Embed Size (px)
Citation preview


In the forthcoming Issue
1. Isotope techniques for water resources development and management Archana S. Deodhar et al. IARD
2. Total reflection x-ray fluorescence spectrometry for characterization of nuclear materials
N. L. Mishra et al., FCD
3. Cobalt shapes for radio-isotope application from an indigenous source B. Paul et al., MPD
4. Compositional characterization of materials using neutron and proton based nuclear analytical methods
R. Acharya et al. RCD
5. Transgenic approaches for development of disease resistance in banana Ganapathi, T.R., NABTD

ISSUE NO. 336 JAN-FEB 2014 i
C O N T E N T SEditorial Note ii
Brief Communication
• Development of Suspendable Servo Manipulator for Activity Reduction in iiiVitrification Cell - WIP, Trombay
Book Reviews
• Functional Materials: Preparation, Processing and Applications iv (Eds. S. Banerjee and A.K. Tyagi)
• Thoria-based Nuclear Fuels: Thermophysical and Thermodynamic Properties, Fabrication, ivReprocessing, and Waste Management.
(Eds. Dr. D. Das, Dr. S.R. Bharadwaj)
Research Articles
• Modeling The Flow Characteristics During Start-Up of Natural Circulation Systems from Rest State 1 Naveen Kumar, A.K. Nayak, P.K. Vijayan and K.K. Vaze
• Time Frequency based Algorithm for Online Detection of Thermal Hydraulic Instabilities in AHWR 12 Ch Santosh Subudhi, S.R. Shimjith and A.P. Tiwari
Technology Development Articles
• Under Sodium Ultrasonic Imaging System for PFBR 18 H. Patankar, S.K. Lalwani, A.A. Agashe, G.D. Randale, R. Chaurasia, P. Jyothi, R.K. Jain, S. Srivastava, T.S. Ananthakrishnan and C.K. Pithawa
• Applications of Digital Reactivity Meter based on Kalman Filtering Technique in 25Indian Nuclear Reactors
R.K. Patil and S.R. Shimjith
• Measurement of Internal Diameter of Pressure Tubes in Pressurized 31Heavy Water Reactors using Ultrasonics
Manojit Bandyopadhyay, Amit K Haruray, A.M. Kadu, Gurpartap Singh, H.M. Bapat, M. Padmanabhan, R.K. Puri and D.N. Badodkar
News & Events
• National Symposium on Very High Energy Gamma – Ray Astronomy (NSGRA-2013): a report 38
• Report of Conference on Neutron Scattering (CNS-2014) 39
• Report on National Symposium on Nuclear Instrumentation – 2013 (NSNI-2013) 40
• Resistive Plate Chambers installed for the new layer added to CMS muon system at CERN 41
• The Nineteenth National Symposium & Workshop on Thermal Analysis (THERMANS-2013) 43
BARC Scientists Honoured 44

ii ISSUE NO. 336 JAN-FEB 2014
Editorial Committee
ChairmanDr. S.K. Apte,
Director, Bio-Science Group
EditorDr. K. Bhanumurthy
Head, SIRD
Associate Editors for this issueDr. A.P. Tiwari, RCnD
Dr. D.N. Badodkar, DRHR
MembersDr. S.K. Apte, Bio-Science Group
Dr. R.C. Hubli, MPD
Dr. D.N. Badodkar, DRHR
Dr. K.T. Shenoy, ChED
Dr. A.P. Tiwari, RCnD
Dr. S.M. Yusuf, SSPD
Dr. A.K. Tyagi, ChD
Mr. G. Venugopala Rao, APPD
Dr. C.P. Kaushik, WMD
Dr. G. Rami Reddy, RSD
Dr. S. Kannan, FCD
Dr. A.K. Nayak, RED
Dr. S.K. Sandur, RB&HSD
Dr. S.C. Deokattey, SIRD
From the Editor’s Desk
The first issue of 2014 is now with you. The cover page
has been changed to present a better look. We would like
to sincerely thank all the scientists and engineers who have
contributed their articles to BARCNL during 2013. Over the
years BARCNL has become an important medium to express our
major achievements and we are happy that the readership has
increased both in India and abroad. This year due to unavoidable
circumstances, there was a delay in the publication of the issue
and we sincerely regret this delay.
This issue carries Five articles and a Brief Communication.
One of the articles addresses the important issue of nuclear
safety in advanced reactor designs; the reliability assessment
of natural circulation systems. Another article deals with the
design and development of a novel Non Contact Ultrasonic
Inspection System (NCUIS) to check the functionality of the
high-temperature and contaminated transducers of the Under
Sodium UltraSonic Scanner (USUSS), for the Prototype Fast
Breeder Reactor. The air-coupled ultrasonic technique was used
to develop the system.
Recently, BARC Scientists published two books: One on
Functional Materials and the other on Thoria-based Nuclear
Fuels. The first one was published by Elsevier and the other by
Springer-Verlag. This issue carries a brief review about the two
published books which would be of interest to our colleagues.
Dr. K. Bhanumurthy
On behalf of the Editorial Committee

Brief Communication
ISSUE NO. 336 JAN-FEB 2014 iii
Induction heated metallic melter has been deployed
at Waste Immobilisation Plant (WIP), Trombay, for
vitrification of high level radioactive waste. Vitirified
product from melters is poured into stainless steel
canisters for interim storage and its subsequent
disposal in geological disposal facilities. During the
completion of pouring of molten vitreous mass, a
few glass-threads get formed at the bottom part
of process pot due to physic-chemical properties
of glass. These threads invariably get collected in
the canister itself but on a few occasions, it falls
on the turn table during handling of canisters.
These threads are generally very small in sizes with
an average diameter of 4 mm and length of 50
mm. Existing remote handling tools are used for
lifting these glass threads. However, a few glass
threads remain inaccessible, because of limited
reach of the remote handling gadgets. Suspended
Development of Suspendable Servo Manipulator for Activity Reduction in Vitrification Cell - WIP, Trombay
Design, Manufacturing & Automation Groupand
Nuclear Recycle Group
Fig.1: Suspendable Servo Manipulator (SSM)
Servo Manipulator (SSM) developed by Division of
Remote Handling and Robotics (DRHR), BARC was
deployed after extensive mock trials to lift remaining
glass threads fallen at inaccessible areas during
recently completed vitrification campaign. With the
joint effort of Waste Management Division (WMD,
NRG) and DRHR, campaign of picking up of about
30 number of glass threads of smaller sizes were
successfully completed resulting in a substantial
dose reduction within the hot-cell.
The suspendable Servo Manipulator [Fig.1] is a
novel design consisting of a slave and a master arm,
connected to a controller through electric cables.
The slave arm is suspended onto the crane hook
and taken to the site remotely. It has five degrees of
freedom and gripper, all controlled by electric motors.
The major joints of the slave arm are mechanically
balanced to reduce
the swing of
the arm, during
motion. The master
arm is small and
kinematically similar
to that of the
slave arm. Remote
operations are
viewed through
in-cell cameras and
additional cameras
mounted on the
slave arm [Fig. 2 &
3].
Fig.3: Active Glass Thread Picked-Up by SSM
Fig.2: Master Arm of SSM in the Control Room

iv ISSUE NO. 336 JAN-FEB 2014
Thoria-based Nuclear FuelsThermophysical and Thermodynamic Properties,
Fabrication, Reprocessing, and Waste Management.
Dr. D. Das, Dr. S. R. Bharadwaj (Eds.)Chemistry Division
This book presents the state of the art on
thermophysical and thermochemical properties,
fabrication methodologies, irradiation behaviours,
fuel reprocessing procedures, and aspects of waste
management for oxide fuels in general and for
thoria-based fuels in particular. The book covers all
the essential features involved in the development
of and working with nuclear technology. With the
help of key databases, many of which were created
by the authors, information is presented in the form
of tables, figures, schematic diagrams and flow
sheets, and photographs. This information will be
useful for scientists and engineers working in the
nuclear field, particularly for design and simulation,
and for establishing the technology. One special
feature is the inclusion of the latest information on
thoria-based fuels, especially on the use of thorium
in power generation, as it has less proliferation
potential for nuclear weapons. Given its natural
abundance, thorium offers a future alternative to
uranium fuels in nuclear technology. In closing, the
latest information on conventional uranium and
plutonium fuels is also provided.
This book is published by Springer-Verlag, London
(2013), 418 Pages and 173 Illustrations.
Functional Materials: Preparation, Processing and Applications
(Eds. S. Banerjee and A. K. Tyagi)Elsevier Insights (ISBN: 978-0-12-385142-0)
Recently a book titled “Functional Materials: Preparation, Processing and Applications (Eds. S. Banerjee and A. K. Tyagi)” was published by Elsevier Insights. The major highlight of this book is that all the chapters have been contributed by scientists from BARC. Thus a wide spectrum of research on functional materials, being carried out at BARC, could be showcased.
The functional materials are categorized solely based on their functional properties and their prospective applications. They have assumed very prominent position in several high tech areas. The book encompasses a wide panorama of functional materials such as super-strong materials, soft materials, magnetic materials, multi-ferroics, spintronics, carbon based materials, conducting polymers, optical materials, glasses, nuclear fuels, corrosion resistant materials, materials for hydrogen production and storage, and electro-ceramics. Each chapter broadly discusses physical basis of the functionality, materials synthesis and processing, characterization, properties and applications. We hope that this book will be of use to both new and experienced researchers in the field.
Book Reviews

Research Article
ISSUE NO. 336 JAN-FEB 2014 1
Introduction
Passivity and simplicity are the hallmark of any good
engineering design. These features are perhaps
nowhere more desirable than in nuclear systems
where safety of both the plant and the public at
large is of prime concern. Passivity, the ability to
operate without reliance on any external power
source, enhances the safety. Simplicity, avoidance
of complex piping and logics, makes the system
operation and maintenance considerably easy.
A natural circulation system has both passivity
and simplicity inbuilt in it. It is because of these
desirable features that these systems find wide
application in many industrial systems like nuclear
power plants, solar heating and cooling systems,
geothermal systems, electrical machine rotor
cooling, turbine blade cooling, electronic device
cooling and process industry. Many of the next
generation nuclear power plants propose to use
natural circulation as the heat removal mode either
during normal operational states and/or during off-
normal operational states. Indian Advanced Heavy
Water Reactor (AHWR) and Prototype Fast Breeder
Reactor (PFBR), Westinghouse’s AP-1000, General
Electric’s Economic Simplified Boiling Water Reactor
(ESBWR), Russian VVER-1000 and Argentina’s
Modeling The Flow Characteristics During Start-Up of Natural Circulation Systems from Rest State
Naveen Kumar, A.K. Nayak, P.K. Vijayan and K.K. VazeReactor Engineering Division
CAREM, are just to name a few. Despite the
philosophy of defense-in-depth, electromechanical
active components and/or human operations are
likely to fail as exemplified by the accidents at Three
Mile Island-2, Chernobyl-4 and Fukushima.
Decay heat, if not removed, can result in
overheating and damage to the fuel. Hence, most
of the advanced reactor designs propose to use
natural circulation for decay heat removal during
the off normal conditions.Like any other system,
the natural circulation systems also do have their
own set of challenges. Though passive systems are
highly reliable, in reality there exists a non-zero
probability that these system fail to perform the
intended function. Therefore, a reliable prediction
of their performance is of utmost importance for
their successful deployment. Natural circulation
systems have low driving force and need to be
started from the state of rest. Start-up from rest
is one of the key issues in assessing the reliability
of these systems. There is always a finite time lag
before these systems attain their optimum/intended
performance level. Further, the models applicable
under low flow conditions can be quite different
from those applicable under high flow conditions.
For example, under low flow conditions, the flow
Abstract
Most of the advanced reactor designs propose to use natural circulation for core heat removal either
during normal operational states and/or during off-normal operational states because of simplicity and
higher reliability of natural circulation. However, these systems do have their own set of challenges
with respect to assessment of their reliability. Simulation of start-up from rest and performance
evaluation using conventional models are the key issues in assessing their reliability. In view of their wide
importance to nuclear safety, the performance of these systems during start-up from rest is addressed in
the present study.

Research Article
2 ISSUE NO. 336 JAN-FEB 2014
is essentially multi-dimensional and hence classical
1-D may not predict their behaviour with reasonable
satisfaction. Also the performance of these
systems is strongly dependent on the operating
conditions and system geometry. Owing to the very
dependence of system flow rate (and hence heat
removal capability) on operating conditions, any
change in operating conditions may have a bearing
on their overall performance. This article addresses
some of these issues.
Model for start-up from rest
During the start-up of a natural circulation system,
the flow is essentially single-phase and hence,
single-phase natural circulation is important to
all the natural circulation systems. Unlike forced
circulation systems where flow gets established
as soon as the fluid moving device is put on, in a
natural circulation system, the flow is generated
by the temperature difference between the source
and the sink. In a forced circulation system, the
flow through the system is established first by
putting on the fluid moving machinery. This is
followed by activation of heater power, e.g. chain
reaction in a nuclear power plant and electrical
heating in experimental facilities. However, in a
natural circulation system, the sequence is reverse.
Since both source and the sink are at the same
temperature to start with, initially there is no flow
through the system. Hence, the heater power needs
to be raised to some positive non-zero value before
flow gets established through the system. The
problem is further complicated by the orientation
of the heat source and sink. Heat source can be
vertical as in AHWR or ESBWR or horizontal as in
PHWRs. Similarly sink can also be horizontal as in
VVERs or vertical as in PHWRs.While in systems
having vertical heater the onset of bulk fluid
circulation is almost immediate for moderate heater
powers, in loops having heaters in horizontal leg,
the bulk circulation is always preceded by some
quiescent period. In systems having horizontal
heaters, the flow does not take place till the hot
fluid reaches the vertical leg. This has a bearing on
the peak heater element temperature and hence on
the integrity of the fuel or heating element. Present
1-D models, which continue to be the workhorse
for reactor thermal hydraulics and safety analysis,
fail to predict the start-up of natural circulation
systems having heat source in horizontal leg.
Under low or no flow (circulation) conditions, the
heat is transferred from the heated sections to
unheated sections by natural convection. These
currents were referred as secondary currents by
Bau and Torrence[1]. These currents are essentially
multi-dimensional in nature. They are relevant not
only during start-up but also during the transients
whenever low flow conditions are encountered. It
is because of the inability of present 1-D models
to account for these local convection currents that
these models fail to predict the start-up of these
systems from rest reliably.Numerical simulations
carried out using system codes like ATHLET [2],
RELAP5 [3] and CATHARE [4] show that start-up
of these loops cannot be simulated using classical
1-D models. Fichera and Pagano [5] accounted
for these currents by taking an arbitrarily high
value of molecular thermal diffusivity in their
numerical simulations.In the present study, a
pseudo-conductivity model has been presented to
account for these secondary convection currents.
The proposed model is based on scale analysis.
It has been validated against CFD simulations
and incorporated in a 1-D model. The results of
numerical simulations for start-up of single-phase
natural circulation systems having different heater
and cooler configurations are presented.
Governing Equations
The mathematical model is based on the following
simplifying assumptions:
(a) The flow can be represented by a 1-D
description that does not take into account for
radial variation of the fluid properties.

Research Article
ISSUE NO. 336 JAN-FEB 2014 3
(b) Heat generation in the fluid due to frictional
dissipation and macroscopic terms, i.e. kinetic
and potential energy are neglected in the
energy equation.
(c) Each fluid element is in thermal contact with
a heat structure and a convective heat transfer
boundary condition can be assigned to the
outside surface of the structure, specifying the
outer fluid temperature and the outer heat
transfer coefficient.
(d) For a nearly incompressible fluid, natural
convection consists of two equal and
opposite streams moving between cold and
warm sections. There is zero net mass
transfer between the two sections and a
net energy exchange. The energy change
can be accounted in the area averaged energy
balance equation.
With the above assumptions the governing mass,
momentum and energy balance equations for flow
through a channel are written as:
(1)
(2)
(3)
(4)
For the solution of governing equations, these
are discretized using staggered mesh. The
computational domain is divided into non-
overlapping rigid control volumes, called cells. The
field variables, h, p and are defined at the cell
centers, while the fluid mass velocity, W is defined at
cell interfaces also called junctions. The discretized
equations are presented in Naveen Kumar [6].
Evaluation of Keff – Pseudo-conductivity Model
Keff in equation (3), known as effective conductivity,
is evaluated using the pseudo-conductivity model
described here. In a natural circulation loop
having heater in the horizontal section, the fluid is
motionless and is at same temperature to start with.
When the heater is switched on and power is made
greater than zero, the fluid in the heated portion
starts getting heated up. This hot fluid spreads
sideways into the unheated section by local natural
convection. For an incompressible fluid, these
currents lead to net energy transfer from the heated
section to unheated section without any net mass
transfer across the pipe cross section. Hence, these
currents can be thought like pseudo-conduction.
During the start-up of natural circulation loops
having horizontal heater, the natural convection
currents are confined to the horizontal pipe section
only and the fluid behavior is similar to that in a
slender horizontal cavity closed at both the ends.
During this phase, the area averaged net flow at
any cross section remains zero and there is a net
heat transfer at the interface between hot and cold
sections. The rate of heat transfer across any cross-
section depends upon the net forward or backward
(both are equal in magnitude for an incompressible
fluid) mass flow rate at that cross section and the
difference in temperatures of two stream. Naveen
Kumar et al. [6-7] studied the natural convection in
slender pipes closed at both the ends. In this study it
was shown that the magnitude of cross section area
averaged forward or backward velocity (backward
and forward currents are equal in magnitude but
opposite in direction) for horizontal and vertical
pipes is given by the following expression:
(5)
It is worth noting here that the velocities given
by equation (5) are area averaged forward or
backward (in case of a vertical cavity, it is upward

Research Article
4 ISSUE NO. 336 JAN-FEB 2014
or downward) velocities at any cross section under
steady state conditions. However, during natural
convection, the forward current is expected to be
confined to half of the pipe cross section and the
backward current is expected to be confined to
the other half of pipe cross section. Therefore, the
convection currents will move twice as fast as that
given by equation (5). For a loop having horizontal
heater, the heat transfer by natural convection
can exist in horizontal section whenever natural
circulation flow is small e.g., during start-up of
such systems from no flow condition. However, for
a vertical pipe section, this can happen whenever
a hot fluid pocket lies below a cold fluid pocket
e.g., during the transient the hot pocket may be
lying below the cold pocket, and the hot and cold
fluid packets may be distributed in two legs such
that the loop flow is near zero. These conditions
are expected during the transient unstable flow
conditions and have been observed experimentally
by Vijayan et al. [8]. Naveen Kumar [6] showed that
the net energy exchange per unit area by these
local convection currents is given by the following
expression:
(6)
Thus in the absence of any bulk fluid motion,
the steady state heat transfer between the cold
and hot sections, maintained at a temperature
difference of ∆T, consists of two components:
conduction and natural convection. Mathematically,
it is written as
(7)
where
(8)
For ease of interpretation, equation (7) is written as
(9)
where (10)
Keff is the effective thermal conductivity which takes
into account the heat transfer by both conduction
and natural convection. The first term in equation
(10) is the molecular conductivity of the fluid and
accounts for axial heat transfer by conduction
in the fluid. The second term accounts for heat
transfer by local natural convection between two
volumes (pipe sections) filled with fluids having
different temperatures. However, unlike the
fluid thermal conductivity, which is a property
of fluid, the magnitude of pseudo-conductivity
depends on the temperature difference between
the two fluid volumes. Thus, the effect of natural
convection can be accounted in 1-D model by
using an effective thermal conductivity as given by
equation (10). Advantage of this approach is that
it can easily be incorporated in the conventional
1-D models without any major modifications.
Also, this approach has the advantage of being
computationally cost effective.
Local convection is the dominant mechanism of
heat transfer till the natural circulation flow is zero.
With the onset of bulk flow (circulation), the fluid
starts moving either in clockwise or anti-clockwise
direction throughout the loop. The fluid flow is
now just like forced convection through a pipe.
With the onset of bulk fluid motion, these currents
start diminishing and eventually get suppressed
completely when loop flow rate increases
sufficiently. Hence, the heat transport mechanism
in a natural circulation loop passes from the phases
of local natural convection to mixed convection to
natural circulation. A proper simulation of loop
dynamics requires not only proper models for
each regime but also the knowledge of criterion

Research Article
ISSUE NO. 336 JAN-FEB 2014 5
for transition from one regime to another. Naveen
Kumar et al. [7] presented the following criterion
for transition between natural convection and
natural circulation:
(11)
The above criterion is based on the relative strength
of natural convection and natural circulation
currents. The relative strength of natural convection
to natural circulation is given by the ratio of the
characteristic natural convection velocity, and
the natural circulation velocity, . It can be seen
from equation (11) that pure natural convection
is the heat transfer mode when natural circulation
( ) velocity is zero and natural circulation is the
heat transfer mode when natural circulation
velocity ( ) is greater than natural convection
velocity ( ). The mixed convection regime lies
between these two regimes. This regime is taken
into account in the above criterion by introducing
the factor in equation (11). The reasons
for adopting such a criterion are explained below.
The natural convection currents are essentially
multi-dimensional in nature even in small diameter
pipes and develop fully only in the absence of forced
convection (global natural circulation) currents.
However, forced convection currents are strongly
directional in nature and involve either movement
of fluid from the cold section to the hot section or
from the hot section to the cold section. There is net
flow across the interface. As one moves away from
natural convection regime to mixed convection
regime, these natural circulation (bulk loop flow)
currents start interfering with natural convection
currents. This impedes the development of natural
convection currents thereby hindering the energy
transfer by natural convection across the interface.
This has been taken into account in equation (11)
by introducing the factor . The criterion
given by equation (11) blends the switching
from natural convection to natural circulation in
a continuous fashion. The pseudo-conductivity
model has been validated by comparing the model
predictions with CFD simulations for circular
horizontal and vertical cavities closed at both the
ends [6-7].
Role of constitutive laws for wall friction
The inability of conventional friction factor
correlations applicable for forced circulation under
adiabatic conditions to predict pressure drop under
diabatic conditions was recognized long back by
Deissler[9]. Ambrosini and Ferreri[10] showed that
accurate and reliable prediction of loop stability
and transient behaviour is strongly dependent on
the choice of friction factor. Naveen Kumar [6]
proposed the following correlation for friction
factor for flow through horizontal pipes:
(12)
where (13)
(14)
(15)
(16)
The correlation given by equation (12) was derived from steady state experimental data by Naveen Kumar [6]. A comparison of the proposed correlation with conventional forced convection laws is shown in Fig. 1. It is seen from the Fig 1 that the conventional forced friction factor laws overpredict the loop mass flow rate (higher Ress for a given Grm/NG). A similar type of correlation showing dependence on local Rayleigh number is expected for vertical pipe sections also. However, in the absence of any such correlation, the wall friction in vertical sections has been evaluated using conventional forced friction correlation. To sum up,

Research Article
6 ISSUE NO. 336 JAN-FEB 2014
the model uses the following correlation for wall
friction:
(17)
Flow characteristics of single-phase natural circulation during start-up
The model developed has been applied to simulate
the start-up of natural circulation loop shown in
Fig. 2. The loop consists of a uniform diameter
rectangular natural circulation loop. The details of
the experimental setup are given in Vijayan et al.
[4]. It has two heaters and two coolers. One of the
heaters is at lowest elevation and the other one is
in vertical section. Similarly, one of the coolers is
placed in the horizontal section at the uppermost
elevation and the other cooler is placed in vertical
pipe section. It is possible to run the loop in any of
the following four configurations:
(a) Horizontal Heater and Horizontal Cooler
(HHHC)
(b) Horizontal Heater and Vertical Cooler (HHVC)
(c) Vertical Heater and Horizontal Cooler (VHHC)
(d) Vertical Heater and Vertical Cooler (VHVC)
Fig. 1: Comparison of model predictions made using proposed friction factor correlation with experimental data.
The addressed loop with different combinations
of heaters and coolers can be considered as
representative of different natural circulation
systems encountered in the industry.
Fig. 2: Schematic of natural circulation loop [8]
Studies for horizontal heater configuration
The model developed has been applied for the
simulation of loop transient behavior from state
of rest conditions. The initial fluid temperature
is assumed to be same throughout the loop and
the expansion tank. In the test facility, the heater
is located symmetrical with respect to loop centre
line. In such a facility, there is equal probability of
flow getting initiated in either direction. However,
in numerical simulations the direction of flow
initiation is dictated by the sign of initial fluid
velocity which is assumed to be 1.0E-9 kg/s.
Fig. 3 shows the flow initiation transient predicted
by the present model with the fluid axial heat
conduction taken same as that the molecular
conductivity of the fluid (hnc = 0) for the HHVC

Research Article
ISSUE NO. 336 JAN-FEB 2014 7
configuration for a heater power input of 128 W. It
is clear from Fig. 3(a) that the flow initiation does
not take place even after a lapse of more than 800
seconds since switching on of the heater power.
It was noted by Bau and Torrance [1] that mere
inclusion of fluid and wall axial conduction does not
help in simulating the start-up from the rest state.
The same simulation is now carried out using the
pseudo-conductivity model explained earlier (Keff=
kf+ hnc∆s). The results shown in Fig 3(b) indicates
that the flow gets initiated at t = 300 seconds.
This behavior has been found to be in agreement
with that observed experimentally. However, the
magnitude of the initial peak is greater than that
observed experimentally. Also there is a mismatch
in the time at which peak occurs. The mismatch
between the model prediction and experimental
observation can be attributed to the simplification
adopted in modeling heater. The heater in the
experimental test facility consists of a nichrome
wire evenly wound on the glass tube. The nichrome
wire makes a line contact with the glass tube and
is surrounded by mineral wool from all other sides.
In the heater model adopted in the numerical
simulations, all the heat is assumed to be generated
inside the glass tube, while in reality a portion of
the heat also goes to the insulating material. This
has a bearing on the flow initiation time and the
magnitude of initial peak. This becomes clear from
Fig 4 where the model predictions for different initial
heat power inputs are compared.It is clear from Fig
4(a) that initial peak flow increases with increase in
heater power input. Also the heater temperature
(Fig 4(b)) increases with increase in heater power.
Fig. 3: Prediction of flow initiation transient by the model developed for HHVC configuration for a heater power of 128 W.
Fig. 4: Effect of heater power on flow initiation transient for HHVC configuration.
(a) hnc= 0 (b) With pseudo-conductivity model
(a) Loop mass flow rate (b) Heater surface temperature

Research Article
8 ISSUE NO. 336 JAN-FEB 2014
Vijayan et al. (2001) reported that for HHVC
configuration, while there is equal probability
of flow getting initiated in either clockwise or
anticlockwise direction, however, only clockwise
flow was found to be stable. This is shown in Fig.
5, where for a heater power input of 257 W, the
flow gets initiated in anti-clockwise direction and
it turns clockwise after one oscillation. A similar
behavior is predicted by the model as well. Fig. 5
shows the comparison of the model predictions
(made using pseudo-conductivity model) with
the observed experimental behavior. The model
predictions are in fair agreement with the observed
experimental behavior. Fig 6 shows a comparison
of model predictions with the experimental data for
HHHC configuration for a heater power input of
120 W. For this configuration, both loop mass flow
rate (indicated by pressure drop across heater) and
fluid temperature were found to be oscillating. In
fact, for this configuration, stable behaviour was
observed only at powers below 55 W.
Role of expansion tank
All the closed single-phase natural circulation loops,
the authors have come across are provided with an
expansion tank. The tank serves the twin purposes
of venting the air out during the loop filling and
accommodation of the swells and shrinkages of
the loop fluid during the transient. Creveling et al.
[11] and Damerell and Schoenhals [12] mentioned
that the interior of the loop was connected to an
open reservoir; however, no details of the reservoir
were reported. The loops studied by Misale et al.
[4] and Fichera and Pagano [5] and Vijayan et al.
[8] have expansion tank in their loops. However,
only few details are available about the dimensional
details of these tanks in published literature. In
most works, this component is not considered
important in characterizing natural circulation
loop performance. In nuclear reactors also, the
components like pressuriser, emergency core
cooling headers etc. are also similar to expansion
tank. In the present study, the expansion tank was
Fig. 5: Comparison of flow initiation transient predicted by the model developed with experimental behavior for HHVC configuration for a heater power of 257 W.
Fig. 6: Comparison of the predicted behaviour with experimental data for 120W heater power for HHHC configuration.
Research Article
ISSUE NO. 336 JAN-FEB 2014 9
found to be affecting the performance of these systems.
In most of the studies, a lumped parameter model is used for modelling the expansion tank. The pressure in the tank is assumed to be constant. With these assumptions, mass, momentum and energy balance in the expansion tank take the
following from:
(18)
Neglecting frictional and acceleration losses, the
momentum balance is written as
(19)
Energy balance equation is written as
(20)
The first term on the right hand side of Eq. (20) represent the energy exchange with the loop because of swell/shrinkage in volume of liquid contained in the loop and the last term accounts for energy exchange between the expansion tank and the main loop by natural convection. Thus, hnc in equation (20) is evaluated using the following expression:
(21)
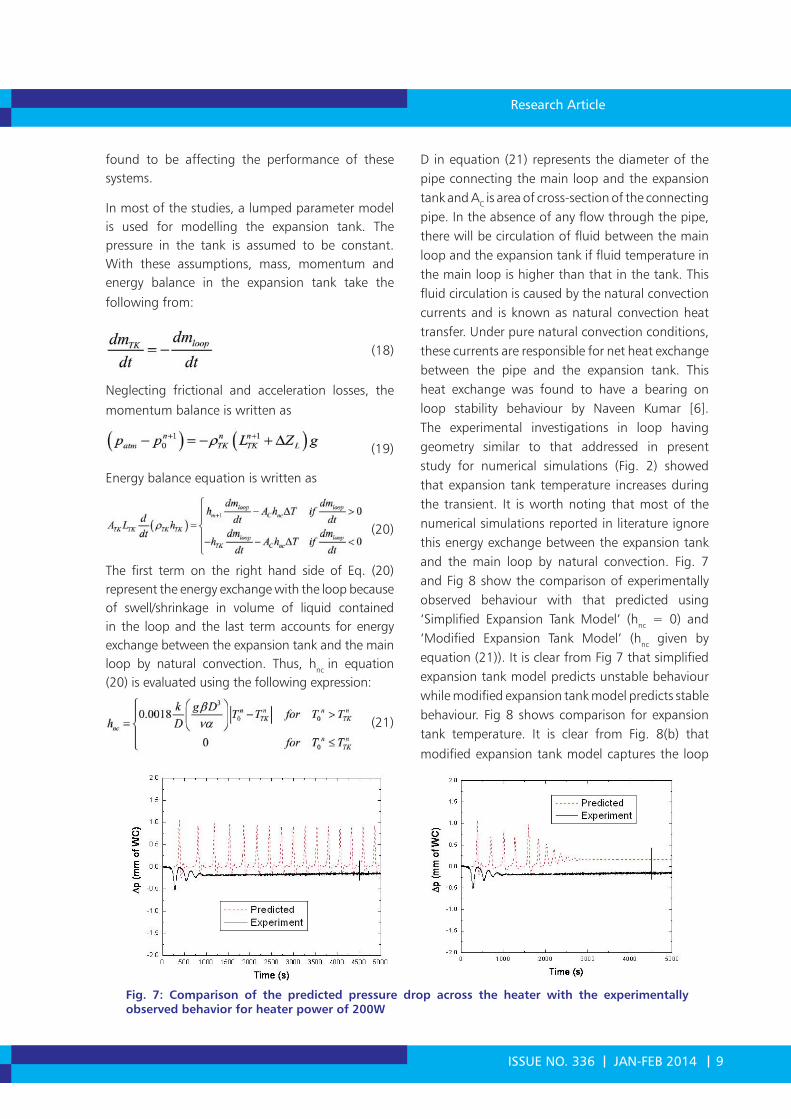
D in equation (21) represents the diameter of the pipe connecting the main loop and the expansion tank and AC is area of cross-section of the connecting pipe. In the absence of any flow through the pipe, there will be circulation of fluid between the main loop and the expansion tank if fluid temperature in the main loop is higher than that in the tank. This fluid circulation is caused by the natural convection currents and is known as natural convection heat transfer. Under pure natural convection conditions, these currents are responsible for net heat exchange between the pipe and the expansion tank. This heat exchange was found to have a bearing on loop stability behaviour by Naveen Kumar [6]. The experimental investigations in loop having geometry similar to that addressed in present study for numerical simulations (Fig. 2) showed that expansion tank temperature increases during the transient. It is worth noting that most of the numerical simulations reported in literature ignore this energy exchange between the expansion tank and the main loop by natural convection. Fig. 7 and Fig 8 show the comparison of experimentally observed behaviour with that predicted using ‘Simplified Expansion Tank Model’ (hnc = 0) and ‘Modified Expansion Tank Model’ (hnc given by equation (21)). It is clear from Fig 7 that simplified expansion tank model predicts unstable behaviour while modified expansion tank model predicts stable behaviour. Fig 8 shows comparison for expansion tank temperature. It is clear from Fig. 8(b) that
modified expansion tank model captures the loop
Fig. 7: Comparison of the predicted pressure drop across the heater with the experimentally observed behavior for heater power of 200W
(a) Simplified expansion tank model (b) Modified expansion tank model

Research Article
10 ISSUE NO. 336 JAN-FEB 2014
behaviour more realistically. The results presented in
Fig 7 and 8 clearly show that the tanks connected to
these systems may modify the operating conditions
and hence the loop dynamic thermal hydraulic
behaviour. In nuclear reactors, main heat transport
systems have several components like pressuriser,
Emergency Cooling Headers etc. connected with it.
While simulating the behaviour of these systems,
due consideration should be given to interaction of
these systems with main loop.
Studies for vertical heater configuration
In a natural circulation loop having vertical heater,
the flow initiation occurs almost immediately after
the heater power is made greater than zero. This
is because the buoyancy starts developing as soon
as the fluid in the vertical heated section gets
heated. Typical flow initiation transient predicted
with model developed for VHHC configuration
for a heater power input of 530W is shown in
Fig. 9. The model predictions are in reasonably
good agreement with the experimental behavior.
However, as discussed earlier, the secondary
effects (simplified heater wall dynamic model and
use of wall constitutive laws derived from steady
state forced convection experiments) lead to over
estimation of the magnitude of the initial peak.
As the hot fluid rises through the vertical pipe, it
comes in contact with cold wall. When the hot fluid
comes in contact with cold wall, it gets cooled,
the buoyancy acts opposite to loop flow and fluid
motion near the wall has a tendency to get retarded.
This alters the velocity profile near the wall and may
change the wall friction factor. Saylor and Joye
[13] studied pressure drop in mixed convection
heat transfer in vertical tubes and observed that at
low Reynolds numbers and high Grashof numbers,
the pressure drop for aiding flow (heating in up
flow and cooling in down flow) through a vertical
tube under constant temperature conditions
can be orders of magnitude higher than that
expected on the basis of forced flow considerations.
They also observed negative pressure drop for
downflow heating in mixed convection zone. Also
subtle changes in model predictions made using
simplified and modified expansion tank model are
quite clear.
Fig. 8: Comparison of the predicted fluid temperature in the expansion tank with the experimentally observed behavior for heater power input of 200W
(a) Simplified expansion tank model (b) Modified expansion tank model
Fig. 9: Comparison of the predicted behaviour with experimental data for 530W heater power for VHHC configuration.

Research Article
ISSUE NO. 336 JAN-FEB 2014 11
Conclusions
In this research, a model has been developed to predict the performance of natural circulation systems during start-up from rest. A pseudo-conductivity model has been proposed to account for multi-dimensional heat diffusion under low flow conditions. The model has been validated against the CFD simulations and successfully integrated with 1-D models which are the industry workhorse for predicting the behaviour of these systems. The model has then been used to predict the performance of a natural circulation loop having different heater and cooler orientations. The numerical predictions show that onset of flow in a NCL having horizontal heater is always preceded by some quiescent period. During this period, the heater surface temperature can rise substantially. Numerical and experimental studies show that onset of flow in a loop having vertical heater is almost immediate for moderate heater powers. The study brings out that the conventional friction factors derived from steady state forced convection experimental data are not applicable for natural circulation loops under low flow conditions. A new correlation has been proposed for wall friction for flow through horizontal tubes. In this research, the behaviour of natural circulation systems has been found to be affected by the expansion tank.
References
1. Bau, H.H., Torrance, K.E., Transient and steady behaviour of an open symmetrically heated, free convection loop, Int. J. Heat Mass Transfer 24(1981), 597-609.
2. Vijayan,P.K., Austregesilo,H., Teschendorff,V., Simulation of the unstable oscillatory behavior of single-phase natural circulation with repetitive flow reversals in a rectangular loop using the computer code ATHLET, Nucl. Eng. Des. 155(1995), 623-641.
3. Pilkhwal,D.S.,Ambrosini,W., Forgione, N., Vijayan, P.K.,Saha, D., Ferrari, J.C., Analysis of the unstable behaviour of a single phase natural circulation loop with one dimensional
and computational fluid dynamics models, Ann. Nucl. Energy 34(2007), 339-355.
4. Misale, M., Frogheri,M., D’Auria,F., Fontani, E., Garcia,A., Analysis of single-phase natural circulation experiments by system codes, Int. J. Therm. Sci. 38(1999), 977-983.
5. Fichera,A., Pagano, A., Modeling and control of natural circulation loops, Int. J. Heat Mass Transfer 46(2003), 2425-2444.
6. Naveen Kumar, Investigations on start-up of natural circulation systems, Ph.D. dissertation, Indian Institute of Technology Bombay, India (2013).
7. Naveen Kumar, Doshi, J.B., Doshi, Vijayan, P.K., Investigations on the role of mixed convection and wall friction factor in single-phase natural circulation loop dynamics, Ann. Nucl. Energy 38(2011), 2247-2270.
8. Vijayan, P.K., Bhojwani, V.K., Bade, M.H., Sharma, M., Nayak, A.K., Saha, D., Sinha, R.K., Investigations on the effect of heater and cooler orientation on the steady state, transient and stability behaviour of single-phase natural circulation in a rectangular loop, Bhabha Atomic Research Centre, Report BARC/2001/E/034, 2001.
9. Deissler, R.G., Analytical investigation of fully developed laminar flow in tubes with heat transfer with fluids properties variable along the radius, NACA TN 2410, Washington DC, 1951.
10. Ambrosini,W., Ferreri, J.C., Stability analysis of single phase thermosyphon loops by finite difference numerical methods, Nucl. Eng. Des. 201(2000), 11-23.
11. Creveling, H.F., DePaz, J.F., Baladi, J.Y., Schoehnals, R.J., Stability characteristics of a single-phase free convection loop, J. Fluid Mech. 67(1975), 65-84.
12. Damerell, P.S., Schoenhals, R.J., Flow in a toroidalthermosyphon with angular displacement of heated and cooled sections, J. heat Transfer 101(1979), 672-676.
13. Saylor, P.E., Joye, D.D., Hydrostatic correction and pressure drop measurement in mixed convection heat transfer in vertical tube, Ind.
Eng. Chem. Res. 30(1991), 784-788.

Research Article
12 ISSUE NO. 336 JAN-FEB 2014
Introduction
Advanced Heavy Water Reactor (AHWR) [1] is
a 300 MWe, vertical, pressure tube type, heavy
water moderated reactor which employs natural
circulation of boiling light water for core cooling.
The Main Heat Transport System (MHTS) of AHWR
consists of four horizontal steam drums connected
to common inlet header through downcomers.
Fig.1 shows a simplified schematic of MHTS of
AHWR showing a single heat transport loop
consisting of a steam drum, downcomer,
feeder, coolant channel and tail pipe.
Subcooled light water is transported from
the steam drum to the channel through the
feeder originating from inlet header. Boiling
takes place inside the channel and the
resulting steam-water mixture is transported
to the steam drum through the tail pipe.
AHWR, like many other natural circulation
reactors, is prone to thermal hydraulic
Time Frequency based Algorithm for Online Detection of Thermal Hydraulic Instabilities in AHWR
Ch Santosh Subudhi, S.R. Shimjith and A.P. TiwariReactor Control Division
instabilities under certain operating conditions. It
is reported that Ledinegg type instabilities (static
in nature) and density wave instabilities (dynamic
in nature) may occur in AHWR [1]. Ledinegg
instabilities are suppressed in AHWR by operating
at a high pressure (7 MPa). However, density wave
instabilities can still be experienced if the operating
conditions are not strategically controlled and
therefore are of primary concern. Density wave
instabilities manifest as flow oscillations of increasing
Abstract :
Advanced Heavy Water Reactor (AHWR), a natural circulation boiling water reactor, is reported to be prone to
xenon instabilities. Xenon induced spatial instabilities are suppressed by the spatial power control program
of AHWR. However, thermal hydraulic instabilities characterised by flow oscillations of the order of tens
of seconds, are more challenging in terms of detection and control. In AHWR, the operating procedure is
carefully formulated so as to avoid thermal hydraulic instabilities during start-up and operation. Nevertheless,
the availability of an on-line monitoring mechanism to indicate the onset of such instabilities would aid the
operator to monitor the operational state of the reactor and to take up immediate corrective measures
in case of the onset of thermal hydraulic instabilities during unanticipated operating conditions. In this
context, a time frequency representation based algorithm suitable for online implementation, is developed
to detect the onset of the oscillations by continuous monitoring of the channel flow signals. Validation
of the algorithm is carried out with data simulated using a homogeneous equilibrium model capable of
demonstrating thermal hydraulic instabilities in the Main Heat Transport system of the AHWR.
Fig. 1: Main Heat Transport System of AHWR (Schematic)

Research Article
ISSUE NO. 336 JAN-FEB 2014 13
amplitude in response to any perturbation in system
variables like flow, enthalpy, etc. These instabilities
are caused due to multiple regenerative feedback
effects between the flow-rate, vapour generation
rate and pressure drop. Under certain operating
conditions the feedback tends to become out-
of-phase with a perturbation and results in self-
sustained oscillations. In any natural circulation
based reactor operating at a constant power, the
fission power and core inlet subcooling essentially
govern the stability conditions [2]. In AHWR, the
core inlet temperature is varied (by controlling the
feed water temperature) based on the operating
power so as to avoid density wave instabilities
during normal operation of the reactor. However,
availability of real time stability information at the
operator’s console is still very beneficial to ensure
smooth operation.
Nature of Density Wave Instabilities
It is necessary to study the effect of power and core
inlet subcooling on the flow oscillations caused
due to density waves instabilities. Density wave
instabilities are simulated for a given combination
of power and core inlet subcooling by initially
maintaining steady state conditions and then
introducing a small perturbation in power. For
an unstable combination of power and core inlet
subcooling, this perturbation leads to unstable
oscillations in flowrate, density, pressure and
enthalpy. The frequency of the flow oscillation is
computed by studying the amplitude spectrum of
the channel flowrate signal. The amplitude spectra
of a time-domain signal can be obtained by carrying
out a Fourier transform of the given signal. Fig.2
and 3 show comparison of normalised channel
flowrates during onset of density wave instabilities
and their single sided amplitude spectra at different
powers and core inlet subcooling values respectively.
The figures clearly indicate that the frequency of
oscillation tends to increase with increasing power
and decrease with increasing core inlet subcooling.
Fig. 2: (a) Normalised response of channel flow-rates at different power levels to a perturbation in power at a fixed inlet subcooling of 24K, (b) Single sided amplitude spectra (|Y(f)|) of the normalised channel flowrates
Fig. 3: (a) Normalised response of channel flow-rates at different core inlet subcooling to a perturbation in power around the operating power level of 24% channel power, (b) Single sided amplitude spectra (|Y(f)|) of the normalised channel flowrates

Research Article
14 ISSUE NO. 336 JAN-FEB 2014
Similarly, it can also be observed that the amplitude
of oscillation tends to decrease with increase in
fission power and increase with increase in core
inlet subcooling. These observations indicate that
the frequency of density wave instabilities vary with
time and are determined by the instantaneous
operating condition.
Detection of Density Wave Instabilities
In boiling channel systems, density wave
instabilities are undesirable as they may cause
mechanical vibrations, system control
problems etc [3]. In some cases
they may rupture the heat transfer
surface due to boiling crisis (dry-out,
burnout) [2]. In AHWR, the design
methodology is formulated to avoid
such phenomena. Nevertheless, it
is necessary and advisable to detect
the onset of these instabilities during
plant operation and make this
information available to the operator.
The onset of these instabilities can be
detected by continuously acquiring
the channel flow signals and sensing
the presence of oscillations, followed
by computation of the decay ratio
of these oscillations. Decay ratio is
defined as the ratio of two consecutive
maxima of the impulse response. Decay ratio
greater than unity would mean an unstable
scenario, a value less than unity would mean a
stable scenario. The simplest approach to compute
the decay ratio could be to detect the magnitude of
peaks of the oscillations whenever they appear and
then compute the ratio of magnitude of present
peak to that of the previous peak. However, this
approach is not practical since the frequency of
oscillation tend to vary with time. This problem can
be addressed by using a time-frequency framework
to describe the time varying flow signals rather
than a conventional time-domain approach. A
Time Frequency Representation (TFR) [4] gives the
distribution of energy of a signal in time-frequency
plane. The most widely TFRs are Short-time Fourier
transform and Wigner-Ville distribution. However,
in this work Wigner-Ville representation is preferred
owing to its mathematical simplicity and the
adaptability for real time applications. Fig.4 shows
the Wigner-Ville time frequency distribution for a
typical signal with linear variation in frequency. An
algorithm based on Wigner-Ville time frequency
representation is employed to predict a quantity
called Instantaneous Decay Ratio (IDR) which
Fig. 4: A signal with linear frequency modulation (above) and WVD of the signal (below).
would serve as a real time stability parameter. The
algorithm also computes Accumulated Decay Ratio
(ADR) defined as the accumulative multiplication of
IDRs (in time) which projects the long term stability
trend of the reactor.
Algorithm for Computation of Decay Ratios
Fig.5 shows the schematic representation of the
proposed algorithm which computes of IDR and
ADR based on MHT channel flow information
acquired at discrete time instants and infers about
instability. The real signal sequence is converted

Research Article
ISSUE NO. 336 JAN-FEB 2014 15
into analytic signal by removing the negative
frequency components from the Fourier transform
of the real signal and doubling the positive
frequency components. Inverse transform of the
resultant spectrum gives the analytic signal. It may
be noted that conversion of the real signal into an
analytic signal is necessary to eliminate the low
frequency artefacts which appear in the Wigner
time frequency distribution otherwise. The signal is
then transformed into a zero mean signal and it is
used to compute the Wigner-Ville time frequency
distribution (WVD). The WVD involves FFT operation
on the local autocorrelation of the analytic signal
(localised product of time shifted signal at each
discrete time instant). Instantaneous frequency
(normalised first moment of frequency) is computed
by taking the frequency weighted average of the
magnitude of WVD at each discrete time instant.
Time marginal (instantaneous power of the signal)
is computed by adding the magnitude of WVD at
each discrete time instant and multiplying the sum
with the frequency resolution of the system. The
natural frequency is computed using instantaneous
frequency and the time marginal. The damping
factor (computed from the natural frequency and
time marginal) is used to compute IDR. The ADR is
the accumulative product of local IDRs.
Online implementation
The proposed algorithm is suited for online
implementation on a computer based system. The
channel flow information can be sampled and
acquired periodically, say every second, by a data
acquisition module. A moving window (of width
200 s) of channel flow signal with certain degree
of overlapping (of width 5 s) is fed to the algorithm
and the decay ratios based on latest window of
the flow signal are computed and continuously
displayed on the operator console.
Validation of the algorithm
The effectiveness of the decay ratio based algorithm
for instability detection is established using simulated
channel flow data for various stable and unstable
Fig. 5: Time frequency based algorithm for computing decay ratio

Research Article
16 ISSUE NO. 336 JAN-FEB 2014
scenarios obtained using a one-dimensional finite
difference based homogenous equilibrium model
of the MHT loop of AHWR, consisting of a single
downcomer, tailpipe, boiling channel and riser. The
model consists of mass, momentum and energy
balance equations to represent the dynamics of
coolant flow in the MHTS. It is assumed that there
is no relative velocity between the two phases and
the vapour and liquid in the channels and the
riser sections are in thermodynamic equilibrium.
Control volume-based spatial discretization and
forward difference scheme discretization in time
are employed to derive the difference equations
for mass, momentum and energy conservation for
various meshes in the MHTS. For a given operating
power and core inlet subcooling, the steady-state
distribution of system variables pressure, enthalpy,
density and flow are computed using steady state
equations. With the steady-state distribution as
the starting point, time-dependent difference
equations are solved for each mesh during transient
conditions. A small perturbation is introduced in
the channel power and the response of the system
variables - pressure, enthalpy, density and flow is
observed.
Fig.6 and Fig.7 show the preprocessed channel
flow (converted into a zero mean signal), respective
instantaneous decay ratios and accumulated decay
ratios computed by the algorithm during the onset
of stable and unstable oscillations respectively. Fig.
6 shows that the IDR value remains below unity
indicating an instantaneous stable behaviour. The
ADR shows a gradually decreasing trend showing
a globally stable behaviour. Similarly, Fig. 7 shows
that the IDR value remains above one indicating
unstable behaviour throughout the time window
and the ADR value gradually increases showing a
globally unstable behaviour. The figures indicate
that the decay ratio based algorithm effectively
operates on the channel flow signal and gives the
stability information of the system.
Fig. 6: Pre-processed Channel flow signal for a stable case of 24%Channel Power and core inlet subcooling of 12K and the time-variation of Instantaneous Decay Ratio and Accumulated Decay Ratio.

Research Article
ISSUE NO. 336 JAN-FEB 2014 17
Fig. 7: Pre-processed flow signal for an unstable case of 24%Channel Power and core inlet subcooling of 18K and the time-variation of Instantaneous Decay Ratio and Accumulated Decay Ratio.
Conclusion
The decay ratio estimation based on Wigner
-Ville time frequency representation is employed
to devise an algorithm capable of handling time-
varying nature of the density wave instabilities.
The algorithm is found to be very effective in
providing the stability information of the system
during stable and unstable scenarios simulated
using a homogenous equilibrium flow model. The
algorithm is suitable for online implementation due
to its computational simplicity. Implementation of
this algorithm on hardware with real time data
acquisition and computational capabilities would
yield a system that is capable of indicating the
stability status of the AHWR in real time. Such
an instability monitoring system would be of
immense benefit to the plant operator in taking
up immediate corrective measures in the event of
onset of instabilities.
References
1. Sinha R.K., Kakodkar, A. Design and
development of AHWR- the Indian thorium
fuelled innovative nuclear reactor. Nuclear
Engineering and Design 236 (2006):683-700.
2. Boure, J.A., Bergles, A.E., and Tong, L.S.
Review of two-phase flow instability, Nuclear
Engineering and Design 25, (1973): 165-192
3. Su Guanghui et al. Theoretical and experimental
study on density wave oscillation of two-phase
natural circulation of low equilibrium quality
Nuclear Engineering and Design 215, (2002):
187–198.
4. Cohen, L. Time Frequency Analysis. Prentice
Hall, Eaglewood Cliffs, NJ, 1995.
5. Torres-Fernandez J.E. et al. Decay ratio
estimation based on time frequency
representations. Annals of Nuclear Energy, 37
(2010): 93-102.

Technology Development Article
18 ISSUE NO. 336 JAN-FEB 2014
Introduction
PFBR is a sodium cooled pool-type nuclear reactor
which has sodium-submerged 181 Fuel Sub
Assemblies (FSAs). During normal operation of the
reactor, the temperature of liquid sodium is more
than 5500C. Due to high temperature, prolonged
irradiation and flow of liquid sodium, there is a
possibility of growth and protrusion of hexagonal
shaped FSAs. As ultrasonic imaging technique only
can be used for visualisation inside the optically
opaque liquid sodium at 1800C, an automated
Under Sodium UltraSonic Scanner (USUSS) has been
designed & developed for detection of growth and
protrusion of in-core FSAs. Ultrasonic Pulse-Echo
(PE) mode and C-Scan imaging technique have
been used for this application. Sodium-compatible
5MHz ultrasonic transducers are employed for
downward viewing operation for detection of
Under Sodium Ultrasonic Imaging System for PFBR
growth in FSAs which are located underneath the
scanner and 1MHz transducers are utilised to scan
in sideways i.e. in lateral direction for detection
of protrusion of FSAs. The scanning is carried out
before every fuel handling operation so that Large
and Small Rotatable Plugs of Prototype Fast Breeder
Reactor (PFBR) can be rotated safely.
Core-plenum is a general level of all the in-core FSAs of
PFBR. Detection of growth and protrusion of FSAs is to
be carried out with reference to this level. For detection
of growth in FSAs, maximum distance between the
core-plenum and the front face of DVTs would be
100mm with minimum detection of growth to be
5mm. Therefore to meet this requirement, optimum
frequency found out by experiments for DVTs is 5MHz.
Similarly, to detect minimum 50mm protrusion of FSAs
at a distance of 5m in sodium, optimum frequency
found out by experiments for SVTs is 1MHz.
V. H. Patankar, S. K. Lalwani, A. A. Agashe, G. D. Randale, R. Chaurasia, P. Jyothi, L.V. Murali Krishna, R. K. Jain, S. Srivastava, T. S. Ananthakrishnan, C. K. Pithawa
Electronics Division, BARC
Abstract
Under Sodium UltraSonic Scanner (USUSS) has been developed to detect the growth and protrusion of
Fuel Sub-Assemblies of PFBR, submerged in liquid sodium by using the ultrasonic imaging technique during
reactor shut-down when liquid sodium is at 1800C. The imaging is carried out prior to every Fuel handling
operation. Electronics Division, BARC has designed and developed an 8-Channel Ultrasonic Imaging
System (UIS) which consists of 4 downward viewing and 4 side viewing ultrasonic transducers alongwith
pulser-receiver, signal processing electronics hardware and software. An automated mechanical scanner
developed by IGCAR houses sodium immersible transducers to image the fuel Sub Assemblies. The system
has been successfully tested with dummy protruding and grown FSAs, submerged under liquid sodium.
Such ultrasonic imaging systems are not available to India from international market. The USUSS developed
indigenously has all the features available in similar systems developed by other countries.
After every imaging campaign, the mechanical scanner containing ultrasonic transducers is stored in the
Argon filled storage-pit. Before every campaign of USUSS, it is necessary to check the healthiness of the
sodium immersible and contaminated ultrasonic transducers, as the under-sodium scanner is decontaminated
once in five years. For this purpose, a novel Non Contact Ultrasonic Inspection System (NCUIS) has been
designed and developed by Electronics Division, BARC to check the functionality of the high-temperature
and contaminated transducers of USUSS, using air-coupled ultrasonic technique.

Technology Development Article
ISSUE NO. 336 JAN-FEB 2014 19
After completion of imaging campaign, the
mechanical scanner is taken out of reactor vessel
and stored in the Argon filled storage-pit. Before
starting of every campaign of USUSS, it is necessary
to check the health of all the ultrasonic transducers.
These transducers, which have residues of
sodium and are contaminated, are checked
using air-coupled ultrasonic technique which
does not require any liquid or solid couplant. The
transducers are checked by pairing each of them
with corresponding air-coupled transducers and
each pair works in Transmit-Receive (T-R) mode.
16-Channel ultrasonic instrumentation designated
as Non-contact Ultrasonic Inspection System
(NCUIS) has been designed and developed for this
purpose. Following description provides details of
both the systems as well as their configuration,
calibration setup and test results.
Under Sodium UltraSonic Scanner (USUSS)
System Description: Under Sodium Ultrasonic
Scanner of PFBR comprises of Instrumentation &
Control (I&C) H/W, system S/W and automated
mechanical scanner. The I&C hardware of USUSS has
been configured into 19” Control & Drive Panel and
Ultrasonic Imaging System (UIS) Panel. The system
software performs automated data acquisition,
display, storage and analysis of 1D,2D,3D data/
images. Fig. 1 shows schematic block diagram of
I&C of USUSS.
Ultrasonic Imaging System: The Ultrasonic Imaging
System comprises of 8-Channel Ultrasonic Pulser-
Receiver unit, Industrial PC with high speed PCI
digitizer and system S/W and HV & LV DC power
supplies. The pulser-receiver unit sequentially
excites the ultrasonic transducers of USUSS using
high voltage square wave tone-burst pulser;
receives the reflected echo signals for each channel;
amplifies and multiplexes them. The multiplexed
echo signal is fed to PCI based 100MSPS, 8 Bits Digitizer located in PC. The software acquires, stores, processes and analyzes the data. The data acquisition is synchronized by generating suitable trigger signals within the pulser-receiver unit and the multiplexed trigger signal is connected to the Digitizer. Configuration of pulser-receiver
Fig.1: Schematic Block Diagram of I&C of USUSS for PFBR
Technology Development Article
20 ISSUE NO. 336 JAN-FEB 2014
for deciding the no. of cycles in the tone-burst,
frequency of excitation signal, receiver (amplifier)
gain, band-pass filter selection, total channels etc.,
is achieved using RS232 interface between UPR unit
and PC. Pulser-receiver diagnostics are performed
to check availability of all LV DC power supplies,
delivery of trigger commands, checking of active
channels, checking of initial ringing of transducer/
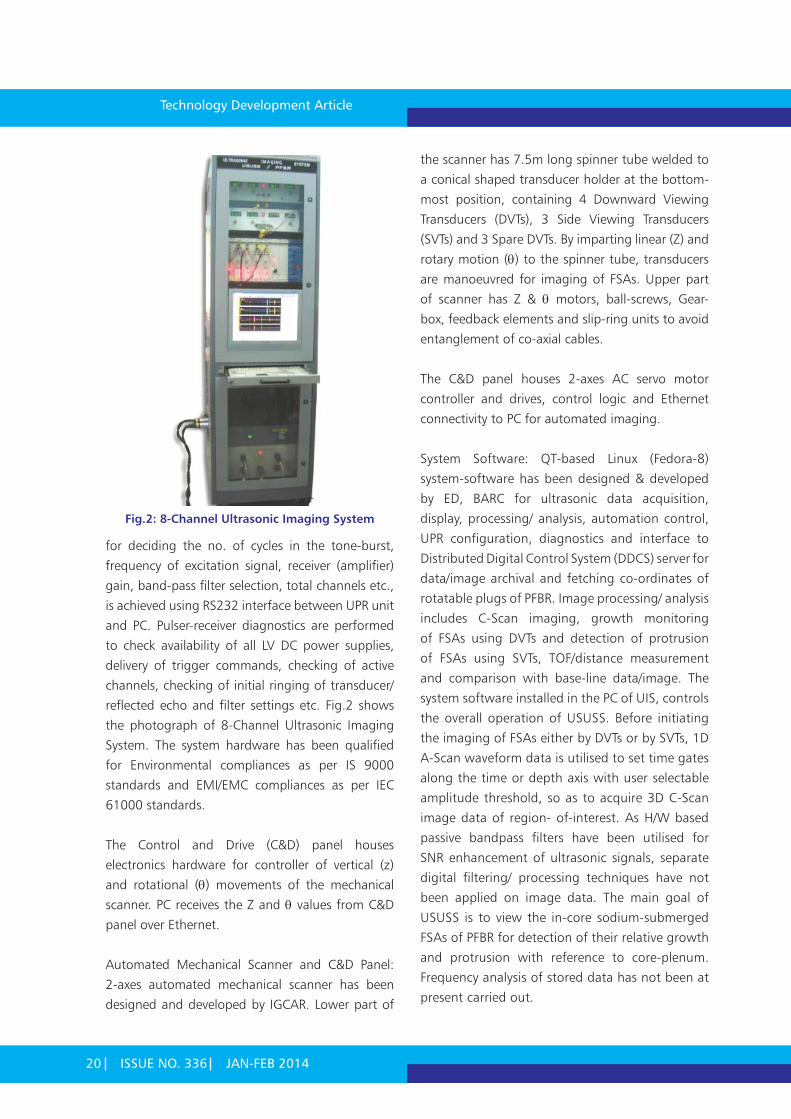
reflected echo and filter settings etc. Fig.2 shows
the photograph of 8-Channel Ultrasonic Imaging
System. The system hardware has been qualified
for Environmental compliances as per IS 9000
standards and EMI/EMC compliances as per IEC
61000 standards.
The Control and Drive (C&D) panel houses
electronics hardware for controller of vertical (z)
and rotational () movements of the mechanical
scanner. PC receives the Z and values from C&D
panel over Ethernet.
Automated Mechanical Scanner and C&D Panel:
2-axes automated mechanical scanner has been
designed and developed by IGCAR. Lower part of
the scanner has 7.5m long spinner tube welded to
a conical shaped transducer holder at the bottom-
most position, containing 4 Downward Viewing
Transducers (DVTs), 3 Side Viewing Transducers
(SVTs) and 3 Spare DVTs. By imparting linear (Z) and
rotary motion () to the spinner tube, transducers
are manoeuvred for imaging of FSAs. Upper part
of scanner has Z & motors, ball-screws, Gear-
box, feedback elements and slip-ring units to avoid
entanglement of co-axial cables.
The C&D panel houses 2-axes AC servo motor
controller and drives, control logic and Ethernet
connectivity to PC for automated imaging.
System Software: QT-based Linux (Fedora-8)
system-software has been designed & developed
by ED, BARC for ultrasonic data acquisition,
display, processing/ analysis, automation control,
UPR configuration, diagnostics and interface to
Distributed Digital Control System (DDCS) server for
data/image archival and fetching co-ordinates of
rotatable plugs of PFBR. Image processing/ analysis
includes C-Scan imaging, growth monitoring
of FSAs using DVTs and detection of protrusion
of FSAs using SVTs, TOF/distance measurement
and comparison with base-line data/image. The
system software installed in the PC of UIS, controls
the overall operation of USUSS. Before initiating
the imaging of FSAs either by DVTs or by SVTs, 1D
A-Scan waveform data is utilised to set time gates
along the time or depth axis with user selectable
amplitude threshold, so as to acquire 3D C-Scan
image data of region- of-interest. As H/W based
passive bandpass filters have been utilised for
SNR enhancement of ultrasonic signals, separate
digital filtering/ processing techniques have not
been applied on image data. The main goal of
USUSS is to view the in-core sodium-submerged
FSAs of PFBR for detection of their relative growth
and protrusion with reference to core-plenum.
Frequency analysis of stored data has not been at
present carried out.
Fig.2: 8-Channel Ultrasonic Imaging System

Technology Development Article
ISSUE NO. 336 JAN-FEB 2014 21
Under-water Test Setup for Calibration of UIS:
Under-water test set up has been fabricated
and installed at ED, BARC for the calibration of
8-Channel Ultrasonic Imaging System. 10m long
pipe-assembly set-up is shown in Fig. 3a. The
horizontally placed pipe assembly was filled with
water. A circular opening has been provided to
mount the 1MHz SVT at one end of the pipe-
assembly and a rectangular cut-out has been
provided at the other end of pipe to place cluster
of 10 FSA top-heads made of SS as shown in Fig. 3b. FSA top-heads (each 90 mm tall) and reflector sub-assemblies (3 nos. of each having 88 mm OD and 190 mm height) were placed over the flat plate resting inside the pipe.
to change the orientation of protruding FSA with respect to the front face of SVT. The detection of protrusion was carried out in under-water setup where the protruding FSA was kept at a distance of ~9 m from the front surface of SVT. Cluster of nine FSAs were placed at same level and were kept between the protruded FSA and SVT to form the core-plenum. The actual height of hexagonal shaped full-length FSA of PFBR is 4.5m whereas only 90mm tall top-heads, having identical shape as the original FSA with 3mm flat annular surface at the top of FSA, have been used for calibration of 8-Channel ultrasonic imaging system. To simulate the divergence of ultrasound in sodium, 10m pipe, filled with water was selected, to match the difference in acoustic velocities. Maximum distance to be scanned in PFBR would be ~5m in sodium.
Major parameters governing the fidelity of ultrasonic images are based on the axial resolution of the transducer, digitization rate and angular/linear step size with which automated ultrasonic images are acquired. For imaging activity carried out by DVTs, the optimum angular step size found out by experiments is 1 degree whereas, for SVTs, the angular and linear step sizes found out by series of experiments is 1 degree and 2mm respectively. Results of Under-water Testing:
8-Channel Ultrasonic Imaging System has been tested with varying amount of protrusion ranging from 5 mm to 50 mm as well as with two different orientations of the protruding FSA by placing flat surface or the edge of hexagonal shaped FSA in front of SVT. Distinct echo signals were obtained from FSA with 25mm or higher protrusion when its flat surface/ edge was facing SVT.
The amplitude of echo signal received from protruded FSA was observed to be increasing with increase in protrusion. Fig. 4 shows a typical A-Scan waveform obtained with 50 mm protrusion at a distance of around 9 m, in water. Also, irrespective of the orientation of protruded FSA, the echo
Fig. 3a: 10 m Long Pipe Assembly
Fig. 3b: Cut-outs for Transducer and FSA Top-heads in 10 m Long Pipe Assembly
The cylindrical reflector SAs were placed behind the cluster of FSA top-heads, with reference to face of SVT. Circular discs of thickness range 5-50mm were placed under one of the FSA top-heads to simulate protrusion. Provision was made

Technology Development Article
22 ISSUE NO. 336 JAN-FEB 2014
signals received from the cylindrical shaped reflector SAs were observed to have a trend of increase in amplitude with the reduction in protrusion from 50 mm to 25 mm.
Fidelity of echo signals was confirmed also by generating water flow of 1m/s in pipe setup and 10% reduction in echo signal amplitude was observed.
Results of Under-sodium Imaging: Prototype
Ultrasonic Imaging System was tested in sodium
test-vessel at IGCAR, Kalpakkam, Tamilnadu. The
sodium vessel test setup comprised of 1m diameter
tank containing 27 dummy FSA top-heads at the
bottom-most position. 19 FSA top-heads were
placed under the transducer holder and remaining
8 FSA heads were mounted along periphery of the
tank at different orientations with reference to the
face of SVTs. Fig. 5a shows the C-Scan image of
19 FSAs located underneath the transducer holder
and detection of 5mm growth of one of the FSAs.
Fig. 5b shows the 3D ultrasonic image of the setup
indicating locations of tie-rods used to hold the
test setup, and 8 FSAs with different orientations.
The circular shaped image at the boundary shows
the wall of the tank containing all the FSA top-
heads.
16-Channel Non-Contact Ultrasonic Inspection
System: The NCUIS is used to check the functionality
of ultrasonic transducers of USUSS, without making
any contact with the contaminated transducers, before every campaign of USUSS of PFBR. Instrumentation of 16-Channel NCUIS, housed in 19” rack, is based on air-coupled ultrasonics and works in T-R mode of operation. A test-jig consisting of 8 sodium-compatible and 8 Air-coupled transducers has been fabricated for testing of NCUIS. Each pair of the sodium-compatible and air-coupled transducer is placed along the line-of-sight with a known stand-off distance.
Fig. 4: Typical A-Scan Waveform Acquired for Detection of 50 mm Protrusion of FSA
Fig. 5a: FSA Mapping using 4 DVTs Fig. 5b: 3D Ultrasonic Image of FSAs using SVT

Technology Development Article
ISSUE NO. 336 JAN-FEB 2014 23
Initially, the sodium-compatible transducers were sequentially energized by a tone-burst pulser to transmit ultrasound in air and the corresponding air-coupled transducer of the same frequency was used as a receiver. The signal was amplified using programmable gain amplifier with gain more than 100dB. A-scan waveforms were recorded for off-line measurements. Subsequently, the role of each transducer within the pair was interchanged and data was once again recorded. The received signals for both the setup were (off-line) analyzed for the assessment of health of sodium-compatible and contaminated transducers for its sensitivity as a receiver, transmission capability as a transmitter and computation of frequency contents of the received signal. DVTs and SVTs are narrowband transducers and so the frequency analysis carried out on received signals was only for academic study.
The NCUIS is capable of driving four pairs of 1MHz transducers and four pairs of 5MHz transducers to check the healthiness of SVTs and DVTs of USUSS. T-R mode of inspection is used because the sensitivity of 5MHz transducers is not adequate to work in
air using Pulse-Echo (PE) mode due to excessive attenuation of energy at higher frequencies in air.
NCUIS System Hardware: PC based 16-Channel NCUIS consists of 8-Channel Ultrasonic Tone-Burst Pulser with ±300V square-wave output and programmable 1-15 cycles of tone-burst; 8-Channel wideband receivers with programmable gain up to 120dB@ 10MHz (-3dB
BW); 100 MSPS-8-bits PCI
bus-based digitizer board
located in Industrial grade
PC, DC power supplies and an isolation transformer.
Fig.6 shows the photograph of the system panel.
NCUIS System Software: GUI software has been
developed for NCUIS. It facilitates A-Scan data
acquisition, display and storage of 1D data,
measurement of TOF/distance and frequency
analysis of the acquired data.
Test Setup for Calibration of NCUIS and Results:
The test-jig, fabricated for the purpose, comprises
of four 5MHz ultrasonic transducers, representing
DVTs of USUSS, facing 4 air-coupled ultrasonic
transducers of same frequency with a stand-
off distance of ~25 mm, as depicted in Fig. 7.
Similarly 4 more 1MHz transducers, representing
SVTs of USUSS, and corresponding 4 air-coupled
transducers of same frequency were mounted on
the test-jig with a stand-off distance of ~45 mm.
Fig. 7: Health-Checking of Sodium-Compatible Transducer as Transmitter and Receiver
Fig. 6: 16-Channel NCUIS System
Fig. 8: Test-Jig for Calibration of NCUIS

Technology Development Article
24 ISSUE NO. 336 JAN-FEB 2014
The test-jig has been designed and manufactured
by Workshop of ED, BARC and the photograph of
test-jig is shown in Fig. 8.
NCUIS Test Results: The NCUIS system was
connected to the transducers, mounted on the
test-jig, using 20m long cables. The cables were
routed through two slip ring units to simulate the
actual connections of USUSS transducers of site.
The received signals for 1MHz and 5MHz sodium-
compatible transducers were recorded. Fig. 9a and
Fig. 9b show the signals obtained from the 1MHz
and 5MHz SVTs and DVTs respectively.
Conclusion
Two innovative systems namely, UIS and NCUIS
have been designed and developed for USUSS
of PFBR. The main function of UIS is to perform
under-sodium ultrasonic imaging of PFBR core for
detection of growth and protrusion of FSAs. Using
sodium test vessel setup, 5MHz DVTs, 8-Channel
UIS and an automated USUSS, 5mm growth of
FSAs was detected. Using under-water 10m long
pipe set-up, UIS and 1MHz SVTs, 25mm FSA
protrusion was detected in water at a distance of
9m which is equivalent to ~5m in sodium. NCUIS
is mainly intended for checking functionality of
contaminated transducers of USUSS in the storage-
pit area.
The pulse-echo technique based 8-Channel
Ultrasonic Imaging System of USUSS has been
completely tested using under-water test set-up
at ED, BARC, Mumbai as well as in under-sodium
test vessel at IGCAR, Kalpakkam, Tamilnadu for
detection of growth and protrusion of dummy Fuel
Sub Assembly top-heads.
The Non Contact Ultrasonic Inspection System,
based on air-coupled ultrasound and working in
T-R mode, has also been tested at ED, BARC. Both
the above systems have been delivered to BHAVINI,
Kalpakkam, TN.
Acknowledgement
Authors wish to acknowledge the support received
from all the BARC and IGCAR team members of
task-force for USUSS of PFBR.
Fig. 9a: Signal received by 1MHz SVT
Fig. 9b: Signal received by 5MHz DVT

Technology Development Article
ISSUE NO. 336 JAN-FEB 2014 25
Introduction
In reactor operation or experiments, signals
indicating reactor power (or neutron flux) and
reactor period are generally used for direct
information on the state of the reactor. However,
the most important time dependent parameter is
the reactivity, and in the past few decades, many
techniques were proposed by researchers for on-
line dynamic computation of reactivity from the
above mentioned signals. Many nuclear reactors
worldwide are equipped with such reactivity meters.
Most of these digital reactivity meters employ
reactivity estimation based on inverse point kinetic
equations or otherwise based on reactor period.
However, these algorithms demand an accurate
knowledge of the model parameters, which is
difficult to provide in many cases. Also they do not
have any direct provision to eliminate noise content
in the data, and hence fail miserably in estimation
of subcriticality when the noise content in detector
Applications of Digital Reactivity Meter based on Kalman Filtering Technique in Indian Nuclear Reactors
R.K. PatilRaja Ramanna Fellow, E&I Group
and
S.R. ShimjithReactor Control Division
signal is large compared to the neutron flux level.
This is where the Kalman Filtering algorithm, with
its inherent ability to work with even highly noisy
input signals and uncertain plant parameters,
serves as a promising candidate.
The Kalman Filter is a recursive stochastic estimator
algorithm, which uses a mathematical model of
the process to predict the instantaneous values of
all the process variables (in the form of a vector
called the ‘state’); including those which cannot
be directly measured [1]. It further corrects these
predicted values using a feedback of the error
between the available measurements from the
actual process and the predicted outputs, through
an optimally computed feedback gain K. This
predictive-corrective process, with in-built noise
filtering capability resulting from the recursive
optimal computation of the feedback gain, repeats
in each cycle of the algorithm execution as shown
schematically in Fig. 1.
Abstract
A reactivity meter based on Kalman filter algorithm is developed in Reactor Control Division, Bhabha Atomic
Research Centre, for providing the reactor operator with a direct, online, real-time indication of the absolute
reactivity status of the reactor core under all states of the reactor from shutdown through start-up to power
operation. The reactivity meter has potential applications such as estimation of reactivity perturbations
around critical conditions, indication of point of criticality during reactor startup, shutdown margin
monitoring, worth computation and calibration of reactivity devices, detection of inadvertent insertion/
removal of reactivity under subcritical conditions etc., thereby improving the overall safety in reactor
operation. This article summarizes the applications of the reactivity meter in Indian nuclear reactors, and its
effectiveness in such applications as experimentally established. It also looks at the regulatory benefits and
support to utility in economization of plant operation.

Technology Development Article
26 ISSUE NO. 336 JAN-FEB 2014
A reactivity meter based on this algorithm is developed
in Reactor Control Division, Bhabha Atomic Research
Centre, for providing the reactor operator with a
direct, online, real-time indication of the absolute
reactivity status of the reactor core under all states
of the reactor from shutdown through start-up to
power operation, unlike the conventional reactivity
meters effective only during power range operation
[2]. The reactivity meter employs an embedded
system hardware consisting of processor with add-
on data acquisition and analog output cards. It
accepts the signals corresponding to reactor power
from the neutronic channels, and provides indication
of the estimated reactivity through a dedicated
Graphical User Interface (GUI) panel as shown in Fig.
2, and/or an analog meter mounted on the control
panel in Main Control Room. The reactivity meter
algorithm adopts the point kinetics model of the
nuclear reactor in standard state space form, with
neutron life time and delayed neutron data specific
to the reactor as the design data [3]. In order to use
the model for subcriticality indication, the source
term is explicitly modeled in terms of a known initial
stable subcriticality and corresponding steady state
power level for any reference subcritical condition,
which form two additional design parameters for
the meter.
During the past decade, efficacy of this reactivity
meter in estimation of core reactivity under different
operating conditions has been demonstrated in
various nuclear reactors. Vast operational experience
from these exercises has proved that the meter is a
very handy tool in applications such as estimation
of reactivity perturbations around critical conditions
and indication of point of criticality during reactor
startup, shutdown margin monitoring, worth
computation and calibration of reactivity devices,
detection of insertion/removal of small amounts
of reactivity under subcritical conditions etc. The
applications of the reactivity meter in Indian nuclear
reactors, and its effectiveness in such applications
as experimentally established, are touched upon in
the forthcoming sections.
Fig. 1: Schematic representation of Kalman filter algorithm
Indication of point of criticality during reactor startup
The reactivity meter can effectively be used during
startup operation of nuclear reactors, including
first startup, to monitor the approach to criticality.
Fig. 3 shows the response of the reactivity meter
during the first approach to criticality of a critical
facility in Trombay. The meter had been indicating
the instantaneous shutdown margin while
withdrawing a control rod in small steps. As the rod
approached its critical position, indicated reactivity
also approached to zero. When the rod position
attained 771 mm, the estimated reactivity was close
to zero, indicating the criticality. Subsequently
when the rod was driven further out and kept
at 792 mm for about 5 minutes, it indicated a
Fig. 2: Screenshot of the reactivity meter GUI

Technology Development Article
ISSUE NO. 336 JAN-FEB 2014 27
and in Fast Breeder Test Reactor (FBTR),
Kalpakkam.
Fig. 4 depicts the performance of the
meter in the critical facility during a
transient involving lowering of control
rod followed by dropping of safety rods.
Prior to the transient, the meter indicated
that the reactor was subcritical by about
2.9 mk. When the control rod reached
core bottom, indicated subcriticality was
about 7 mk. Subsequently when the
shut off rods reached core bottom, the
indicated subcriticality was stabilized at
63 mk. These figures were found to be
in very good agreement with the values
calculated by the reactor physicists. It
is also established that the Reactivity Meter can
indicate the reactivity even under a prolonged
shutdown, thus providing valuable information of
the shutdown margin of the reactor.
Fig. 3: Response of the meter during approach to criticality.
supercriticality of about 0.3 mk. During this phase,
the reactor was declared critical. Afterwards the
rod was driven down to 768 mm during which the
indicated subcriticality was about -0.08 mk. Soon
the rod was driven slightly out to 772 mm, on
which the reactivity indicated was zero.
Reactor was operated at critical steady
state with the rod at 772 mm as shown.
Subcriticality Monitoring
Real–time indication of subcriticality is a
challenging problem, essentially due to
the difficulties in modeling the neutron
source strength with sufficient accuracy,
and also due to the high fluctuations in
neutron signals measured in subcritical
systems. The Kalman filter algorithm
has inherent capability to work with
stochastic signals and hence addresses
the latter issue efficiently. Former issue is
taken care of by an explicit modeling of the neutron
source in terms of any known initial subcriticality
as mentioned previously. Efficacy of the meter in
indication of subcriticality has been validated in
research reactors and critical facility at Trombay
Fig. 4: Subcriticality indication in the critical facility during the lowering of regulating rod followed by reactor trip.
Worth Computation and Calibration of Reactivity Devices
Experiments conducted in different reactors
demonstrate the capability of the meter to serve

Technology Development Article
28 ISSUE NO. 336 JAN-FEB 2014
as a handy tool for direct online computation of
the worth of different reactivity devices and their
calibration. Outcome of one such exercise in the
critical facility is depicted in Fig. 5. It shows the
worth estimation when two shutoff rods were
withdrawn sequentially. With both the shutoff
rods at core bottom, reactivity indicated was -90
mk. When first rod was fully retracted, it was about
-57.75 mk which shows that its worth is 32.25 mk.
When the second rod was fully withdrawn, reactor
was still subcritical by about 31 mk. This indicates
that the worth of the second rod, with the first one
at top, is 26.75 mk.
Likewise, Fig. 6 depicts the response of the
meter during step by step withdrawal and
subsequent insertion of the regulating rod in
the critical facility. Prior to the withdrawal of
the regulating rod, the indicated subcriticality
was 22.6 mk. The regulating rod was
withdrawn in steps of about 100 mm till it
reached the core top when the subcriticality
indicated was 10.8 mk. Hence, the worth of
the rod as indicated by the reactivity meter
is 11.8 mk, against the calculated worth
of 12.6 mk. From the reactivity estimated
by the meter at different rod positions, the
calibration curve of the rod was plotted
off–line. Fig. 7 compares this calibration
curve, with that generated from the physics
calculations.
Detection of reactivity changes during fuelling operations
The feasibility of using the reactivity meter for
the purpose of measuring the reactivity during
shutdown, fuel handling and startup of the
reactor was established in FBTR. Measurement
of reactivity during fuel handling operations
was of prime significance. During the
fuel handling campaign, various fuel sub
assembly transfer operations were carried
Fig. 5: Online estimation of shutoff rods’ worth in critical facility.
Fig. 6: Indicated reactivity during regulating rod calibration exercise in critical facility.
Fig. 7: Comparison of the calibration curves generated from reactivity meter readings and physics computations.

Technology Development Article
ISSUE NO. 336 JAN-FEB 2014 29
out. While transfer operation is in progress the
changes in core reactivity values were estimated
online by the reactivity meter. From the results
obtained, it was concluded that the meter is
very effective in indication of the worth of fuel
pins. Subsequently it was proposed to connect
the meter as a diverse measuring instrument to
the existing reactivity meter which is effective
only in the high power range. Fig. 8 depicts the
response of the meter during this fuel handling
operation, which indicates that the meter
recognizes each incident of fuel pin removal /
insertion, and provides a direct indication of the
worth of individual pins.
the rods since the change in reactivity status of the core on shut-off rod drop is equal to the worth of the shut-off rod. The efficacy of the reactivity meter in estimation of rod drop time has been demonstrated through offline analysis as well as rod drop experiments in FBTR. Fig. 9 depicts the time variations of neutronic signal, estimated reactivity and the reactivity computed from the rod position, during dropping of a shutoff rod in FBTR. The deviation between rod drop time inferred from the reactivity values estimated by the reactivity meter and the drop time inferred from rod position signal is found to be less than 20 ms, which is considered acceptable for sensing of rod drop time [4]. Concluding Remarks
The applications of the reactivity meter based on the Kalman filtering technique have generated remarkable confidence in its usage. The reactivity meter facilitates continuous surveillance of the core reactivity status from shutdown through the start-up and power range operation of the reactor. Since it always indicates the true state of the reactor, shutdown margin is always directly known, and not inferred by status of reactivity devices as it happens in PHWRs today. The meter assists the operator in monitoring the shutdown margin, detection of any inadvertent introduction of reactivity into the core and in assessment of any requirements of addition
Fig. 8: Response of the meter during fuel handling operations in FBTR.
Drop Time Monitoring of Safety Rods
In PFBR, there are two independent, fast acting, and diverse shutdown systems, the first comprising of nine Control & Safety Rods (CSRs) and the second consisting of three Diverse Safety Rods (DSRs). Monitoring of the drop-time performance of the DSRs is an important design requirement, however, design does not provide for direct sensing of top and bottom positions of DSRs due to physical restrictions on layout and unfavorable environmental conditions. Therefore, the drop time of DSRs will be monitored in PFBR using the reactivity meter, based on the principle that the drop-time can be found out from the record of reactivity change subsequent to the dropping of
Fig.9: Estimated and actual reactivity during a rod drop in FBTR

Technology Development Article
30 ISSUE NO. 336 JAN-FEB 2014
of boron in the moderator, thereby improving the overall safety in reactor operation.
There is generally a stipulation by regulator that Minimum Shutdown margin of 10 mk must be maintained during shut down at all times. There are no means available in Indian reactors to verify this stipulation. Hence it is always up to utility to show the regulator by calculations that this stipulation is being met. The situation becomes even more complicated when the reactivity in the reactor can change substantially due to change in temperature and Xenon concentration. If an online reactivity meter is installed in the plant it provides direct monitoring of the reactor status, thus enabling regulator o monitor the specified Shutdown margin criterion.
The Reactivity Meter can offer the best protection against inadvertent criticality happening in a nuclear reactor. Reactivity Meter can be used to generate an alarm whenever Reactor keff exceeds 0.99 or is within 10 mk of becoming critical. This indirectly provides regulatory benefits by improving safety.
Specification of shutdown system is often made in terms of speed of actuation of device i.e. Shutoff rods insertion time or injection time in case of liquid poison system. These are again indirect means of ensuring safety, true parameter for reactor being the negative reactivity insertion time. With the reactivity meter regulator can now insist on measure of negative reactivity insertion time.
The reactivity meter can effectively provide a direct estimate of the variations in xenon load subsequent to a reactor trip. This will aid the operator in restarting the reactor prior to a poison out, or in delay of boron addition to maintain adequate Shutdown margin and will also provide more time to the utility whereby it can optimize the amount of boron to be added; in fact in most of cases the plant may be able to skip the boron addition completely. This provides two benefits, first, it will reduce load on resin used in boron removal system which will reduce the radioactive waste. Second, it will reduce
the startup time for the reactor as boron removal time will be reduced drastically in most of the cases.
The capability of the reactivity meter in online monitoring of sub criticality status of the reactor cores can be exploited to extend its application to the monitoring of spent fuel storage pools. With dedicated neutron detectors strategically located inside the spent fuel storage pools, sub criticality status of the pools can be monitored continuously thereby enhancing the safety of the storage pools.
Finally, it is convincingly felt that a reactivity meter is a very useful and convenient instrument for reactivity measurements during the physics experiments. It provides direct reactivity measurement in many experiments with great convenience and accuracy, which would not be possible through conventional means.
Acknowledgement
The authors express their sincere gratitude to Director E&IG and Director RPG, BARC, and Director ROMG, IGCAR for their kind support.
References
1. H. W. Sorenson, “Kalman Filtering Techniques,” Kalman Filtering: Theory and Application, edited by H. W. Sorenson, New York: IEEE Press, 90 - 126 (1985).
2. A.P. Tiwari, B.R. Ivan. “Kalman Filtering Technique for Reactivity Measurement”. Proceedings of symposium on Advances in Nuclear and Allied Instrumentation (SANAI - 97), Feb 5-7, 1997, BARC.
3. T.U. Bhatt, S.R. Shimjith and A.P. Tiwari, “Estimation of shutdown reactivity in power reactor: Comparative study of inverse point kinetics and Kalman filtering,” BARC Newsletter, Issue No. 324, Jan-Feb 2012.
4. Report of the task force for the development and supply of Kalman filter based system for monitoring the drop-time performance of PFBR-DSRDM.

Technology Development Article
ISSUE NO. 336 JAN-FEB 2014 31
Introduction
The Pressure Tubes in Pressurized Heavy Water
Reactors (PHWRs) undergo dimensional changes
due to the effects of irradiation creep and growth.
This causes permanent increase in length and
diameter of pressure Tube and also sag that occurs
from the weight of the fuel bundles and coolant
contained in it. The increase in diameter may lead
to fuel failure due to in-sufficient cooling caused by
the coolant bypassing the fuel bundle. Squeezing
of garter spring spacer between the pressure and
Measurement of Internal Diameter of Pressure Tubes in Pressurized Heavy Water Reactors
using UltrasonicsManojit Bandyopadhyay, Amit K Haruray, A.M. Kadu, Gurpartap Singh, H.M. Bapat,
M. Padmanabhan, R.K. Puri and D.N. BadodkarDivision of Remote Handling & Robotics
Calandria Tubes may create safety issues. The coolant
bypassing the fuel bundles also reduces the critical
channel power at constant flow. Thus, the diameter
expansion turns out to be a major life limiting
parameter for the reactor Pressure Tubes. Hence
periodic monitoring of pressure Tube diameter is
necessary during In-Service Inspection (ISI) and also
during pre-service inspection (PSI) for baseline data.
Mechanical measurements from inside the Tube are
difficult due to high radiation and inaccessibility. The
presence of heavy water as coolant helps the use of
Ultrasonic immersion based techniques for periodic
Abstract
The Pressure Tube in Pressurized Heavy Water Reactors (PHWRs) undergoes dimensional changes due to
the effects of creep and growth as it is subjected to high pressure and temperature, which causes Pressure
Tubes to permanently increase in length and diameter and to sag because of weight of fuel & coolant (heavy
water) contained in it. These dimensional changes are due to prolonged stresses under high temperature &
radiation. Pressure Tube stresses are evaluated for both beginning and end of life for accounting the Pressure
Tube dimensional changes that occur during its design life. At the beginning of life, the initial wall thickness
and un-irradiated material properties are applied. At the end of life, Pressure Tube diameter and length
increases, while wall thickness decreases. Material strength also increases during that period. The increase
in Pressure Tube diameter results in squeezing of garter spring spacer between the pressure and calandria
Tubes. It also causes unacceptable heat removal from the fuel due to an increased amount of primary
coolant that bypasses the fuel bundles. This reduces the critical channel power at constant flow. Hence the
periodic monitoring of pressure Tube diameter is important for these reasons. This is also required as per the
applicable codes and standards for In-Service Inspection of PHWRs. Mechanical measurement from ID of
the Tube during periodic monitoring is not practically feasible due to high radiation and inaccessibility. This
necessitates the development of NDT technique using Ultrasonics for periodic in-situ measurement of ID of
pressure Tubes with a BARC made remotely operated drive system called BARCIS (BARC Channel Inspection
system). The development of Ultrasonic based ID measurement techniques and their actual applications in
PHWRs Pressure tubes are being discussed in this paper.
Key Words: Ultrasonic velocity, Heavy water, In-situ Calibration, Stepped reference block, Coolant
Channel

Technology Development Article
32 ISSUE NO. 336 JAN-FEB 2014
in-situ measurement of Internal Diameter (ID) for
pressure Tubes along with a remotely operated drive
system (BARC Channel Inspection System) BARCIS.
Since the Ultrasonic velocity is highly dependent
upon temperature of the medium, in which they
are travelling; a provision has been made for in-
situ compensation for velocity variation in heavy
water flowing through PT under measurement.
This paper describes the development of UT based
two techniques viz. full wave rectified flank method
& negative half wave rectified peak method for PT
ID measurement with in-situ ultrasound velocity
compensation required to maintain measurement
accuracy. It also discusses our experiences gained
during ID measurements carried out at different
reactors (for both types of PHWRs; 220MWe & 540
MWe PHWRs).
EXPERIMENTAL SET UP:
BARCIS Inspection head for ID measurement has
been designed with three 10 MHz immersion
spot focused probes; two probes are used for
measurement of water path kept at diametrically
opposite to each other (180°
apart) and the third probe is used
for calibration, kept at a fixed
distance from a stepped reference
reflector as shown in Fig 1. First ID
is measured at 12 locations of the
reference standard piece where it
is mechanically measured using
two axis co-ordinate measuring
machine (CMM) and the calibration
is done using calibration probe
and stepped reference reflector by
observing the difference between
first and second echo using digital
Ultrasonic flaw detector having
multiple gates and minimum
reading accuracy 0.01 mm (Fig
2). At the calibration velocity the
water paths are measured by the
other two probes meant for actual measurement.
(fig.3) Then the ID value measured by mechanical
method is subtracted from the summation of
two water paths measured by two measurement
probes. It gives us the value of probe-to-probe face
distance within the inspection head and this value
will be constant during all measurements. Probe to
probe face distance is not possible to measure by
mechanical measurement due to the geometrical
layout & probe positions. For measurement of water
paths in full wave rectified flank measurement
method; the difference between 1st & 2nd interface
echoes are measured and in negative half wave
rectified peak measurement method the difference
between initial pulse and first interface echo is
measured. Since the Pressure Tube (PT) is filled with
heavy water; during ID measurement inside the
coolant channel, there is a need in the inspection
head to have a reference calibration probe to
measure in-situ calibration velocity. Since the ID
value is required with high accuracy, Ultrasonic
flaw detector is required to get the water path
reading at least with 10 microns reading accuracy
as mentioned above.
Fig.1: Schematic of Ultrasonic probes arrangement for ID measurement

Technology Development Article
ISSUE NO. 336 JAN-FEB 2014 33
TOF1 = Ultrasound Time of Flight from probe 1,
in μs
TOF2 = Ultrasound Time of Flight from probe 2,
in μs
v = Ultrasound velocity in liquid (viz. Heavy water)
medium, in mm/μsec
x = Probe to probe face distance for probe 1 &
probe 2, in mm
Velocity calibration from stepped piece,
(2)
v = calibration velocity, in mm/μsec
z = step distance from reference piece, in mm.
TOFs1 = Ultrasound Time of Flight from surface 1,
in μs
TOFs2 = Ultrasound Time of Flight from surface 2,
in μs
Possible errors during ID measurement:
1) Mechanical configuration of the stepped
surface such as chamfering, surface roughness,
degree of parallelism etc
2) Ultrasonic instrument settings
3) Errors in measurement of probe to probe face
distance
4) Variation in light water/heavy water velocities
5) Distance between stepped reference piece used
for calibration and reference ultrasonic probe.
Features to achieve the measurement accuracy:
The difference in thickness of two stepped reference
block was made to ~18 mm. This will ensure the
increased accuracy of water path measurements
which is the range of 15-20 mm during actual
inspection.
The surfaces of reference block for in-situ velocity
measurement has been smoothly polished. In
order to achieve sharp stable echoes; the surface
Since actual measurements are done in the channel
filled with heavy water, calibration of Inspection
heads are also carried out using virgin heavy water
before putting into the actual channel. Measurement
of Ultrasonic velocity at each measurement location
within the channel compensates the Ultrasonic
velocity in heavy water at the channel temperature
and all measurements within the channel are taken
with the measured Ultrasonic velocity in both the
techniques.
Measurement Methodology:
(1)
D = Diameter of Pressure Tube, in mm
Fig.2: Echoes from Stepped Reference Block
Fig.3: Water Path Measurement by Ultrasonic Probe

Technology Development Article
34 ISSUE NO. 336 JAN-FEB 2014
finish of the reference target is made of the order
of 0.1 micron or better and two stepped surfaces
parallelism is maintained within 10 microns.
The water distance measured by probe is adjusted in
such a way that first interface and second interface
echoes are having almost equal heights in flank
method. This significantly contributes increase in
measurement accuracy.
ID measurement in calibration Tube piece is made
by two axis coordinate measuring machines where
inaccuracy is negligible and minimizes errors in ID
values used during calibrations.
Calibration is done before putting the inspection
heads into the channel. Inspection heads are
calibrated using both light water and heavy
water and ID values obtained are compared with
mechanical measurement ID data of calibration
Tube piece (which is done by two axis coordinate
measuring machines). The difference between
ID by mechanical measurement and ultrasonic
measurement during calibration is always of the
order of ± 50 microns.
Considering all other uncertainties in the
measurement, the overall accuracy of ID
measurement system achieved is approx. ±100
microns.
Calibration Procedure:
First the velocity in the calibration media (first
light water, then heavy water) is determined using
reference probe with the help of stepped reference
block. The reference probe distance from the
stepped block is adjusted in such a way that the
amplitudes of echoes from the two interfaces of
stepped block is almost same (max variation of ±
5% FSH) at any gain (dB) in flank method when put
in heavy water during calibration.
Similarly in negative half wave rectified peak
method, the distance between initial pulse & 1st
interface echo is measured and in this method the
echo amplitude can be kept at any height on the
screen. Probe to probe face distance is measured in
both light water and heavy water during calibration
at minimum 3 locations and the difference between
these measurements cannot be more than ± 30
microns in both flank and peak method.
The calibration spool of Pressure Tube is around
500mm long. At the centre of the Tube four axial
locations (min 50mm apart) are marked as P, Q,
R and S. At each axial location, 3 circumferential
orientations viz; 6 – 12 O’ clock, 4 – 10 O’clock
and 2 – 8 O’clock are marked with respect to a fixed
reference. All these points are defined as calibration
locations and there are 12 such calibration locations
in calibration spool.
First the calibration is to be done using light water.
At first calibration location, probe to probe distance
is determined. This is done by measuring water path
at that location using two measurement probes at
reference velocity set as mentioned above. The sum
of the water path by both measurement probes
is to be subtracted from the ID value measured
by mechanical method. This probe to probe face
distance is a mechanical parameter and remains
constant irrespective of media and calibration
locations. The measurement of this probe to probe
distance is thus repeated at other two locations.
The difference of these measurements should not
vary by more than ±30μm (microns) as mentioned
earlier. The mean of probe to probe face distance
measured in heavy water is used during actual ID
measurement within the Pressure Tube in both the
methods.
After that in remaining 9 calibration locations,
using average probe to probe face distance
determined above, ID values by Ultrasonic method

Technology Development Article
ISSUE NO. 336 JAN-FEB 2014 35
are calculated and they are compared with
mechanical ID measurement values. The difference
of ID determined by UT method and mechanical
method does not vary by more than ±50μm for
any calibration locations.
The distance between the measurement probes and
the ID of the tube is adjusted in such a way that
the amplitudes of the first and second interface
echoes shall be almost same (max variations
± 5% FSH at any gain level) in flank method. In
velocity measurement interface echoes from two
steps shall be kept within the width of ‘A’ and ‘B’
gates respectively and difference in the beam path
between the gates measured in flank/edge mode.
In water path measurement, 1st and 2nd interface
echoes are kept within gates A and B respectively
(gate threshold level to be kept at 40 % FSH for
both the gates) and their differences are measured
in flank/edge mode. Measurement of Velocity of
Ultrasound in Light Water was carried out using
negative half-wave rectification on the echo signals
received from two steps of the reference block.
Two Gates used one each on the two echo signals
from the step reference block. Measurement of
reference velocity using Peak method of water
path measurement, by entering the precise step
difference measured mechanically. Then the
distance between initial pulse & 1st interface echo
is measured and in this method the echo amplitude
can be kept at any height on the screen.
Measurement of Probe Face-to-Face distance was
carried out in the Calibration tube by measurement
of water paths of Probe-1 and Probe-2 and
subtracting sum of the two water paths of Probe-1
and Probe-2 from the Calibration tube ID. Water
path measurement of Probe-1 and Probe-2 at each
location was carried out using Peak Measurement
mode with one gate on the First Interface (S-A
mode in the UT equipment) of the negative half-
wave rectification echo signal received from ID of
the tube.
Measurement of Internal Diameter was carried out
in horizontal condition in both 3-9 O’clock and
6-12 O’ Clock orientation in the Test Set Up for
2%, 4% and 5% diametrical creep tube samples
by both the methods. The ID at each location was
calculated by summation of Water paths of Probe
-1, Probe-2 and Probe Face to Face distance.
During calibration, the temperature of the water
should be measured. Similar exercise of calibration
is repeated (in exactly the same manner as in light
water) using virgin heavy water in a calibration tank
and data are to be tabulated in a similar format.
The accuracy level required for probe to probe face
distance measurements and ID measurements at
9 other locations shall be same as of light water
calibration.
For validation of technique for higher diameter
pressure tubes in the actual coolant channel,
experiments were also carried out using 2%,
4% & 5% creep ID standards and accuracy of
ID measurements were found to be approx.
±100 microns as described in Para 7.0(Results
& discussions). All calibrations are to be done
using full length signal cable and four drive tube
cables, which simulate the actual condition during
inspection. All the parameters of equipment
controls are to be recorded and used during actual
inspection for setting of Ultrasonic equipment.
RESULTS AND DISCUSSION:
This ID measurement technique has been
successfully used in various Pressurized Heavy Water
reactors (PHWRs). This has also been deployed
in both types of Indian PHWRs viz. 220 MWe &
540 MWe. Measurements were generally done at
3-9 O’clock orientation and also at 6-12 O’clock
orientation in a cross section with a close spacing
(100 mm) between two successive measurements
for ID in the hot region (where diameter increase
is expected to be higher) to find out the maximum

Technology Development Article
36 ISSUE NO. 336 JAN-FEB 2014
diameter in the channel. At other than the hot
region, axial spacing between two successive
locations is 200 mm. The difference in ID values
at 6-12 O’clock and 3-9 O’clock orientations at
same axial location was also observed and found
to be very less as can be seen from the graph (Fig
-4) given below. This ensures that de-centering
errors of Inspection head in the channel was also
negligible. This was also successfully carried out for
540 MWe PHWRs at TAPS 3&4 .Apart from that
at rolled joint region & liner tube region where
possibility of increase in diameter is very less, ISI
values are almost matching with installed data
within max. difference of ±50μm (microns). This
ensures the required accuracy obtained from our ID
measurement technique.
The two techniques (Flank and Peak) were
simultaneously employed in K-04 channel of KGS-1
and the data obtained by both the methods were
compared and plotted as graph (fig 5 & 6). The
RF waveforms for both types of UT signals were
captured and analyzed (fig 7). It has been observed
from RF waveform analysis that negative half wave
rectified peak method gives better accuracy than
full wave rectified flank method.
Flank Mode ID Measurement
Sr.
No.
Inspection Head
Type and No.
Diametrical Creep
(Tube Sample Size)
Maximum variation between
UT ID and Mechanical ID
( in mm)
1220 MWe
NDG-12-10
2%(84.15mm) +0.03 /-0.03
2 4%(85.80mm) +0.07/-0.03
3 5%(86.60mm) +0.08/-0.13
4540 MWe
BDG-12-06
2%(105.50mm) +0.01/-0.08
5 4%(107.60mm) +0.10/-0.07
6 5%(108.60mm) +0.11/-0.01
Peak Mode ID Measurement
Sr.
No
Inspection Head
Type and No.
Diametrical Creep
(Tube Sample Size)
Maximum variation between UT
ID and Mechanical ID
( in mm)
1220 MWe
NDG-12-10
2%(84.15mm) -0.03 /-0.05
2 4%(85.80mm) +0.04/-0.01
3 5%(86.60mm) +0.05/-0.04
4540 MWe
BDG-12-06
2%(105.50mm) -0.04/-0.07
5 4%(107.60mm) +0.08/+0.01
6 5%(108.60mm) +0.09/-0.11
Fig. 4: UT-ID for Channel H-07 KAPS-2

Technology Development Article
ISSUE NO. 336 JAN-FEB 2014 37
CONCLUSION:
ID measurement using our above mentioned
techniques for all PHWR’s (both 220 MWe and
540 MWe) was carried out successfully. From our
experiences it is observed that ID measurement of
Pressure Tube in in-situ condition is possible with
this probe arrangement and digital Ultrasonic
flaw detector. We also make the provision of
in-situ calibration with the help of calibration
probe and stepped reference reflector at fixed
distance for compensation of Ultrasonic velocity
in heavy water at the channel temperature. The
inspection head has been designed in such a way
that it can measure the ID of Pressure tube at any
circumferential and axial locations for monitoring
the growth of diameter due to high temperature
irradiation and creep with required accuracy. It also
helps in determining ovality of Pressure Tube. The
results obtained from different reactors are highly
encouraging and presently it is regularly used
during Pre-Service & In-Service inspection of any
220 MWe & 540 MWe PHWRs.
ACKNOWLEDGEMENTS:
The authors deeply acknowledge the guidance,
support and encouragement from Shri R.J.Patel,
Head, RTD, BARC & Chairman of the sub-committee
for evaluation of PT UT ID measurement technique
formed by Expert Group of Coolant Channel and
also from the other members of that subcommittee
for their timely help & prompt action for evaluation
of experimental data.
REFERENCES:
1. IAEA-TECDOC- 1037; Assessment and
management of aging of major Nuclear Power
Plant Components: Important to safety
2. CAN/CSA-N285.4-94; Periodic Inspection of
CANDU Nuclear Power Plant Components.
3. AERB Safety Guide: AERB/NPP/SG/O-2
Fig. 5: UT-ID for Channel K-4 KGS-1 (Flank Method)
Fig. 6: UT-ID for Channel K-4 KGS-1 (Peak Method)
Fig. 7: RF Waveform

News & Events
38 ISSUE NO. 336 JAN-FEB 2014
The National Symposium on Very High Energy
Gamma-Ray Astronomy was organized jointly by
the Astrophysical Sciences Division, BARC and the
Department of High Energy Physics, TIFR during
25-27 November, 2013 at the Training School
Hostel, BARC, Mumbai. About 90 delegates
from various national institutes and universities
participated. 12 invited talks on various aspects
of multi-wavelength observations were organized
during the morning sessions and 30 contributed
papers were presented in the afternoon sessions.
10 posters on various aspects of ground-based
gamma-ray astronomy were also displayed. On
the last day special sessions were organized to
discuss the status of the MACE and HAGAR
gamma-ray telescopes. A panel discussion was
also organized to discuss the need for Indian
participation in the Cherenkov Telescope Array
National Symposium on Very High Energy Gamma – Ray Astronomy (NSGRA-2013): a report
A group photograph of the participants of the NSGRA-2013
(CTA) project – a VHE observatory being set up by
an international collaboration of 170 institutes
from 27 countries. Prof. S. Ananthakrishnan,
Pune University, Prof. P. Sreekumar, Director, IIA,
Bengaluru, Prof. V.C. Sahni, BARC, Prof. P.R.
Vishwanath, Ex TIFR, Prof. B.S.Acharya, TIFR,
Dr. V. Chitnis, TIFR, Shri. Y.S. Mayya, BARC, Shri
R. Koul, BARC, Dr. R.C. Rannot, BARC, Dr. A.K.
Mitra, BARC, Dr. A.K. Tickoo, BARC and many
other delegates participated in the discussions. It
was the considered opinion of the delegates that
participation in the CTA project would be beneficial
to the astronomy and astrophysics community of
the country. It was suggested that the details of
possible in-kind contribution to the CTA be
worked out and a project report be submitted
to DAE for funding. The symposium was funded
by BRNS and TIFR.

News & Events
ISSUE NO. 336 JAN-FEB 2014 39
A Conference on Neutron Scattering was held at the
Indian Institute of Science and Education Research
(IISER), Pune, during February 10 - 12, 2014. It
was sponsored by the Board of Research in Nuclear
Sciences. The conference was jointly organized
by BARC and IISER Pune in association with the
Neutron Scattering Society of India (NSSI). The
conference was inaugurated by Prof. S.L. Chaplot,
Director, Physics Group, BARC. Prof. H. Schober,
Associate Director - Science Division, Institut
Laue-Langevin, France, was the Chief Guest at the
inaugural function. Prof. K.N. Ganesh, Director,
IISER, Pune and Prof. R. Mukhopadhyay, Head,
Solid State Physics Division, BARC also addressed
the audience during the inaugural function.
There were more than 125 participants including
9 invited speakers from abroad. There were 31
invited talks and about 100 poster presentations.
The conference covered important aspects of
neutron scattering including facilities, science and
applications. Particular emphasis was given to
the application of neutron scattering in strongly
Report of Conference on Neutron Scattering (CNS-2014)
A group photograph of participants of CNS-2014 at IISER, Pune.
correlated electron systems, functional materials,
soft matter and biological systems, thin films and
multilayers, and nanomaterials.
Researchers from various universities and national
institutions regularly utilize the National Facility
for Neutron Beam Research at Dhruva reactor,
BARC. The conference provided useful scientific
discussions and a platform for collaborations
among the national and international neutron
scattering researchers. Four best posters were
awarded by the NSSI.
A Pre-Conference Neutron School on “Neutron as
Probes of Condensed Matter” (XVI in the series)
was organized prior to CNS-2014 jointly by BARC
and UGC-DAE-CSR during February 4 - 8, 2014.
The course comprised theory lectures and hands-
on experiments at Dhruva reactor. Apart from the
faculty of BARC and UGC-DAE CSR, some of the
foreign invited speakers to the conference delivered
lectures in the School.

News & Events
40 ISSUE NO. 336 JAN-FEB 2014
The National Symposium on Nuclear Instrumentation
(NSNI-2013) was held at the Multi-purpose Hall,
Training School Hostel, AnushaktiNagar, Mumbai
during November 19-21, 2013. The Conference was
organized by Electronics & Instrumentation Group,
BARC under the aegis of BRNS. The DAE-BRNS
symposium covered application areas of Nuclear
Instrumentation for Reactors, Accelerators, Physics
Experiments, Health and Environment Monitoring
Systems. Topics covered in the symposium included
radiation detectors, front-end electronics, RF
electronics, Smart instruments, High density /
high performance systems, Instrumentation bus
and communication standards and Software
technologies.
This symposium was organized to provide a forum for
scientists and engineers to present their work and share
their knowledge and ideas with other participants in
the field. The Conference was attended by more than
300 participants from AMD, BARC, IGCAR, IUAC, IPR-
ITER, NPCIL, RRCAT, TIFR, UCIL, VECC and HBNI as well
as from academic institutions.
Report on National Symposium on Nuclear Instrumentation – 2013 (NSNI-2013)
Photograph of the proceedings of NSNI-2013 being released by Dr. Srikumar Banerjee, the Chief Guest
Dr. Srikumar Banerjee, Prof. Homi Bhabha Chair
and Former Secretary, DAE & Chairman AEC
presided over the inaugural function. Dr. T.S.
Ananthakrishnan Head, Electronics Division and
Chairman, Organizing Committee welcomed the
invitees and delegates of NSNI-2013. Shri C.K.
Pithawa Director E&I Group and Chairman National
Advisory Committee presented an overview of
NSNI-2013. Shri G.P. Srivastava, OSD and Former
Director E&I Group delivered the keynote address.
Chief Guest Dr. S. Banerjee delivered the inaugural
address and formally released the Symposium
Proceedings. Anita Behere Convener, Organizing
Committee proposed the vote of thanks.
Contributions were received in the form of 128
poster papers which were presented in five sessions.
The posters for all the contributory papers were
prepared by the authors in a uniform template
provided by organizers and were printed by the
organizers. They were put on display and were
presented by the authors. There was a collective
preview presentation for each poster session where
each poster was introduced to the
audience through a summary slide
that illustrated the paper.
The main highlight of the
symposium was the invited talks
(21) on topics related to application
areas of Nuclear Instrumentation.
Speakers from BARC, IGCAR, NPCIL,
RRCAT, IIT (B) and IIT Roorkee were
invited to deliver the talks. Notable
speakers from abroad include
Dr. Shekhar Mishra, from Fermi Labs
and Dr. Andrea Venturi from CERN.
Proceedings of the symposium were
brought out in the form of CDs.

News & Events
ISSUE NO. 336 JAN-FEB 2014 41
A fourth station –– called RE4 (Resistive Plate
Chambers for the Fourth End-Cap)–– will be added
to the CMS endcap muon system during the
ongoing LHC Long Shutdown (LS1 – 2013-2014).
The CMS muon system consists of three different
sub-detectors: RPCs (Resistive Plate Chambers), DT
(Drift Tubes)and CSC (Cathode Strip Chambers). The
endcap region is made of CSCs and RPCs in the first
three disks and RPCs will be installed in the fourth
disk as part of the RE4 project. The construction of
the RE4 is an international project carried out by
teams from institutes in Belgium, Bulgaria, China,
Colombia, Finland, Georgia, India, Italy, Korea,
Mexico and Pakistan as well as from CERN.
CERN plays an important role in the chamber
construction and testing at the RPC laboratory
located in building 904 at Prevessin where many
physicists, engineers, technicians and students
Resistive Plate Chambers installed for the new layer added to CMS muon system at CERN
from around the world are working together,
alongwith the assembly sites in Belgium (University
of Ghent) and India (NPD-BARC). RE4 consists of
72 super-modules, each of which is made by two
RPCs (Fig. 1), for a total of 144 double-gap RPCs.
Nineteen institutions involved with the RPCs cover
all the tasks and have been working very hard
since the beginning of 2012, in order to complete
the project by the end of 2014. These tasks are
distributed among the following countries: Korea
is responsible for the construction of 660 gas
gaps and 10 chambers. Pakistan, Italy and Finland
are working on the front-end electronics, DAQ
and power system while India (NPD-BARC) is
building and characterizing 50 RPCs, apart from
fabricating 200 cooling sets (MD&PDD-BARC) for
the entire collaboration. Bulgaria, Mexico and
Georgia are responsible for super-module assembly
and testing. India, Italy and Pakistan are building
Fig. 1 : The Super Module Assembly

News & Events
42 ISSUE NO. 336 JAN-FEB 2014
the chamber services (gas, cooling and
cabling). China provides the readout strips,
mechanical frame boxes and participates
in the chamber construction and testing at
CERN. A large international team will work
on the installation and commissioning of
the full system. So far, the three assembly
sites have produced 72 RPC detectors,
corresponding to 36 super-modules; these
were installed earlier in December 2013
(Fig. 2 – positive side of endcap). The
production for the second endcap disk
(negative side) started in September 2013
and is almost getting completed. The
installation and commissioning of the same
is scheduled during middle of 2014.
Fig. 2 : The recently installed, positive side of the RE4, 100 metres below the ground, at Point 5 (CMS at the LHC facility) in Cessy, France is approximately 15 metres in diameter, weighing close to 5 tons

News & Events
ISSUE NO. 336 JAN-FEB 2014 43
The Nineteenth National Symposium & Workshop
on Thermal Analysis (THERMANS-2013) was held at
TSH & HBNI, BARC during December 19-23, 2013.
There was overwhelming response to the
symposium and workshop. In all there were 240
registered participants from academic and research
institutions with a significant percentage of
students and research scholar participants.
The symposium was inaugurated by Dr. K.L.
Ramakumar Director, Radiochemistry & Isotope
Group, BARC. Dr. B.N. Jagatap, Director Chemistry
Group was Guest of Honour for the inaugural
function. Dr D. Das, President, Indian Thermal
Analysis Society (ITAS) cited the active role played
by thermal analysis techniques in characterization
of materials for specific purposes.
Dr. S.C. Parida, Secretary, ITAS, announced
the awards instituted by the Indian Thermal
The Nineteenth National Symposium & Workshop on Thermal Analysis (THERMANS-2013)
Inaugural function of THERMANS 2013. From right to left: Dr. K.L. Ramakumar (Director, Radiochemistry and Isotope Group, BARC), Dr. Shyamala Bharadwaj (Convener, THERMANS 2013), Dr. B.N. Jagatap (Director, Chemistry Group, BARC), Dr. D. Das (President, ITAS) and Dr. Y. K. Bhardwaj (Secretary, THERMANS 2013)
Analysis Society. The awards were presented by
Dr. K.L. Ramakumar, Dr. B.N. Jagatap, Dr. D. Das
and the sponsors of the awards. SETARAM-ITAS
Calorimetry Excellence Award was conferred
on Dr. V. Venugopal. NETZSCH-ITAS Award
2013 for her outstanding contributions to field
of thermal analysis was conferred on Dr. (Mrs.) Bina
N. Wani, of Chemistry Division BARC, Mumbai.
The TA Instruments-ITAS Young Scientist Award
2013was conferred on Shri Bhaskar Paul of
Materials Processing Division, BARC. Dr. M.D.
Karkhanavala Memorial Essay Contest 2013 was
won by Shri Subhasis Pati, JRF, BARC. Dr. Gurdip
Singh Award for Best Thesis in Thermal Analysis
2013 was given to Dr. Puja Paul of Jadavpur
University, Kolkata.
There were 08 technical sessions, 01 instrumentation
session and 13 invited lectures. More than 120
research papers were presented at the symposium
in both oral and poster sessions.

BARC Scientists Honoured
44 ISSUE NO. 336 JAN-FEB 2014
BARC Scientists Honoured
Name of the Scientist : Pitamber Singh, IADD
Name of the Award : Fellowship Award under Physics category
Instituted by : International Academy of Physical Sciences(IAPS)
Name of the Event : Academy conference on “Science and Technology for sustainable
development” held at Indian Institute for Information Technology, Design
and Manufacturing (IIITDM) Jabalpur, 20th March, 2014
Name of the Scientists : Pramod Bhatt and S.M. Yusuf, SSPD
Name of Award : Best Poster Award
Title of the Paper : Neutron diffraction and reverse Monte Carlo simulation study of
M1.5[Cr(CN)6]•zH2O (M= Fe,Co,Ni) Prussian blue analogues molecular
magnets
Presented at : 7th India-Singapore Symposium on Experimental Condensed Matter
Physics (2014) held at Mumbai, 24-26 February 2014.
Name of the Scientist : A.K. Tyagi, Chemistry Division
Name of the Award : MRSI-ICSC Superconductivity and Materials Science Senior Award (2014)
Instituted by : Materials Research Society of India at the Conference held at Bengaluru,
Feb. 12-14, 2014
Name of the Scientist : K. Dasgupta, REDS, Materials Group
Name of the Award : Best Presentation Award
Title of the Paper : Development of rare-earth based magnetic alloy powders by reduction-
diffusion method
Presented At : International Conference on Magnetic Materials and Applications
(MagMa 2013), Guwahati, Dec.5-7, 2013.
Name of the Scientists : Sangeeta Deokattey, K. Bhanumurthy and P.K. Wattal
Affiliation : SIRD and NRG
Title of the Award : Progress in Nuclear Energy Best Paper Award 2013
Instituted by : The Editors of the Journal
Title of the Paper : High Level Waste Management in Asia : R&D Perspectives, Vol. 62, Jan
2013, pp. 37-45.