Embed Size (px)
Citation preview
In the Shadow of Banks: Wealth Management Products and Issuing Banks’ Risk in China*
Viral V. Acharya Jun “QJ” Qian New York University, and Fanhai International School of Finance Reserve Bank of India Fudan University [email protected] [email protected] Yang Su Zhishu Yang Booth School of Business School of Economics and Management University of Chicago Tsinghua University [email protected] [email protected]
This Draft: June 28, 2019
Abstract
Chinese banks issue wealth management products (WMPs) to circumvent regulations for on-balance sheet activities, attract funding, and increase profits. To support the government’s stimulus plan in response to the global financial crisis, the “Big Four” state-owned banks substantially increased their loan supply and grew more aggressive in the deposit markets. Small- and medium-sized banks more exposed to competition from the Big Four banks, especially the fastest expanding large bank, issued more WMPs after 2008. The growth of WMPs imposes rollover risks for the issuers, as reflected by higher yields on new WMPs and banks’ behavior in the interbank market.
JEL Classifications: G2, E4, L2.
Keywords: Shadow banking, Wealth Management Product, regulatory arbitrage, loan-to-deposit ratio, rollover risk.
* We appreciate helpful comments from Zhuo Chen, Kinda Hachem, Zhiguo He, Nirupama Kulkarni, Robert Marquez, Yiming Qian, Hong Ru, Tianyue Ruan, Vineet Srivastava, Hao Wang, Hao Zhou, and seminar/session participants at the Central University of Finance & Economics, Fudan University, Korea University, NYU Stern, Shanghai Univ. of Finance & Economics, Tsinghua PBC School, University of Nottingham, Ningbo, Asian Econometric Meetings (Hong Kong), China International Conference in Finance (Xiamen), China Financial Research Conference, NBER China Working Group Meeting (Cambridge, MA), Princeton China Conference, Summer Institute of Finance, and the Western Finance Association meetings (Whistler, Canada). We gratefully acknowledge research assistance from Vanya Petrova, Yang Zhao, and financial support from Fudan University, NYU, and Tsinghua University; Yang also acknowledges financial support from National Science Foundation of China (Project number 71272024). The views presented in the paper are those of the authors, and do not represent those of the Reserve Bank of India. The authors are responsible for all remaining errors.
1
I. Introduction
Since the 2007/08 financial crisis, an extensive strand of literature studies how a shadow
banking sector arises in the financial system as a result of regulatory arbitrage by financial
institutions.1 Much of this literature focuses on developed economies, with little research
studying shadow banking in emerging markets, including what many believe to be a large
sector in China.2 Facing tight regulations for on-balance sheet activities, Chinese banks issue
wealth management products (WMPs)—off-balance sheet investment products and possible
substitutes for deposits, to circumvent regulations and increase profits. Interest rates on WMPs
are much less regulated than deposit rates, and the funds raised from selling these products are
invested in projects without affecting on-balance sheet assets. The size of this segment began
to take off at the end of 2011 (Figure 1), and this rapid growth continues to the present day.
What triggered the rise of WMPs in China? What types of risks do these products impose
on the issuing banks and the overall financial system? Are the regulators and investors aware
of these risks? We address these questions in this paper. In particular, we link the growth of
this sector to the RMB 4 trillion stimulus plan initiated by the Chinese government in response
to the global financial crisis in 2007/08, and examine how the stimulus, along with bank
competition, affects bank behavior both on- and off-balance sheets. Our results extend the
literature by showing that the rapid growth of China’s shadow banking seems to have been
triggered by the stimulus and the associated credit boom, and that it has contributed to the
greater fragility of the financial system.
We first show that, consistent with regulatory arbitrage, banks facing a shortfall in deposits
issue more WMPs to attract funding, and banks issue more WMPs when the gap between the
regulated deposit rates and the market lending rates is greater. We next show that competition
for deposits among banks intensified following the massive stimulus plan in 2008. To support
and implement the stimulus, the largest four state-owned banks (“Big Four” banks) issued a
large volume of new loans into the economy.3 Banks face on-balance-sheet lending restrictions,
including a limit on the loan-to-deposit ratio (LDR)—loans cannot exceed 75% of total
deposits. As a result, the Big Four banks competed more aggressively for deposits to stay below
1 See, e.g., Acharya and Oncu (2013), for a review of this literature. 2 The Financial Times estimates that the scale of China’s shadow banking, in terms of lending, is half that of total bank lending, and that China’s shadow banking system provided much of the leveraged capital that eventually went into the stock market (FT 06/25/2015, article by Gabriel Wildau). 3 The “Big Four” banks refer to the Industrial and Commercial Bank of China (ICBC), China Construction Bank (CCB), Bank of China (BOC), and Agricultural Bank of China (ABC).
2
the LDR limit. The differing extent of balance sheet expansion across these four banks and the
resulting increase in competition created a plausibly exogenous shock in the local deposit
market to small and medium-sized banks (SMBs). We find that SMBs that are more exposed
to the competition from the Big Four banks, especially the most aggressively expanding big
bank, had higher LDRs, and issued more WMPs after 2008. These SMBs also established fewer
branches in cities with more competition from the Big Four banks.
Issuer banks take on substantial rollover risks: when a large amount of WMPs mature,
SMBs offer significantly higher yields on the new WMPs, while the Big Four banks and the
next ten large banks are willing to borrow at higher interest rates in the interbank market, in
order to raise sufficient funds to meet redemption. As the total amount of WMPs rises sharply,
the aggregate risk also increases as banks need to roll over greater amounts. When the cost of
interbank funds unexpectedly rises, stock prices drop more for banks with more WMPs
maturing, indicating that the market is concerned with the extent of banks’ rollover risks.
Our dataset covers all WMPs issued by the largest 25 banks in China for 2008-2014, with
matched data on the issuing banks. We separate the banks into two categories: the Big Four
banks and the remaining 21 banks. The Big Four banks are among the largest financial
institutions in the world, and are under direct control of the central government. They had
extensive networks of branches before many other banks were established. They are also
predominant players in China’s financial system, including the interbank markets. The
remaining 21 banks in our sample are much smaller, and many of these SMBs concentrate their
business in certain regions.
During our sample period, China’s central bank—the People’s Bank of China (PBC)—set
ceilings on bank deposit rates, which changed over time, but were almost always below the
market rates (Shanghai Inter-bank Offered Rate, or SHIBOR). In addition to capital ratio
regulations, banks must comply with the LDR requirement as discussed above. They in turn
pursue less regulated, off-balance-sheet activities, most notably in the form of WMPs. By
offering higher rates than regulated deposit rates, WMPs help banks attract more savings,
including from bank depositors. Moreover, principal-floating products can move loan assets
off the balance sheet.
Hence, the issuance of WMPs ought to be greater when the LDR rises, especially when
the market lending rate rises considerably above the regulated deposit rate. For example, as the
gap between SHIBOR and the deposit ceiling widens to 2%, the WMP issuance as a percentage
of the bank’s equity increases by 43% within a single quarter, with one standard deviation
3
increase (7.6%) in the LDR.
Next, we study how the stimulus and bank competition led to the liftoff of WMPs,
especially those issued by the SMBs. The Chinese economy was booming before the stimulus
plan was announced in 2008. Thus, the government initiated the stimulus due to external
pressure—in particular, the expeditious drop in exports resulted from weakened demand in
developed economies, and not due to internal economic problems, including conditions in the
banking system. The stimulus was implemented mostly through the Big Four banks’ large
volume of new loans to various sectors of the economy during 2009-2010. Consequently, these
banks also raised deposits to fulfill the LDR requirement and stay below the 75% limit.
Interestingly, the extent of support for the stimulus differed across the four banks, with
Bank of China (BOC) becoming the most aggressive big bank in expanding both new loans
and new deposits. While all four banks have branches throughout the country, the concentration
of their branches differs by region. Therefore, the SMBs, with their business concentrated in
regions with more intensive branching of Big Four banks, especially BOC branches, would
face more competition in attracting and securing deposits following the stimulus. With
information on branch openings and closings of all the banks at the city level (including those
not in our WMP sample), we construct four sets of bank-level competition metrics, measuring
each of the twenty-one SMBs’ geographical exposure to branch competition, in all regions of
the country, from the Big Four banks. These competition measures are relatively steady
overtime (hence bank fixed effects are not included in regressions), while the differential pace
of expansion in support of the stimulus created an exogenous shock to local SMBs facing
different degrees of competition from the big banks. Our identification strategy is thus to track
the issuance of WMPs by SMBs confronting various degrees of competition from the Big Four
banks, and we expect the BOC competition measures to have a positive and significant impact
on SMBs’ issuance of WMPs following the stimulus plan.4
Consistent with our hypothesis, we find that both the LDR and the amount of WMP
issuance were greater for SMBs with more exposure to regional competition from the local
branches of the BOC, and the effects of BOC on SMBs became significant only after the
implementation of the stimulus. During 2011-2012, for example, a one-standard deviation
increase in the geographic exposure to the BOC leads to an increase of an SMB’s LDR by 0.48
4 Acharya and Kulkarni (2018) use a similar variation in competition from state-owned banks to document crowding out of private sector banks by state-owned banks in India.
4
standard deviation (or 3.1%), and an increase in its WMP issuance over equity by 0.22 standard
deviation (or by 39.2% over equity). By contrast, the impact of the other three big banks—
which increased the scale of their lending and deposits at slower paces than the BOC—on
SMBs’ LDRs and WMP issuance is much weaker.
Our analysis of WMP issuance is performed at the bank level, while a bank’s issuance
decisions might be driven by certain factors (e.g., investment opportunities) that correlate with
the degree of its BOC exposure after the stimulus. To rule out this alternative hypothesis, we
explore within-bank variations, and find that the same bank chose to establish fewer branches
in cities with more presence of BOC branches, and this pattern only holds for the post-stimulus
period. This result reinforces that deposit competition at the branch level is the force that
prompted SMBs to issue more WMPs.
The Big Four banks’ issuance of WMPs also rose during the second half of the sample
period. We can interpret this as their response to the WMP issuance by SMBs. We also
hypothesize that Big Four banks issue WMPs to refinance the long-term projects originally
funded by the stimulus credit. A large fraction of the stimulus credit went to real estate and
infrastructure projects, leading to rising leverage and risks in these sectors. The PBC began
tightening the bank credit supply to these sectors in 2010. Facing restrictions on extending new
loans and to help avoid defaults in these long-term projects, many owned by local governments,
the Big Four banks issued WMPs, especially principal-floating products, to refinance these
projects and rolled over old loans. Consistent with our hypothesis, we find a positive
relationship between the estimated (abnormal) loan increase due to the stimulus and the WMP
balance in later years (when earlier loans matured) for the Big Four banks.
In our final set of tests, we analyze the rollover risk of WMPs for the issuing banks. When
WMPs mature, investors often put the funds they redeem back in their deposit accounts (for a
short period) with the issuing bank, which helps the bank to temporarily boost deposit levels
and lower its LDR. WMPs typically mature in three months or less, and many products mature
immediately before the end of a quarter, when banks’ LDRs are calculated and monitored by
the China Banking Regulatory Commission (CBRC). Some investment projects financed by
WMPs, such as those in real estate and infrastructure, however, pay off in much longer
horizons. Thus, banks may need to issue new WMPs to meet the redemption of mature products
and to refinance assets.
When there are more WMPs due in a quarter, SMBs offer significantly higher yields on
the new products. WMPs also affect banks’ behavior in the interbank market. The ask quotes
5
show that the Big Four banks and the next ten large banks are willing to borrow at higher
interest rates when they have more WMPs due for redemption. At the aggregate level, the one-
week SHIBOR rises during the second half of the sample period, closely tracking the aggregate
amount of maturing WMPs issued by the Big Four banks. This result also indicates that the
rollover risk grows with the total amount of outstanding WMPs, as the amount to rollover also
increases. We also look at the stock market response during episodes of ‘credit crunch,’ when
the cost of interbank funds unexpectedly rises. Stock prices drop more for banks with more
WMPs maturing in the short-run, indicating that investors and the market are concerned about
the extent of banks’ rollover risks.
Our study contributes to and extends the literature on the formation and risk of shadow
banking. There are at least two important differences between the U.S. shadow banking sector
and its counterpart in China. First, the process of moving debt obligations from institutions’
balance sheets and packing and re-packaging them into structured products makes these
products complicated and opaque in the U.S. By contrast, most WMPs offered by Chinese
banks during our sample period are simple, short-term fixed income products.5 Second, after
institutions sell the loans and other (unpackaged) debt to the underwriters, there remains some
connection between the structured products and the originating institutions in the U.S. The
WMPs and their issuing banks in China, in terms of the on- and off-balance sheet activities and
banks’ overall risks, however, are all closely tied, as our results show. The growth of WMPs
in China more closely resembles the growth of the money market in the U.S. due to Regulation
Q, and, more recently, the growth and collapse in the issuance of asset-backed commercial
paper market due to regulatory arbitrage (Acharya, Schnabl, and Suarez, 2013).
There are a few recent studies on China’s shadow banking sector. Dang, Wang, and Yao
(2014) provide a theoretical model to explain the differences between the U.S. and Chinese
shadow banking. Allen, Qian, Tu, and Yu (2018) and Chen, Ren, and Zha (2018) study another
large component of the shadow banking sector—entrusted loans, which non-bank financial
institutions and firms offer. Hachem and Song (2015) provide a theoretical analysis of the
interactions between large and small banks in both the on- and off-balance sheet markets and
demonstrate how a shadow banking sector with off-balance sheet products can arise from bank
5 Some of the funds raised from selling WMPs do go into risky and speculative areas, mostly through trust companies such as leveraged trading in the stock market, but banks often retain the most senior tranches.
6
competition.6 Unlike these studies, we use a large set of product-level data to examine the
relationship between WMP issuance and issuing bank characteristics. Our empirical strategy—
tracking how SMBs respond to competition from the Big Four banks expanding their lending
and deposits at different paces—allows us to establish a direct link between the implementation
of the stimulus along with bank competition, and the growth of shadow banking. Our results
also indicate that the swift rise of WMPs increased the banking system’s fragility.
In Section II, we describe China’s banking sector and the regulatory framework. In Section
III, we present our sample of WMPs and their issuing banks, assess the effects of the capital
ratio and LDR on WMP issuance, and link the rise of WMPs to the 4-trillion stimulus plan and
bank competition. In Section IV, we study the rollover risk of WMPs. We conclude in Section
V. The appendix contains the explanations of the variables.
II. Institutional Background, Banking Regulation, and Shadow Banking
There are four categories of banks in China. The first category is the aforementioned Big
Four banks, including the ABC, BOC, CCB, and ICBC. They are listed in both the domestic
A-share market and the stock market in Hong Kong, with the central government as the
controlling shareholder. The State Council, the highest branch of the government, directly
appoints presidents of these banks. 7 These banks are the dominant players in China’s
commercial loan, deposit, and interbank markets. As market-oriented institutions, they also
carry out certain policy goals—typically through lending, as all state-owned enterprises do.
The second category is state-owned policy banks, whose goal is to carry out certain government
policies through lending. This category includes the China Export-Import Bank, China
Development Bank, and the Agricultural Development Bank of China.
The third category is joint-equity commercial banks (there were 12 of these as of 2017).
The average size of these banks is about 10% of that of the Big Four banks. They are also
market oriented, with most being publicly listed companies. The fourth category is urban and
rural commercial banks, which are typically founded and majority-owned by provincial or city
governments. They are typically much smaller than joint-equity commercial banks. Unlike the
other three types of banks, they concentrate their business in a limited number of cities.
6 In a setting resembling the US financial markets, Hanson, Shleifer, Stein and Vishny (2015) show that while traditional banks and “shadow banks” (e.g., intermediaries involving money market funds) both create safe, “money-like” claims, they differ in their investment portfolios of assets to support these claims. 7 The Bank of Communications is the fifth largest bank in China. However, its size is still much smaller than that of the Big Four banks, and we thus classify it as an SMB in the tests.
7
The PBC and CBRC supervise and monitor commercial banks. Standard regulations such
as capital ratio requirements, in conjunction with the Basel III Accords, are in place. Banks’
reserve ratios have been high—21.5% in June 2011 and 17.5% for big banks at the end of
2015—in part to help sterilize the large amount of foreign currency reserves accumulated over
the previous years.8
China tightly regulated interest rates. As part of its macroeconomic policy tools, the PBC
set base interest rates along with upper and lower bounds that fluctuated over business cycles.
Both the upper and lower bounds on lending rates and the lower bound on deposit rates were
not binding most of the time, and were liberalized gradually. The upper bound on deposit rates,
however, was usually binding and not lifted until 2015. These interest rate policies were also
part of China’s investment-driven growth model—transferring capital from savers/depositors
to borrowers such as large industrial enterprises (e.g., Song, Storesletten, and Zilibotti, 2011).
The gap between the regulated deposit rate and market lending rate gives banks an
incentive to engage in excessive lending. In response, the CBRC monitors and sets limits on
total bank lending through tools including capital ratio requirements and the LDR. The limit
on the LDR prohibits banks from lending more than 75% of their total deposits, and this upper
bound on lending was binding during our sample period, especially for SMBs.9
These regulations give rise to the shadow banking sector in China. First, to fulfill capital
ratio requirements, banks can raise capital by issuing new equity and bonds. They can also
conduct off-balance sheet investments, which do not increase on-balance sheet assets. Second,
to ensure that the LDR stays below the 75% threshold, banks can attract more deposits and/or
cut on-balance sheet lending. WMPs can help banks satisfy both requirements and increase
profits. On the asset side, banks often invest the funds raised from WMPs in loan assets
originated by themselves and/or packaged by other financial institutions. Hence, loans are
supplied without increasing on-balance sheet assets. On the liability side, WMPs are “deposit-
like” products banks sell to investors. There was no default on WMPs issued by our sample
banks during the sample period, and investors regard these products as similar to deposits. As
interest rates on these products are not regulated, WMPs can help banks attract funds. The
principal of WMPs can be either guaranteed or floating. Principal-guaranteed WMPs are often
8 For a comprehensive description of the banking sector and its relationship with other parts of the financial system and overall economy, see Allen, Qian, Zhang, and Zhao (2012) and Qian, Strahan, and Yang (2015). 9 The restrictions on deposit rates as well as the LDR were lifted at the end of 2015. However, Chinese banks still face high reserve ratios and their lending remains capped by the PBC through “window guidance.” Hence, banks’ incentives for shadow banking activities, including the issuance of WMPs, remain.
8
included on the balance sheet as deposits, as the CBRC requires. Principal-floating WMPs are
treated as off-balance sheet liabilities, but the structure of their maturities can be chosen to
boost the banks’ deposit balance when LDR is calculated.
A broad definition of “shadow banking” refers to all investment products in the market
that are not on the banks’ balance sheets, including loans issued by non-bank financial
institutions and non-financial firms (entrusted loans). A popular product is Yu’e’Bao, offered
by Alibaba along with a money market fund. Another important component of China’s shadow
banking sector is the loans offered by trust companies (e.g., Allen, Gu, Qian, and Qian, 2018).10
With the rise of shadow banking, there is a dual-track system of intermediation in China’s
financial system (e.g., Wang et al., 2015). While interest rates on deposits are capped and on-
balance sheet lending is regulated by the capital ratio and LDR, the shadow banking sector,
including banks’ off-balance sheet activities, is not subject to on-balance sheet requirements.
However, regulators (PBC and CBRC) are aware of both the scale and nature of WMPs issued
by banks, and a cat and mouse game between the CBRC and banks has been evolving along
with the expansion of the shadow banking sector.
Early waves of WMPs were issued through coordination between banks and trust
companies. In July 2009, the CBRC prohibited banks from investing funds raised from WMPs
in their own (loan) assets. Banks sidestepped this policy by selling their loan assets to trust
companies to form a trust plan, while asking other banks to issue WMPs and invest the proceeds
into the plan. In August 2010, the CBRC further stipulated that trust companies cannot invest
more than 30% of all proceeds from bank-trust WMPs in loan assets. Banks circumvented the
new policy by inviting investment banks to the circle: trust companies first extend loans to
borrowers and packaged the loan assets into a trust plan; banks then issue WMPs and delegate
the management of the funds to investment banks. Through contractual agreements, the banks
require the investment banks to invest the WMP proceeds in the trust plan.
In March 2013, the CBRC announced yet another new policy: total WMP investment in
non-standard financial assets cannot exceed 35% of all WMPs or 4% of bank assets. Non-
standard financial assets include not only trust assets, but also all financial products not traded
on the interbank or securities markets. To circumvent this policy, banks needed to find certain
types of standard financial assets to facilitate lending to firms/projects and pay riskless returns
10 Offered by Alipay (the payment arm of Alibaba) and Tianhong Fund Management Co., Yu’e’Bao grew very quickly, with its net assets growing from RMB 200 million in May 2013 to over RMB 700 billion in April 2015. For more information, including its promised returns, see https://bao.alipay.com/yeb/index.htm.
9
above the deposit rates to WMP investors. Accordingly, banks and trust companies developed
a new business model involving even more steps and participants.11
Figure 2 shows the WMP balances sorted by the four main investment categories
according to information disclosed in the WMP prospectus, starting from December 2011. The
balance of WMPs funding loan assets peaked in March 2013, when the CBRC implemented
the new policy regarding non-standard assets, and has since stayed at a high level. WMPs
targeting deposits increased sharply at the end of 2014, possibly when banks developed the
new business model with multiple participants and steps as discussed above. WMPs going to
the money market also increased over time, as banks can lend the WMP’s proceeds to other
banks, which can then purchase non-standard financial assets like trust plans. CBRC
regulations never fully achieved their intended goals because financial institutions can devise
new products with contractual agreements involving more parties to transfer funds.
There are at least two types of risks involved in the shadow banking sector. The first is the
rollover risk of WMP issuing banks. Some of the assets financed by WMPs pay off in the
medium to long-term, but many investors prefer liquid assets, as do the other participating
banks and institutions. The issuing banks prefer short maturities because they can transfer the
WMP’s funds at maturity to the deposit accounts (even for only a few days), which can help
lower their LDRs. This maturity mismatch leads to rollover risk. Large banks can tap into the
inter-bank market for liquidity needs, and all banks can issue new WMPs to refinance long-
term loans and meet the redemption of mature WMPs. However, during credit crunches, as was
the situation in June 2013, banks with large amounts of WMPs due would face tremendous
pressure. The second type of risk is “contagion risk,” in which the rollover risk of an individual
bank can spread to other banks and possibly the entire banking system, because the multiple
channels of WMPs link various types of financial institutions and firms and the fast-growing
interbank market also makes financial institutions more interconnected than before.
III. Data and Determinants of WMP Issuance
11 For example, Bank A places WMP funds with Bank B in the form of “contracted (interbank) deposits”—a form of standard asset. Bank B then invests its own funds (not the WMP funds) or delegates an investment bank to invest its own funds in certain trust plans packaged by trust companies. The contracted deposits are then pledged as guarantees for the trust plans, and in return, can be swapped with the returns on the trust plans. Through this scheme, Bank A invests the WMP funds in standard assets (interbank deposits); Bank B uses its own funds to invest in non-standard financial assets, and increases its deposit balance (with the interbank deposits) with no increase in its loan balance; WMP investors receive a risk-free (guaranteed by Bank A) return above the deposit rate (from the trust plans); and the borrower receives funding.
10
We focus on the 25 largest banks in China, including the Big Four banks, the 13 (national)
joint-equity commercial banks (including the Bank of Communications), and the 8 largest
urban commercial banks (Table 1, Panel B). We consider the 21 non-Big Four banks as SMBs.
Our data come from multiple sources. First, we collect bank financial and WMP information
from public datasets and surveys. Listed banks and banks that issued publicly traded bonds
disclose their financial information (on a semi-annual or quarterly basis). For the remaining
unlisted banks, we conduct a survey of each bank to inquire about their financial information.
We also gather reports from the CBRC and PBC. The final data set obtained from public
sources and surveys covers the period of 2008-2014, and includes bank equity, total loan and
deposit balances, the capital ratio, LDR, and aggregate WMP quantity information for each
bank in each quarter.
Second, bank branch information is available from the CBRC. Each individual branch of
all financial institutions requires a license from the CBRC to open and operate. Starting from
November 2007, CBRC has been publishing information on bank branch licenses, including
the opening date, the closing date (if applicable), operation location, and affiliation of each
branch. Third, we collect individual WMP information from WIND, which covers a large
fraction of bank WMPs. We collect yield and maturity information for all WMPs issued by the
25 banks, including those available from WIND, during the sample period. Finally, we
download the SHIBOR quotes and each bank’s submitted quotes from the SHIBOR web site.
III.1 Summary Statistics
Table 1 reports the summary statistics of bank and WMP characteristics (see Appendix A
for definitions of all variables). The Big Four banks are typically 10 times the size of SMBs in
terms of equity, total deposit balance, and total loan balance (Panel A). These two groups of
banks have similar capital ratios.12 The average LDR of SMBs is higher than that of the Big
Four banks. During our sample period, 75 of the 700 bank-quarter observations have bank
LDRs exceeding the 75% upper bound, and only one such observation belongs to a Big Four
bank. When the LDR exceeds 75%, a bank will receive a warning from the CBRC, and it must
lower the LDR to below 75% or face fines and suspensions of normal activities.
12 According to the Basel Accord, banks’ capital ratios cannot be lower than 8%. Most banks in the sample fulfill this requirement, except for the ABC, which had lower capital ratios before 2009, reached the required level in 2009 Q4 after receiving a capital injection. Starting from 2013, a new approach to calculate the capital ratio was adopted, but the previous approach is still in use. For consistency, we use the capital ratio calculated with the previous approach. The results using the updated capital ratios stay largely the same.
11
All Big Four banks participate in the SHIBOR bid and ask processes, but only ten SMBs
submit quotes. We calculate each bank’s SHIBOR quoted rates minus the SHIBOR for different
maturities, but report only the overnight rates to save space. SMBs seem to ask for higher rates
than the Big Four banks do, a pattern consistent with the fact that SMBs typically face more
liquidity pressure.
Table 1, Panel C reports the summary statistics of WMPs. While the Big Four banks issue
much more WMPs in total amounts, SMBs are more aggressive in issuing WMPs if we scale
total WMP issuance by the bank’s equity. Both groups of banks issue more principal-floating
WMPs than principal-guaranteed WMPs. As stated above, principal-guaranteed WMPs are
recorded on the balance sheet according to CBRC regulations, while principal-floating WMPs
are not. Panel C also shows that principal-floating WMPs have higher annualized expected
yields than principal-guaranteed WMPs do. WMPs issued by SMBs generally have higher
expected yields than those issued by the Big Four banks, especially principal-floating WMPs.
Figure 3 shows the evolution of (the weighted average) WMP yields as well as the
SHIBOR and deposit rate ceilings over the sample period. The yields of WMPs closely track
the 3-month SHIBOR rates. Except for the first half of 2009, when the SHIBOR dropped
dramatically, perhaps due to the substantial liquidity injection by the PBC in response to the
global financial crisis, the SHIBOR and WMP yields are above the deposit rate ceiling. This
means that the regulatory constraint on deposit rates was binding for most of our sample period.
Table 1, Panel D shows a decreasing trend in WMP maturities for both groups of banks,
which may reflect banks’ responses to the LDR regulation. As discussed above, when WMPs
mature, the funds can be transferred to investors’ deposit accounts, thus (temporarily) boosting
its deposit level. Before 2009, the CBRC monitored LDRs at year end; in late 2009, the CBRC
switched to end-of-quarter monitoring, and we observe newly issued WMPs with shorter
maturities. In short, the increasing scale and decreasing maturities reflect banks’ dependence
on WMP financing, and a greater maturity mismatch and rollover risks in these products.
III.2 Determinants of WMP Issuance
In this subsection, we first examine the effects of the LDR and capital ratio on WMP
issuance, and then link the rise of WMPs to the 4-trillion stimulus and bank competition.
A. LDR, Capital Ratio, and Regulatory Arbitrage
We hypothesize that the rise of WMPs is a result of profit-seeking banks’ regulatory
arbitrage to circumvent on-balance sheet regulations. First, during our sample period, banks’
12
deposit rates were capped. As Figure 3 shows, the ceiling on the deposit rate was binding: the
SHIBOR was strictly higher than the deposit rate for most of the period. Second, banks also
face on-balance sheet lending restrictions in the form of capital ratio requirements and limits
on the LDR. By issuing WMPs, banks can attract more deposits by offering higher returns than
the (capped) deposit rates and get around the on-balance sheet lending restrictions by moving
loan assets off the balance sheet.
Based on the discussion above, both the capital ratio and LDR can be factors in the
issuance of WMPs. Capital ratio requirements target the asset side and aim to control the total
size of the bank relative to its capital. To maintain a certain capital ratio, a bank can conduct
more off-balance sheet activities or move on-balance sheet assets off the balance sheet. WMPs,
especially principal-floating ones, fulfill this role.
Alternatively, LDR requirements target both sides of the balance sheet, with the goal of
controlling the bank’s loan balance relative to its deposit balance. To stay below the LDR
threshold, banks can either increase deposits or decrease on-balance sheet loans. Again, WMPs
can accomplish both tasks. The higher yields on WMPs relative to deposit rates can attract
more investors. Principal-guaranteed WMPs are regarded as deposits. Principal-floating
WMPs are off the balance sheet, but by setting the maturity date right before the end of a quarter,
when the CBRC monitors the LDR, these products can increase deposits on and shortly after
the maturity dates too. In addition, loans financed by principal-floating WMPs are off-balance
sheet and do not increase banks’ on-balance sheet loan balances.
We estimate the following model of WMP issuance:
𝑖𝑖𝑖𝑖𝑖𝑖𝑖𝑖𝑖𝑖_𝑖𝑖𝑖𝑖𝑖𝑖 = 𝛽𝛽1𝐶𝐶𝐶𝐶𝐶𝐶𝑖𝑖,𝑖𝑖−1(𝑜𝑜𝑜𝑜 𝐿𝐿𝐿𝐿𝐿𝐿𝑖𝑖,𝑖𝑖−1) + 𝛽𝛽2𝑖𝑖𝐶𝐶𝑜𝑜𝑖𝑖𝐶𝐶𝑠𝑠𝑖𝑖 + 𝛽𝛽3𝑖𝑖𝐶𝐶𝑜𝑜𝑖𝑖𝐶𝐶𝑠𝑠𝑖𝑖× 𝐶𝐶𝐶𝐶𝐶𝐶𝑖𝑖,𝑖𝑖−1(𝑜𝑜𝑜𝑜 𝐿𝐿𝐿𝐿𝐿𝐿𝑖𝑖,𝑖𝑖−1) + 𝑏𝑏𝐶𝐶𝑏𝑏𝑏𝑏𝑖𝑖 + 𝑞𝑞𝑖𝑖𝐶𝐶𝑜𝑜𝑞𝑞𝑖𝑖𝑜𝑜𝑖𝑖 + 𝑖𝑖𝑖𝑖𝑖𝑖
(1)
The dependent variable in Eq. (1) is the total amount of WMPs issued in quarter t divided by
lagged bank equity (at the end of quarter t-1). For the key explanatory variable, capital ratio or
LDR, we also use its lagged value as a control. We define the variable spread as the difference
between the 3-month SHIBOR rate and the associated deposit rate ceiling. We use 3-month
rates because they match the maturity structure of the WMPs; the market rates ought to be
driven by market conditions for loans while shorter-term rates are primarily driven by inter-
bank market liquidity. More specifically, a greater spread between the market rate (SHIBOR)
and the regulated deposit rate gives a stronger incentive for banks to issue WMPs.
According to our discussion above, β2 is positive and β3 is negative when Spread interacts
13
with capital ratio; that is, banks with lower capital ratios will issue more WMPs, especially
when the spread is greater. These effects should be more pronounced for principal-floating
WMPs as these represent off-balance activities. β3 is positive when Spread interacts with LDR:
when the gap between the market rate and the deposit rate ceiling rises, banks with higher
LDRs will issue more WMPs. Additionally, these effects should hold for both principal-
guaranteed and principal-floating WMPs, as both can help attract savings. Finally, given the
differences between Big Four banks and SMBs—Table 1 shows that the two groups are similar
in capital ratio but different in LDR, we also estimate the models for each group of banks
separately.
The results in Table 2 indicate that the LDR matters more for WMP issuance than the
capital ratio does. In Panel A, as predicted, the coefficient of the interaction between spread
and capital ratio is significant for principal-floating WMPs and insignificant for principal-
guaranteed WMPs, and this pattern holds for both groups of banks. However, the interaction
term is only significant at the 10% level. In Panel B, we find that while the LDR does not affect
WMP issuance for the Big Four banks, it has a significant effect for SMBs. In Column (4), the
estimated coefficient of the interaction term is 3.449, significant at the 1% level, and remains
significant for both principal-floating WMPs and principal-guaranteed WMPs.
The economic significance of the effect of LDR on WMP issuance is also greater. For
SMBs, the standard deviation of capital ratio is 0.03 and of LDR is 0.08. If we use the estimated
coefficients, then a one-standard deviation decrease in the capital ratio will increase WMP
issuance over bank equity by (0.254×spread – 0.247), while a one-standard deviation increase
in the LDR will increase WMP issuance over bank equity by (0.276×spread – 0.097).
The different degrees of impact of capital ratio and LDR on WMP issuance may reflect
the relative difficulty in raising capital vs. raising deposits. By issuing equity and (junior) debt,
banks can raise capital and improve their capital ratios; in fact, the average capital ratio for
both the Big Four banks and SMBs is 12% (Table 1, Panel A), well above the regulatory floor.
By contrast, it is much more difficult to attract deposits for SMBs than it is for the Big Four
banks. SMBs have far fewer branches, and their businesses, including lending and deposits,
are usually concentrated in certain regions. As Table 1, Panel A shows, SMBs have higher
LDRs than Big Four banks do, and thus face a more binding constraint from the LDR regulation.
Given the greater impact of the LDR on WMPs in Table 2, we include LDR as the main
regulatory variable in subsequent tests; all results are robust to the inclusion of the capital ratio.
We next explore the factors that contributed to the sudden and dramatic increase in WMP
14
issuance, especially for SMBs, after 2008 (Figure 1). Is this increase connected to the stimulus
plan in response to the global financial crisis?
B. The Stimulus Plan and Differing Implementation Process by the Big Four Banks
While China’s financial system was largely closed to global markets, the economy was
impacted by the global financial crisis through trade, among other channels. Total exports fell
from US $136.7 billion in September 2008 to $64.86 billion in February 2009; the GDP growth
rate fell from 13.9% in 2007 Q4 to 6.2% in 2009 Q1, an unprecedented slowdown since China’s
entry to the WTO in 2001. The Chinese government responded by introducing the RMB
4-trillion Stimulus Plan.
The implementation of the stimulus plan involved multiple parties. First, the central
government invested RMB 1.18 trillion from fiscal revenues and other sources of incomes.
According to the National Development and Reform Commission, the investment projects
from 2008 Q4 to 2010 Q4 include infrastructure, such as reconstruction following the
Wenchuan earthquake (in Sichuan Province), housing, public health and education, energy and
environmental protection, and so on. One stated purpose of the stimulus was to increase
domestic demand and improve public services. Second, local governments, through state-
owned City Infrastructure Investment Corporations (CIICs), also made investments. These
CIICs raise funds from bank loans and issuing bonds against local government land properties.
Third, banks, especially the Big Four banks, played a crucial role in the implementation
process by providing the lion’s share of the funds for the investment projects associated with
the stimulus, both by issuing bank loans and purchasing CIIC bonds. This led to a large credit
expansion in the economy. Figure 4.1 shows total loan balance during the sample period for
the Big Four banks and SMBs (data for SMBs only became available from 2010). Many
investment projects, such as infrastructure projects, were medium and long-term in nature and
thus financed by medium and long-term loans. From Figure 4.1, we can see that from January
2009 to December 2010, Big Four banks’ medium and long-term loan balances increased by
RMB 5.80 trillion (a 66% increase), while their short-term loan balances increased by RMB
1.26 trillion (a 31% increase). In contrast, both the short- and medium/long-term loan balances
of the SMBs remained relatively stable: from January 2009 to December 2010, their medium
and long-term loan balances increased by 1.27 trillion RMB (25%) and short-term loan
balances increased by 0.82 trillion RMB (18%). These results confirm that the Big Four banks
were definitely the major lenders during the stimulus plan.
While all four banks announced large-scale credit expansion in support of the stimulus,
15
the speed of the expansion was different. Figure 4.2 shows total loan balances of the Big Four
banks. For comparison, we scale each bank’s current loan balance by its loan balance at the
end of 2008, the beginning of the stimulus plan. From 2006 Q4 to 2008 Q4, except ABC, the
other three banks exhibited similar growth rates in loans.13 The paths of the loan balances
began to diverge in 2009. The BOC illustrated a much steeper growth path than the other three
banks did: from 2009 Q1 to 2010 Q4, the BOC’s total loan balance increased by 77%, compared
to an increase of 60% by ABC, and 48% by both the CCB and ICBC.
We can see the same patterns for the LDR. From Figure 4.3, none of these banks’ LDRs
exceeded 65% at the end of 2008 Q4, well below the limit of 75%. Starting from 2009, however,
the BOC’s LDR jumped due to aggressive credit expansion and approached the 75% threshold
by the end of 2009, while the LDR of the other three banks dropped in the same year. Finally,
rising loan balances and LDRs would put pressure on the deposit side. Increasing and
maintaining higher deposit levels can help banks stay below the LDR threshold.
Figure 4.4 presents the evolution of the total deposits of the Big Four banks. Similar to
Figure 4.2, we scale each bank’s total deposits by its deposit balance at the end of 2008. From
2006 Q4 to 2008 Q4, all four banks were on similar growth paths for deposits. Starting in 2009,
the growth rates of all the banks spiked compared to the earlier period. Since the BOC had the
highest LDR among the four banks, it also became the most aggressive in raising total deposits.
From 2009 Q1 to 2010 Q4, the BOC’s total deposit increased by 58%, compared to increases
of 47%, 43%, and 35% for the ABC, CCB, and ICBC, respectively. Given the average deposit
balance of RMB 9660.8 billion, the magnitude of the growth rates in deposits for these large
banks (within two years) is substantial, and dramatically changed the landscape of the deposit
market in many regions in China.
What can explain the differences in how the Big Four banks supported the stimulus plan
through credit expansion? One possibility is related to bank executives’ career concerns. The
central government controls the Big Four banks, with top executives appointed by the
Organization Department of the Central Committee of the Communist Party of China. Bank
presidents hold the rank of vice-minister within the hierarchy of government branches. The
President of the BOC at the time was Mr. Xiao Gang, who worked in PBC before joining BOC.
He directed the bank to actively support the stimulus plan through credit expansion. In 2013,
13 ABC went public in July 2010 (the last IPO of the Big Four banks). To prepare for the IPO, capital was injected and non-performing loans were removed from its balance sheet (see Allen et al., 2012, for more details). As in Figure 4.2, its loan balance exhibits two jumps leading up to the IPO.
16
Mr. Xiao was promoted to Chairman of the China Securities Regulatory Commission, a
ministerial position. In contrast, the long-time President of the ICBC, Mr. Jiang Jianqing,
widely regarded as one of the best banking executives in the world, was more cautious in
extending credit following the announcement of the stimulus plan, as the statistics above
indicate. Despite the consistently strong performance of the ICBC relative to the other large
banks, Mr. Jiang retired in May 2016 without any further promotion.14
C. Bank Competition and the Rise of WMPs: Empirical Strategies and Results
As discussed earlier, the Big Four banks enjoy a much stronger status in the deposit market
over all other smaller banks due to their extensive branches across all parts of the country. Thus,
SMBs typically have higher LDRs, as in Table 1. Following the credit expansion as part of the
stimulus implementation, the Big Four banks’ LDRs rose to higher levels, forcing them to
increase deposit levels to stay below the LDR limit. This put even greater pressure on SMBs
to preserve deposits. To circumvent the regulatory ceiling on deposit rates and to attract
depositors, banks employed tactics such as offering gifts, including cash, to depositors when
the account balance is sufficiently high on days close to the CBRC’s LDR monitoring.15
With increasing pressure on the deposit side and facing LDR regulations, SMBs turned to
WMPs, especially the off-balance sheet principal-floating products. Since there was no
restriction on the interest rate for WMPs, and WMPs issued by our sample banks during the
sample period typically mature in 6 months or less with almost no default risk, WMPs were
“deposit-like” instruments without interest rate control. The CBRC and other regulators also
regarded off-balance-sheet WMPs as a compliment to banks’ on-balance-sheet assets and
activities (e.g., Wang et al., 2015), and thus allowed the co-existence of a dual-track
intermediation system. With SMBs’ need to attract deposits, the issuance of WMPs took off.
We hypothesize that competition in local deposit markets, along with LDR regulations,
drove SMBs to issue WMPs. Our point of departure is that competition for deposits occurs in
local markets among branches of different banks. The Big Four banks have extensive branch
networks across all regions in China, but with various degrees of intensity (see the four branch
“heat” maps in Figure 5). Since most SMBs concentrate their branches in certain regions, they
14 During an interview with McKinsey Quarterly in March 2009, Mr. Jiang said, “the government’s recent decision to boost domestic demand provides opportunities for banks, but ICBC is a commercial bank, and we should consider these opportunities from a commercial standpoint.” See Allen, Qian, Shan, and Zhao (2014) for more details on the ICBC, and Deng, Morck, Wu, and Yeung (2015) for bank executives’ career concerns. 15 Concerned about the effectiveness of the interest rate policy, the CBRC forbade banks from giving gifts of any kind to depositors. See a collection of news reports here: http://finance.qq.com/zt2010/banklc/.
17
have different degrees of geographical exposure to competition from the Big Four banks.
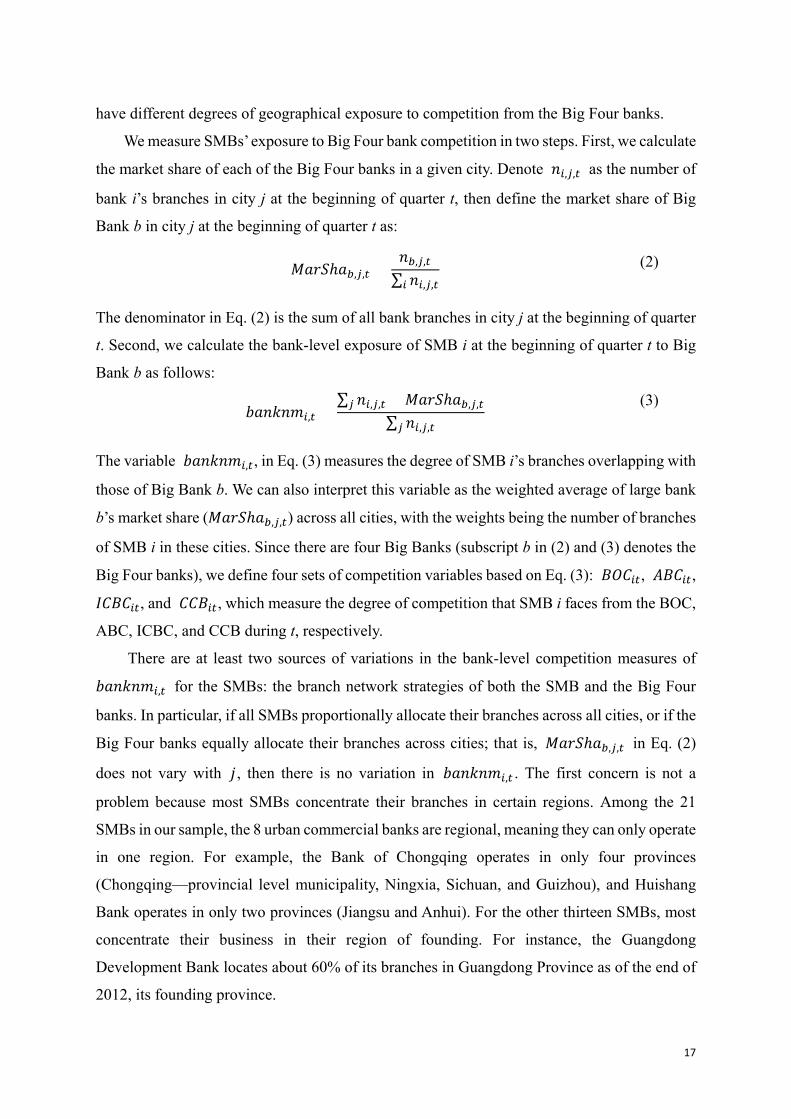
We measure SMBs’ exposure to Big Four bank competition in two steps. First, we calculate
the market share of each of the Big Four banks in a given city. Denote 𝑏𝑏𝑖𝑖,𝑗𝑗,𝑖𝑖 as the number of
bank i’s branches in city j at the beginning of quarter t, then define the market share of Big
Bank b in city j at the beginning of quarter t as:
𝑀𝑀𝐶𝐶𝑜𝑜𝑀𝑀ℎ𝐶𝐶𝑏𝑏,𝑗𝑗,𝑖𝑖 =𝑏𝑏𝑏𝑏,𝑗𝑗,𝑖𝑖
∑ 𝑏𝑏𝑖𝑖,𝑗𝑗,𝑖𝑖𝑖𝑖 (2)
The denominator in Eq. (2) is the sum of all bank branches in city j at the beginning of quarter
t. Second, we calculate the bank-level exposure of SMB i at the beginning of quarter t to Big
Bank b as follows:
𝑏𝑏𝐶𝐶𝑏𝑏𝑏𝑏𝑏𝑏𝑏𝑏𝑖𝑖,𝑖𝑖 =∑ 𝑏𝑏𝑖𝑖,𝑗𝑗,𝑖𝑖 × 𝑀𝑀𝐶𝐶𝑜𝑜𝑀𝑀ℎ𝐶𝐶𝑏𝑏,𝑗𝑗,𝑖𝑖𝑗𝑗
∑ 𝑏𝑏𝑖𝑖,𝑗𝑗,𝑖𝑖𝑗𝑗
(3)
The variable 𝑏𝑏𝐶𝐶𝑏𝑏𝑏𝑏𝑏𝑏𝑏𝑏𝑖𝑖,𝑖𝑖, in Eq. (3) measures the degree of SMB i’s branches overlapping with
those of Big Bank b. We can also interpret this variable as the weighted average of large bank
b’s market share (𝑀𝑀𝐶𝐶𝑜𝑜𝑀𝑀ℎ𝐶𝐶𝑏𝑏,𝑗𝑗,𝑖𝑖) across all cities, with the weights being the number of branches
of SMB i in these cities. Since there are four Big Banks (subscript b in (2) and (3) denotes the
Big Four banks), we define four sets of competition variables based on Eq. (3): 𝐵𝐵𝐵𝐵𝐶𝐶𝑖𝑖𝑖𝑖, 𝐴𝐴𝐵𝐵𝐶𝐶𝑖𝑖𝑖𝑖,
𝐼𝐼𝐶𝐶𝐵𝐵𝐶𝐶𝑖𝑖𝑖𝑖, and 𝐶𝐶𝐶𝐶𝐵𝐵𝑖𝑖𝑖𝑖, which measure the degree of competition that SMB i faces from the BOC,
ABC, ICBC, and CCB during t, respectively.
There are at least two sources of variations in the bank-level competition measures of
𝑏𝑏𝐶𝐶𝑏𝑏𝑏𝑏𝑏𝑏𝑏𝑏𝑖𝑖,𝑖𝑖 for the SMBs: the branch network strategies of both the SMB and the Big Four
banks. In particular, if all SMBs proportionally allocate their branches across all cities, or if the
Big Four banks equally allocate their branches across cities; that is, 𝑀𝑀𝐶𝐶𝑜𝑜𝑀𝑀ℎ𝐶𝐶𝑏𝑏,𝑗𝑗,𝑖𝑖 in Eq. (2)
does not vary with 𝑗𝑗, then there is no variation in 𝑏𝑏𝐶𝐶𝑏𝑏𝑏𝑏𝑏𝑏𝑏𝑏𝑖𝑖,𝑖𝑖 . The first concern is not a
problem because most SMBs concentrate their branches in certain regions. Among the 21
SMBs in our sample, the 8 urban commercial banks are regional, meaning they can only operate
in one region. For example, the Bank of Chongqing operates in only four provinces
(Chongqing—provincial level municipality, Ningxia, Sichuan, and Guizhou), and Huishang
Bank operates in only two provinces (Jiangsu and Anhui). For the other thirteen SMBs, most
concentrate their business in their region of founding. For instance, the Guangdong
Development Bank locates about 60% of its branches in Guangdong Province as of the end of
2012, its founding province.
18
The second concern is not a problem either. Again, from Figure 5 (branches as of the end
of 2012), while all four banks have branches in all provinces, their network intensities vary.
For example, the ABC has most of its branches in the western areas, the ICBC concentrates on
the northern and southern regions, the CCB focuses on central China, and the BOC
concentrates on the coastal and northern parts of the country. If we aggregate the four banks,
they have much stronger presence in less developed areas compared to the SMBs. Table 3
presents the summary statistics of these competition measures and their correlations.
We attribute the spike in SMBs’ WMP issuance post-stimulus to increased competition
from the Big Four banks in local deposit markets. Our identification strategy stems from the
differential pace of credit expansion among the Big Four banks following the announcement
of the stimulus. As Figure 4 documents, the BOC was the most aggressive in its expansion in
the credit and deposit markets. These differences created a plausibly exogenous shock to SMBs
competing against the big banks in local deposit markets. Accordingly, the exposure to BOC
competition ought to have a greater impact on the SMBs’ LDRs and WMP issuance relative to
other big banks’ expansion during the post-stimulus period.16
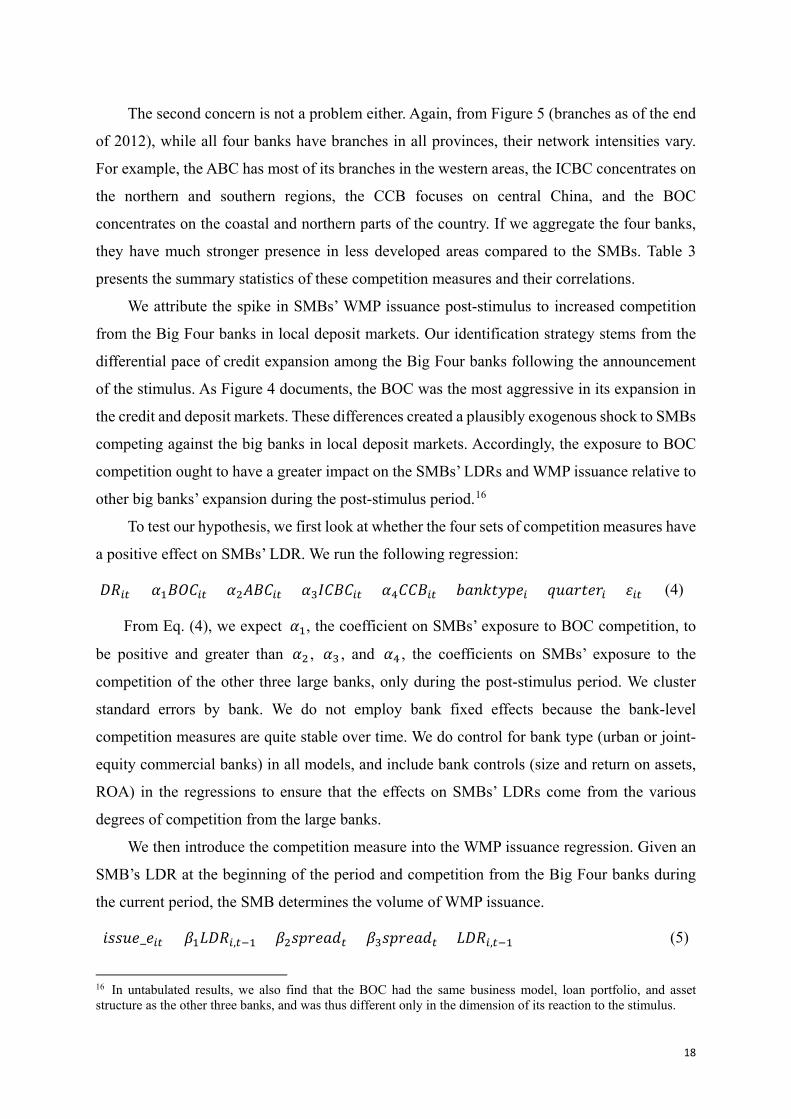
To test our hypothesis, we first look at whether the four sets of competition measures have
a positive effect on SMBs’ LDR. We run the following regression:
𝐿𝐿𝐿𝐿𝑖𝑖𝑖𝑖 = 𝛼𝛼1𝐵𝐵𝐵𝐵𝐶𝐶𝑖𝑖𝑖𝑖 + 𝛼𝛼2𝐴𝐴𝐵𝐵𝐶𝐶𝑖𝑖𝑖𝑖 + 𝛼𝛼3𝐼𝐼𝐶𝐶𝐵𝐵𝐶𝐶𝑖𝑖𝑖𝑖 + 𝛼𝛼4𝐶𝐶𝐶𝐶𝐵𝐵𝑖𝑖𝑖𝑖 + 𝑏𝑏𝐶𝐶𝑏𝑏𝑏𝑏𝑞𝑞𝑏𝑏𝐶𝐶𝑖𝑖𝑖𝑖 + 𝑞𝑞𝑖𝑖𝐶𝐶𝑜𝑜𝑞𝑞𝑖𝑖𝑜𝑜𝑖𝑖 + 𝜀𝜀𝑖𝑖𝑖𝑖 (4)
From Eq. (4), we expect 𝛼𝛼1, the coefficient on SMBs’ exposure to BOC competition, to
be positive and greater than 𝛼𝛼2 , 𝛼𝛼3 , and 𝛼𝛼4 , the coefficients on SMBs’ exposure to the
competition of the other three large banks, only during the post-stimulus period. We cluster
standard errors by bank. We do not employ bank fixed effects because the bank-level
competition measures are quite stable over time. We do control for bank type (urban or joint-
equity commercial banks) in all models, and include bank controls (size and return on assets,
ROA) in the regressions to ensure that the effects on SMBs’ LDRs come from the various
degrees of competition from the large banks.
We then introduce the competition measure into the WMP issuance regression. Given an
SMB’s LDR at the beginning of the period and competition from the Big Four banks during
the current period, the SMB determines the volume of WMP issuance.
𝑖𝑖𝑖𝑖𝑖𝑖𝑖𝑖𝑖𝑖_𝑖𝑖𝑖𝑖𝑖𝑖 = 𝛽𝛽1𝐿𝐿𝐿𝐿𝐿𝐿𝑖𝑖,𝑖𝑖−1 + 𝛽𝛽2𝑖𝑖𝐶𝐶𝑜𝑜𝑖𝑖𝐶𝐶𝑠𝑠𝑖𝑖 + 𝛽𝛽3𝑖𝑖𝐶𝐶𝑜𝑜𝑖𝑖𝐶𝐶𝑠𝑠𝑖𝑖 × 𝐿𝐿𝐿𝐿𝐿𝐿𝑖𝑖,𝑖𝑖−1 + (5)
16 In untabulated results, we also find that the BOC had the same business model, loan portfolio, and asset structure as the other three banks, and was thus different only in the dimension of its reaction to the stimulus.
19
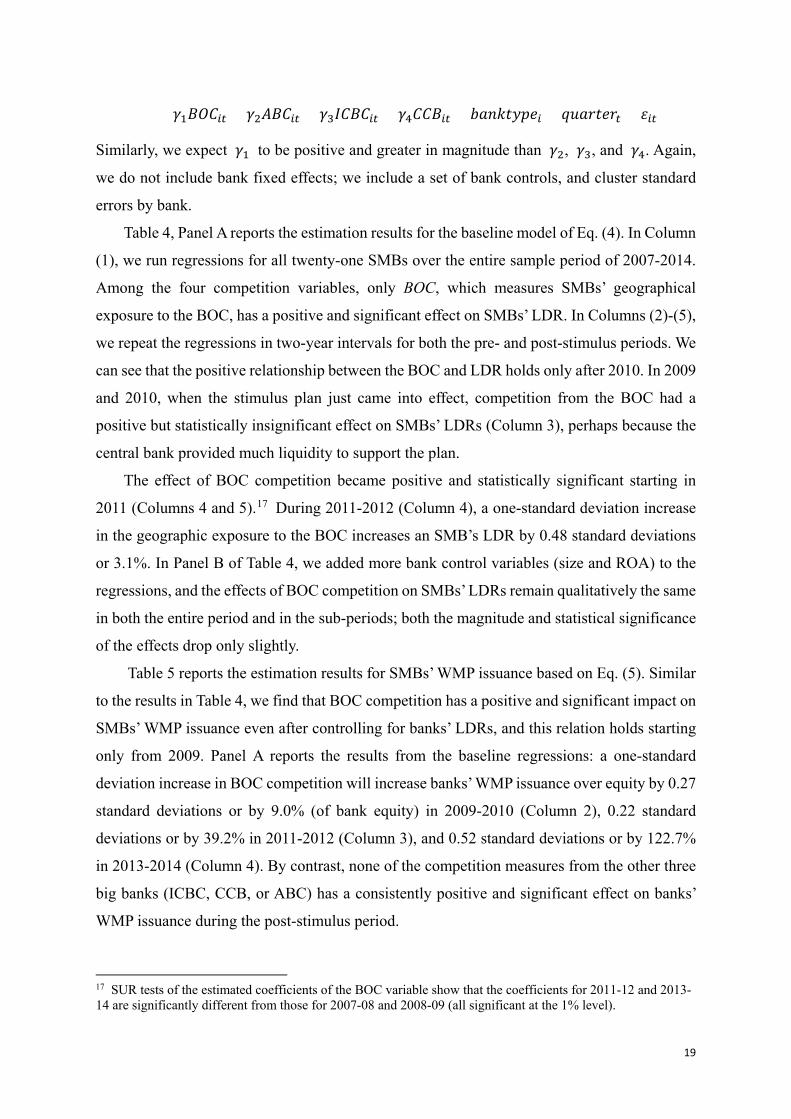
𝛾𝛾1𝐵𝐵𝐵𝐵𝐶𝐶𝑖𝑖𝑖𝑖 + 𝛾𝛾2𝐴𝐴𝐵𝐵𝐶𝐶𝑖𝑖𝑖𝑖 + 𝛾𝛾3𝐼𝐼𝐶𝐶𝐵𝐵𝐶𝐶𝑖𝑖𝑖𝑖 + 𝛾𝛾4𝐶𝐶𝐶𝐶𝐵𝐵𝑖𝑖𝑖𝑖 + 𝑏𝑏𝐶𝐶𝑏𝑏𝑏𝑏𝑞𝑞𝑏𝑏𝐶𝐶𝑖𝑖𝑖𝑖 + 𝑞𝑞𝑖𝑖𝐶𝐶𝑜𝑜𝑞𝑞𝑖𝑖𝑜𝑜𝑖𝑖 + 𝜀𝜀𝑖𝑖𝑖𝑖
Similarly, we expect 𝛾𝛾1 to be positive and greater in magnitude than 𝛾𝛾2, 𝛾𝛾3, and 𝛾𝛾4. Again,
we do not include bank fixed effects; we include a set of bank controls, and cluster standard
errors by bank.
Table 4, Panel A reports the estimation results for the baseline model of Eq. (4). In Column
(1), we run regressions for all twenty-one SMBs over the entire sample period of 2007-2014.
Among the four competition variables, only BOC, which measures SMBs’ geographical
exposure to the BOC, has a positive and significant effect on SMBs’ LDR. In Columns (2)-(5),
we repeat the regressions in two-year intervals for both the pre- and post-stimulus periods. We
can see that the positive relationship between the BOC and LDR holds only after 2010. In 2009
and 2010, when the stimulus plan just came into effect, competition from the BOC had a
positive but statistically insignificant effect on SMBs’ LDRs (Column 3), perhaps because the
central bank provided much liquidity to support the plan.
The effect of BOC competition became positive and statistically significant starting in
2011 (Columns 4 and 5).17 During 2011-2012 (Column 4), a one-standard deviation increase
in the geographic exposure to the BOC increases an SMB’s LDR by 0.48 standard deviations
or 3.1%. In Panel B of Table 4, we added more bank control variables (size and ROA) to the
regressions, and the effects of BOC competition on SMBs’ LDRs remain qualitatively the same
in both the entire period and in the sub-periods; both the magnitude and statistical significance
of the effects drop only slightly.
Table 5 reports the estimation results for SMBs’ WMP issuance based on Eq. (5). Similar
to the results in Table 4, we find that BOC competition has a positive and significant impact on
SMBs’ WMP issuance even after controlling for banks’ LDRs, and this relation holds starting
only from 2009. Panel A reports the results from the baseline regressions: a one-standard
deviation increase in BOC competition will increase banks’ WMP issuance over equity by 0.27
standard deviations or by 9.0% (of bank equity) in 2009-2010 (Column 2), 0.22 standard
deviations or by 39.2% in 2011-2012 (Column 3), and 0.52 standard deviations or by 122.7%
in 2013-2014 (Column 4). By contrast, none of the competition measures from the other three
big banks (ICBC, CCB, or ABC) has a consistently positive and significant effect on banks’
WMP issuance during the post-stimulus period.
17 SUR tests of the estimated coefficients of the BOC variable show that the coefficients for 2011-12 and 2013-14 are significantly different from those for 2007-08 and 2008-09 (all significant at the 1% level).
20
We learned from Table 4 that BOC competition affects SMBs’ LDRs. Therefore, bank-
level measure of geographical exposure to competition from the BOC branches not only affects
smaller banks’ WMP issuance directly, but also indirectly through LDR—in particular, SMBs
facing a tighter LDR constraint have a stronger incentive to issue WMPs to help them stay
below the threshold. To see the total effects of BOC competition on SMBs, we repeat the
estimation without LDR. Columns (5)-(8) in Panel A show that all results continue to hold in
these specifications, except that the magnitude of the coefficients on BOC becomes greater.
According to the estimation, a one-standard deviation increase in BOC exposure will increase
banks’ WMP issuance over equity by 0.33 standard deviations in 2009-2010, and 0.33 standard
deviations in 2011-2012, and 0.56 standard deviations in 2013-2014.
Since the four sets of competition metrics are correlated (see Table 3), to obtain a clearer
picture of how each individual large bank affects SMBs’ WMP issuance, we include only one
large bank’s competition variable in the regressions, and report the results in Table 5, Panel B.
For brevity, we report only the coefficients on the competition measures; thus, we obtain each
coefficient from one regression. From Panel B, we can see that only geographic exposure to
the BOC has a positive and significant effect on the SMBs’ WMP issuance during the entire
post-stimulus period. ICBC exposure has a much smaller effect, while that of the two other
banks is mostly positive but statistically insignificant. In Panel C, we again add bank size and
ROA as additional controls (with and without LDR as a control) and the main results are robust
to this specification.18
To summarize, Tables 4 and 5 provide support for our hypothesis that the 4-trillion
stimulus, especially different paces in Big Four banks’ credit expansion, created a plausibly
exogenous shock to SMBs, and those facing more competition in local deposit markets from
the fastest expanding big bank—the BOC—issued more WMPs.
Although we provide evidence that the effect of big bank competition on SMBs’ WMP
issuance exists only after the stimulus period and only for the most aggressive big bank BOC,
one concern may be that there is an omitted variable that happens to be correlated with BOC’s
presence in the post-stimulus period and drives the WMP issuance of SMBs. For example, as
BOC’s branching network is more concentrated in the coastal areas and these areas generally
experience faster economic growth, SMBs with more branches in the coastal areas will be
18 We also look at the effects of monetary policy tightening on WMP issuance. We introduced the 3-month SHIBOR as an additional control and compared this rate with the BOC competition variable to find that the interaction term has a positive and significant effect on SMBs’ WMP issuance (results available upon request).
21
exposed to more BOC competition and also face have more investment opportunities which
can drive their funding raising activities through WMPs. Ideally, if branches of the same bank
face the same investment opportunities through its internal financial market, we can conduct a
within-bank estimation strategy, that is, to control for bank fixed effect and explore variations
in WMP issuance and Big Four competition across branches. Since WMP issuance decisions
are made at the headquarter of SMBs (and not at branch-level), a branch-level analysis on WMP
issuance is not feasible.19
Instead, we provide a different within-bank analysis that can further confirm the deposit
competition channel. Banks can compete for funding not only through issuing WMPs but also
by establishing new branches. To avoid competition from BOC branches, they ought to prefer
establishing branches in cities with less BOC presence. So, after controlling for bank fixed
effect, we should expect to see less branch establishment in cities with more BOC competition.
However, if more presence of BOC branches represents more investment opportunities in that
city, we should expect to see more (if any) branch establishment to capture these opportunities.
To empirically test the hypothesis, we consider branch establishment decisions in cities
where the banks already operate. For all the commercial banks, we construct bank-city pairs
such that the bank operates at least one branch in that city on December 31, 2008 (so as to
avoid new branch establishments possibly affecting the competition measures). Then for any
year after 2008, we construct a binary variable Establish which equals 1 if the bank established
any new branches in that city from 2009 up to that year, and 0 otherwise. We then regress
Establish on the Big Four competition measures (as of December 31, 2008), as follows:
𝐸𝐸𝑖𝑖𝑞𝑞𝐶𝐶𝑏𝑏𝐸𝐸𝑖𝑖𝑖𝑖ℎ′𝑖𝑖𝑖𝑖𝑖𝑖 = 𝛾𝛾1𝑖𝑖𝐵𝐵𝐵𝐵𝐶𝐶𝑖𝑖 + 𝛾𝛾2𝑖𝑖𝐴𝐴𝐵𝐵𝐶𝐶𝑖𝑖 + 𝛾𝛾3𝑖𝑖𝐼𝐼𝐶𝐶𝐵𝐵𝐶𝐶𝑖𝑖 + 𝛾𝛾4𝑖𝑖𝐶𝐶𝐶𝐶𝐵𝐵𝑖𝑖 +
𝛽𝛽𝑖𝑖𝐶𝐶𝑖𝑖𝑞𝑞𝐵𝐵𝑜𝑜𝐶𝐶𝐶𝐶𝑖𝑖𝑏𝑏𝑖𝑖 + 𝑏𝑏𝐶𝐶𝑏𝑏𝑏𝑏𝑖𝑖𝑖𝑖 + 𝐶𝐶𝑜𝑜𝑜𝑜𝑝𝑝𝑖𝑖𝑏𝑏𝑝𝑝𝑖𝑖𝑖𝑖 + 𝜀𝜀𝑖𝑖𝑖𝑖𝑖𝑖
(6)
We assume 𝐸𝐸𝑖𝑖𝑞𝑞𝐶𝐶𝑏𝑏𝐸𝐸𝑖𝑖𝑖𝑖ℎ𝑖𝑖𝑖𝑖𝑖𝑖 = 1(𝐸𝐸𝑖𝑖𝑞𝑞𝐶𝐶𝑏𝑏𝐸𝐸𝑖𝑖𝑖𝑖ℎ′𝑖𝑖𝑖𝑖𝑖𝑖 > 0). In Eq. (6), c represents city and i
represents bank. We include both the bank and province fixed effects, as well as the number of
branches in a city as a control variable. We run Logit estimation of the model for each year
from 2009 to 2016, and cluster the standard errors at the city level.
Table 6 reports the results. BOC competition has a negative and significant effect on new
branch establishment of SMBs. For example, in 2011 (Column 3), moving from the 10th
percentile of the BOC competition measure to the 90th percentile would reduce the probability
19 In our conversation with executives of Big Four banks and SMBs, we learned that a few large branches of the large banks do have authority to issue WMPs. However, our focus here is to understand how deposit-competition led to SMBs’ issuance of WMPs, and not WMP issuance of the large banks.
22
of establishing a new branch (of an SMB) in that city from 59% to 52%. The effect of
competition from the other three large banks is much weaker (the ICBC competition measure
has a marginally positive effect in some years). Because we control for the bank fixed effect,
the variation is only driven by city-specific factors. As we discuss above, the investment
opportunity hypothesis would predict either a zero or positive effect of BOC competition, while
the deposit competition hypothesis is consistent with the negative estimates. In fact, the
negative and significant effect of BOC competition begins to emerge in 2011, which is also
consistent with heightened deposit competition in the post-stimulus period.
In the next subsection, we argue and show that the rise of Big Four’s WMP issuance can
also be attributed to the RMB 4-trillion stimulus.
D. Big Four Banks’ WMP Issuance and the Stimulus Plan
Recall from Figure 1 that the Big Four banks also increased WMP issuance (relative to
assets) during the post-stimulus period, although the extent of the increase is more subdued
compared to that of the SMBs. As we discussed in Section III.2B, a significant amount of new
bank loans went to CIICs, which are owned by the local governments. At the end of 2008, the
total bank loan balance to CIICs was RMB 4.33 trillion; the total balance shot up to RMB 7.66
trillion in June 2009 and then to RMB 9.20 trillion at the end of 2012. Some of the extra credit
supply resulting from the stimulus also went to the real estate sector and pushed up housing
prices substantially (see, e.g., Deng et al., 2015).20
The sharp increase in CIICs’ debt levels, as well as an overheated real estate sector, posed
a threat to the overall financial system. On June 10, 2010, the State Council passed a new
regulation on CIICs and their debt: commercial banks must tighten their credit supply to CIICs
and reduce their existing debt levels. The central government, along with the PBC, also placed
restrictions on new bank loans going to the real estate sector. Consequently, the total amount
of bank loans for real estate shrank from RMB 2.02 trillion in 2009 and 2010 to 1.38 trillion in
2011 and 2012.
These regulatory changes and tightening of bank credit to CIICs and the real estate sector
led to a sharp increase in shadow banking activities. Long-term investment in infrastructure
and real estate will take years before cash inflows can cover the initial costs. Thus, when the
original bank loans extended during the stimulus mature, these loans need to be rolled over or
20 The total income of local governments in 2010, as a main source of funds to repay the debt, was about RMB 11.51 trillion, while total CIIC debt balance was over 7.8 trillion. It is estimated that RMB 1.84 billion of bank loans for CIICs was due in 2012 alone (see the Chinese Financial Statistics Yearbooks 2010-2012).
23
they may face default. Since banks were restricted to extend new loans, credit originating in
the shadow banking sector emerged as a substitute. Banks could refinance these loans with
principal-floating WMPs, which are off their balance sheet, or work with non-bank institutions,
such as trust companies, to extend new credit.21
We do not have information on the individual loans extended during the stimulus; instead,
we look at the changes in loan balances, most of which are medium and long-term, over time,
and link these changes to the issuance of WMPs for the Big Four banks. Figure 7.1 shows that
the fraction of medium (1-5 years) and long-term (longer than 5 years) loans among all loans
rose sharply from 56% and 68% in 2008 to 63% and 73% in 2010 for all Big Four banks, before
falling gradually in later years. The drop in the percentages of these loans is consistent with
banks cutting new loans to CIICs and the real estate sector.
To test our hypothesis that banks issue WMPs to refinance maturing bank loans, for each
big bank, we first estimate the linear trend of total loan balances using quarterly observations
from 2006 Q4 to 2008 Q4 and calculate the predicted loan balance in 2010 Q4. We then
calculate the difference between the actual and predicted loan balances in 2010 Q4 and use it
as a proxy for loan increase due to the stimulus. We scale this proxy and the WMP balance by
banks’ total loan balances at the end of 2008.
Figure 7.2 shows a positive relationship between a large bank’s WMP balance at the end
of 2013 and the estimated loan increase. In Table 7, we regress banks’ WMP balance each year
on our proxy of loan increase due to the stimulus. For principal-floating WMP balance (top
panel), the positive relationship grew stronger during the post-stimulus period, when more
medium- and loan-term loans matured and the need for debt rollover increased. For principal-
guaranteed WMPs, however, there is no such relationship, since these WMPs cannot move
loans and assets off the balance sheet.
Combining the results of this section, we conclude that there are at least two mechanisms
through which the 4-trillion stimulus triggered the rise in China’s shadowing banking sector in
the form of bank WMPs. For SMBs, the local deposit markets became more competitive
because of the Big Four banks, especially the BOC’s, massive credit support for the stimulus
and need to raise deposits (to satisfy the LDR requirement). The heightened competition in the
local deposit markets resulting from the stimulus and large banks’ credit expansion had a causal
impact on SMBs, leading them to issue much more WMPs to attract more savings. For the Big
21 See, for example, Chen, He, and Liu (2018) on the debt rollover of CIICs, and Allen, Gu, Qian, and Qian (2018) on the use of trust products to refinance real estate projects.
24
Four banks, when the large amount of “stimulus” loans to CIICs and the real estate sector
matured, and regulators tightened the credit supply to these sectors, they issued off-balance
sheet, principal-floating WMPs to refinance these long-term projects.
As the Big Four banks and SMBs issued more WMPs, the total amount of outstanding,
off-balance sheet products rose substantially, and this put pressure on the banking system as
the amount required to pay off or roll over also increased sharply. In Table 5 (all 3 panels), the
coefficient on BOC competition increases significantly during 2011-12 and 2013-14 compared
to 2009-10. The BOC competition variable, which measures SMBs’ geographical exposure to
BOC branches, is relatively stable over time, while the amount of new issuance (by SMBs) is
tied to the total amount they need to roll over, which is increasing for both the Big Four banks
and SMBs.
Hence, the rising magnitude of the coefficients of the BOC variable in Table 5 captures a
“compounding” effect of bank competition on WMP issuance. In Table 8, we use the amount
of net issuance (the difference between total issuance and WMP due in the quarter) as the
dependent variable, and regress it on the same set of controls as in Table 5, Panel A. We still
observe that the coefficient on BOC competition becomes larger after the stimulus, but the
BOC coefficient for 2011-2012 is not statistically different from that for 2013-14. These results
confirm that new WMP issuance is indeed tied to the total amount that the bank needs to roll
over. These results and interpretations also highlight the importance of rollover risk, which we
examine next.
IV. Rollover Risk of WMPs
In the previous section, we established a causal relation between bank competition, which
was “shocked” by the 4-trillion stimulus, and the sharp increase in the issuance of WMPs by
SMBs during the post-stimulus period. We also examine the reasons behind the increase in
WMP issuance by the Big Four banks. In this section, we study the outcome of the fast rise in
WMP issuance—the substantial rollover risk of the issuing banks—and whether the stock
market and investors are aware of this risk.
IV.1 Maturity Mismatch of WMPs and Yield on New Products
Recall from Table 1, Panel C that many WMPs are short-term products with an average
maturity of 3-4 months. We examine the distribution of the maturity dates of WMPs within a
25
quarter. We collect information on individual WMPs from the WIND database and count the
number of WMPs that mature on each day within a quarter. Figure 8.1 shows that many WMPs
issued by the Big Four banks mature on the final few days within a quarter. For SMBs, the
most striking pattern is that an abnormally high proportion of WMPs mature on the last day of
each month, and especially on the last day of the quarter (Figure 8.2). For principal-floating
WMPs, a large proportion of products issued by both the Big Four banks and SMBs mature at
month end, and again, many products mature on the last day of the quarter (Figure 8.3). For
principal-guaranteed products, which issuing banks do include on their balance sheets, the
distribution is more even across the days of a quarter (Figure 8.4).
The above patterns support the notion that banks use off-balance sheet principal-floating
WMPs to help manage LDR regulations. When this type of WMPs mature on the last day of a
quarter, investors, many of whom have a deposit account at the issuing bank, let funds flow
back to their deposit account (at least temporarily), thus boosting the bank’s overall deposit
level on that day. Since the CBRC monitors the LDR on the last day of a quarter, this temporary
boost in banks’ deposit levels helps them stay below the LDR limit of 75%.
The above regulatory arbitrage behavior introduces rollover risk for the banks, in that
when a large amount of WMPs mature on a particular day, if a fraction of the invested (long-
term) assets does not yield sufficient cash flows, banks will need to refinance these loans and
satisfy the redemption of funds by issuing new WMPs and/or raising funds from other
institutions and the interbank market.
To examine the rollover risk around WMP maturity dates, we construct a variable
WMPdue, which is the amount of WMPs due in a quarter over bank equity at the end of the
previous quarter, and study its impact on the issuing bank’s behavior. We first study its effect
on the yield of newly issued WMPs by estimating the following model:
𝑊𝑊𝑀𝑀𝑊𝑊𝑜𝑜𝑖𝑖𝑞𝑞𝑖𝑖𝑜𝑜𝑏𝑏_𝑠𝑠𝑖𝑖𝑖𝑖 = 𝛽𝛽1𝑊𝑊𝑀𝑀𝑊𝑊𝑠𝑠𝑖𝑖𝑖𝑖𝑖𝑖𝑖𝑖 + 𝛽𝛽2𝑀𝑀ℎ𝑖𝑖𝑏𝑏𝑜𝑜𝑜𝑜_𝑠𝑠𝑖𝑖 + 𝑏𝑏𝐶𝐶𝑏𝑏𝑏𝑏𝑖𝑖 + 𝑖𝑖𝑖𝑖𝑖𝑖 (7)
The dependent variable is the difference between the annualized yield on a new WMP and
the bank’s deposit rate ceiling. The variable SHIBOR_dt measures the difference between the
SHIBOR and banks’ deposit rate ceiling. We choose the SHIBOR and the deposit rate that have
the same (or closest) maturity as the WMP and obtain the rates on the day of the WMP issuance.
Note that in Eq. (7), we do not include the quarter fixed effect due to the presence of the variable
SHIBOR_dt, but we do include the issuing bank fixed effect.
The key independent variable is WMPdue. For principal-floating (guaranteed) WMPs, we
26
use only the total amount of all such products that mature in the same quarter over bank equity.
If one purpose of issuing new WMPs is to raise funds to refinance long-term assets and meet
the redemption of maturing products, then the issuing bank should offer a higher yield on the
new WMPs. Therefore, we expect 1β in Eq. (7) to be positive.
Table 9 presents the results. Consistent with our hypothesis, WMPdue has a positive and
significant impact on the yields of new WMPs by the SMBs, but no such relationship exists for
the large banks. These results make sense, as different banks have different financing needs
and channels when WMPs come due. On one hand, the Big Four banks can raise funds from
the interbank market; moreover, they are not as aggressive as SMBs in issuing WMPs, so the
amount of WMPs maturing in each quarter does not require large-scale fundraising through the
issuance of new products. On the other hand, SMBs face greater liquidity shortages and offer
considerably higher yields on the new WMPs to attract capital. The effect of WMPdue on new
the WMP’s yield is positive and significant for both principal-floating and principal-guaranteed
products issued by SMBs (Columns 3 and 4; significant at the 1% level). A one-standard
deviation increase in WMPdue increases the annual yield of WMPs by 0.23% for principal-
floating products and 0.38% for principal-guaranteed products. These results indicate a large
economic effect of maturing WMPs on the issuance of new products, and confirm that SMBs
face substantial rollover risk when a large amount of WMPs mature.
IV.2 Rollover Risk and the Interbank Market
As we discussed above, besides raising funds via new WMPs, banks can tap the interbank
market for liquidity. With more maturing WMPs, issuing banks ought to be more willing to
offer higher rates when borrowing funds; in other words, banks should submit higher quotes
when they have more maturing WMPs and when the aggregate demand for liquidity is greater.
To see whether the Big Four banks or SMBs’ amount of maturing WMPs plays a greater role
in determining the interbank market rate, we include both the average amount of maturing
WMPs for the Big Four banks (WMPdue_BIG4) and the average amount of maturing WMPs
for SMBs (WMPdue_SMB) in the regressions. We also include the WMPs due for each
individual bank (WMPdue). We run the following regression model:
𝐴𝐴𝑖𝑖𝑏𝑏𝑖𝑖𝑖𝑖 = 𝛼𝛼 + 𝛽𝛽1𝑊𝑊𝑀𝑀𝑊𝑊𝑠𝑠𝑖𝑖𝑖𝑖𝑖𝑖𝑖𝑖 + 𝛽𝛽2𝑊𝑊𝑀𝑀𝑊𝑊𝑠𝑠𝑖𝑖𝑖𝑖_𝑀𝑀𝑀𝑀𝐵𝐵𝑖𝑖 + 𝛽𝛽3𝑊𝑊𝑀𝑀𝑊𝑊𝑠𝑠𝑖𝑖𝑖𝑖_𝐵𝐵𝐼𝐼𝐵𝐵4𝑖𝑖+ 𝛽𝛽4𝐶𝐶𝐶𝐶𝐶𝐶𝑖𝑖,𝑖𝑖−1 + 𝛽𝛽5𝐿𝐿𝐿𝐿𝐿𝐿𝑖𝑖,𝑖𝑖−1 + 𝑖𝑖𝑖𝑖𝑖𝑖
(8)
The dependent variable is a participating bank’s average ask quote within quarter t. We do not
27
include the bank fixed effect because we are interested in cross-sectional variation—how the
variation in WMPdue across banks affects the submission of ask quotes. We do not include the
quarter fixed effect either because we are interested in the relative importance of WMPdue,
which varies both across banks and over quarters, and WMPdue_SMB and WMPdue_BIG4,
which vary over time, on the ask quotes.
We use quarterly observations of banks that participate in the SHIBOR bid and ask process
from 2008 Q1 to 2014 Q4 and estimate the model in Eq. (8) for the Big Four banks and SMBs
separately. We standardize the four variables—ask rate, WMPdue, WMPdue_BIG4, and
WMPdue_SMB—by scaling them by their standard deviations. There are only fourteen banks
in the regression sample; clustering standard errors by bank would dramatically reduce the
statistical significance of the coefficients. We do cluster standard errors by quarter.
Table 10 reports the results. The effect of the (average) maturing WMPs for the Big Four
banks on the borrowing rates is much stronger than that of WMPs for the SMBs. The coefficient
on WMPdue_SMB is statistically insignificant in all models, while the coefficient on
WMPdue_BIG4 is positive and significant for both the Big Four banks and SMBs. A one-
standard-deviation increase in WMPdue_BIG4 leads to an increase in a large bank’s ask for the
overnight SHIBOR by 0.805 standard deviations (Column 1), and a participating SMB’s ask
for the overnight SHIBOR by 0.728 standard deviations (Column 7). The amount of a large
bank’s maturing WMPs does not affect its own quotes, while the amount of an SMB’s maturing
WMPs increases their ask quotes, especially for long-term SHIBOR bidding (Columns 7-12).
These results confirm that the Big Four banks are the dominant players and usually the
main liquidity providers in the interbank market, while SMBs are typically net borrowers.
When large banks have more maturing WMPs, SMBs are forced to submit higher ask quotes.
Further, to analyze how WMPs affect the interbank market as a whole, we look at the
relationship between the aggregate amount of maturing WMPs and the one-week SHIBOR. In
Figure 9, we calculate the aggregate amount of maturing WMPs over M2 in the Big Four banks
and for all SMBs, and plot them against the one-week SHIBOR. We can see a clear rising trend
in the one-week SHIBOR over our sample period, and it closely tracks the total amount of
maturing WMPs of the Big Four banks (Figure 9.1). By contrast, the amount of WMP due from
the SMBs steadily increases over time, but has no clear relationship with the SHIBOR. These
patterns indicate that the Big Four banks’ activities—the amount of maturing WMPs as one
factor—play an important role in determining the SHIBOR.
28
IV.3 Rollover Risk and the Stock Market’s Response
As a final set of tests on the impact of rollover risk, we look at the stock market’s response
to 17 (publicly listed) banks when their funding cost jumps to higher levels. We calculate the
daily change in the overnight and 1-week SHIBOR and regard the changes as unexpected if
changes in both the overnight and one-week rates are high. On each business day, the SHIBOR
is announced at 11:30am (9:30am starting from 08/01/2014); if the announced rates in the
current day are much higher than those on the previous day, then stock prices ought to reflect
this adverse change before trading ends. Specifically, we estimate the following model:
𝑜𝑜𝑖𝑖𝑞𝑞𝑖𝑖𝑜𝑜𝑏𝑏𝑖𝑖𝑖𝑖 = 𝛼𝛼 + 𝛽𝛽𝑊𝑊𝑀𝑀𝑊𝑊𝑠𝑠𝑖𝑖𝑖𝑖𝑖𝑖𝑖𝑖 + 𝜀𝜀𝑖𝑖𝑖𝑖 (9)
The independent variable WMPdueit is the amount of WMPs that mature in the current month
t scaled by the issuing bank’s equity at the end of the previous quarter; the dependent variable
returnit is the stock return of the issuing bank from the previous trading day to the current day.
We choose days on which the changes in both the overnight and one-week SHIBOR are above
a certain threshold. The coefficient β is expected to be negative for sufficiently large changes.
Table 11 reports the results. We choose four different thresholds, with the highest c = 1%.
During our sample period, we have 9 trading days in which both the overnight and one-week
SHIBOR jumped by 1% or more. The second, third, and fourth thresholds are 0.8%, 0.6%, 0.4%
with 16, 25, and 48 trading days, respectively. The first row in Table 10 reports the raw returns
on the banks’ stocks. We find that the coefficient on WMPdue is negative and statistically
significant when the threshold is greater than or equal to 0.6%. Figure 10 presents the scatter
plot of raw returns against WMPdue with c = 1%; clearly, we find a negative relationship
between bank stock prices and WMPdue.
We also use three risk-adjusted stock returns as the dependent variable in Table 10: raw
daily return minus the market return (second row), the residual (from the current day) from a
linear projection of raw daily returns on market returns for the past 60 trading days (third row),
and the residual from a CAPM model (with the 3-month SHIBOR as the risk-free rate) using
observations for the past 60 trading days (fourth row). We continue to find a negative
relationship between the amount of WMPs due and the bank’s returns on days when the
SHIBOR rises sharply. The economic magnitude of the effect is also very large: a one-standard
deviation increase in WMPdue (68% of issuing bank’s equity) leads to a drop in raw returns by
0.64% during the trading days when the SHIBOR spiked by 1% or higher.
The results from Figure 10 and Table 11 suggest that the stock market and investors appear
29
to be aware of the rollover risk—as measured by maturing WMPs—that the issuing banks face.
To conclude, the results in this section show that the rollover risks of WMPs put pressure on
banks’ liquidity management and increase their funding cost, and the amount of maturing
WMPs of the Big Four banks is a determinant of the SHIBOR in the interbank market. As the
Big Four banks and SMBs all issue more WMPs, the scale and rollover risks rise the amount
to roll over increases, which poses a threat to the stability of the entire financial system.
V. Conclusion
Much attention has been paid to the rise of shadow banking as a result of “regulatory
arbitrage” by financial institutions and its impact on the stability of the overall financial system.
However, there is little academic research on how shadow banking arises in emerging markets.
In this study, we examine one of the largest components of China’s shadow banking sector—
WMPs issued by banks. We link the rapid rise in the scale of WMPs after 2009 to banking
regulations, especially on-balance sheet regulations, and the RMB 4-trillion stimulus. We also
study the rollover risk of the WMPs by looking at issuing banks’ behavior when these products
mature and in the context of the interbank market.
While WMPs existed long before 2009, their scale, especially off-balance sheet, principal-
floating products, took off after the stimulus was implemented. We first provide evidence
showing that regulatory arbitrage is indeed behind the issuance of WMPs: the scale of WMP
issuance is greater for banks that are more constrained by on-balance sheet lending restrictions,
in particular the LDR (loan-to-deposit ratio) requirement for SMBs, and when the gap between
the market lending rates and the regulated deposit rate ceiling is high.
Second, we attribute the swift rise of SMBs’ issuance of WMPs during the post-stimulus
period to heightened competition with large banks triggered by the massive credit expansion
during the implementation of the stimulus. The Big Four banks were the primary source that
pumped stimulus credit into the economy. After a rapid increase in loan balances, these large
banks, especially the BOC, grew much more aggressive in deposit markets to ensure that their
LDRs stay below the regulatory limit. Increased competition in the local deposit markets then
forced SMBs, especially those with high geographical exposure to BOC competition, to issue
off-balance sheet WMPs to attract savings and satisfy on-balance sheet lending requirements.
When the regulators tightened the credit supply to local governments and the real estate sector,
the Big Four banks issued principal-floating WMPs to refinance the long-term projects in these
30
sectors, while moving the new loans off their balance sheets. Hence, this is another channel
through which the stimulus triggered the growth of WMPs.
Third, as the amount of WMPs rises over time, they impose increasingly greater rollover
risks for the issuing banks, the inter-bank market, and the entire financial system. When more
WMPs mature, SMBs offer higher yields on new WMPs, while more maturing WMPs in the
Big Four banks is associated with higher short-term rates (SHIBOR) in the interbank market.
Finally, (listed) issuing banks’ stock prices drop more during credit crunches when they have
more WMPs come due. Overall, our tests and results shed light on how the stimulus and bank
competition triggered the rapid rise of shadow banking—in the form of WMPs—in China, and
contributed to the greater fragility of the financial system.
31
References:
1. Acharya, Viral, Hemal Khandwala, and Sabri Oncu, 2013, “The Growth of a Shadow
Banking System in Emerging Markets: Evidence from India,” Journal of International
Money and Finance, 39, 207-230.
2. Acharya, Viral, and Nirupama Kulkarni, 2018, “Government Guarantees and Bank
Vulnerability during the Financial Crisis of 2007-09: Evidence from an Emerging Market,”
Working paper, NYU Stern School of Business.
3. Acharya, Viral, and Sabri Oncu, 2013, “A Proposal for the Resolution of Systemically
Important Assets and Liabilities: The Case of the Repo Market,” International Journal of
Central Banking 9 (1), 291-350.
4. Acharya, Viral, and Guillaume Plantin, “Monetary Easing and Financial Instability”,
Working Paper, NYU Stern School of Business.
5. Acharya, Viral, Philipp Schnabl and Gustavo Suarez, “Securitization without Risk
Transfer”, 2013, Journal of Financial Economics, 107, 515-536.
6. Allen, Franklin, Xian Gu, Jun Qian and Yiming Qian, 2018. “Implicit Guarantees and the
Rise of Shadow Banking: the Case of Trust Products in China,” working paper, Fudan
University.
7. Allen, Franklin, Jun Qian, Chenyu Shan, and Mengxin Zhao, 2014. “The IPO of Industrial
and Commercial Bank of China and the ‘Chinese Model’ of Privatizing Large Financial
Institutions,” European Journal of Finance 20, 599-624.
8. Allen, Franklin, Jun Qian, Chenying Zhang, and Mengxin Zhao, 2012. “China’s Financial
System: Opportunities and Challenges,” Chapter 2 in Capitalizing China, Joseph Fan and
Randall Morck, eds. University of Chicago Press.
9. Allen, Franklin, Yiming Qian, Guoqian Tu, and Frank Yu, 2018. “Entrusted Loans: A Close
Look at China's Shadow Banking System,” forthcoming, Journal of Financial Economics.
10. Chen, Kaiji, Jue Ren, and Tao Zha, 2018. “The Nexus of Monetary Policy and Shadow
Banking in China,” forthcoming, American Economic Review.
11. Chen, Zhuo, Zhiguo He, and Chun Liu, 2018. “The Financing of Local Government in the
People’s Republic of China: Stimulus Loan Wanes and Shadow Banking Waxes,” working
paper, University of Chicago.
12. Dang, Tri Vi, Honglin Wang, and Aidan Yao, 2014. Chinese Shadow Banking: Bank-
Centric Misperceptions, working paper, Columbia University.

32
13. Deng, Yongheng, Randall Morck, Jing Wu, and Bernard Yeung, 2015. China’s Pseudo-
monetary Policy, Review of Finance 19, 55-93.
14. Diamond, Douglas, 2004, “Committing to Commit: Short-term Debt When Enforcement is
Costly,” AFA Presidential Address.
15. Fan, Gang, Xiaolu Wang, and Hengpeng Zhu, 2006. NERI Index of Marketization of
China's Provinces 2006 Report, Economic Science Press, Beijing.
16. Hachem, Kinda, and Zheng Song, 2015. “The Rise of China’s Shadow Banking System,”
Working Paper, University of Chicago.
17. Hanson, Samuel, Andrei Shleifer, Jeremy Stein, and Robert Vishny, 2015. “Banks as
Patient Fixed-income Investors,” Journal of Financial Economics 117, 449-469.
18. Qian, Jun, Phil Strahan, and Zhishu Yang, 2015, “The Impact of Incentives and
Communication Costs on Information Production and Use: Evidence from Bank Lending,”
Journal of Finance 70, 1457-1493.
19. Song, Michael, Jetil Storesletten, and Fabrizio Zilibotti, 2011. “Growing like China,”
American Economic Review 101, 196–233.
20. Wang, Hao, Honglin Wang, Lisheng Wang, and Hao Zhou, 2015. “Shadow Banking:
China’s Dual-track Interest Rate Liberalization,” working paper, Tsinghua University.
21. Wildau, Gabriel, 06/25/2015. “Shadow lending crackdown looms over China”, The
Financial Times. Retrieved from http://www.ft.com
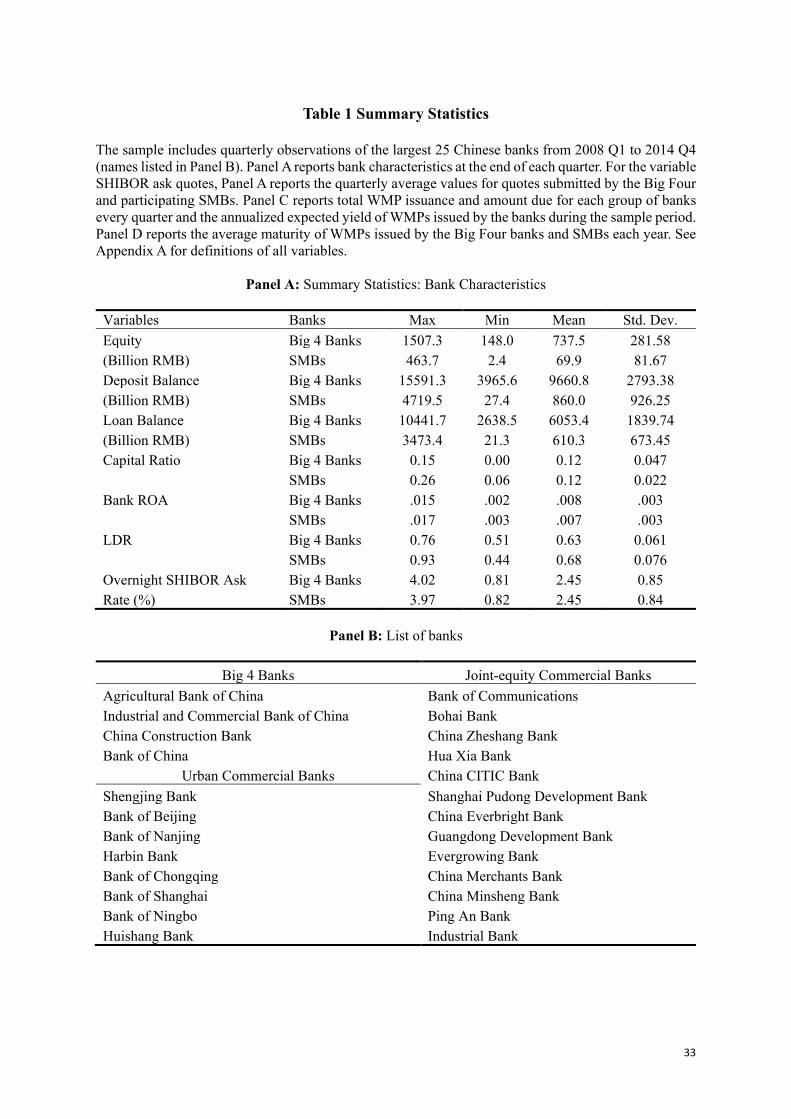
33
Table 1 Summary Statistics
The sample includes quarterly observations of the largest 25 Chinese banks from 2008 Q1 to 2014 Q4 (names listed in Panel B). Panel A reports bank characteristics at the end of each quarter. For the variable SHIBOR ask quotes, Panel A reports the quarterly average values for quotes submitted by the Big Four and participating SMBs. Panel C reports total WMP issuance and amount due for each group of banks every quarter and the annualized expected yield of WMPs issued by the banks during the sample period. Panel D reports the average maturity of WMPs issued by the Big Four banks and SMBs each year. See Appendix A for definitions of all variables.
Panel A: Summary Statistics: Bank Characteristics
Variables Banks Max Min Mean Std. Dev. Equity Big 4 Banks 1507.3 148.0 737.5 281.58 (Billion RMB) SMBs 463.7 2.4 69.9 81.67 Deposit Balance Big 4 Banks 15591.3 3965.6 9660.8 2793.38 (Billion RMB) SMBs 4719.5 27.4 860.0 926.25 Loan Balance Big 4 Banks 10441.7 2638.5 6053.4 1839.74 (Billion RMB) SMBs 3473.4 21.3 610.3 673.45 Capital Ratio Big 4 Banks 0.15 0.00 0.12 0.047 SMBs 0.26 0.06 0.12 0.022 Bank ROA Big 4 Banks .015 .002 .008 .003 SMBs .017 .003 .007 .003 LDR Big 4 Banks 0.76 0.51 0.63 0.061 SMBs 0.93 0.44 0.68 0.076 Overnight SHIBOR Ask Big 4 Banks 4.02 0.81 2.45 0.85 Rate (%) SMBs 3.97 0.82 2.45 0.84
Panel B: List of banks
Big 4 Banks Joint-equity Commercial Banks
Agricultural Bank of China Bank of Communications Industrial and Commercial Bank of China Bohai Bank China Construction Bank China Zheshang Bank Bank of China Hua Xia Bank
Urban Commercial Banks China CITIC Bank Shengjing Bank Shanghai Pudong Development Bank Bank of Beijing China Everbright Bank Bank of Nanjing Guangdong Development Bank Harbin Bank Evergrowing Bank Bank of Chongqing China Merchants Bank Bank of Shanghai China Minsheng Bank Bank of Ningbo Ping An Bank Huishang Bank Industrial Bank
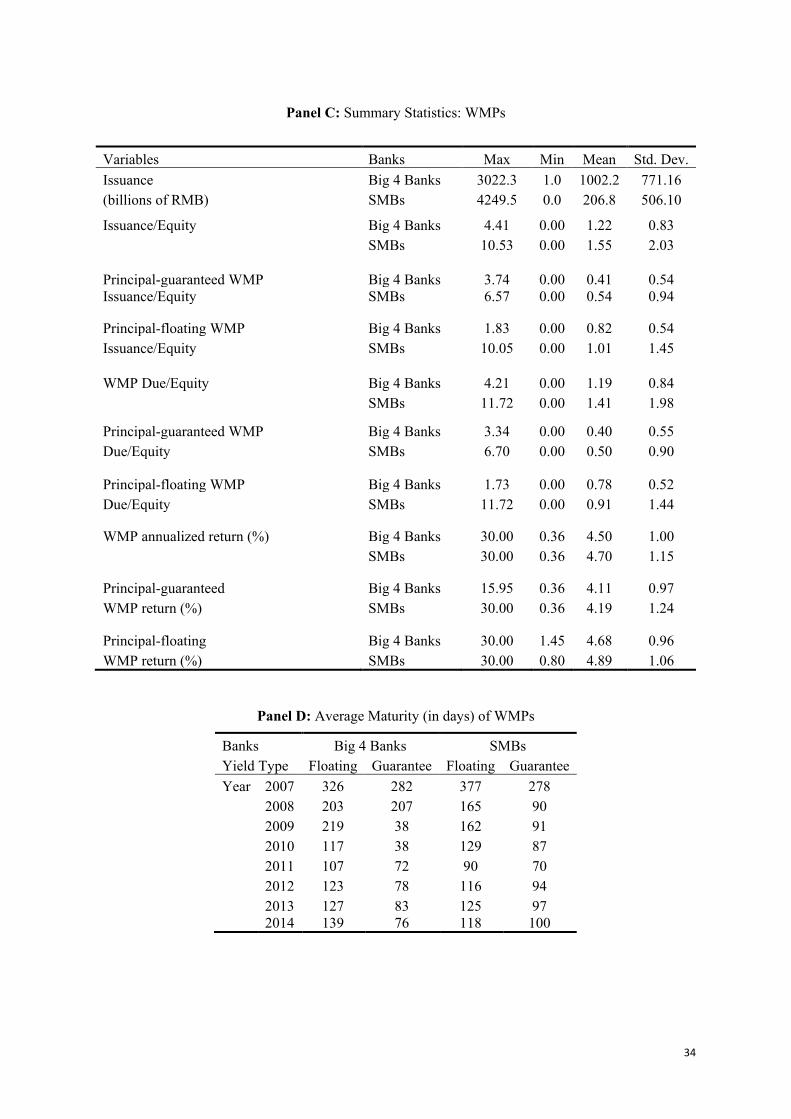
34
Panel C: Summary Statistics: WMPs
Variables Banks Max Min Mean Std. Dev. Issuance Big 4 Banks 3022.3 1.0 1002.2 771.16 (billions of RMB) SMBs 4249.5 0.0 206.8 506.10 Issuance/Equity Big 4 Banks 4.41 0.00 1.22 0.83 SMBs 10.53 0.00 1.55 2.03 Principal-guaranteed WMP Big 4 Banks 3.74 0.00 0.41 0.54 Issuance/Equity SMBs 6.57 0.00 0.54 0.94 Principal-floating WMP Big 4 Banks 1.83 0.00 0.82 0.54 Issuance/Equity SMBs 10.05 0.00 1.01 1.45 WMP Due/Equity Big 4 Banks 4.21 0.00 1.19 0.84 SMBs 11.72 0.00 1.41 1.98 Principal-guaranteed WMP Big 4 Banks 3.34 0.00 0.40 0.55 Due/Equity SMBs 6.70 0.00 0.50 0.90 Principal-floating WMP Big 4 Banks 1.73 0.00 0.78 0.52 Due/Equity SMBs 11.72 0.00 0.91 1.44 WMP annualized return (%) Big 4 Banks 30.00 0.36 4.50 1.00 SMBs 30.00 0.36 4.70 1.15 Principal-guaranteed Big 4 Banks 15.95 0.36 4.11 0.97 WMP return (%) SMBs 30.00 0.36 4.19 1.24 Principal-floating Big 4 Banks 30.00 1.45 4.68 0.96 WMP return (%) SMBs 30.00 0.80 4.89 1.06
Panel D: Average Maturity (in days) of WMPs
Banks Big 4 Banks SMBs Yield Type Floating Guarantee Floating Guarantee Year 2007 326 282 377 278 2008 203 207 165 90 2009 219 38 162 91 2010 117 38 129 87 2011 107 72 90 70 2012 123 78 116 94 2013 127 83 125 97 2014 139 76 118 100
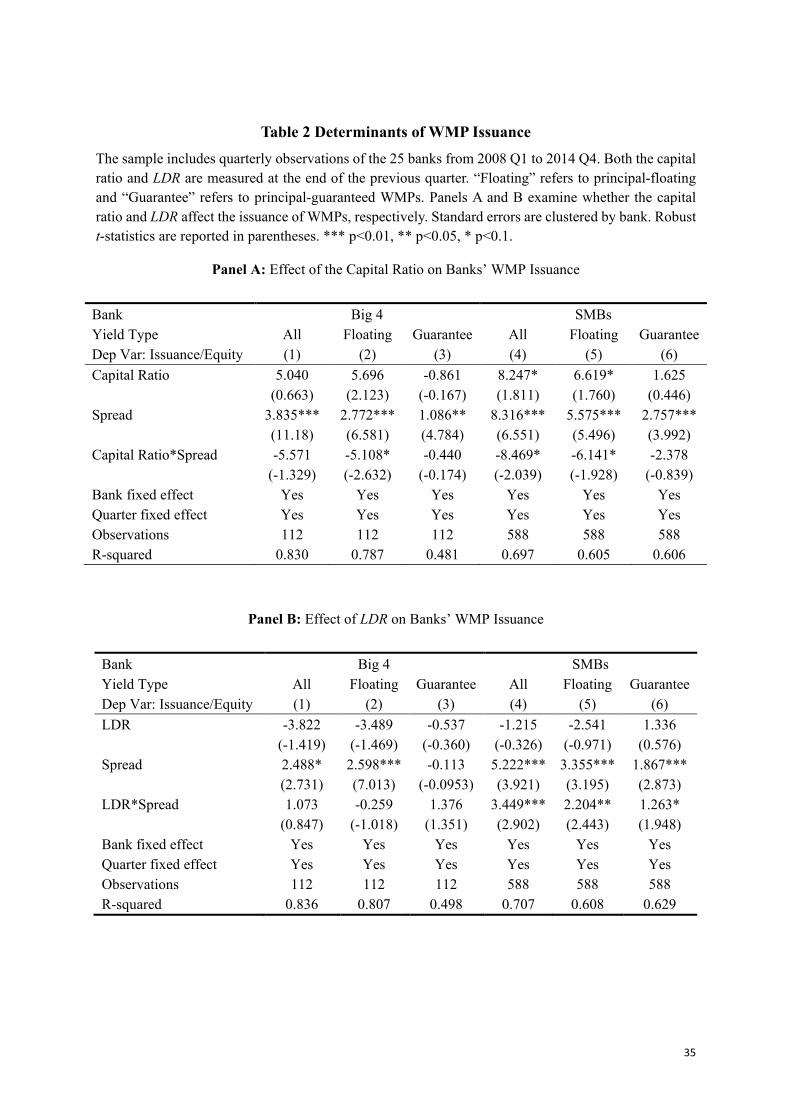
35
Table 2 Determinants of WMP Issuance
The sample includes quarterly observations of the 25 banks from 2008 Q1 to 2014 Q4. Both the capital ratio and LDR are measured at the end of the previous quarter. “Floating” refers to principal-floating and “Guarantee” refers to principal-guaranteed WMPs. Panels A and B examine whether the capital ratio and LDR affect the issuance of WMPs, respectively. Standard errors are clustered by bank. Robust t-statistics are reported in parentheses. *** p<0.01, ** p<0.05, * p<0.1.
Panel A: Effect of the Capital Ratio on Banks’ WMP Issuance
Bank Big 4 SMBs Yield Type All Floating Guarantee All Floating Guarantee Dep Var: Issuance/Equity (1) (2) (3) (4) (5) (6) Capital Ratio 5.040 5.696 -0.861 8.247* 6.619* 1.625 (0.663) (2.123) (-0.167) (1.811) (1.760) (0.446) Spread 3.835*** 2.772*** 1.086** 8.316*** 5.575*** 2.757*** (11.18) (6.581) (4.784) (6.551) (5.496) (3.992) Capital Ratio*Spread -5.571 -5.108* -0.440 -8.469* -6.141* -2.378 (-1.329) (-2.632) (-0.174) (-2.039) (-1.928) (-0.839) Bank fixed effect Yes Yes Yes Yes Yes Yes Quarter fixed effect Yes Yes Yes Yes Yes Yes Observations 112 112 112 588 588 588 R-squared 0.830 0.787 0.481 0.697 0.605 0.606
Panel B: Effect of LDR on Banks’ WMP Issuance
Bank Big 4 SMBs Yield Type All Floating Guarantee All Floating Guarantee Dep Var: Issuance/Equity (1) (2) (3) (4) (5) (6) LDR -3.822 -3.489 -0.537 -1.215 -2.541 1.336 (-1.419) (-1.469) (-0.360) (-0.326) (-0.971) (0.576) Spread 2.488* 2.598*** -0.113 5.222*** 3.355*** 1.867*** (2.731) (7.013) (-0.0953) (3.921) (3.195) (2.873) LDR*Spread 1.073 -0.259 1.376 3.449*** 2.204** 1.263* (0.847) (-1.018) (1.351) (2.902) (2.443) (1.948) Bank fixed effect Yes Yes Yes Yes Yes Yes Quarter fixed effect Yes Yes Yes Yes Yes Yes Observations 112 112 112 588 588 588 R-squared 0.836 0.807 0.498 0.707 0.608 0.629
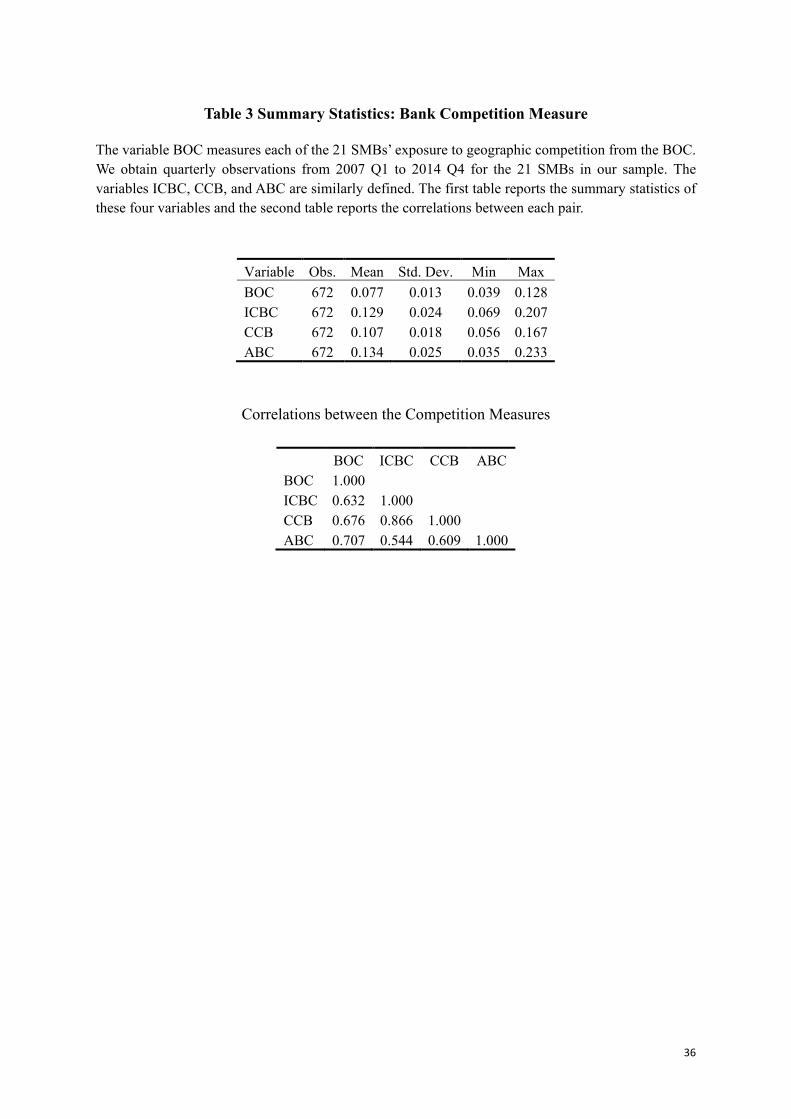
36
Table 3 Summary Statistics: Bank Competition Measure
The variable BOC measures each of the 21 SMBs’ exposure to geographic competition from the BOC. We obtain quarterly observations from 2007 Q1 to 2014 Q4 for the 21 SMBs in our sample. The variables ICBC, CCB, and ABC are similarly defined. The first table reports the summary statistics of these four variables and the second table reports the correlations between each pair.
Variable Obs. Mean Std. Dev. Min Max BOC 672 0.077 0.013 0.039 0.128 ICBC 672 0.129 0.024 0.069 0.207 CCB 672 0.107 0.018 0.056 0.167 ABC 672 0.134 0.025 0.035 0.233
Correlations between the Competition Measures
BOC ICBC CCB ABC BOC 1.000 ICBC 0.632 1.000 CCB 0.676 0.866 1.000 ABC 0.707 0.544 0.609 1.000
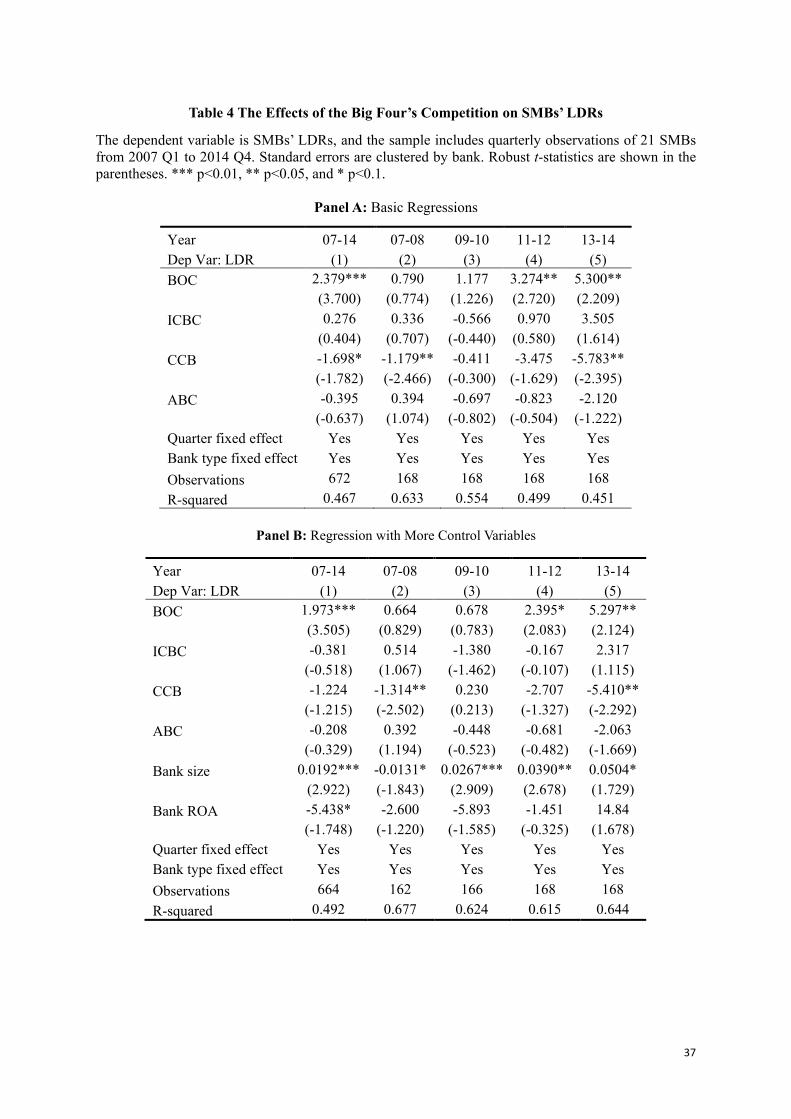
37
Table 4 The Effects of the Big Four’s Competition on SMBs’ LDRs
The dependent variable is SMBs’ LDRs, and the sample includes quarterly observations of 21 SMBs from 2007 Q1 to 2014 Q4. Standard errors are clustered by bank. Robust t-statistics are shown in the parentheses. *** p<0.01, ** p<0.05, and * p<0.1.
Panel A: Basic Regressions
Year 07-14 07-08 09-10 11-12 13-14 Dep Var: LDR (1) (2) (3) (4) (5) BOC 2.379*** 0.790 1.177 3.274** 5.300**
(3.700) (0.774) (1.226) (2.720) (2.209) ICBC 0.276 0.336 -0.566 0.970 3.505
(0.404) (0.707) (-0.440) (0.580) (1.614) CCB -1.698* -1.179** -0.411 -3.475 -5.783**
(-1.782) (-2.466) (-0.300) (-1.629) (-2.395) ABC -0.395 0.394 -0.697 -0.823 -2.120
(-0.637) (1.074) (-0.802) (-0.504) (-1.222) Quarter fixed effect Yes Yes Yes Yes Yes Bank type fixed effect Yes Yes Yes Yes Yes Observations 672 168 168 168 168 R-squared 0.467 0.633 0.554 0.499 0.451
Panel B: Regression with More Control Variables
Year 07-14 07-08 09-10 11-12 13-14 Dep Var: LDR (1) (2) (3) (4) (5) BOC 1.973*** 0.664 0.678 2.395* 5.297**
(3.505) (0.829) (0.783) (2.083) (2.124) ICBC -0.381 0.514 -1.380 -0.167 2.317
(-0.518) (1.067) (-1.462) (-0.107) (1.115) CCB -1.224 -1.314** 0.230 -2.707 -5.410**
(-1.215) (-2.502) (0.213) (-1.327) (-2.292) ABC -0.208 0.392 -0.448 -0.681 -2.063
(-0.329) (1.194) (-0.523) (-0.482) (-1.669) Bank size 0.0192*** -0.0131* 0.0267*** 0.0390** 0.0504*
(2.922) (-1.843) (2.909) (2.678) (1.729) Bank ROA -5.438* -2.600 -5.893 -1.451 14.84
(-1.748) (-1.220) (-1.585) (-0.325) (1.678) Quarter fixed effect Yes Yes Yes Yes Yes Bank type fixed effect Yes Yes Yes Yes Yes Observations 664 162 166 168 168 R-squared 0.492 0.677 0.624 0.615 0.644
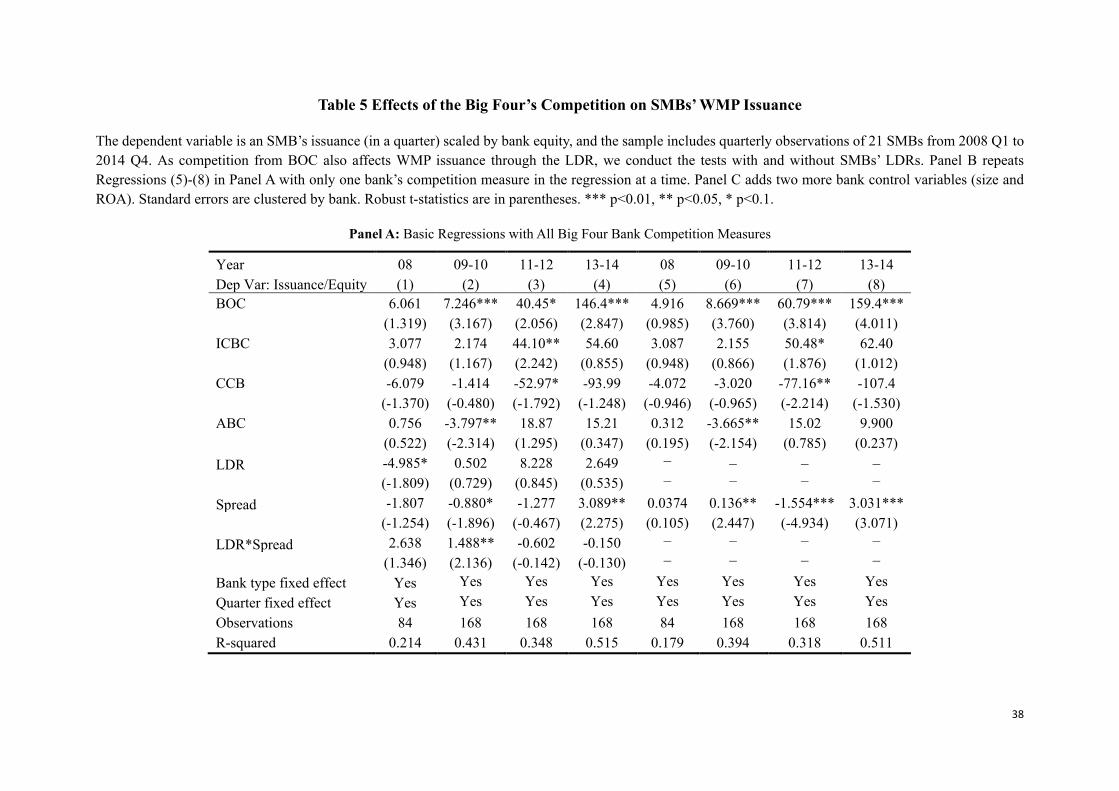
38
Table 5 Effects of the Big Four’s Competition on SMBs’ WMP Issuance
The dependent variable is an SMB’s issuance (in a quarter) scaled by bank equity, and the sample includes quarterly observations of 21 SMBs from 2008 Q1 to 2014 Q4. As competition from BOC also affects WMP issuance through the LDR, we conduct the tests with and without SMBs’ LDRs. Panel B repeats Regressions (5)-(8) in Panel A with only one bank’s competition measure in the regression at a time. Panel C adds two more bank control variables (size and ROA). Standard errors are clustered by bank. Robust t-statistics are in parentheses. *** p<0.01, ** p<0.05, * p<0.1.
Panel A: Basic Regressions with All Big Four Bank Competition Measures
Year 08 09-10 11-12 13-14 08 09-10 11-12 13-14 Dep Var: Issuance/Equity (1) (2) (3) (4) (5) (6) (7) (8) BOC 6.061 7.246*** 40.45* 146.4*** 4.916 8.669*** 60.79*** 159.4*** (1.319) (3.167) (2.056) (2.847) (0.985) (3.760) (3.814) (4.011) ICBC 3.077 2.174 44.10** 54.60 3.087 2.155 50.48* 62.40 (0.948) (1.167) (2.242) (0.855) (0.948) (0.866) (1.876) (1.012) CCB -6.079 -1.414 -52.97* -93.99 -4.072 -3.020 -77.16** -107.4 (-1.370) (-0.480) (-1.792) (-1.248) (-0.946) (-0.965) (-2.214) (-1.530) ABC 0.756 -3.797** 18.87 15.21 0.312 -3.665** 15.02 9.900 (0.522) (-2.314) (1.295) (0.347) (0.195) (-2.154) (0.785) (0.237) LDR -4.985* 0.502 8.228 2.649 − − − − (-1.809) (0.729) (0.845) (0.535) − − − −
Spread -1.807 -0.880* -1.277 3.089** 0.0374 0.136** -1.554*** 3.031***
(-1.254) (-1.896) (-0.467) (2.275) (0.105) (2.447) (-4.934) (3.071) LDR*Spread 2.638 1.488** -0.602 -0.150 − − − −
(1.346) (2.136) (-0.142) (-0.130) − − − − Bank type fixed effect Yes Yes Yes Yes Yes Yes Yes Yes Quarter fixed effect Yes Yes Yes Yes Yes Yes Yes Yes Observations 84 168 168 168 84 168 168 168 R-squared 0.214 0.431 0.348 0.515 0.179 0.394 0.318 0.511
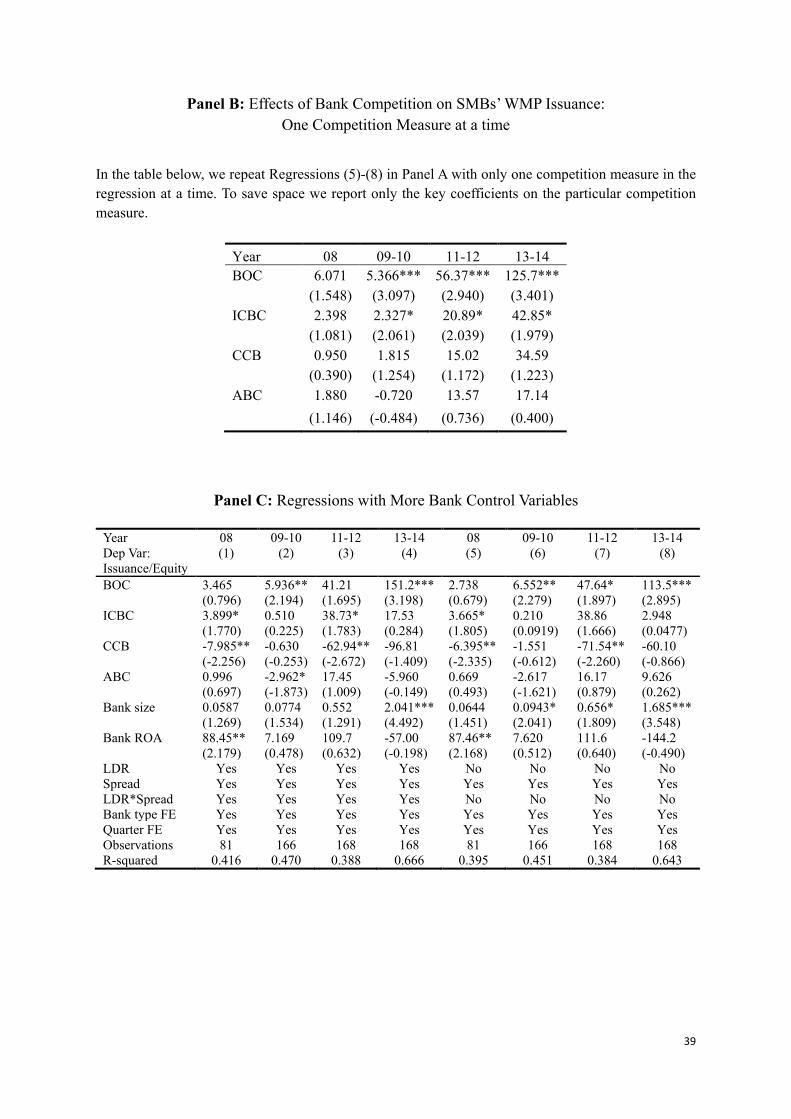
39
Panel B: Effects of Bank Competition on SMBs’ WMP Issuance: One Competition Measure at a time
In the table below, we repeat Regressions (5)-(8) in Panel A with only one competition measure in the regression at a time. To save space we report only the key coefficients on the particular competition measure.
Year 08 09-10 11-12 13-14 BOC 6.071 5.366*** 56.37*** 125.7***
(1.548) (3.097) (2.940) (3.401) ICBC 2.398 2.327* 20.89* 42.85*
(1.081) (2.061) (2.039) (1.979) CCB 0.950 1.815 15.02 34.59
(0.390) (1.254) (1.172) (1.223) ABC 1.880 -0.720 13.57 17.14 (1.146) (-0.484) (0.736) (0.400)
Panel C: Regressions with More Bank Control Variables
Year 08 09-10 11-12 13-14 08 09-10 11-12 13-14 Dep Var: Issuance/Equity
(1) (2) (3) (4) (5) (6) (7) (8)
BOC 3.465 (0.796)
5.936** (2.194)
41.21 (1.695)
151.2*** (3.198)
2.738 (0.679)
6.552** (2.279)
47.64* (1.897)
113.5*** (2.895)
ICBC
3.899* (1.770)
0.510 (0.225)
38.73* (1.783)
17.53 (0.284)
3.665* (1.805)
0.210 (0.0919)
38.86 (1.666)
2.948 (0.0477)
CCB
-7.985** (-2.256)
-0.630 (-0.253)
-62.94** (-2.672)
-96.81 (-1.409)
-6.395** (-2.335)
-1.551 (-0.612)
-71.54** (-2.260)
-60.10 (-0.866)
ABC
0.996 (0.697)
-2.962* (-1.873)
17.45 (1.009)
-5.960 (-0.149)
0.669 (0.493)
-2.617 (-1.621)
16.17 (0.879)
9.626 (0.262)
Bank size
0.0587 (1.269)
0.0774 (1.534)
0.552 (1.291)
2.041*** (4.492)
0.0644 (1.451)
0.0943* (2.041)
0.656* (1.809)
1.685*** (3.548)
Bank ROA
88.45** (2.179)
7.169 (0.478)
109.7 (0.632)
-57.00 (-0.198)
87.46** (2.168)
7.620 (0.512)
111.6 (0.640)
-144.2 (-0.490)
LDR Yes Yes Yes Yes No No No No Spread Yes Yes Yes Yes Yes Yes Yes Yes LDR*Spread Yes Yes Yes Yes No No No No Bank type FE Yes Yes Yes Yes Yes Yes Yes Yes Quarter FE Yes Yes Yes Yes Yes Yes Yes Yes Observations 81 166 168 168 81 166 168 168 R-squared 0.416 0.470 0.388 0.666 0.395 0.451 0.384 0.643
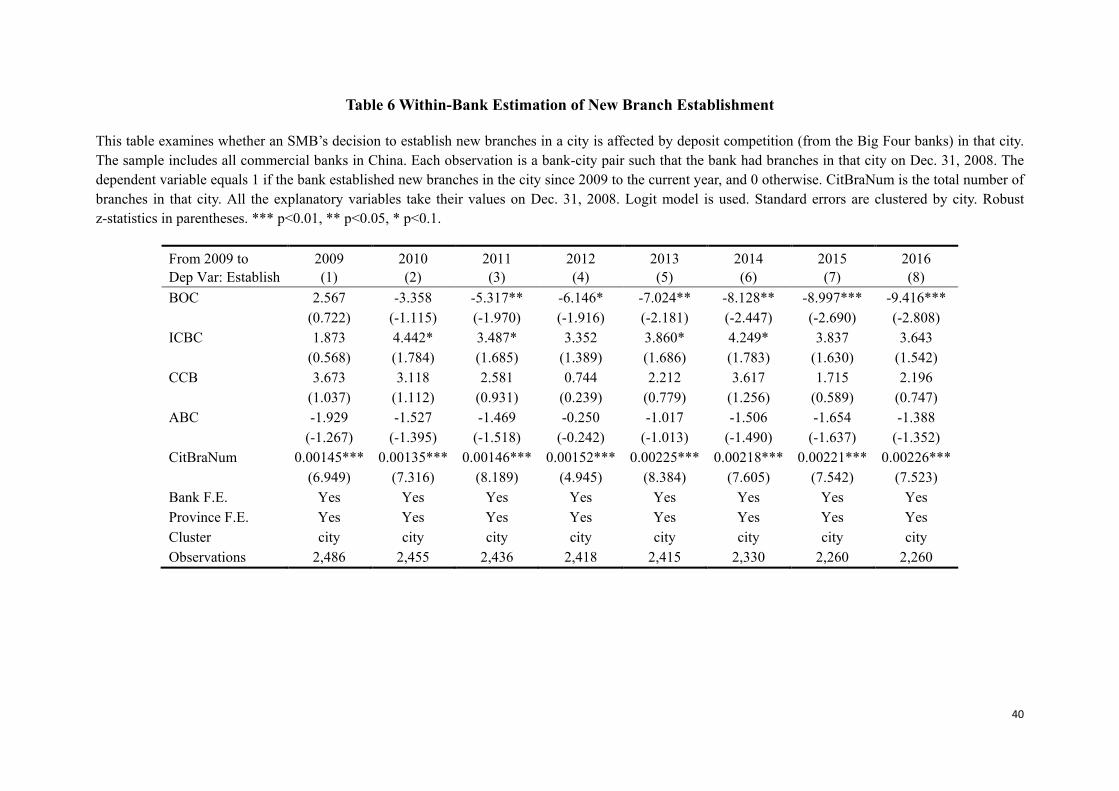
40
Table 6 Within-Bank Estimation of New Branch Establishment
This table examines whether an SMB’s decision to establish new branches in a city is affected by deposit competition (from the Big Four banks) in that city. The sample includes all commercial banks in China. Each observation is a bank-city pair such that the bank had branches in that city on Dec. 31, 2008. The dependent variable equals 1 if the bank established new branches in the city since 2009 to the current year, and 0 otherwise. CitBraNum is the total number of branches in that city. All the explanatory variables take their values on Dec. 31, 2008. Logit model is used. Standard errors are clustered by city. Robust z-statistics in parentheses. *** p<0.01, ** p<0.05, * p<0.1.
From 2009 to 2009 2010 2011 2012 2013 2014 2015 2016 Dep Var: Establish (1) (2) (3) (4) (5) (6) (7) (8) BOC 2.567 -3.358 -5.317** -6.146* -7.024** -8.128** -8.997*** -9.416***
(0.722) (-1.115) (-1.970) (-1.916) (-2.181) (-2.447) (-2.690) (-2.808) ICBC 1.873 4.442* 3.487* 3.352 3.860* 4.249* 3.837 3.643
(0.568) (1.784) (1.685) (1.389) (1.686) (1.783) (1.630) (1.542) CCB 3.673 3.118 2.581 0.744 2.212 3.617 1.715 2.196
(1.037) (1.112) (0.931) (0.239) (0.779) (1.256) (0.589) (0.747) ABC -1.929 -1.527 -1.469 -0.250 -1.017 -1.506 -1.654 -1.388
(-1.267) (-1.395) (-1.518) (-0.242) (-1.013) (-1.490) (-1.637) (-1.352) CitBraNum 0.00145*** 0.00135*** 0.00146*** 0.00152*** 0.00225*** 0.00218*** 0.00221*** 0.00226***
(6.949) (7.316) (8.189) (4.945) (8.384) (7.605) (7.542) (7.523) Bank F.E. Yes Yes Yes Yes Yes Yes Yes Yes Province F.E. Yes Yes Yes Yes Yes Yes Yes Yes Cluster city city city city city city city city Observations 2,486 2,455 2,436 2,418 2,415 2,330 2,260 2,260
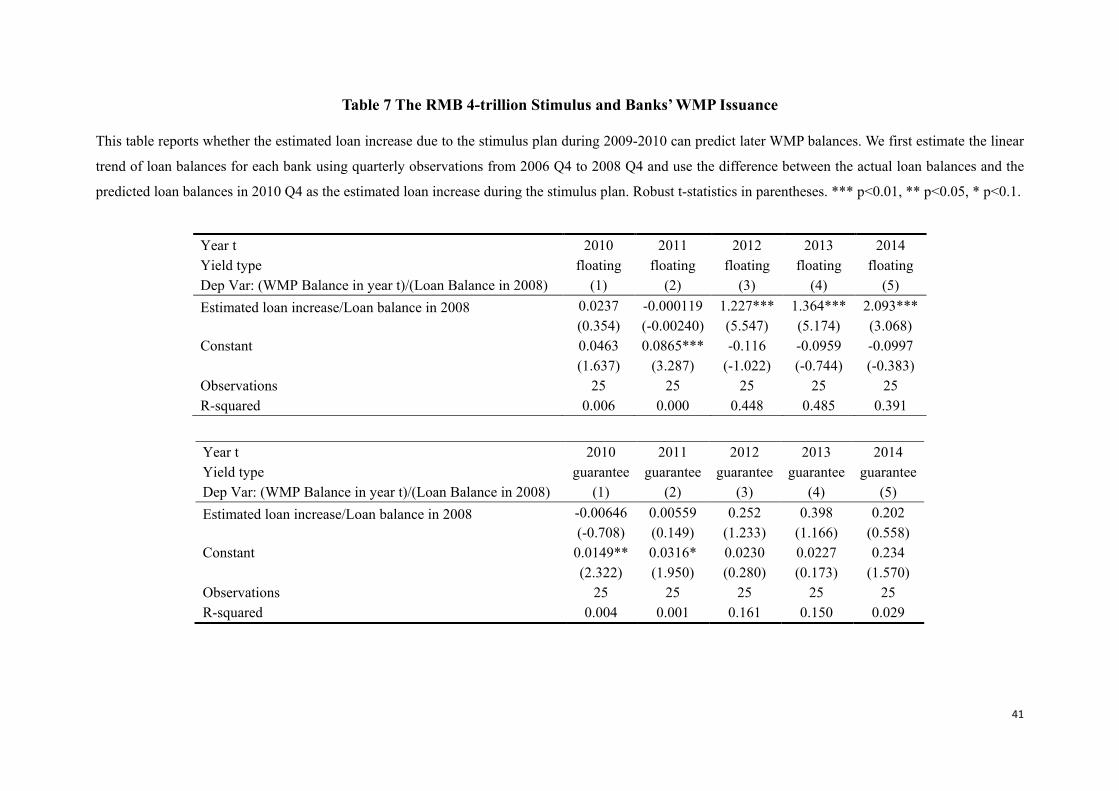
41
Table 7 The RMB 4-trillion Stimulus and Banks’ WMP Issuance
This table reports whether the estimated loan increase due to the stimulus plan during 2009-2010 can predict later WMP balances. We first estimate the linear
trend of loan balances for each bank using quarterly observations from 2006 Q4 to 2008 Q4 and use the difference between the actual loan balances and the
predicted loan balances in 2010 Q4 as the estimated loan increase during the stimulus plan. Robust t-statistics in parentheses. *** p<0.01, ** p<0.05, * p<0.1.
Year t 2010 2011 2012 2013 2014 Yield type floating floating floating floating floating Dep Var: (WMP Balance in year t)/(Loan Balance in 2008) (1) (2) (3) (4) (5) Estimated loan increase/Loan balance in 2008 0.0237 -0.000119 1.227*** 1.364*** 2.093*** (0.354) (-0.00240) (5.547) (5.174) (3.068) Constant 0.0463 0.0865*** -0.116 -0.0959 -0.0997 (1.637) (3.287) (-1.022) (-0.744) (-0.383) Observations 25 25 25 25 25 R-squared 0.006 0.000 0.448 0.485 0.391
Year t 2010 2011 2012 2013 2014 Yield type guarantee guarantee guarantee guarantee guarantee Dep Var: (WMP Balance in year t)/(Loan Balance in 2008) (1) (2) (3) (4) (5) Estimated loan increase/Loan balance in 2008 -0.00646 0.00559 0.252 0.398 0.202 (-0.708) (0.149) (1.233) (1.166) (0.558) Constant 0.0149** 0.0316* 0.0230 0.0227 0.234 (2.322) (1.950) (0.280) (0.173) (1.570) Observations 25 25 25 25 25 R-squared 0.004 0.001 0.161 0.150 0.029
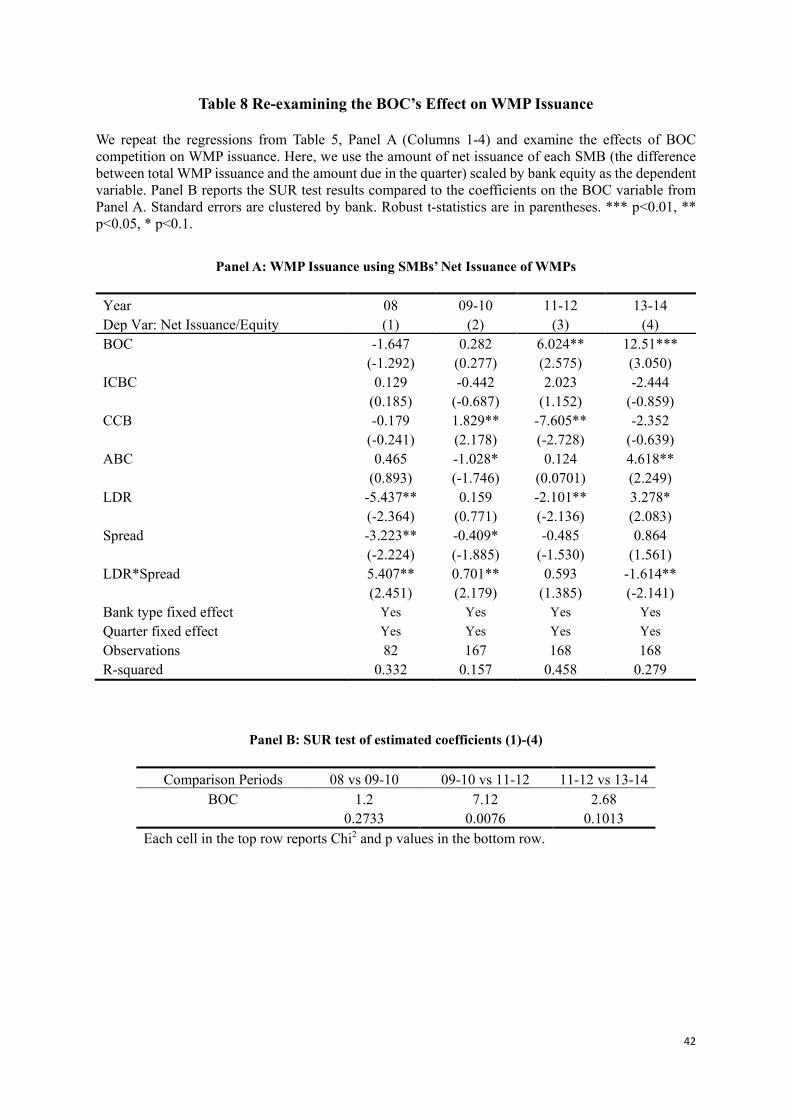
42
Table 8 Re-examining the BOC’s Effect on WMP Issuance
We repeat the regressions from Table 5, Panel A (Columns 1-4) and examine the effects of BOC competition on WMP issuance. Here, we use the amount of net issuance of each SMB (the difference between total WMP issuance and the amount due in the quarter) scaled by bank equity as the dependent variable. Panel B reports the SUR test results compared to the coefficients on the BOC variable from Panel A. Standard errors are clustered by bank. Robust t-statistics are in parentheses. *** p<0.01, ** p<0.05, * p<0.1.
Panel A: WMP Issuance using SMBs’ Net Issuance of WMPs
Year 08 09-10 11-12 13-14 Dep Var: Net Issuance/Equity (1) (2) (3) (4) BOC -1.647 0.282 6.024** 12.51***
(-1.292) (0.277) (2.575) (3.050) ICBC 0.129 -0.442 2.023 -2.444
(0.185) (-0.687) (1.152) (-0.859) CCB -0.179 1.829** -7.605** -2.352
(-0.241) (2.178) (-2.728) (-0.639) ABC 0.465 -1.028* 0.124 4.618**
(0.893) (-1.746) (0.0701) (2.249) LDR -5.437** 0.159 -2.101** 3.278*
(-2.364) (0.771) (-2.136) (2.083) Spread -3.223** -0.409* -0.485 0.864
(-2.224) (-1.885) (-1.530) (1.561) LDR*Spread 5.407** 0.701** 0.593 -1.614**
(2.451) (2.179) (1.385) (-2.141) Bank type fixed effect Yes Yes Yes Yes Quarter fixed effect Yes Yes Yes Yes Observations 82 167 168 168 R-squared 0.332 0.157 0.458 0.279
Panel B: SUR test of estimated coefficients (1)-(4)
Comparison Periods 08 vs 09-10 09-10 vs 11-12 11-12 vs 13-14
BOC 1.2 7.12 2.68 0.2733 0.0076 0.1013
Each cell in the top row reports Chi2 and p values in the bottom row.
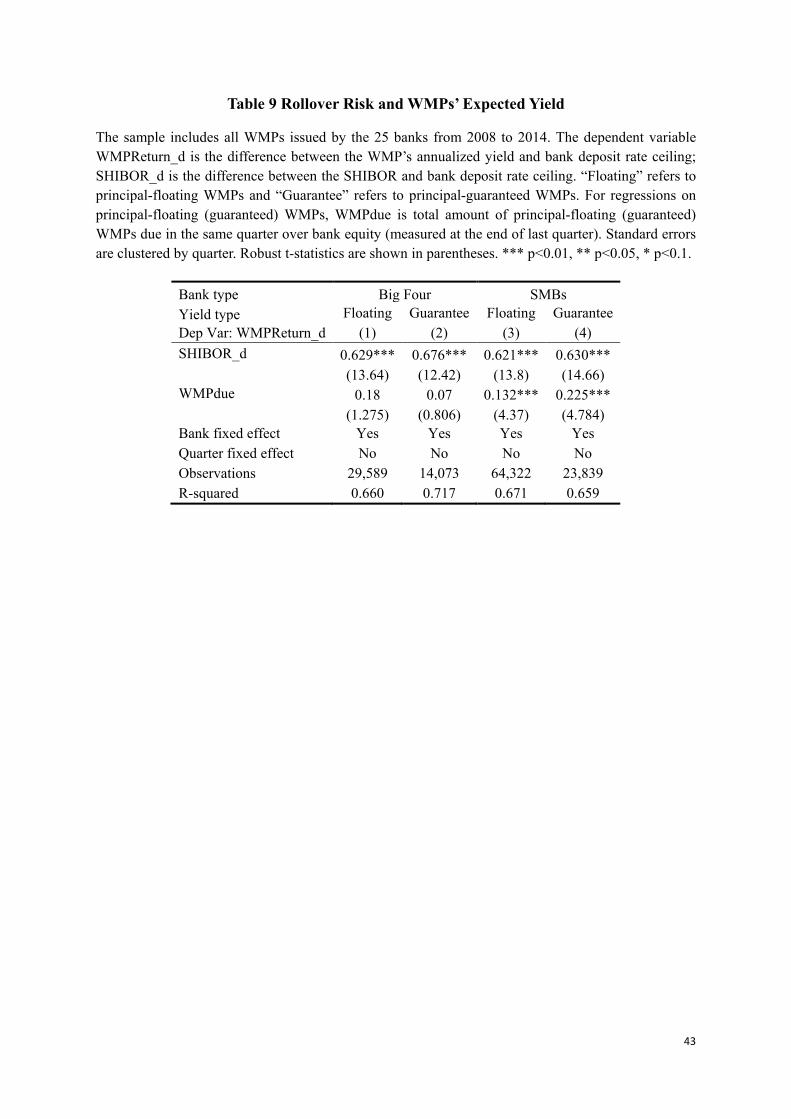
43
Table 9 Rollover Risk and WMPs’ Expected Yield
The sample includes all WMPs issued by the 25 banks from 2008 to 2014. The dependent variable WMPReturn_d is the difference between the WMP’s annualized yield and bank deposit rate ceiling; SHIBOR_d is the difference between the SHIBOR and bank deposit rate ceiling. “Floating” refers to principal-floating WMPs and “Guarantee” refers to principal-guaranteed WMPs. For regressions on principal-floating (guaranteed) WMPs, WMPdue is total amount of principal-floating (guaranteed) WMPs due in the same quarter over bank equity (measured at the end of last quarter). Standard errors are clustered by quarter. Robust t-statistics are shown in parentheses. *** p<0.01, ** p<0.05, * p<0.1.
Bank type Big Four SMBs Yield type Floating Guarantee Floating Guarantee Dep Var: WMPReturn_d (1) (2) (3) (4) SHIBOR_d 0.629*** 0.676*** 0.621*** 0.630*** (13.64) (12.42) (13.8) (14.66) WMPdue 0.18 0.07 0.132*** 0.225*** (1.275) (0.806) (4.37) (4.784) Bank fixed effect Yes Yes Yes Yes Quarter fixed effect No No No No Observations 29,589 14,073 64,322 23,839 R-squared 0.660 0.717 0.671 0.659
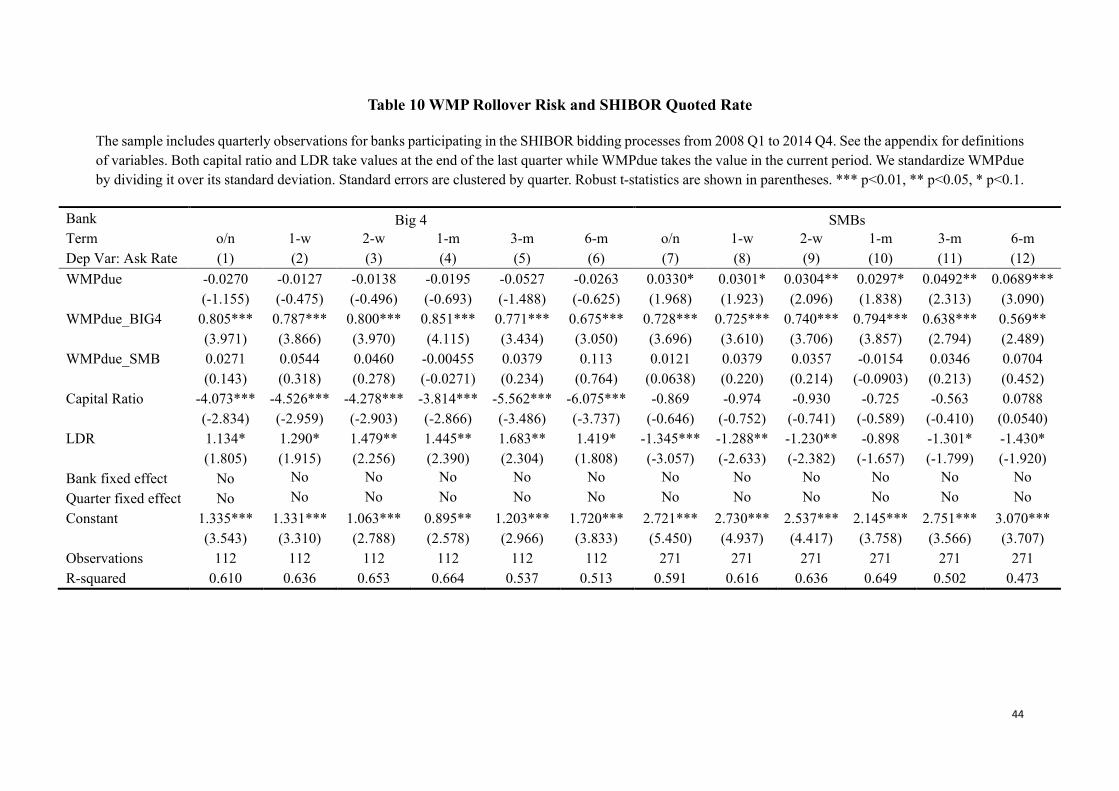
44
Table 10 WMP Rollover Risk and SHIBOR Quoted Rate
The sample includes quarterly observations for banks participating in the SHIBOR bidding processes from 2008 Q1 to 2014 Q4. See the appendix for definitions of variables. Both capital ratio and LDR take values at the end of the last quarter while WMPdue takes the value in the current period. We standardize WMPdue by dividing it over its standard deviation. Standard errors are clustered by quarter. Robust t-statistics are shown in parentheses. *** p<0.01, ** p<0.05, * p<0.1.
Bank Big 4 SMBs Term o/n 1-w 2-w 1-m 3-m 6-m o/n 1-w 2-w 1-m 3-m 6-m Dep Var: Ask Rate (1) (2) (3) (4) (5) (6) (7) (8) (9) (10) (11) (12) WMPdue -0.0270 -0.0127 -0.0138 -0.0195 -0.0527 -0.0263 0.0330* 0.0301* 0.0304** 0.0297* 0.0492** 0.0689***
(-1.155) (-0.475) (-0.496) (-0.693) (-1.488) (-0.625) (1.968) (1.923) (2.096) (1.838) (2.313) (3.090) WMPdue_BIG4 0.805*** 0.787*** 0.800*** 0.851*** 0.771*** 0.675*** 0.728*** 0.725*** 0.740*** 0.794*** 0.638*** 0.569**
(3.971) (3.866) (3.970) (4.115) (3.434) (3.050) (3.696) (3.610) (3.706) (3.857) (2.794) (2.489) WMPdue_SMB 0.0271 0.0544 0.0460 -0.00455 0.0379 0.113 0.0121 0.0379 0.0357 -0.0154 0.0346 0.0704
(0.143) (0.318) (0.278) (-0.0271) (0.234) (0.764) (0.0638) (0.220) (0.214) (-0.0903) (0.213) (0.452) Capital Ratio -4.073*** -4.526*** -4.278*** -3.814*** -5.562*** -6.075*** -0.869 -0.974 -0.930 -0.725 -0.563 0.0788
(-2.834) (-2.959) (-2.903) (-2.866) (-3.486) (-3.737) (-0.646) (-0.752) (-0.741) (-0.589) (-0.410) (0.0540) LDR 1.134* 1.290* 1.479** 1.445** 1.683** 1.419* -1.345*** -1.288** -1.230** -0.898 -1.301* -1.430*
(1.805) (1.915) (2.256) (2.390) (2.304) (1.808) (-3.057) (-2.633) (-2.382) (-1.657) (-1.799) (-1.920) Bank fixed effect No No No No No No No No No No No No Quarter fixed effect No No No No No No No No No No No No Constant 1.335*** 1.331*** 1.063*** 0.895** 1.203*** 1.720*** 2.721*** 2.730*** 2.537*** 2.145*** 2.751*** 3.070***
(3.543) (3.310) (2.788) (2.578) (2.966) (3.833) (5.450) (4.937) (4.417) (3.758) (3.566) (3.707) Observations 112 112 112 112 112 112 271 271 271 271 271 271 R-squared 0.610 0.636 0.653 0.664 0.537 0.513 0.591 0.616 0.636 0.649 0.502 0.473
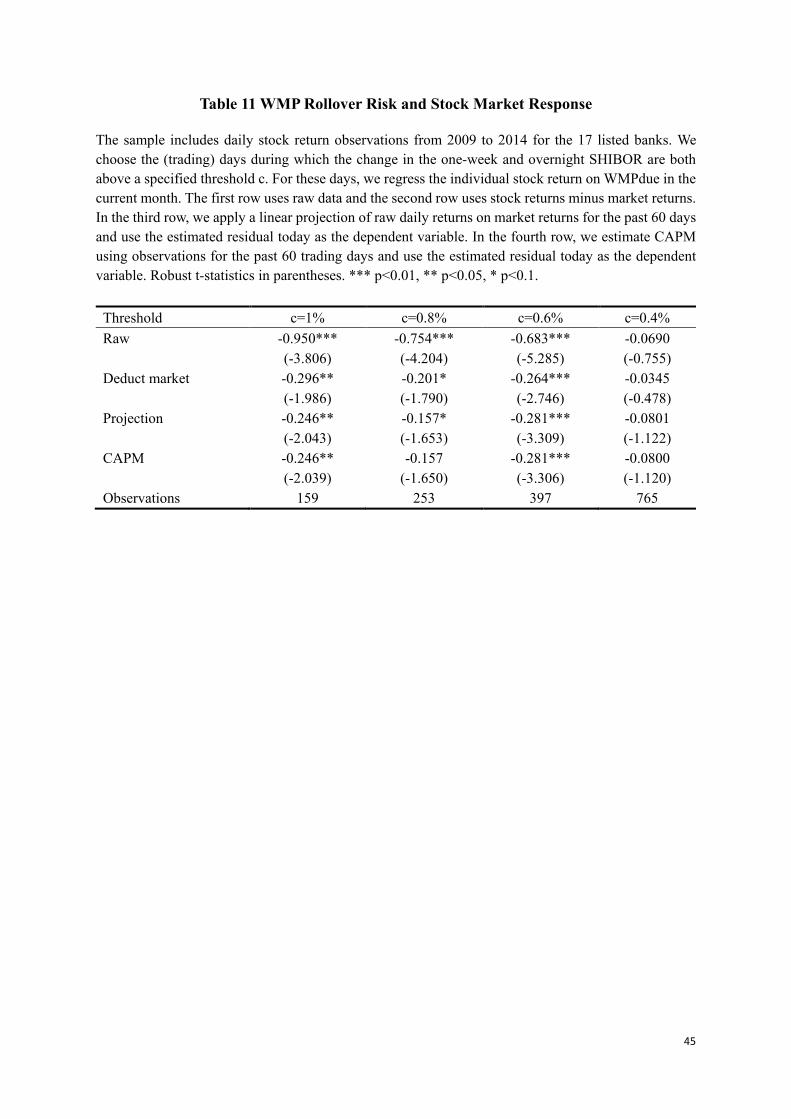
45
Table 11 WMP Rollover Risk and Stock Market Response
The sample includes daily stock return observations from 2009 to 2014 for the 17 listed banks. We choose the (trading) days during which the change in the one-week and overnight SHIBOR are both above a specified threshold c. For these days, we regress the individual stock return on WMPdue in the current month. The first row uses raw data and the second row uses stock returns minus market returns. In the third row, we apply a linear projection of raw daily returns on market returns for the past 60 days and use the estimated residual today as the dependent variable. In the fourth row, we estimate CAPM using observations for the past 60 trading days and use the estimated residual today as the dependent variable. Robust t-statistics in parentheses. *** p<0.01, ** p<0.05, * p<0.1.
Threshold c=1% c=0.8% c=0.6% c=0.4% Raw -0.950*** -0.754*** -0.683*** -0.0690 (-3.806) (-4.204) (-5.285) (-0.755) Deduct market -0.296** -0.201* -0.264*** -0.0345 (-1.986) (-1.790) (-2.746) (-0.478) Projection -0.246** -0.157* -0.281*** -0.0801 (-2.043) (-1.653) (-3.309) (-1.122) CAPM -0.246** -0.157 -0.281*** -0.0800 (-2.039) (-1.650) (-3.306) (-1.120) Observations 159 253 397 765
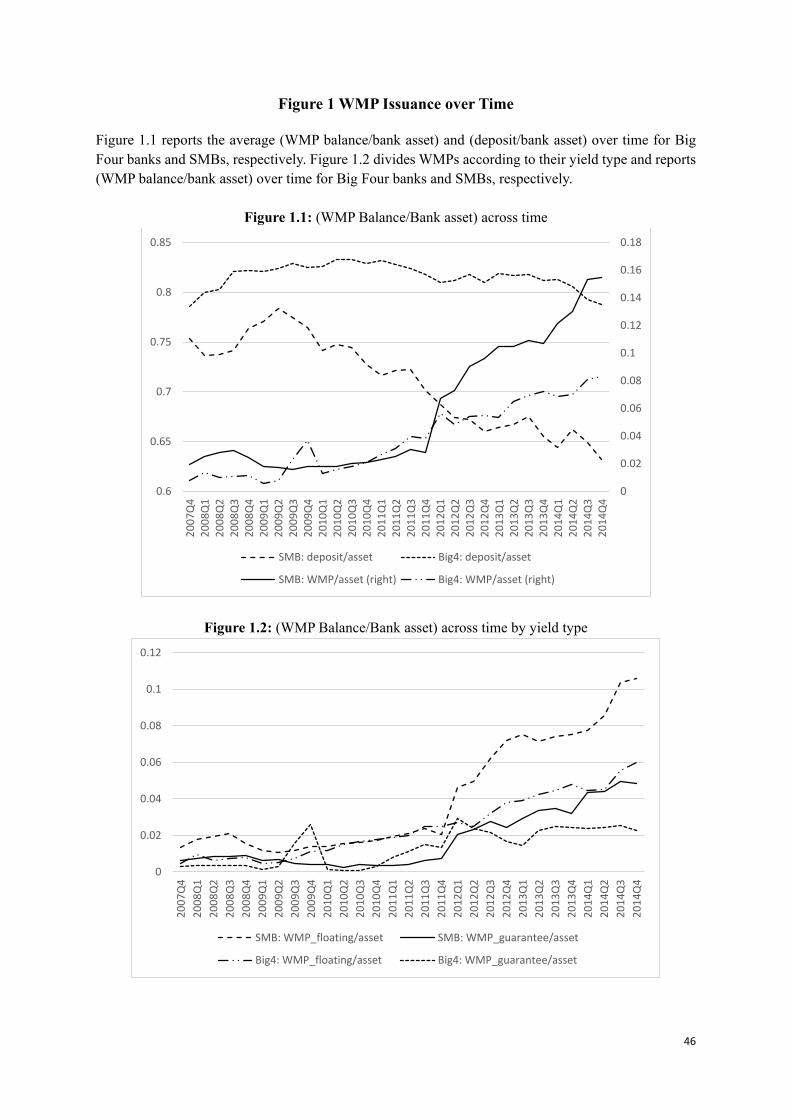
46
Figure 1 WMP Issuance over Time
Figure 1.1 reports the average (WMP balance/bank asset) and (deposit/bank asset) over time for Big Four banks and SMBs, respectively. Figure 1.2 divides WMPs according to their yield type and reports (WMP balance/bank asset) over time for Big Four banks and SMBs, respectively.
Figure 1.1: (WMP Balance/Bank asset) across time
Figure 1.2: (WMP Balance/Bank asset) across time by yield type
0
0.02
0.04
0.06
0.08
0.1
0.12
0.14
0.16
0.18
0.6
0.65
0.7
0.75
0.8
0.85
2007
Q4
2008
Q1
2008
Q2
2008
Q3
2008
Q4
2009
Q1
2009
Q2
2009
Q3
2009
Q4
2010
Q1
2010
Q2
2010
Q3
2010
Q4
2011
Q1
2011
Q2
2011
Q3
2011
Q4
2012
Q1
2012
Q2
2012
Q3
2012
Q4
2013
Q1
2013
Q2
2013
Q3
2013
Q4
2014
Q1
2014
Q2
2014
Q3
2014
Q4
SMB: deposit/asset Big4: deposit/asset
SMB: WMP/asset (right) Big4: WMP/asset (right)
0
0.02
0.04
0.06
0.08
0.1
0.12
2007
Q4
2008
Q1
2008
Q2
2008
Q3
2008
Q4
2009
Q1
2009
Q2
2009
Q3
2009
Q4
2010
Q1
2010
Q2
2010
Q3
2010
Q4
2011
Q1
2011
Q2
2011
Q3
2011
Q4
2012
Q1
2012
Q2
2012
Q3
2012
Q4
2013
Q1
2013
Q2
2013
Q3
2013
Q4
2014
Q1
2014
Q2
2014
Q3
2014
Q4
SMB: WMP_floating/asset SMB: WMP_guarantee/asset
Big4: WMP_floating/asset Big4: WMP_guarantee/asset
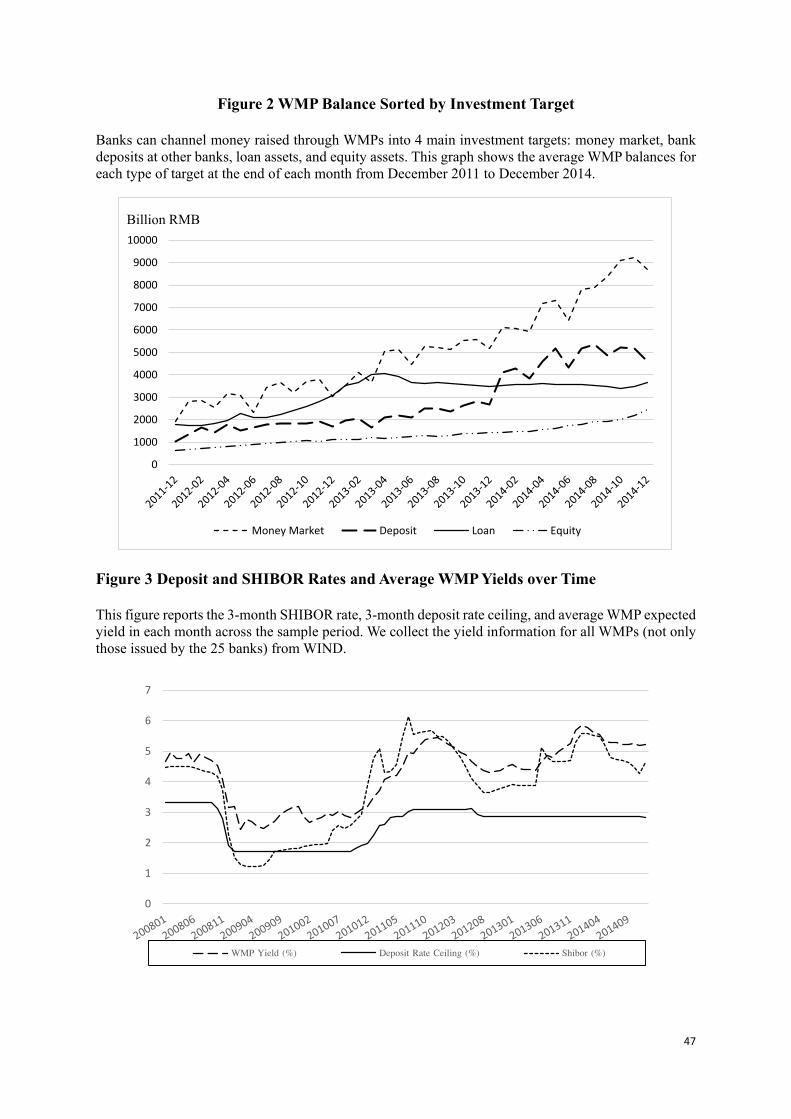
47
Figure 2 WMP Balance Sorted by Investment Target
Banks can channel money raised through WMPs into 4 main investment targets: money market, bank deposits at other banks, loan assets, and equity assets. This graph shows the average WMP balances for each type of target at the end of each month from December 2011 to December 2014.
Figure 3 Deposit and SHIBOR Rates and Average WMP Yields over Time This figure reports the 3-month SHIBOR rate, 3-month deposit rate ceiling, and average WMP expected yield in each month across the sample period. We collect the yield information for all WMPs (not only those issued by the 25 banks) from WIND.
0
1000
2000
3000
4000
5000
6000
7000
8000
9000
10000
Billion RMB
Money Market Deposit Loan Equity
0
1
2
3
4
5
6
7
WMP Yield (%) Deposit Rate Ceiling (%) Shibor (%)

48
Figure 4 Banks’ Activities during the RMB 4-trillion Stimulus Plan
Figure 4.1 shows total loan balance (both short- and medium-/long-term) of all national SMBs and the Big Four banks, respectively. Data for SMBs is only available from 2010. Figure 4.2 presents the total loan balance of the Big Four banks only. For comparison, we scale each by the bank’s loan balance at the end of 2008, the beginning of the Stimulus plan. Figure 4.3 focuses on the Big Four’s LDRs, while Figure 4.4 exhibits their total deposit balance.
Figure 4.1: Total Loan Balance of all National Banks
Figure 4.2: Total Loan Balance of the Big Four Banks
0
2
4
6
8
10
12
14
16trillion RMB
SMB_short-term SMB_medium and long-termBig 4 banks_short-term Big 4 banks_medium and long-term
0.60
0.80
1.00
1.20
1.40
1.60
1.80
2.00
ABC ICBC CCB BOC
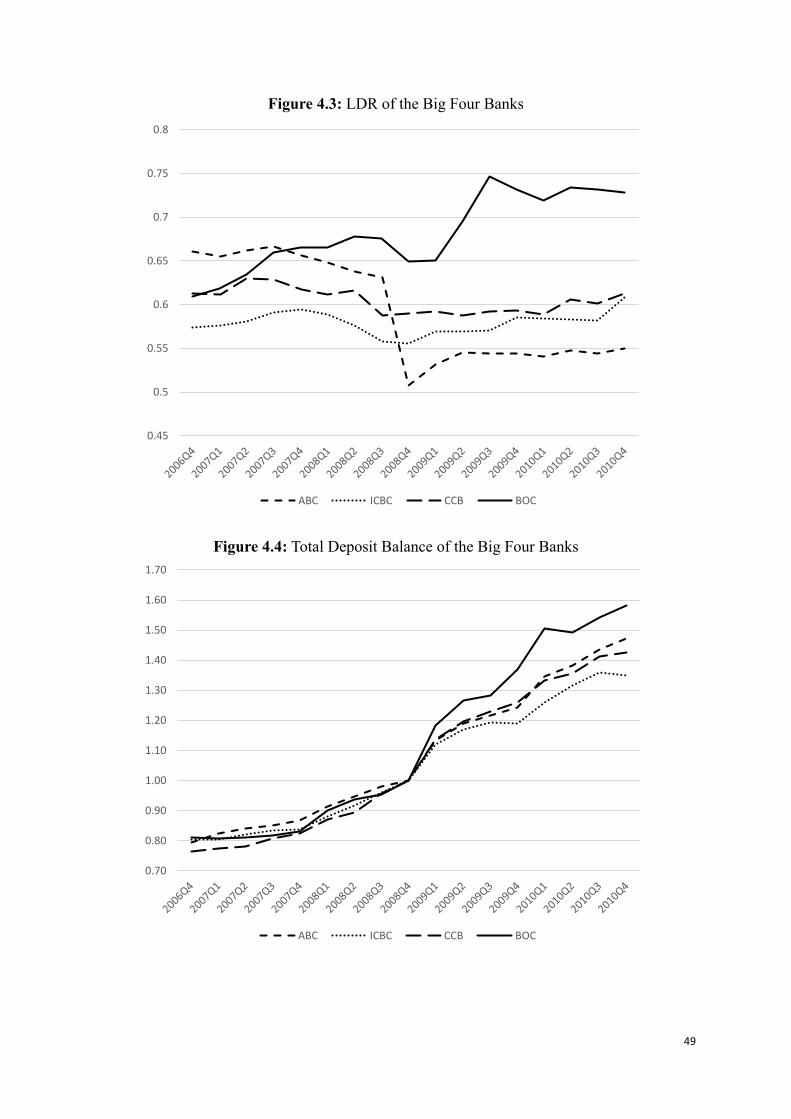
49
Figure 4.3: LDR of the Big Four Banks
Figure 4.4: Total Deposit Balance of the Big Four Banks
0.45
0.5
0.55
0.6
0.65
0.7
0.75
0.8
ABC ICBC CCB BOC
0.70
0.80
0.90
1.00
1.10
1.20
1.30
1.40
1.50
1.60
1.70
ABC ICBC CCB BOC
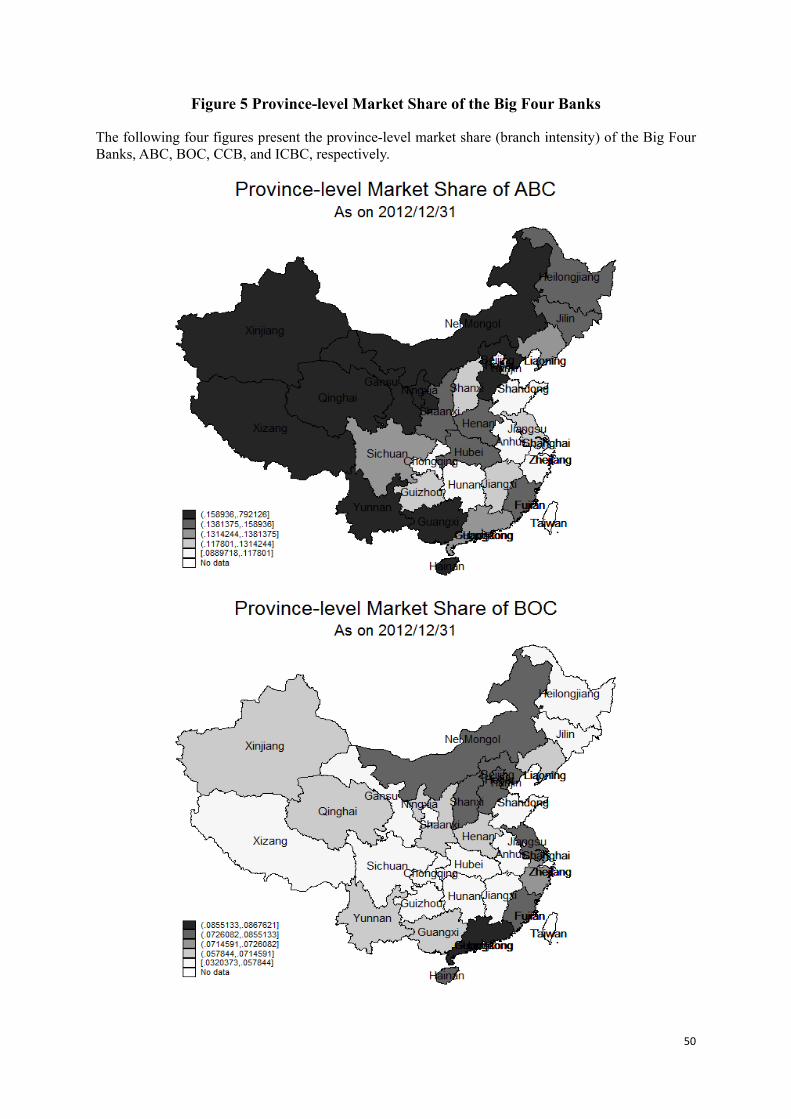
50
Figure 5 Province-level Market Share of the Big Four Banks
The following four figures present the province-level market share (branch intensity) of the Big Four Banks, ABC, BOC, CCB, and ICBC, respectively.
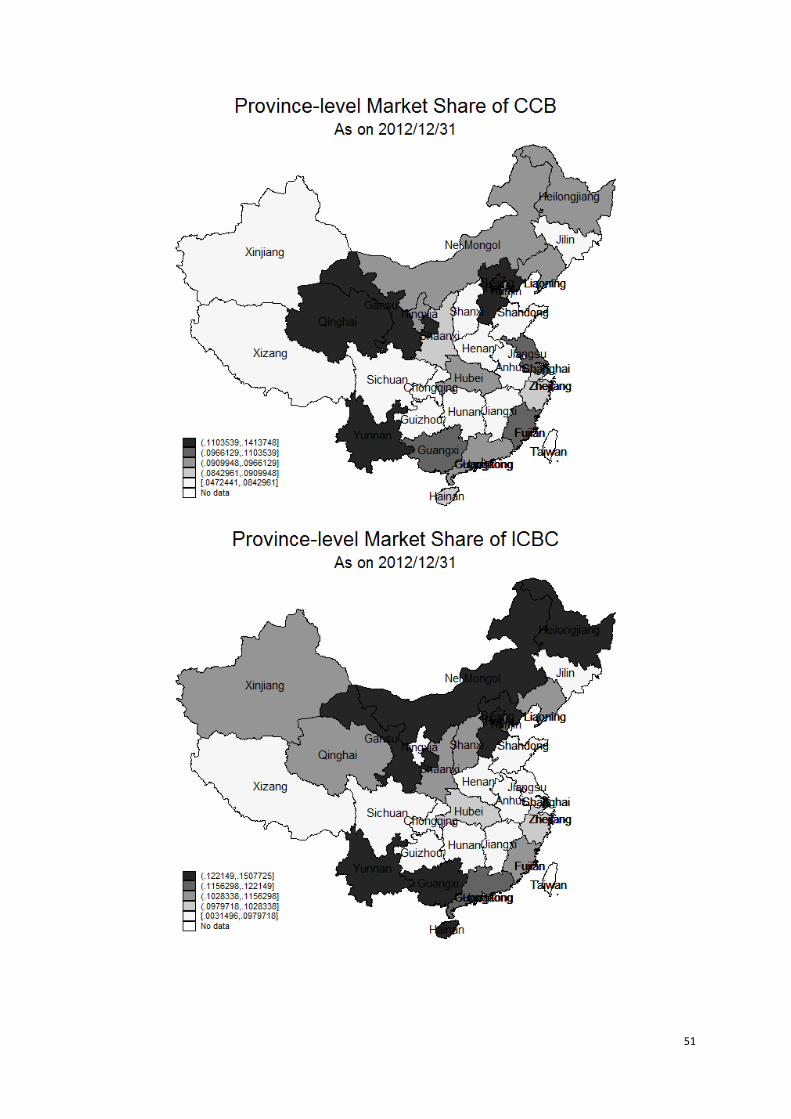
51
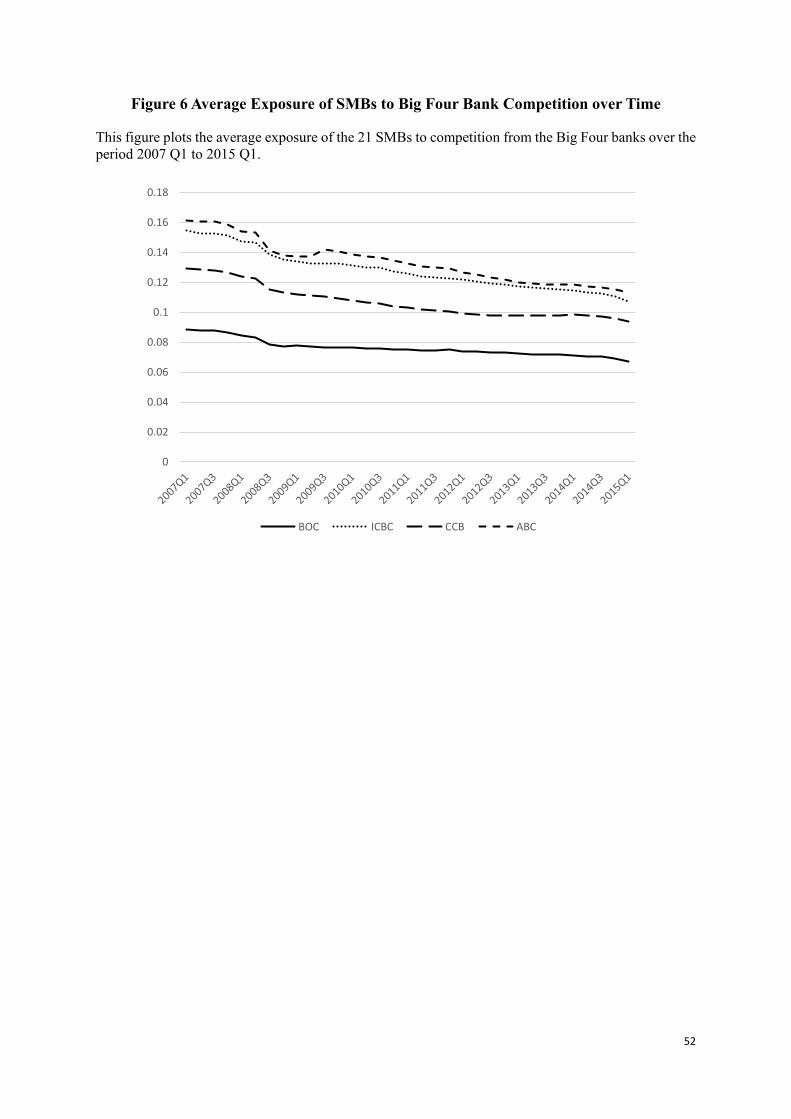
52
Figure 6 Average Exposure of SMBs to Big Four Bank Competition over Time
This figure plots the average exposure of the 21 SMBs to competition from the Big Four banks over the period 2007 Q1 to 2015 Q1.
0
0.02
0.04
0.06
0.08
0.1
0.12
0.14
0.16
0.18
BOC ICBC CCB ABC
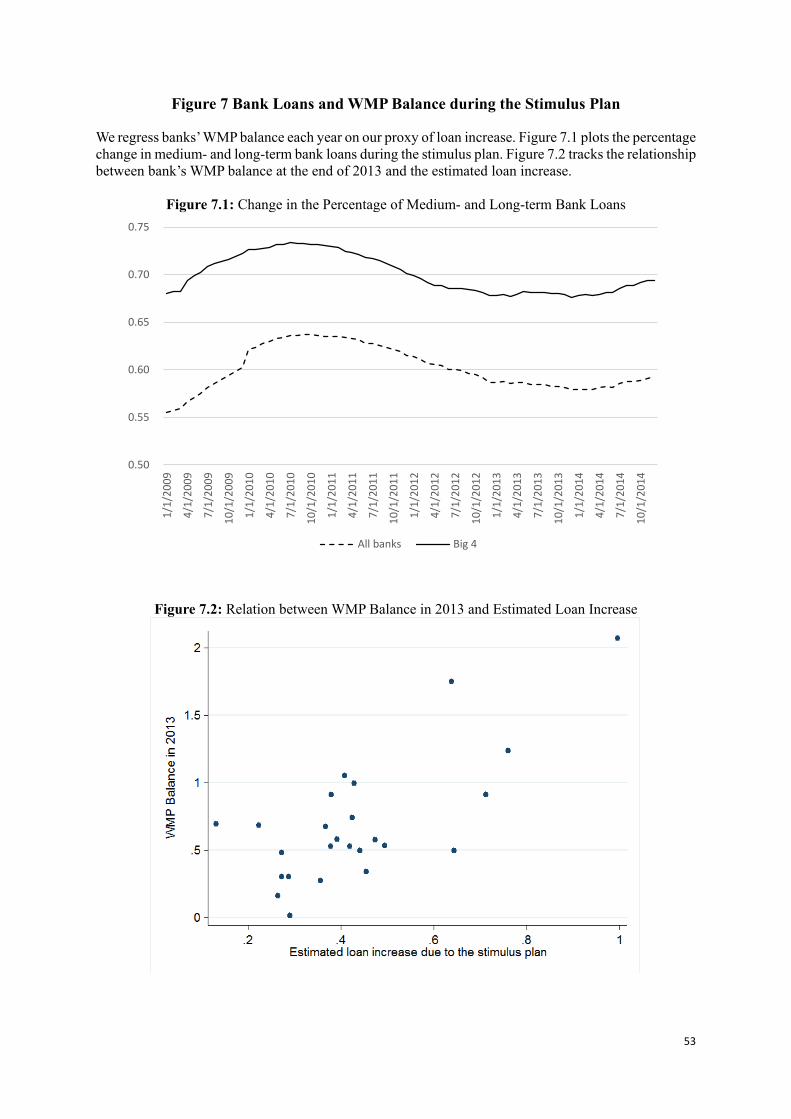
53
Figure 7 Bank Loans and WMP Balance during the Stimulus Plan
We regress banks’ WMP balance each year on our proxy of loan increase. Figure 7.1 plots the percentage change in medium- and long-term bank loans during the stimulus plan. Figure 7.2 tracks the relationship between bank’s WMP balance at the end of 2013 and the estimated loan increase.
Figure 7.1: Change in the Percentage of Medium- and Long-term Bank Loans
Figure 7.2: Relation between WMP Balance in 2013 and Estimated Loan Increase
0.50
0.55
0.60
0.65
0.70
0.75
1/1/
2009
4/1/
2009
7/1/
2009
10/1
/200
9
1/1/
2010
4/1/
2010
7/1/
2010
10/1
/201
0
1/1/
2011
4/1/
2011
7/1/
2011
10/1
/201
1
1/1/
2012
4/1/
2012
7/1/
2012
10/1
/201
2
1/1/
2013
4/1/
2013
7/1/
2013
10/1
/201
3
1/1/
2014
4/1/
2014
7/1/
2014
10/1
/201
4
All banks Big 4
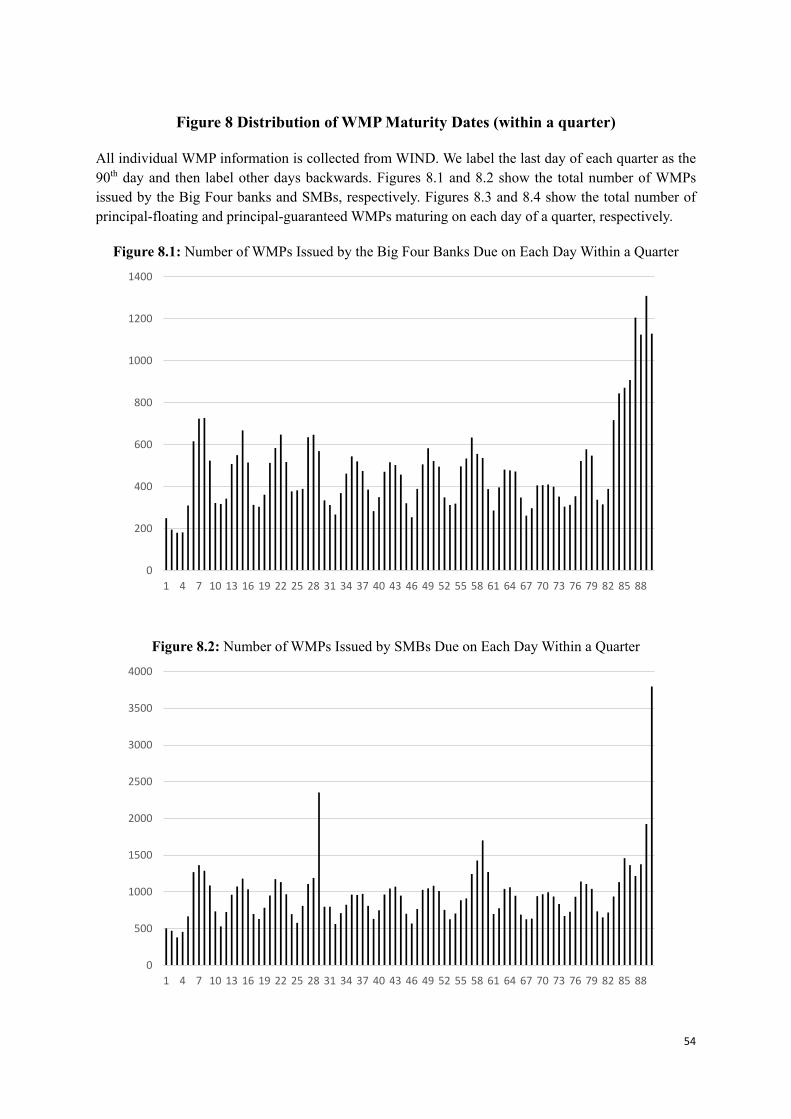
54
Figure 8 Distribution of WMP Maturity Dates (within a quarter)
All individual WMP information is collected from WIND. We label the last day of each quarter as the 90th day and then label other days backwards. Figures 8.1 and 8.2 show the total number of WMPs issued by the Big Four banks and SMBs, respectively. Figures 8.3 and 8.4 show the total number of principal-floating and principal-guaranteed WMPs maturing on each day of a quarter, respectively.
Figure 8.1: Number of WMPs Issued by the Big Four Banks Due on Each Day Within a Quarter
Figure 8.2: Number of WMPs Issued by SMBs Due on Each Day Within a Quarter
0
200
400
600
800
1000
1200
1400
1 4 7 10 13 16 19 22 25 28 31 34 37 40 43 46 49 52 55 58 61 64 67 70 73 76 79 82 85 88
0
500
1000
1500
2000
2500
3000
3500
4000
1 4 7 10 13 16 19 22 25 28 31 34 37 40 43 46 49 52 55 58 61 64 67 70 73 76 79 82 85 88
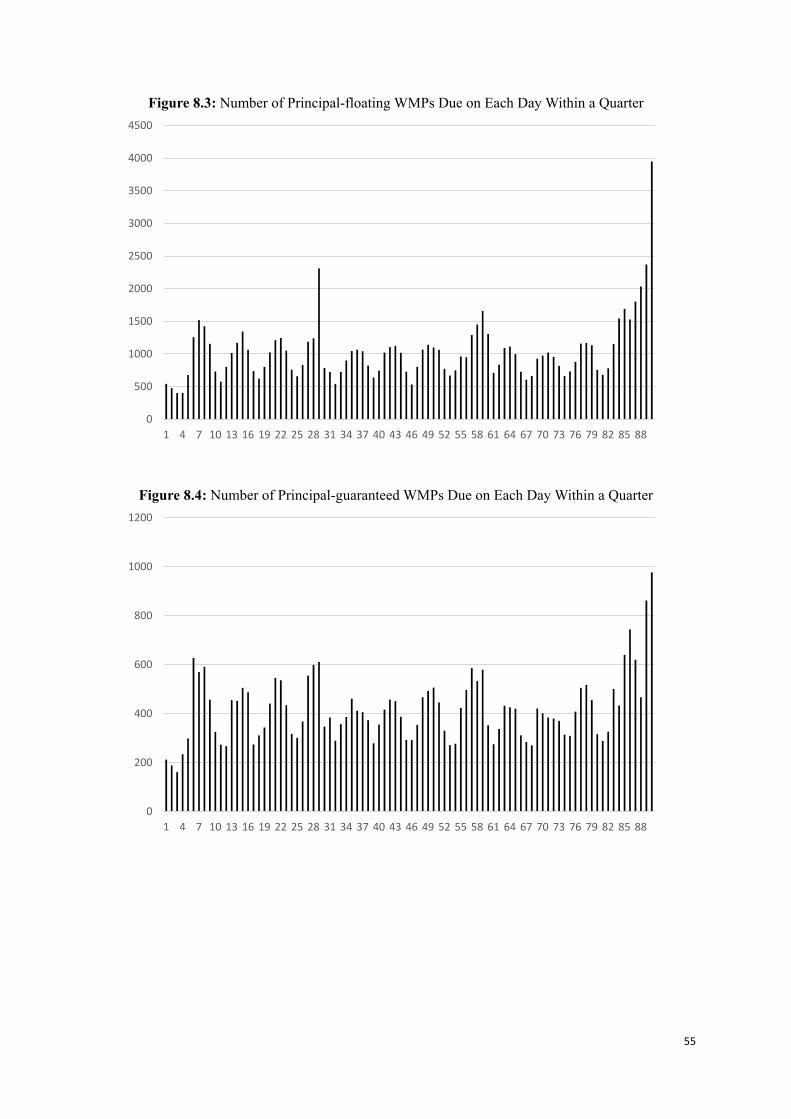
55
Figure 8.3: Number of Principal-floating WMPs Due on Each Day Within a Quarter
Figure 8.4: Number of Principal-guaranteed WMPs Due on Each Day Within a Quarter
0
500
1000
1500
2000
2500
3000
3500
4000
4500
1 4 7 10 13 16 19 22 25 28 31 34 37 40 43 46 49 52 55 58 61 64 67 70 73 76 79 82 85 88
0
200
400
600
800
1000
1200
1 4 7 10 13 16 19 22 25 28 31 34 37 40 43 46 49 52 55 58 61 64 67 70 73 76 79 82 85 88
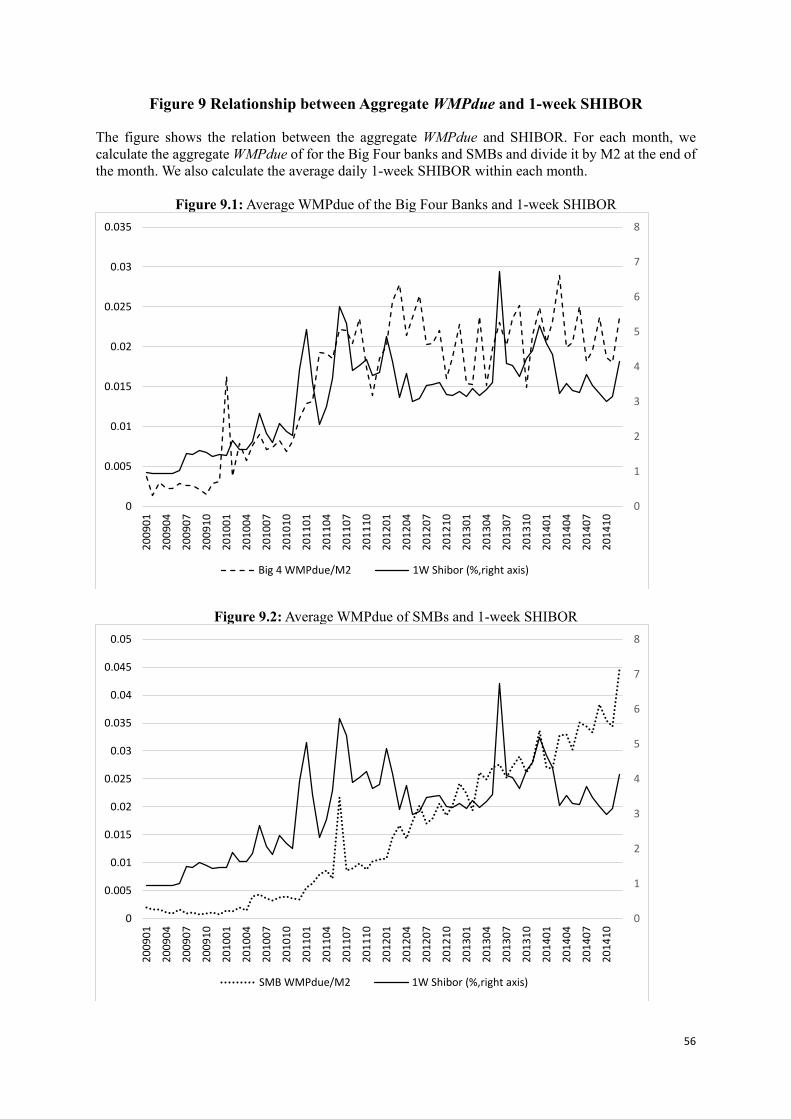
56
Figure 9 Relationship between Aggregate WMPdue and 1-week SHIBOR
The figure shows the relation between the aggregate WMPdue and SHIBOR. For each month, we calculate the aggregate WMPdue of for the Big Four banks and SMBs and divide it by M2 at the end of the month. We also calculate the average daily 1-week SHIBOR within each month.
Figure 9.1: Average WMPdue of the Big Four Banks and 1-week SHIBOR
Figure 9.2: Average WMPdue of SMBs and 1-week SHIBOR
0
1
2
3
4
5
6
7
8
0
0.005
0.01
0.015
0.02
0.025
0.03
0.035
2009
01
2009
04
2009
07
2009
10
2010
01
2010
04
2010
07
2010
10
2011
01
2011
04
2011
07
2011
10
2012
01
2012
04
2012
07
2012
10
2013
01
2013
04
2013
07
2013
10
2014
01
2014
04
2014
07
2014
10
Big 4 WMPdue/M2 1W Shibor (%,right axis)
0
1
2
3
4
5
6
7
8
0
0.005
0.01
0.015
0.02
0.025
0.03
0.035
0.04
0.045
0.05
2009
01
2009
04
2009
07
2009
10
2010
01
2010
04
2010
07
2010
10
2011
01
2011
04
2011
07
2011
10
2012
01
2012
04
2012
07
2012
10
2013
01
2013
04
2013
07
2013
10
2014
01
2014
04
2014
07
2014
10
SMB WMPdue/M2 1W Shibor (%,right axis)
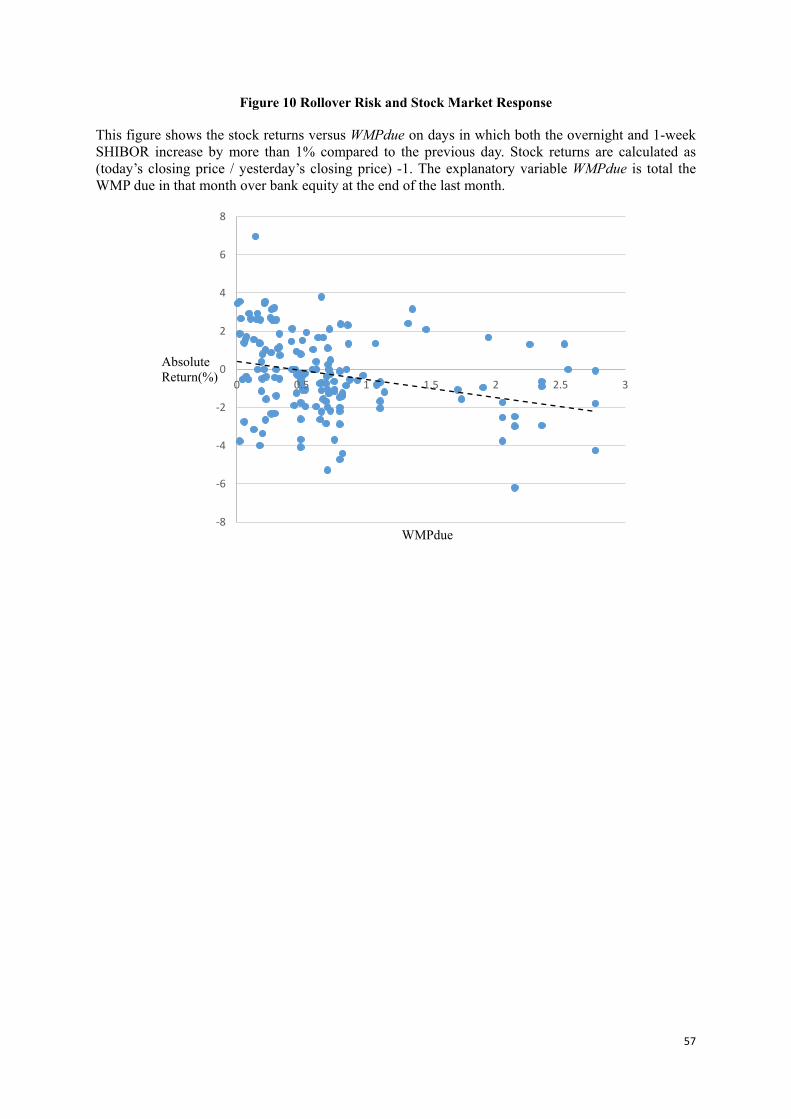
57
Figure 10 Rollover Risk and Stock Market Response
This figure shows the stock returns versus WMPdue on days in which both the overnight and 1-week SHIBOR increase by more than 1% compared to the previous day. Stock returns are calculated as (today’s closing price / yesterday’s closing price) -1. The explanatory variable WMPdue is total the WMP due in that month over bank equity at the end of the last month.
-8
-6
-4
-2
0
2
4
6
8
0 0.5 1 1.5 2 2.5 3
WMPdue
AbsoluteReturn(%)
58
Appendix A: Definitions of Variables Used in Empirical Tests
Variable
Definition
Issuance/Equity Total WMPs issued in the current quarter divided by bank equity at the end of the previous quarter (scaled by bank equity)
Net Issuance/Equity
The difference between total amount of WMP issued and amount due in the quarter (scaled by bank equity)
Capital Ratio Commercial bank's capital adequacy ratio calculated according to the "Commercial Bank Capital Adequacy Ratio Management Method" modified by the CBRC on December 28, 2006. Starting from January 1, 2013, a new requirement for the capital ratio took effect, but for consistency, we maintain the old method. Some banks had extreme capital ratios in the early stage of the sample period, so we winsorize it at 1%.
LDR Loan-to-deposit ratio, calculated as the bank's loan balance over deposit balance. The values for the loan and deposit balances are adjusted according to the risk to different deposits and loan assets.
Spread Difference between the market rate and regulatory rate calculated using the 3-month SHIBOR minus the 3-month bank deposit rate ceiling and taking the average across days within the same quarter.
Size Logarithm of total bank asset at the end of the previous quarter. WMPReturn_d WMP initial expected annualized yield minus the bank deposit rate
ceiling with the same maturity on the issuing date. SHIBOR_d SHIBOR of the same maturity as the WMP minus the bank deposit rate
ceiling with the same maturity on the issuing date. WMPdue Total amount of WMPs due in the current quarter (in the current month
in Table 11) over the bank's equity at the end of the previous quarter. WMPdue_BIG4 The average WMPdue of the Big Four banks in each quarter.
WMPdue_SMB The average WMPdue of the 21 SMBs in each quarter.
Ask Rate The banks’ average SHIBOR ask rate within the same quarter. All Big Four banks participate in the SHIBOR bid and ask process, but only 9 or 10 SMBs do. Winsorized at both sides by 1%.
BOC Exposure of an individual bank to competition from the BOC measured by the weighted average of city-level market share of the BOC using the bank’s number of branches in that city as the weight. Similar for ABC, CCB, ICBC, and SMB.


![A Comparison of the US and European Shadow Banking Systems ... · Definitions • Mculley ~ î ì ì ó : ^unlike regulated banks […], unregulated shadow banks fund themselves with](https://img.pdfslide.net/doc/110x75/5e37ea71309dfc2a7113eb46/a-comparison-of-the-us-and-european-shadow-banking-systems-definitions-a-mculley.jpg)

![Governments as Shadow Banks: The Looming Threat to ...pages.stern.nyu.edu/...as_shadow_banks_TLR_Acharya.pdf2012] Governments as Shadow Banks 1747 over time.12 Given such difficulty](https://img.pdfslide.net/doc/110x75/5e4bfb1ec01edf4aac085b27/governments-as-shadow-banks-the-looming-threat-to-pagessternnyueduasshadowbankstlr.jpg)