Embed Size (px)
Citation preview
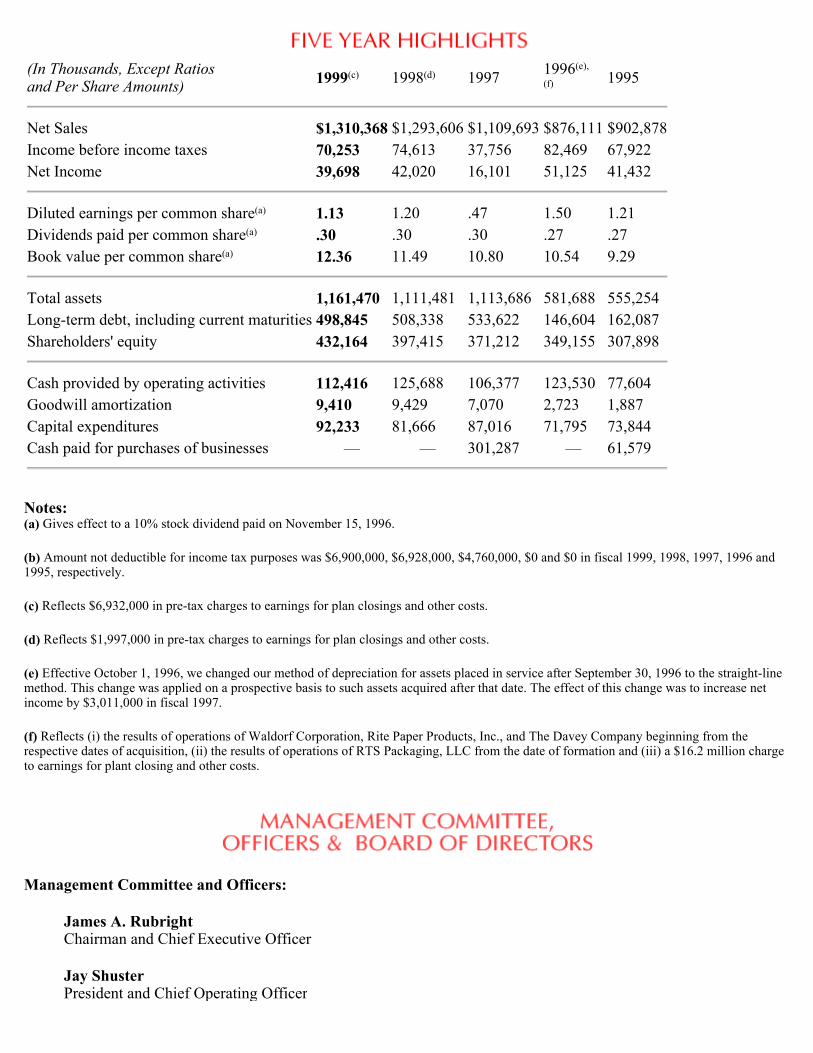
Notes: (a) Gives effect to a 10% stock dividend paid on November 15, 1996.
(b) Amount not deductible for income tax purposes was $6,900,000, $6,928,000, $4,760,000, $0 and $0 in fiscal 1999, 1998, 1997, 1996 and 1995, respectively.
(c) Reflects $6,932,000 in pre-tax charges to earnings for plan closings and other costs.
(d) Reflects $1,997,000 in pre-tax charges to earnings for plan closings and other costs.
(e) Effective October 1, 1996, we changed our method of depreciation for assets placed in service after September 30, 1996 to the straight-line method. This change was applied on a prospective basis to such assets acquired after that date. The effect of this change was to increase net income by $3,011,000 in fiscal 1997.
(f) Reflects (i) the results of operations of Waldorf Corporation, Rite Paper Products, Inc., and The Davey Company beginning from the respective dates of acquisition, (ii) the results of operations of RTS Packaging, LLC from the date of formation and (iii) a $16.2 million charge to earnings for plant closing and other costs.
Management Committee and Officers:
James A. Rubright Chairman and Chief Executive Officer
Jay Shuster President and Chief Operating Officer
(In Thousands, Except Ratios and Per Share Amounts) 1999(c) 1998(d) 1997 1996(e),
(f) 1995
Net Sales $1,310,368 $1,293,606 $1,109,693 $876,111 $902,878Income before income taxes 70,253 74,613 37,756 82,469 67,922Net Income 39,698 42,020 16,101 51,125 41,432
Diluted earnings per common share(a) 1.13 1.20 .47 1.50 1.21Dividends paid per common share(a) .30 .30 .30 .27 .27Book value per common share(a) 12.36 11.49 10.80 10.54 9.29
Total assets 1,161,470 1,111,481 1,113,686 581,688 555,254Long-term debt, including current maturities 498,845 508,338 533,622 146,604 162,087Shareholders' equity 432,164 397,415 371,212 349,155 307,898
Cash provided by operating activities 112,416 125,688 106,377 123,530 77,604Goodwill amortization 9,410 9,429 7,070 2,723 1,887Capital expenditures 92,233 81,666 87,016 71,795 73,844Cash paid for purchases of businesses — — 301,287 — 61,579
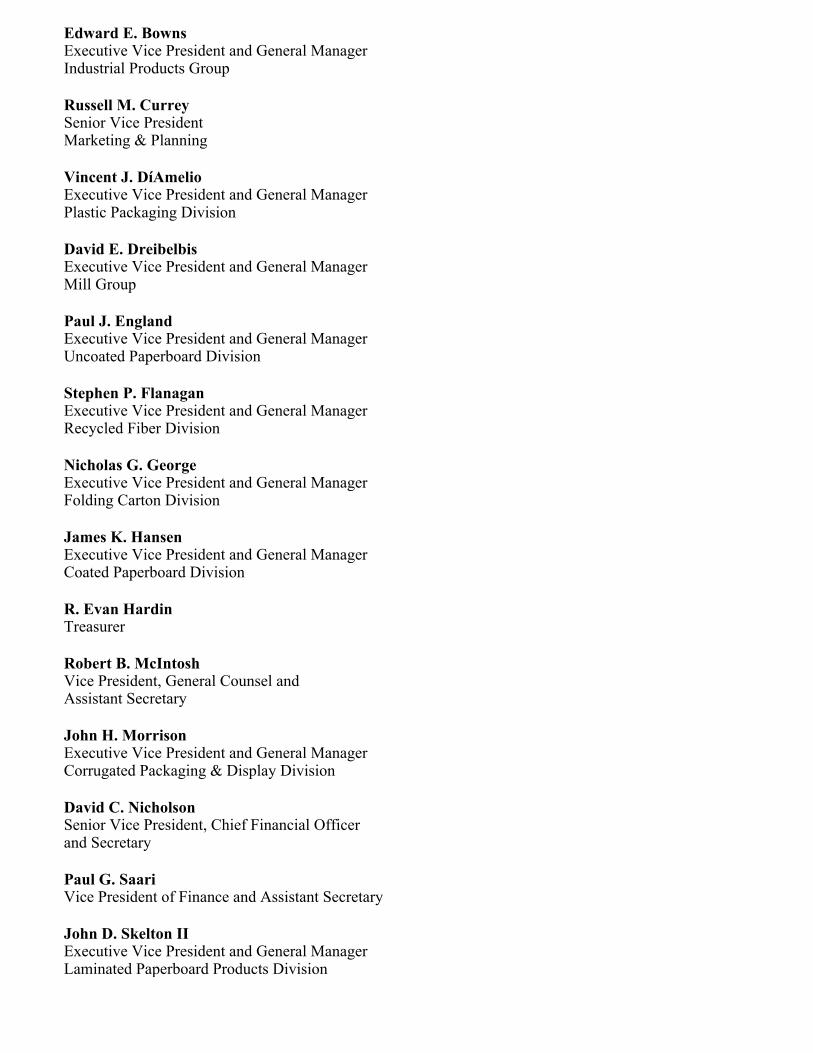
Edward E. Bowns Executive Vice President and General Manager Industrial Products Group
Russell M. Currey Senior Vice President Marketing & Planning
Vincent J. DíAmelio Executive Vice President and General Manager Plastic Packaging Division
David E. Dreibelbis Executive Vice President and General Manager Mill Group
Paul J. England Executive Vice President and General Manager Uncoated Paperboard Division
Stephen P. Flanagan Executive Vice President and General Manager Recycled Fiber Division
Nicholas G. George Executive Vice President and General Manager Folding Carton Division
James K. Hansen Executive Vice President and General Manager Coated Paperboard Division
R. Evan Hardin Treasurer
Robert B. McIntosh Vice President, General Counsel and Assistant Secretary
John H. Morrison Executive Vice President and General Manager Corrugated Packaging & Display Division
David C. Nicholson Senior Vice President, Chief Financial Officer and Secretary
Paul G. Saari Vice President of Finance and Assistant Secretary
John D. Skelton II Executive Vice President and General Manager Laminated Paperboard Products Division
Richard E. Steed President and Chief Executive Officer RTS Packaging, LLC
Board of Directors:
Stephen G. Anderson, M.D. Winston-Salem, North Carolina Audit Committee
J. Hyatt Brown Chairman and Chief Executive Officer Brown & Brown, Inc. Daytona Beach, Florida Executive Committee
Bradley Currey, Jr. Chairman Rock-Tenn Company Norcross, Georgia Executive Committee
Robert B. Currey Chief Executive Officer Currey & Company, Inc. Atlanta, Georgia
A.D. Frazier, Jr. President and Chief Executive Officer Invesco, Inc. Atlanta, Georgia Audit Committee
Eugene U. Frey Chairman Wabash Management, Inc. Minneapolis, Minnesota Audit Committee
L.L. Gellerstedt III Chairman Children's Healthcare of Atlanta Atlanta, Georgia Compensation and Options Committee
John D. Hopkins Senior Vice President and General Counsel Jefferson Pilot Corporation Greensboro, North Carolina Executive Committee
Lou Brown Jewell Private Investor
Atlanta, Georgia Compensation and Options Committee
James W. Johnson President McCranie Tractor Company Unadilla, Georgia Compensation and Options Committee
James A. Rubright Vice Chairman and Chief Executive Officer Rock-Tenn Company Norcross, Georgia
Charles R. Sexton Principal Sexton-Talbert Products Vero Beach, Florida
Jay Shuster President and Chief Operating Officer Rock-Tenn Company Norcross, Georgia Executive Committee
John W. Spiegel Executive Vice President and Chief Financial Officer SunTrust Banks, Inc. Atlanta, Georgia Executive Committee and Audit Committee
Home Office: 504 Thrasher St. Norcross, GA 30071 770-448-2193 www.rocktenn.com
Transfer Agent and Registrar: Wachovia Bank of North Carolina, N.A. c/o Boston Equiserve, L.P. P.O. Box 8217 Boston, MA 02266-8217 800-633-4236
Investor Relations: Investor Relations Department P.O. Box 4098 Norcross, GA 30091 770-448-2193 Fax: 770-263-3582 For more information or an investor relations kit, contact [email protected]. Be sure to include your full name,
mailing address and phone number.
Annual Meeting: Northeast Atlanta Hilton 5993 Peachtree Industrial Blvd. Norcross, GA 30092 Friday, January 28, 2000 9:00 A.M.
Auditors: Ernst & Young LLP 600 Peachtree St. Suite 2800 Atlanta, GA 30308
Direct Deposit of Dividends: Rock-Tenn shareholders may have their quarterly cash dividends automatically deposited to checking, savings or money market accounts through the automatic clearinghouse system. If you wish to participate in the program, please contact: Boston Equiserve, L.P. P.O. Box 8217 Boston, MA 02266-8217 800-633-4236
Common Stock: Rock-Tenn Class A common stock trades on the New York Stock Exchange under the symbol RKT. There is not an established public trading market for the Company’s Class B common stock.
As of December 3, 1999, there were approximately 4,191 Class A common shareholders of record and 130 Class B common shareholders of record.
Form 10-K Report: A copy of the Company’s annual report on Form 10-K for the year ended September 30, 1999, as filed with the Securities and Exchange Commission is available at no charge to shareholders of record, by writing to: Investor Relations Rock-Tenn Company P.O. Box 4098 Norcross, GA 30091 email: [email protected]
TO OUR SHAREHOLDERS FROM THE CHAIRMAN
We ended fiscal 1999 strong. As the year came to a close, packaging and other converting operations picked up and paperboard mills ran closer to their full capacity. Prices also began to recover from weaker levels in the first half. Our business is in excellent shape today. Every division is stronger and contributing to operating income. All have excellent prospects for fiscal 2000.
After net sales declined for the first half of fiscal 1999 by 3.3%, the Company recorded a modest net sales increase for the third quarter over the same quarter of fiscal 1998 and an 8.7% net sales increase for the fourth quarter resulting in net sales for the year of just over $1.3 billion, a small increase over fiscal 1998. Net income for the year was $39.7
million. Excluding plant closings and other costs, net income rose slightly to $44.0 million, an increase of 1.6%.
As Rock-Tenn entered 1999, an important goal for the year was to replace a couple of large accounts that we lost in fiscal 1998. The folding carton team has secured new business in excess of $100 million, more than enough to replace the business lost in 1998. Many of these accounts began running in our plants during 1999, but we expect to enjoy more of the impact in fiscal year 2000. These accounts will impact not only the folding carton business but also the paperboard business.
We have faced up to our most difficult operating problems. In 1999, several plants that were losing money in previous years have turned profitable. We closed three plants in two of our divisions where capacity was greater than demand, in order to consolidate operations in lower cost, more produc-tive and better-located facilities.
We achieved our best ever safety performance. Injuries were reduced by almost one-third, a good start on our way to a long-term goal of eliminating serious injuries in our plants. The current rate of personal injuries puts us among the best in American industry and among the top companies in the paper and packaging industry. Safety performance is an excellent indicator of manufacturing effectiveness and long-term operating performance.
We have every reason to be proud of where we are today and how we are positioned. Still, in order to be a player in the global economy of the future, we are looking at every aspect of our business, even as we are healthy. We are finding new products and markets that can grow sales. There are tremendous opportunities for Rock-Tenn to grow and change as the world changes around us. At the same time, we are holding on to the bedrock values so important to all of us: the safety and security of every member of the Rock-Tenn team, an entrepreneurial sense of responsibility and accountability, the willingness to set high goals and standards and then the determination to do whatever it takes to achieve them.
In September, I announced my plan to retire in January 2000. Our board of directors elected Jim Rubright as vice chairman of the board and chief executive officer. Jim is a great new leader for this team and brings new knowledge and experi-ence to Rock-Tenn to help us meet the challenges ahead. He now heads the finest collection of young, able, experienced talent in this industry, second to none.
Thank you to the people who make up the Rock-Tenn team. We started the year with great plants, great technology, and most of all, great people. Today the team is stronger still. Their experience, creativity and commitment to our customers assure this Company of a great future.
Bradley Currey, Jr. Chairman
December 14, 1999
TO OUR SHAREHOLDERS FROM THE VICE CHAIRMAN AND CHIEF EXECUTIVE OFFICER AND THE PRESIDENT AND CHIEF OPERATING OFFICER
Currey to Retire; Rubright Elected Vice Chairman and CEO
At its meeting in September, the board elected Jim Rubright vice chairman and chief executive officer. Brad Currey announced his plan to retire as chairman in January 2000 but will continue as a director. Before being named CEO of Rock-Tenn, Jim Rubright was executive vice president of Sonat, Inc., a diversified energy company in Birmingham, Alabama. Jim was responsible for the company’s interstate natural gas pipeline group and energy services businesses. Before join-ing Sonat in 1994, he was a partner in the Atlanta office of the law firm of King & Spalding. We are fortunate to have a new CEO with Jim’s proven abilities and experience to lead us into the next century.
We enter this year committed to creating value for Rock-Tenn Company’s shareholders. Brad Currey’s leadership and vision will be missed. His legacy is a company full of opportunity and a team full of people charged up and ready to make 2000 a great year.
We believe that the capital invested and the customers gained in the last two years enhance our competitiveness and position our Company to capitalize on our improving markets – and deliver very good results to our shareholders.
Improving Earnings, Accelerating Sales Our performance in the last half of the year shows our earnings are improving and our sales are accel-erating. We earned 3.9% more in the final quarter of 1999 than in the same quarter of 1998, and our sales were up 8.7%. Our paperboard mills produced a record 287,000 tons during the fourth quarter and operated at 93% of full capacity. Our packaging and other converting operations were very busy across the board.
This year we will focus on executing our plans to drive down our costs, improve product quality and customer service, raise operating efficiency and continue the sales growth that began in the second half of 1999. A key goal is to turn around operating results at the remaining plants that lost money last year.
Two divisions, Corrugated Packaging and Display and Plastic Packaging, led the team in sales growth. We will do everything necessary to support these growing businesses in 2000. Their high-value products and services are meeting new and growing needs among our customers. We believe our shareholders should expect us to deliver consistent, double-digit earnings growth. Our job is to ensure that our people and assets deliver in fiscal 2000 while we lay the groundwork to continue delivering reliable earnings growth in future years. To do this, we are driving down our costs and working to be the best in our businesses at customer service, product quality and operating efficiency. We are concentrating on our sales of high value-added products and services in order to capture opportunities in growing and profitable markets as well as to reduce our exposure to cyclicality in our businesses.
In the next year we expect to secure long-term commitments for critical business that will strengthen the positions of our mills and plants. We have exe-cuted financial hedges on about half of our corrugated medium output, taking advantage of the opportunity to ensure that we realize good margins on our output. We will pursue other opportunities to reduce the volatility of our most price and cost sensitive operations.
Rewarding Initiative We are starting to see great returns on what we call "Totally New Thinking" as we recognize and reward employees for new innovations that drive value. Our program to recognize and reward sales that cross divisional lines and that create new opportunities for different business with existing customers continues to show growing results. We are giving clear signs to our people that we encourage their initiative and empower them to drive change in our business. We have great people on the Rock-Tenn team. Leaders
have emerged at all levels of our business in the last three years of difficult operating conditions for the Company. Our assets are well positioned. Our commitment is to ensure that together we produce the results that our shareholders expect. We enter this year excited about our opportunities and as focused as can be on making them realities. Thank you for your interest in Rock-Tenn and your support as shareholders. We are committed to your success.
"Our earnings are improving. Our paperboard mills operated at 93% of full capacity."
"We believe our shareholders should expect us to deliver consistent, double-digit earnings growth."
"We are concentrating on increasing our sales of high value-added products and services in order to capture opportunities in growing and profitable markets."
"We are giving clear signs to our people that we encourage their initiative and empower them to drive change in our business."
James A Rubright Vice Chairman and Chief Executive Officer
Jay Shuster President and Chief Operating Officer

December 15, 1998
Rock-Tenn CompanyFinancial Review
FINANCIAL CONTENTS
Five Year Selected Financial and Operating Highlights . . . 18
Management’s Discussion and Analysis ofResults of Operations and Financial Condition . . . 19
Consolidated Statements of Income . . . 30
Consolidated Balance Sheets . . . 31
Consolidated Statements of Shareholders’ Equity . . . 32
Consolidated Statements of Cash Flows . . . 33
Notes to Consolidated Financial Statements . . . 34
Report of Independent Auditors . . . 46
Management’s Statement of Responsibility for Financial Information . . . 47
Shareholder Information . . . 48
FINANCIA.WPC 1/19/00 5:18 PM Page 17
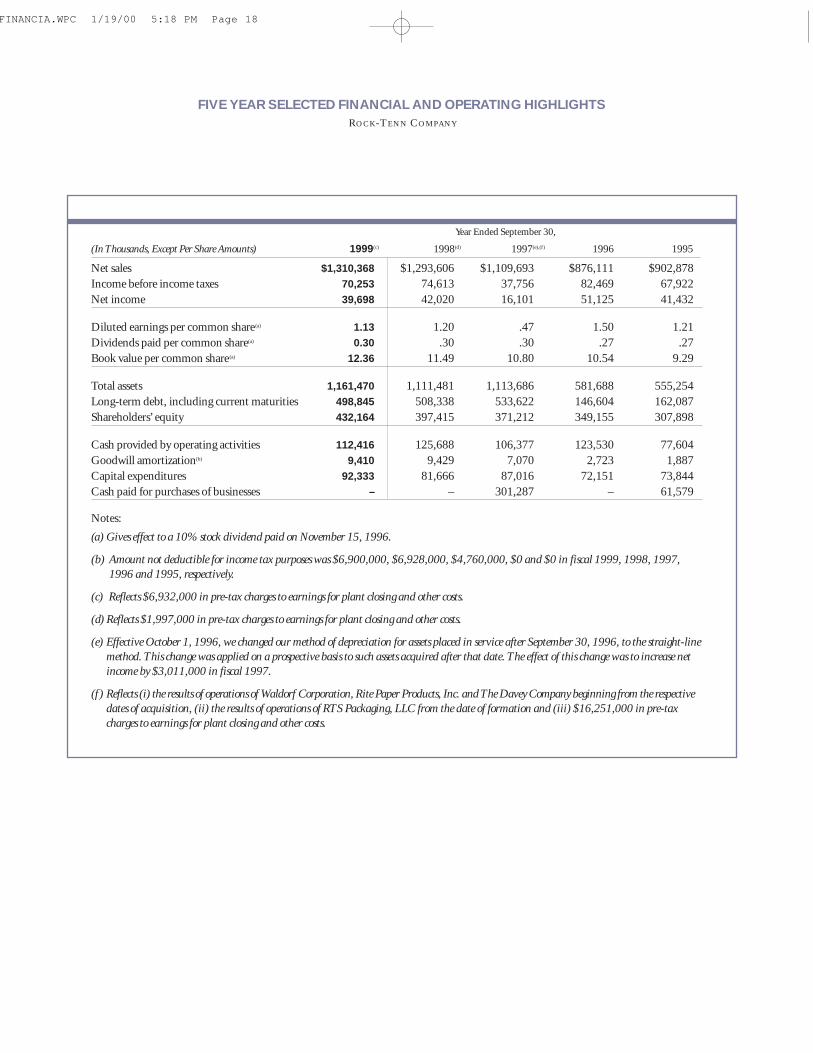
Year Ended September 30,
(In Thousands, Except Per Share Amounts) 1999(c) 1998(d) 1997(e),(f ) 1996 1995
Net sales $1,310,368 $1,293,606 $1,109,693 $876,111 $902,878
Income before income taxes 70,253 74,613 37,756 82,469 67,922
Net income 39,698 42,020 16,101 51,125 41,432
Diluted earnings per common share(a) 1.13 1.20 .47 1.50 1.21
Dividends paid per common share(a) 0.30 .30 .30 .27 .27
Book value per common share(a) 12.36 11.49 10.80 10.54 9.29
Total assets 1,161,470 1,111,481 1,113,686 581,688 555,254
Long-term debt, including current maturities 498,845 508,338 533,622 146,604 162,087
Shareholders’ equity 432,164 397,415 371,212 349,155 307,898
Cash provided by operating activities 112,416 125,688 106,377 123,530 77,604
Goodwill amortization(b) 9,410 9,429 7,070 2,723 1,887
Capital expenditures 92,333 81,666 87,016 72,151 73,844
Cash paid for purchases of businesses – – 301,287 – 61,579
Notes:
(a) Gives effect to a 10% stock dividend paid on November 15, 1996.
(b) Amount not deductible for income tax purposes was $6,900,000, $6,928,000, $4,760,000, $0 and $0 in fiscal 1999, 1998, 1997,
1996 and 1995, respectively.
(c) Reflects $6,932,000 in pre-tax charges to earnings for plant closing and other costs.
(d) Reflects $1,997,000 in pre-tax charges to earnings for plant closing and other costs.
(e) Effective October 1, 1996, we changed our method of depreciation for assets placed in service after September 30, 1996, to the straight-line
method. This change was applied on a prospective basis to such assets acquired after that date. The effect of this change was to increase net
income by $3,011,000 in fiscal 1997.
(f ) Reflects (i) the results of operations of Waldorf Corporation, Rite Paper Products, Inc. and The Davey Company beginning from the respective
dates of acquisition, (ii) the results of operations of RTS Packaging, LLC from the date of formation and (iii) $16,251,000 in pre-tax
charges to earnings for plant closing and other costs.
FIVE YEAR SELECTED FINANCIAL AND OPERATING HIGHLIGHTSROCK-TENN COMPANY
FINANCIA.WPC 1/19/00 5:18 PM Page 18
MANAGEMENT’S DISCUSSION AND ANALYSIS OF RESULTS OF OPERATIONS AND FINANCIAL CONDITION
ROCK-TENN COMPANY
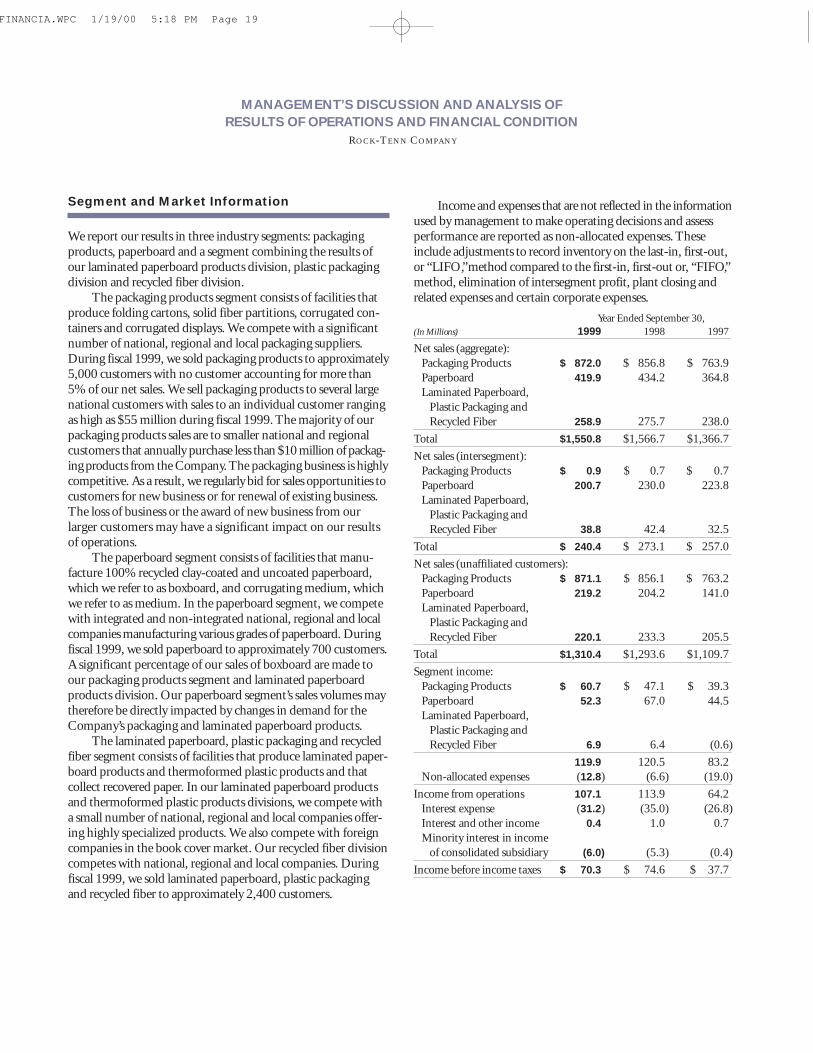
Segment and Market Information
We report our results in three industry segments: packagingproducts, paperboard and a segment combining the results ofour laminated paperboard products division, plastic packagingdivision and recycled fiber division.
The packaging products segment consists of facilities thatproduce folding cartons, solid fiber partitions, corrugated con-tainers and corrugated displays. We compete with a significantnumber of national, regional and local packaging suppliers.During fiscal 1999, we sold packaging products to approximately5,000 customers with no customer accounting for more than5% of our net sales. We sell packaging products to several largenational customers with sales to an individual customer rangingas high as $55 million during fiscal 1999. The majority of ourpackaging products sales are to smaller national and regionalcustomers that annually purchase less than $10 million of packag-ing products from the Company. The packaging business is highlycompetitive. As a result, we regularly bid for sales opportunities tocustomers for new business or for renewal of existing business.The loss of business or the award of new business from ourlarger customers may have a significant impact on our resultsof operations.
The paperboard segment consists of facilities that manu-facture 100% recycled clay-coated and uncoated paperboard,which we refer to as boxboard, and corrugating medium, whichwe refer to as medium. In the paperboard segment, we competewith integrated and non-integrated national, regional and localcompanies manufacturing various grades of paperboard. Duringfiscal 1999, we sold paperboard to approximately 700 customers.A significant percentage of our sales of boxboard are made toour packaging products segment and laminated paperboardproducts division. Our paperboard segment’s sales volumes maytherefore be directly impacted by changes in demand for theCompany’s packaging and laminated paperboard products.
The laminated paperboard, plastic packaging and recycledfiber segment consists of facilities that produce laminated paper-board products and thermoformed plastic products and that collect recovered paper. In our laminated paperboard productsand thermoformed plastic products divisions, we compete witha small number of national, regional and local companies offer-ing highly specialized products. We also compete with foreigncompanies in the book cover market. Our recycled fiber divisioncompetes with national, regional and local companies. Duringfiscal 1999, we sold laminated paperboard, plastic packagingand recycled fiber to approximately 2,400 customers.
Income and expenses that are not reflected in the informationused by management to make operating decisions and assessperformance are reported as non-allocated expenses. Theseinclude adjustments to record inventory on the last-in, first-out,or “LIFO,”method compared to the first-in, first-out or, “FIFO,”method, elimination of intersegment profit, plant closing andrelated expenses and certain corporate expenses.
Year Ended September 30,
(In Millions) 1999 1998 1997
Net sales (aggregate):
Packaging Products $ 872.0 $ 856.8 $ 763.9
Paperboard 419.9 434.2 364.8
Laminated Paperboard,
Plastic Packaging and
Recycled Fiber 258.9 275.7 238.0
Total $1,550.8 $1,566.7 $1,366.7
Net sales (intersegment):
Packaging Products $ 0.9 $ 0.7 $ 0.7
Paperboard 200.7 230.0 223.8
Laminated Paperboard,
Plastic Packaging and
Recycled Fiber 38.8 42.4 32.5
Total $ 240.4 $ 273.1 $ 257.0
Net sales (unaffiliated customers):
Packaging Products $ 871.1 $ 856.1 $ 763.2
Paperboard 219.2 204.2 141.0
Laminated Paperboard,
Plastic Packaging and
Recycled Fiber 220.1 233.3 205.5
Total $1,310.4 $1,293.6 $1,109.7
Segment income:
Packaging Products $ 60.7 $ 47.1 $ 39.3
Paperboard 52.3 67.0 44.5
Laminated Paperboard,
Plastic Packaging and
Recycled Fiber 6.9 6.4 (0.6)
119.9 120.5 83.2
Non-allocated expenses (12.8) (6.6) (19.0)
Income from operations 107.1 113.9 64.2
Interest expense (31.2) (35.0) (26.8)
Interest and other income 0.4 1.0 0.7
Minority interest in income
of consolidated subsidiary (6.0) (5.3) (0.4)
Income before income taxes $ 70.3 $ 74.6 $ 37.7
FINANCIA.WPC 1/19/00 5:18 PM Page 19
MANAGEMENT’S DISCUSSION AND ANALYSIS OF RESULTS OF OPERATIONS AND FINANCIAL CONDITION
ROCK-TENN COMPANY
Results of Operations
We provide quarterly information in the following tables to assist in evaluating trends in our results of operations. For additional discussion of quarterly information, see our quarterly reports on Form 10-Q filed with the Securities and Exchange Commission.
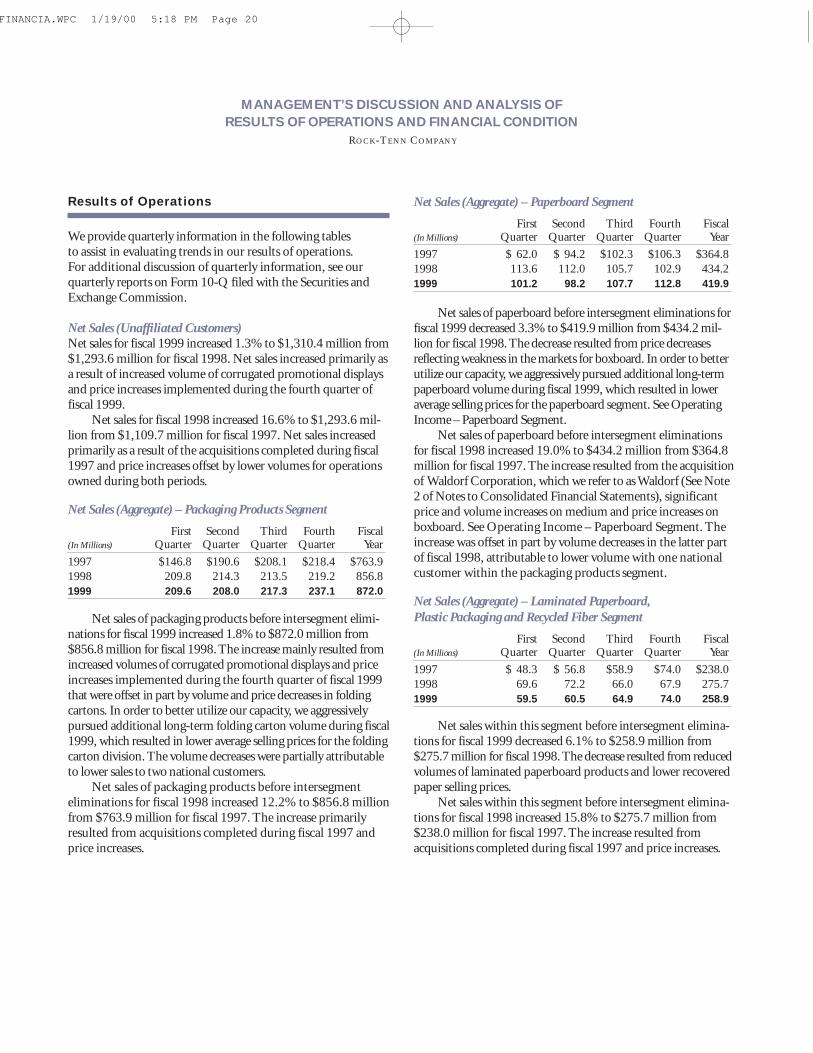
Net Sales (Unaffiliated Customers) Net sales for fiscal 1999 increased 1.3% to $1,310.4 million from$1,293.6 million for fiscal 1998. Net sales increased primarily asa result of increased volume of corrugated promotional displaysand price increases implemented during the fourth quarter offiscal 1999.
Net sales for fiscal 1998 increased 16.6% to $1,293.6 mil-lion from $1,109.7 million for fiscal 1997. Net sales increasedprimarily as a result of the acquisitions completed during fiscal1997 and price increases offset by lower volumes for operationsowned during both periods.
Net Sales (Aggregate) – Packaging Products Segment
First Second Third Fourth Fiscal(In Millions) Quarter Quarter Quarter Quarter Year
1997 $146.8 $190.6 $208.1 $218.4 $763.9
1998 209.8 214.3 213.5 219.2 856.8
1999 209.6 208.0 217.3 237.1 872.0
Net sales of packaging products before intersegment elimi-nations for fiscal 1999 increased 1.8% to $872.0 million from$856.8 million for fiscal 1998. The increase mainly resulted fromincreased volumes of corrugated promotional displays and priceincreases implemented during the fourth quarter of fiscal 1999that were offset in part by volume and price decreases in foldingcartons. In order to better utilize our capacity, we aggressivelypursued additional long-term folding carton volume during fiscal1999, which resulted in lower average selling prices for the foldingcarton division. The volume decreases were partially attributableto lower sales to two national customers.
Net sales of packaging products before intersegmenteliminations for fiscal 1998 increased 12.2% to $856.8 millionfrom $763.9 million for fiscal 1997. The increase primarilyresulted from acquisitions completed during fiscal 1997 andprice increases.
Net Sales (Aggregate) – Paperboard Segment
First Second Third Fourth Fiscal(In Millions) Quarter Quarter Quarter Quarter Year
1997 $ 62.0 $ 94.2 $102.3 $106.3 $364.8
1998 113.6 112.0 105.7 102.9 434.2
1999 101.2 98.2 107.7 112.8 419.9
Net sales of paperboard before intersegment eliminations forfiscal 1999 decreased 3.3% to $419.9 million from $434.2 mil-lion for fiscal 1998. The decrease resulted from price decreasesreflecting weakness in the markets for boxboard. In order to betterutilize our capacity, we aggressively pursued additional long-termpaperboard volume during fiscal 1999, which resulted in loweraverage selling prices for the paperboard segment. See OperatingIncome – Paperboard Segment.
Net sales of paperboard before intersegment eliminationsfor fiscal 1998 increased 19.0% to $434.2 million from $364.8million for fiscal 1997. The increase resulted from the acquisitionof Waldorf Corporation, which we refer to as Waldorf (See Note2 of Notes to Consolidated Financial Statements), significantprice and volume increases on medium and price increases onboxboard. See Operating Income – Paperboard Segment. Theincrease was offset in part by volume decreases in the latter partof fiscal 1998, attributable to lower volume with one nationalcustomer within the packaging products segment.
Net Sales (Aggregate) – Laminated Paperboard,
Plastic Packaging and Recycled Fiber Segment
First Second Third Fourth Fiscal(In Millions) Quarter Quarter Quarter Quarter Year
1997 $ 48.3 $ 56.8 $58.9 $74.0 $238.0
1998 69.6 72.2 66.0 67.9 275.7
1999 59.5 60.5 64.9 74.0 258.9
Net sales within this segment before intersegment elimina-tions for fiscal 1999 decreased 6.1% to $258.9 million from$275.7 million for fiscal 1998. The decrease resulted from reducedvolumes of laminated paperboard products and lower recoveredpaper selling prices.
Net sales within this segment before intersegment elimina-tions for fiscal 1998 increased 15.8% to $275.7 million from$238.0 million for fiscal 1997. The increase resulted fromacquisitions completed during fiscal 1997 and price increases.
FINANCIA.WPC 1/19/00 5:18 PM Page 20
MANAGEMENT’S DISCUSSION AND ANALYSIS OF RESULTS OF OPERATIONS AND FINANCIAL CONDITION
ROCK-TENN COMPANY
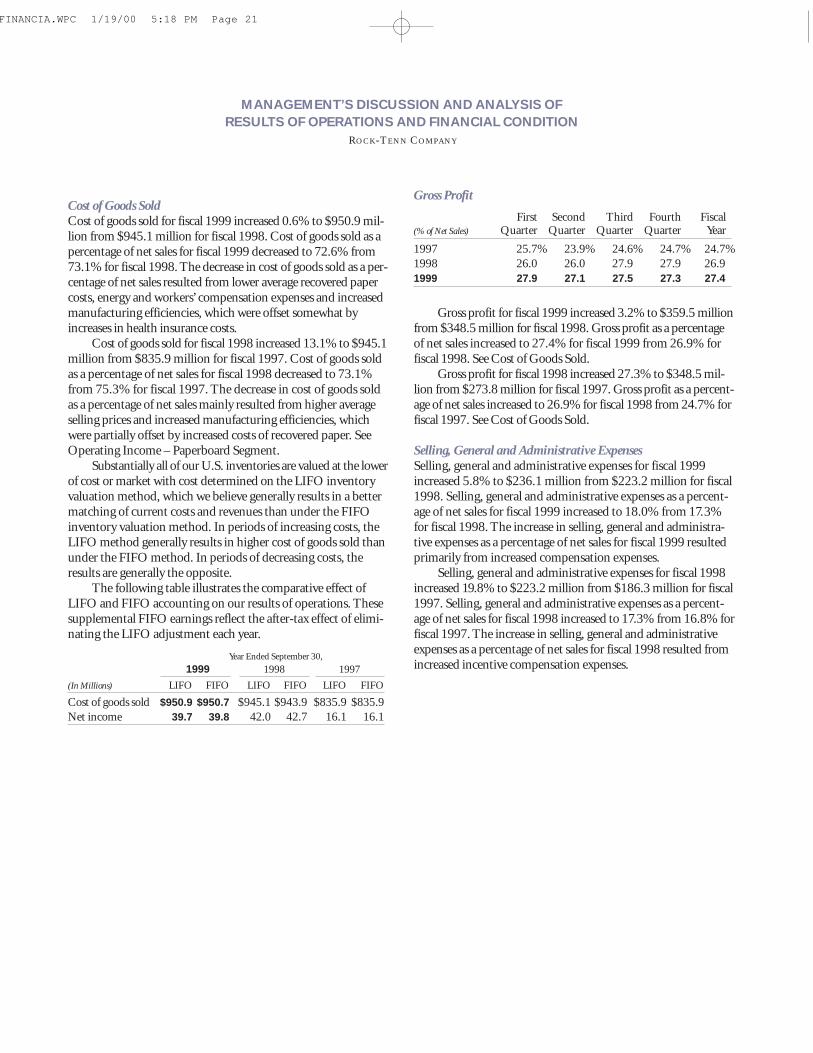
Cost of Goods Sold Cost of goods sold for fiscal 1999 increased 0.6% to $950.9 mil-lion from $945.1 million for fiscal 1998. Cost of goods sold as apercentage of net sales for fiscal 1999 decreased to 72.6% from73.1% for fiscal 1998. The decrease in cost of goods sold as a per-centage of net sales resulted from lower average recovered papercosts, energy and workers’ compensation expenses and increasedmanufacturing efficiencies, which were offset somewhat byincreases in health insurance costs.
Cost of goods sold for fiscal 1998 increased 13.1% to $945.1million from $835.9 million for fiscal 1997. Cost of goods soldas a percentage of net sales for fiscal 1998 decreased to 73.1%from 75.3% for fiscal 1997. The decrease in cost of goods soldas a percentage of net sales mainly resulted from higher averageselling prices and increased manufacturing efficiencies, whichwere partially offset by increased costs of recovered paper. SeeOperating Income – Paperboard Segment.
Substantially all of our U.S. inventories are valued at the lowerof cost or market with cost determined on the LIFO inventoryvaluation method, which we believe generally results in a bettermatching of current costs and revenues than under the FIFOinventory valuation method. In periods of increasing costs, theLIFO method generally results in higher cost of goods sold thanunder the FIFO method. In periods of decreasing costs, theresults are generally the opposite.
The following table illustrates the comparative effect ofLIFO and FIFO accounting on our results of operations. Thesesupplemental FIFO earnings reflect the after-tax effect of elimi-nating the LIFO adjustment each year.
Year Ended September 30,
1999 1998 1997
(In Millions) LIFO FIFO LIFO FIFO LIFO FIFO
Cost of goods sold $950.9 $950.7 $945.1 $943.9 $835.9 $835.9
Net income 39.7 39.8 42.0 42.7 16.1 16.1
Gross Profit
First Second Third Fourth Fiscal(% of Net Sales) Quarter Quarter Quarter Quarter Year
1997 25.7% 23.9% 24.6% 24.7% 24.7%
1998 26.0 26.0 27.9 27.9 26.9
1999 27.9 27.1 27.5 27.3 27.4
Gross profit for fiscal 1999 increased 3.2% to $359.5 millionfrom $348.5 million for fiscal 1998. Gross profit as a percentageof net sales increased to 27.4% for fiscal 1999 from 26.9% forfiscal 1998. See Cost of Goods Sold.
Gross profit for fiscal 1998 increased 27.3% to $348.5 mil-lion from $273.8 million for fiscal 1997. Gross profit as a percent-age of net sales increased to 26.9% for fiscal 1998 from 24.7% forfiscal 1997. See Cost of Goods Sold.
Selling, General and Administrative ExpensesSelling, general and administrative expenses for fiscal 1999increased 5.8% to $236.1 million from $223.2 million for fiscal1998. Selling, general and administrative expenses as a percent-age of net sales for fiscal 1999 increased to 18.0% from 17.3%for fiscal 1998. The increase in selling, general and administra-tive expenses as a percentage of net sales for fiscal 1999 resultedprimarily from increased compensation expenses.
Selling, general and administrative expenses for fiscal 1998increased 19.8% to $223.2 million from $186.3 million for fiscal1997. Selling, general and administrative expenses as a percent-age of net sales for fiscal 1998 increased to 17.3% from 16.8% forfiscal 1997. The increase in selling, general and administrativeexpenses as a percentage of net sales for fiscal 1998 resulted fromincreased incentive compensation expenses.
FINANCIA.WPC 1/19/00 5:18 PM Page 21
MANAGEMENT’S DISCUSSION AND ANALYSIS OF RESULTS OF OPERATIONS AND FINANCIAL CONDITION
ROCK-TENN COMPANY
Plant Closings and Other Costs During fiscal 1999, we incurred plant closing and other costsrelated to announced facility closings. We generally accrue thecost of employee terminations at the time of notification to theemployees. Certain other costs, such as moving and relocationcosts, are expensed as incurred. These costs include the closingof a folding carton plant in Taylorsville, North Carolina, a lami-nated paperboard products operation in Otsego, Michigan, andan uncoated papermill serving our coverboard converting opera-tions in Jersey City, New Jersey. The closures resulted in the ter-mination of approximately 280 employees. In connection withthese closings, we incurred charges of $6.3 million, which con-sisted mainly of employee termination, equipment relocation,expected losses on the disposition of the facility and relatedexpenses. Of the $6.3 million, approximately $4.1 million waspaid in fiscal 1999, losses of $0.8 million were incurred in con-nection with disposal of inventory and other assets and the car-rying value of the Jersey City facility was reduced by $1.0 million,leaving a remaining liability of approximately $0.4 million atSeptember 30, 1999. Plant closing and other costs are not allocatedto the respective segments for financial reporting purposes. Hadthese costs been allocated, $3.9 million would have been chargedto the laminated paperboard, plastic packaging and recycled fibersegment and $2.4 million would have been charged to the pack-aging products segment. We have consolidated the operations ofthese closed plants into other existing facilities. In November 1999,we announced the closing of our Lynchburg, Virginia, laminatedpaperboard products plant. Severance, equipment relocation,and other one-time operational costs in connection with thisclosing are expected to reduce net income by approximately$5.5 million during the fiscal year ending September 2000. Weexpect that this consolidation will result in significantly lowercosts on an ongoing basis. No amounts have been accrued atSeptember 30, 1999 with respect to the Lynchburg closing.
During fiscal 1998, we began implementing certain costreduction initiatives designed to reduce overhead and productioncosts and improve operating efficiency. In connection with thesecost reduction initiatives, we terminated approximately 40employees and recorded $0.6 million and $2.0 million of costsrelated to these terminations during fiscal 1999 and 1998, respec-tively. We made payments of approximately $1.2 million and anominal amount during fiscal 1999 and 1998, respectively, relatedto these terminations. The remaining liability at September 30,1999 is $1.3 million, which is expected to be paid over the nexttwo years. Plant closing and other costs are not allocated to therespective segments for financial reporting purposes. Had thesecosts been allocated, $0.6 million and $0.3 million would havebeen charged to the laminated paperboard, plastic packaging andrecycled fiber segment in fiscal 1999 and 1998, respectively, and$1.7 million would have been charged to the packaging productssegment in fiscal 1998.
During fiscal 1997, in connection with the Waldorf acquisi-tion, we decided to close our folding carton plant at Mundelein,Illinois. The Mundelein facility was acquired in the acquisition of
Olympic Packaging. In connection with this closing, we incurreda charge of approximately $12.8 million during fiscal 1997 thatconsisted primarily of the non-cash write-off of goodwill associatedwith our Olympic Packaging subsidiary. The write-off of goodwillwas required based upon our decision to close the Mundeleinfacility and our determination, based on an analysis of estimatedfuture cash flows, that we could not recover this goodwill. Weincurred additional costs of approximately $1.6 million duringfiscal 1997 principally for employee termination and relatedcharges associated with closing the Mundelein facility, which werepaid during fiscal 1998 and 1999. In addition, during fiscal1997, we decided to close a plastics recycling facility located inIndianapolis, Indiana. As a result, we recorded charges ofapproximately $1.8 million related to the losses on disposal ofmachinery and equipment.
Segment Operating Income
Operating Income – Packaging Products Segment
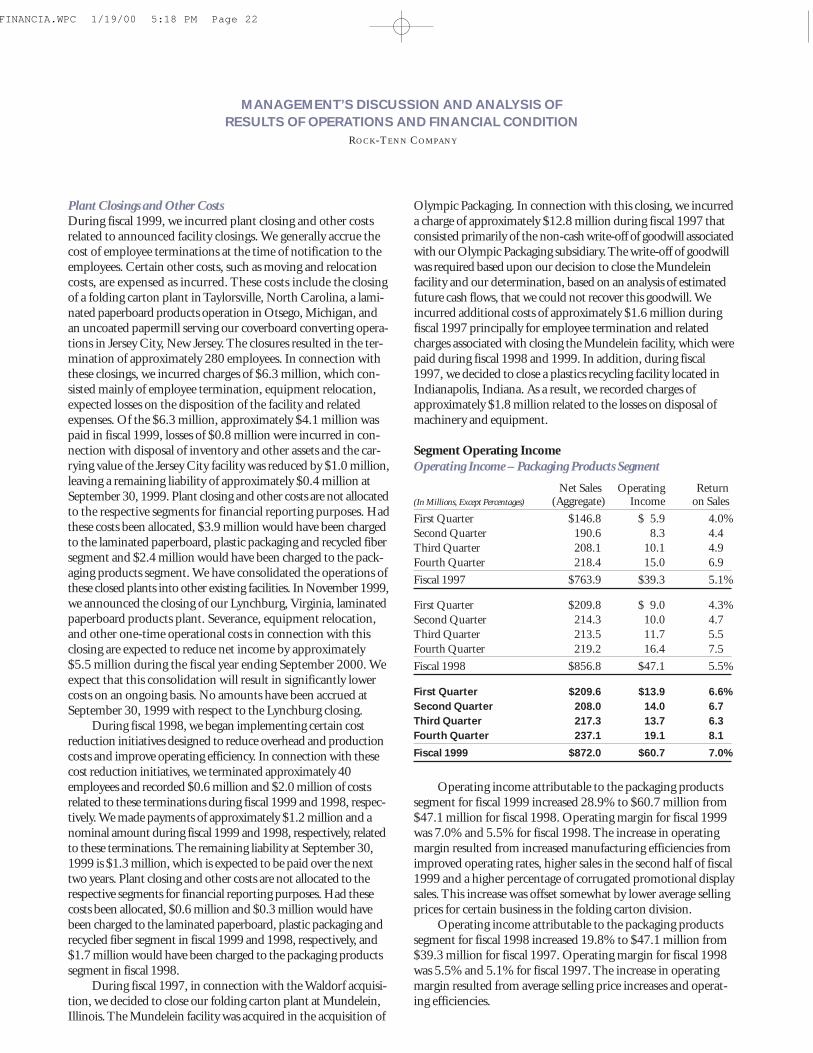
Net Sales Operating Return(In Millions, Except Percentages) (Aggregate) Income on Sales
First Quarter $146.8 $ 5.9 4.0%
Second Quarter 190.6 8.3 4.4
Third Quarter 208.1 10.1 4.9
Fourth Quarter 218.4 15.0 6.9
Fiscal 1997 $763.9 $39.3 5.1%
First Quarter $209.8 $ 9.0 4.3%
Second Quarter 214.3 10.0 4.7
Third Quarter 213.5 11.7 5.5
Fourth Quarter 219.2 16.4 7.5
Fiscal 1998 $856.8 $47.1 5.5%
First Quarter $209.6 $13.9 6.6%Second Quarter 208.0 14.0 6.7Third Quarter 217.3 13.7 6.3Fourth Quarter 237.1 19.1 8.1
Fiscal 1999 $872.0 $60.7 7.0%
Operating income attributable to the packaging productssegment for fiscal 1999 increased 28.9% to $60.7 million from$47.1 million for fiscal 1998. Operating margin for fiscal 1999was 7.0% and 5.5% for fiscal 1998. The increase in operatingmargin resulted from increased manufacturing efficiencies fromimproved operating rates, higher sales in the second half of fiscal1999 and a higher percentage of corrugated promotional displaysales. This increase was offset somewhat by lower average sellingprices for certain business in the folding carton division.
Operating income attributable to the packaging productssegment for fiscal 1998 increased 19.8% to $47.1 million from$39.3 million for fiscal 1997. Operating margin for fiscal 1998was 5.5% and 5.1% for fiscal 1997. The increase in operatingmargin resulted from average selling price increases and operat-ing efficiencies.
FINANCIA.WPC 1/19/00 5:18 PM Page 22
MANAGEMENT’S DISCUSSION AND ANALYSIS OF RESULTS OF OPERATIONS AND FINANCIAL CONDITION
ROCK-TENN COMPANY
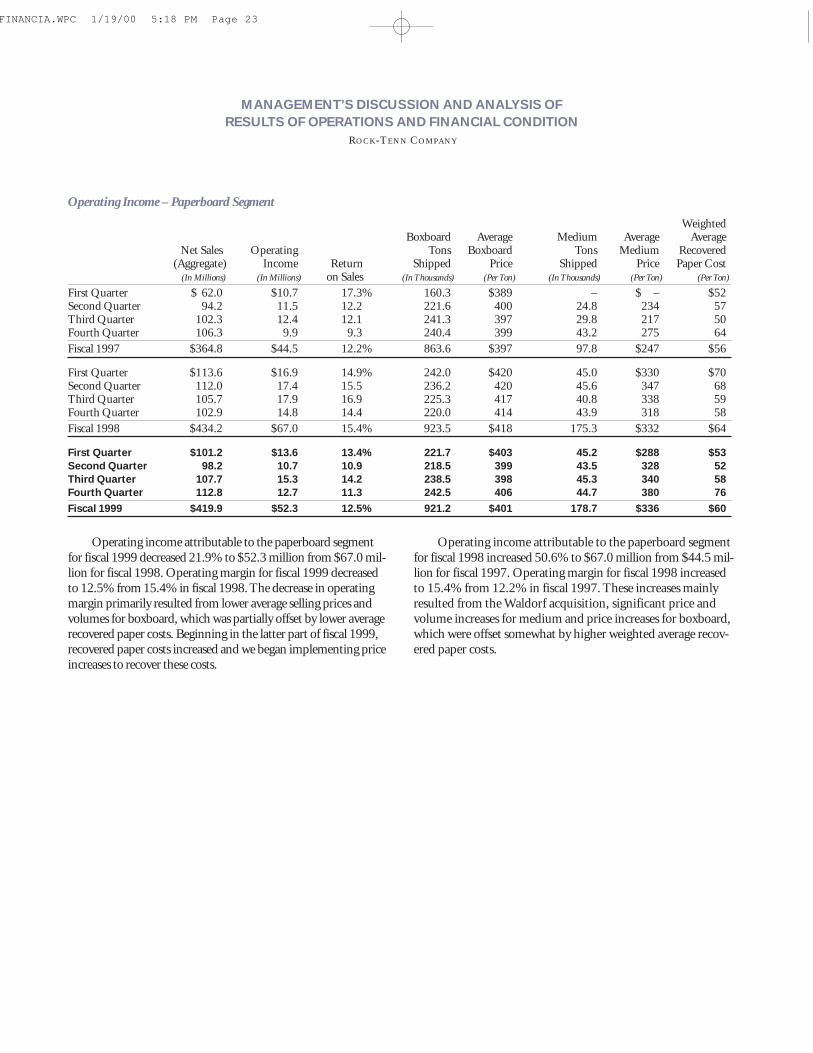
Operating Income – Paperboard Segment
WeightedBoxboard Average Medium Average Average
Net Sales Operating Tons Boxboard Tons Medium Recovered(Aggregate) Income Return Shipped Price Shipped Price Paper Cost
(In Millions) (In Millions) on Sales (In Thousands) (Per Ton) (In Thousands) (Per Ton) (Per Ton)
First Quarter $ 62.0 $10.7 17.3% 160.3 $389 – $ – $52Second Quarter 94.2 11.5 12.2 221.6 400 24.8 234 57Third Quarter 102.3 12.4 12.1 241.3 397 29.8 217 50Fourth Quarter 106.3 9.9 9.3 240.4 399 43.2 275 64
Fiscal 1997 $364.8 $44.5 12.2% 863.6 $397 97.8 $247 $56
First Quarter $113.6 $16.9 14.9% 242.0 $420 45.0 $330 $70Second Quarter 112.0 17.4 15.5 236.2 420 45.6 347 68Third Quarter 105.7 17.9 16.9 225.3 417 40.8 338 59Fourth Quarter 102.9 14.8 14.4 220.0 414 43.9 318 58
Fiscal 1998 $434.2 $67.0 15.4% 923.5 $418 175.3 $332 $64
First Quarter $101.2 $13.6 13.4% 221.7 $403 45.2 $288 $53 Second Quarter 98.2 10.7 10.9 218.5 399 43.5 328 52 Third Quarter 107.7 15.3 14.2 238.5 398 45.3 340 58 Fourth Quarter 112.8 12.7 11.3 242.5 406 44.7 380 76 Fiscal 1999 $419.9 $52.3 12.5% 921.2 $401 178.7 $336 $60
Operating income attributable to the paperboard segmentfor fiscal 1999 decreased 21.9% to $52.3 million from $67.0 mil-lion for fiscal 1998. Operating margin for fiscal 1999 decreasedto 12.5% from 15.4% in fiscal 1998. The decrease in operatingmargin primarily resulted from lower average selling prices andvolumes for boxboard, which was partially offset by lower averagerecovered paper costs. Beginning in the latter part of fiscal 1999,recovered paper costs increased and we began implementing priceincreases to recover these costs.
Operating income attributable to the paperboard segmentfor fiscal 1998 increased 50.6% to $67.0 million from $44.5 mil-lion for fiscal 1997. Operating margin for fiscal 1998 increasedto 15.4% from 12.2% in fiscal 1997. These increases mainlyresulted from the Waldorf acquisition, significant price andvolume increases for medium and price increases for boxboard,which were offset somewhat by higher weighted average recov-ered paper costs.
FINANCIA.WPC 1/19/00 5:18 PM Page 23
MANAGEMENT’S DISCUSSION AND ANALYSIS OF RESULTS OF OPERATIONS AND FINANCIAL CONDITION
ROCK-TENN COMPANY
Operating Income – Laminated Paperboard,
Plastic Packaging and Recycled Fiber Segment
Net Sales Operating Return(In Millions, Except Percentages) (Aggregate) Income on Sales
First Quarter $ 48.3 $(1.9) (3.9)%
Second Quarter 56.8 (0.5) (0.9)
Third Quarter 58.9 (0.2) (0.3)
Fourth Quarter 74.0 2.0 2.7
Fiscal 1997 $238.0 $(0.6) (0.3)%
First Quarter $ 69.6 $ 0.4 0.6%
Second Quarter 72.2 2.4 3.3
Third Quarter 66.0 1.9 2.9
Fourth Quarter 67.9 1.7 2.5
Fiscal 1998 $275.7 $ 6.4 2.3%
First Quarter $ 59.5 $ 0.1 0.2%Second Quarter 60.5 1.5 2.5Third Quarter 64.9 1.7 2.6Fourth Quarter 74.0 3.6 4.9
Fiscal 1999 $258.9 $ 6.9 2.7%
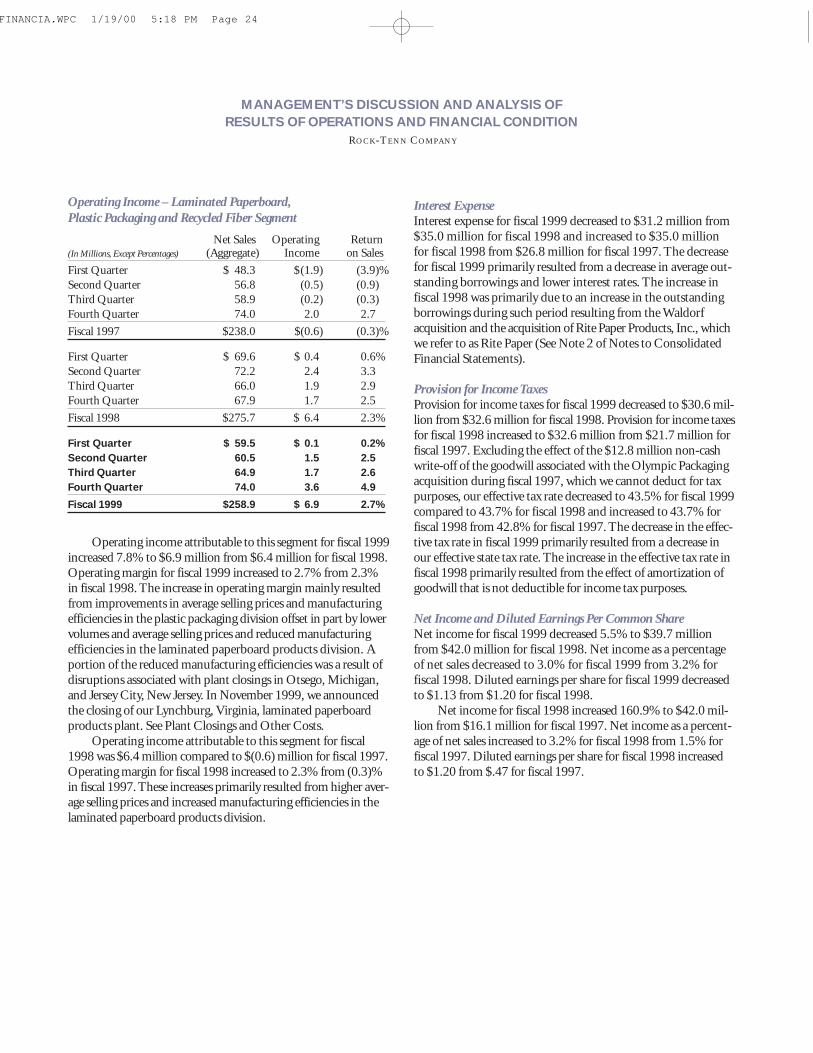
Operating income attributable to this segment for fiscal 1999increased 7.8% to $6.9 million from $6.4 million for fiscal 1998.Operating margin for fiscal 1999 increased to 2.7% from 2.3%in fiscal 1998. The increase in operating margin mainly resultedfrom improvements in average selling prices and manufacturingefficiencies in the plastic packaging division offset in part by lowervolumes and average selling prices and reduced manufacturingefficiencies in the laminated paperboard products division. Aportion of the reduced manufacturing efficiencies was a result ofdisruptions associated with plant closings in Otsego, Michigan,and Jersey City, New Jersey. In November 1999, we announcedthe closing of our Lynchburg, Virginia, laminated paperboardproducts plant. See Plant Closings and Other Costs.
Operating income attributable to this segment for fiscal1998 was $6.4 million compared to $(0.6) million for fiscal 1997.Operating margin for fiscal 1998 increased to 2.3% from (0.3)%in fiscal 1997. These increases primarily resulted from higher aver-age selling prices and increased manufacturing efficiencies in thelaminated paperboard products division.
Interest ExpenseInterest expense for fiscal 1999 decreased to $31.2 million from$35.0 million for fiscal 1998 and increased to $35.0 millionfor fiscal 1998 from $26.8 million for fiscal 1997. The decreasefor fiscal 1999 primarily resulted from a decrease in average out-standing borrowings and lower interest rates. The increase infiscal 1998 was primarily due to an increase in the outstandingborrowings during such period resulting from the Waldorfacquisition and the acquisition of Rite Paper Products, Inc., whichwe refer to as Rite Paper (See Note 2 of Notes to ConsolidatedFinancial Statements).
Provision for Income TaxesProvision for income taxes for fiscal 1999 decreased to $30.6 mil-lion from $32.6 million for fiscal 1998. Provision for income taxesfor fiscal 1998 increased to $32.6 million from $21.7 million forfiscal 1997. Excluding the effect of the $12.8 million non-cashwrite-off of the goodwill associated with the Olympic Packagingacquisition during fiscal 1997, which we cannot deduct for taxpurposes, our effective tax rate decreased to 43.5% for fiscal 1999compared to 43.7% for fiscal 1998 and increased to 43.7% forfiscal 1998 from 42.8% for fiscal 1997. The decrease in the effec-tive tax rate in fiscal 1999 primarily resulted from a decrease inour effective state tax rate. The increase in the effective tax rate infiscal 1998 primarily resulted from the effect of amortization ofgoodwill that is not deductible for income tax purposes.
Net Income and Diluted Earnings Per Common ShareNet income for fiscal 1999 decreased 5.5% to $39.7 millionfrom $42.0 million for fiscal 1998. Net income as a percentageof net sales decreased to 3.0% for fiscal 1999 from 3.2% forfiscal 1998. Diluted earnings per share for fiscal 1999 decreasedto $1.13 from $1.20 for fiscal 1998.
Net income for fiscal 1998 increased 160.9% to $42.0 mil-lion from $16.1 million for fiscal 1997. Net income as a percent-age of net sales increased to 3.2% for fiscal 1998 from 1.5% forfiscal 1997. Diluted earnings per share for fiscal 1998 increasedto $1.20 from $.47 for fiscal 1997.
FINANCIA.WPC 1/19/00 5:18 PM Page 24
MANAGEMENT’S DISCUSSION AND ANALYSIS OF RESULTS OF OPERATIONS AND FINANCIAL CONDITION
ROCK-TENN COMPANY
Market Risk Sensitive Instruments and Positions
We are exposed to market risk from changes in interest rates, for-eign exchange rates and commodity prices. To modify the riskfrom these interest rate, exchange rate and commodity pricefluctuations, we enter into various hedging transactions. Thesensitivity analyses presented do not consider the effect of possi-ble adverse changes in the economy generally, nor do they con-sider additional actions management may take to mitigate itsexposure to such changes.
Derivative InstrumentsWe enter into a variety of derivative transactions. Generally, wedesignate at inception that derivatives hedge risks associated withspecific assets, liabilities or future commitments and monitor eachderivative to determine if it remains an effective hedge. The effec-tiveness of the derivative as a hedge is based on a high correlationbetween changes in its value and changes in value of the underly-ing hedged item. We include in operations amounts received orpaid when the underlying transaction settles. We do not enter intoor hold derivatives for trading or speculative purposes.
We use interest rate cap agreements and interest rate swapagreements to manage synthetically the interest rate characteris-tics of a portion of our outstanding debt and to limit our expo-sure to rising interest rates. Amounts to be received or paid as a result of interest rate cap agreements and interest rate swapagreements are accrued and recognized as an adjustment tointerest expense related to the designated debt. The cost of pur-chasing interest rate caps are amortized to interest expense ratablyduring the life of the agreement. Gains or losses on termina-tions of interest rate swap agreements are deferred and amortizedas an adjustment to interest expense related to the debt over theremaining term of the original contract life of terminated swapagreements. In the event of the early extinguishment of a desig-nated debt obligation, any realized or unrealized gain or lossfrom the swap would be recognized in income at the time ofthe extinguishment.
We use forward contracts to limit our exposure to fluctua-tions in Canadian foreign currency rates with respect to ourreceivables denominated in Canadian dollars. The forward con-tracts are settled monthly and resulting gains or losses are recog-nized at the time of settlement.
We use commodity swap agreements to limit our exposureto falling selling prices and rising raw material costs for a portionof our recycled corrugating medium business. Amounts to bereceived or paid as a result of these swap agreements are recog-nized in the period in which the related sale is made.
Interest RatesWe are exposed to changes in interest rates, primarily as a resultof our short-term and long-term debt with both fixed and float-ing interest rates. We use interest rate agreements to effectivelycap the LIBOR rate on portions of the amount outstandingunder our revolving credit facility. In addition, we have used aninterest rate swap agreement to effectively fix the LIBOR rateon $100,000,000 of variable rate borrowings. If market interestrates had averaged 1.0% more than actual rates in fiscal 1999, ourinterest expense, after considering the effects of interest rate swapand cap agreements, would have increased, and income beforetaxes would have decreased, by approximately $3.0 million.Comparatively, if market interest rates had averaged 1.0% morethan actual rates in fiscal 1998, our interest expense, after consid-ering the effects of interest rate swap and cap agreements, wouldhave increased, and income before taxes would have decreased,by approximately $1.6 million. These amounts are determinedby considering the impact of the hypothetical interest rates onour borrowing costs and interest rate swap and cap agreements.These analyses do not consider the effects of the reduced level ofoverall economic activity that could exist in such an environment.
Foreign CurrencyWe are exposed to changes in foreign currency rates with respectto our foreign currency-denominated operating revenues andexpenses. We use forward contracts to limit exposure to fluctuationsin Canadian foreign currency rates, our largest exposure to foreigncurrency rates. For fiscal 1999, a uniform 10.0% strengtheningin the value of the dollar relative to the currency in which oursales are denominated would have resulted in an increase in grossprofit of $0.4 million for fiscal 1999. Comparatively, for fiscal1998, a uniform 10.0% strengthening in the value of the dollarrelative to the currency in which our sales are denominated wouldhave resulted in an increase in gross profit of $0.3 million for fis-cal 1998. This calculation assumes that each exchange rate wouldchange in the same direction relative to the U.S. dollar.
FINANCIA.WPC 1/19/00 5:18 PM Page 25
MANAGEMENT’S DISCUSSION AND ANALYSIS OF RESULTS OF OPERATIONS AND FINANCIAL CONDITION
ROCK-TENN COMPANY
In addition to the direct effect of changes in exchange rateson the dollar value of the resulting sales, changes in exchangerates also affect the volume of sales or the foreign currency salesprice as competitors’ products become more or less attractive.Our sensitivity analysis of the effects of changes in foreign currencyexchange rates does not factor in a potential change in sales levelsor local currency prices.
CommoditiesWe sell recycled medium to various customers. The principalraw material used in the production of medium is old corrugatedcontainers, or “OCC.”Medium and OCC prices and costsfluctuate widely due to changing market forces. As a result, wemake use of swap agreements to limit our exposure to fallingselling prices and rising raw material costs of a portion of ourrecycled medium business. We are exposed to market risk relatedto these instruments if selling prices rise above the fixed sellingprice of our swap agreements or if raw material costs fall belowthe fixed raw material cost of our swap agreements. We estimatemarket risk as a hypothetical 10.0% increase in selling prices ora 10% decrease in raw material costs. Based on 1999 mediumsales prices, such an increase would have resulted in lower sales of$1.7 million during fiscal 1999 because of our swaps on mediumprices. Based on 1999 OCC costs, such a decrease would haveresulted in higher costs of purchases of $0.7 million duringfiscal 1999 because of our swaps on OCC costs. We purchaseand sell a variety of commodities which are not subject toderivative commodity instruments including OCC, paperboardand recovered paper. Fluctuations in market prices of thesecommodities could have a material effect on our results of oper-ations. Such fluctuations are not reflected in the results above.
Liquidity and Capital Resources
Working Capital and Capital ExpendituresWe have funded our working capital requirements and capitalexpenditures, including acquisitions, from net cash provided byoperating activities, borrowings under term notes and bank creditfacilities and proceeds received in connection with the issuanceof industrial revenue bonds and debt and equity securities. Infiscal 1997, we entered into a revolving credit facility under whichwe have aggregate borrowing availability of $450.0 million. AtSeptember 30, 1999, we had $362.0 million outstanding underour revolving credit facility. Cash and cash equivalents, $4.5million at September 30, 1999, decreased from $5.8 million atSeptember 30, 1998.
Net cash provided by operating activities for fiscal 1999was $112.4 million compared to $125.7 million for fiscal 1998.This decrease primarily resulted from a larger change in operat-ing assets and liabilities during fiscal 1999 than fiscal 1998. Netcash used by financing activities aggregated $22.8 million forfiscal 1999 and consisted primarily of repayments of debt andquarterly dividend payments. Net cash used by financing activitiesaggregated $44.7 million for fiscal 1998 and consisted primarilyof repayments of debt and quarterly dividend payments. Netcash used for investing activities was $91.2 million for fiscal1999 compared to $78.4 million for fiscal 1998 and consistedprimarily of capital expenditures in both years.
Net cash provided by operating activities for fiscal 1998 was$125.7 million compared to $106.4 million for fiscal 1997. Thisincrease primarily resulted from increased earnings before depre-ciation and amortization and a smaller change in operating assetsand liabilities during fiscal 1998 than in fiscal 1997. Net cashused by financing activities aggregated $44.7 million for fiscal1998 and consisted primarily of repayments of debt and quarterlydividend payments. Net cash provided by financing activitiesaggregated $233.7 million for fiscal 1997 and consisted primarilyof borrowings under our $450.0 million revolving credit facility,net of scheduled repayments of long-term debt, repaymentsof certain acquired indebtedness of Waldorf and The DaveyCompany, which we refer to as Davey (See Note 2 of Notesto Consolidated Financial Statements), and quarterly dividendpayments. Net cash used for investing activities was $78.4 millionfor fiscal 1998 compared to $387.5 million for fiscal 1997 andconsisted primarily of capital expenditures for fiscal 1998 andcash paid for the Waldorf acquisition and capital expendituresfor fiscal 1997.
Our capital expenditures aggregated $92.3 million for fiscal1999. We used these expenditures primarily for the purchase andupgrading of machinery and equipment.
We currently estimate that our capital expenditures willaggregate approximately $70.0 million in fiscal 2000. We intendto use these expenditures for the purchase and upgrading ofmachinery and equipment and for building expansions andimprovements in one of our divisions. We believe that our finan-cial position would support higher levels of capital expenditures,if justified by opportunities to increase revenues or reduce costs,and we continuously review new investment opportunities.Accordingly, it is possible that our capital expenditures in fiscal2000 could be higher than previously anticipated.
We anticipate that we will be able to fund our capitalexpenditures, acquisitions, interest payments, stock repurchases,dividends and working capital needs for the foreseeable futurefrom cash generated from operations, borrowings under ourrevolving credit facility, proceeds from the issuance of debt orequity securities or other additional long-term debt financing.
FINANCIA.WPC 1/19/00 5:18 PM Page 26
MANAGEMENT’S DISCUSSION AND ANALYSIS OF RESULTS OF OPERATIONS AND FINANCIAL CONDITION
ROCK-TENN COMPANY
AcquisitionsOn January 21, 1997, we completed the Waldorf acquisition forapproximately $239.0 million in cash. In addition, in connectionwith the Waldorf acquisition, we (1) made certain payments onthe closing date aggregating $32.6 million, relating to the settle-ment of a contingent interest agreement with a former creditorof Waldorf and the termination of Waldorf ’s Stock AppreciationRights Plan and (2) accrued as a cost of the purchase $5.3 millionin connection with the planned termination of approximately120 employees of Waldorf, principally certain senior executivesand other employees at the Waldorf corporate office. We financedthe Waldorf acquisition with available cash and borrowings underour revolving credit facility.
On June 9, 1997, we completed the Rite Paper acquisition.We financed this acquisition with borrowings under our revolvingcredit facility.
On July 9, 1997, we completed the Davey acquisition. Wefinanced the acquisition through the issuance of 867,510 sharesof our Class A common stock.
On September 5, 1997, we combined our fiber partitionbusiness assets with Sonoco Company’s fiber partition businessassets to form RTS Packaging. Pursuant to the agreement, we own65% of the outstanding interests of RTS Packaging.
Stock Repurchase ProgramThe Board of Directors has authorized the repurchase from timeto time prior to July 31, 2003 of up to 1.5 million shares of Class Acommon stock in open market transactions on the New YorkStock Exchange. In addition, the Board has authorized the repur-chase from time to time of shares of Class B common stock pursuantto certain first offer rights contained in our Restated and AmendedArticles of Incorporation, provided that the aggregate number ofshares of Class A and Class B common stock purchased under thisplan may not exceed 1.5 million shares. During fiscal 1998, werepurchased 290,100 shares of Class A common stock and noClass B common stock under this plan. There were no repurchasesof shares in fiscal 1999.
Year 2000
We have used both internal and external resources to evaluate thepotential impact of the situation commonly referred to as the“Year 2000 problem.” The Year 2000 problem, which is commonto most businesses, concerns the inability of certain computersystems and devices to properly recognize and process date-sensi-tive information when the year changes to 2000. We dependupon our information technology (“IT”) and non-IT systems(used to run manufacturing equipment that contain embeddedhardware or software that must handle dates and may not prop-erly record dates after 1999) to conduct and manage our busi-ness. Unless remediated, Year 2000 related issues may materiallyadversely affect our results of operations, financial condition andcash flows as well as that of one or more of our suppliers or cus-tomers. While we obtain raw materials, equipment and services
from a number of suppliers and sell our products to a number ofcustomers for a wide variety of applications, if a sufficient numberof these suppliers or customers experience Year 2000 problems thatprevent or substantially impair their ability to continue to transactbusiness with us as they currently do, we would be required tofind alternative suppliers and/or customers for these products.Any delay or inability in finding such alternatives could have amaterial adverse effect on our results of operations, financial con-dition and cash flows.
We currently have a team dedicated to identifying, evaluatingand resolving our potential Year 2000 issues. Our Year 2000 pro-gram included six stages: education, inventory, assessment, remedi-ation, testing and implementation. The education stage involvedidentifying Year 2000 leaders at each of our facilities and educat-ing our personnel on the specific issues associated with the Year2000 problem. During the inventory stage, our personnel iden-tified any system (IT and non-IT) that could potentially have aYear 2000 problem and developed software that is now beingused to centrally track these identified systems. The assessmentstage involved determining if there was a Year 2000 problem withthe specific system (IT and non-IT). Remediation involveddeciding what action to take if there was a Year 2000 problem,such as modifying or replacing the system, and actually fixing theproblem. We tested each affected system once the remediationwas complete. When it was determined that the system was Year2000 compliant, the system was implemented. As of Septem-ber 30, 1999, all of our mission-critical systems had been remedi-ated and tested for the Year 2000, including all business systems.
We currently believe that we have modified, upgraded orreplaced all of our critical IT and non-IT systems affected by theYear 2000 problem. In the event that we have not adequatelyremediated our material Year 2000 problems, we may be unableto, among other things, take customer orders, manufacture andship products, invoice customers or collect payments. Under anumber of our supply agreements, we are required to indemnifyand hold harmless customers for damages incurred by such cus-tomers arising from our failure to resolve our Year 2000 problems.The amount of any potential liability and/or lost revenue can-not be reasonably estimated at this time; however, such amountscould be material.
In connection with our Year 2000 program, we have analyzedthe need for contingent arrangements. To the extent we experi-ence a Year 2000 problem, we intend to respond appropriately.We have multiple vendors for all critical raw materials, higherinventories of spare parts for our critical machinery, multiplefacilities with the ability to shift manufacturing among facilities,multiple vendors to deliver products to customers as well asalternative methods of distribution and higher inventories insome product lines to meet customer demand in the event of adisruption. However, if we experience a Year 2000 problem, wecannot guarantee that our response will be timely or effective toprevent an adverse impact on our results of operations, financialcondition and cash flows during the period in which we areremediating the problem. Any such impact could be material.
FINANCIA.WPC 1/19/00 5:18 PM Page 27
MANAGEMENT’S DISCUSSION AND ANALYSIS OF RESULTS OF OPERATIONS AND FINANCIAL CONDITION
ROCK-TENN COMPANY
We have conducted a program to assess the Year 2000 readi-ness of our suppliers. This program has involved identifyingsuppliers that are critical to our operations as well as suppliers thatwould be difficult to replace and conducting a survey of thesesuppliers to assess their Year 2000 readiness. We have receivedassurances from substantially all suppliers of business-criticalgoods and services that they are or will be Year 2000 ready, althoughwe cannot guarantee that this will be the case. We cannot reason-ably estimate the magnitude of the impact on us of the Year 2000problems that may be experienced by any of our suppliers; how-ever, the impact of any such problems could have a materialadverse effect on our results of operations, financial conditionand cash flows.
We have not assessed the Year 2000 problems, if any, of ourcustomers. To the extent customers experience Year 2000 prob-lems that are not remediated on a timely basis, we anticipatepotential material fluctuations in the demand for our products.
While we believe the occurrence of such a scenario is unlikely,a possible worst-case scenario might include the inadvertent failureto adequately remediate the process controllers (which are non-ITsystems) on one or more of our paper machines. Depending onthe number of machines affected, such an event could have anadverse impact on our ability to manufacture paperboard andto supply our converting operations, which, depending on itsduration, could have a material adverse effect on our results ofoperations, financial condition and cash flows.
Costs associated with the Year 2000 program (excludingcosts relating to capital improvements to IT and non-IT systemsthat are not directly related to remediating Year 2000 problemsin such systems) have been expensed as incurred. We have financedthe expenses with cash from operations. These expenses representapproximately 20% of the Company’s Information Systemsbudget. To date, we have spent approximately $0.4 million inthe education and inventory stages, $0.4 million in the assessmentstage, $2.0 million in the remediation stage, $0.4 million in thetesting stage and $0.8 million in the implementation stage andwe expect to spend an additional $0.5 million to complete ourYear 2000 program. There can be no assurance that we will notincur additional costs for unanticipated Year 2000 problems.Certain other system-related projects have been deferred dueto the Year 2000 program.
Expenditures for Environmental Compliance
We are subject to various Federal, state, local and foreign envi-ronmental laws and regulations, including those regulating thedischarge, storage, handling and disposal of a variety of substances.These laws and regulations include, among others, the Compre-hensive Environmental Response, Compensation and LiabilityAct, which we refer to as CERCLA, the Clean Air Act (as amendedin 1990), the Clean Water Act, the Resource Conservation andRecovery Act (including amendments relating to undergroundtanks) and the Toxic Substances Control Act. These environmen-tal regulatory programs are primarily administered by the U.S.Environmental Protection Agency. In addition, some states inwhich we operate have adopted equivalent or more stringentenvironmental laws and regulations, or have enacted their ownparallel environmental programs, which are enforced throughvarious state administrative agencies.
We do not believe that future compliance with these envi-ronmental laws and regulations will have a material adverse effecton our results of operations, financial condition or cash flows.However, environmental laws and regulations are becomingincreasingly stringent. Consequently, our compliance andremediation costs could increase materially. In addition, wecannot currently assess with certainty the impact that the futureemissions standards and enforcement practices under the 1990amendments to the Clean Air Act will have on our operationsor capital expenditure requirements. However, we believe thatany such impact or capital expenditures will not have a materialadverse effect on our results of operations, financial conditionor cash flows.
We estimate that we will spend $1.0 to $3.0 million forcapital expenditures during fiscal year 2000 in connection withmatters relating to environmental compliance.
In addition, we may choose to modify or replace the coal firedboilers at two of our facilities in order to operate cost effectivelywhile complying with emissions regulations under the Clean AirAct. We estimate these improvements will cost approximately$9.0 million.
We have been identified as a potentially responsible party,which we refer to as a PRP, at nine “superfund” sites pursuant toCERCLA or comparable state statutes. No remediation costs orallocations have been determined with respect to such sites otherthan costs that were not material to us. Based upon currentlyavailable information and the opinions of our environmentalcompliance managers and general counsel, although there canbe no assurance, we believe that any liability we may have atany site will not have a material adverse effect on our results ofoperations, financial condition or cash flows.
FINANCIA.WPC 1/19/00 5:18 PM Page 28
MANAGEMENT’S DISCUSSION AND ANALYSIS OF RESULTS OF OPERATIONS AND FINANCIAL CONDITION
ROCK-TENN COMPANY
On February 9, 1999, we received a letter from the MichiganDepartment of Environmental Quality, which we refer to asMDEQ, in which the MDEQ alleges that we are in violation ofthe Michigan Natural Resources and Environmental ProtectionAct, as well as the facility’s wastewater discharge permit at oneof our Michigan facilities. The letter alleges that we exceededseveral numerical limitations for chemical parameters outlinedin the wastewater permit and violated other wastewater dischargecriteria. The MDEQ further alleges that we are liable for con-tamination contained on the facility property as well as for con-tributing contamination to the Kalamazoo River site. The letterrequests that we commit, in the form of a binding agreement, toundertake the necessary and appropriate response activities andresponse actions to address contamination in both areas. We haveagreed to enter into an administrative consent order pursuant towhich improvements will be made to the facility’s wastewatertreatment system and we will pay a $75,000 fine for the allegedviolations. We have also agreed to pay an additional $30,000 forpast and future oversight costs incurred by the State of Michigan.We will pay this additional amount in three equal payments overthe next three years. The cost of making upgrades to the processwaste system and wastewater treatment systems is estimated tobe approximately $1,000,000. Nothing contained in the orderwill constitute an admission of liability or any factual finding,allegation or legal conclusion on our part. The order is expectedto be completed during the second quarter of fiscal 2000.
New Accounting Standards
In June 1998, the Financial Accounting Standards Boardissued Statement of Financial Accounting Standards No. 133(“SFAS 133”), “Accounting for Derivative Instruments andHedging Activities.” This statement requires the fair value ofderivatives to be recorded as assets or liabilities. Gains or lossesresulting from changes in the fair values of derivatives would beaccounted for currently in earnings or comprehensive incomedepending on the purpose of the derivatives and whether theyqualify for hedge accounting treatment. SFAS 133 is requiredto be adopted in fiscal 2001. We are currently evaluating SFAS133 and have not yet determined its impact on our consolidatedfinancial statements.
Forward-Looking Statements
Statements herein regarding, among other things, estimatedcapital expenditures for fiscal 2000, the anticipated impact andcost of remediating Year 2000 problems and expected expendi-tures for environmental law compliance, constitute forward-looking statements within the meaning of the Securities Act of1933 and the Securities Exchange Act of 1934. Such statementsare subject to certain risks and uncertainties that could causeactual amounts to differ materially from those projected. Withrespect to these forward-looking statements, management hasmade assumptions regarding, among other things, the amountand timing of expected capital expenditures, the extent of ourand certain third parties’ Year 2000 problems, the costs toremedy such problems, the estimated cost of compliance withenvironmental laws, the expected resolution of various pendingenvironmental matters, competition conditions in our businessesand general economic conditions. These forward-looking state-ments are subject to certain risks including, among others, thatthe amount of necessary capital expenditures has been underesti-mated; the extent of our Year 2000 problems and the costs toremedy, and the likely impact of, such problems has been under-estimated; the cost of compliance with environmental laws hasbeen underestimated; and expected outcomes of various pend-ing environmental matters are inaccurate. In addition, our per-formance in future periods is subject to other risks including,among others, decreases in demand for our products, increasesin raw material costs, fluctuations in selling prices, the adverseactions of our customers, the adverse actions of our competitorsand our suppliers and adverse changes in general market andindustry conditions. We believe these estimates are reasonable;however, undue reliance should not be placed on such estimateswhich are based on current expectations.
FINANCIA.WPC 1/19/00 5:18 PM Page 29
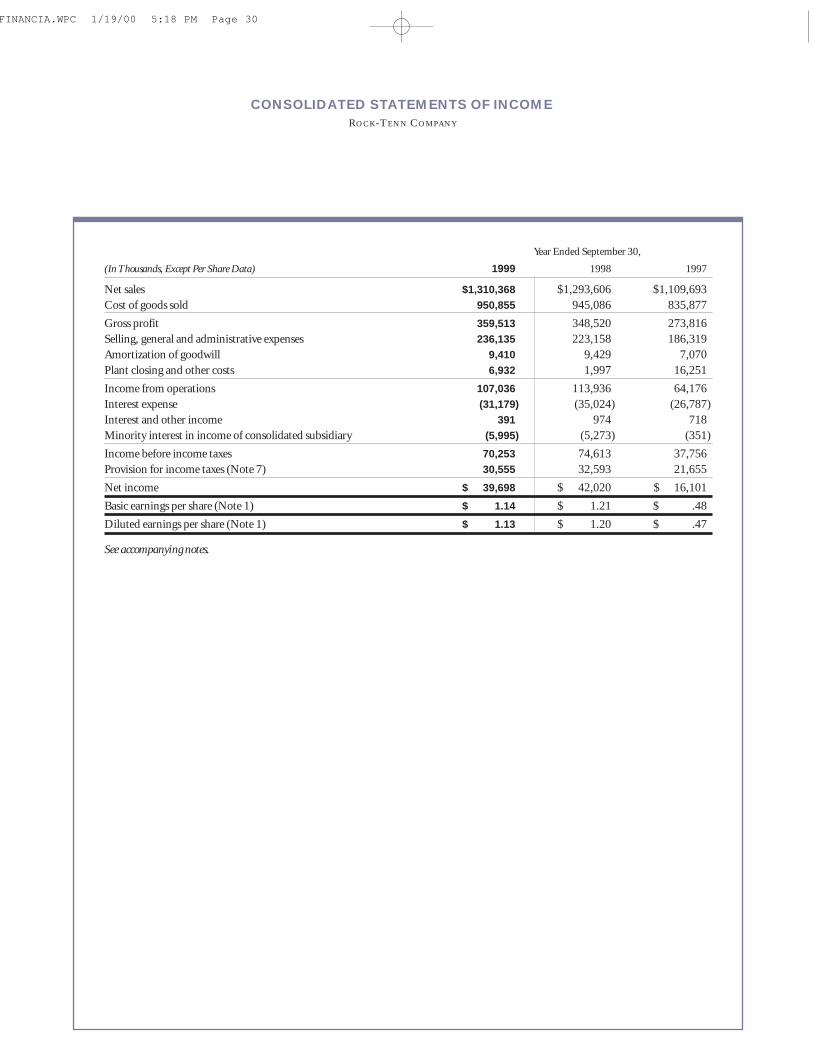
CONSOLIDATED STATEMENTS OF INCOME ROCK-TENN COMPANY
Year Ended September 30,
(In Thousands, Except Per Share Data) 1999 1998 1997
Net sales $1,310,368 $1,293,606 $1,109,693
Cost of goods sold 950,855 945,086 835,877
Gross profit 359,513 348,520 273,816
Selling, general and administrative expenses 236,135 223,158 186,319
Amortization of goodwill 9,410 9,429 7,070
Plant closing and other costs 6,932 1,997 16,251
Income from operations 107,036 113,936 64,176
Interest expense (31,179) (35,024) (26,787)
Interest and other income 391 974 718
Minority interest in income of consolidated subsidiary (5,995) (5,273) (351)
Income before income taxes 70,253 74,613 37,756
Provision for income taxes (Note 7) 30,555 32,593 21,655
Net income $ 39,698 $ 42,020 $ 16,101
Basic earnings per share (Note 1) $ 1.14 $ 1.21 $ .48
Diluted earnings per share (Note 1) $ 1.13 $ 1.20 $ .47
See accompanying notes.
FINANCIA.WPC 1/19/00 5:18 PM Page 30
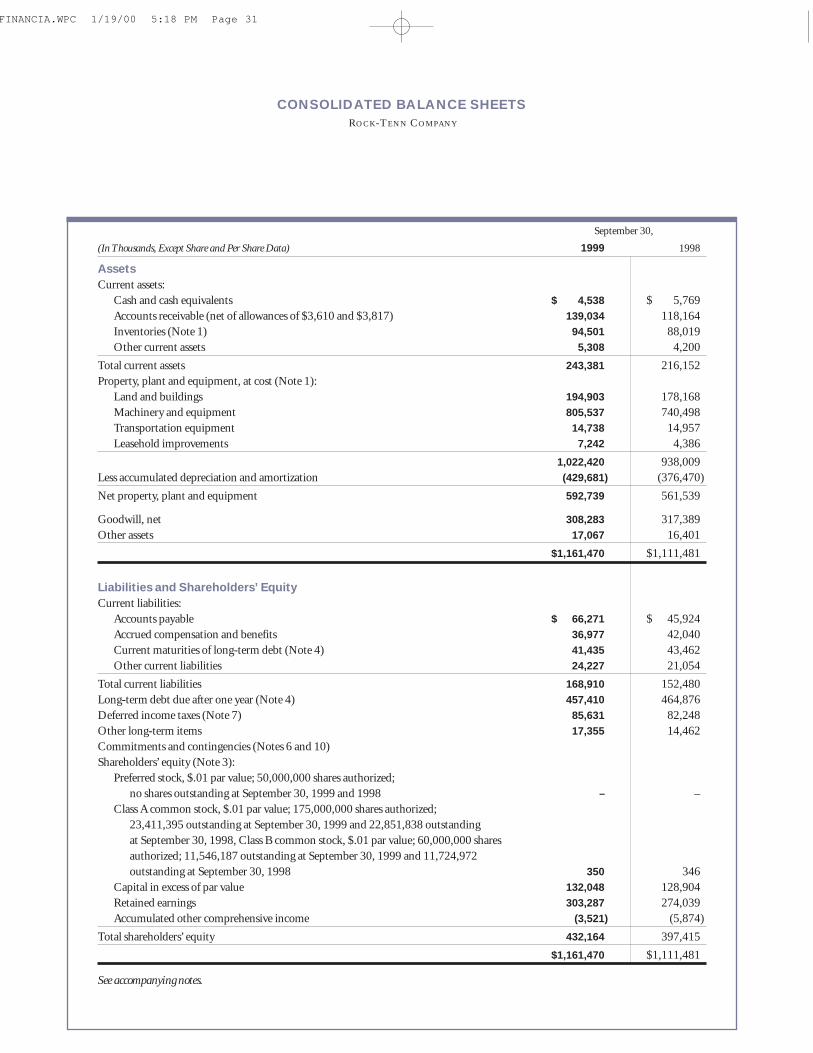
CONSOLIDATED BALANCE SHEETS ROCK-TENN COMPANY
September 30,
(In Thousands, Except Share and Per Share Data) 1999 1998
AssetsCurrent assets:
Cash and cash equivalents $ 4,538 $ 5,769
Accounts receivable (net of allowances of $3,610 and $3,817) 139,034 118,164
Inventories (Note 1) 94,501 88,019
Other current assets 5,308 4,200
Total current assets 243,381 216,152
Property, plant and equipment, at cost (Note 1):
Land and buildings 194,903 178,168
Machinery and equipment 805,537 740,498
Transportation equipment 14,738 14,957
Leasehold improvements 7,242 4,386
1,022,420 938,009
Less accumulated depreciation and amortization (429,681) (376,470)
Net property, plant and equipment 592,739 561,539
Goodwill, net 308,283 317,389
Other assets 17,067 16,401
$1,161,470 $1,111,481
Liabilities and Shareholders’ EquityCurrent liabilities:
Accounts payable $ 66,271 $ 45,924
Accrued compensation and benefits 36,977 42,040
Current maturities of long-term debt (Note 4) 41,435 43,462
Other current liabilities 24,227 21,054
Total current liabilities 168,910 152,480
Long-term debt due after one year (Note 4) 457,410 464,876
Deferred income taxes (Note 7) 85,631 82,248
Other long-term items 17,355 14,462
Commitments and contingencies (Notes 6 and 10)
Shareholders’ equity (Note 3):
Preferred stock, $.01 par value; 50,000,000 shares authorized;
no shares outstanding at September 30, 1999 and 1998 – –
Class A common stock, $.01 par value; 175,000,000 shares authorized;
23,411,395 outstanding at September 30, 1999 and 22,851,838 outstanding
at September 30, 1998, Class B common stock, $.01 par value; 60,000,000 shares
authorized; 11,546,187 outstanding at September 30, 1999 and 11,724,972
outstanding at September 30, 1998 350 346
Capital in excess of par value 132,048 128,904
Retained earnings 303,287 274,039
Accumulated other comprehensive income (3,521) (5,874)
Total shareholders’ equity 432,164 397,415
$1,161,470 $1,111,481
See accompanying notes.
FINANCIA.WPC 1/19/00 5:18 PM Page 31
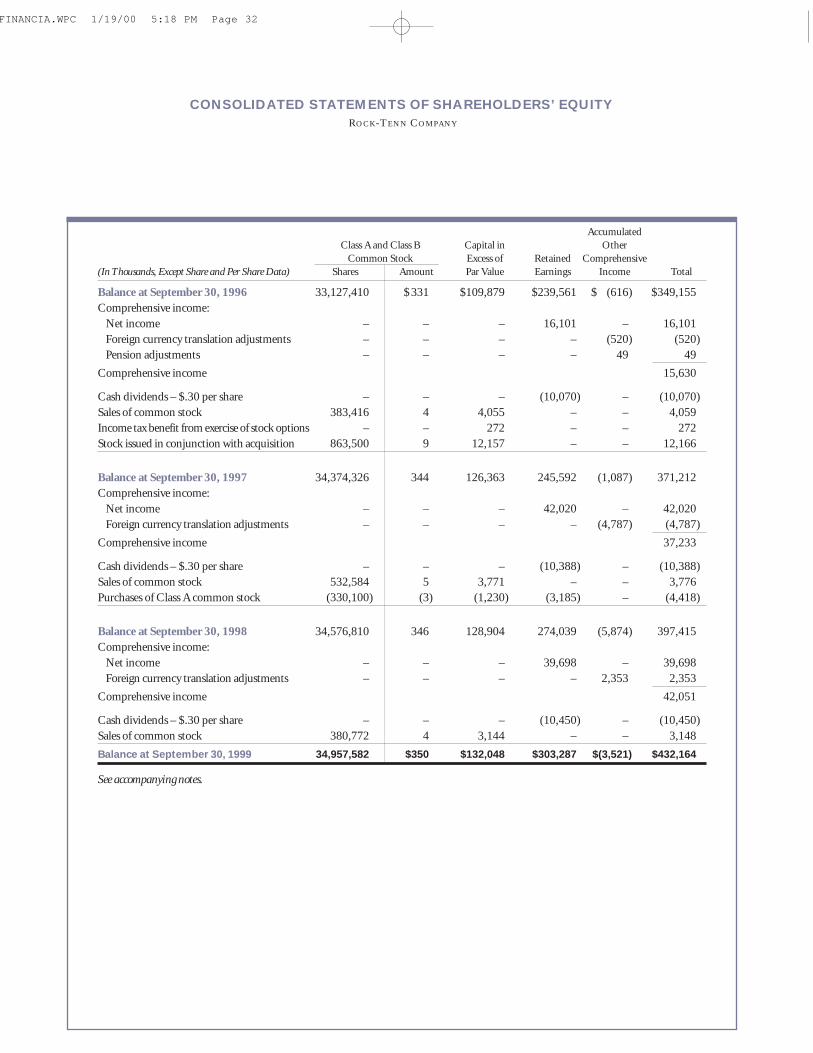
CONSOLIDATED STATEMENTS OF SHAREHOLDERS’ EQUITY ROCK-TENN COMPANY
Accumulated
Class A and Class B Capital in Other
Common Stock Excess of Retained Comprehensive
(In Thousands, Except Share and Per Share Data) Shares Amount Par Value Earnings Income Total
Balance at September 30, 1996 33,127,410 $331 $109,879 $239,561 $ (616) $349,155
Comprehensive income:
Net income – – – 16,101 – 16,101
Foreign currency translation adjustments – – – – (520) (520)
Pension adjustments – – – – 49 49
Comprehensive income 15,630
Cash dividends – $.30 per share – – – (10,070) – (10,070)
Sales of common stock 383,416 4 4,055 – – 4,059
Income tax benefit from exercise of stock options – – 272 – – 272
Stock issued in conjunction with acquisition 863,500 9 12,157 – – 12,166
Balance at September 30, 1997 34,374,326 344 126,363 245,592 (1,087) 371,212
Comprehensive income:
Net income – – – 42,020 – 42,020
Foreign currency translation adjustments – – – – (4,787) (4,787)
Comprehensive income 37,233
Cash dividends – $.30 per share – – – (10,388) – (10,388)
Sales of common stock 532,584 5 3,771 – – 3,776
Purchases of Class A common stock (330,100) (3) (1,230) (3,185) – (4,418)
Balance at September 30, 1998 34,576,810 346 128,904 274,039 (5,874) 397,415
Comprehensive income:
Net income – – – 39,698 – 39,698
Foreign currency translation adjustments – – – – 2,353 2,353
Comprehensive income 42,051
Cash dividends – $.30 per share – – – (10,450) – (10,450)
Sales of common stock 380,772 4 3,144 – – 3,148
Balance at September 30, 1999 34,957,582 $350 $132,048 $303,287 $(3,521) $432,164
See accompanying notes.
FINANCIA.WPC 1/19/00 5:18 PM Page 32
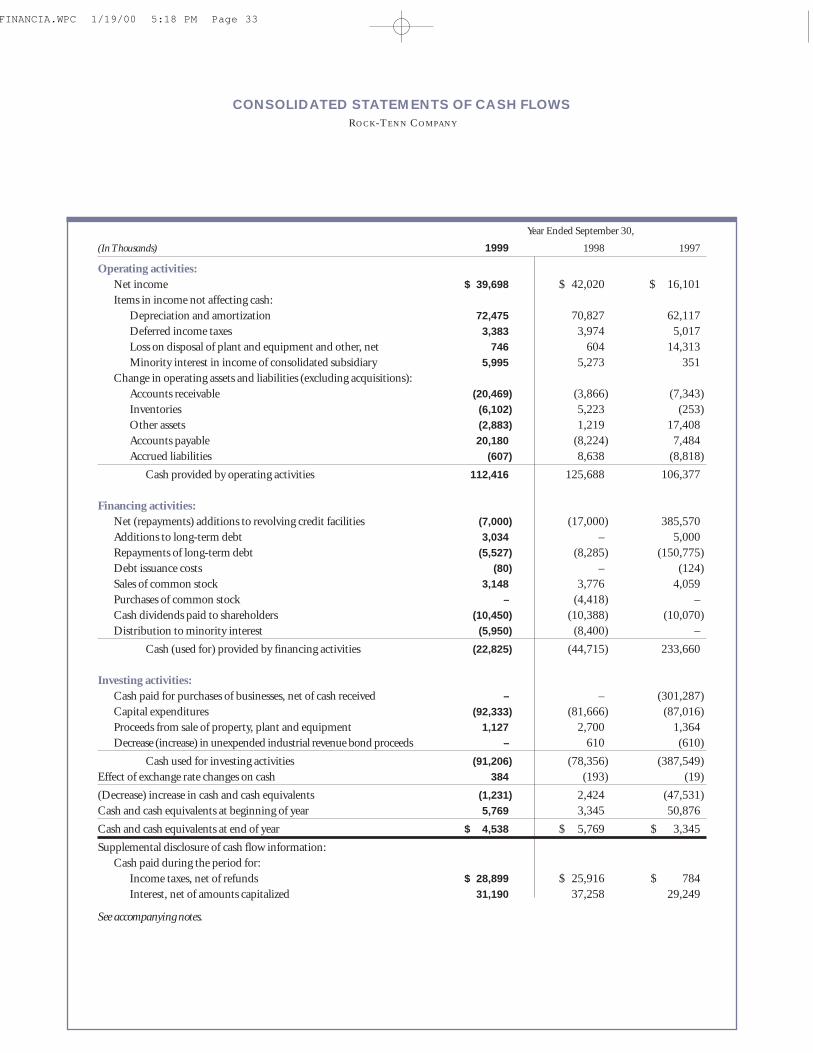
CONSOLIDATED STATEMENTS OF CASH FLOWS ROCK-TENN COMPANY
Year Ended September 30,
(In Thousands) 1999 1998 1997
Operating activities:
Net income $ 39,698 $ 42,020 $ 16,101
Items in income not affecting cash:
Depreciation and amortization 72,475 70,827 62,117
Deferred income taxes 3,383 3,974 5,017
Loss on disposal of plant and equipment and other, net 746 604 14,313
Minority interest in income of consolidated subsidiary 5,995 5,273 351
Change in operating assets and liabilities (excluding acquisitions):
Accounts receivable (20,469) (3,866) (7,343)
Inventories (6,102) 5,223 (253)
Other assets (2,883) 1,219 17,408
Accounts payable 20,180 (8,224) 7,484
Accrued liabilities (607) 8,638 (8,818)
Cash provided by operating activities 112,416 125,688 106,377
Financing activities:
Net (repayments) additions to revolving credit facilities (7,000) (17,000) 385,570
Additions to long-term debt 3,034 – 5,000
Repayments of long-term debt (5,527) (8,285) (150,775)
Debt issuance costs (80) – (124)
Sales of common stock 3,148 3,776 4,059
Purchases of common stock – (4,418) –
Cash dividends paid to shareholders (10,450) (10,388) (10,070)
Distribution to minority interest (5,950) (8,400) –
Cash (used for) provided by financing activities (22,825) (44,715) 233,660
Investing activities:
Cash paid for purchases of businesses, net of cash received – – (301,287)
Capital expenditures (92,333) (81,666) (87,016)
Proceeds from sale of property, plant and equipment 1,127 2,700 1,364
Decrease (increase) in unexpended industrial revenue bond proceeds – 610 (610)
Cash used for investing activities (91,206) (78,356) (387,549)
Effect of exchange rate changes on cash 384 (193) (19)
(Decrease) increase in cash and cash equivalents (1,231) 2,424 (47,531)
Cash and cash equivalents at beginning of year 5,769 3,345 50,876
Cash and cash equivalents at end of year $ 4,538 $ 5,769 $ 3,345
Supplemental disclosure of cash flow information:
Cash paid during the period for:
Income taxes, net of refunds $ 28,899 $ 25,916 $ 784
Interest, net of amounts capitalized 31,190 37,258 29,249
See accompanying notes.
FINANCIA.WPC 1/19/00 5:18 PM Page 33
NOTES TO CONSOLIDATED FINANCIAL STATEMENTSROCK-TENN COMPANY
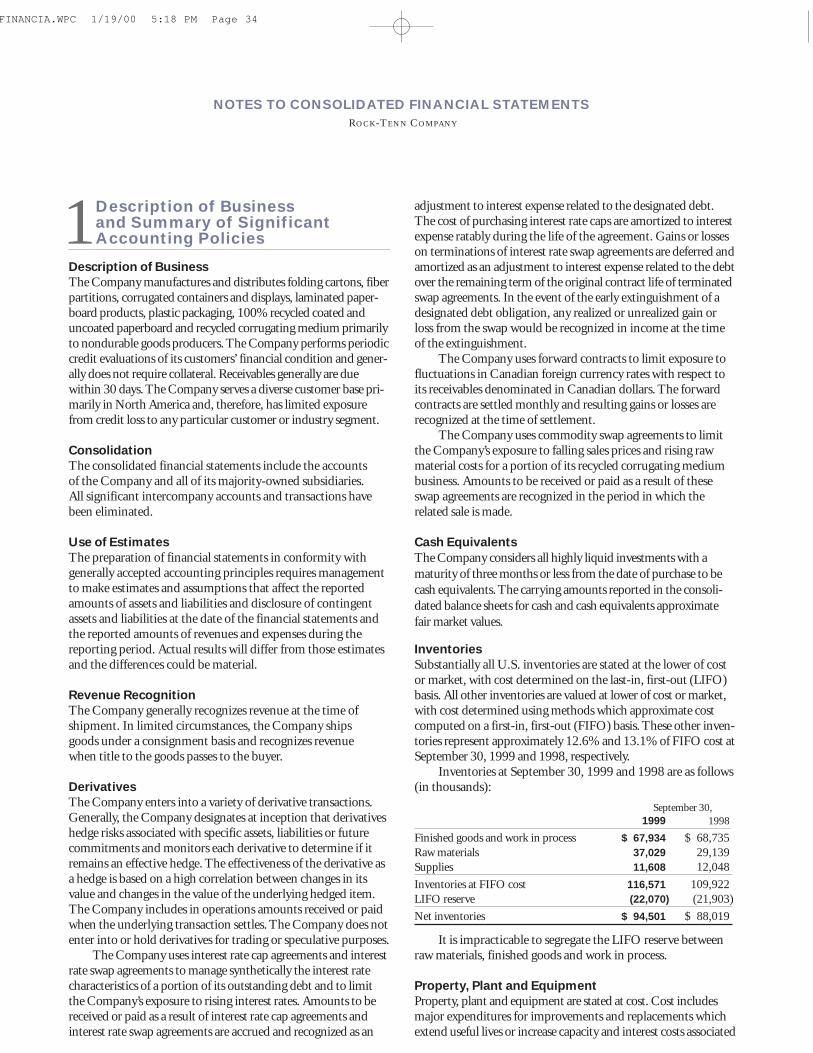
1Description of Business and Summary of SignificantAccounting Policies
Description of Business The Company manufactures and distributes folding cartons, fiberpartitions, corrugated containers and displays, laminated paper-board products, plastic packaging, 100% recycled coated anduncoated paperboard and recycled corrugating medium primarilyto nondurable goods producers. The Company performs periodiccredit evaluations of its customers’ financial condition and gener-ally does not require collateral. Receivables generally are duewithin 30 days. The Company serves a diverse customer base pri-marily in North America and, therefore, has limited exposurefrom credit loss to any particular customer or industry segment.
ConsolidationThe consolidated financial statements include the accounts of the Company and all of its majority-owned subsidiaries. All significant intercompany accounts and transactions have been eliminated.
Use of EstimatesThe preparation of financial statements in conformity withgenerally accepted accounting principles requires managementto make estimates and assumptions that affect the reportedamounts of assets and liabilities and disclosure of contingentassets and liabilities at the date of the financial statements andthe reported amounts of revenues and expenses during thereporting period. Actual results will differ from those estimatesand the differences could be material.
Revenue RecognitionThe Company generally recognizes revenue at the time of shipment. In limited circumstances, the Company ships goods under a consignment basis and recognizes revenue when title to the goods passes to the buyer.
DerivativesThe Company enters into a variety of derivative transactions.Generally, the Company designates at inception that derivativeshedge risks associated with specific assets, liabilities or futurecommitments and monitors each derivative to determine if itremains an effective hedge. The effectiveness of the derivative asa hedge is based on a high correlation between changes in itsvalue and changes in the value of the underlying hedged item.The Company includes in operations amounts received or paidwhen the underlying transaction settles. The Company does notenter into or hold derivatives for trading or speculative purposes.
The Company uses interest rate cap agreements and interestrate swap agreements to manage synthetically the interest ratecharacteristics of a portion of its outstanding debt and to limitthe Company’s exposure to rising interest rates. Amounts to bereceived or paid as a result of interest rate cap agreements andinterest rate swap agreements are accrued and recognized as an
adjustment to interest expense related to the designated debt.The cost of purchasing interest rate caps are amortized to interestexpense ratably during the life of the agreement. Gains or losseson terminations of interest rate swap agreements are deferred andamortized as an adjustment to interest expense related to the debtover the remaining term of the original contract life of terminatedswap agreements. In the event of the early extinguishment of adesignated debt obligation, any realized or unrealized gain orloss from the swap would be recognized in income at the timeof the extinguishment.
The Company uses forward contracts to limit exposure tofluctuations in Canadian foreign currency rates with respect toits receivables denominated in Canadian dollars. The forwardcontracts are settled monthly and resulting gains or losses arerecognized at the time of settlement.
The Company uses commodity swap agreements to limitthe Company’s exposure to falling sales prices and rising rawmaterial costs for a portion of its recycled corrugating mediumbusiness. Amounts to be received or paid as a result of theseswap agreements are recognized in the period in which therelated sale is made.
Cash EquivalentsThe Company considers all highly liquid investments with a
maturity of three months or less from the date of purchase to be
cash equivalents. The carrying amounts reported in the consoli-
dated balance sheets for cash and cash equivalents approximate
fair market values.
InventoriesSubstantially all U.S. inventories are stated at the lower of costor market, with cost determined on the last-in, first-out (LIFO)basis. All other inventories are valued at lower of cost or market,with cost determined using methods which approximate costcomputed on a first-in, first-out (FIFO) basis. These other inven-tories represent approximately 12.6% and 13.1% of FIFO cost atSeptember 30, 1999 and 1998, respectively.
Inventories at September 30, 1999 and 1998 are as follows(in thousands):
September 30,
1999 1998
Finished goods and work in process $ 67,934 $ 68,735
Raw materials 37,029 29,139
Supplies 11,608 12,048
Inventories at FIFO cost 116,571 109,922
LIFO reserve (22,070) (21,903)
Net inventories $ 94,501 $ 88,019
It is impracticable to segregate the LIFO reserve betweenraw materials, finished goods and work in process.
Property, Plant and EquipmentProperty, plant and equipment are stated at cost. Cost includesmajor expenditures for improvements and replacements whichextend useful lives or increase capacity and interest costs associated
FINANCIA.WPC 1/19/00 5:18 PM Page 34
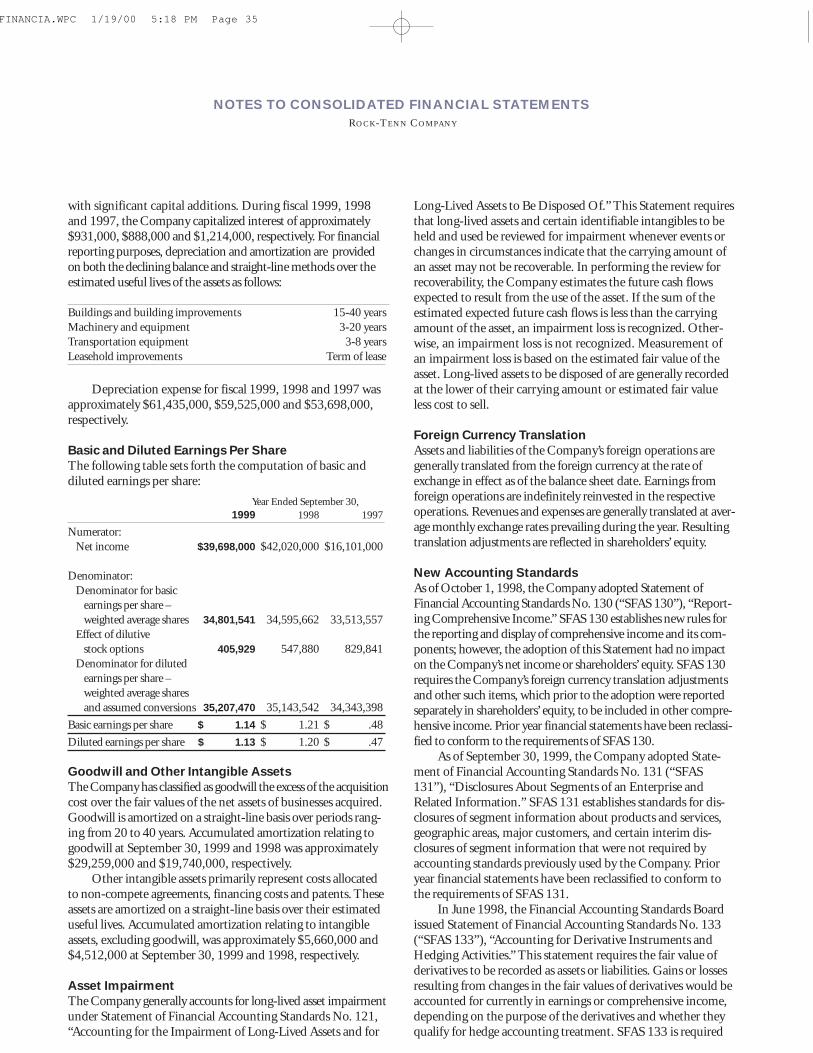
with significant capital additions. During fiscal 1999, 1998and 1997, the Company capitalized interest of approximately$931,000, $888,000 and $1,214,000, respectively. For financialreporting purposes, depreciation and amortization are providedon both the declining balance and straight-line methods over theestimated useful lives of the assets as follows:
Buildings and building improvements 15-40 years
Machinery and equipment 3-20 years
Transportation equipment 3-8 years
Leasehold improvements Term of lease
Depreciation expense for fiscal 1999, 1998 and 1997 wasapproximately $61,435,000, $59,525,000 and $53,698,000,respectively.
Basic and Diluted Earnings Per Share The following table sets forth the computation of basic anddiluted earnings per share:
Year Ended September 30,
1999 1998 1997
Numerator:
Net income $39,698,000 $42,020,000 $16,101,000
Denominator:
Denominator for basic
earnings per share –
weighted average shares 34,801,541 34,595,662 33,513,557
Effect of dilutive
stock options 405,929 547,880 829,841
Denominator for diluted
earnings per share –
weighted average shares
and assumed conversions 35,207,470 35,143,542 34,343,398
Basic earnings per share $ 1.14 $ 1.21 $ .48
Diluted earnings per share $ 1.13 $ 1.20 $ .47
Goodwill and Other Intangible AssetsThe Company has classified as goodwill the excess of the acquisitioncost over the fair values of the net assets of businesses acquired.Goodwill is amortized on a straight-line basis over periods rang-ing from 20 to 40 years. Accumulated amortization relating togoodwill at September 30, 1999 and 1998 was approximately$29,259,000 and $19,740,000, respectively.
Other intangible assets primarily represent costs allocatedto non-compete agreements, financing costs and patents. Theseassets are amortized on a straight-line basis over their estimateduseful lives. Accumulated amortization relating to intangibleassets, excluding goodwill, was approximately $5,660,000 and$4,512,000 at September 30, 1999 and 1998, respectively.
Asset ImpairmentThe Company generally accounts for long-lived asset impairmentunder Statement of Financial Accounting Standards No. 121,“Accounting for the Impairment of Long-Lived Assets and for
Long-Lived Assets to Be Disposed Of.” This Statement requiresthat long-lived assets and certain identifiable intangibles to beheld and used be reviewed for impairment whenever events orchanges in circumstances indicate that the carrying amount ofan asset may not be recoverable. In performing the review forrecoverability, the Company estimates the future cash flowsexpected to result from the use of the asset. If the sum of theestimated expected future cash flows is less than the carryingamount of the asset, an impairment loss is recognized. Other-wise, an impairment loss is not recognized. Measurement ofan impairment loss is based on the estimated fair value of theasset. Long-lived assets to be disposed of are generally recordedat the lower of their carrying amount or estimated fair valueless cost to sell.
Foreign Currency TranslationAssets and liabilities of the Company’s foreign operations aregenerally translated from the foreign currency at the rate ofexchange in effect as of the balance sheet date. Earnings fromforeign operations are indefinitely reinvested in the respectiveoperations. Revenues and expenses are generally translated at aver-age monthly exchange rates prevailing during the year. Resultingtranslation adjustments are reflected in shareholders’ equity.
New Accounting StandardsAs of October 1, 1998, the Company adopted Statement ofFinancial Accounting Standards No. 130 (“SFAS 130”), “Report-ing Comprehensive Income.” SFAS 130 establishes new rules forthe reporting and display of comprehensive income and its com-ponents; however, the adoption of this Statement had no impacton the Company’s net income or shareholders’ equity. SFAS 130requires the Company’s foreign currency translation adjustmentsand other such items, which prior to the adoption were reportedseparately in shareholders’ equity, to be included in other compre-hensive income. Prior year financial statements have been reclassi-fied to conform to the requirements of SFAS 130.
As of September 30, 1999, the Company adopted State-ment of Financial Accounting Standards No. 131 (“SFAS131”), “Disclosures About Segments of an Enterprise andRelated Information.” SFAS 131 establishes standards for dis-closures of segment information about products and services,geographic areas, major customers, and certain interim dis-closures of segment information that were not required byaccounting standards previously used by the Company. Prioryear financial statements have been reclassified to conform tothe requirements of SFAS 131.
In June 1998, the Financial Accounting Standards Boardissued Statement of Financial Accounting Standards No. 133(“SFAS 133”), “Accounting for Derivative Instruments andHedging Activities.” This statement requires the fair value ofderivatives to be recorded as assets or liabilities. Gains or lossesresulting from changes in the fair values of derivatives would beaccounted for currently in earnings or comprehensive income,depending on the purpose of the derivatives and whether theyqualify for hedge accounting treatment. SFAS 133 is required
NOTES TO CONSOLIDATED FINANCIAL STATEMENTSROCK-TENN COMPANY
FINANCIA.WPC 1/19/00 5:18 PM Page 35
NOTES TO CONSOLIDATED FINANCIAL STATEMENTSROCK-TENN COMPANY
to be adopted in fiscal 2001. The Company is currently evaluat-ing SFAS 133 and has not yet determined its impact on theCompany’s consolidated financial statements.
ReclassificationsCertain reclassifications have been made to prior year amountsto conform with the current year presentation.
2Acquisitions of Businesses and Other Matters
On January 21, 1997, the Company acquired all of the outstand-ing capital stock of the parent of Waldorf Corporation (“Waldorf”),a manufacturer of folding cartons and 100% recycled paperboardand a manufacturer of recycled corrugating medium, for approxi-mately $239,000,000, financed primarily with borrowings underthe Company’s credit facility. In addition, the Company (i) madecertain payments aggregating $32,600,000 in connection withthe settlement of a contingent interest agreement with a formercreditor of Waldorf and the termination of Waldorf ’s StockAppreciation Rights Plan and (ii) accrued as a cost of the purchase$5,293,000 in connection with the planned termination ofapproximately 120 employees of Waldorf, principally certainsenior executives and other employees at the Waldorf corporateoffice. The Company paid $5,261,000 related to these terminations.
On June 9, 1997, the Company acquired substantially all ofthe assets of Rite Paper Products, Inc. (“Rite Paper”), a manufac-turer of component paperboard pieces primarily for the ready-to-assemble furniture industry.
On July 9, 1997, the Company acquired substantially all ofthe assets and certain of the liabilities of The Davey Company(“Davey”), a manufacturer of recycled paperboard book coversused by the book manufacturing industry. The acquisition wasfinanced through the issuance of 867,510 shares of the Company’sClass A common stock (with a fair value of $12,200,000).
On September 5, 1997, the Company and Sonoco ProductsCompany combined their respective fiber partition businessassets into a new entity named RTS Packaging, LLC (“RTSPackaging”). The Company owns 65% of RTS Packaging.
The consolidated statements of income for fiscal 1997include the results of operations of Waldorf, Rite Paper, Daveyand RTS Packaging from the respective dates of acquisition orformation, as the case may be, and the transactions have beenaccounted for under the purchase method of accounting. Thegoodwill arising from these purchase transactions is being amor-tized over forty years. The assets acquired and liabilities assumedare as follows (in thousands):
Value of assets acquired $ 575,997
Deferred tax and other liabilities (102,264)
Long-term debt assumed (147,226)
Net purchase price $ 326,507
The following pro forma information gives effect to theacquisitions of Waldorf and Davey as if both had occurred at thebeginning of fiscal 1997. The pro forma information is providedfor informational purposes only. It is based on historical informa-tion and does not necessarily reflect the actual results of operationsthat would have occurred had such acquisitions actually occurredat the beginning of fiscal 1997 nor is it necessarily indicative offuture results of operations of the combined enterprise (in thou-sands, except per share data, unaudited):
Year Ended September 30,
1997
Net sales $1,231,215
Net income 14,402
Diluted earnings per share .41
The Rite Paper and RTS Packaging transactions are imma-terial for pro forma presentation purposes and are not reflectedin the aforementioned pro forma financial information.
During fiscal 1999, the Company incurred plant closing andother costs related to announced facility closings. The cost ofemployee terminations is generally accrued at the time of notifi-cation to the employees. Certain other costs, such as moving andrelocation costs, are expensed as incurred. Included in these costsare the closing of a folding carton plant in Taylorsville, NorthCarolina, a laminated paperboard products operation in Otsego,Michigan, and an uncoated papermill, serving the Company’scoverboard converting operations, in Jersey City, New Jersey.The closures resulted in the termination of approximately 280employees. In connection with these closings, the Companyincurred charges of $6,357,000, which consisted primarily ofemployee termination, equipment relocation, expected losseson the disposition of the facility and related expenses. Of the$6,357,000, approximately $4,134,000 was paid in fiscal 1999,losses of $764,000 were incurred in connection with disposal ofinventory and other assets and the carrying value of the Jersey Cityfacility was reduced by $1,000,000, leaving a remaining liabilityof approximately $436,000 at September 30, 1999. Facilitiesclosed during fiscal 1999 had combined revenues and operatinglosses of $16,585,000 and $1,501,000, respectively, in fiscal1999, $63,323,000 and $745,000, respectively, in fiscal 1998and $49,947,000 and $2,573,000, respectively, in fiscal 1997.The Company has consolidated the operations of these closedplants into other existing facilities.
During fiscal 1998, the Company began implementingcertain cost reduction initiatives designed to reduce overhead andproduction costs and improve operating efficiency. In connectionwith these cost reduction initiatives, the Company terminatedapproximately 40 employees and recorded $575,000 and$1,997,000 of costs related to these terminations during fiscal1999 and 1998, respectively. The Company made payments ofapproximately $1,246,000 and $23,000 during fiscal 1999 and1998, respectively, related to these terminations. The remainingliability at September 30, 1999 is $1,303,000, which is expected
FINANCIA.WPC 1/19/00 5:18 PM Page 36
NOTES TO CONSOLIDATED FINANCIAL STATEMENTSROCK-TENN COMPANY
to be paid over the next two years. See “Management’s Discussionand Analysis of Financial Condition and Results of Operations –Forward-Looking Statements.”
During fiscal 1997, in connection with the Waldorfacquisition, management decided to close the Company’s fold-ing carton plant at Mundelein, Illinois. The Mundelein facilitywas acquired in the acquisition of Olympic Packaging. In con-nection with this closing, the Company incurred a charge ofapproximately $12,784,000 during fiscal 1997, which representedthe non-cash write-off of goodwill associated with the Company’sOlympic Packaging subsidiary. The write-off of goodwill wasrequired based upon the decision to close the Mundelein facilityand the determination, based on an analysis of estimated futurecash flows, that such goodwill would not be recoverable. Duringfiscal 1997, the Company charged to expense approximately$1,622,000 principally for the termination of approximately150 employees and other related charges associated with closingthe Mundelein facility. Of the $1,622,000, losses of $207,000were incurred in fiscal 1997 and payments of approximately$186,000 and $1,029,000 were made in fiscal 1998 and 1997,respectively. The remaining accrual was adjusted in fiscal 1998.The Mundelein facility had revenue and operating losses of$19,032,000 and $1,242,000, respectively, in fiscal 1997 and$30,440,000 and $1,197,000, respectively, in fiscal 1996. Inaddition, during fiscal 1997, management decided to close aplastics recycling facility located in Indianapolis, Indiana. Duringfiscal 1997, the Company charged to expense approximately$1,750,000 related to this closing, primarily relating to losseson disposal of the equipment. Severance costs were immaterial.Revenue and operating losses were immaterial to the overallconsolidated financial statements.
3Shareholders’ Equity
CapitalizationThe Company’s capital stock consists of Class A common stock(“Class A Common”) and Class B common stock (“Class B Com-mon”). Holders of Class A Common have one vote per share andholders of Class B Common have 10 votes per share. Holders ofClass B Common are entitled to convert their shares into Class ACommon at any time on a share-for-share basis, subject to certainrights of first refusal by the Company and its management com-mittee. The Company’s Class A Common is publicly traded onthe New York Stock Exchange. There is not an established publictrading market for Class B Common. During fiscal 1999, 1998and 1997, respectively, approximately 213,000, 157,000 and172,000 Class B Common shares were converted into Class ACommon shares.
The Company also has authorized preferred stock, ofwhich no shares have been issued. The terms and provisions ofsuch shares will be determined by the Board of Directors uponany issuance of such shares.
Stock Option PlansThe Company’s 1993 Stock Option Plan allows for the grant-ing of options to certain key employees for the purchase of amaximum of 3,700,000 shares of Class A Common. Optionsthat have been granted under this plan vest in increments over aperiod of up to three years and have 10-year terms.
The Incentive Stock Option Plan, the 1987 Stock OptionPlan and the 1989 Stock Option Plan provided for the grant-ing of options to certain key employees for an aggregate of4,320,000 shares of Class A Common and 1,440,000 sharesof Class B Common. The Company will not grant any additionaloptions under the Incentive Stock Option Plan, the 1987 StockOption Plan or the 1989 Stock Option Plan.
The Company has elected to follow Accounting PrinciplesBoard Opinion No. 25, “Accounting for Stock Issued to Employ-ees” (APB 25) and related interpretations in accounting for itsemployee stock options. Under APB 25, because the exerciseprice of the Company’s employee stock options equals the marketprice of the underlying stock on the date of grant, generally nocompensation expense is recognized.
Pro forma information regarding net income and earningsper share is required by FASB Statement No. 123, “Accountingfor Stock-Based Compensation,” which also requires that theinformation be determined as if the Company had accountedfor its employee stock options granted subsequent to Septem-ber 30, 1995, under the fair-value method of that Statement.The fair values for the options granted subsequent to Septem-ber 30, 1995, were estimated at the date of grant using a Black-Scholes option pricing model with the following weightedaverage assumptions for fiscal 1999, 1998 and 1997, respectively:risk-free interest rate of 4.78%, 4.8% and 6.3%, a dividend yieldof 2.0% for all three years, volatility factor of the expected marketprice of the Company’s common stock of 40.0%, 32.0% and28.0%, and an expected life of the option of 10 years.
The Black-Scholes option valuation model was developedfor use in estimating the fair value of traded options that haveno vesting restrictions and are fully transferable. In addition,option valuation models require the input of highly subjectiveassumptions including the expected stock price volatility. Becausethe Company’s employee stock options have characteristicssignificantly different from those of traded options, and becausechanges in the subjective input assumptions can materiallyaffect the fair values estimate, in management’s opinion, theexisting models do not necessarily provide a reliable singlemeasure of the fair values of its employee stock options.
For purposes of pro forma disclosures, the estimated fairvalues of the options are amortized to expense over the options’vesting periods. The Company’s pro forma information follows(in thousands, except for earnings per share information):
1999 1998 1997
Pro forma net income $37,339 $40,395 $14,856
Pro forma earnings per share:
Basic 1.07 1.17 .44
Diluted 1.06 1.15 .43
FINANCIA.WPC 1/19/00 5:18 PM Page 37
NOTES TO CONSOLIDATED FINANCIAL STATEMENTSROCK-TENN COMPANY
The table below summarizes the changes in all stock options during the periods indicated:
Class B Common Class A Common
Weighted Average Weighted Average
Shares Price Range Exercise Price Shares Price Range Exercise Price
Options outstanding at
September 30, 1996 315,959 $2.52-7.45 $4.78 1,345,080 $ 2.50-16.59 $ 9.41
Exercised or forfeited (14,080) $2.52-3.27 $2.74 (124,520) $ 2.50-18.30 $ 4.21
Granted – – – 757,100 $17.50-20.31 $19.49
Options outstanding at
September 30, 1997 301,879 $2.52-7.45 $4.87 1,977,660 $ 2.50-20.31 $13.60
Exercised or forfeited (99,660) $2.52-7.45 $3.62 (246,420) $ 2.50-18.30 $ 3.71
Granted – – – 519,200 $11.13-18.75 $11.48
Options outstanding at
September 30, 1998 202,219 $3.27-7.45 $5.49 2,250,440 $ 3.26-20.31 $14.19
Exercised or forfeited (36,300) $3.27-4.33 $3.60 (72,400) $ 3.26-20.31 $ 4.95
Granted – – – 822,200 $11.44-15.19 $14.59
Options outstanding at
September 30, 1999 165,919 $4.33-7.45 $5.90 3,000,240 $ 4.32-20.31 $14.52Options exercisable at
September 30, 1999 165,919 $4.33-7.45 $5.90 1,366,240 $ 4.32-20.31 $14.50Options available for future
grant at September 30, 1999 – – – 933,200 – –
The following table summarizes information concerning options outstanding and exercisable at September 30, 1999:
Class B Common Class A Common
Outstanding Exercisable
Weighted Weighted Weighted Weighted Average
Number Average Average Average Remaining
Outstanding Exercise Exercise Exercise Contractual Life
and Exercisable Price Number Price Number Price (Both Classes)
$4.32-7.45 165,919 $5.90 313,040 $ 5.91 313,040 $ 5.91 2.1$11.13-11.44 – – 555,200 11.16 – – 9.0$14.31-17.50 – – 1,374,400 15.09 609,650 15.39 7.9$18.30-20.31 – – 757,600 19.51 443,550 19.33 7.4
165,919 5.90 3,000,240 14.52 1,366,240 14.50 7.1
FINANCIA.WPC 1/19/00 5:18 PM Page 38
NOTES TO CONSOLIDATED FINANCIAL STATEMENTSROCK-TENN COMPANY
The estimated weighted average fair value of options grantedduring fiscal 1999, 1998 and 1997 with option prices equal tothe market price on the date of grant was $6.72, $4.46 and$7.61, respectively.
Employee Stock Purchase PlanUnder the Amended and Restated 1993 Employee Stock PurchasePlan, 1,320,000 shares of Class A Common are reserved for pur-chase by substantially all qualifying employees of the Company.In fiscal 1999, 1998 and 1997, approximately 284,000, 207,000and 196,000 shares, respectively, were purchased by employeesunder this plan.
4Long-term Debt
Long-term debt at September 30, 1999 and 1998 consists ofthe following:
September 30,
(In Thousands) 1999 1998
Revolving credit facility (a) $362,000 $369,000
7.25% notes, due August 2005,
net of unamortized discount
of $81 and $94(b) 99,919 99,906
Industrial revenue bonds, bearing
interest at variable rates
(4.40% at September 30, 1999),
due through December 2037(c) 34,650 32,150
Other notes 2,276 7,282
498,845 508,338
Less current maturities of long-term debt 41,435 43,462
Long-term debt due after one year $457,410 $464,876
(a) The Company has a revolving credit facility, provided by asyndicate of banks, which provides aggregate borrowing avail-ability of up to $450,000,000 through 2002. Borrowings out-standing under the facility bear interest based upon LIBORplus an applicable margin. This rate was 6.18% and 6.38% atSeptember 30, 1999 and 1998, respectively. Annual facility feesrange from 0.075% to 0.3% of the aggregate borrowing availabil-ity, based on the Company’s consolidated funded debt-to-totalcapitalization ratio. Under the agreements covering this loan,restrictions exist as to the maintenance of financial ratios, cre-ation of additional long-term and short-term debt, certain leas-ing arrangements, mergers, acquisitions, disposals and othermatters. The Company is in compliance with such restrictions.
In October 1997, the Company entered into two interestrate agreements effectively to cap the LIBOR rate on portionsof the amount outstanding under the revolving credit facility.Under the agreements, $75,000,000 is capped at 8.00% perannum until October 7, 2000, while another $75,000,000 is
capped at 7.50% per annum until October 7, 1999. The costsassociated with these interest rate agreements are being amor-tized over the terms of the agreements.
In April 1998, the Company entered into an interest rateswap agreement effectively to fix the LIBOR rate on $100,000,000of variable rate borrowings at 5.79% per annum until April 2005.In May 1999, the Company terminated this swap agreement. Theresulting gain of $1,034,000 is being amortized over the originalcontract life as a reduction of interest expense.
In May 1999, the Company entered into an interest rate swapagreement effectively to fix the LIBOR rate on $100,000,000 ofvariable rate borrowings at 5.84% per annum until May 2002.
The Company is exposed to counterparty credit risk fornonperformance and, in the unlikely event of nonperformance,to market risk for changes in interest rates. The Company man-ages exposure to counterparty credit risk through minimumcredit standards, diversification of counterparties and proce-dures to monitor concentrations of credit risk. The Companydoes not anticipate nonperformance of the counterparties.
(b) In August 1995, the Company sold $100,000,000 in aggregateprincipal amount of its 7.25% notes due August 1, 2005 (the“Notes”). The Notes are not redeemable prior to maturity and arenot subject to any sinking fund requirements. The Notes areunsubordinated, unsecured obligations. The indenture related tothe Notes restricts the Company and its subsidiaries from incurringcertain liens and entering into certain sale and leaseback transac-tions, subject to a number of exceptions. Debt issuance costs ofapproximately $908,000 are being amortized over the term of theNotes. In May 1995, the Company entered into an interest rateadjustment transaction in order to effectively fix the interest rate onthe Notes subsequently issued in August 1995. The costs associatedwith the interest rate adjustment transaction of $1,530,000 arebeing amortized over the term of the Notes. Giving effect to theamortization of the original issue discount, the debt issuance costsand the costs associated with the interest rate adjustment transac-tion, the effective interest rate on the Notes is approximately 7.51%.
(c) Payments of principal and interest on the industrial revenuebonds are guaranteed by a letter of credit issued by a bank.Restrictions on the Company similar to those described in (a)above exist under the terms of the agreements. The bonds areremarketed periodically based on the interest rate periodselected by the Company. In the event the bonds cannot beremarketed, the bank has agreed to extend long-term financingto the Company in an amount sufficient to retire the bonds.
As of September 30, 1999, $321,000,000 of the $362,000,000outstanding under the revolving credit facility has been classifiedas long-term debt since the Company has the ability to continueto finance this amount pursuant to the terms of the revolvingcredit facility and does not intend to repay this amount with cash
FINANCIA.WPC 1/19/00 5:18 PM Page 39
NOTES TO CONSOLIDATED FINANCIAL STATEMENTSROCK-TENN COMPANY
from operations during the ensuing year. As of September 30,1999, the aggregate maturities of long-term debt for the suc-ceeding five years are as follows (in thousands):
2000 $ 41,435
2001 307
2002 321,327
2003 350
2004 284
Thereafter 135,142
Total debt $498,845
One of the Company’s Canadian subsidiaries has a revolv-ing credit facility with a Canadian bank. The facility providesborrowing availability of up to Canadian $2,000,000 and canbe renewed on an annual basis. There are no facility fees relatedto this arrangement. As of September 30, 1999 and 1998, therewere no amounts outstanding under this facility.
5 Financial Instruments
At September 30, 1999 and 1998, the fair market value of theNotes was approximately $96,003,000 and $100,250,000,respectively, based on quoted market prices. At September 30,1999, the carrying amount for variable rate long-term debtapproximates fair market value since the interest rates on theseinstruments are reset periodically.
At September 30, 1999 and 1998, the fair values of the twointerest rate cap agreements were immaterial. The fair valuesof interest rate swap agreements held by the Company wereapproximately $800,000 and $4,451,000 at September 30, 1999and 1998, respectively. There were no carrying amounts associ-ated with these instruments.
The Company has swap agreements to limit its exposure tofalling prices and rising costs for a portion of its recycled corrugat-ing medium business. Some agreements hedge the selling prices ona total of 12,000 tons of recycled corrugating medium and the costof related OCC each quarter and expire during fiscal 2002. Otheragreements hedge the selling prices on a total of 15,000 tons ofrecycled corrugating medium each quarter and expire duringfiscal 2003. These swap agreements were entered into throughprivately negotiated transactions for which there is no readilyaccessible market. It is impracticable to estimate the fair valuesas they are based upon future costs and prices that cannot be reasonably estimated. There is no carrying amount associated with these instruments.
6 Leases and Other Agreements
The Company leases certain manufacturing and warehousingfacilities and equipment (primarily transportation equipment)under various operating leases. Some leases contain escalationclauses and provisions for lease renewal.
As of September 30, 1999, future minimum lease payments,including certain maintenance charges on transportation equip-ment, under all noncancelable leases, are as follows (in thousands):
2000 $ 7,093
2001 5,691
2002 4,590
2003 3,923
2004 2,620
Thereafter 2,876
Total future minimum lease payments $26,793
Rental expense for the years ended September 30, 1999,1998 and 1997 was approximately $13,685,000, $12,264,000and $10,503,000, respectively, including lease payments undercancelable leases.
7Income Taxes
The Company accounts for income taxes under the liabilitymethod, which requires the recognition of deferred tax assetsand liabilities for the future tax consequences attributable todifferences between the financial statement carrying amount ofexisting assets and liabilities and their respective tax bases. Therecognition of future tax benefits is required to the extent thatrealization of such benefits is more likely than not.
The provisions for income taxes consist of the followingcomponents (in thousands):
Year Ended September 30,
1999 1998 1997
Current income taxes:
Federal $23,824 $25,360 $13,676
State 2,383 2,498 2,694
Foreign 965 761 268
Total current 27,172 28,619 16,638
Deferred income taxes:
Federal 2,791 3,359 3,989
State 239 265 349
Foreign 353 350 679
Total deferred 3,383 3,974 5,017
Provision for income taxes $30,555 $32,593 $21,655
FINANCIA.WPC 1/19/00 5:18 PM Page 40
NOTES TO CONSOLIDATED FINANCIAL STATEMENTSROCK-TENN COMPANY
The differences between the statutory federal income taxrate and the Company’s effective income tax rate are as follows:
Year Ended September 30,
1999 1998 1997
Statutory federal tax rate 35.0% 35.0% 35.0%
State taxes, net of federal benefit 3.5 3.7 3.9
Non-deductible amortization and
write-off of goodwill (See Note 2) 3.7 3.5 18.3
Other, net (primarily
non-taxable items) 1.3 1.5 0.2
Effective tax rate 43.5% 43.7% 57.4%
The tax effects of temporary differences that give rise tosignificant portions of deferred income tax assets and liabilitiesconsist of the following (in thousands):
September 30,
1999 1998
Deferred income tax assets:
Accruals and allowances $ 9,843 $ 9,092
Other 2,829 5,955
Total 12,672 15,047
Deferred income tax liabilities:
Property, plant and equipment 82,586 77,266
Deductible intangibles 2,550 2,343
Inventory and other 13,167 17,686
Total 98,303 97,295
Net deferred income tax liability $85,631 $82,248
The Company has not recorded any valuation allowancesfor deferred income tax assets.
The components of the income before income taxes are(in thousands):
Year Ended September 30,
1999 1998 1997
United States $66,173 $71,356 $34,916
Foreign 4,080 3,257 2,840
Income before income taxes $70,253 $74,613 $37,756
8Retirement Plans
The Company has a number of defined benefit pension planscovering essentially all employees who are not covered by certaincollective bargaining agreements. The benefits are based onyears of service and, for certain plans, compensation. TheCompany’s practice is to fund amounts deductible for federalincome tax purposes.
In addition, under several labor contracts the Companymakes payments based on hours worked into multi-employerpension plan trusts established for the benefit of certain collec-tive bargaining employees.
The Company’s projected benefit obligation, fair value ofassets and net periodic pension cost includes the followingcomponents (in thousands):
Year Ended September 30,
1999 1998
Projected benefit obligation at
beginning of year $166,189 $146,808
Service cost 7,592 7,460
Interest cost on projected benefit obligations 12,487 11,008
Amendments 3,829 (8,410)
Actuarial (gain) loss (15,266) 12,714
Acquisitions and other – 1,861
Benefits paid (6,178) (5,252)
Projected benefit obligation at end of year $168,653 $166,189
Fair value of assets at beginning of year $195,062 $159,048
Actual return on plan assets 20,987 35,945
Acquisitions and other – 2,427
Employer contribution – 2,894
Benefits paid (6,178) (5,252)
Fair value of assets at end of year $209,871 $195,062
Funded status $ 41,218 $ 28,873
Net unrecognized asset (531) (909)
Net unrecognized gain (42,282) (23,420)
Unrecognized prior service income (1,095) (5,029)
Net accrued pension cost included
in consolidated balance sheets $ (2,690) $ (485)
The amounts recognized in the consolidated income state-ments are as follows (in thousands):
Year Ended September 30,
1999 1998 1997
Service cost $ 7,592 $ 7,460 $ 6,027
Interest cost on projected
benefit obligations 12,488 11,008 9,647
Expected return on plan assets (17,169) (14,870) (10,449)
Net amortization of the
initial asset (378) (385) (399)
Net amortization of gain loss (222) (110) (7)
Net amortization of prior
service (income) cost (105) (436) 445
Total Company defined benefit
plan expense 2,206 2,667 5,264
Multi-employer plans for
collective bargaining employees 238 237 163
Net periodic pension cost $ 2,444 $ 2,904 $ 5,427
The discount rate used in determining the actuarial presentvalue of the projected benefit obligations was 7.75%, 7.0% and7.5% as of September 30, 1999, 1998 and 1997, respectively. Theexpected increase in compensation levels used in determining theactuarial present value of the projected benefit obligations was
FINANCIA.WPC 1/19/00 5:18 PM Page 41
NOTES TO CONSOLIDATED FINANCIAL STATEMENTSROCK-TENN COMPANY
4.0% as of September 30, 1999, 1998 and 1997. The expectedlong-term rate of return on assets used in determining pensionexpense was 9% for all years presented. There were no under-funded plans as of September 30, 1999. The projected benefitobligations, accumulated benefit obligation and fair value of assets for underfunded plans was $2,392,000, $2,392,000, and$2,352,000, respectively, as of September 30, 1998.
Effective October 1, 1997, the Company implemented anemployee savings plan which permits participants to makecontributions by salary reduction pursuant to Section 401(k)of the Internal Revenue Code. The Company matches 50% ofcontributions up to a maximum of 6% of compensation asdefined by the plan. During fiscal 1999 and fiscal 1998, theCompany recorded matching expense of $3,982,000 and$4,001,000 related to the plan. As a result of the new employeesavings plan effective January 1, 1998, the Company amendedits defined benefit plans to lower pension benefits. Net periodicpension cost was approximately $1,600,000 lower during fiscal1998 as a result of the reduced benefits.
The Company has a Supplemental Executive RetirementPlan (“SERP”) which provides unfunded supplemental retire-ment benefits to certain executives of the Company. The SERPprovides for incremental pension payments to partially offset thereduction in amounts that would have been payable from theCompany’s principal pension plan if it were not for limitationsimposed by federal income tax regulations. Expense relating tothe plan of $137,000, $219,000 and $174,000 was recorded forfiscal 1999, 1998 and 1997, respectively. Amounts accrued as ofSeptember 30, 1999 and 1998 related to the plan were $821,000and $688,000, respectively.
9Related Party Transactions
A director of the Company is the Chairman and a significantshareholder of the insurance agency that brokers substantiallyall insurance for the Company. The insurance premiums paidby the Company may vary significantly from year to year withthe claims arising during such years. For the years ended Septem-ber 30, 1999, 1998 and 1997, payments were approximately$4,458,000, $4,898,000 and $3,831,000, respectively.
A director of the Company is the former Chairman ofthe construction company that built a new building for theCompany. For fiscal 1999, 1998 and 1997, payments approxi-mated $118,000, $2,733,000 and $5,335,000, respectively, andwere capitalized as property, plant and equipment. The projectwas completed during fiscal 1999.
10 Commitments and Contingencies
Capital AdditionsEstimated costs for completion of authorized capital additionsunder construction as of September 30, 1999, total approxi-mately $17,000,000.
Stock Repurchase PlanThe Board of Directors has approved a stock repurchase planfor the repurchase of a maximum of 1,500,000 shares in aggre-gate of Class A Common or Class B Common prior to July 31,2003. During fiscal 1999, the Company repurchased no sharesunder this plan. During fiscal 1998, the Company repurchased290,100 shares of Class A Common under this plan. Under apreviously authorized plan, which expired on July 31, 1998, theCompany repurchased 40,000 and no shares of Class A Commonduring fiscal 1998 and 1997, respectively.
Environmental and Other MattersThe Company is subject to various Federal, state, local and foreignenvironmental laws and regulations, including those regulatingthe discharge, storage, handling and disposal of a variety of sub-stances. These laws and regulations include, among others, theComprehensive Environmental Response, Compensation andLiability Act, which the Company refers to as CERCLA, the CleanAir Act (as amended in 1990), the Clean Water Act, the ResourceConservation and Recovery Act (including amendments relatingto underground tanks) and the Toxic Substances Control Act.These environmental regulatory programs are primarily adminis-tered by the U.S. Environmental Protection Agency. In addition,some states in which the Company operates have adopted equiva-lent or more stringent environmental laws and regulations, orhave enacted their own parallel environmental programs, whichare enforced through various state administrative agencies.
The Company does not believe that future compliance withthese environmental laws and regulations will have a materialadverse effect on its results of operations, financial condition orcash flows. However, environmental laws and regulations arebecoming increasingly stringent. Consequently, the Company’scompliance and remediation costs could increase materially. Inaddition, the Company cannot currently assess with certaintythe impact that the future emissions standards and enforcementpractices under the 1990 amendments to the Clean Air Act willhave on our operations or capital expenditure requirements.However, the Company believes that any such impact or capitalexpenditures will not have a material adverse effect on its resultsof operations, financial condition or cash flows.
FINANCIA.WPC 1/19/00 5:18 PM Page 42
NOTES TO CONSOLIDATED FINANCIAL STATEMENTSROCK-TENN COMPANY
The Company estimates that it will spend $1.0 to $3.0 mil-lion for capital expenditures during fiscal year 2000 in connectionwith matters relating to environmental compliance.
In addition, the Company may choose to modify or replacethe coal fired boilers at two of our facilities in order to operate costeffectively while complying with emissions regulations under theClean Air Act. The Company estimates these improvements willcost approximately $9.0 million.
The Company has been identified as a potentially responsibleparty, which the Company refers to as a PRP, at nine “superfund”sites pursuant to CERCLA or comparable state statutes. No reme-diation costs or allocations have been determined with respect tosuch sites other than costs that were not material to the Company.Based upon currently available information and the opinions ofthe Company’s environmental compliance managers and generalcounsel, although there can be no assurance, the Companybelieves that any liability it may have at any site will not have amaterial adverse effect on the Company’s results of operations,financial condition or cash flows.
On February 9, 1999, the Company received a letter fromthe Michigan Department of Environmental Quality, which theCompany refers to as MDEQ, in which the MDEQ alleges thatthe Company is in violation of the Michigan Natural Resourcesand Environmental Protection Act as well as the facility’s wastewaterdischarge permit at one of the Company’s Michigan facilities.The letter alleges that the Company exceeded several numericallimitations for chemical parameters outlined in the wastewaterpermit and violated other wastewater discharge criteria. TheMDEQ further alleges that the Company is liable for contamina-tion contained on the facility property as well as for contributingcontamination to the Kalamazoo River site. The letter requeststhat the Company commit, in the form of a binding agreement,to undertake the necessary and appropriate response activities andresponse actions to address contamination in both areas. TheCompany has agreed to enter into an administrative consent orderpursuant to which improvements will be made to the facility’swastewater treatment system and the Company will pay a$75,000 fine for the alleged violations. The Company has alsoagreed to pay an additional $30,000 for past and future oversightcosts incurred by the State of Michigan. The Company will paythis additional amount in three equal payments over the next threeyears. The cost of making upgrades to the process waste systemand wastewater treatment systems is estimated to be approximately$1,000,000. Nothing contained in the order will constitute anadmission of liability or any factual finding, allegation or legalconclusion on the part of the Company. The order is expected tobe completed during the second quarter of fiscal 2000.
11Segment Information
The Company adopted SFAS No. 131, “Disclosures AboutSegments of an Enterprise and Related Information,” in 1999which changes the way operating segment information is pre-sented. The information for fiscal 1998 and fiscal 1997 hasbeen restated from the prior year’s presentation in order to conform to the fiscal 1999 presentation.
The Company reports three business segments. The pack-aging products segment consists of facilities that produce foldingcartons, fiber partitions, corrugated containers and corrugateddisplays. The paperboard segment consists of facilities thatmanufacture 100% recycled clay-coated and uncoated paperboardand corrugating medium. The laminated paperboard, plasticpackaging and recycled fiber segment consists of facilities thatproduce laminated paperboard products and thermoformedplastic products and that collect recovered paper; although thesefacilities do not meet the aggregation criteria of SFAS 131,they also do not meet the criteria of SFAS 131 for separatereporting and accordingly, have been presented as a single segment.Certain operations included in the packaging products segmentare located in foreign countries and had operating income of$5,455,000, $4,293,000 and $4,483,000 during fiscal 1999,1998 and 1997, respectively. For fiscal 1999, foreign operationsrepresented approximately 4.6%, 5.1% and 5.5% of total netsales to unaffiliated customers, total income from operationsand total identifiable assets, respectively. For fiscal 1998, foreignoperations represented approximately 4.1%, 3.8% and 5.4%of total net sales to unaffiliated customers, total income fromoperations and total identifiable assets, respectively. In fiscal 1997,these operations represented approximately 4.8%, 7.0% and 5.3%of total net sales to unaffiliated customers, total income fromoperations and total identifiable assets, respectively. As of Septem-ber 30, 1999, 1998 and 1997, the Company had foreign long-lived assets with a net book value of $34,556,000, $28,545,000and $31,844,000, respectively.
The Company evaluates performance and allocates resourcesbased, in part, on profit or loss from operations before incometaxes, interest and other items. The accounting policies of thereportable segments are the same as those described in theSummary of Significant Accounting Policies except that theCompany accounts for inventory on the FIFO basis at the segmentlevel compared to a LIFO basis at the consolidated level. Interseg-ment sales are accounted for at prices that approximate marketprices. Intercompany profit is eliminated at the consolidated level.
FINANCIA.WPC 1/19/00 5:18 PM Page 43
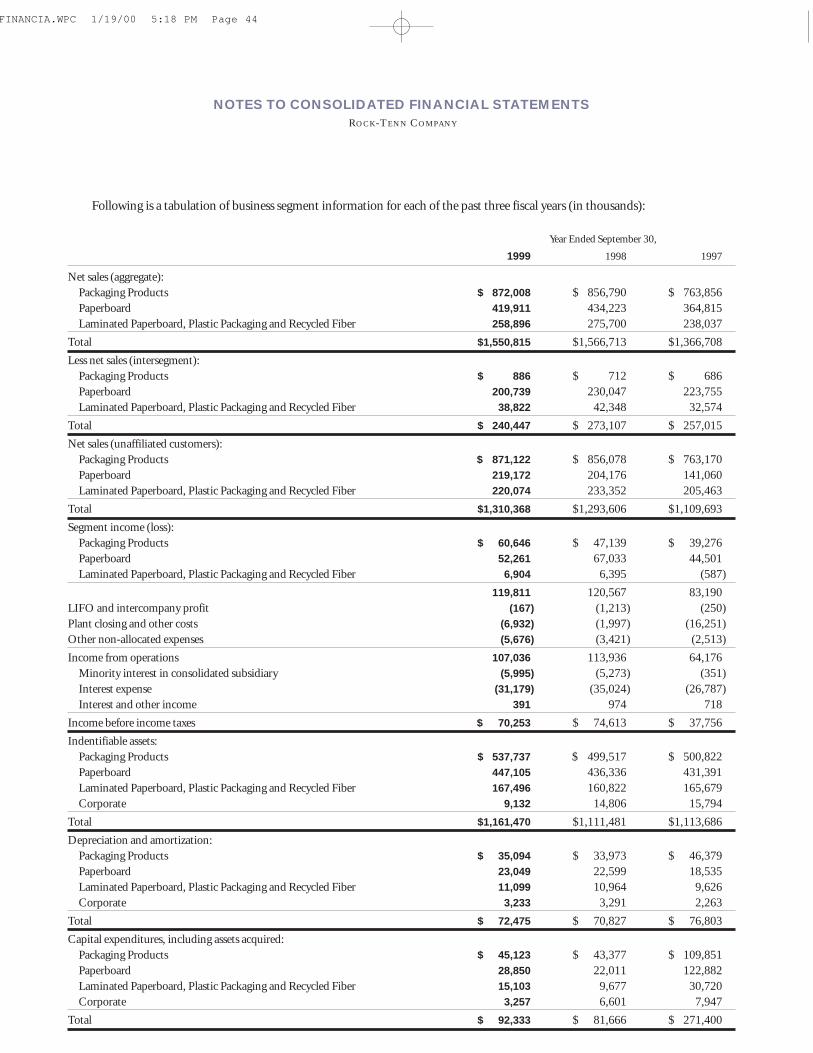
NOTES TO CONSOLIDATED FINANCIAL STATEMENTSROCK-TENN COMPANY
Following is a tabulation of business segment information for each of the past three fiscal years (in thousands):
Year Ended September 30,
1999 1998 1997
Net sales (aggregate):
Packaging Products $ 872,008 $ 856,790 $ 763,856
Paperboard 419,911 434,223 364,815
Laminated Paperboard, Plastic Packaging and Recycled Fiber 258,896 275,700 238,037
Total $1,550,815 $1,566,713 $1,366,708
Less net sales (intersegment):
Packaging Products $ 886 $ 712 $ 686
Paperboard 200,739 230,047 223,755
Laminated Paperboard, Plastic Packaging and Recycled Fiber 38,822 42,348 32,574
Total $ 240,447 $ 273,107 $ 257,015
Net sales (unaffiliated customers):
Packaging Products $ 871,122 $ 856,078 $ 763,170
Paperboard 219,172 204,176 141,060
Laminated Paperboard, Plastic Packaging and Recycled Fiber 220,074 233,352 205,463
Total $1,310,368 $1,293,606 $1,109,693
Segment income (loss):
Packaging Products $ 60,646 $ 47,139 $ 39,276
Paperboard 52,261 67,033 44,501
Laminated Paperboard, Plastic Packaging and Recycled Fiber 6,904 6,395 (587)
119,811 120,567 83,190
LIFO and intercompany profit (167) (1,213) (250)
Plant closing and other costs (6,932) (1,997) (16,251)
Other non-allocated expenses (5,676) (3,421) (2,513)
Income from operations 107,036 113,936 64,176
Minority interest in consolidated subsidiary (5,995) (5,273) (351)
Interest expense (31,179) (35,024) (26,787)
Interest and other income 391 974 718
Income before income taxes $ 70,253 $ 74,613 $ 37,756
Indentifiable assets:
Packaging Products $ 537,737 $ 499,517 $ 500,822
Paperboard 447,105 436,336 431,391
Laminated Paperboard, Plastic Packaging and Recycled Fiber 167,496 160,822 165,679
Corporate 9,132 14,806 15,794
Total $1,161,470 $1,111,481 $1,113,686
Depreciation and amortization:
Packaging Products $ 35,094 $ 33,973 $ 46,379
Paperboard 23,049 22,599 18,535
Laminated Paperboard, Plastic Packaging and Recycled Fiber 11,099 10,964 9,626
Corporate 3,233 3,291 2,263
Total $ 72,475 $ 70,827 $ 76,803
Capital expenditures, including assets acquired:
Packaging Products $ 45,123 $ 43,377 $ 109,851
Paperboard 28,850 22,011 122,882
Laminated Paperboard, Plastic Packaging and Recycled Fiber 15,103 9,677 30,720
Corporate 3,257 6,601 7,947
Total $ 92,333 $ 81,666 $ 271,400
FINANCIA.WPC 1/19/00 5:18 PM Page 44
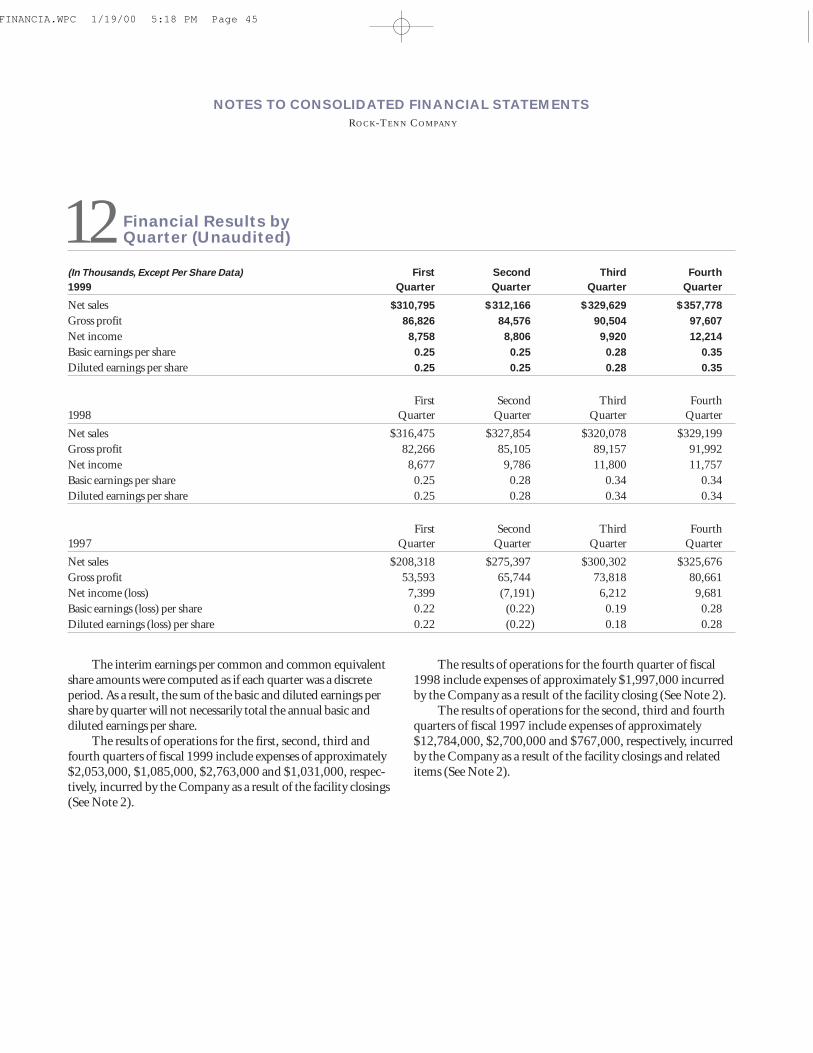
NOTES TO CONSOLIDATED FINANCIAL STATEMENTSROCK-TENN COMPANY
12 Financial Results by Quarter (Unaudited)
(In Thousands, Except Per Share Data) First Second Third Fourth1999 Quarter Quarter Quarter Quarter
Net sales $310,795 $312,166 $329,629 $357,778Gross profit 86,826 84,576 90,504 97,607Net income 8,758 8,806 9,920 12,214Basic earnings per share 0.25 0.25 0.28 0.35Diluted earnings per share 0.25 0.25 0.28 0.35
First Second Third Fourth
1998 Quarter Quarter Quarter Quarter
Net sales $316,475 $327,854 $320,078 $329,199
Gross profit 82,266 85,105 89,157 91,992
Net income 8,677 9,786 11,800 11,757
Basic earnings per share 0.25 0.28 0.34 0.34
Diluted earnings per share 0.25 0.28 0.34 0.34
First Second Third Fourth
1997 Quarter Quarter Quarter Quarter
Net sales $208,318 $275,397 $300,302 $325,676
Gross profit 53,593 65,744 73,818 80,661
Net income (loss) 7,399 (7,191) 6,212 9,681
Basic earnings (loss) per share 0.22 (0.22) 0.19 0.28
Diluted earnings (loss) per share 0.22 (0.22) 0.18 0.28
The interim earnings per common and common equivalentshare amounts were computed as if each quarter was a discreteperiod. As a result, the sum of the basic and diluted earnings pershare by quarter will not necessarily total the annual basic anddiluted earnings per share.
The results of operations for the first, second, third andfourth quarters of fiscal 1999 include expenses of approximately$2,053,000, $1,085,000, $2,763,000 and $1,031,000, respec-tively, incurred by the Company as a result of the facility closings(See Note 2).
The results of operations for the fourth quarter of fiscal1998 include expenses of approximately $1,997,000 incurredby the Company as a result of the facility closing (See Note 2).
The results of operations for the second, third and fourthquarters of fiscal 1997 include expenses of approximately$12,784,000, $2,700,000 and $767,000, respectively, incurredby the Company as a result of the facility closings and relateditems (See Note 2).
FINANCIA.WPC 1/19/00 5:18 PM Page 45
REPORT OF INDEPENDENT AUDITORSROCK-TENN COMPANY
To the Board of Directors and ShareholdersRock-Tenn Company
We have audited the accompanying consolidated balance sheets
of Rock-Tenn Company as of September 30, 1999 and 1998,
and the related consolidated statements of income, shareholders’
equity and cash flows for each of the three years in the period
ended September 30, 1999. These financial statements are the
responsibility of the Company’s management. Our responsibil-
ity is to express an opinion on these financial statements based
on our audits.
We conducted our audits in accordance with generally
accepted auditing standards. Those standards require that we plan
and perform the audit to obtain reasonable assurance about
whether the financial statements are free of material misstatement.
An audit includes examining, on a test basis, evidence supporting
the amounts and disclosures in the financial statements. An audit
also includes assessing the accounting principles used and signifi-
cant estimates made by management, as well as evaluating the
overall financial statement presentation. We believe that our
audits provide a reasonable basis for our opinion.
In our opinion, the financial statements referred to above
present fairly, in all material respects, the consolidated financial
position of Rock-Tenn Company at September 30, 1999 and 1998,
and the consolidated results of its operations and its cash flows
for each of the three years in the period ended September 30,
1999, in conformity with generally accepted accounting principles.
Atlanta, Georgia
October 26, 1999
FINANCIA.WPC 1/19/00 5:18 PM Page 46
MANAGEMENT’S STATEMENT OF RESPONSIBILITY FOR FINANCIAL INFORMATIONROCK-TENN COMPANY
The management of Rock-Tenn Company has the responsibility
for preparing the accompanying consolidated financial state-
ments and for their integrity and objectivity. The statements
were prepared in accordance with generally accepted accounting
principles. The financial statements include amounts that are
based on management’s best estimates and judgments. Manage-
ment also prepared the other information in the annual report
and is responsible for its accuracy and consistency with the
financial statements.
Rock-Tenn Company has established and maintains a
system of internal control to safeguard assets against loss or unau-
thorized use and to ensure the proper authorization and account-
ing for all transactions. This system includes appropriate reviews
by the Company’s internal audit department and management as
well as written policies and procedures that are communicated to
employees with significant roles in the financial reporting process
and updated as necessary.
The Board of Directors, through its Audit Committee, is
responsible for ensuring that both management and the inde-
pendent auditors fulfill their respective responsibilities with
regard to the financial statements. The Audit Committee, com-
posed entirely of directors who are not officers or employees of
the Company, meets periodically with both management and
the independent auditors to assure that each is carrying out its
responsibilities. The independent auditors and the Company’s
internal audit department have full and free access to the Audit
Committee and meet with it, with and without management
present, to discuss auditing and financial reporting matters.
The Company’s financial statements have been audited by
Ernst & Young LLP, independent auditors, elected by the share-
holders. The opinion of the independent auditors, based upon
their audits of the consolidated financial statements, is contained
in this Annual Report.
As part of its audit of the Company’s financial statements,
Ernst & Young LLP considered the Company’s internal control
structure in determining the nature, timing and extent of audit
tests to be applied. Management has considered Ernst & Young
LLP’s recommendations concerning the Company’s system of
internal controls and has taken actions that we believe are cost-
effective in the circumstances to respond appropriately to these
recommendations. Management believes that, as of September 30,
1999, the Company’s system of internal controls is adequate to
accomplish the objectives discussed herein.
James A. Rubright David C. Nicholson
Vice Chairman and Senior Vice President,
Chief Executive Officer Chief Financial Officer
and Secretary
FINANCIA.WPC 1/19/00 5:18 PM Page 47