Embed Size (px)
Citation preview

IN TWENTY-TWENTY WE WERE AT THE
OF CONNECTIONS WHEN IT MATTERED MOST.
ANNUAL REPORT 2020

Advancing how Canadians connect

with each other and the world

2 | BCE InC. 2020 AnnuAl REpoRt
OUR FINANCIAL PERFORMANCE
Stepping up in a year like no otherAs the Bell team kept Canada connected in a challenging 2020, we built marketplace momentum with
world-class network, service and content innovations for our customers while delivering sustainable dividend growth for our shareholders.
2020 financial performance
Revenue * (3.8%)
Adjusted EBITDA (1) * (4.0%)
Capital intensity 18.4%
Adjusted EPS (1) $3.02
Free cash flow (1) * (10.4%)
* Compared to 2019
+307%total shareholder
return 2009–2020 (3)
+140%Increase in dividend per common share
2009–2021
6.1 %Dividend yield
in 2020 (2)
+5.1 %Increase in dividend per common share
for 2021
(1) Adjusted EBITDA, adjusted EPS and free cash flow are non-GAAP financial measures and do not have any standardized meaning under International Financial Reporting Standards (IFRS). Therefore, they are unlikely to be comparable to similar measures presented by other issuers. For a full description of these measures, see section 10.2, Non-GAAP financial measures and key performance indicators (KPIs) on pp. 115 to 117 of the MD&A.
(2) Annualized dividend per BCE common share divided by BCE’s share price at the end of the year.
(3) The change in BCE’s common share price for a specified period plus BCE common share dividends reinvested, divided by BCE’s common share price at the beginning of the period.
BCE InC. 2020 AnnuAl REpoRt | 3
OUR PURPOSE
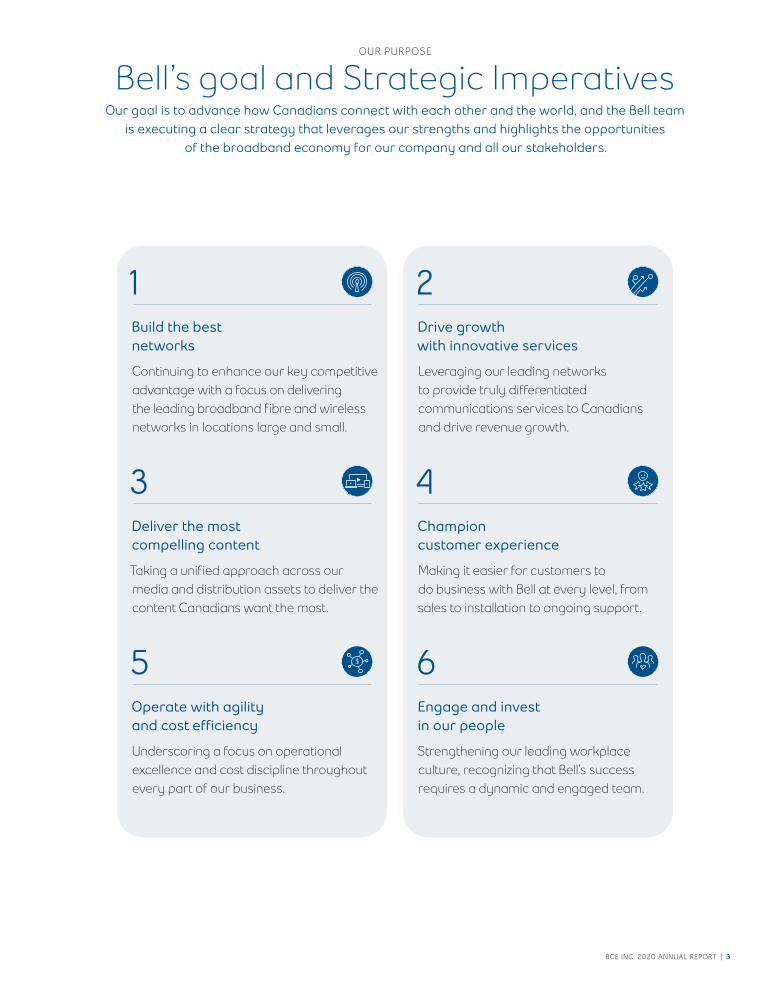
Bell’s goal and Strategic ImperativesOur goal is to advance how Canadians connect with each other and the world, and the Bell team
is executing a clear strategy that leverages our strengths and highlights the opportunities of the broadband economy for our company and all our stakeholders.
1Build the best networks
Continuing to enhance our key competitive advantage with a focus on delivering the leading broadband fibre and wireless networks in locations large and small.
3Deliver the most compelling content
Taking a unified approach across our media and distribution assets to deliver the content Canadians want the most.
5operate with agility and cost efficiency
Underscoring a focus on operational excellence and cost discipline throughout every part of our business.
2Drive growth with innovative services
Leveraging our leading networks to provide truly differentiated communications services to Canadians and drive revenue growth.
6Engage and invest in our people
Strengthening our leading workplace culture, recognizing that Bell’s success requires a dynamic and engaged team.
4Champion customer experience
Making it easier for customers to do business with Bell at every level, from sales to installation to ongoing support.

4 | BCE InC. 2020 AnnuAl REpoRt
FINANCIAL AND OPERATIONAL HIGHLIGHTS
Connecting Canadians with the best in broadband communications
With a consistent focus on customer experience, the Bell team rebounded from the impacts of the COVID-19 crisis to deliver consecutive quarterly operational improvement and growth in
next-generation broadband services.
Our high-performance network connections, innovative services and compelling content enabled Bell to achieve solid increases in retail Internet, IPTV and wireless subscribers while improving the rate of decline in legacy services like landline phone and satellite TV.
Investing for future growth as we also play a key role in Canada’s economic recovery from COVID-19, Bell over-delivered on our fibre, wireless and rural network expansion objectives in 2020.
BCE retail subscribers (millions) 2020 2019 Change
Wireless 10.22 9.96 +2.6%
High-speed Internet (1) 3.70 3.56 +4.2%
Television (1) 2.74 2.77 (1.2%)
Local residential telephone services (1) (2)
2.48 2.70 (7.9%)
total (1) 19.15 18.98 +0.9%
(1) Excludes wholesale subscribers.
(2) Excludes business telephone services.
22.32Mtotal Bell consumer,
business and wholesale customer connections
BCE InC. 2020 AnnuAl REpoRt | 5
FINANCIAL AND OPERATIONAL HIGHLIGHTS
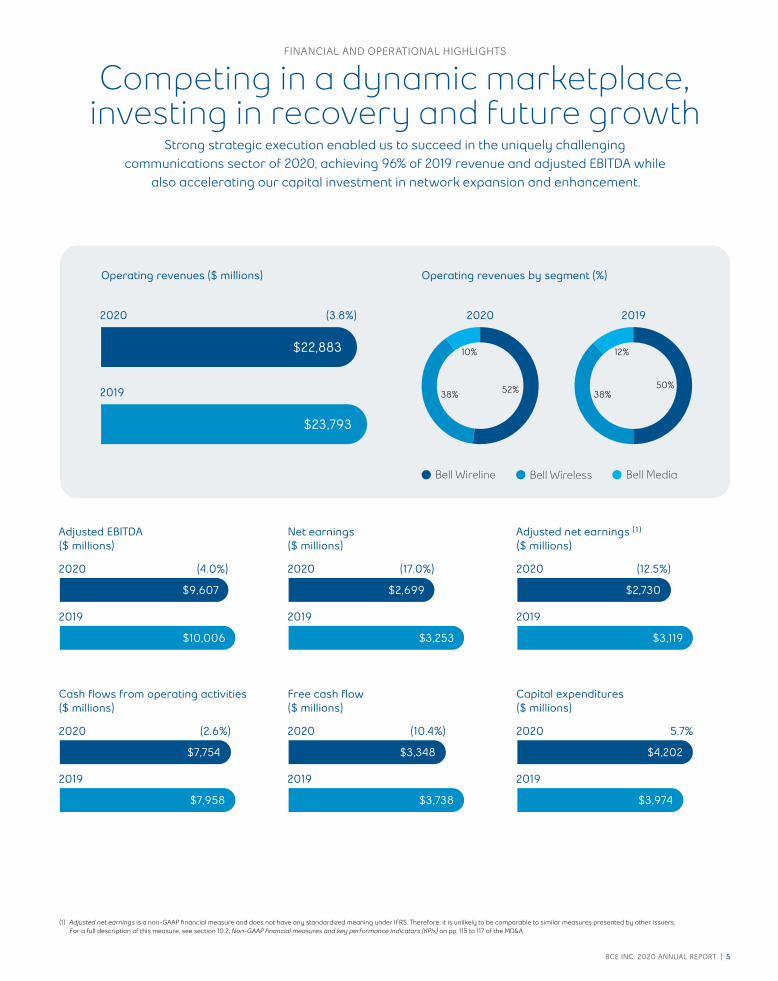
Competing in a dynamic marketplace, investing in recovery and future growth
Strong strategic execution enabled us to succeed in the uniquely challenging communications sector of 2020, achieving 96% of 2019 revenue and adjusted EBITDA while
also accelerating our capital investment in network expansion and enhancement.
operating revenues by segment (%)operating revenues ($ millions)
2020 (3.8%)
$22,883
2019
$23,793
(1) Adjusted net earnings is a non-GAAP financial measure and does not have any standardized meaning under IFRS. Therefore, it is unlikely to be comparable to similar measures presented by other issuers. For a full description of this measure, see section 10.2, Non-GAAP financial measures and key performance indicators (KPIs) on pp. 115 to 117 of the MD&A.
2020 2019
Bell Wireline Bell Wireless Bell Media
Adjusted EBItDA($ millions)
2020 (4.0%)
$9,607
2019
$10,006
Cash flows from operating activities($ millions)
2020 (2.6%)
$7,754
2019
$7,958
net earnings($ millions)
2020 (17.0%)
$2,699
2019
$3,253
Free cash flow($ millions)
2020 (10.4%)
$3,348
2019
$3,738
Adjusted net earnings (1)($ millions)
2020 (12.5%)
$2,730
2019
$3,119
Capital expenditures($ millions)
2020 5.7%
$4,202
2019
$3,974
52% 50%38% 38%
10% 12%

6 | BCE InC. 2020 AnnuAl REpoRt
Bell has always stepped up for Canadians during difficult times in our country’s history, and 2020 was no exception. Rapidly adjusting to the unprecedented impacts of COVID-19, the BCE group of companies delivered the reliable connections and outstanding service that enabled the national response at every level. Core to that effort was accelerating investment in Bell network and service innovation, ensuring critical support now and building a long-range foundation for future growth.
2020 was a year unlike any other. For Canada’s leading communications company, the unprecedented increases in network usage and capacity demands, rigorous new health and safety requirements, and an uncertain economy required swift and agile action to ensure uninterrupted service for millions of customers while continuing to grow our business in a responsible and sustainable manner.
I am immensely proud of the clear and direct way Bell’s management team has addressed the COVID-19 challenge, a crucial element in Canada’s overall response that has been widely acknowledged by our stakeholders. Throughout, Bell met the needs of a country facing crisis, providing customers with billing relief and complimentary services, increasing mental health funding, and donating 1.5 million protective masks and other supports for healthcare and frontline workers.
At the same time, Bell continued to drive the evolution of Canada’s network infrastructure and next-generation communications services, increasing broadband deployments, especially in rural and other underserved areas, while also launching Canada’s fastest 5G wireless network in multiple centres.
Determined to keep Canadians connected, informed and entertained, Bell continued to build momentum in an unpredictable and challenging environment, encouraged by government policies that support the investments required to ensure Canada remains a global leader in communications and the digital economy.
Building a leadership position in ESG standards
2020 underscored how integral Bell is to how Canadians live and work. Since 1880, we have led the way in communications while setting a standard for excellence in how we deliver. Today, this means dedication to leadership in environmental, social and governance standards (ESG).
Bell’s goal to advance how Canadians connect with each other and the world is the core of our commitment to all the stakeholders we serve, supported by our unparalleled investments in the country’s core network infrastructure, ongoing broadband service
MESSAGE FROM THE CHAIR OF THE BOARD
Building on our strengths to deliver now and into the future

BCE InC. 2020 AnnuAl REpoRt | 7
innovation, and adherence to the highest financial, operational and data governance standards. I am pleased to note that oversight of this purpose will be added to the Corporate Governance Committee’s responsibilities in 2021.
Bell networks and services help to enable a clean economy, with 5G wireless poised to be a major factor in helping multiple sectors reduce emissions. In 2020, Bell became the first communications company in North America to achieve ISO 50001 certification for our energy management system, and we are proud to build on that leadership and announce our objective to achieve carbon neutral operations in 2025.
At the same time, Bell Let’s Talk is supporting mental health action in communities throughout Canada. We accelerated the initiative in 2020 with $5 million in additional funding to respond to the unique mental health challenges of COVID-19, and a new Bell Let’s Talk Diversity Fund to help address the impact of systemic racism on the mental health of Black, Indigenous and People of Colour (BIPOC) communities.
Our diverse national team is building an inclusive workplace, fostering innovation and creativity as we work to eliminate any systemic impediments to team members reaching their full potential. We undertook meaningful actions to foster a more diverse workplace in 2020, including new targets for BIPOC representation in Bell’s senior management team (25% by 2025) and graduate and student hiring (at least 40%), as well as forging new technology, education and employment partnerships to enable our diversity objectives.
BCE is also a member of the 30% Club and a signatory to the Catalyst Accord 2022, which aim to increase the proportion of women serving on Canadian corporate boards to at least 30%. At our annual shareholders meeting, we expect to exceed that objective.
Bell is consistently recognized as one of Canada’s Top Employers, and in 2020 as one of the greenest, most family-friendly and best diversity employers in the country, and a top workplace for young professionals.
Solid financial performance in uncertain times
Significant declines in commercial activity during COVID-19, including reduced spending by both consumers and businesses, significantly impacted BCE’s financial results throughout most of 2020. However, consistently strong strategic execution by the Bell team resulted in consecutive quarterly performance improvements throughout the COVID crisis, including achieving 96% of our 2019 revenue and adjusted EBITDA results in 2020.
We also generated $3.35 billion in free cash flow to enable Bell’s unmatched network, service and content investments, as well as returns to the shareholders who have invested in our strategy. BCE remains on a very sound financial footing, with $3.8 billion in liquidity at the end of 2020, fully funded pension plans, and ready access to financial markets, with no significant debt maturities until 2022.
As a result, BCE was proud to announce both an acceleration in capital investment of at least an additional $1 billion over the next 2 years while also increasing our common share dividend 5.1% to $3.50 effective with the Q1 2021 payment on April 15, 2021. This is the 13th consecutive year that BCE has increased the dividend by 5% or more, and total shareholder return over that timeframe has been 307%.
Changes to your BCE Board
Directors Barry Allen, Robert Brown and Paul Weiss will be retiring from the Board at our annual shareholder meeting this year, and I would like to thank them for their dedication and outstanding service to you and our great company over more than a decade.
I am also very pleased to announce the nominations of Jennifer Tory and Cornell Wright to your Board.
A renowned corporate strategist, Jennifer was Chief Administrative Officer for Royal Bank of Canada until her retirement in 2019, previously RBC’s Group Head, Personal and Commercial Banking, and serves as Chair of the Toronto International Film Festival and on the Board of the Sunnybrook Hospital Foundation. Cornell is Chair of the Corporate Department at Torys LLP, previously co-head of its Mergers & Acquisitions practice, and is Chair of the National Ballet of Canada, a trustee of University Health Network, and Executive in Residence at the Rotman School of Management.
As your Chair, and on behalf of every member of the BCE Board of Directors, I thank our shareholders for your support and confidence in our company. I trust that you share our pride in BCE’s accomplishments over the course of 2020, and our excitement about the tremendous opportunities ahead.
Gordon M. Nixon Chair of the Board BCE Inc.

8 | BCE InC. 2020 AnnuAl REpoRt
The strength of Bell’s broadband networks, service innovations and dedicated team were on full display in 2020 as we kept Canadians connected, informed and entertained around the clock throughout COVID-19, while also continuing to build our momentum in a dynamic communications marketplace. By accelerating the country’s shift to next-generation communications technologies, Bell is advancing how Canadians connect with each other and the world.
The Bell team is guided by 6 Strategic Imperatives that highlight our strengths while underscoring the opportunities for Bell to excel in a fast-changing and highly competitive communications landscape: Build the best networks; drive growth with innovative services; deliver the most compelling content; champion customer experience; operate with agility and cost efficiency; and engage and invest in our people.
This clear roadmap for success was fundamental to Bell’s solid financial and operating progress in a uniquely challenging 2020. Supplemented by 3 key principles developed to guide our operations during the COVID crisis – keep Canadians connected and informed; protect the health and safety of the public, our customers and team; and support our customers and communities – our strategy was also core to our team’s outstanding response to the unprecedented impacts of COVID-19.
Building the networks of the future now
The robustness of Bell’s network infrastructure during COVID-19, further reinforced with continued investment in capacity and coverage in response to unprecedented usage by consumers, businesses, governments and emergency responders, was reflected in 99.99+% availability across our wireline and wireless networks throughout the crisis.
Bell also exceeded our broadband network expansion objectives for the year, including a significant acceleration of our service footprint in rural and remote communities.
Our all-fibre connections reached approximately 5.6 million homes and businesses by the end of the year, and we accelerated our rural Wireless Home Internet (WHI) rollout in response to increased demand during COVID-19 to reach nearly half a million households. That included expansion to rural Atlantic Canada, alongside an increase in WHI download/upload speeds to 50/10 megabits per second (Mbps).
Bell also launched the country’s fastest 5G wireless network in more than 150 centres, laying the groundwork for a generational change in connectivity possibilities for all Canadians. Building on our world-class 4G LTE network, which today reaches over 99% of Canadians, Bell’s early 5G leadership means we’re well prepared to continue offering Canadians the best in broadband wireless into the future.
Our leading investments in research and development continue to enable the rollout of innovative communications services, including new residential Internet and TV options; enhanced Bell Smart Home monitoring and control systems; and more advanced connections for Canadian businesses of all sizes, including the integrated 5G, cloud and IoT solutions that will be key drivers of Canada’s growing digital economy.
Bell remains committed to delivering the most compelling content across all platforms, and to seeking new opportunities for growth in a fast-changing media sector marked by changing consumer tastes, all-new ways for audiences to access content and growing competition from well-funded international competitors.
We built on our position as Canada’s top TV provider in 2020 by launching new viewing platforms like Virgin TV and Bell Streamer, and continuing to grow our Crave customer base with the addition of extensive French-language content. Recognizing the opportunity to bring fresh choice and enhanced competition to the Québec media market, Bell Media also launched the French-language Noovo network, which joins our other premier media brands including CTV, Canada’s #1 English-language TV network, and TSN and RDS, the top sports networks in the country.
Champion customer experience
Network leadership combined with innovation in service delivery enabled our team to further enhance the Bell customer experience in 2020. We continued to unveil a broad array of new support options, many accelerated by the unique challenges of COVID-19.
In 2020, we launched appointment-based sales, customer self-installations and our unique Move Valet service, while also making significant investments in digital sales and support platforms. Today, more than half of all Bell customer transactions are taking place online.
A strong indicator of the progress Bell is making in improving customer experience is the most recent annual report from Canada’s Commission for Complaints for Telecom-television Services (CCTS). For the fifth consecutive year, Bell led all major competitors in significantly reducing the number of customer service complaints to the CCTS.
MESSAGE FROM THE PRESIDENT AND CEO
Driving Canada’s communications leadership in a fast-changing world

BCE InC. 2020 AnnuAl REpoRt | 9
Supporting our team
With as many as 80% of our team members working from home during COVID-19, and those in our stores and other workplaces adhering to strict safety protocols and government restrictions, it has not been business as usual.
In line with our COVID-19 operating principles, Bell provided our team with the tools necessary to adjust to changes in the way we work, and we enhanced support services with dedicated mental health and wellness resources, increased psychological care benefits, and mobile access to our Employee and Family Assistance Program, as well as online learning and collaboration resources.
Consistently recognized as one of Canada’s top employers, Bell continues to adopt new best practices to empower our team and ensure we are as agile, efficient and productive as possible – including making significant strides in promoting diversity and inclusion in our workplaces and communities.
Accelerating our momentum
We’re taking our commitment to lead the way in Canadian communications further still with an unprecedented acceleration in our capital spending of an additional $1 billion to $1.2 billion over the next 2 years to enhance our fibre, rural and 5G network rollout plans. A supplement to the approximately $4 billion in capital we typically invest in networks each year, the project is the largest of its kind in Bell’s history, and will bring fast fibre and WHI coverage to up to 400,000 more homes and businesses than originally planned while also doubling the national population coverage of Bell 5G.
This investment plan is an excellent example of Bell’s focus on supporting Canada’s response to and recovery from COVID-19 as we also lay the groundwork for our country’s long-range leadership in next-generation communications.
thank you
Bell is a Canadian company with a celebrated past and a bright future, and the shareholders who have invested in our company’s vision have always been critical to making it all possible. On behalf of the entire Bell team, I thank you for your ongoing support as we move forward with our goal to advance how Canadians connect with each other and the world.
Mirko Bibic President and Chief Executive Officer BCE Inc. and Bell Canada

10 | BCE InC. 2020 AnnuAl REpoRt
Bell takes broadband network innovation to the next level with industry-leading investments in infrastructure, support systems and research and development (R&D). Our capital expenditures of $4.2 billion in 2020 reflected ongoing expansion and enhancement of our fibre, rural Wireless Home Internet (WHI) and mobile 5G networks, increases in network capacity and redundancy investments to manage the unprecedented usage volumes driven by COVID-19, and the highest spending on Canadian R&D in the communications industry.
Bell’s wireless and wireline networks delivered 99.99+% availability throughout the COVID situation as usage volumes increased exponentially. Internet traffic increased up to 60% during the day and 20% at night at the peak of the crisis, WHI usage grew 40%, voice calling up to 200% at peak calling times, and business conference calling as much as 250% as stay at home measures took effect across the country.
In response to increased demand during the COVID crisis, Bell also accelerated the rollout of our rural WHI service, including to 137,000 more households by the end of April 2020. WHI is a revolutionary new broadband Internet service specifically designed to serve smaller and more remote communities, and in 2020 we increased Internet access speeds to 50/10 (50 Mbps downloads and 10 Mbps uploads) and began rolling out service in the Atlantic provinces. WHI will ultimately reach approximately 1 million rural and remote locations in 7 provinces, and we’ve achieved almost 50% of this overall build plan so far.
Now, to enable Canada’s ongoing recovery from the COVID crisis while ensuring our long-term leadership in global broadband communications, Bell is implementing an ambitious program to accelerate our network rollouts with $1 billion to $1.2 billion in additional capital investment in 2021 and 2022. An addition to Bell’s typical annual capital expenditures of approximately $4 billion, this bold investment plan will boost our combined fibre and rural WHI locations to approximately 6.9 million by the end of 2021 while doubling 5G network coverage. The project is expected to generate $2 billion in additional economic activity and create approximately 5,300 additional direct and indirect Canadian jobs.
Working with infrastructure suppliers Ericsson and Nokia, Bell launched mobile 5G service in multiple centres in summer 2020, covering 26% of the national population by the end of the year. Our 5G leadership was recognized by PCMag, which ranked Bell’s network as the clear winner in its 2020 Fastest Mobile Networks Canada report. After extensive testing, PCMag found Bell offered faster, more reliable connection speeds in more cities than any other Canadian carrier. Customers outside Bell’s 5G coverage areas are seamlessly connected to our 4G LTE network, which offers coverage for more than 99% of the Canadian population.
Our high-speed fibre rollouts continued in Canadian centres large and small in 2020. We announced an investment of approximately $400 million to bring fibre links to homes and businesses throughout Winnipeg, and a similar program to deliver fibre connections to more than 200,000 residences and commercial locations in Hamilton. And from Churchill, Manitoba, to Lakefield, Ontario and Val-David, Québec, to Bouctouche, New Brunswick, Souris, Prince Edward Island and Hantsport, Nova Scotia, and on to Fortune in Newfoundland and Labrador, Bell is also bringing broadband fibre connectivity to a broad range of smaller communities.
● With fast and reliable data speeds enabled by fibre interconnections, Bell’s 5G network was launched in 2020 in multiple Canadian centres, and coverage is expected to double in 2021.
STRATEGIC IMPERATIVE 1
Build the best networksDriving the reach and capabilities of Canada’s critical communications infrastructure has been Bell’s mission
since our company’s founding in 1880, and we continued to lead the way 140 years later with unparalleled investment in the world’s top broadband fibre and wireless technologies. Bell’s enduring commitment
to build the best networks ensured the country had the communications foundation necessary to respond to the COVID-19 crisis, and that Canadians in urban, rural and remote locations alike will have the
next-generation connections they need to thrive in a broadband digital economy.

BCE InC. 2020 AnnuAl REpoRt | 11
We also work with the federal and provincial governments to bring fibre to areas that are especially difficult and costly to reach. Bell fibre is coming to 32,000 more rural towns and farms as part of the Internet for Nova Scotia Initiative, and in PEI we are completing links to 9,400 additional households in a partnership with the provincial and federal governments. In Newfoundland and Labrador, Bell, the provincial government and community organizations are bringing LTE wireless service to 11 small and remote communities, many of which will have wireless access for the first time.
In Québec, Bell fibre is rolling out to more than 100 underserved communities through projects in partnership with the Québec and federal governments and the new Régions branchées initiative. To help further accelerate broadband network innovation and access in Québec, Bell has simplified the process other service providers use to safely access our communications support structures. We also announced a Centre of Excellence to share technology best practices and offer dedicated technical support access to service providers.
In Canada’s North, Bell subsidiary Northwestel is expanding its fibre connections to Hay River and Inuvik in the Northwest Territories, with Inuvik becoming Bell’s first all-fibre community north of the Arctic Circle. Northwestel is also bringing faster Internet to residents of Yukon and other communities in the Northwest Territories in partnership with the CRTC’s Broadband Fund.
Bell worked with Société de transport de Montréal (STM) and industry partners to complete deployment of wireless service throughout the 68 stations and 71 kilometres of tunnels that make up Montréal’s métro transit system, the largest indoor digital network in Canada.
Canada’s #1 investor in communications R&D, Bell launched new 5G research partnerships in 2020, including the creation of new 5G research centres at Western University and Université de Sherbrooke to support innovations in IoT and smart energy management.
● Accelerating fibre and rural broadband network investment will bring additional connections to centres large and small while supporting Canada’s economic recovery from COVID-19.

12 | BCE InC. 2020 AnnuAl REpoRt
The critical role of dependable Internet service was highlighted throughout 2020 as millions of Canadians worked remotely and families sheltered at home during the COVID crisis, relying on Bell’s wireline and wireless services to stay connected, informed and entertained.
With increasing usage of multiple Internet-enabled devices in the home, Bell continued to expand the availability of our Whole Home Wi-Fi product, including to Atlantic Canada. Integrating a Fibe Internet HomeHub modem, specialized pods and the Bell Wi-Fi app, Whole Home Wi-Fi enables customers to optimize their networks to provide the strongest signals and fastest speeds everywhere in the home. From a smartphone or tablet, customers can easily see who’s connected, set parental controls, and test speed and signal strength.
Bell is Canada’s largest Internet service provider, and the ongoing expansion of our fibre connections is contributing to subscriber growth and increased customer satisfaction. Reflecting the high speed and low latency of our all-fibre network, PCMag named Virgin Mobile Home Internet as Canada’s best Internet service for gaming in 2020, with the highest scores ever awarded in the category.
Bell Smart Home also grew its suite of home monitoring and security services, making it easier than ever for residential customers to protect their properties and manage multiple smart devices. A new self-monitored home automation solution lets customers link popular smart products, like cameras, video doorbells and thermostats, with the Bell Smart Home app to control their home systems from anywhere.
● From affordable Lucky Mobile prepaid to Canada’s fastest 5G service, Bell wireless brands offer a full range of mobile pricing and service options.
STRATEGIC IMPERATIVE 2
Drive growth with innovative servicesBuilding the best networks enables Bell to provide the widest range of innovative and integrated
communications services for consumers and business customers – fast home and mobile Internet access, industry-leading Wi-Fi and Smart Home products, and the next generation of remote
work, security and cloud solutions for business customers of all kinds.

BCE InC. 2020 AnnuAl REpoRt | 13
Driving Canada’s wireless leadership
Bell has quickly become Canada’s 5G leader with a fast-growing network footprint offering “faster, more reliable connection speeds in more cities than any other Canadian carrier,” according to PCMag, which notes that customers who switch to Bell 5G “will see a big boost in network performance.”
Bell played a key role in the launch of several next-generation mobile products in 2020, including the exclusive introduction of Apple Family Setup, which allows kids and older family members to use Apple Watch even if they don’t have an iPhone, and the launch of Apple’s first 5G smartphones. Bell’s 5G device lineup includes the Apple iPhone 12 series, Samsung’s full roster of 5G smartphones, Google’s 5G Pixel series, LG Velvet 5G and Motorola Edge.
Offering a full range of mobile service and pricing options, Bell continued to expand the reach of our Lucky Mobile prepaid wireless service to even more budget-conscious Canadians. We renewed our ground-breaking prepaid SIM card distribution agreement with Dollarama and signed a new agreement with the Giant Tiger discount chain to make Lucky Mobile available in more than 250 locations. We also partnered with Loblaws to expand its PC mobile prepaid service in more than 840 store locations across Canada.
● Wireless Home Internet is bringing the benefits of Bell’s broadband home Internet services to Canadians in smaller towns and rural communities.
Business market momentum
Even as the COVID crisis heavily impacted every level of the business communications sector, Bell Business Markets continued to build its market momentum with timely innovation in advanced security, remote work support and enhanced cloud opportunities.
BBM’s new Managed Cloud Security Gateway is providing enterprise customers with advanced security solutions, including protection from malware, phishing and other cyber threats. Partnering with BlackBerry, we delivered advanced mobile security solutions to business and government customers to support their remote work programs, and launched Bell Virtual Office, an integrated suite of remote work solutions to enhance productivity, optimize costs and grow employee engagement in remote environments.
With the sale of Bell data centres to Equinix in 2020, Bell also became the first Equinix Platinum Partner in Canada, offering our customers access to an unmatched worldwide network of data and cloud centres to support their digital transformations.
Echoing the success of Whole Home Wi-Fi, we launched Total Business Wi-Fi to provide small business customers with enhanced Wi-Fi coverage and easy network management.

14 | BCE InC. 2020 AnnuAl REpoRt
Bell Media is home to the biggest names in Canadian media, and our roster continues to grow. In 2020, we introduced Noovo, the exciting rebrand of our newly acquired French-language conventional and digital TV services for the Québec media marketplace. Noovo is bringing renewed investment to French-language content production and fresh choice for viewers, including the upcoming launch of Noovo Info news services.
CTV marked its 19th consecutive year as Canada’s top network, led by the #1 new CTV original drama Transplant and the top primetime drama and comedy programs in the country. As Canadians turned to the most trusted name in news, CTV News continued its leadership with the top national newscast, CTV National News with Lisa Laflamme, while CTV News Channel, CP24 and BNN Bloomberg all achieved their highest annual viewership in at least the last 5 years.
Bell Media is also Canada’s sports leader, with TSN the most-watched sports network in Canada in 2020 and RDS maintaining its leadership in French-language sports TV. TSN and RDS broadcasts of the most recent IIHF World Junior Championship won the biggest total audience for Canada’s hockey tradition since 2015 – including a 121% year-over-year increase in live streaming. Home to the most championship events, Canada’s sports networks also announced exclusive long-term rights extensions with Formula 1 and Curling Canada.
Canada’s top radio broadcaster with 109 stations available through our iHeartRadio platforms, Bell Media rebranded more stations as part of the national Pure Country and Virgin radio networks, and launched contemporary radio brand MOVE Radio in 10 markets across Canada. Astral, our out-of-home advertising business, secured an exclusive agreement with the Québec City airport and with the Toronto Parking Authority to manage advertising faces at Bike Share Stations across the city, adding to its more than 50,000 advertising locations in key urban markets nationally.
● With significant investment in Canadian talent and production, Bell Media creates compelling English and French language content that is winning audiences across the country and internationally.
STRATEGIC IMPERATIVE 3
Deliver the most compelling contentBell is Canada’s #1 multimedia company with the top TV, radio, digital and advertising brands in the
country, leading-edge digital platforms like Crave, and TV services including Bell Fibe TV, Alt TV, Virgin TV and Satellite TV offering a full range of pricing and service options. Keeping Canada connected
during COVID-19 included ensuring Canadians had full access to the most compelling news, sports, lifestyle and entertainment content across any platform they chose.

BCE InC. 2020 AnnuAl REpoRt | 15
new ways to access the best content
Our established Crave platform continued to grow its reach, serving a total of 2.8 million customers by the end of 2020 and launching bilingual service with more than 7,500 hours of exclusive new French-language content, leading to a doubling of Crave streams in Québec in 2020. Crave launched its most successful original production ever, Canada’s Drag Race, and introduced exclusive HBO Max programming as part of our long-term licensing agreement with Warner Bros.
Bell continues to develop new ways to watch, including the launch of Virgin TV, the app-based service that requires no set-top box; Bell Streamer, a powerful new Bell-operated Android TV device offering live and on-demand content; and CTV’s ad-supported all-in-one digital video platform offering access to live and on-demand CTV programming.
Reflecting our strategy to deliver the most compelling content in the Canadian market and beyond, Bell Media original productions are also enjoying growing success in the United States. Crave’s comedy series Letterkenny has achieved widespread acclaim and CTV’s Transplant is airing on NBC, original comedy Jann is streaming on Hulu and reality series Holmes Family Effect has been picked up by Fox.
Bell Media further enhanced its content creation and production resources in 2020 through a new partnership with Montréal’s Grandé Studios and significant expansion of sound stages and other facilities at Pinewood Toronto Studios.
For the 2020–2021 broadcast year, Bell Media is working with nearly 50 production companies across the country to create hundreds of hours of original content in French and English. Bell Media and partners took home 57 awards at the 2020 Canadian Screen Awards, the most of any private broadcaster – including 5 awards for the Crave original film Song of Names – and collected 46 awards from the Radio Television Digital News Association, including awards for CTV News, W5 and TSN.
● With #1 CTV and the new Noovo network in Québec, Crave streaming and top specialty channels like sports network TSN, Bell has the TV brands that Canadians watch the most.

16 | BCE InC. 2020 AnnuAl REpoRt
Providing the nation’s critical communications backbone, Bell’s high-capacity networks delivered the reliable, round-the-clock connections that consumers, businesses, governments and public health responders have needed to weather COVID-19. These high-quality fibre and wireless connections are also core to the Bell service advantage every day, supporting ongoing subscriber growth and customer churn reduction in a competitive marketplace, and enhancing our service responsiveness and cost efficiency.
Building on these core service strengths were our Bell customer experience teams, who rapidly adjusted to the challenges of COVID-19, operating with a strict focus on safety and finding innovative new ways to deliver on our service imperative.
Delivering essential installation and repair support to keep people connected, Bell instituted new safety protocols for field technicians serving homes and businesses, and introduced innovations like remote-assisted self-install programs, which enable field techs to guide customers through service setups by phone or video from outside the premises.
Bell retail locations including The Source stores were revamped with protective enhancements and access restrictions for team and customer safety, and select locations remained open even in lockdown areas to provide essential repair and replacement services with in-store appointments. Thousands of Bell call centre agents were equipped to work remotely and securely, and many team members in hard-hit parts of the business such as retail and media were redeployed to customer support roles.
We continued to develop the specialized services for residential and business customers that set Bell apart, including Move Valet, to ensure the seamless transfer of Internet, TV and phone services when customers move their residence, and Virtual Office from Bell Business Markets, providing corporate customers with new ways to connect and engage with their remote workforces.
● The Bell team adapted rapidly to the strict public health and safety changes necessary to continuing serving our customers while keeping everyone safe during COVID-19.
STRATEGIC IMPERATIVE 4
Champion customer experienceFully focused on delivering the best customer experience, the Bell team quickly adapted to confront
the unique service challenges of COVID-19 while also accelerating the development of our next-generation support platforms, including increasingly popular digital sales and self-serve options.
As Bell embraces new ways of working and invests in next-generation technology, we’re making it easier to do business with us at every level.

BCE InC. 2020 AnnuAl REpoRt | 17
VIRGINMOBILE.CA
BEST CUSTOMER SERVICE IN CANADA, FOUR YEARS IN A ROW.
#1 in Customer Service among wireless providersin Canada.For J.D. Power 2020 award information, visit jdpower.com/awards.
leadership in digital transactions
As more customers embrace digital platforms to buy services and manage their accounts, Bell is leading the way with our increasingly popular online and app self-serve options. By the end of 2020, 54% of total Bell customer transactions were taking place online.
MyBell.ca, MyBell app and our other branded self-serve platforms enable customers to easily view and pay bills, manage services or check usage, putting control in the customer’s hands while reducing call centre and field service volumes. In 2020, we added the Manage Your Appointment tool to MyBell, while Virgin Mobile’s My Account app was named Best Telecommunications Mobile Application of the Year at the 2020 Mobile Web Awards.
Award-winning service
Virgin Mobile Canada was also named #1 in customer care satisfaction by J.D. Power for the fourth year in a row, and the fifth time in the last 6 years. Virgin outperformed all other Canadian wireless providers in customer satisfaction with phone, in-store and online support, and the overall wireless purchase experience.
And for the fifth straight year, Bell led service improvement among major communications providers in the annual report of the Commission for Complaints for Telecom-television Services (CCTS). Complaint volumes declined by more than 35%, and Bell’s overall share was down 6 basis points to 24% despite having the most customers by far of all Canadian communications carriers.
Bell also got top marks in a 2020 secret shopper report from the Canadian Radio-television and Telecommunications Commission (CRTC), which found that Bell was the industry leader in providing clear and easy to understand information and recommending services that are right for a customer’s needs.
● More than half of Bell customer transactions now take place online including with our award-winning self-serve apps.
● J.D. Power once again ranked Virgin Mobile Canada #1 in customer care across phone, in-store and online support and overall customer experience.

18 | BCE InC. 2020 AnnuAl REpoRt
Bell’s sharpened organizational responsiveness was key to our ability to adapt quickly to the challenges of COVID-19 as we equipped most of our team members to work from home, found new ways to safely serve customers in our stores and in the field, and made timely investments in network capacity and customer support to manage unprecedented growth in usage volumes throughout the crisis.
As Bell kept Canada fully connected in these uncertain times, our seasoned team was able to accelerate our fibre and wireless buildouts and deliver new service options despite the unique challenges of the year. Our proven 6 Strategic Imperatives combined with a collective commitment to agility, efficiency and proactive industry leadership enabled us to succeed in the dynamic communications marketplace of 2020.
the fibre advantage
Bell is rebuilding Canada’s communications backbone with fast fibre connections, and we’re past the midway point of this historic program with links to approximately 5.6 million homes and businesses completed by the end of 2020. Our unparalleled fibre footprint allows Bell to realize operational benefits including in subscriber growth and market share, customer retention, and installation and repair costs.
Our secure and scalable fibre infrastructure now connects approximately 92% of our wireless network cell sites, enabling Bell’s next-generation 5G wireless network with the unmatched backhaul capacity to handle IoT, Smart City and other enhanced digital opportunities, as well as our Wireless Home Internet (WHI) service for rural Canada.
Bell’s ambitious plan to accelerate our fibre, rural and 5G rollouts with an additional $1 billion to $1.2 billion in capital investment over the next 2 years will further drive these competitive efficiencies. Funded in part by the sale of Bell data centres to Equinix in 2020, the program also leverages the federal capital cost allowance program that results in cash tax savings that can be reinvested in further infrastructure development.
A Canadian leader in sustainability
Bell is the first telecommunications company in North America to achieve the
internationally recognized ISO 50001 standard awarded for our energy management system, further underscoring our position as one of Canada’s greenest employers and positioning us for sustainable operational efficiencies for years to come. Fuel and energy savings from fleet modernization, electric vehicle charging stations, lighting and heating system optimization, renewable energy use, and enhanced leveraging of cloud and virtual conferencing services all contributed to reductions in our environmental impact and operational costs.
STRATEGIC IMPERATIVE 5
Operate with agility and cost efficiencyIn our fast-changing and highly competitive Canadian communications industry, the Bell team is always working to grow more nimble and efficient in all that we do. Every day, Canada’s largest communications company is finding new ways to simplify and enhance how we build networks,
create compelling content and deliver top-notch service, streamlining our systems and reducing costs to enable long-term growth, innovation and a better customer experience.

BCE InC. 2020 AnnuAl REpoRt | 19
Simplifying how we do business
Bell is dedicated to delivering a positive customer experience at every level, and to leveraging new technologies and innovative approaches to achieve our objective more cost-effectively. In 2020, this focus helped grow customer satisfaction and reduce churn as well as decrease our overall operating costs.
Our easy-to-use digital tools that enable customers to self-manage a variety of straightforward service and account options are reducing call volumes and freeing call centre and online agents to manage more complex service issues. During COVID-19, this focus on empowering the customer extended to the launch of new assisted self-installation and repair options for many of our popular residential products, alongside new specialized service programs like Move Valet, with dedicated teams of cross-functional representatives ensuring the seamless transfer of Bell Internet, TV and phone services when customers move.
At Bell Media, we’re bringing a renewed focus to customer experience to confront the rapid changes in the Canadian media sector, investing in content creation and new technologies as we also develop new ways to make Canada’s top media provider more accessible to all our stakeholders. Bell Media and Environics Analytics (EA), one of Canada’s leading data and analytics companies, are also working together to open up new opportunities for advanced media advertising strategies while further enhancing content apps and other delivery platforms.
A strong financial foundation
BCE’s solid financial position, including significant liquidity, a strong balance sheet and fully funded pension plans, underpins Bell’s ability to invest and compete in an evolving communications sector. We’re dedicated to making the most of our scale and resources by ensuring operational excellence across our business, reducing our costs, supporting new investment and driving a strong marketplace performance.
As we re-engineered our operations to ensure we continued to deliver for Canadians throughout the challenges of COVID-19, we also reduced our total operating costs by 3.7% in 2020. It’s a reflection of our team’s strict focus on cost management: leveraging the efficiency of fibre and other new technologies; minimizing discretionary expenses at all levels; finding synergies across our business, including the rapid redeployment of team members to new roles during COVID; and renegotiating contracts with a wide range of suppliers.
Thriving in today’s communications marketplace requires an unprecedented focus on operational excellence, and Bell is delivering with disciplined cost management and the operational innovation necessary to advance how Canadians connect with each other and the world.
● Bell’s ability to invest and compete is underpinned by our team’s proven commitment to operational excellence and agility in making the most of our scale and resources.

20 | BCE InC. 2020 AnnuAl REpoRt
STRATEGIC IMPERATIVE 6
Engage and invest in our people Essential to our goal to advance how Canadians connect with each other and the world, the Bell team
is more than 50,000 strong, working in centres large and small in every province and territory to serve our customers and communities. When faced with the challenges of the global health crisis,
the Bell team responded with dedication, agility and innovation to keep our customers safe and connected while also delivering on our strategy in the marketplace.
Consistently recognized as a top Canadian employer, Bell is committed to ensuring everyone on #TeamBell can reach their full potential, providing our team members with the tools and resources they need to deliver for our customers and other stakeholders, supporting their career development, and fostering their well-being, including with consistent leadership in workplace mental health.
This commitment was reflected in our rapid response to the demands of the COVID crisis. We developed clear operating principles and strict safety measures for our team and customers aligned with the most current public health protocols; implemented technology support and revamped processes to enable flexible and remote work; made timely enhancements to benefits and health resources, including virtual online medical and mental wellness consultations; and put in place a wide range of operational innovations to protect our team and the public at retail stores and other Bell workplaces, and in the field at customer homes and business locations.
A diverse and inclusive workplace
As Canada faced off against COVID-19, we also saw our society step up the fight against systemic racism in our communities and workplaces. In response, Bell accelerated our work to create an inclusive, equitable and accessible workplace, building new partnerships and making new commitments for action.
Bell partnered with the Onyx Initiative to help bridge the gap in the recruitment of Black college and university students at Bell and across corporate Canada, and teamed up with the Black Professionals in Tech Network, Ascend Canada and Indigenous Works to further drive hiring and promotion of Black, Indigenous and People of Colour (BIPOC) talent.
As Canada’s #1 multimedia provider, Bell also launched a Content Diversity Task Force to enhance the representation of diverse voices in programming and decision-making, which included a Bell Media partnership with BIPOC TV & Film to enhance career development and grow employment through the new HireBIPOC website. Bell Let’s Talk also stepped up with a special $5 million Diversity Fund and a new advisory committee to support the mental health of racialized Canadians in communities nationwide.
● Consistently ranked as a top Canadian employer, Bell offers a diverse and inclusive workplace focused on enabling all team members to reach their full potential.

BCE InC. 2020 AnnuAl REpoRt | 21
Building a talent advantage
To underline our resolve for positive change, Bell set new targets for BIPOC representation in senior management of at least 25% by 2025, as well as student and graduate hiring of at least 40%. And to build a better understanding of unconscious bias and other impacts on our team members, Bell has worked with our external partners and employee networks like Black Professionals at Bell to educate team members on the issues with events and resources, and created the Inclusive Leadership Development Program completed by more than 1,500 team leaders across Bell.
Recruitment and career development went online in 2020, shifting to virtual campus visits and recruiting drives that contributed to over 1 million social media impressions (up 73%) and more than 35,000 total applicants (up 114%), including more interest from BIPOC candidates.
Virtual onboarding and career programs included the introduction of Bell U, an in-house continuous learning program focused on critical skills development in a range of technology-focused roles, and external initiatives with universities like Western and Sherbrooke to develop the next-generation of 5G and cybersecurity professionals.
Over 1,200 graduate and other students joined the company last year through our recruitment initiatives, including our award-winning Graduate Leadership Program that offers unparalleled work, networking and mentoring opportunities at Bell. Our virtual career development and learning programs tripled in interest in 2020 with more than 1.7 million online video courses completed and over 77,000 hours of self-directed learning provided by the Bell team.
Bell was again named a top employer for young people and one of Canada’s best diversity employers in 2020, alongside honours as an outstanding place to work both nationally and in our headquarters city of Montréal; as one of Canada’s greenest employers; and as a top family-friendly company.
● During COVID-19, Bell supported team members with a strict focus on health and safety, redeployment opportunities and innovative remote work solutions.

22 | BCE InC. 2020 AnnuAl REpoRt
The topics Bell reports on reflect the intersection of our company’s value chain, current and emerging sustainability trends and stakeholder interests and their potential impacts on our business:
Climate change
Bell is taking action to help address climate change and adapt to its consequences. Our efforts to mitigate climate change start with energy consumption as we strive to both save energy and reduce associated greenhouse gas (GHG) emissions. Among other targets, we are increasing electricity efficiency at Bell facilities, reducing the fuel consumption of our vehicles and boosting the use of renewable energy.
• Key metricsBell’s objective is to achieve carbon neutral operations starting in 2025, with an interim 2021 target to reduce the ratio of operational GHG emissions to our network usage by 40% from 2019 levels.
• Key achievementsIn 2020, Bell’s Energy Management System received ISO 50001 certification, a first for North American telecommunications companies. We also surpassed our GHG reduction target for the year, reducing the ratio of our operational emissions to our network usage by 34% from 2019 levels.
Diversity and inclusion
At Bell, we are proud of our commitment to foster an inclusive, equitable and accessible workplace where all team members and customers feel valued, respected and supported. We are dedicated to building a workforce that reflects the diversity of the communities we serve, with a commitment to ensuring every team member has the opportunity to reach their full potential.
40
30
20
10
0
2018 2019 2020 2021Director
nominees
36%30%31%31%
Target(3)
(2)27%
30
25
20
15
10
5
0
2019 2020 2021
1719
29
Ope
ratio
nal e
mis
sion
s(1)
(ton
nes)
div
ided
by
netw
ork
usag
e(p
etab
ytes
)
Actual
Target
-34%
-40%
40
30
20
10
0
2018 2019 2020
32%35%
32%29%
Target
CORPORATE RESPONSIBILITY
2020 environmental, social and governance highlights
Bell’s ESG approach balances economic growth, social responsibility, and environmental performance. Focused on our goal of advancing how Canadians connect with each other and the world, Bell provides
millions of Canadian consumers and businesses with leading communications networks, services and media content, creates value for shareholders, provides meaningful careers for people nationwide,
and makes a significant overall contribution to Canada’s social and economic prosperity.
Key target: Reduce the ratio of our operational GHG emissions to our network usage by 40% by 2021 vs. 2019
Key target:At least 35% women in executive positions (vice president level and above) by the end of 2021
Key target: 30% women non-executive directors on the BCE Board by the end of 2021
(1) Operational emissions include scope 1, GHG emissions from sources owned or controlled by Bell, and scope 2, GHG emissions associated with the consumption of purchased electricity, heat, steam and cooling.
(2) The variation from 2019 to 2020 is the result of appointments made to the BCE Board during 2020 in anticipation of the retirements of 3 directors at the 2021 annual shareholder meeting.
(3) Based on director nominees for election at the 2021 annual shareholder meeting.

BCE InC. 2020 AnnuAl REpoRt | 23
• Key metricsA member of the 30% Club and a signatory to the Catalyst Accord 2022, Bell is committed to achieving the Accord’s objective of women representing at least 30% of non-executive directors on the BCE Board by 2022, and to women representing at least 35% of Bell leaders at the VP level and above by the end of 2021.
In 2020, Bell updated its 2025 targets for Black, Indigenous and People of Colour (BIPOC) representation in Bell senior management to at least 25% and in student and graduate hiring to at least 40%.
• Key achievementsWomen represent 36% of the BCE Board non-executive directors based on director nominees for election at BCE’s 2021 annual shareholder meeting, exceeding our 30% objective. Women currently represent 32% of Bell leaders at the VP level and above. Our support for gender equity in the workplace has been recognized with Gold Parity Certification for the third year in a row by Women in Governance.
Bell was again recognized as one of Canada’s Best Diversity Employers in 2020. To further accelerate diversity and inclusion on our team, Bell partnered with the Onyx Initiative, which brings together major companies and academic institutions to support professional development and recruiting opportunities for Black post-secondary students and graduates. We also teamed up with the Black Professionals in Tech Network, Ascend Canada and Indigenous Works to drive progress in hiring and promotion for BIPOC talent in Canadian telecom and tech, and joined with BIPOC TV & Film to launch HireBIPOC to connect creators and crew with opportunities in Canadian media.
privacy and information security
Our customers, team members and investors expect us to demonstrate that we collect data appropriately, use it for purposes that advance their interests, and keep it secure.
Our approach to data governance encompasses the protection and appropriate use of data across its lifecycle, and we incorporate data governance proactively as a core consideration in all our business initiatives and technology decisions.
• Key metricsIn 2021, Bell plans to develop and deploy enhanced data governance training and complete the rollout of new BeCyberSavvy Information Security training to all applicable team members across the company.
• Key achievementsThe BCE Board adopted an enhanced data governance policy in 2020, bringing together multiple existing policies and programs in the interrelated areas of privacy, information security, data access management and records management.
To learn more about our ESG approach and our reporting, please visit BCE.ca/Responsibility.
● With strict focus on the protection of customer information, data governance is a key factor in all of our business decisions.

24 | BCE InC. 2020 AnnuAl REpoRt
Every action counts.
January 28
BELL_500761_LetsTalk_47x68.indd 3 2020-12-10 2:20 PM
D O S S I E R C L I E N T C A M PAG N E V E R S I O N S T U D I O / C O N S E I L
500761 Bell Let’s Talk 2021 V1 FS / MLP R O J E T F O R M AT F O R M AT I N F O G R A P H I Q U E R AT I O L I V R A I S O N C O U L E U R R É V I S I O N
Panneau 20 x 10 20’ x 10’ 20” x 10” 1/12 Décembre 4C 0
Now more than ever.
January 28
BELL_500761_LetsTalk_20x10_options.indd 1 2020-12-08 8:19 AM
In March, Bell Let’s Talk began working with national partners providing front-line mental health-care to identify ways to provide additional support quickly and effectively, especially to young people and families. A key focus was the need for enhanced virtual access to care.
Bell Let’s Talk put in place an emergency $5 million fund in response to COVID-19 demands, enabling new and expanded mental health programs from the Canadian Mental Health Association, Canadian Red Cross, Kids Help Phone, Revivre and Strongest Families Institute.
As Canada also confronted the urgent need to address systemic racism in our society, increasing access to culturally informed mental health services for Canadians from BIPOC communities became an important part of the Bell Let’s Talk response in 2020.
Bell launched a new $5 million Bell Let’s Talk Diversity Fund, working with expert advisors and partners from within BIPOC communities to identify new opportunities to support the mental health needs of racialized Canadians. To date, the fund has distributed $1.5 million to 10 groups, including initial grants to Black Youth Helpline and the National Association of Friendship Centres.
The crises of 2020 reinforced the need to address mental illness in new ways, as well as the important role all Canadians can play in putting the focus on mental health. This was underscored by the theme of our 2021 Bell Let’s Talk Day campaign: When it comes to mental health, now more than ever, every action counts.
Every Bell Let’s Talk Day, Bell donates 5 cents to mental health programs for every eligible call, text and social media message of support for action in mental health, at no cost to participants other than what they may normally pay their service provider for phone, text or Internet access. On our most recent Bell Let’s Talk Day, Canadians and people around the world set all-new records for engagement in the mental health conversation, sharing 159,173,435 messages of support.
The additional $7,958,671.75 generated by the messaging total brought Bell’s overall funding commitment to $121,373,806.75, well on the way to our objective of at least $155 million in 2025.
Despite restrictions imposed by COVID-19, Canadians found new ways to take part in Bell Let’s Talk Day in 2021. Virtual events enabled people from every corner of the country to join together and share messages of support and ideas for action, including more than 200 universities and colleges that took part in the Bell Let’s Talk Campus Campaign.
Many communities and partner organizations across the country took part in Bell Let’s Talk flag raisings to show their support for the mental health message. More than 160 flags were raised by cities, towns and legislative assemblies; universities and colleges; hospitals and other public facilities; and by the Canadian Armed Forces, including at CFS Alert near the North Pole, by soldiers overseas in Latvia, and sailors onboard HMCS Halifax in the North Sea.
● To address the mental health impacts of the COVID-19 crisis, we increased Bell Let’s Talk funding to support groups delivering emergency care and support for kids and families.
COMMUNITY INVESTMENT
Bell Let’s Talk accelerates investment in Canadian mental health
11th annual Bell Let’s Talk Day goes virtual across the country and around the world
The stress and uncertainty of the COVID-19 situation, alongside heightened attention to the impacts of systemic racism, meant significantly increased need for mental health supports in 2020.
Bell Let’s Talk responded with new funding and action to help meet the challenge.

BCE InC. 2020 AnnuAl REpoRt | 25
Michael Bublé@MichaelBuble
Today is Bell Let’s Talk Day and simply watching this video helps support mental health. For every view of the official Bell Let’s Talk Day video and every tweet and retweet using #BellLetsTalk, Bell will donate 5¢ to Canadian mental health initiatives. Join the conversation.
Bell Let's Talk @Bell_LetsTalk
Today, every view of this video helps create positive change. All you need to do is watch it and Bell will donate 5¢ more to Canadian mental health initiatives. Retweet to help spread the word! #BellLetsTalk
10:40 PM · Jan 27, 2021
1.8K 1.6K Share this TweetRyan Reynolds@VancityReynolds
It’s critical to have open, honest and healthy discussions around mental health. By retweeting #BellLetsTalk you can make a difference. In case that’s not enough, before Disney bought Fox, Deadpool 3 was gonna be a road trip between Deadpool and Logan. Rashomon style. For real.2:50 PM · Jan 28, 2021
46.7K 13.9K Share this Tweet
ound mental health. By retweeting <a href="https://twitter.com/hashtag/BellLetsTalk?src=hash&ref_src=twsrc%5Etfw">#BellLetsTalk</a> you can make a difference. In case that’s not enough, before Disney bought Fox, Deadpool 3 was gonna be a road trip between Deadpool and Logan. Rashomon style. For real.</p>— Ryan Reynolds (@VancityReynolds) <a href="https://twitter.com/VancityReynolds/status/1354879654406983680?ref_src=twsrc%5Etfw">January 28, 2021</a></blockquote> <script async src="https://platform.twitter.com/widgets.js" charset="utf-8"></script>
Celine Dion@celinedion
Now more than ever, taking care of our #mentalhealth is so very important. Let's all join the conversation & make positive changes to help those who are struggling. Help is out there if you need it, please reach out. – Celine xx… #BellLetsTalk8:59 AM · Jan 28, 2021
1.8K 1.6K Share this Tweet
Every action counts all year round
Bell Let’s Talk is active year round funding organizations in every province and territory that are working to reduce stigma, improving access to mental health care and undertaking critical research. Bell has partnered with more than 1,100 hospitals, universities, national associations and local community service providers since 2010.
This year, Bell Let’s Talk announced almost $7 million in funding for new mental health projects:
• Following the release of the National Standard of Canada for Mental Health and Well-Being for Post-Secondary Students (itself funded in part by Bell), we launched the $2.5 million Bell Let’s Talk Post-Secondary Fund to support Canadian colleges and universities in implementing the Standard.
• A $500,000 donation to Jack.org will further support youth mental health by expanding the reach of Jack Chapters around the country.
• A $2 million donation, matched by the Government of Canada, to the Brain Canada Foundation for the Bell Let’s Talk-Brain Canada Mental Health Research Program will accelerate brain research in the wake of COVID-19.
• Halifax’s QEII Foundation will use $420,000 from Bell Let’s Talk to support new repetitive Transcranial Magnetic Stimulation (rTMS) clinics at the Nova Scotia Hospital and Valley Regional Hospital.
• Montréal’s CHU Sainte-Justine Foundation received $300,000 to support an ambulatory care program for teenage patients being treated for eating disorders.
Please visit Bell.ca/letstalk to learn more about how Bell is supporting Canadian mental health every day of the year.
● Millions of people in Canada and around the world took action and helped spread the mental health message on Bell Let’s Talk Day, setting all-new records for engagement.

26 | BCE InC. 2020 AnnuAl REpoRt
Just 5 years after Bell was founded in the city, Montréal was at the centre of the last uncontrolled outbreak of smallpox in North America. As with COVID-19, people were warned to protect themselves by avoiding gatherings, and Bell employees were required to follow strict safety precautions. The company also ordered vaccinations for all employees in the city.
While the 1885 smallpox outbreak was largely confined to Montréal, the influenza pandemic that followed in 1918 was a global crisis that reached every corner of Canada.
Similar to the huge increases in Internet, phone, business communications and other Bell services during COVID-19, Bell’s network traffic surged during the 1918 flu outbreak as Canadians were forced to isolate in their homes and began using their landline phone services at unprecedented levels.
The Bell team itself was hit hard by influenza, with as many as 25% of employees absent in larger worksites at times. In smaller centres, the impact was often even worse: Joseph Gagnier, a Plant Chief in Trois-Rivières, reported he had only 2 workers available after 8 others became ill. ● Bell took out newspaper ads asking customers to limit
phone conversations to keep lines free during the emergency.
protecting the Bell team
In 1918, Bell President Lewis McFarlane sent advice to employees about influenza symptoms and how they could protect themselves, urging the team to “avoid this epidemic by every possible means.” In 2020, Bell implemented strict health and safety measures across the business, providing our team with personal protective equipment, remote work capabilities and enhanced access to virtual health services including mental health support.
● Lewis McFarlane, Bell President, 1918
BELL ARCHIVES
Bell stepped up for Canadiansduring pandemics of the pastSince our beginning in 1880, Bell has supported Canadians in good times
and bad with reliable connections, dedicated service and support for our communities. The Bell team’s outstanding response to the COVID-19 crisis has powerful echoes
in Canada’s experience with pandemics of the past.

BCE InC. 2020 AnnuAl REpoRt | 27
In major centres, clerks and other office staff were redeployed to take on the work of switchboard operators, also echoed in our COVD-19 response as we moved many team members from heavily impacted businesses like retail and media to take on customer service and support roles during the crisis.
Looking back after the influenza crisis had subsided, Bell Vice President (later President) Charles Sise Jr. described how the Bell team had responded:
“Probably never before has the operating staff been called upon to carry such heavy loads over such an extended period. That they did this willingly, in an endeavor to meet the crisis, shows a strong sense of loyalty to the community, the Company, and their fellow-workers.”
Bell’s key operating principles during the COVID crisis are a modern reflection of that enduring focus on delivering for all our stakeholders: Keep Canadians connected and informed; protect the health and safety of the public, our customers and team; and support our customers and communities.
In 2020, Bell stepped up for our customers, with 99.99+% network reliability, complimentary TV and Internet services, relief for those struggling with their bills and accelerated network deployments, and for our communities with additional Bell Let’s Talk funding and significant donations of protective equipment, and complimentary mobile services for healthcare and other workers on the front lines.
Innovative delivery for customers
In 1918, installers like Port Perry’s Don McIntosh and his colleagues found ways to stay safe and keep customers connected, including wearing “a crude mask of cheesecloth saturated in formaldehyde. Sometimes a telephone would be fastened to a board and pushed through the window.” In 2020, Bell’s Assisted Self-Installation and Repair program allowed technicians to support customers remotely by voice and video links from their vehicles.

28 | BCE InC. 2020 AnnuAl REpoRt
Today just got better
Tabl
e of
con
tent
s
BCE InC. 2020 AnnuAl REpoRt | 29
Table of contentsManagement’s discussion and analysis 301 overview 32
1.1 Introduction 331.2 About BCE 351.3 Key corporate developments 381.4 Capital markets strategy 391.5 Corporate governance and risk management 411.6 Environmental, social and governance practices 44
2 Strategic imperatives 492.1 Build the best networks 492.2 Drive growth with innovative services 502.3 Deliver the most compelling content 512.4 Champion customer experience 522.5 Operate with agility and cost efficiency 522.6 Engage and invest in our people 53
3 outlook, assumptions and risks 543.1 Business outlook and assumptions 543.2 Principal business risks 55
4 Consolidated financial analysis 594.1 Introduction 594.2 Customer connections 604.3 Operating revenues 614.4 Operating costs 614.5 Net earnings 624.6 Adjusted EBITDA 624.7 Severance, acquisition and other costs 634.8 Depreciation and amortization 634.9 Finance costs 644.10 Impairment of assets 644.11 Other (expense) income 644.12 Income taxes 654.13 Net earnings attributable to common shareholders and EPS 654.14 Capital expenditures 664.15 Cash flows 66
5 Business segment analysis 675.1 Bell Wireless 675.2 Bell Wireline 725.3 Bell Media 79
6 Financial and capital management 846.1 Net debt 846.2 Outstanding share data 846.3 Cash flows 856.4 Post-employment benefit plans 866.5 Financial risk management 876.6 Credit ratings 896.7 Liquidity 90
7 Selected annual and quarterly information 927.1 Annual financial information 927.2 Quarterly financial information 95
8 Regulatory environment 99
9 Business risks 103
10 Financial measures, accounting policies and controls 11110.1 Our accounting policies 11110.2 Non-GAAP financial measures and key performance
indicators (KPIs) 11510.3 Effectiveness of internal controls 118
Reports on internal controls 119Management’s report on internal control over financial reporting 119Report of independent registered public accounting firm 120
Consolidated financial statements 121Management’s responsibility for financial reporting 121Report of independent registered public accounting firm 122Consolidated income statements 124Consolidated statements of comprehensive income 125Consolidated statements of financial position 126Consolidated statements of changes in equity 127Consolidated statements of cash flows 128
notes to consolidated financial statements 129Note 1 Corporate information 129Note 2 Significant accounting policies 129Note 3 Discontinued operations 137Note 4 Segmented information 138Note 5 Operating costs 140Note 6 Severance, acquisition and other costs 140Note 7 Interest expense 141Note 8 Impairment of assets 141Note 9 Other (expense) income 142Note 10 Income taxes 142Note 11 Earnings per share 144Note 12 Trade and other receivables 144Note 13 Inventory 145Note 14 Contract assets and liabilities 145Note 15 Contract costs 145Note 16 Property, plant and equipment 146Note 17 Leases 147Note 18 Intangible assets 148Note 19 Investments in associates and joint ventures 149Note 20 Other non-current assets 150Note 21 Goodwill 150Note 22 Trade payables and other liabilities 151Note 23 Debt due within one year 151Note 24 Long-term debt 152Note 25 Provisions 153Note 26 Post-employment benefit plans 154Note 27 Other non-current liabilities 157Note 28 Financial and capital management 157Note 29 Share capital 161Note 30 Share-based payments 162Note 31 Additional cash flow information 165Note 32 Remaining performance obligations 166Note 33 Commitments and contingencies 167Note 34 Related party transactions 168Note 35 Significant partly-owned subsidiary 169Note 36 COVID-19 169
Board of directors 170
Executives 171
Investor information 172

MD
&A
30 | BCE InC. 2020 AnnuAl REpoRt
Management’s discussion and analysisIn this management’s discussion and analysis (MD&A), we, us, our, BCE and the company mean, as the context may require, either BCE Inc. or, collectively, BCE Inc., Bell Canada, their subsidiaries, joint arrangements and associates. Bell means, as the context may require, either Bell Canada or, collectively, Bell Canada, its subsidiaries, joint arrangements and associates.
All amounts in this MD&A are in millions of Canadian dollars, except where noted. Please refer to section 10.2, Non-GAAP financial measures and key performance indicators (KPIs) on pages 115 to 117 for a list of defined non-GAAP financial measures and KPIs.
Please refer to BCE’s audited consolidated financial statements for the year ended December 31, 2020 when reading this MD&A.
In preparing this MD&A, we have taken into account information available to us up to March 4, 2021, the date of this MD&A, unless otherwise stated.
You will find additional information relating to BCE, including BCE’s audited consolidated financial statements for the year ended December 31, 2020, BCE’s annual information form for the year ended December 31, 2020, dated March 4, 2021 (BCE 2020 AIF) and recent financial reports, on BCE’s website at BCE.ca, on SEDAR at sedar.com and on EDGAR at sec.gov.
Documents and other information contained in BCE’s website or in any other site referred to in BCE’s website or in this MD&A are not part of this MD&A and are not incorporated by reference herein.
This MD&A comments on our business operations, performance, financial position and other matters for the two years ended December 31, 2020 and 2019.
CAUTION REGARDING FORWARD-LOOKING STATEMENTS
BCE’s 2020 annual report, including this MD&A and, in particular, but without limitation, section 1.3, Key corporate developments, section 1.4, Capital markets strategy, section 2, Strategic imperatives, section 3.1, Business outlook and assumptions, section 5, Business segment analysis and section 6.7, Liquidity of this MD&A, contains forward-looking statements. These forward-looking statements include, without limitation, statements relating to our projected financial performance for 2021, BCE’s dividend growth objective and 2021 annualized common share dividend, BCE’s anticipated capital expenditures and the benefits expected to result therefrom, including its two-year increased capital investment program to accelerate fibre, Wireless Home Internet and Fifth Generation (5G) network expansion, BCE’s financial policy targets, the sources of liquidity we expect to use to meet our anticipated 2021 cash requirements, our expected post-employment benefit plans funding, BCE’s business outlook, objectives, plans and strategic priorities, and other statements that do not refer to historical facts. A statement we make is forward-looking when it uses what we know and expect today to make a statement about the future. Forward-looking statements are typically identified by the words assumption, goal, guidance, objective, outlook, project, strategy, target and other similar expressions or future or conditional verbs such as aim, anticipate, believe, could, expect, intend, may, plan, seek, should, strive and will. All such forward-looking statements are made pursuant to the safe harbour provisions of applicable Canadian securities laws and of the United States (U.S.) Private Securities Litigation Reform Act of 1995.
Unless otherwise indicated by us, forward-looking statements in BCE’s 2020 annual report, including in this MD&A, describe our expectations as at March 4, 2021 and, accordingly, are subject to change after that date. Except as may be required by applicable securities laws, we do not undertake any obligation to update or revise any forward-looking statements, whether as a result of new information, future events or otherwise.
Forward-looking statements, by their very nature, are subject to inherent risks and uncertainties and are based on several assumptions, both general and specific, which give rise to the possibility that actual results or events could differ materially from our expectations expressed in, or implied by, such forward-looking statements and that our business outlook, objectives, plans and strategic priorities may not be achieved. These statements are not guarantees of future performance or events,
and we caution you against relying on any of these forward-looking statements. Forward-looking statements are presented in BCE’s 2020 annual report, including in this MD&A, for the purpose of assisting investors and others in understanding our objectives, strategic priorities and business outlook as well as our anticipated operating environment. Readers are cautioned, however, that such information may not be appropriate for other purposes.
We have made certain economic, market and operational assumptions in preparing the forward-looking statements contained in BCE’s 2020 annual report, including this MD&A, and, in particular, but without limitation, the forward-looking statements contained in the previously mentioned sections of this MD&A. These assumptions include, without limitation, the assumptions described in the various sections of this MD&A entitled Business outlook and assumptions, which sections are incorporated by reference in this cautionary statement. Subject to various factors including, without limitation, the future impacts of the COVID-19 pandemic, which are difficult to predict, we believe that our assumptions were reasonable at March 4, 2021. If our assumptions turn out to be inaccurate, our actual results could be materially different from what we expect.
Important risk factors that could cause actual results or events to differ materially from those expressed in, or implied by, the previously-mentioned forward-looking statements and other forward-looking statements contained in BCE’s 2020 annual report, and in particular in this MD&A, include, but are not limited to: the COVID-19 pandemic and the adverse effects from the emergency measures implemented or to be implemented as a result thereof, as well as other pandemics, epidemics and other health risks; adverse economic and financial market conditions, a declining level of retail and commercial activity, and the resulting negative impact on the demand for, and prices of, our products and services; the intensity of competitive activity including from new and emerging competitors; the level of technological substitution and the presence of alternative service providers contributing to the acceleration of disruptions and disintermediation in each of our business segments; changing viewer habits and the expansion of over-the-top (OTT) television (TV) and other alternative service providers, as well as the fragmentation of, and changes in, the advertising market; rising content costs and challenges in our ability to acquire or develop key content; the proliferation of content piracy; higher Canadian smartphone

MD
&A
BCE InC. 2020 AnnuAl REpoRt | 31
penetration and reduced or slower immigration flow; regulatory initiatives, proceedings and decisions, government consultations and government positions that affect us and influence our business; the inability to protect our physical and non-physical assets from events such as information security attacks, unauthorized access or entry, fire and natural disasters; the failure to transform our operations, enabling a truly customer-centric service experience, while lowering our cost structure; the failure to continue investment in next-generation capabilities in a disciplined and strategic manner; the inability to drive a positive customer experience; the complexity in our operations; the failure to maintain operational networks in the context of significant increases in capacity demands; the risk that we may need to incur significant capital expenditures to provide additional capacity and reduce network congestion; the failure to implement or maintain highly effective information technology (IT) systems; the failure to generate anticipated benefits from our corporate restructurings, system replacements and upgrades, process redesigns, staff reductions and the integration of business acquisitions; events affecting the functionality of, and our ability to protect, test, maintain, replace and upgrade, our networks, IT systems, equipment and other facilities; in-orbit and other operational risks to which the satellites used to provide our satellite TV services are subject; the failure to attract and retain employees with the appropriate skill sets and to drive their performance in a safe environment; labour disruptions and shortages; our dependence on third-party suppliers, outsourcers and consultants to provide an uninterrupted supply of the products and services we need to operate our business; the failure of our vendor selection, governance and oversight processes; security and data leakage exposure if security control protocols affecting our suppliers are bypassed; the quality of our products and services and the extent to which they may be subject to manufacturing defects or fail to comply with applicable government regulations and standards; the inability to access adequate sources of capital and generate sufficient cash flows from operating activities to meet our cash requirements, fund capital expenditures and provide for planned growth; uncertainty as to whether dividends will be declared by BCE’s board of directors (BCE Board or Board) or whether the dividend on common shares will be increased; the inability to manage various credit, liquidity and market risks; pension obligation volatility and increased contributions to post-employment benefit plans; new or higher taxes due to new tax laws or changes thereto or in the interpretation thereof, and the inability to predict the outcome of government audits; the failure to reduce costs, as well as unexpected increases in costs; the failure to evolve practices to effectively monitor and control fraudulent activities; unfavourable resolution of legal proceedings and, in particular, class actions; new or unfavourable changes in applicable laws and the failure to proactively
address our legal and regulatory obligations; the failure to recognize and adequately respond to climate change concerns or stakeholder and governmental changing expectations on environmental matters; and health concerns about radiofrequency emissions from wireless communication devices and equipment.
These and other risk factors that could cause actual results or events to differ materially from our expectations expressed in, or implied by, our forward-looking statements are discussed in this MD&A and, in particular, in section 9, Business risks of this MD&A.
Forward-looking statements contained in BCE’s 2020 annual report, including in this MD&A, for periods beyond 2021 involve longer-term assumptions and estimates than forward-looking statements for 2021 and are consequently subject to greater uncertainty. In particular, the nature and value of capital investments planned to be made by BCE over the next two years assume our ability to access or generate the necessary sources of capital as well as access the necessary equipment and labour. However, there can be no assurance that the required sources of capital, equipment or labour will be available with the result that the actual nature and value of capital investments made by BCE, as well as the timing thereof, could materially differ from current expectations. Forward-looking statements for periods beyond 2021 further assume, unless otherwise indicated, that the competitive, regulatory, security, technological, operational, financial and other risks described above and in section 9, Business risks, of this MD&A will remain substantially unchanged during such periods, except for an assumed improvement in the risk factors related to the COVID-19 pandemic and general economic conditions in future years.
We caution readers that the risk factors described above and in the previously mentioned section and in other sections of this MD&A are not the only ones that could affect us. Additional risks and uncertainties not currently known to us or that we currently deem to be immaterial may also have a material adverse effect on our business, financial condition, liquidity, financial results or reputation. From time to time, we consider potential acquisitions, dispositions, mergers, business combinations, investments, monetizations, joint ventures and other transactions, some of which may be significant. Except as otherwise indicated by us, forward-looking statements do not reflect the potential impact of any such transactions or of special items that may be announced or that may occur after March 4, 2021. The financial impact of these transactions and special items can be complex and depends on facts particular to each of them. We therefore cannot describe the expected impact in a meaningful way, or in the same way we present known risks affecting our business.

1M
D&
A
Ove
rvie
w
32 | BCE InC. 2020 AnnuAl REpoRt
1 Overview
COVID-19The emergency measures put in place in Canada starting in March 2020 to combat the COVID-19 pandemic significantly disrupted retail and commercial activities across most sectors of the economy and had an adverse and pervasive impact on our financial and operating performance throughout most of 2020. Consequently, this unfavourably affected all three of our segments, with a more pronounced impact on our Bell Wireless and Bell Media segments. The most significant impact of the COVID-19 pandemic was experienced in the second quarter of 2020. The gradual easing of certain emergency measures in the latter part of the second quarter allowed many businesses to resume some level of, or increase, commercial activities, resulting in a marked sequential improvement in our business and financial performance in the third quarter. However, starting in late September, due to the resurgence in the number of COVID-19 cases, government restrictions were gradually tightened and became more severe in late December, resulting in the closure of all non-essential businesses and the reintroduction of lockdown measures in certain areas. This drove lower consumer activity during key selling periods.
The COVID-19 pandemic had the following principal consequences on our business and financial results in 2020:
• Lower advertising revenues from our Bell Media segment due to customer cancellations attributable to the temporary shutdown of businesses and the cancellation and/or postponement of sporting events
• Lower wireless product sales driven by reduced market activity, fewer promotional offers and the temporary closure of our retail distribution channels
• Decreased service revenues in our Bell Wireless segment primarily due to lower outbound roaming revenues resulting from reduced customer travel and the waiving of roaming charges during the month of April 2020
• A reduction in Bell Wireless and Bell Wireline subscriber activity due to reduced market activity, fewer promotions and the temporary closure of our retail distribution channels resulting in lower activations, moderated by lower deactivations
• Higher bad debt expense and customer accommodations, including delayed implementation of price increases and revenue credits, due to the financial difficulty experienced by customers
• Lower and delayed customer spending in our business markets due to the temporary shutdown of businesses, uncertain economic environment and difficulties accessing customer premises
• Higher COVID-19-related expenses primarily in our Bell Wireline segment, including related to employee redeployment, greater donations, purchase of personal protective equipment (PPE), incremental building cleaning and supplies
• Higher capital investments in wireless and wireline network capacity enhancements to support increased demand, along with greater investments in online fulfillment, customer self-serve and automation tools, as well as improved app functionality
Due to uncertainties relating to the severity and duration of the COVID-19 pandemic, including the current resurgence and possible future resurgences in the number of COVID-19 cases, and various potential outcomes, it is difficult at this time to estimate the impacts of the COVID-19 pandemic on our business or future financial results and related assumptions. Our business and financial results could continue to be significantly and negatively impacted in future periods. The extent to which the COVID-19 pandemic will continue to adversely impact us will depend on future developments that are difficult to predict, including the effective distribution of approved vaccines and treatments, and the potential development and distribution of new vaccines and treatments, as well as new information which may emerge concerning the severity, duration and resurgences of the COVID-19 pandemic and the actions required to contain the coronavirus or remedy its impacts, among others.
2020 REPORTING CHANGESOn June 1, 2020, BCE announced that it had entered into an agreement to sell substantially all of its data centre operations in an all-cash transaction valued at $1.04 billion. We have reclassified amounts related to the sale for the previous year to discontinued operations in our consolidated income statements and consolidated statements of cash flows to make them consistent with the presentation for the current year. Property, plant and equipment and intangible assets that were sold were no longer depreciated or amortized effective June 1, 2020. In Q4 2020, we completed the sale for proceeds of $933 million (net of debt and other items) and recorded a gain on sale, net of taxes, of $211 million. The capital gain as a result of the sale is mainly offset by the recognition of previously unrecognized capital loss carry forwards.
In Q2 2020, we updated our definitions of adjusted net earnings (1), adjusted EPS (1) and free cash flow (1) to exclude the impacts of discontinued operations as they may affect the comparability of our
financial results and could potentially distort the analysis of trends in business performance. As a result of this change, prior periods have been restated for comparative purposes. See section 10.2, Non-GAAP financial measures and key performance indicators (KPIs), for more details.
To align with changes in how we manage our business and assess performance, the operating results of our public safety land radio network business are now included within our Bell Wireline segment effective January 1, 2020, with prior periods restated for comparative purposes. Previously, these results were included within our Bell Wireless segment. Our public safety land radio network business, which builds and manages land mobile radio networks primarily for the government sector, is now managed by our Bell Business Markets team in order to better serve our customers with end-to-end communications solutions.
(1) Adjusted net earnings, adjusted EPS and free cash flow are non-GAAP financial measures and do not have any standardized meaning under International Financial Reporting Standards (IFRS). Therefore, they are unlikely to be comparable to similar measures presented by other issuers. See section 10.2, Non-GAAP financial measures and key performance indicators (KPIs) – Adjusted net earnings and adjusted EPS, and Free cash flow and dividend payout ratio in this MD&A for more details, including reconciliations to the most comparable IFRS financial measure.
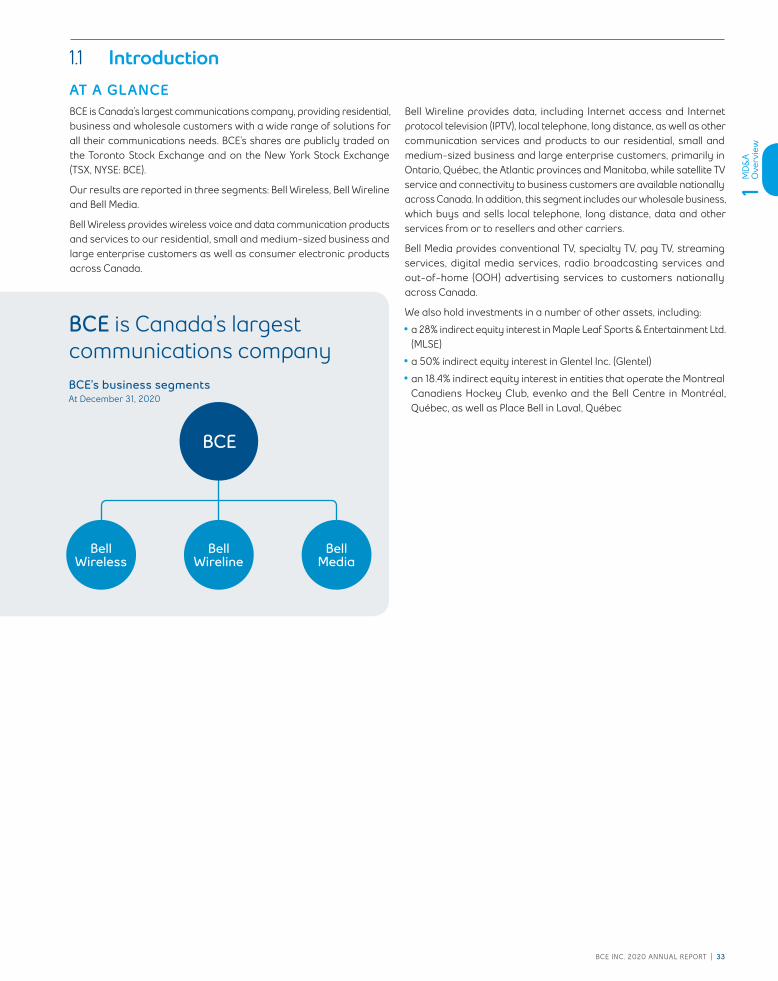
1M
D&
A
Ove
rvie
w
BCE InC. 2020 AnnuAl REpoRt | 33
1.1 IntroductionAT A GLANCEBCE is Canada’s largest communications company, providing residential, business and wholesale customers with a wide range of solutions for all their communications needs. BCE’s shares are publicly traded on the Toronto Stock Exchange and on the New York Stock Exchange (TSX, NYSE: BCE).
Our results are reported in three segments: Bell Wireless, Bell Wireline and Bell Media.
Bell Wireless provides wireless voice and data communication products and services to our residential, small and medium-sized business and large enterprise customers as well as consumer electronic products across Canada.
Bell Wireline provides data, including Internet access and Internet protocol television (IPTV), local telephone, long distance, as well as other communication services and products to our residential, small and medium-sized business and large enterprise customers, primarily in Ontario, Québec, the Atlantic provinces and Manitoba, while satellite TV service and connectivity to business customers are available nationally across Canada. In addition, this segment includes our wholesale business, which buys and sells local telephone, long distance, data and other services from or to resellers and other carriers.
Bell Media provides conventional TV, specialty TV, pay TV, streaming services, digital media services, radio broadcasting services and out-of-home (OOH) advertising services to customers nationally across Canada.
We also hold investments in a number of other assets, including:
• a 28% indirect equity interest in Maple Leaf Sports & Entertainment Ltd. (MLSE)
• a 50% indirect equity interest in Glentel Inc. (Glentel)
• an 18.4% indirect equity interest in entities that operate the Montreal Canadiens Hockey Club, evenko and the Bell Centre in Montréal, Québec, as well as Place Bell in Laval, Québec
BCE is Canada’s largest communications companyBCE’s business segmentsAt December 31, 2020
Bell Wireless
Bell Wireline
Bell Media
BCE

1M
D&
A
Ove
rvie
w
34 | BCE InC. 2020 AnnuAl REpoRt
BCE 2020 CONSOLIDATED RESULTS
Operating revenues
$22,883million (3.8%) vs. 2019
Net earnings
$2,699million (17.0%) vs. 2019
Adjusted EBITDA (1)
$9,607million (4.0%) vs. 2019
Net earnings attributable to common shareholders
$2,498million (17.8%) vs. 2019
Adjusted net earnings
$2,730million (12.5%) vs. 2019
Cash flows from operating activities
$7,754million (2.6%) vs. 2019
Free cash flow
$3,348million (10.4%) vs. 2019
BCE CUSTOMER CONNECTIONS
WirelessTotal
+2.6%10.2 million subscribers at the end of 2020
Retail high-speed Internet
+4.2%3.7 million subscribers at the end of 2020
Retail TV
(1.2%)2.7 million subscribers at the end of 2020
Retail residential network access services (NAS) lines
(7.9%)2.5 million subscribers at the end of 2020
OUR GOALBCE’s goal is to advance how Canadians connect with each other and the world. Our strategic imperatives frame our longstanding strengths in networks, service innovation and content creation, and position the company for continued growth and innovation leadership in a fast-changing communications marketplace. Our primary business objectives are to grow our subscriber base profitably and to maximize revenues, operating profit, free cash flow and return on invested capital by further enhancing our position as the foremost provider in Canada of comprehensive communications services to residential, business and wholesale customers, and as Canada’s premier content creation company. We seek to take advantage of opportunities to leverage our networks, infrastructure, sales channels, and brand and marketing resources across our various lines of business to create value for both our customers and other stakeholders.
Our strategy is centred on our disciplined focus and execution of six strategic imperatives that position us to deliver continued success. The six strategic imperatives that underlie BCE’s business plan are:
1
Build the best networks
3Deliver the most compelling content
2
Drive growth with innovative services
4
Champion customer experience
6
Engage and invest in our people
5
Operate with agility and cost efficiency
BELL’S 6 STRATEGIC IMPERATIVES
(1) Adjusted EBITDA is a non-GAAP financial measure and does not have any standardized meaning under IFRS. Therefore, it is unlikely to be comparable to similar measures presented by other issuers. See section 10.2, Non-GAAP financial measures and key performance indicators (KPIs) – Adjusted EBITDA and adjusted EBITDA margin in this MD&A for more details, including a reconciliation to the most comparable IFRS financial measure.
1M
D&
A
Ove
rvie
w
BCE InC. 2020 AnnuAl REpoRt | 35
1.2 About BCEWe report the results of our operations in three segments: Bell Wireless, Bell Wireline and Bell Media. We describe our product lines by segment below, to provide further insight into our operations.
OUR PRODUCTS AND SERVICES
Bell WirelessSEGMENT DESCRIPTION• Provides integrated digital wireless voice and data communication
products and services to residential and business customers across Canada
• Includes the results of operations of Bell Mobility Inc. (Bell Mobility) and our national consumer electronics retailer, The Source (Bell) Electronics Inc. (The Source)
OUR BRANDS INCLUDE
OUR NETWORKS AND REACHWe hold wireless spectrum licences, with holdings across various spectrum bands and regions across Canada, totalling more than 4.8 billion megahertz per population (MHz-Pop), corresponding to an average of approximately 137 Megahertz (MHz) of spectrum per Canadian.
The vast majority of our cell towers are connected with fibre, the latest network infrastructure technology, for a faster and more reliable connection.
Our Fourth Generation (4G) Long-term Evolution (LTE) and LTE Advanced (LTE-A) nationwide wireless broadband networks are compatible with global standards and deliver high-quality and reliable voice and high-speed data services to virtually all of the Canadian population. Our 5G network, launched in June 2020, is the next-generation of wireless technology. Our LTE network will be the backbone for our 5G network as it expands across Canada.
• LTE coverage of over 99% of Canada’s population coast to coast, with LTE-A covering approximately 96% of Canada’s population and 5G covering 26% of Canada’s population at December 31, 2020
• Peak theoretical mobile data access download speeds: 5G, up to 1.7 Gbps (average expected speeds of 69 to 385 Mbps in the Greater Toronto Area (GTA)); LTE-A, up to 1.5 Gigabit(s) per second (Gbps) (1) (average expected speeds of 25 to 319 Mbps); LTE, up to 150 Mbps (expected average speeds of 18 to 40 Mbps); High-speed packet access plus (HSPA+), up to 42 Mbps (expected average speeds of 7 to 14 Mbps) (2)
• Reverts to LTE/LTE-A technology and speeds when customers are outside 5G coverage areas
• Bell also operates a LTE-category M1 (LTE-M) network, which is a subset of our LTE network, supporting low-power Internet of Things (IoT) applications with enhanced coverage, longer device battery life and lower costs for IoT devices connecting to Bell’s national network. Our LTE-M network is available in most Canadian provinces
We have more than 4,600 retail points of distribution across Canada, including approximately 1,200 Bell, Virgin Mobile Canada (Virgin Mobile), Lucky Mobile and The Source locations, as well as Glentel-operated locations (WIRELESSWAVE, Tbooth wireless and WIRELESS etc.) and other third-party dealer and retail locations.
OUR PRODUCTS AND SERVICES• Data and voice plans: From plans focused on affordability to premium
services, we have plans that cater to all customer segments, available on either postpaid or prepaid options, including unlimited data, shareable, device financing plans and Connect Everything plans. Our services provide fast Internet access for video, social networking, messaging and mobile applications, as well as a host of call features.
• Specialized plans: for tablets, mobile Internet, smartwatches and Connected Car
• Extensive selection of devices: leading 5G, 4G LTE and LTE-A smartphones, tablets, mobile Internet hubs and sticks, mobile Wi-Fi devices and connected things (smartwatches, Bell Connected Car, trackers, connected home, lifestyle products and virtual reality)
• Travel: roaming services with other wireless service providers in more than 230 outbound destinations worldwide with LTE roaming in 196 outbound destinations, Roam Better feature and Travel Passes
• Mobile business solutions: push-to-talk, field service management, worker safety and mobility management
• IoT solutions: asset management, smart buildings, smart cities, fleet management and other IoT services
(1) Peak theoretical download speeds of up to 1.5 Gbps on LTE-A are currently available in Kingston, Waterloo, Toronto, Mississauga, Vaughan, Richmond Hill, Markham, Brampton, North Bay, Niagara-on-the-Lake, Cambridge, Pickering, Ajax, Burlington, Guelph, London, Niagara Falls, Oakville, St. Catharines, Thorold, Thunder Bay, Welland and Ottawa. Compatible device required.
(2) Network speeds vary with location, signal and customer device. Compatible device required.
1M
D&
A
Ove
rvie
w
36 | BCE InC. 2020 AnnuAl REpoRt
Bell WirelineSEGMENT DESCRIPTION• Provides data, including Internet access and IPTV, voice, comprising local
telephone and long distance, as well as other communication services and products to residential, small and medium-sized business and large enterprise customers, primarily in Ontario, Québec, the Atlantic provinces and Manitoba, while satellite TV service and connectivity to business customers are available nationally across Canada. We also offer competitive local exchange carrier (CLEC) services in Alberta and British Columbia.
• Includes the results of our wholesale business, which buys and sells local telephone, long distance, data and other services from or to resellers and other carriers, and the wireline operations of Northwestel Inc. (Northwestel), which provides telecommunications services in Canada’s Northern Territories
OUR BRANDS INCLUDE
OUR NETWORKS AND REACH• Extensive local access network in Ontario, Québec, the Atlantic
provinces and Manitoba, as well as in Canada’s Northern Territories
• Broadband fibre network, consisting of fibre-to-the-premise (FTTP) and fibre-to-the-node (FTTN) locations, covering approximately 9.9 million homes and businesses in Ontario, Québec, the Atlantic provinces and Manitoba. Our FTTP direct fibre footprint encompassed approximately 5.6 million homes and commercial locations at the end of 2020, representing the largest FTTP footprint in Canada.
• Wireless-to-the-premise (WTTP) footprint approaching 50% of our target of 1 million locations primarily in rural areas. WTTP is 5G-capable fixed wireless technology delivered over Bell’s LTE wireless network that provides broadband residential Internet access to smaller and underserved communities.
• Largest Internet protocol (IP) multi-protocol label switching footprint of any Canadian provider, enabling us to offer business customers a virtual private network (VPN) service for IP traffic and to optimize bandwidth for real-time voice and TV
• More than 700 Bell and Virgin Mobile locations
OUR PRODUCTS AND SERVICESRESIDENTIAL
• TV: IPTV services (Fibe TV, Alt TV and Virgin TV) and satellite TV service. Bell Fibe TV provides extensive content options with full high-definition (HD) and 4K resolution (4K) Whole Home personal video recorder (PVR), 4K Ultra HD programming, on-demand content and innovative features including wireless receivers, the Fibe TV app, Restart and access to Crave, Netflix and YouTube. Alt TV app-based live TV streaming service offers live and on-demand programming on Bell Streamer, Apple TV, Amazon Fire TV, Google Chromecast, laptops, smartphones, tablets and other devices with no traditional TV set-top box (STB) required. Bell Streamer is a 4K High Dynamic Range (HDR) streaming device powered by Android TV offering all-in-one access to Alt TV, support for all major streaming services and access to thousands of apps on Google Play. We also offer an app-based live TV streaming service branded as Virgin TV.
• Internet: high-speed Internet access through fibre optic broadband technology, 5G-capable WTTP technology or digital subscriber line (DSL) with a wide range of options, including Whole Home Wi-Fi, unlimited usage, security services and mobile Internet. Our Internet service, marketed as Fibe Internet, offers total download access speeds of up to 1.5 Gbps with FTTP or download speeds of up to 100 Mbps with FTTN, while our Wireless Home Internet fixed wireless service currently delivers broadband download speeds of up to 50 Mbps. We also offer Internet service under the Virgin Mobile brand offering download speeds of up to 100 Mbps.
• Home Phone: local telephone service, long distance and advanced calling features
• Smart Home: home security, monitoring and automation services from Bell Smart Home
• Bundles: multi-product bundles of TV, Internet, home phone and smart home services with monthly discounts
BUSINESS
• Internet and private networks: business Internet, Ethernet, IP VPN, Wavelength, global network solutions, virtual network services, managed Wi-Fi
• Communications: IP telephony, local and long distance, audio, video and web conferencing and webcasting, contact centre solutions
• Cloud: cloud computing, cloud connect, backup and disaster recovery, cloud managed services
• Other: security, managed services, professional services

1M
D&
A
Ove
rvie
w
BCE InC. 2020 AnnuAl REpoRt | 37
Bell MediaSEGMENT DESCRIPTION• Canada’s leading content creation company with premier assets in
video, radio, OOH advertising and digital media
• Revenues are derived primarily from advertising and subscriber fees
• Conventional TV, radio, OOH and digital media revenues are derived from advertising
• Specialty TV revenue is generated from subscription fees and advertising
• Pay TV revenue is derived from subscription fees
OUR BRANDS INCLUDE
OUR ASSETS AND REACH
VIDEO
• 35 conventional TV stations, including CTV, Canada’s #1 TV network for 19 consecutive years, and the French-language Noovo network in Québec
• 27 specialty TV channels, including TSN, Canada’s most-watched sports channel and RDS, the top French-language sports network
• 4 pay TV services and 3 direct-to-consumer (DTC) streaming services, including Crave, the exclusive home of HBO in Canada
RADIO
• 109 licensed radio stations in 58 markets across Canada
OOH ADVERTISING
• Network of more than 50,000 advertising faces in key urban cities across Canada
DIGITAL MEDIA
• More than 200 websites and more than 30 apps
BROADCAST RIGHTS
• Sports: long-term media rights to key sports properties and official Canadian broadcaster of the Super Bowl, Grey Cup and International Ice Hockey Federation (IIHF) World Junior Championship. Live sports coverage includes the Toronto Maple Leafs, Montreal Canadiens, Winnipeg Jets and Ottawa Senators, Canadian Football League (CFL), National Football League (NFL), National Basketball Association (NBA), Major League Soccer (MLS), Fédération Internationale de Football Association (FIFA) World Cup events, Curling’s Season of Champions, Major League Baseball (MLB), Golf’s Majors, NASCAR Cup Series, Formula 1 (F1), Grand Slam Tennis, Ultimate Fighting Championship (UFC), National Collegiate Athletic Association (NCAA), March Madness and more.
• HBO: long-term agreement to deliver all current-season, past-season and library HBO programming in Canada exclusively on our linear, on-demand and OTT platforms
• HBO Max: long-term exclusive agreement to deliver original, non-children’s programming produced by Warner Bros. Television Group for HBO Max
• SHOWTIME: content licensing and trademark agreement for past, present and future SHOWTIME-owned programming
• STARZ: long-term agreement with Lionsgate to deliver U.S. premium pay TV platform STARZ in Canada
• iHeartRadio: exclusive partnership for digital and streaming music services in Canada
OTHER ASSETS
• Majority stake in Pinewood Toronto Studios, the largest purpose-built production studio in Canada
• Partnership in Just for Laughs, the live comedy event and TV producer
• Equity interest in Dome Productions Partnership, one of North America’s leading providers of sports and other event production and broadcast facilities
• Minority interest in Montréal’s Grandé Studios, a Montréal-based multipurpose TV, film, and equipment company which provides production facilities, equipment rentals, and technical services
OUR PRODUCTS AND SERVICES• Varied and extensive array of TV programming to broadcast distributors
across Canada
• Advertising on our TV, radio, OOH, and digital media properties to both local and national advertisers across a wide range of industry sectors
• Crave bilingual subscription on-demand TV streaming service offering a large collection of premium content in one place, including HBO, HBO Max, SHOWTIME, STARZ and Super Écran programming, on STBs, mobile devices, streaming devices and online. Crave is offered through a number of Canadian TV providers and is available directly to all Canadian Internet subscribers as an OTT service.
• TSN Direct and RDS Direct streaming services offering live and on-demand TSN and RDS content directly to consumers through a monthly or single-day subscription on computers, tablets, mobile devices, Apple TV and other streaming devices
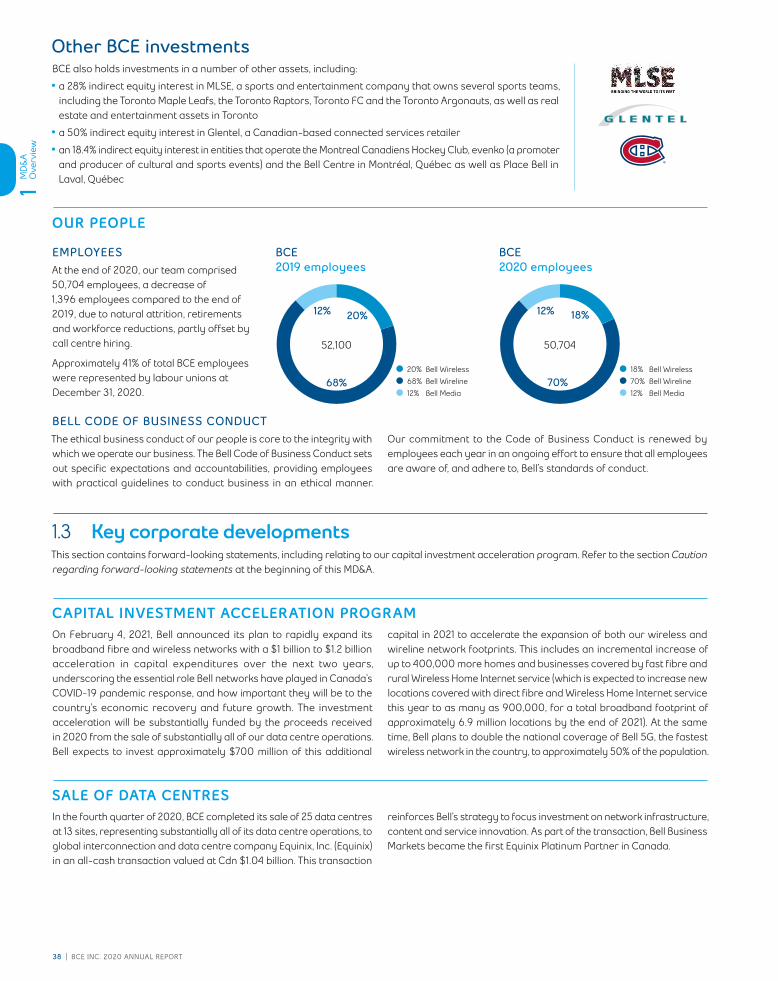
1M
D&
A
Ove
rvie
w
38 | BCE InC. 2020 AnnuAl REpoRt
Other BCE investmentsBCE also holds investments in a number of other assets, including:
• a 28% indirect equity interest in MLSE, a sports and entertainment company that owns several sports teams, including the Toronto Maple Leafs, the Toronto Raptors, Toronto FC and the Toronto Argonauts, as well as real estate and entertainment assets in Toronto
• a 50% indirect equity interest in Glentel, a Canadian-based connected services retailer
• an 18.4% indirect equity interest in entities that operate the Montreal Canadiens Hockey Club, evenko (a promoter and producer of cultural and sports events) and the Bell Centre in Montréal, Québec as well as Place Bell in Laval, Québec
OUR PEOPLE
EMPLOYEESAt the end of 2020, our team comprised 50,704 employees, a decrease of 1,396 employees compared to the end of 2019, due to natural attrition, retirements and workforce reductions, partly offset by call centre hiring.
Approximately 41% of total BCE employees were represented by labour unions at December 31, 2020.
BCE2019 employees
BCE2020 employees
68%
20%12%
52,100
70%
18%12%
50,704
BELL CODE OF BUSINESS CONDUCTThe ethical business conduct of our people is core to the integrity with which we operate our business. The Bell Code of Business Conduct sets out specific expectations and accountabilities, providing employees with practical guidelines to conduct business in an ethical manner.
Our commitment to the Code of Business Conduct is renewed by employees each year in an ongoing effort to ensure that all employees are aware of, and adhere to, Bell’s standards of conduct.
1.3 Key corporate developmentsThis section contains forward-looking statements, including relating to our capital investment acceleration program. Refer to the section Caution regarding forward-looking statements at the beginning of this MD&A.
CAPITAL INVESTMENT ACCELERATION PROGRAMOn February 4, 2021, Bell announced its plan to rapidly expand its broadband fibre and wireless networks with a $1 billion to $1.2 billion acceleration in capital expenditures over the next two years, underscoring the essential role Bell networks have played in Canada’s COVID-19 pandemic response, and how important they will be to the country’s economic recovery and future growth. The investment acceleration will be substantially funded by the proceeds received in 2020 from the sale of substantially all of our data centre operations. Bell expects to invest approximately $700 million of this additional
capital in 2021 to accelerate the expansion of both our wireless and wireline network footprints. This includes an incremental increase of up to 400,000 more homes and businesses covered by fast fibre and rural Wireless Home Internet service (which is expected to increase new locations covered with direct fibre and Wireless Home Internet service this year to as many as 900,000, for a total broadband footprint of approximately 6.9 million locations by the end of 2021). At the same time, Bell plans to double the national coverage of Bell 5G, the fastest wireless network in the country, to approximately 50% of the population.
SALE OF DATA CENTRESIn the fourth quarter of 2020, BCE completed its sale of 25 data centres at 13 sites, representing substantially all of its data centre operations, to global interconnection and data centre company Equinix, Inc. (Equinix) in an all-cash transaction valued at Cdn $1.04 billion. This transaction
reinforces Bell’s strategy to focus investment on network infrastructure, content and service innovation. As part of the transaction, Bell Business Markets became the first Equinix Platinum Partner in Canada.
20% Bell Wireless 68% Bell Wireline 12% Bell Media
18% Bell Wireless 70% Bell Wireline 12% Bell Media

1M
D&
A
Ove
rvie
w
BCE InC. 2020 AnnuAl REpoRt | 39
BELL MEDIA LEADERSHIP CHANGEOn January 4, 2021, Wade Oosterman assumed operational leadership of Bell Media in addition to his media strategy role following the departure of Bell Media President Randy Lennox. A Bell executive since 2006, Mr. Oosterman was most recently Vice Chair and Group President, BCE and Bell, responsible for strategic direction of Bell’s wireless, residential and media segments. In his prior roles, Mr. Oosterman
served as President of Mobility and Residential Services and has also served as Bell’s Chief Brand Officer since he joined the company. As Mr. Oosterman focuses fully on his role at Bell Media, Devorah Lithwick, formerly Senior Vice-President, Brand, was appointed Senior Vice-President and Chief Brand Officer.
1.4 Capital markets strategyThis section contains forward-looking statements, including relating to BCE’s dividend growth objective, 2021 annualized common share dividend and financial policy targets, and our business outlook, objectives and plans. Refer to the section Caution regarding forward-looking statements at the beginning of this MD&A.
We seek to deliver sustainable shareholder returns through consistent dividend growth. This objective is underpinned by substantial free cash flow generation and a strong balance sheet, supporting a significant ongoing capital investment on advanced broadband networks and services that are essential to driving the long-term growth of our business.
DIVIDEND GROWTH AND PAYOUT POLICY
Dividend yield (1)
6.1%in 2020
2021 dividend increase
+5.1%to $3.50 per common share
Dividend payout policy
65%–75%of free cash flow
On February 4, 2021, we announced a 5.1%, or 17 cents, increase in the annualized dividend payable on BCE’s common shares for 2021 to $3.50 per share from $3.33 per share in 2020, starting with the quarterly dividend payable on April 15, 2021. This represents BCE’s 17th increase to its annual common share dividend since 2009, representing a total increase of 140%. This is BCE’s 13th consecutive year of 5% or better dividend growth.
Our objective is to seek to achieve dividend growth while maintaining our dividend payout ratio (2) within the target policy range of 65% to 75% of free cash flow and balancing our strategic business priorities.
BCE’s dividend payout policy, increases in the common share dividend and the declaration of dividends are subject to the discretion of the BCE Board and, consequently, there can be no guarantee that BCE’s dividend policy will be maintained, that the dividend on common shares will be increased or that dividends will be declared. In 2020, our dividend payout ratio was 89%, which is higher than our policy range due to the impact of the COVID-19 pandemic. Due to a planned acceleration in capital expenditures and ongoing financial impacts of the COVID-19 pandemic expected in 2021, BCE’s dividend payout ratio is expected to remain above our target policy range this year.
EXECUTIVE COMPENSATION ALIGNMENTBCE’s management equity-based incentive plans are structured to maximize shareholder value, share price and capital returns, as well as delivering on our goal of advancing how Canadians connect with each other and the world, through the successful execution of our six strategic imperatives. We have a strong alignment of interest between shareholders and our management’s equity-based incentive plans.
Best practices adopted by
BCEfor executive compensation
• Stringent share ownership requirements
• Emphasis on pay at risk for executive compensation
• Double trigger change-in-control policy
• Anti-hedging policy on share ownership and incentive compensation
• Clawbacks for the president and Chief Executive officer (CEo) and all Executive Vice-presidents as well as all option holders
• Caps on BCE supplemental executive retirement plans and annual bonus payouts, in addition to mid-term and long-term incentive grants
• Vesting criteria fully aligned to shareholder interests
(1) Annualized dividend per BCE common share divided by BCE’s share price at the end of the year.(2) Dividend payout ratio is a non-GAAP financial measure and does not have any standardized meaning under IFRS. Therefore, it is unlikely to be comparable to similar measures presented
by other issuers. See section 10.2, Non-GAAP financial measures and key performance indicators (KPIs) – Free cash flow and dividend payout ratio for more details.

1M
D&
A
Ove
rvie
w
40 | BCE InC. 2020 AnnuAl REpoRt
USE OF LIQUIDITYConsistent with our capital markets objective to deliver sustainable shareholder returns through dividend growth, while maintaining planned levels of capital investment, investment-grade credit ratings and considerable overall financial flexibility, we deploy remaining free cash flow, after payment of dividends on common shares, in a balanced manner and on uses that include, but are not limited to:
• Funding of strategic acquisitions and investments (including wireless spectrum purchases) that support the growth of our business
• Debt reduction
• Voluntary contributions to BCE’s defined benefit (DB) pension plans to improve the funded position of the plans and reduce the use of letters of credit for funding deficits
• Share buybacks through normal course issuer bid programs
In 2020, free cash flow, after payment of dividends on common shares, in the amount of $373 million, down from $919 million in 2019, was directed towards various small acquisitions and strategic partnerships that support our strategic imperatives, as well as the repayment of short-term debt. The year-over-year decrease was primarily attributable to the financial impacts of the COVID-19 pandemic.
TOTAL SHAREHOLDER RETURN PERFORMANCE
Five-year total shareholder return (1)
+32%2016–2020
One-year total shareholder return (1)
(4.1%)2020
FIVE-YEAR CUMULATIVE TOTAL VALUE OF A $100 INVESTMENT (2)DECEMBER 31, 2015 – DECEMBER 31, 2020
This graph compares the yearly change in the cumulative annual total shareholder return of BCE common shares against the cumulative annual total return of the S&P/TSX Composite Index (3), for the five-year period ending December 31, 2020, assuming an initial investment of $100 on December 31, 2015 and the quarterly reinvestment of all dividends.
BCE common shares S&P/TSX Composite Index
STRONG CAPITAL STRUCTUREBCE’s balance sheet is underpinned by a healthy liquidity position of approximately $3.8 billion at the end of 2020 and an investment-grade credit profile, providing the company with a solid financial foundation and a high level of overall financial flexibility. BCE has an attractive long-term debt maturity profile with no material maturities until the fourth quarter of 2022. We continue to monitor the capital markets
for opportunities where we can further reduce our cost of debt and optimize our cost of capital. We seek to proactively manage financial risk in terms of currency exposure of our U.S. dollar-denominated purchases, as well as equity risk exposure under BCE’s long-term equity-based incentive plans and interest rate and foreign currency exposure under our various debt instruments. We also seek to maintain investment-grade credit ratings with stable outlooks.
ATTRACTIVE LONG-TERM PUBLIC DEBT MATURITY PROFILE (4)• Average term of Bell Canada’s publicly
issued debt securities: approximately 11.8 years
• Average after-tax cost of publicly issued debt securities: 3.0%
• No material publicly issued debt securities maturing until Q4 2022
STRONG LIQUIDITY POSITION (4)• $3,151 million available under our $3.5 billion
multi-year committed credit facilities
• $400 million accounts receivable securitization available capacity
• $224 million cash and cash equivalents on hand
INVESTMENT GRADE CREDIT PROFILE (4) (5)• Long-term debt credit rating of BBB (high)
by DBRS Limited (DBRS), Baa 1 by Moody’s Investors Service, Inc. (Moody’s) and BBB+ by S&P Global Ratings Canada (S&P), all with stable outlooks
2015 2016 2017 2018 2019 2020
$200
$175
$150
$125
$100
$75
(1) The change in BCE’s common share price for a specified period plus BCE common share dividends reinvested, divided by BCE’s common share price at the beginning of the period.(2) Based on BCE’s common share price on the Toronto Stock Exchange (TSX) and assuming the reinvestment of dividends.(3) As the headline index for the Canadian equity market, the S&P/TSX Composite Index is the primary gauge against which to measure total shareholder return for Canadian-based,
TSX-listed companies.(4) As at December 31, 2020(5) These credit ratings are not recommendations to buy, sell or hold any of the securities referred to, and they may be revised or withdrawn at any time by the assigning rating agency.
Ratings are determined by the rating agencies based on criteria established from time to time by them, and they do not comment on market price or suitability for a particular investor. Each credit rating should be evaluated independently of any other credit rating.

1M
D&
A
Ove
rvie
w
BCE InC. 2020 AnnuAl REpoRt | 41
We monitor our capital structure by utilizing a number of measures, including net debt leverage ratio (1), adjusted EBITDA to net interest expense ratio (1), and dividend payout ratio.
As a result of financing a number of strategic acquisitions made since 2010, including CTV Inc., Astral Media Inc., MLSE, Bell Aliant Inc. and Manitoba Telecom Services Inc. (MTS); voluntary pension plan funding contributions to reduce our pension solvency deficit; wireless spectrum purchases; as well as a one-time unfavourable impact in 2019 due to the adoption of IFRS 16 that added $2.3 billion of leases to net debt (1) on our balance sheet on January 1, 2019, our net debt leverage ratio has increased above the limit of our internal target range. At December 31, 2020, our net debt leverage ratio was 2.93 times adjusted EBITDA, which exceeded the upper limit of our internal target range by 0.43.
BCE’s adjusted EBITDA to net interest expense ratio at the end of 2020 remained above our internal target range of greater than 7.5 times adjusted EBITDA at 8.32, providing good predictability in our debt service costs and protection from interest rate volatility for the foreseeable future.
BCE CREDIT RATIOS INTERNAL TARGET DECEMBER 31, 2020
Net debt leverage ratio 2.0–2.5 2.93
Adjusted EBITDA to net interest expense ratio >7.5 8.32
Bell Canada successfully accessed the debt capital markets in February 2020, March 2020, May 2020 and August 2020, raising a total of $4.0 billion in gross proceeds from the issuance in Canada of medium-term note (MTN) debentures. The issuances contributed to modestly lowering our after-tax cost of outstanding publicly issued debt securities to approximately 3.0% (4.1% on a pre-tax basis), and increasing the average term to maturity to 11.8 years. The net proceeds of the 2020 offerings were used to fund certain early redemptions of Bell Canada MTN debentures maturing in 2021, to repay short-term debt and for general corporate purposes.
In November 2020, Bell Canada renewed its short form base shelf prospectus, enabling Bell Canada to offer up to $6 billion of debt securities from time to time until December 16, 2022. The debt securities will be fully and unconditionally guaranteed by BCE. Consistent with past practice, the short form base shelf prospectus was renewed to continue to provide Bell Canada with financial flexibility and efficient access to the Canadian and U.S. debt capital markets. As at March 4, 2021, Bell Canada had issued no debt securities under its new short form base shelf prospectus.
1.5 Corporate governance and risk managementCORPORATE GOVERNANCE PHILOSOPHYThe Board and management of BCE believe that strong corporate governance practices contribute to superior results in creating and maintaining shareholder value. That is why we continually seek to strengthen our leadership in corporate governance and ethical business conduct by adopting best practices, and providing full transparency and accountability to our shareholders. The Board is responsible for the supervision of the business and affairs of the company.
Below are our key Board information and governance best practices:
Directors are ALL Independent (except CEO)
96% 2020 Board and Committee Director Attendance Record
Board Committees Members are All Independent
Board Diversity Policy and Target for Gender Representation
Annual Election of All Directors
Directors Elected Individually
Majority Voting Policy for Directors
Separate Chair and CEO
Board Interlocks Guidelines
Directors’ Tenure Guidelines
Share Ownership Guidelines for Directors and Executives
Code of Business Conduct and Ethics Program
Annual Advisory Vote on Executive Compensation
Formal Board Evaluation Process
Board Risk Oversight Practices
Robust Succession Planning
For more information, please refer to BCE’s most recent notice of annual general shareholder meeting and management proxy circular (the Proxy Circular) filed with the Canadian provincial securities regulatory authorities (available at sedar.com) and furnished to the U.S. Securities and Exchange Commission (available at sec.gov), and available on BCE’s website at BCE.ca.
(1) Net debt, net debt leverage ratio and adjusted EBITDA to net interest expense ratio are non-GAAP financial measures and do not have any standardized meaning under IFRS. Therefore, they are unlikely to be comparable to similar measures presented by other issuers. See section 10.2, Non-GAAP financial measures and key performance indicators (KPIs) - Net debt, Net debt leverage ratio and Adjusted EBITDA to net interest expense ratio in this MD&A for more details.

1M
D&
A
Ove
rvie
w
42 | BCE InC. 2020 AnnuAl REpoRt
RISK GOVERNANCE FRAMEWORKBOARD OVERSIGHTBCE’s full Board is entrusted with the responsibility for identifying and overseeing the principal risks to which our business is exposed and seeking to ensure there are processes in place to effectively identify, monitor and manage them. These processes seek to mitigate rather than eliminate risk. A risk is the possibility that an event might happen in the future that could have a negative effect on our business, financial condition, liquidity, financial results or reputation. While the Board has overall responsibility for risk, the responsibility for certain elements of the risk oversight program is delegated to Board committees in order to ensure that they are treated with appropriate expertise, attention and diligence, with reporting to the Board on a regular basis.
Board of Directors
Audit Committee
Compensation Committee
Governance Committee
Risk and Pension Fund Committee
Effective January 1, 2021, the Board established the Risk and Pension Fund Committee, succeeding the Pension Fund Committee, which further underlines the importance that the Board assigns to risk management across the organization. Risk information is reviewed by the Board or the relevant committee throughout the year, and business leaders present regular updates on the execution of business strategies, risks and mitigation.
• The Risk and Pension Fund Committee has oversight responsibility for the organization’s risk governance framework, which exists to identify, assess, mitigate and report key risks to which BCE is exposed. As part of its Charter, the Risk and Pension Fund Committee is tasked with oversight of risks relating to business continuity plans, work stoppage and disaster recovery plans, regulatory and public policy, information management and privacy, information and physical security, fraud, vendor and supply chain management, the environment, the pension fund, and other risks as required. The Risk and Pension Fund Committee receives a report on security matters, including information security, at each of its meetings.
• The Audit Committee is responsible for overseeing financial reporting and disclosure, as well as the organization’s internal control systems and compliance with legal requirements
• The Management Resources and Compensation Committee (Compensation Committee) oversees risks relating to compensation, succession planning and workplace policies and practices
• The Corporate Governance Committee (Governance Committee) assists the Board in developing and implementing BCE’s corporate governance guidelines and determining the composition of the Board and its committees. The Governance Committee also oversees matters such as environmental, social and governance (ESG) matters, the organization’s policies concerning business conduct, ethics and public disclosure of material information.
RISK MANAGEMENT CULTUREThere is a strong culture of risk management at BCE that is actively promoted by the Board, the Risk and Pension Fund Committee and the President and CEO, at all levels within the organization. It has become a part of how the company operates on a day-to-day basis and is woven into its structure and operating principles, guiding the implementation of the organization’s strategic imperatives.
The President and CEO, selected by the Board, has set his strategic focus through the establishment of six strategic imperatives and focuses risk management around the factors that could impact the achievement of those strategic imperatives. While the constant state of change in the economic environment and the industry creates challenges that need to be managed, clarity around strategic objectives, performance expectations, risk management and integrity in execution ensures discipline and balance in all aspects of our business.
RISK MANAGEMENT FRAMEWORKWhile the Board is responsible for BCE’s risk oversight program, operational business units are central to the proactive identification and management of risk. They are supported by a range of corporate support functions that provide independent expertise to reinforce implementation of risk management approaches in collaboration with the operational business units. The Internal Audit function provides a further element of expertise and assurance, working to provide insight and support to the operational business units and corporate support functions, while also providing the Audit Committee, and other Board committees as required, with an independent perspective on the state of risk and control within the organization. Collectively, these elements can be thought of as a “three lines” approach to risk management. Although the risk management framework described in this section 1.5 is aligned with industry practices, there can be no assurance that it will be sufficient to prevent the occurrence of events that could have a material adverse effect on our business, financial condition, liquidity, financial results or reputation.
Board and Committees
Oversight
Corporate
2nd line support
functions
Internal Audit
3rd line assurance function
Operational Business Units
1st line functions
RISK AND CONTROL
ENVIRONMENT
1M
D&
A
Ove
rvie
w
BCE InC. 2020 AnnuAl REpoRt | 43
FIRST LINE – OPERATIONAL BUSINESS UNITS
The first line refers to management within our operational business segments (Bell Wireless, Bell Wireline and Bell Media), who are expected to understand their operations in great detail and the financial results that underpin them. There are regular reviews of operating performance involving the organization’s executive and senior management. The discipline and precision associated with this process, coupled with the alignment and focus around performance goals, creates a high degree of accountability and transparency in support of our risk management practices.
As risks emerge in the business environment, they are discussed in a number of regular forums to share details and explore their relevance across the organization. Executive and senior management are integral to these activities in driving the identification, assessment, mitigation and reporting of risks at all levels. Formal risk reporting occurs through strategic planning sessions, management presentations to the Board and formal enterprise risk reporting, which is shared with the Board and the Risk and Pension Fund Committee during the year.
Management is also responsible for maintaining effective internal controls and for executing risk and control procedures on a day-to-day basis. Each operational business unit develops its own operating controls and procedures that fit the needs of its unique environment.
SECOND LINE – CORPORATE SUPPORT FUNCTIONS
BCE is a very large enterprise, with 50,704 employees as at December 31, 2020, multiple business units and a diverse portfolio of risks that is constantly evolving based on internal and external factors. In a large organization, it is common to manage certain functions centrally for efficiency, scale and consistency. While the first line is often central to identification and management of business risks, in many instances operational management works collaboratively with, and also relies on, the corporate functions that make up the second line for support in these areas. These corporate functions include Regulatory, Finance, Corporate Security, Corporate Risk Management, Legal, Corporate Responsibility, Human Resources, Real Estate and Procurement.
Regulatory function: This function is responsible for the regulatory portfolio, including an expanding range of obligations set out in new privacy and data protection laws being enacted in Canada and around the world. BCE has developed, and will maintain, an enhanced Data Governance Policy which encompasses the protection and appropriate use of data across its lifecycle. A significant element of the data governance program relies on the Corporate Security activities outlined below and these two functions are working jointly with data owners, data custodians and other relevant employees to ensure this policy is appropriately implemented. We recognize that a strong and consistently applied approach to data governance is essential to maintaining the social licence necessary to achieve our business objectives. For more information on our approach to privacy and data security, refer to section 1.6, Environmental, social and governance practices, in this MD&A.
Finance function: BCE’s Finance function plays a pivotal role in seeking to identify, assess and manage risks through a number of activities, which include financial performance management, external reporting, pension management, capital management, and oversight and execution practices related to the U.S. Sarbanes-Oxley Act of 2002 and equivalent Canadian securities legislation, including the establishment and maintenance of appropriate internal control over financial reporting. BCE has also established and maintains disclosure controls and procedures to seek to ensure that the information it publicly discloses, including its business risks, is accurately recorded, processed, summarized and reported on a timely basis. For more details concerning BCE’s internal control over financial reporting and disclosure controls and procedures, refer to the Proxy Circular and section 10.3, Effectiveness of internal controls of this MD&A.
Corporate Security function: This function is responsible for all aspects of security, which requires a deep understanding of the business, the risk environment and the external stakeholder environment. Based on this understanding, Corporate Security sets the standards of performance required across the organization through security policy definitions and monitors the organization’s performance against these policies. In high and emerging risk areas such as information security, Corporate Security leverages its experience and competence and, through collaboration with the operational business units, develops strategies intended to seek to mitigate the organization’s risks. For instance, we have implemented security awareness training and policies and procedures that seek to mitigate information security threats. We further rely on security assessments to identify risks, projects and implementation controls with the objective of ensuring that systems are deployed with the appropriate level of control based on risk and technical capabilities, including access management, vulnerability management, security monitoring and testing, to help identify and respond to attempts to gain unauthorized access to our information systems and networks. We evaluate and seek to adapt our security policies and procedures designed to protect our information and assets in light of the continuously evolving nature and sophistication of information security threats. However, given in particular the complexity and scale of our business, network infrastructure, technology and IT supporting systems, there can be no assurance that the security policies and procedures that we implement will prevent the occurrence of all potential information security breaches. In addition, although BCE has contracted an insurance policy covering information security risk, there can be no assurance that any insurance we may have will cover the costs, damages, liabilities or losses that could result from the occurrence of any information security breach.
Corporate Risk Management function: This function works across the company to gather information and report on the organization’s assessment of its principal risks and the related exposures. Annually, senior management participate in a risk survey that provides an important reference point in the overall risk assessment process.
In addition to the activities described above, the second line is also critical in building and operating the oversight mechanisms that bring focus to relevant areas of risk and reinforce the bridges between the first and second lines, thereby seeking to ensure that there is a clear understanding of emerging risks, their relevance to the organization and the proposed mitigation plans.
1M
D&
A
Ove
rvie
w
44 | BCE InC. 2020 AnnuAl REpoRt
To further coordinate efforts between the first and second lines, BCE has established a Health and Safety, Security, Environment and Compliance Oversight Committee (HSSEC Committee). A significant number of BCE’s most senior leaders are members of the HSSEC Committee, the purpose of which is to oversee BCE’s strategic security (including information security), compliance, environmental, and health and safety risks and opportunities. This cross-functional committee seeks to ensure that relevant risks are adequately recognized and mitigation activities are well integrated and aligned across the organization and are supported with sufficient resources. The HSSEC Committee also mandates the company’s Energy Board, a working group composed of business unit employees at the vice-president and director levels, to
ensure oversight of our overall energy consumption and costs with the objective of minimizing financial and reputational risks while maximizing business opportunities.
THIRD LINE – INTERNAL AUDIT FUNCTION
Internal Audit is a part of the overall management information and control system and has the responsibility to act as an independent appraisal function. Its purpose is to provide the Audit Committee, other Board committees as required, and management with objective evaluations of the company’s risk and control environment, to support management in fulfilling BCE’s strategic imperatives and to maintain an audit presence throughout BCE and its subsidiaries.
1.6 Environmental, social and governance practicesESG practices form an integral part of BCE’s corporate responsibility approach. Since its founding in 1880, Bell has been the Canadian leader in telecommunications and today our goal is to advance how Canadians connect with each other and the world. We take very seriously our responsibility to manage the company in ways that
enable us to sustain our record of serving the personal and business communications needs of millions of customers, seek to create value for shareholders, provide meaningful careers for tens of thousands of people, and make a significant contribution to the broader Canadian community and economy.
CORPORATE RESPONSIBILITY UNDERPINS OUR SIX STRATEGIC IMPERATIVESCorporate responsibility is a fundamental element of each of the six strategic imperatives that inform BCE’s policies, decisions and actions. This approach also supports our goal of advancing how Canadians connect with each other and the world.
The Board has established clear lines of authority and oversight over our corporate responsibility programs and our ESG practices, with primary accountability at the committee level. The Risk and Pension Fund Committee oversees ESG issues, including environmental risks, security and business continuity. The Compensation Committee has oversight for human resources issues, including respectful workplace practices, health and safety. The Governance Committee is responsible for governance practices and policies, overview of our ESG strategy and
disclosure as well as policies concerning business conduct and ethics. In addition, in 2020, the Compensation Committee introduced a metric to track corporate performance against our ESG targets.
We report annually on our corporate responsibility performance and our ESG practices in our Corporate Responsibility Report, available on BCE.ca. We report on the ESG topics that are of greatest importance to our stakeholders and which could have a relevant impact on our business.
BCE is recognized around the world for the effectiveness of its corporate responsibility and ESG programs, as reflected in its inclusion in various sustainability indices and its receipt of sustainability awards. In 2020, BCE continued to be listed on socially responsible investment indices such as the FTSE4Good Index, the Jantzi Social Index, the Ethibel Sustainability Index (ESI) Excellence Global, and the Euronext Vigeo World 120 index.
COMMUNITYSince 2010, the Bell Let’s Talk mental health initiative has built awareness and action in Canadian mental health, helping reduce the stigma around mental illness while improving access to care, research and workplace mental health. Over the last 11 years, Canadians and people worldwide have taken the mental health conversation started by Bell Let’s Talk to remarkable heights each year, driving unprecedented change in mental health. To date, Bell Let’s Talk has supported more than 1,100 organizations providing mental health support and services throughout Canada, including hospitals, universities, local community service providers and other care and research organizations.
WHY MENTAL HEALTH MATTERSWith the COVID-19 crisis affecting every aspect of our lives, the Canadian Mental Health Association reports that 40% of Canadians say their mental health has declined due to the COVID-19 pandemic. At the same time, the mental health challenges within Black, Indigenous and People of Colour (BIPOC) communities, and those faced by youth, have also underscored the need to address mental illness in new ways as well as the important role we can all play in putting the focus on mental health.
WHAT WE ARE DOING
In March 2020, Bell extended Bell Let’s Talk for another five years and launched a new $10 million partnership with the Graham Boeckh Foundation to accelerate the delivery of mental health services for young people through Integrated Youth Services (IYS) hubs. Later that month, Bell Let’s Talk announced an additional $5 million in donations to the Canadian Red Cross, Canadian Mental Health Association, Kids Help Phone, Revivre and Strongest Families Institute, to enhance their efforts to support Canadians confronting isolation, anxiety and other challenges during the COVID-19 crisis.
In July 2020, Bell launched the $5 million Bell Let’s Talk Diversity Fund to support the mental health and well-being of BIPOC communities across Canada with inaugural donations totaling $500,000 to Black Youth Helpline and the National Association of Friendship Centres.
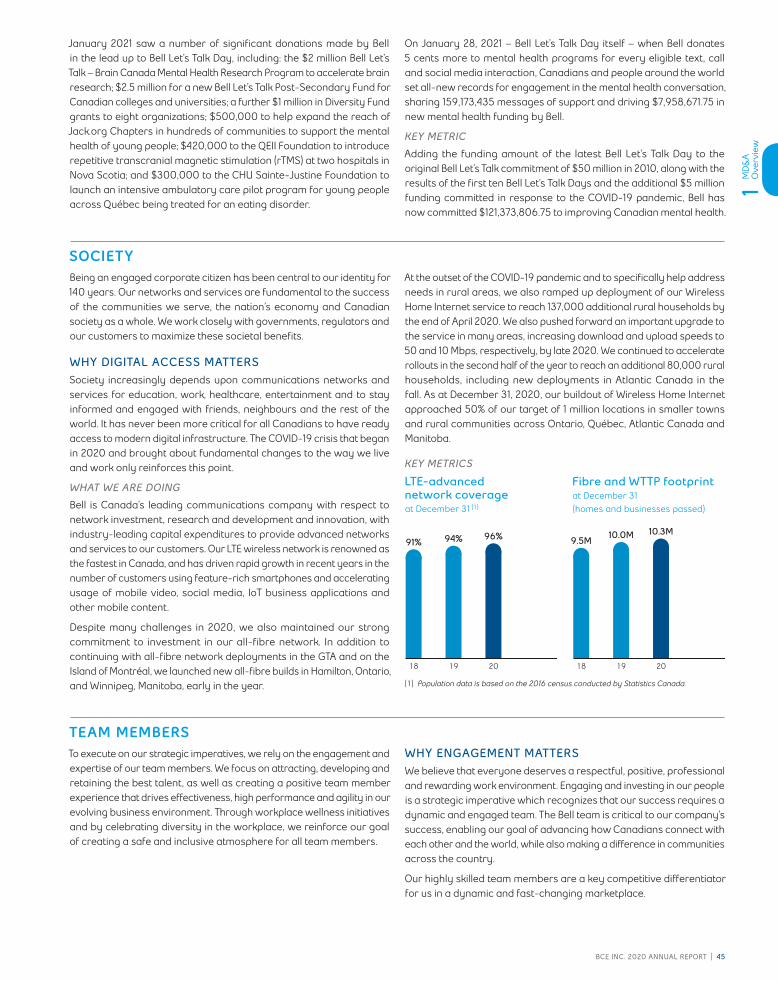
1M
D&
A
Ove
rvie
w
BCE InC. 2020 AnnuAl REpoRt | 45
January 2021 saw a number of significant donations made by Bell in the lead up to Bell Let’s Talk Day, including: the $2 million Bell Let’s Talk – Brain Canada Mental Health Research Program to accelerate brain research; $2.5 million for a new Bell Let’s Talk Post-Secondary Fund for Canadian colleges and universities; a further $1 million in Diversity Fund grants to eight organizations; $500,000 to help expand the reach of Jack.org Chapters in hundreds of communities to support the mental health of young people; $420,000 to the QEII Foundation to introduce repetitive transcranial magnetic stimulation (rTMS) at two hospitals in Nova Scotia; and $300,000 to the CHU Sainte-Justine Foundation to launch an intensive ambulatory care pilot program for young people across Québec being treated for an eating disorder.
On January 28, 2021 – Bell Let’s Talk Day itself – when Bell donates 5 cents more to mental health programs for every eligible text, call and social media interaction, Canadians and people around the world set all-new records for engagement in the mental health conversation, sharing 159,173,435 messages of support and driving $7,958,671.75 in new mental health funding by Bell.
KEY METRIC
Adding the funding amount of the latest Bell Let’s Talk Day to the original Bell Let’s Talk commitment of $50 million in 2010, along with the results of the first ten Bell Let’s Talk Days and the additional $5 million funding committed in response to the COVID-19 pandemic, Bell has now committed $121,373,806.75 to improving Canadian mental health.
SOCIETYBeing an engaged corporate citizen has been central to our identity for 140 years. Our networks and services are fundamental to the success of the communities we serve, the nation’s economy and Canadian society as a whole. We work closely with governments, regulators and our customers to maximize these societal benefits.
WHY DIGITAL ACCESS MATTERSSociety increasingly depends upon communications networks and services for education, work, healthcare, entertainment and to stay informed and engaged with friends, neighbours and the rest of the world. It has never been more critical for all Canadians to have ready access to modern digital infrastructure. The COVID-19 crisis that began in 2020 and brought about fundamental changes to the way we live and work only reinforces this point.
WHAT WE ARE DOING
Bell is Canada’s leading communications company with respect to network investment, research and development and innovation, with industry-leading capital expenditures to provide advanced networks and services to our customers. Our LTE wireless network is renowned as the fastest in Canada, and has driven rapid growth in recent years in the number of customers using feature-rich smartphones and accelerating usage of mobile video, social media, IoT business applications and other mobile content.
Despite many challenges in 2020, we also maintained our strong commitment to investment in our all-fibre network. In addition to continuing with all-fibre network deployments in the GTA and on the Island of Montréal, we launched new all-fibre builds in Hamilton, Ontario, and Winnipeg, Manitoba, early in the year.
At the outset of the COVID-19 pandemic and to specifically help address needs in rural areas, we also ramped up deployment of our Wireless Home Internet service to reach 137,000 additional rural households by the end of April 2020. We also pushed forward an important upgrade to the service in many areas, increasing download and upload speeds to 50 and 10 Mbps, respectively, by late 2020. We continued to accelerate rollouts in the second half of the year to reach an additional 80,000 rural households, including new deployments in Atlantic Canada in the fall. As at December 31, 2020, our buildout of Wireless Home Internet approached 50% of our target of 1 million locations in smaller towns and rural communities across Ontario, Québec, Atlantic Canada and Manitoba.
KEY METRICS
LTE-advanced network coverage at December 31 (1)
Fibre and WTTP footprint at December 31(homes and businesses passed)
18 19 20
94% 96%91%
18 19 20
10.0M 10.3M9.5M
(1) Population data is based on the 2016 census conducted by Statistics Canada.
TEAM MEMBERSTo execute on our strategic imperatives, we rely on the engagement and expertise of our team members. We focus on attracting, developing and retaining the best talent, as well as creating a positive team member experience that drives effectiveness, high performance and agility in our evolving business environment. Through workplace wellness initiatives and by celebrating diversity in the workplace, we reinforce our goal of creating a safe and inclusive atmosphere for all team members.
WHY ENGAGEMENT MATTERSWe believe that everyone deserves a respectful, positive, professional and rewarding work environment. Engaging and investing in our people is a strategic imperative which recognizes that our success requires a dynamic and engaged team. The Bell team is critical to our company’s success, enabling our goal of advancing how Canadians connect with each other and the world, while also making a difference in communities across the country.
Our highly skilled team members are a key competitive differentiator for us in a dynamic and fast-changing marketplace.

1M
D&
A
Ove
rvie
w
46 | BCE InC. 2020 AnnuAl REpoRt
WHAT WE ARE DOING
We are focused on attracting, developing and retaining the best talent in the country by providing a workplace that is positive, professional, and rewarding which enables creativity and innovation. We are proud to be ranked as one of Canada’s Top Employers both across Canada and in Montréal, where Bell was founded in 1880. As part of our commitment to mental health, we support and invest in our people with comprehensive health and wellness benefits and a flexible work policy. Reflecting our focus on ensuring an inclusive, equitable and accessible workplace, Bell has been recognized by Mediacorp as one of Canada’s Best Diversity Employers, Canada’s Top Employers for Young People, Canada’s Top Family-Friendly Employers and one of Canada’s Greenest Employers.
KEY METRICS
Overall team member engagement score (1)
18 19 20
73% 76%74%
(1) This metric is calculated as the average score obtained in the annual Bell team member satisfaction survey. The Team Member Engagement score is based on five specific questions and the percentage of employees who responded favourably (Strongly agree or Agree) to these questions out of the total number of employees who responded to the survey.
WHY DIVERSITY AND INCLUSION MATTERSBell is committed to an inclusive, equitable and accessible workplace where all team members feel valued, respected, supported and have the opportunity to reach their full potential. A truly diverse team and inclusive workplace fosters innovation and creativity, better reflects the customers we serve, and increases team member engagement.
WHAT WE ARE DOING
Our diversity and inclusion strategy is supported by a strong governance framework that includes the Diversity Leadership Council, business unit committees and employee-led networks, including: Black Professionals at Bell, Pride at Bell and Women at Bell.
In step with our overarching corporate commitment to improve gender diversity, we are strategically focused on increasing the diversity of our senior leadership. Bell is a signatory of the Catalyst Accord 2022 and member of the 30% Club. We have established a goal of at least 35% women in executive positions (vice-president level and above) by the end of 2021.
In 2020, Bell committed to taking meaningful actions to address the impacts of systemic racism on blacks, indigenous and people of colour at our company and in our communities. This included:
• New targets for BIPOC representation on our senior management team of at least 25%, and 40% of graduate and student hires by 2025
• New partnerships with the Onyx Initiative and the Black Professionals in Tech Network that are helping drive the recruitment of Black college and university students and promote Black talent in technology
• Promoting greater diversity in Canadian media with the launch of the HireBIPOC website and the Bell Media Content Diversity Task Force in partnership with BIPOC TV & Film
• A new $5 million Bell Let’s Talk Diversity Fund to support the mental health and well-being of Canada’s BIPOC communities
• Reinforcing our culture of inclusion with review of internal policies and practices, and successful launch of the Inclusive Leadership Development Program to people leaders, exceeding our goal of over 30% completion within the first year.
Looking ahead, we plan to continue building momentum for our diversity and inclusion strategy based on concrete objective-setting and the integration of inclusive leadership practices.
KEY METRICS
Women in executive positions (vice-president level and above)
Women non-executive directors on the BCE Board
18 19 20
32% 32%29%
18 19 20 21(1)
31%27%
36%31%
Director nominees (2)
(1) The variation from 2019 to 2020 is the result of appointments made to the BCE Board during the year 2020 in anticipation of the retirements of three directors at the 2021 annual shareholder meeting.
(2) Based on director nominees for election at BCE’s 2021 annual shareholder meeting.
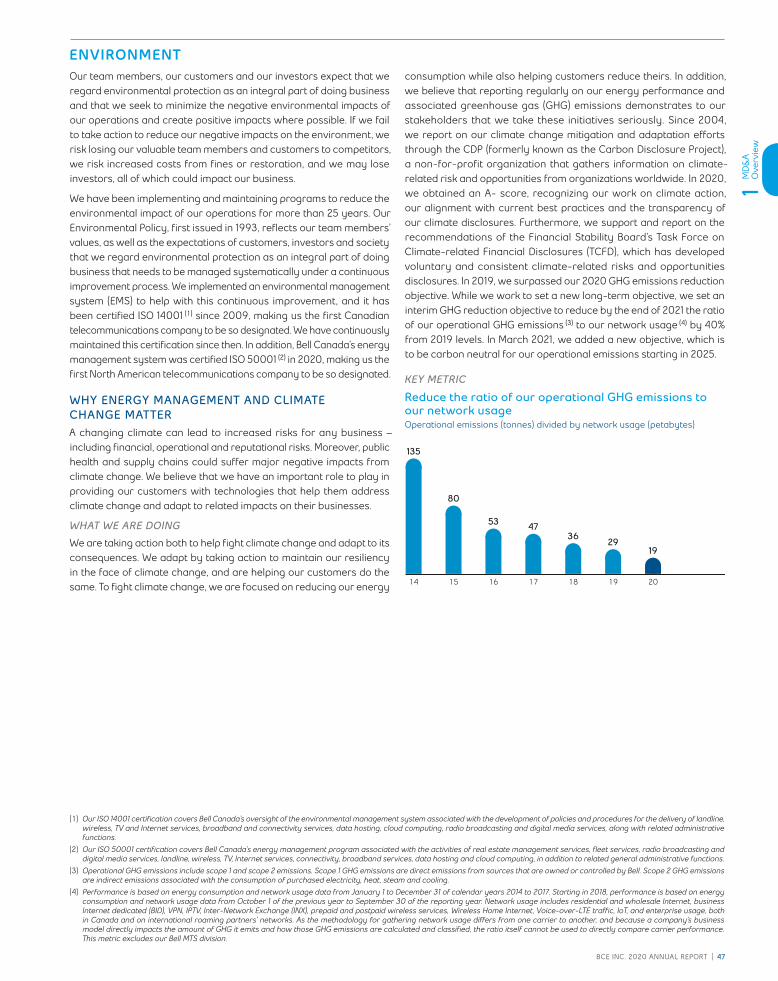
1M
D&
A
Ove
rvie
w
BCE InC. 2020 AnnuAl REpoRt | 47
ENVIRONMENTOur team members, our customers and our investors expect that we regard environmental protection as an integral part of doing business and that we seek to minimize the negative environmental impacts of our operations and create positive impacts where possible. If we fail to take action to reduce our negative impacts on the environment, we risk losing our valuable team members and customers to competitors, we risk increased costs from fines or restoration, and we may lose investors, all of which could impact our business.
We have been implementing and maintaining programs to reduce the environmental impact of our operations for more than 25 years. Our Environmental Policy, first issued in 1993, reflects our team members’ values, as well as the expectations of customers, investors and society that we regard environmental protection as an integral part of doing business that needs to be managed systematically under a continuous improvement process. We implemented an environmental management system (EMS) to help with this continuous improvement, and it has been certified ISO 14001 (1) since 2009, making us the first Canadian telecommunications company to be so designated. We have continuously maintained this certification since then. In addition, Bell Canada’s energy management system was certified ISO 50001 (2) in 2020, making us the first North American telecommunications company to be so designated.
WHY ENERGY MANAGEMENT AND CLIMATE CHANGE MATTERA changing climate can lead to increased risks for any business – including financial, operational and reputational risks. Moreover, public health and supply chains could suffer major negative impacts from climate change. We believe that we have an important role to play in providing our customers with technologies that help them address climate change and adapt to related impacts on their businesses.
WHAT WE ARE DOING
We are taking action both to help fight climate change and adapt to its consequences. We adapt by taking action to maintain our resiliency in the face of climate change, and are helping our customers do the same. To fight climate change, we are focused on reducing our energy
consumption while also helping customers reduce theirs. In addition, we believe that reporting regularly on our energy performance and associated greenhouse gas (GHG) emissions demonstrates to our stakeholders that we take these initiatives seriously. Since 2004, we report on our climate change mitigation and adaptation efforts through the CDP (formerly known as the Carbon Disclosure Project), a non-for-profit organization that gathers information on climate-related risk and opportunities from organizations worldwide. In 2020, we obtained an A- score, recognizing our work on climate action, our alignment with current best practices and the transparency of our climate disclosures. Furthermore, we support and report on the recommendations of the Financial Stability Board’s Task Force on Climate-related Financial Disclosures (TCFD), which has developed voluntary and consistent climate-related risks and opportunities disclosures. In 2019, we surpassed our 2020 GHG emissions reduction objective. While we work to set a new long-term objective, we set an interim GHG reduction objective to reduce by the end of 2021 the ratio of our operational GHG emissions (3) to our network usage (4) by 40% from 2019 levels. In March 2021, we added a new objective, which is to be carbon neutral for our operational emissions starting in 2025.
KEY METRIC
Reduce the ratio of our operational GHG emissions to our network usage Operational emissions (tonnes) divided by network usage (petabytes)
14 15 16 17 18 19 20
80
53 4736
2919
135
(1) Our ISO 14001 certification covers Bell Canada’s oversight of the environmental management system associated with the development of policies and procedures for the delivery of landline, wireless, TV and Internet services, broadband and connectivity services, data hosting, cloud computing, radio broadcasting and digital media services, along with related administrative functions.
(2) Our ISO 50001 certification covers Bell Canada’s energy management program associated with the activities of real estate management services, fleet services, radio broadcasting and digital media services, landline, wireless, TV, Internet services, connectivity, broadband services, data hosting and cloud computing, in addition to related general administrative functions.
(3) Operational GHG emissions include scope 1 and scope 2 emissions. Scope 1 GHG emissions are direct emissions from sources that are owned or controlled by Bell. Scope 2 GHG emissions are indirect emissions associated with the consumption of purchased electricity, heat, steam and cooling.
(4) Performance is based on energy consumption and network usage data from January 1 to December 31 of calendar years 2014 to 2017. Starting in 2018, performance is based on energy consumption and network usage data from October 1 of the previous year to September 30 of the reporting year. Network usage includes residential and wholesale Internet, business Internet dedicated (BID), VPN, IPTV, Inter-Network Exchange (INX), prepaid and postpaid wireless services, Wireless Home Internet, Voice-over-LTE traffic, IoT, and enterprise usage, both in Canada and on international roaming partners’ networks. As the methodology for gathering network usage differs from one carrier to another, and because a company’s business model directly impacts the amount of GHG it emits and how those GHG emissions are calculated and classified, the ratio itself cannot be used to directly compare carrier performance. This metric excludes our Bell MTS division.
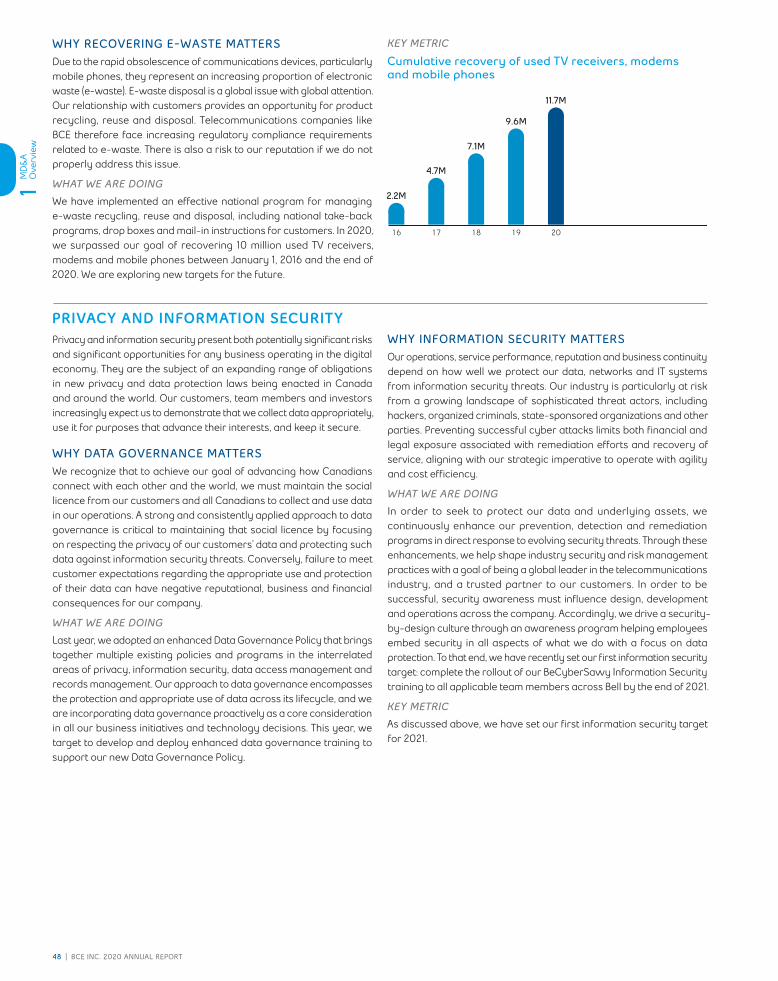
1M
D&
A
Ove
rvie
w
48 | BCE InC. 2020 AnnuAl REpoRt
WHY RECOVERING E-WASTE MATTERSDue to the rapid obsolescence of communications devices, particularly mobile phones, they represent an increasing proportion of electronic waste (e-waste). E-waste disposal is a global issue with global attention. Our relationship with customers provides an opportunity for product recycling, reuse and disposal. Telecommunications companies like BCE therefore face increasing regulatory compliance requirements related to e-waste. There is also a risk to our reputation if we do not properly address this issue.
WHAT WE ARE DOING
We have implemented an effective national program for managing e-waste recycling, reuse and disposal, including national take-back programs, drop boxes and mail-in instructions for customers. In 2020, we surpassed our goal of recovering 10 million used TV receivers, modems and mobile phones between January 1, 2016 and the end of 2020. We are exploring new targets for the future.
KEY METRIC
Cumulative recovery of used TV receivers, modems and mobile phones
16 17 18 19 20
4.7M
7.1M
9.6M
11.7M
2.2M
PRIVACY AND INFORMATION SECURITYPrivacy and information security present both potentially significant risks and significant opportunities for any business operating in the digital economy. They are the subject of an expanding range of obligations in new privacy and data protection laws being enacted in Canada and around the world. Our customers, team members and investors increasingly expect us to demonstrate that we collect data appropriately, use it for purposes that advance their interests, and keep it secure.
WHY DATA GOVERNANCE MATTERSWe recognize that to achieve our goal of advancing how Canadians connect with each other and the world, we must maintain the social licence from our customers and all Canadians to collect and use data in our operations. A strong and consistently applied approach to data governance is critical to maintaining that social licence by focusing on respecting the privacy of our customers’ data and protecting such data against information security threats. Conversely, failure to meet customer expectations regarding the appropriate use and protection of their data can have negative reputational, business and financial consequences for our company.
WHAT WE ARE DOING
Last year, we adopted an enhanced Data Governance Policy that brings together multiple existing policies and programs in the interrelated areas of privacy, information security, data access management and records management. Our approach to data governance encompasses the protection and appropriate use of data across its lifecycle, and we are incorporating data governance proactively as a core consideration in all our business initiatives and technology decisions. This year, we target to develop and deploy enhanced data governance training to support our new Data Governance Policy.
WHY INFORMATION SECURITY MATTERSOur operations, service performance, reputation and business continuity depend on how well we protect our data, networks and IT systems from information security threats. Our industry is particularly at risk from a growing landscape of sophisticated threat actors, including hackers, organized criminals, state-sponsored organizations and other parties. Preventing successful cyber attacks limits both financial and legal exposure associated with remediation efforts and recovery of service, aligning with our strategic imperative to operate with agility and cost efficiency.
WHAT WE ARE DOING
In order to seek to protect our data and underlying assets, we continuously enhance our prevention, detection and remediation programs in direct response to evolving security threats. Through these enhancements, we help shape industry security and risk management practices with a goal of being a global leader in the telecommunications industry, and a trusted partner to our customers. In order to be successful, security awareness must influence design, development and operations across the company. Accordingly, we drive a security-by-design culture through an awareness program helping employees embed security in all aspects of what we do with a focus on data protection. To that end, we have recently set our first information security target: complete the rollout of our BeCyberSavvy Information Security training to all applicable team members across Bell by the end of 2021.
KEY METRIC
As discussed above, we have set our first information security target for 2021.

2M
D&
A
Stra
tegi
c im
pera
tives
BCE InC. 2020 AnnuAl REpoRt | 49
2 Strategic imperativesOur success is built on the BCE team’s dedicated execution of the six strategic imperatives that support our goal to advance how Canadians connect with each other and the world.This section contains forward-looking statements, including relating to our network deployment and capital investment plans and our 2021 objectives, plans and strategic priorities. Refer to the section Caution regarding forward-looking statements at the beginning of this MD&A.
2.1 Build the best networks Expand Bell’s next-generation network leadership with continued capital investment in all-fibre home and business connections
in more places, enhanced rural connectivity with Wireless Home Internet and the buildout of our mobile 5G network.
2020 PROGRESS
• Continued to expand our FTTP direct fibre footprint, reaching approximately 5.6 million homes and businesses in seven provinces. FTTP delivers total broadband access speeds of up to 1.5 Gbps currently, with faster speeds expected in the future as equipment evolves to support these higher speeds.
• As part of Bell’s $1 billion investment plan for Manitoba, we announced an investment of approximately $400 million to bring all-fibre connections to approximately 275,000 homes and business locations throughout Winnipeg. We also announced an investment of approximately $400 million in Hamilton’s digital infrastructure that is planned to bring direct fibre connections to more than 200,000 residential and business locations throughout the city.
• Accelerated the rollout of our innovative Wireless Home Internet service to previously unserved or underserved communities in response to COVID-19 demand and expanded service to rural Atlantic Canada
• At the end of 2020, our buildout of Wireless Home Internet approached 50% of our target of 1 million locations in smaller towns and rural communities across Ontario, Québec, the Atlantic provinces and Manitoba
• Wireless Home Internet was also enhanced to deliver 50/10 access speeds (50 Mbps download/10 Mbps upload) to a majority of customers
• Expanded our LTE-A wireless network to reach approximately 96% of the Canadian population with theoretical mobile data peak download speeds of up to 1.5 Gbps in select markets (expected average download speeds of 25 to 319 Mbps)
• Launched our 5G wireless network, offering enhanced mobile data speeds, with initial service in Montréal, the GTA, Calgary, Edmonton and Vancouver. Our 5G network expanded to reach 26% of Canada’s population at the end of 2020.
• Our 5G network will expand to more centres across the country as the next-generation wireless technology grows in speed and capacity. As with previous wireless and wireline network deployments, Bell is working with multiple equipment suppliers for its 5G rollout.
• Bell’s 4G and 5G wireless networks were ranked Canada’s fastest in PCMag’s 2020 Fastest Mobile Networks Canada, the prestigious annual study of network performance across the country
• Bell’s wireless and wireline networks delivered 99.99+% service availability throughout the COVID-19 pandemic, despite increased demand for data as millions of Canadians worked and studied from home
• Collaborated with Société de Transport de Montréal (STM) and industry partners to complete deployment of 4G LTE wireless service throughout Montreal’s metro transit system, providing the STM with Canada’s largest indoor digital network and the longest underground wireless network in the country
• Enabled faster access to infrastructure to advance the rollout of high-speed Internet services throughout Québec, with new measures simplifying the process for service providers requesting access to our communications support structures
2021 FOCUS
• In February 2021, Bell announced a capital investment acceleration of an additional $1 billion to $1.2 billion over the next two years to advance its direct fibre, Wireless Home Internet and 5G wireless network rollouts. Bell expects to invest approximately $700 million of this additional capital in 2021.
• Further deployment of direct fibre to more homes and businesses within our wireline footprint and fixed WTTP technology in rural communities
• Increase the number of customer locations covered with direct fibre and fixed WTTP technology by as many as 900,000, bringing our total broadband footprint to approximately 6.9 million homes and businesses by the end of 2021
• Continued deployment of 5G wireless network offering coverage that is competitive with other national operators in centres across Canada
• Double the national coverage of our wireless 5G network to approximately 50% of the population

2M
D&
A
Stra
tegi
c im
pera
tives
50 | BCE InC. 2020 AnnuAl REpoRt
2.2 Drive growth with innovative services Leverage our network superiority to provide innovative, integrated communications services to Canadian consumers and
businesses, including the fastest Internet and best Wi-Fi technology, the highest-quality mobile services and a growing range of next-generation IoT solutions, smart home products and business solutions like Virtual Network Services.
2020 PROGRESS
• Added 263,721 total net postpaid and prepaid wireless customers. Our wireless customer base grew to 10,221,683 at December 31, 2020, up 2.6% over 2019.
• Expanded our lineup of 5G, 4G LTE and LTE-A devices and offered a broad selection of 5G smartphones, including Apple’s iPhone 12 Series, the Samsung Galaxy S20 5G series and the Samsung Galaxy Note20 5G Series
• Renewed our exclusive national distribution agreement with Dollarama Inc. to offer Lucky Mobile and Virgin Mobile prepaid wireless service at the value retailer’s more than 1,200 locations across Canada
• Partnered with Giant Tiger to make Lucky Mobile available in the discount retail chain’s over 250 locations across the country, expanding the reach of our prepaid wireless offering to even more budget-conscious Canadians
• Renewed our partnership with Loblaws to offer the newly rebranded PC mobile prepaid service in more than 840 Loblaws store locations across Canada
• Became the first wireless provider in Canada to offer mobile connection for Apple Family Setup, a service that allows kids and older family members in the household to use Apple Watch even if they do not have an iPhone
• Built on our position as the leading Internet service provider (ISP) in Canada with a retail high-speed Internet subscriber base of 3,704,590 at December 31, 2020, up 4.2% over 2019, including almost 1.7 million FTTP customers at December 31, 2020
• Launched Managed Cloud Security Gateway, a solution that provides our corporate customers with fully managed Internet protection as a cost-effective, hassle-free service from the cloud. Offered in partnership with Zscaler, the Managed Cloud Security Gateway provides an advanced and consistent layer of security including protection from botnets, malware, phishing attempts and other threats as well as blocking malicious websites and other fraudulent Internet activity.
• Partnered with BlackBerry Limited (BlackBerry) to provide enhanced secure communications to business and government customers. BlackBerry became our preferred Mobile Threat Defense partner, enabling Bell to offer its enterprise customers access to BlackBerry Protect, the Mobile Threat Defense solution that uses the power of artificial intelligence to block malware infections, prevent URL phishing attacks and provide application integrity checking.
• Launched Bell Total Business Wi-Fi, enabling small businesses in Ontario and Québec to take advantage of enhanced Wi-Fi coverage, the fastest speeds available and an easy way to manage their network
2021 FOCUS
• Maintain our market share of national operators’ wireless postpaid net additions
• Continued growth of our prepaid subscriber base
• Continued adoption of mobile phone devices, tablets and data applications, as well as the introduction of more 5G, 4G LTE and LTE-A devices and new data services
• Increased adoption of unlimited data plans and device financing plans
• Improvement in subscriber acquisition and retention spending, enabled by increasing adoption of device financing plans
• Continued growth in retail Internet subscribers
• Enhance Internet product superiority through new service offerings and innovation to provide an enhanced customer experience in the home
• Invest in direct fibre expansion, 5G and new solutions in key portfolios such as Internet and private networks, cloud services, unified communications, security and IoT to improve the business client experience and increase overall business customer spending on telecommunications products and services
• Continue to deliver network-centric managed and professional services solutions to large and medium-sized businesses that increase the value of connectivity services
2M
D&
A
Stra
tegi
c im
pera
tives
BCE InC. 2020 AnnuAl REpoRt | 51
2.3 Deliver the most compelling content Inform and engage Canadian audiences with a unified approach to delivering our top TV, media and entertainment assets, leveraging
our trusted media brands and content creation leadership to bring Canadians the content they want the most on any platform they choose.
2020 PROGRESS
• Maintained our position as Canada’s largest TV provider with 2,738,605 retail subscribers at December 31, 2020, and increased our total number of IPTV subscribers by 2.2% to 1,806,373
• Introduced the Bell Streamer, a new 4K HDR streaming device powered by Android TV offering all-in-one access to live TV, movies and on demand content from Bell Alt TV, support for all major streaming services, and access to thousands of apps in Google Play
• Launched Virgin TV, an app-based TV service offering Virgin Internet Members an all-new way to watch live and on-demand TV shows and live sports across iOS and Android smartphones, tablets, laptops and streaming devices
• Maintained CTV’s #1 ranking as the most-watched TV network in Canada for the 19th year in a row, delivering the most Top 10, Top 20, and Top 30 programs nationally among total viewers
• TSN remained Canada’s sports leader and RDS remained the top French-language sports network
• Grew our Crave subscriber base to approximately 2.8 million, up 8% over 2019
• Completed the acquisition of French-language conventional TV network V and the ad-supported video-on-demand (VOD) service Noovo.ca from Groupe V Média, strengthening choice for TV viewers in Québec while enhancing investment in French-language content creation. Bell Media rebranded V network as Noovo, establishing a singular brand in Québec for both a traditional TV network and its popular digital platform.
• Formed a new partnership with Grandé Studios, bringing increased resources to Québec’s French-language content creation and production communities. Bell Media acquired a minority investment in the Montréal-based multipurpose TV, film, and equipment company, expanding our industry-leading content production role.
• Introduced a new ad-supported CTV digital video platform offering all-in-one access to live and on-demand programming from CTV, CTV2, CTV-branded specialty channels, MTV, CTV Movies and CTV Throwback across smartphones, smart TVs and other connected devices
• Crave launched HBO Max programming in Canada as part of Bell Media’s long-term licensing agreement with Warner Bros. International Television Distribution
• TSN and RDS announced a multi-year media rights extension with F1, ensuring that Bell Media’s sports networks continue to be the Canadian home of F1 through the 2024 season
• TSN and RDS extended their long-term broadcast partnership with Curling Canada, ensuring that Bell Media’s sports networks will continue to be the exclusive English and French broadcasters of Curling Canada Season of Champions events through the 2027-28 season
• Bell Media’s Pinewood Toronto Studios began major construction on its multi-stage expansion of new sound stage and support space. The 5-acre new build will better meet the growing roster of domestic and international film and TV clients in Toronto, bringing the production facility to a total of over 525,000 square feet.
• iHeartRadio Canada launched the new national contemporary radio brand, MOVE Radio, in 10 markets across Canada, as well as on the iHeartRadio Canada app and at MoveRadio.ca
2021 FOCUS
• Continued growth in IPTV subscribers
• Enhance TV product superiority through new service offerings and innovation to provide an enhanced customer experience in the home
• Continued scaling of Crave through broader content offering and user experience improvements
• Investment in Noovo news and more French-language originals to better serve our French-language customers
• In January 2021, Bell Media’s French-language Noovo TV and digital network announced the debut of its news show LE FIL on March 29, continuing Bell Media’s industry-leading investment in and commitment to offer enhanced information and entertainment programming across all platforms
• Strategic pricing on advertising sales
• Monetization of content rights and Bell Media properties across all platforms
• Maintain strong audience levels and ratings across all TV and radio properties
• Reinforce industry leadership in conventional TV, specialty TV, pay TV, streaming and sports services
• Optimize unique partnerships and strategic content investments
2M
D&
A
Stra
tegi
c im
pera
tives
52 | BCE InC. 2020 AnnuAl REpoRt
2.4 Champion customer experience Deliver a positive customer experience for consumers and business customers by making it easier to do business with Bell at
every level, from sales to installation to ongoing support.
2020 PROGRESS
• Delivered the greatest reduction in consumer complaints among all national providers for the fifth year in a row according to the 2019-20 Annual Report from the Commission for Complaints for Telecom-television Services (CCTS). The CCTS reported that complaints received from Bell customers declined more than 35% and the company’s overall share of complaints was down six basis points to 24%.
• Virgin Mobile was ranked highest in overall customer care satisfaction in the J.D. Power 2020 Canada Wireless Customer Care Study for the fourth year in a row, and the fifth time in the last six years. Virgin Mobile also ranked best in overall satisfaction in J.D. Power’s 2020 Wireless Purchase Experience Study.
• Virgin Mobile’s My Account was named the Best Telecommunications Mobile Application of the year at the 2020 MobileWebAwards
• Improved wireless postpaid churn by 0.14 pts over 2019 to 0.99%, our lowest ever annual postpaid churn rate
• Improved customer churn rates across all wireline residential services over 2019
• Launched Move Valet, a service that helps customers in Ontario and Québec seamlessly transfer their Internet, TV and phone services from one residential address to another, with dedicated customer care specialists available seven days a week
• Improved our digital capabilities, including online fulfillment, self-serve tools and enhanced app functionality. As a result, 54% of total customer transactions were conducted online by the end of 2020, up 10 pts over 2019.
• Introduced the Assisted Self-Installation and Repair program in response to the COVID-19 pandemic to protect the health and safety of our customers and team members. We also offered a full self-installation option to households in Ontario and Québec with fibre connections already in place.
• Integrated our innovative Manage Your Appointment service into the MyBell app and enabled this service for Virgin Mobile customers. Available in Ontario and Québec, Manage Your Appointment provides customers with more precise estimates of technician arrival times and allows customers the ability to add their appointment to a personal calendar.
• Reduced residential FTTP Internet repair truck rolls per customer by 17% in Ontario, Québec and the Atlantic provinces as a result of greater network performance
• Offered residential repair appointments the same day or next day 92% of the time in Ontario, Québec and the Atlantic provinces
• Introduced Virtual Office, a new suite of integrated remote work solutions enabling businesses to optimize costs, enhance productivity and grow employee engagement
2021 FOCUS
• Improve end-to-end customer experience with continued investment in online sales support and digital functionality
• Further improve and expand self-installation capabilities, including ordering and delivery options and interactive support
• Further improve customer satisfaction scores
• Deliver a more convenient and personalized self-serve experience for customers
• Further evolve our self-serve tools
• Further reduce the total number of customer calls to our call centres as well as the number of truck rolls
• Continue to invest in artificial intelligence and machine learning to resolve customer issues faster
2.5 Operate with agility and cost efficiency Enhance our operational excellence in a competitive marketplace and build on our industry-leading cost structure with a focus
on efficiency and disciplined cost management across our business segments.
2020 PROGRESS
• Maintained relatively stable BCE consolidated adjusted EBITDA margin (1)
• Delivered productivity improvements and cost efficiencies resulting from the expansion of Bell’s all-fibre network footprint and service innovations enabled by new broadband technologies
• Lowered Bell Canada’s average after-tax cost of publicly issued debt securities to 3.0%
2021 FOCUS
• Continued sharp focus on our cost structure
• Realize cost savings from:
• management workforce reductions including attrition and retirements
• lower contracted rates from our suppliers
• operating efficiencies enabled by a growing direct fibre footprint
• changes in consumer behaviour and product innovation
• new call centre technology that is enabling self-serve capabilities
• rationalization of real estate footprint
• other improvements to the customer service experience
• Reduce subscriber acquisition and retention spending, enabled by increasing adoption of device financing plans
(1) Adjusted EBITDA margin is a non-GAAP financial measure and does not have any standardized meaning under IFRS. Therefore, it is unlikely to be comparable to similar measures presented by other issuers. See section 10.2, Non-GAAP financial measures and key performance indicators (KPIs) – Adjusted EBITDA and adjusted EBITDA margin in this MD&A for more details.

2M
D&
A
Stra
tegi
c im
pera
tives
BCE InC. 2020 AnnuAl REpoRt | 53
2.6 Engage and invest in our people Recognize our team’s importance to Bell’s competitive success by strengthening our award-winning workplace culture with new
technology and support resources and by offering enhanced development opportunities, enabling our diverse and dynamic team members to achieve their full potential.
2020 PROGRESS
• Recognized as one of Canada’s Top 100 Employers for the sixth consecutive year in Mediacorp’s annual review of the best workplaces across the country, reflecting our long-standing commitment to mental health, comprehensive employee benefits and resources, inclusive workplace environment and strong response to the COVID-19 pandemic
• Announced new initiatives to support BIPOC team members and communities
• New targets for BIPOC representation in Bell senior management and intern/graduate hiring and launched the Bell Let’s Talk Diversity Fund to support the mental health and well-being of Canada’s BIPOC communities
• Partnered with BIPOC TV and Film to launch the Bell Media Content Diversity Task Force to enhance the representation of diverse voices in programming and decision-making, and increase the employment of BIPOC Canadians working in the media industry through the HireBIPOC website and other initiatives
• Partnerships with the Onyx Initiative, Black Professionals in Tech Network, Ascend Canada and Indigenous Works, as well as ongoing support for the Black Professionals at Bell Network
• Named one of Canada’s Best Diversity Employers for the fourth year in a row in Mediacorp’s 2020 report on workplace diversity and inclusion. The award recognizes Bell’s commitment to providing an inclusive and accessible workplace that reflects Canada’s diversity and highlights our wide range of programs to enable BIPOC communities, women, persons with disabilities, Indigenous Peoples, visible minorities and other groups in their career development.
• Ranked as the top communications company on the Solutions Research Group (SRG) list of 25 Canadian brands that are championing diversity and inclusion
• Named one of Canada’s Top Employers for Young People for the third consecutive year by Mediacorp in recognition of our industry-leading recruitment and career development programs for students
• Named one of Canada’s Top Family-Friendly Employers by Mediacorp in recognition of our maternity and parental benefits, commitment to workplace mental health, comprehensive and flexible benefits plans and a strong Employee and Family Assistance Program with a variety of resources and support
• Introduced our Flexible Work Policy, offering Bell team members new ways to balance work, family and other life commitments and facilitating a move to remote work arrangements in response to the COVID-19 pandemic
• Launched an online virtual healthcare program, offering team members and their families convenient and confidential access to healthcare professionals through virtual consultation technology and added a new HealthCareAssist service to help team members better navigate the healthcare system
• Enhanced our health and safety measures as part of Bell’s ongoing response to the COVID-19 pandemic, and provided mental health resources and confidential support services through Bell’s Employee and Family Assistance Program
2021 FOCUS
• Continue our initiatives to engage and invest in our people, recognizing how critically important our team is to Bell’s success
• Deliver on diversity and inclusion commitments
• Enhance Bell’s focus on performance and employee recognition with a new, unified corporate reward and recognition program
• Build Bell’s talent advantage by expanding critical skills and upskilling
• Continue to evolve Bell’s COVID-19 pandemic response, focusing on the guiding principles to keep Canadians connected and informed; protect the health and safety of the public, our customers and team; and support our customers and communities

3M
D&
A
Out
look
, ass
umpt
ions
and
ris
ks
54 | BCE InC. 2020 AnnuAl REpoRt
3 Outlook, assumptions and risksThis section provides information pertaining to our consolidated business outlook and operating assumptions for 2021 and our principal business risks.
3.1 Business outlook and assumptionsThis section contains forward-looking statements, including relating to our projected financial performance for 2021, our 2021 business outlook, objectives, plans and strategic priorities and our 2021 annualized common share dividend. Refer to the section Caution regarding forward-looking statements at the beginning of this MD&A.
OUTLOOK2021 will be a reset year for BCE as we expect to transition towards a return to pre-COVID-19 pandemic levels of financial performance and operating momentum. Due to uncertainties relating to the severity and duration of the COVID-19 pandemic, including the current resurgence and possible future resurgences in the number of COVID-19 cases, and various potential outcomes, it is difficult at this time to estimate the impacts of the COVID-19 pandemic on our business or future financial results and related assumptions. Our business and financial results could continue to be significantly and negatively impacted in future periods. The extent to which the COVID-19 pandemic will continue to adversely impact us will depend on future developments that are difficult to predict, including the effective distribution of approved vaccines and treatments, and the potential development and distribution of new vaccines and treatments, as well as new information which may emerge concerning the severity, duration and resurgences of the COVID-19 pandemic and the actions required to contain the coronavirus or remedy its impacts, among others.
Our projected operating success for 2021 will continue to be anchored to the strategic priorities we set in 2020. They centre on:
• Increased investment on core network infrastructure that will lay the foundation for future broadband Internet and 5G growth
• Improving the end-to-end customer experience
• The ongoing digital transformation of our operations, especially as it relates to online fulfillment, self-serve and automation tools and improved app functionality
• A continued sharp focus on our cost structure
Underpinning our outlook for 2021 is an expected improving performance trajectory for all Bell operating segments. Wireless, retail Internet and TV subscriber base growth, together with pricing discipline and the flow-through of operating cost savings from a reduced workforce, fibre-related operating efficiencies and continued service improvement, are projected to drive overall revenue and adjusted EBITDA growth. This is expected to contribute to substantial free cash flow generation, providing support for the higher BCE common share dividend for 2021, as well as increased capital expenditures to forge ahead even more aggressively on our broadband strategy, including the expansion of all-fibre connections, deployment of Wireless Home Internet to even more rural communities, and a faster build of our mobile 5G network.
The key 2021 operational priorities for BCE are:
• Maintain our market share of national operators’ wireless postpaid net additions
• Continued growth of our prepaid subscriber base
• Continued adoption of mobile phone devices, tablets and data applications, as well as the introduction of more 5G, 4G LTE and LTE-A devices and new data services
• Continued deployment of 5G wireless network offering coverage that is competitive with other national operators in centres across Canada
• Increased adoption of unlimited data plans and device financing plans
• Improvement in subscriber acquisition and retention spending, enabled by increasing adoption of device financing plans
• Continued growth in retail Internet and IPTV subscribers
• Further deployment of direct fibre to more homes and businesses within our wireline footprint and fixed WTTP technology in rural communities
• Enhance Internet and TV product superiority through new service offerings and innovation to provide an enhanced customer experience in the home
• Realization of cost savings related to management workforce reductions including attrition and retirements, lower contracted rates from our suppliers, operating efficiencies enabled by a growing direct fibre footprint, changes in consumer behaviour and product innovation, new call centre technology that is enabling self-serve capabilities, rationalization of real estate footprint and other improvements to the customer service experience
• Media revenue generation from an expected improvement in advertiser demand with a gradual economic recovery combined with subscriber revenue growth and strategic pricing on advertising sales, while seeking to control TV programming and premium content cost escalation
• Continued scaling of Crave through broader content offering and user experience improvements
• Investment in Noovo news and more French-language originals to better serve our French-language customers with a wider array of content, in the language of their choice, on their preferred platforms
• Monetization of content rights and Bell Media properties across all platforms
Our projected financial performance for 2021 enabled us to increase the annualized BCE common share dividend for 2021 by 17 cents, or 5.1%, to $3.50 per share.
3M
D&
A
Out
look
, ass
umpt
ions
and
ris
ks
BCE InC. 2020 AnnuAl REpoRt | 55
ASSUMPTIONSASSUMPTIONS ABOUT THE CANADIAN ECONOMYWe have made certain assumptions concerning the Canadian economy, which in turn depend on important assumptions about how the COVID-19 pandemic will evolve. Notably, it is assumed that the vaccine rollout proceeds largely as announced by governments and that Canada, other advanced economies and China achieve broad immunity by the end of 2021. In particular, we have assumed:
• Strong rebound in economic growth after the first quarter of 2021 as the economy recovers from the significant impacts of the COVID-19 pandemic, given the Bank of Canada’s most recent estimated growth in Canadian gross domestic product of around 4% on average in 2021, following a decline of about 5.5% in 2020
• Recovery of consumer confidence and elevated levels of disposable income
• Strengthening business investment outside the oil and gas sector as uncertainty recedes
• Employment gains expected in 2021, despite ongoing challenges in some sectors
• Accelerating trend toward e-commerce
• Low immigration levels until international travel and/or health-related restrictions are lifted
• Prevailing low interest rates expected to remain at or near current levels for the foreseeable future
• Canadian dollar expected to remain at or near current levels. Further movements may be impacted by the degree of strength of the U.S. dollar, interest rates and changes in commodity prices.
MARKET ASSUMPTIONS• A consistently high level of wireline and wireless competition in
consumer, business and wholesale markets
• Higher, but slowing, wireless industry penetration
• A shrinking data and voice connectivity market as business customers migrate to lower-priced traditional telecommunications solutions or alternative OTT competitors
• While the advertising market continues to be adversely impacted by cancelled or delayed advertising campaigns from many sectors due to the economic downturn during the COVID-19 pandemic, we do expect gradual recovery in 2021
• Declines in broadcasting distribution undertakings (BDU) subscribers driven by increasing competition from the continued rollout of subscription video on demand (SVOD) streaming services together with further scaling of OTT aggregators
3.2 Principal business risksProvided below is a summary description of certain of our principal business risks that could have a material adverse effect on all of our segments. Certain additional business segment-specific risks are reported in section 5, Business segment analysis. For a detailed description of the principal risks relating to our regulatory environment and a description of the other principal business risks that could have a material adverse effect on our business, financial condition, liquidity, financial results or reputation, refer to section 8, Regulatory environment and section 9, Business risks, respectively.
COVID-19 PANDEMIC AND GENERAL ECONOMIC CONDITIONSThe COVID-19 pandemic resulted in governments and businesses worldwide adopting emergency measures to combat the spread of the coronavirus. These emergency measures have included, without limitation, social distancing, the temporary closure of non-essential businesses, stay-at-home and work-from-home policies, quarantine periods, border closures, travel bans or restrictions and curfews. These measures significantly disrupted retail and commercial activities across most sectors of the economy and had an adverse and pervasive impact on our financial and operating performance throughout most of 2020. The most significant impact of the COVID-19 pandemic on our business and financial results was experienced in the second quarter of 2020. The gradual easing of certain emergency measures in the latter part of the second quarter allowed many businesses to resume some level of, or increase, commercial activities, resulting in a marked sequential improvement in our financial performance in the third quarter. However, starting in late September, due to the resurgence in the number of COVID-19 cases, government restrictions were gradually strengthened and became more severe in late December, resulting in the closure of all non-essential businesses and the reintroduction of lockdown measures in certain areas. Accordingly, resurgences in new COVID-19 cases have caused and could continue to cause
governments to strengthen or re-introduce emergency measures including, depending on a resurgence’s intensity, certain or all of the strict confinement measures and business closures previously mandated or, potentially, additional measures. The strengthening or reintroduction of emergency measures, or a more prolonged duration of the COVID-19 pandemic, could result in increased adverse economic disruptions and financial markets volatility. The uncertainty brought about by the COVID-19 pandemic could result in increased insolvencies, bankruptcies, permanent store closures, higher unemployment levels and decreased consumer and corporate spending in Canada and around the world. Economic uncertainty could continue or worsen for as long as measures taken to contain the spread of COVID-19 persist and certain of such economic conditions could continue even upon the gradual or complete removal of such measures and thereafter. While government programs supporting workers and certain businesses, coupled with low interest rates, sustained some level of consumer and business activities, it is unknown for what period of time such government programs will be maintained. In addition, it is difficult to predict the speed and magnitude of travel recovery and economic rebound, or the associated impact on our business once government programs and health restrictions limiting movement of people are withdrawn.
Restrictive measures adopted or encouraged to combat the spread of COVID-19 and the resulting adverse economic conditions are expected to continue to adversely affect our business, financial condition, liquidity and financial results for as long as measures adopted in response to the COVID-19 pandemic remain in place or are reintroduced, and potentially upon and after their gradual or complete removal, and such adverse effect could be material. Should the COVID-19 pandemic continue for a more prolonged period of time and the temporary closure of non-essential businesses continue or be reintroduced, it would likely result in more employment losses and financial hardship, adversely affecting spending by our customers, both businesses and consumers, which could continue or accelerate the decrease in the
3M
D&
A
Out
look
, ass
umpt
ions
and
ris
ks
56 | BCE InC. 2020 AnnuAl REpoRt
purchase of certain of our products and services. It may also result in the continued suppression by customers of mobile phone data usage and offloading onto Wi-Fi networks as customers work from home, as well as influence customer adoption of new services including, without limitation, 5G and IoT.
A more prolonged COVID-19 pandemic could continue to result in lower business customer activity, which could continue to lead to further reduction or cancellation of our services due to economic uncertainty. These adverse results would be exacerbated should the temporary closure of non-essential businesses continue or be reintroduced as a result of resurgences in the number of COVID-19 cases. Business customers may continue to postpone purchases of hardware products, downgrade data connectivity speeds, or re-prioritize various business projects with a focus on business continuity instead of growth projects. We may be unable to perform work and render services on the premises of certain business customers due to existing, new or reintroduced government guidelines and health and safety measures. Finally, a certain number of our business customers could become insolvent or otherwise cease to carry on business as a result of the COVID-19 pandemic.
Measures adopted to combat the spread of COVID-19 have resulted in the suspension, delay or cancellation of some live programming and other productions, resulting in reduced audience levels in certain Bell Media market segments. In addition, measures such as social distancing and stay-at-home and work-from-home policies have adversely impacted Bell Media’s radio audience levels and OOH business, while economic pressures on advertisers have led to the cancellation or deferral of advertising campaigns. These events have adversely affected, and could continue to adversely affect, for as long as they persist, Bell Media’s revenues.
In addition, risk factors, including, without limitation, those described in section 9, Business risks, have been and/or could be exacerbated, or
become more likely to materialize, as a result of the COVID-19 pandemic. While we have implemented business continuity plans and taken additional steps where required, including various preventive measures and precautions, there can be no assurance that these actions in response to the COVID-19 pandemic will succeed in preventing or mitigating, in whole or in part, the negative impacts of the COVID-19 pandemic on our company, employees or customers, and these actions may have adverse effects on our business, which may continue following the COVID-19 pandemic.
The extent to which the COVID-19 pandemic will continue to adversely impact us will depend on future developments that are difficult to predict, including the effective distribution of approved vaccines and treatments, and the potential development and distribution of new vaccines and treatments, as well as new information which may emerge concerning the COVID-19 pandemic and the actions required to contain the coronavirus or remedy its impacts, among others. Any of the developments and risks referred to above and elsewhere in this MD&A, and others arising from the COVID-19 pandemic, could have a material adverse effect on our business, financial condition, liquidity, financial results or reputation.
In addition to risks related to the COVID-19 pandemic, other pandemics, epidemics and other health risks could occur, which could adversely affect our ability to maintain operational networks and provide products and services to our customers, as well as the ability of our suppliers to provide us with products and services we need to operate our business. Any such pandemics, epidemics and other health risks could also have an adverse effect on the economy and financial markets resulting in a declining level of retail and commercial activity, which could have a negative impact on the demand for, and prices of, our products and services. Any of these events could have an adverse effect on our business and financial performance.
COMPETITIVE ENVIRONMENTAs the scope of our businesses increases and evolving technologies drive new services, delivery models and strategic partnerships, our competitive landscape intensifies and expands to include new and emerging competitors, certain of which were historically our partners or suppliers, as well as global-scale competitors, including, in particular, cloud and OTT service providers, IoT hardware and software providers, voice over IP (VoIP) providers and other web-based players that are penetrating the telecommunications space with significant resources and a large customer base over which to amortize costs. Certain of these competitors are changing the competitive landscape by establishing material positions, which has accelerated during the COVID-19 pandemic. Established competitors further seek to consolidate or expand their product offerings through acquisitions in order to increase scale and market opportunities in light of these changes in market dynamics.
Technology substitution, IP networks and recent regulatory decisions, in particular, continue to reduce barriers to entry in our industry. In addition, the effects of government policies reserving spectrum at favourable pricing for regional facilities-based wireless service providers continue to impact market dynamics. Together, these factors have changed industry economics and allowed competitors to launch new products and services and gain market share with far less investment in financial, marketing, human, technological and network resources than has historically been required. In particular, some competitors deliver their services over our networks, leveraging regulatory obligations
applicable to us, therefore limiting their need to invest in building their own networks and impacting the network-based differentiation of our services. Such lower required investment challenges the monetization of our networks and our operating model. Moreover, foreign OTT players are currently not subject to the same taxation and Canadian content investment obligations as those imposed on Canadian domestic digital suppliers, which provides them with a competitive advantage over us.
Greater customer adoption of services like 5G, international roaming and resurgence of travel, as well as IoT services and applications in the areas of retail (e.g., home automation), business (e.g., remote monitoring), transportation (e.g., connected car and asset tracking) and urban city optimization (smart cities), is expected to accelerate growth opportunities as well as competition in these areas. If we are unable to develop and deploy new solutions in advance of or concurrently with our competitors, or if the market does not adopt these new technologies in pace with our deployment of new solutions, our business and financial results could be adversely affected.
We expect these trends, some of which have intensified during the COVID-19 pandemic, to continue in the future, and the increased competition we face as a result could negatively impact our business including, without limitation, in the following ways:
• The acceleration of disruptions and disintermediation in each of our business segments could adversely affect our business and financial results

3M
D&
A
Out
look
, ass
umpt
ions
and
ris
ks
BCE InC. 2020 AnnuAl REpoRt | 57
• The COVID-19 pandemic and the restrictive measures mandated or encouraged to contain the spread of the coronavirus have changed consumer behaviour and activity and the way businesses operate, and such changes could continue or further evolve for as long as such measures persist, and potentially thereafter, which could adversely affect the sale of our products and services, as well as our revenues and cash flows
• The regional nature of restrictive measures imposed by provincial governments in response to the COVID-19 pandemic could adversely impact our business in certain key markets differently from other industry players
• Competitors’ aggressive market offers, combined with heightened customer sensitivity around pricing, could result in pricing pressures, lower margins and increased costs of customer acquisition and retention, and our market share and sales volumes could decrease if we do not match competitors’ pricing levels or increase customer acquisition and retention spending
• Should our value proposition on pricing, network, speed, service or features not be considered sufficient for customers in light of available alternatives, this could lead to increased churn
• The shift to online transactions during the COVID-19 pandemic amid store closures and reduced store traffic adversely impacted our ability to leverage our extensive retail network to increase the number of subscribers and sell our products and services. This could continue during the COVID-19 pandemic and thereafter, and potentially worsen if temporary closures of our retail outlets are maintained or reintroduced.
• The convergence of wireline and wireless services is impacting product purchase choice by customers and could accelerate product substitution in favour of lower-margin products as well as accelerate churn, which trends are expected to increase with the introduction of 5G
• Regulatory decisions regarding wholesale access to our wireless and fibre networks could bring new competitors, including OTT players, or strengthen the market position of current competitors, which may negatively impact our retail subscriber base in favour of lower margin wholesale subscribers and thus could negatively impact our capacity to optimize scale and invest in our networks
• The timely rollout of 5G mobile service may be adversely impacted by government decisions, constraints on access to network equipment suppliers, the availability of 5G compatible handsets and potential operational challenges in delivering new technology
• The accelerated cloud-based and OTT-based substitution and the market expansion of lower-cost VoIP, collaboration and software-defined networking in a wide area network (SD WAN) solutions offered by local and global competitors, such as traditional software players,
are changing our approach to service offerings and pricing and could have an adverse effect on our business
• Spending rationalization by business customers could lead to higher declines in sales of traditional connectivity value-added services and margin erosion, driven by technology substitution, economic factors and customers’ operational efficiencies
• Multinational business consumers’ desire to consolidate global network service supply with one supplier could accelerate the disruptions in our wireline segment
• The pressure from simpler, lower-cost, agile service models is driving in-sourcing trends, which could have an adverse impact on our managed services business
• Subscriber and viewer growth is challenged by changing viewer habits, the expansion and accelerated market penetration amid the COVID-19 pandemic of low-cost OTT content providers, OTT aggregators and other alternative service providers, some of which may offer content as loss leaders to support their core business, as well as piracy, account stacking, Canadian Radio-television and Telecommunications Commission (CRTC) arbitration and a fragmentation of audience with an abundance of choices
• Competition with global competitors such as Netflix, Amazon and Disney, in addition to traditional Canadian TV competitors, for programming content could drive significant increases in content acquisition and development costs as well as reduced access to key content as some competitors withhold content to enhance their OTT service offering
• The proliferation of content piracy could negatively impact our ability to monetize products and services beyond our current expectations, while creating bandwidth pressure without corresponding revenue growth in the context of regulated wholesale high-speed Internet access rates
• Traditional radio faces accelerated substitution from alternative streaming services such as those offered by global audio streaming players and those made available by new technologies, including smart car services, which has been exacerbated by the COVID-19 pandemic due to a decline in radio audience driven by reduced travel needs
• The launch by international competitors of low orbit satellites to provide connectivity, primarily in rural areas, represents a new type of competition which could adversely affect our network deployment strategy in such areas
For a further discussion of our competitive environment and related risks, as well as a list of our main competitors, on a segmented basis, refer to Competitive landscape and industry trends and Principal business risks in section 5, Business segment analysis.
REGULATORY ENVIRONMENTAlthough most of our retail services are not price-regulated, government agencies and departments such as the CRTC, Innovation, Science and Economic Development Canada (ISED), Canadian Heritage and the Competition Bureau continue to play a significant role in regulatory matters such as mandatory access to networks, spectrum auctions, the imposition of consumer-related codes of conduct, approval of acquisitions, broadcast and spectrum licensing, foreign ownership requirements and control of copyright piracy. As with all regulated organizations, strategies are contingent upon regulatory decisions. Adverse decisions by governments or regulatory agencies, increased regulation or lack of effective anti-piracy remedies could have negative
financial, operational, reputational or competitive consequences for our business. As a result of the COVID-19 pandemic, additional legislation or regulations, regulatory initiatives or proceedings, or government consultations or positions, may be adopted or instituted, as the case may be, that impose additional constraints on our operations and may adversely impact our ability to compete in the marketplace.
For a discussion of our regulatory environment and the principal risks related thereto, refer to section 8, Regulatory environment as well as the applicable segment discussions under Principal business risks in section 5, Business segment analysis.
3M
D&
A
Out
look
, ass
umpt
ions
and
ris
ks
58 | BCE InC. 2020 AnnuAl REpoRt
SECURITY MANAGEMENTOur operations, service performance, reputation and business continuity depend on how well we protect our physical and non-physical assets, including networks, IT systems, offices, corporate stores and sensitive information, from events such as information security attacks, unauthorized access or entry, fire, natural disasters (including, without limitation, seismic and severe weather-related events such as ice, snow and wind storms, wildfires, flooding, extended heat waves, hurricanes, tornadoes and tsunamis), power loss, building cooling loss, acts of war or terrorism, sabotage, vandalism, actions of neighbours and other events. The protection and effective organization of our systems, applications and information repositories are central to the secure and continuous operation of our networks and business, as electronic and physical records of proprietary business and personal data, such as confidential customer and employee information, are all sensitive from a market and privacy perspective. As our operations involve receiving, processing and storing such proprietary business and personal data, effective policies, procedures and controls must be implemented to protect information systems and underlying data.
Information security breaches can result from deliberate or unintended actions by a growing number of sophisticated actors, including hackers, organized criminals, state-sponsored organizations and other parties. Information security attacks have grown in complexity, magnitude and frequency in recent years and the potential for damage is increasing. Information security attacks may be perpetrated using a complex array of ever evolving and changing means including, without limitation, the use of stolen credentials, social engineering, computer viruses and malicious software, phishing and other attacks on network and information systems. Information security attacks aim to achieve various malicious objectives including unauthorized access to, and theft of, confidential, proprietary, sensitive or personal information, as well as extortion and business disruptions. Information security policies, procedures and controls must continuously adapt and evolve in order to seek to mitigate risk and, consequently, require constant monitoring to ensure effectiveness. There is, however, no certainty that our information security policies, procedures and controls will be effective against all information security attacks.
We are also exposed to information security threats as a result of actions that may be taken by our customers, suppliers, outsourcers, business partners, employees or independent third parties, whether malicious or not, including as a result of the use of social media, cloud-based solutions and IT consumerization. Our use of third-party suppliers and outsourcers and reliance on business partners, which may also be subject to information security threats, also expose us to risks as we have less immediate oversight over their IT domains. Furthermore, the proliferation of data services, including mobile TV, mobile commerce, mobile banking and IoT applications, as well as increased digitization and the use of emerging technologies such as artificial intelligence, robotics and smart contracts leveraging blockchain for digital certificate, have significantly increased the threat surface of our network and systems, resulting in higher complexity that needs to be carefully monitored and managed to minimize security threats. Failure to implement an information security program that efficiently considers relationships and interactions with business partners, suppliers, customers, employees and other third parties across all methods of communication, including social media and cloud-based solutions, could adversely affect our ability to successfully defend against information security attacks.
The COVID-19 pandemic has increased our exposure to information security threats. Remote work arrangements of our employees and those of our suppliers have increased remote connectivity to our systems and the potential use of unauthorized communications technologies. In addition, the COVID-19 pandemic has seen an increase in global criminal activity, which further pressures our security environment.
If information security threats were to become successful attacks resulting in information security breaches, they could harm our brand, reputation and competitiveness, decrease customer and investor confidence and adversely affect our business, financial results, stock price and long-term shareholder value, given that they could lead to:
• Network operating failures and business disruptions, which could negatively impact our ability to sell products and services to our customers and adversely affect their ability to maintain normal business operations and deliver critical services, and/or the ability of third-party suppliers to deliver critical services to us
• Unauthorized access to proprietary or sensitive information about our business, which could result in diminished competitive advantages and loss of future business opportunities
• Theft, loss, unauthorized disclosure, destruction or corruption of data and confidential information, including personal information about our customers or employees, that could result in financial loss, exposure to claims for damages by customers, employees and others, and difficulty in accessing materials to defend legal actions
• Lost revenue resulting from the unauthorized use of proprietary information or the failure to retain or attract customers after an incident
• Physical damage to network assets impacting service continuity
• Litigation, investigations, fines and liability for failure to comply with increasingly stringent privacy and information security laws, including via mandatory flow-through of privacy-related obligations by our customers, as well as increased audit and regulatory scrutiny that could divert resources from project delivery
• Fines and sanctions from credit card providers for failing to comply with payment card industry data security standards for protection of cardholder data
• Increased fraud as criminals leverage stolen information against us, our employees or our customers
• Remediation costs such as liability for stolen information, equipment repair and service recovery, and incentives to customers or business partners in an effort to maintain relationships after an incident
• Increased information security protection costs, including the costs of deploying additional personnel and protection technologies, training and monitoring employees, and engaging third-party security experts and auditors
• Higher insurance premiums
In light of the evolving nature and sophistication of information security threats, we seek to continuously adapt our security policies and procedures to protect our information and assets. However, given the complexity and scale of our business, network infrastructure, technology and IT supporting systems, there can be no assurance that the security policies and procedures that we implement will prevent the occurrence of all potential information security breaches. In addition, there can be no assurance that any insurance we may have will cover all or part of the costs, damages, liabilities or losses that could result from the occurrence of any information security breach.

4M
D&
AC
onso
lidat
ed fi
nanc
ial a
naly
sis
BCE InC. 2020 AnnuAl REpoRt | 59
4 Consolidated financial analysisThis section provides detailed information and analysis about BCE’s performance in 2020 compared with 2019. It focuses on BCE’s consolidated operating results and provides financial information for our Bell Wireless, Bell Wireline and Bell Media business segments. For further discussion and analysis of our business segments, refer to section 5, Business segment analysis.
4.1 IntroductionBCE CONSOLIDATED INCOME STATEMENTS
2020 2019 $ CHANGE % CHANGE
Operating revenues
Service 19,832 20,566 (734) (3.6%)
Product 3,051 3,227 (176) (5.5%)
Total operating revenues 22,883 23,793 (910) (3.8%)
Operating costs (13,276) (13,787) 511 3.7%
Adjusted EBITDA 9,607 10,006 (399) (4.0%)
Adjusted EBITDA margin 42.0% 42.1% (0.1) pts
Severance, acquisition and other costs (116) (114) (2) (1.8%)
Depreciation (3,475) (3,458) (17) (0.5%)
Amortization (929) (886) (43) (4.9%)
Finance costs
Interest expense (1,110) (1,125) 15 1.3%
Interest on post-employment benefit obligations (46) (63) 17 27.0%
Impairment of assets (472) (102) (370) n.m.
Other (expense) income (194) 95 (289) n.m.
Income taxes (792) (1,129) 337 29.8%
Net earnings from continuing operations 2,473 3,224 (751) (23.3%)
Net earnings from discontinued operations 226 29 197 n.m.
Net earnings 2,699 3,253 (554) (17.0%)
Net earnings from continuing operations attributable to:
Common shareholders 2,272 3,011 (739) (24.5%)
Preferred shareholders 136 151 (15) (9.9%)
Non-controlling interest 65 62 3 4.8%
Net earnings from continuing operations 2,473 3,224 (751) (23.3%)
Net earnings attributable to:
Common shareholders 2,498 3,040 (542) (17.8%)
Preferred shareholders 136 151 (15) (9.9%)
Non-controlling interest 65 62 3 4.8%
Net earnings 2,699 3,253 (554) (17.0%)
Adjusted net earnings 2,730 3,119 (389) (12.5%)
Net earnings per common share (EPS)
Continuing operations 2.51 3.34 (0.83) (24.9%)
Discontinued operations 0.25 0.03 0.22 n.m.
Net earnings per common share 2.76 3.37 (0.61) (18.1%)
Adjusted EPS 3.02 3.46 (0.44) (12.7%)
n.m.: not meaningful
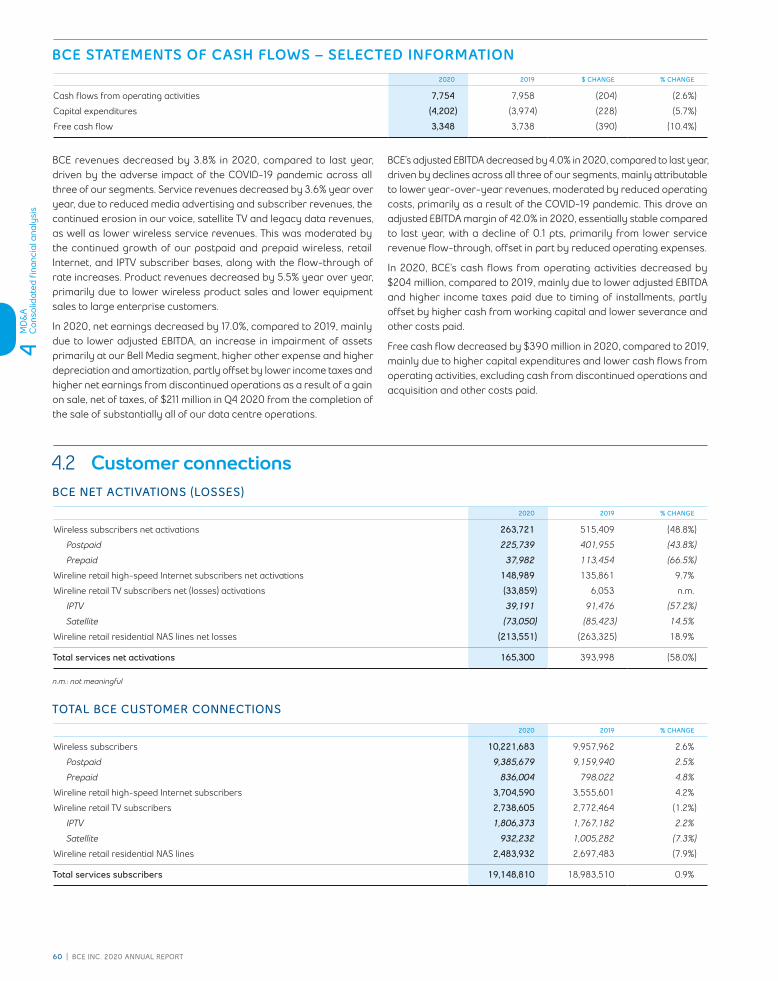
4M
D&
AC
onso
lidat
ed fi
nanc
ial a
naly
sis
60 | BCE InC. 2020 AnnuAl REpoRt
BCE STATEMENTS OF CASH FLOWS – SELECTED INFORMATION2020 2019 $ CHANGE % CHANGE
Cash flows from operating activities 7,754 7,958 (204) (2.6%)
Capital expenditures (4,202) (3,974) (228) (5.7%)
Free cash flow 3,348 3,738 (390) (10.4%)
BCE revenues decreased by 3.8% in 2020, compared to last year, driven by the adverse impact of the COVID-19 pandemic across all three of our segments. Service revenues decreased by 3.6% year over year, due to reduced media advertising and subscriber revenues, the continued erosion in our voice, satellite TV and legacy data revenues, as well as lower wireless service revenues. This was moderated by the continued growth of our postpaid and prepaid wireless, retail Internet, and IPTV subscriber bases, along with the flow-through of rate increases. Product revenues decreased by 5.5% year over year, primarily due to lower wireless product sales and lower equipment sales to large enterprise customers.
In 2020, net earnings decreased by 17.0%, compared to 2019, mainly due to lower adjusted EBITDA, an increase in impairment of assets primarily at our Bell Media segment, higher other expense and higher depreciation and amortization, partly offset by lower income taxes and higher net earnings from discontinued operations as a result of a gain on sale, net of taxes, of $211 million in Q4 2020 from the completion of the sale of substantially all of our data centre operations.
BCE’s adjusted EBITDA decreased by 4.0% in 2020, compared to last year, driven by declines across all three of our segments, mainly attributable to lower year-over-year revenues, moderated by reduced operating costs, primarily as a result of the COVID-19 pandemic. This drove an adjusted EBITDA margin of 42.0% in 2020, essentially stable compared to last year, with a decline of 0.1 pts, primarily from lower service revenue flow-through, offset in part by reduced operating expenses.
In 2020, BCE’s cash flows from operating activities decreased by $204 million, compared to 2019, mainly due to lower adjusted EBITDA and higher income taxes paid due to timing of installments, partly offset by higher cash from working capital and lower severance and other costs paid.
Free cash flow decreased by $390 million in 2020, compared to 2019, mainly due to higher capital expenditures and lower cash flows from operating activities, excluding cash from discontinued operations and acquisition and other costs paid.
4.2 Customer connectionsBCE NET ACTIVATIONS (LOSSES)
2020 2019 % CHANGE
Wireless subscribers net activations 263,721 515,409 (48.8%)
Postpaid 225,739 401,955 (43.8%)
Prepaid 37,982 113,454 (66.5%)
Wireline retail high-speed Internet subscribers net activations 148,989 135,861 9.7%
Wireline retail TV subscribers net (losses) activations (33,859) 6,053 n.m.
IPTV 39,191 91,476 (57.2%)
Satellite (73,050) (85,423) 14.5%
Wireline retail residential NAS lines net losses (213,551) (263,325) 18.9%
Total services net activations 165,300 393,998 (58.0%)
n.m.: not meaningful
TOTAL BCE CUSTOMER CONNECTIONS
2020 2019 % CHANGE
Wireless subscribers 10,221,683 9,957,962 2.6%
Postpaid 9,385,679 9,159,940 2.5%
Prepaid 836,004 798,022 4.8%
Wireline retail high-speed Internet subscribers 3,704,590 3,555,601 4.2%
Wireline retail TV subscribers 2,738,605 2,772,464 (1.2%)
IPTV 1,806,373 1,767,182 2.2%
Satellite 932,232 1,005,282 (7.3%)
Wireline retail residential NAS lines 2,483,932 2,697,483 (7.9%)
Total services subscribers 19,148,810 18,983,510 0.9%

4M
D&
AC
onso
lidat
ed fi
nanc
ial a
naly
sis
BCE InC. 2020 AnnuAl REpoRt | 61
BCE added 165,300 net retail customer activations in 2020, declining by 58.0% compared to last year. The net retail customer activations in 2020 consisted of:
• 225,739 postpaid wireless net customer activations, and 37,982 prepaid wireless net customer activations
• 148,989 retail high-speed Internet net customer activations
• 33,859 retail TV net customer losses comprised of 73,050 retail satellite TV net customer losses, moderated by 39,191 retail IPTV net customer activations
• 213,551 retail residential NAS net losses
At December 31, 2020, BCE’s retail customer connections totaled 19,148,810, up 0.9% year over year, and consisted of the following:
• 10,221,683 wireless subscribers, up 2.6% compared to 2019, comprised of 9,385,679 postpaid subscribers, an increase of 2.5% over last year, and 836,004 prepaid subscribers, up 4.8% year over year
• 3,704,590 retail high-speed Internet subscribers, 4.2% higher than last year
• 2,738,605 total retail TV subscribers, down 1.2% compared to 2019, comprised of 1,806,373 retail IPTV subscribers, up 2.2% year over year, and 932,232 retail satellite TV subscribers, down 7.3% year over year
• 2,483,932 retail residential NAS lines, a decline of 7.9% compared to 2019
4.3 Operating revenuesBCERevenues(in $ millions)
2020 2019 $ CHANGE % CHANGE
Bell Wireless 8,683 9,001 (318) (3.5%)
Bell Wireline 12,206 12,317 (111) (0.9%)
Bell Media 2,750 3,217 (467) (14.5%)
Inter-segment eliminations (756) (742) (14) (1.9%)
Total BCE operating revenues 22,883 23,793 (910) (3.8%)
19 20
$22,883$23,793
BCETotal operating revenues at BCE decreased by 3.8% in 2020, compared to 2019, due to declines across all three of our segments, which were adversely affected by the COVID-19 pandemic, with a more pronounced impact on media advertising revenues, as well as wireless product volumes and outbound roaming revenues. BCE service revenues of $19,832 million in 2020 declined by 3.6% over last year and product revenues of $3,051 million in 2020 decreased by 5.5% year over year.
Wireless operating revenues declined by 3.5% due to both lower service and product revenues of 3.2% and 4.4%, respectively. Wireline operating revenues decreased by 0.9% year over year in 2020, driven by lower service revenue of 0.4%, from reduced voice revenue, moderated by higher data revenues, along with lower product revenue of 9.9%. Bell Media operating revenues declined by 14.5% year over year in 2020 from lower advertising and subscriber revenues.
4.4 Operating costsBCEOperating costs(in $ millions)
BCEOperating cost profile2019
BCEOperating cost profile2020
$13,787in 2019
$13,276in 2020 33%
53%
14%
33%52%
15%
(3.8%)
53% Cost of revenues (1) 33% Labour (2) 14% Other (3)
52% Cost of revenues (1) 33% Labour (2) 15% Other (3)
(1) Cost of revenues includes costs of wireless devices and other equipment sold, network and content costs, and payments to other carriers.(2) Labour costs (net of capitalized costs) include wages, salaries and related taxes and benefits, post-employment benefit plans service cost, and other labour costs, including contractor
and outsourcing costs.(3) Other operating costs include marketing, advertising and sales commission costs, bad debt expense, taxes other than income taxes, IT costs, professional service fees and rent.
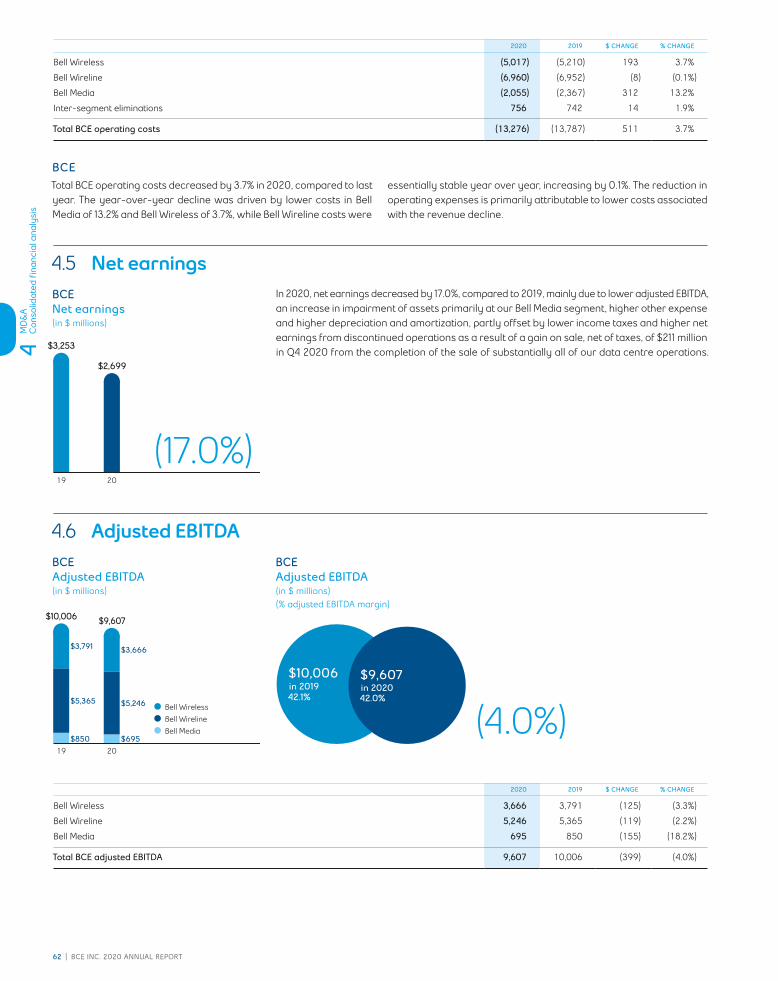
4M
D&
AC
onso
lidat
ed fi
nanc
ial a
naly
sis
62 | BCE InC. 2020 AnnuAl REpoRt
2020 2019 $ CHANGE % CHANGE
Bell Wireless (5,017) (5,210) 193 3.7%
Bell Wireline (6,960) (6,952) (8) (0.1%)
Bell Media (2,055) (2,367) 312 13.2%
Inter-segment eliminations 756 742 14 1.9%
Total BCE operating costs (13,276) (13,787) 511 3.7%
BCETotal BCE operating costs decreased by 3.7% in 2020, compared to last year. The year-over-year decline was driven by lower costs in Bell Media of 13.2% and Bell Wireless of 3.7%, while Bell Wireline costs were
essentially stable year over year, increasing by 0.1%. The reduction in operating expenses is primarily attributable to lower costs associated with the revenue decline.
4.5 Net earningsBCENet earnings(in $ millions)
In 2020, net earnings decreased by 17.0%, compared to 2019, mainly due to lower adjusted EBITDA, an increase in impairment of assets primarily at our Bell Media segment, higher other expense and higher depreciation and amortization, partly offset by lower income taxes and higher net earnings from discontinued operations as a result of a gain on sale, net of taxes, of $211 million in Q4 2020 from the completion of the sale of substantially all of our data centre operations.
19 20
$2,699
$3,253
4.6 Adjusted EBITDABCEAdjusted EBITDA(in $ millions)
BCEAdjusted EBITDA(in $ millions)(% adjusted EBITDA margin)
19 20
$9,607$10,006
$5,246
$3,666
$695
$5,365
$3,791
$850
$10,006in 201942.1%
$9,607in 202042.0%
2020 2019 $ CHANGE % CHANGE
Bell Wireless 3,666 3,791 (125) (3.3%)
Bell Wireline 5,246 5,365 (119) (2.2%)
Bell Media 695 850 (155) (18.2%)
Total BCE adjusted EBITDA 9,607 10,006 (399) (4.0%)
(17.0%)
Bell Wireless Bell Wireline Bell Media (4.0%)

4M
D&
AC
onso
lidat
ed fi
nanc
ial a
naly
sis
BCE InC. 2020 AnnuAl REpoRt | 63
BCEBCE’s adjusted EBITDA decreased by 4.0% in 2020, compared to 2019, driven by lower revenues, moderated by reduced operating costs, primarily attributable to the adverse impact of the COVID-19 pandemic. Adjusted EBITDA margin of 42.0% in 2020 was relatively stable year
over year, declining by 0.1 pts over last year, mainly resulting from lower service revenue flow-through, partly offset by reduced operating expenses.
4.7 Severance, acquisition and other costsThis category includes various income and expenses that are not related directly to the operating revenues generated during the year. This includes severance costs consisting of charges related to involuntary and voluntary employee terminations, as well as transaction costs, such as legal and financial advisory fees, related to completed or potential acquisitions, employee severance costs related to the purchase of a business, the costs to integrate acquired companies into our operations, costs relating to litigation and regulatory decisions, when they are significant, and other costs.
BCESeverance, acquisition and other costs(in $ millions)
2020Severance, acquisition and other costs included:
• Severance costs of $35 million related to involuntary and voluntary employee terminations
• Acquisition and other costs of $81 million
2019Severance, acquisition and other costs included:
• Severance costs of $63 million related to involuntary and voluntary employee terminations
• Acquisition and other costs of $51 million
$114in 2019
$116in 2020
4.8 Depreciation and amortizationThe amount of our depreciation and amortization in any year is affected by:
• How much we invested in new property, plant and equipment and intangible assets in previous years
• How many assets we retired during the year
• Estimates of the useful lives of assets
BCEDepreciation(in $ millions)
BCEAmortization(in $ millions)
19 20
$3,475$3,458
19 20
$929$886
DEPRECIATIONDepreciation in 2020 increased by $17 million, compared to 2019, mainly due to a higher asset base as we continued to invest in our broadband and wireless networks as well as our IPTV services, partly offset by an increase in the estimate of useful lives of certain assets as a result of our ongoing annual review process.
AMORTIZATIONAmortization in 2020 increased by $43 million, compared to 2019, mainly due to a higher asset base.
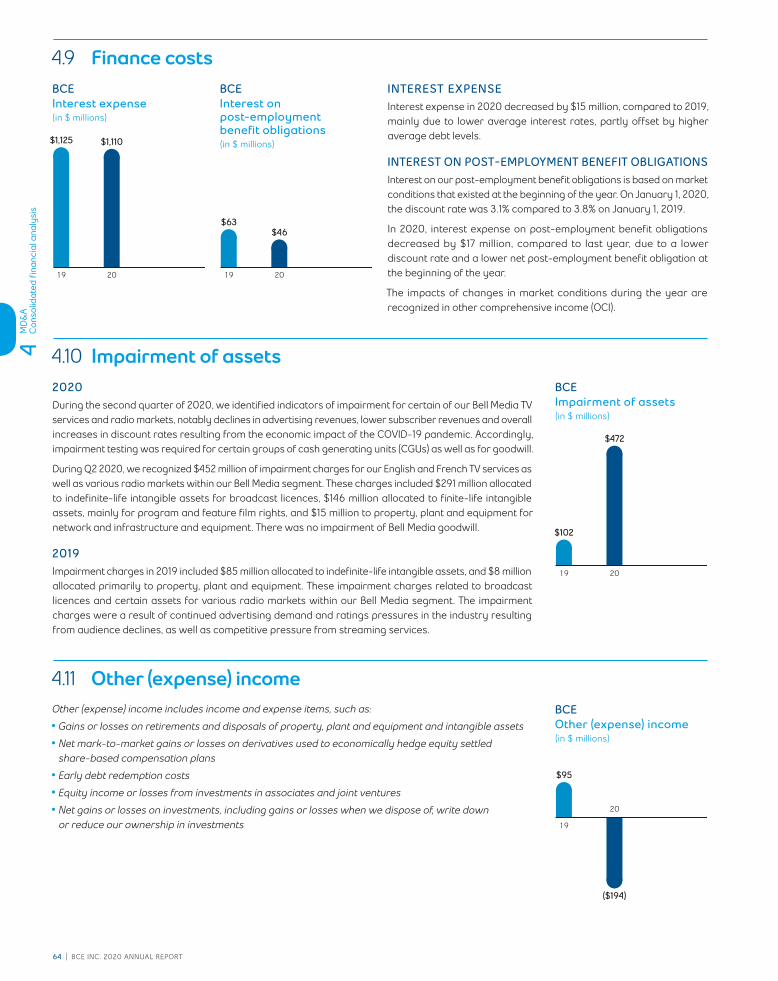
4M
D&
AC
onso
lidat
ed fi
nanc
ial a
naly
sis
64 | BCE InC. 2020 AnnuAl REpoRt
4.9 Finance costsBCEInterest expense(in $ millions)
19 20
$1,110$1,125
BCEInterest on post-employment benefit obligations(in $ millions)
19 20
$46$63
INTEREST EXPENSEInterest expense in 2020 decreased by $15 million, compared to 2019, mainly due to lower average interest rates, partly offset by higher average debt levels.
INTEREST ON POST-EMPLOYMENT BENEFIT OBLIGATIONSInterest on our post-employment benefit obligations is based on market conditions that existed at the beginning of the year. On January 1, 2020, the discount rate was 3.1% compared to 3.8% on January 1, 2019.
In 2020, interest expense on post-employment benefit obligations decreased by $17 million, compared to last year, due to a lower discount rate and a lower net post-employment benefit obligation at the beginning of the year.
The impacts of changes in market conditions during the year are recognized in other comprehensive income (OCI).
4.10 Impairment of assets2020During the second quarter of 2020, we identified indicators of impairment for certain of our Bell Media TV services and radio markets, notably declines in advertising revenues, lower subscriber revenues and overall increases in discount rates resulting from the economic impact of the COVID-19 pandemic. Accordingly, impairment testing was required for certain groups of cash generating units (CGUs) as well as for goodwill.
During Q2 2020, we recognized $452 million of impairment charges for our English and French TV services as well as various radio markets within our Bell Media segment. These charges included $291 million allocated to indefinite-life intangible assets for broadcast licences, $146 million allocated to finite-life intangible assets, mainly for program and feature film rights, and $15 million to property, plant and equipment for network and infrastructure and equipment. There was no impairment of Bell Media goodwill.
2019Impairment charges in 2019 included $85 million allocated to indefinite-life intangible assets, and $8 million allocated primarily to property, plant and equipment. These impairment charges related to broadcast licences and certain assets for various radio markets within our Bell Media segment. The impairment charges were a result of continued advertising demand and ratings pressures in the industry resulting from audience declines, as well as competitive pressure from streaming services.
BCEImpairment of assets(in $ millions)
19 20
$472
$102
4.11 Other (expense) incomeOther (expense) income includes income and expense items, such as:
• Gains or losses on retirements and disposals of property, plant and equipment and intangible assets
• Net mark-to-market gains or losses on derivatives used to economically hedge equity settled share-based compensation plans
• Early debt redemption costs
• Equity income or losses from investments in associates and joint ventures
• Net gains or losses on investments, including gains or losses when we dispose of, write down or reduce our ownership in investments
BCEOther (expense) income(in $ millions)
19
20
($194)
$95

4M
D&
AC
onso
lidat
ed fi
nanc
ial a
naly
sis
BCE InC. 2020 AnnuAl REpoRt | 65
2020Other expense of $194 million included losses on retirements and disposals of property, plant and equipment and intangible assets of $83 million, which included a loss related to a change in strategic direction of the ongoing development of some of our TV platform assets under construction, net mark-to-market losses on derivatives used to economically hedge equity settled share-based compensation plans of $51 million, early debt redemption costs of $50 million and losses on operations from our equity investments of $38 million. These expenses were partly offset by gains on our equity investments of $43 million, which included gains on BCE’s share of an obligation to repurchase at fair value the minority interest in one of BCE’s joint ventures.
2019Other income of $95 million included net mark-to-market gains on derivatives used to economically hedge equity settled share-based compensation plans of $138 million and gains on investments of $18 million which included BCE’s obligation to repurchase at fair value the minority interest in one of BCE’s subsidiaries, partly offset by losses from our equity investments of $72 million, which included BCE’s obligation to repurchase at fair value the minority interest in one of BCE’s joint ventures, and early debt redemption costs of $18 million.
4.12 Income taxesBCEIncome taxes(in $ millions)
$1,129in 2019 $792
in 2020
The following table reconciles the amount of reported income taxes in the income statements with income taxes calculated at a statutory income tax rate of 26.9% for 2020 and 27.0% for 2019.
FOR THE YEAR ENDED DECEMBER 31 2020 2019
Net earnings from continuing operations 2,473 3,224
Add back income taxes 792 1,129
Earnings from continuing operations before income taxes 3,265 4,353
Applicable statutory tax rate 26.9% 27.0%
Income taxes computed at applicable statutory rates (878) (1,175)
Non-taxable portion of gains on investments 1 5
Uncertain tax positions 21 15
Effect of change in provincial corporate tax rate 9 25
Change in estimate relating to prior periods 6 14
Non-taxable portion of equity gains (losses) 2 (20)
Previously unrecognized tax benefits 47 5
Other – 2
Total income taxes from continuing operations (792) (1,129)
Average effective tax rate 24.3% 25.9%
Income taxes in 2020 decreased by $337 million, compared to 2019, mainly due to lower taxable income and a higher value of previously unrecognized tax benefits, partly offset by a favourable change in the corporate income tax rate in Alberta in Q2 2019.
4.13 Net earnings attributable to common shareholders and EPSBCENet earnings attributable to common shareholders(in $ millions)
BCEEPS(in $)
BCEAdjusted net earnings(in $ millions)
BCEAdjusted EPS(in $)
19 20
$2,498
$3,040
19 20
$2.76
$3.37
19 20
$2,730
$3,119
19 20
$3.02
$3.46

4M
D&
AC
onso
lidat
ed fi
nanc
ial a
naly
sis
66 | BCE InC. 2020 AnnuAl REpoRt
Net earnings attributable to common shareholders in 2020 decreased by $542 million, or $0.61 per common share, compared to 2019, mainly due to lower adjusted EBITDA, an increase in impairment of assets primarily at our Bell Media segment, higher other expense and higher depreciation and amortization, partly offset by lower income taxes and higher net earnings from discontinued operations as a result of a gain on sale, net of taxes, of $211 million in Q4 2020 from the completion of the sale of substantially all of our data centre operations.
Excluding the impact of severance, acquisition and other costs, net mark-to-market gains (losses) on derivatives used to economically hedge equity settled share-based compensation plans, net gains (losses) on investments, early debt redemption costs, impairment of assets and discontinued operations, net of tax and non-controlling interest (NCI), adjusted net earnings in 2020 was $2,730 million, or $3.02 per common share, compared to $3,119 million, or $3.46 per common share, in 2019.
4.14 Capital expendituresBCECapital expenditures(in $ millions)
Capital intensity(%)
BCE capital expenditures increased by 5.7% in 2020 over the prior year to $4,202 million for a corresponding capital intensity ratio of 18.4%, up 1.7 pts compared to the 16.7% achieved in 2019. The year-over-year increase in capital spending was driven by greater investments in Bell Wireless and Bell Media, moderated by reduced spending in Bell Wireline. We continued to focus our investments on network expansion with the ongoing deployment of our FTTP and WTTP networks to more locations along with the launch of our mobile 5G network in June 2020 and the continued rollout of our LTE-A network, which at the end of 2020 reached 26% and 96% of the Canadian population, respectively. Additionally, we invested in capacity enhancements to support increased demand due to the COVID-19 pandemic, as well as investments in online fulfillment, customer self-serve and automation tools, as well as improved app functionality, also driven by the COVID-19 pandemic.
19 20
$3,97416.7%
$4,20218.4%
$6717.5%
$3,19525.9%
$1083.4%
$91610.5%
$3,16125.9%
$1254.5%
4.15 Cash flowsIn 2020, BCE’s cash flows from operating activities decreased by $204 million, compared to 2019, mainly due to lower adjusted EBITDA and higher income taxes paid due to timing of installments, partly offset by higher cash from working capital and lower severance and other costs paid.
Free cash flow decreased by $390 million in 2020, compared to 2019, mainly due to higher capital expenditures and lower cash flows from operating activities, excluding cash from discontinued operations and acquisition and other costs paid.
BCECash flows from operating activities(in $ millions)
BCEFree cash flow(in $ millions)
19 20
$7,754$7,958
19 20
$3,348$3,738
Bell Wireless Bell Wireline Bell Media
(2.6%) (10.4%)

5M
D&
A
Busi
ness
seg
men
t ana
lysi
s Be
ll W
irel
ess
BCE InC. 2020 AnnuAl REpoRt | 67BCE InC. 2020 AnnuAl REpoRt | 67
5 Business segment analysis
5.1 Bell WirelessWe grew our wireless customer base by 2.6% in 2020 with the addition of 263,721 total net postpaid and prepaid subscribers, the vast majority of which were new mobile phone customers. An impressive result in the context of the challenging COVID-19 situation that speaks to our focus on driving service revenue and adjusted EBITDA growth through accretive smartphone transactions.
FINANCIAL PERFORMANCE ANALYSIS2020 PERFORMANCE HIGHLIGHTS
Bell WirelessRevenues(in $ millions)
Bell WirelessAdjusted EBITDA(in $ millions)(% adjusted EBITDA margin)
19 20
$8,683$9,001
71%
29%
71%
29%
$3,791in 201942.1%
$3,666in 202042.2%
Total subscriber growth
+2.6%in 2020
Postpaid net activations in 2020
225,739Declined 43.8% vs. 2019
Prepaid net activations in 2020
37,982Declined 66.5% vs. 2019
Postpaid churn in 2020
0.99%Improved 0.14 pts vs. 2019
Blended average billing per user (ABPU) (1)per month
(5.4%)2020: $64.69 2019: $68.36
(1) In Q1 2020, we updated our definition of ABPU to include monthly billings related to device financing receivables owing from customers on contract. Consequently, we restated previously reported 2019 ABPU for comparability. See section 10.2, Non-GAAP financial measures and key performance indicators (KPIs), in this MD&A for the definition of ABPU.
BELL WIRELESS RESULTS
REVENUES
2020 2019 $ CHANGE % CHANGE
External service revenues 6,122 6,323 (201) (3.2%)
Inter-segment service revenues 47 49 (2) (4.1%)
Total operating service revenues 6,169 6,372 (203) (3.2%)
External product revenues 2,508 2,623 (115) (4.4%)
Inter-segment product revenues 6 6 – –
Total operating product revenues 2,514 2,629 (115) (4.4%)
Total Bell Wireless revenues 8,683 9,001 (318) (3.5%)
Service Product
(3.5%) (3.3%)

5M
D&
A
Busi
ness
seg
men
t ana
lysi
s Be
ll W
irel
ess
68 | BCE InC. 2020 AnnuAl REpoRt68 | BCE InC. 2020 AnnuAl REpoRt
Bell Wireless operating revenues decreased by 3.5% in 2020, compared to 2019, driven by both lower service and product revenues.
Service revenues declined by 3.2% in 2020, compared to last year, due to:
• Lower outbound roaming revenues mainly from reduced customer travel as a result of the COVID-19 pandemic
• Reduced data overages driven by greater customer adoption of monthly plans with higher data thresholds, including unlimited and shareable plans
• Accommodations provided to customers as a result of the COVID-19 pandemic, including delayed implementation of planned price increases and revenue credits due to financial difficulty experienced by customers
These factors were partly offset by the continued growth in our postpaid and prepaid subscriber base combined with the flow-through of rate increases.
Product revenues decreased by 4.4% in 2020, compared to last year, driven by lower device upgrades and gross activations, as well as lower consumer electronics sales at The Source from reduced retail traffic as a result of the COVID-19 pandemic, including the temporary closure of our retail distribution channels during the year. This was partly offset by increased sales of premium devices, higher handset prices and lower discounting.
OPERATING COSTS AND ADJUSTED EBITDA
2020 2019 $ CHANGE % CHANGE
Operating costs (5,017) (5,210) 193 3.7%
Adjusted EBITDA 3,666 3,791 (125) (3.3%)
Total adjusted EBITDA margin 42.2% 42.1% 0.1 pts
Bell Wireless operating costs decreased by 3.7% in 2020, compared to 2019, driven by:
• Lower product cost of goods sold associated with reduced device sales, primarily driven by the COVID-19 pandemic, offset in part by a greater mix of premium devices and higher handset costs
• Reduced labour costs due to the Canada Emergency Wage Subsidy (CEWS), a wage subsidy program offered by the federal government to eligible employers as a result of the COVID-19 pandemic, which mitigated the impact on our retail employees from the temporary closure of our retail distribution channels
• Lower discretionary spending, mainly reduced advertising and employee travel as a result of the COVID-19 pandemic
These factors were partly offset by:
• Higher network operating costs to support the rollout of our mobile 5G network
Bell Wireless adjusted EBITDA decreased by 3.3% in 2020, compared to 2019, mainly driven by revenue decline, moderated by lower operating costs. Adjusted EBITDA margin, based on wireless operating revenues of 42.2% in 2020, was relatively stable compared to last year, increasing by 0.1 pts.
BELL WIRELESS OPERATING METRICS
2020 2019 CHANGE % CHANGE
Blended ABPU ($/month) (1) 64.69 68.36 (3.67) (5.4%)
Gross activations 1,805,732 2,117,517 (311,785) (14.7%)
Postpaid 1,286,307 1,568,729 (282,422) (18.0%)
Prepaid 519,425 548,788 (29,363) (5.4%)
Net activations 263,721 515,409 (251,688) (48.8%)
Postpaid 225,739 401,955 (176,216) (43.8%)
Prepaid 37,982 113,454 (75,472) (66.5%)
Blended churn % (average per month) 1.28% 1.39% 0.11 pts
Postpaid 0.99% 1.13% 0.14 pts
Prepaid 4.60% 4.44% (0.16) pts
Subscribers 10,221,683 9,957,962 263,721 2.6%
Postpaid 9,385,679 9,159,940 225,739 2.5%
Prepaid 836,004 798,022 37,982 4.8%
(1) In Q1 2020, we updated our definition of ABPU to include monthly billings related to device financing receivables owing from customers on contract. Consequently, we restated previously reported 2019 ABPU for comparability. See section 10.2, Non-GAAP financial measures and key performance indicators (KPIs), in this MD&A for the definition of ABPU.
Blended ABPU of $64.69 decreased by 5.4% in 2020, compared to 2019, driven by:
• Decreased outbound roaming revenues from reduced customer travel due to the COVID-19 pandemic
• Lower data overages driven by greater customer adoption of monthly plans with higher data thresholds, including unlimited and shareable plans
• Customer accommodations, including delayed implementation of price increases and revenue credits due to the financial difficulty experienced by customers as a result of the COVID-19 pandemic
These factors were partly offset by:
• Higher monthly billings related to increased adoption of device financing plans
• The flow-through of rate increases

5M
D&
A
Busi
ness
seg
men
t ana
lysi
s Be
ll W
irel
ess
BCE InC. 2020 AnnuAl REpoRt | 69BCE InC. 2020 AnnuAl REpoRt | 69
Total gross wireless activations decreased by 14.7% in 2020, compared to 2019, due to both lower postpaid and prepaid gross activations.
• Postpaid gross activations decreased by 18.0% in 2020, compared to last year, driven by reduced market activity and lower retail traffic due to the COVID-19 pandemic, including the temporary closure of retail distribution channels during the year
• Prepaid gross activations decreased by 5.4% in 2020, compared to last year, driven by reduced market activity and less retail traffic due to the COVID-19 pandemic, including the temporary closure of retail distribution channels during the year, and strong subscriber activations from Lucky Mobile in 2019
Blended wireless churn of 1.28% improved by 0.11 pts in 2020, compared to 2019.
• Postpaid churn of 0.99% in 2020 improved by 0.14 pts, compared to last year, driven by lower deactivations from reduced market activity as a result of the COVID-19 pandemic
• Prepaid churn of 4.60% in 2020 increased by 0.16 pts in 2020, compared to 2019, due to greater competitive intensity in the discount market
Net activations declined by 48.8% in 2020, compared to 2019, due to both lower year-over-year postpaid and prepaid net activations.
• Postpaid net activations decreased by 43.8% in 2020, compared to last year, driven by lower gross activations, offset in part by fewer customer deactivations
• Prepaid net activations decreased by 66.5% in 2020, compared to the prior year, due to lower gross activations and greater customer deactivations
Wireless subscribers at December 31, 2020 totaled 10,221,683, an increase of 2.6%, compared to 2019. This was comprised of 9,385,679 postpaid subscribers and 836,004 prepaid subscribers, an increase of 2.5% and 4.8%, respectively, year over year. At the end of 2020, the proportion of Bell Wireless customers subscribing to our postpaid service remained stable compared to last year at 92%.
COMPETITIVE LANDSCAPE AND INDUSTRY TRENDSThis section contains forward-looking statements, including relating to our business outlook. Refer to the section Caution regarding forward-looking statements at the beginning of this MD&A.
COMPETITIVE LANDSCAPEThe Canadian wireless industry has experienced strong subscriber growth in recent years, supported by immigration and population growth; the trend toward multiple devices, including tablets; the expanding functionality of data and related applications; and the adoption of mobile devices and services by both younger and older generations. However, various forms of public health measures during the global COVID-19 pandemic, including the temporary closure of retail stores and global travel restrictions, hampered the growth of new subscribers in 2020. The wireless penetration rate increased to approximately 94% in Canada in 2020, with further increases in penetration expected in 2021. By comparison, the wireless penetration rate in the U.S. is well over 100%, and even higher in Europe and Asia.
The 2020 wireless market in Canada was challenged by the COVID-19 pandemic. Growth in ABPU had already been moderating as carriers migrated their customer bases to unlimited data and device financing plans. However, ABPU moderation was exacerbated by the COVID-19 pandemic as wireless industry roaming revenue significantly declined from customers’ reduced travel activity. Additionally, with large numbers of the Canadian workforce working from home during the COVID-19 pandemic, there were associated declines in chargeable usage from workers offloading their mobile device traffic onto Wi-Fi. The Canadian wireless market also continued to experience high levels of competition nationally, which has led to continued declines in chargeable data usage and larger allotments of data, in addition to other factors, such as the popularity of data sharing plans and an evolving customer mix shift towards non-traditional wireless devices and tools such as video chats. These factors, combined with increases in overall data usage, which is expected to increase dramatically with the ongoing commercialization of 5G, led to widespread adoption and promotion of unlimited data plans and device financing plans by all national players.
The Canadian wireless industry continues to be highly competitive and capital-intensive, with carriers continuing to expand and enhance their broadband wireless networks, including through material investments in spectrum.
Competitors• Large facilities-based national wireless service providers Rogers
Communications Inc. (Rogers) and the Telus Corporation group of companies (Telus)
• Smaller facilities-based wireless service provider Shaw Communica-tions Inc. (Shaw), which currently provides service in Toronto, Calgary, Vancouver, Edmonton and Ottawa, as well as in several communities in southwestern Ontario
• Regional facilities-based wireless service providers Vidéotron Ltée (Vidéotron), which provides service in Montréal and other parts of Québec; Saskatchewan Telecommunications Holding Corporation, which provides service in Saskatchewan; Bragg Communications Inc. (Eastlink), which provides service in Nova Scotia and Prince Edward Island; and Xplornet Communications Inc., which provides service in Manitoba
INDUSTRY TRENDS
INCREASED ADOPTION OF UNLIMITED DATA AND DEVICE FINANCING PLANS
The introduction of unlimited wireless data and device financing plans are a natural evolution of competition in the market. Unlimited wireless data plans are having a near-term unfavourable financial impact, due to revenue and ABPU pressure as customers with high overage charges or higher priced plans look to optimize their bills. Longer term, these new customer options are expected to encourage greater data consumption, particularly as the industry shifts to 5G over the next several years; drive lower costs as a result of lower device discounting compared to traditional subsidy plans, e-billing and reduced call centre activity. In addition, unlimited data and device financing plans address the need to make wireless data and the latest smartphone devices more affordable to Canadians.
5M
D&
A
Busi
ness
seg
men
t ana
lysi
s Be
ll W
irel
ess
70 | BCE InC. 2020 AnnuAl REpoRt70 | BCE InC. 2020 AnnuAl REpoRt
ACCELERATING DATA CONSUMPTION
The demand for wireless data services is expected to continue to grow, due to: ongoing investment in faster network technologies, such as LTE-A and 5G, that provide a richer user experience and lower network latency; a larger appetite for mobile connectivity, social networking and other applications; increasing adoption of shared plans with multiple devices by families; and the growth of unlimited data plans. Greater customer adoption of services like 5G, international roaming and resumption of travel post-COVID-19, as well as IoT services and applications enabled and developed by 5G networks, should also contribute to the demand for data services. In the consumer market, IoT represents a growth area for the industry as wireless connectivity on everyday devices, from home automation to cameras, becomes ubiquitous. However, data overage revenue will continue to be negatively impacted as customers continue to migrate to unlimited and large allotment data plans.
SIGNIFICANT INVESTMENTS IN WIRELESS NETWORKS
Fast growth in mobile data traffic is increasingly putting a strain on wireless carriers’ networks and their ability to manage and service this traffic. Industry Canada’s 600 MHz, 700 MHz, advanced wireless services-3 (AWS-3), and 2500 MHz spectrum auctions that occurred
since 2014 provided wireless carriers with prime spectrum to roll out faster next-generation wireless networks and build greater capacity. Carrier aggregation is a technology currently being employed by Canadian wireless carriers that allows for multiple channels of spectrum to be used together, thereby significantly increasing network capacity and data transfer rates. Investments in fibre backhaul to cell sites and the deployment of small-cell technology further increase the efficient utilization of carriers’ spectrum holdings and will also pave the way for mobile 5G service. Early 5G wireless networks were deployed by the national operators in 2020 utilizing low-band and mid-band spectrum. Early 5G speeds are similar to peak speeds enabled by LTE-A mobile networks. The real benefit of 5G will come from the ability to offer consumers higher speeds, lower latency and the ability to support the massive deployment of devices connected to the Internet as well as the faster delivery of data services. Bringing Canada into this true 5G world will require higher-band spectrum, including 3.5 Gigahertz (GHz) spectrum, which will become available following the federal government’s auction process scheduled to occur in June 2021. We expect 5G technology to provide a significant opportunity for future growth in the industry.
BUSINESS OUTLOOK AND ASSUMPTIONSThis section contains forward-looking statements, including relating to our projected financial performance for 2021 and our 2021 business outlook, objectives, plans and strategic priorities. Refer to the section Caution regarding forward-looking statements at the beginning of this MD&A.
2021 OUTLOOKWe expect revenue growth to be driven primarily by postpaid and prepaid mobile phone subscriber base expansion. We expect ABPU to continue to be impacted negatively by lower roaming revenues due to ongoing COVID-19 travel restrictions, reductions in data overage revenue resulting from continued adoption of unlimited plans and larger data allotments, and prepaid customer growth. We will seek to achieve higher revenues from the flow-through of pricing changes, as well as IoT services and applications in the areas of retail, business, transportation, and urban city optimization. Our intention is to introduce new services to the market in a way that balances innovation with profitability.
We also remain focused on sustaining our market share of national operators’ postpaid net additions in a disciplined and cost-conscious manner, while also growing our share of new industry prepaid net additions.
We plan to deliver adjusted EBITDA growth in 2021 from flow-through of higher revenue and disciplined cost management.
ASSUMPTIONS• Maintain our market share of national operators’ wireless postpaid
net additions
• Continued growth of our prepaid subscriber base
• Continued adoption of smartphone devices, tablets and data applications, as well as the introduction of more 5G, 4G LTE and LTE-A devices and new data services
• Continued deployment of 5G wireless network offering coverage that is competitive with other national operators in centres across Canada
• Improvement in subscriber acquisition and retention spending, enabled by increasing adoption of device financing plans
• Unfavourable impact on blended ABPU, driven by reduced outbound roaming revenue due to travel restrictions as a result of the COVID-19 pandemic, reduced data overage revenue due to continued adoption of unlimited plans and the impact of a higher prepaid mix in our overall subscriber base
• Increased adoption of unlimited data plans and device financing plans
• No material financial, operational or competitive consequences of changes in regulations affecting our wireless business

5M
D&
A
Busi
ness
seg
men
t ana
lysi
s Be
ll W
irel
ess
BCE InC. 2020 AnnuAl REpoRt | 71BCE InC. 2020 AnnuAl REpoRt | 71
KEY GROWTH DRIVERS• Higher, but slowing, Canadian wireless industry penetration
• A greater number of customers on our 4G LTE, LTE-A and 5G networks
• Continued growth of our prepaid subscriber base
• Continued adoption of smartphone devices, tablets, and data applications
• Increased adoption of unlimited data plans and device financing plans
PRINCIPAL BUSINESS RISKSThis section discusses certain principal business risks specifically related to the Bell Wireless segment. For a detailed description of the other principal risks that could have a material adverse effect on our business, including those related to the COVID-19 pandemic, refer to section 9, Business risks.
AGGRESSIVE COMPETITION
RISK
• The intensity of competitive activity from national wireless operators, regional facilities-based wireless service providers, non-traditional players and resellers
POTENTIAL IMPACT
• Pressure on our revenue, adjusted EBITDA, ABPU and churn would likely result if competitors continue to aggressively pursue new types of price plans, increase discounts, offer shared plans based on sophisticated pricing requirements or offer other incentives, such as multi-product bundles, to attract new customers
REGULATORY ENVIRONMENT
RISK
• Greater regulation of wireless services, pricing and infrastructure (e.g., additional mandated access to wireless networks and limitations placed on future spectrum bidding)
POTENTIAL IMPACT
• Greater regulation could influence network investment and the market structure, limit our flexibility, improve the business position of our competitors, limit network-based differentiation of our services, and negatively impact the financial performance of our wireless business
MARKET MATURITY
RISK
• Slower subscriber growth due to high Canadian smartphone penetration and reduced or slower immigration flow
POTENTIAL IMPACT
• A maturing wireless market could challenge subscriber growth and cost of acquisition and retention, putting pressure on the financial performance of our wireless business

5M
D&
ABu
sine
ss s
egm
ent a
naly
sis
Bell
Wir
elin
e
72 | BCE InC. 2020 AnnuAl REpoRt
5.2 Bell WirelineThe advantages of fast, reliable and high-capacity broadband networks in a challenging and competitive marketplace, together with lower customer churn, drove an industry-leading 148,989 retail Internet net additions in 2020, up 9.7%, despite the impact of the COVID-19 pandemic on customer activity. The broadband footprint advantage that we are building, with the fastest fibre network and Wireless Home Internet speeds in the market today, positions us favourably in both our consumer and business segments over the long term to grow Internet revenue.
FINANCIAL PERFORMANCE ANALYSIS2020 PERFORMANCE HIGHLIGHTS
Bell WirelineRevenues(in $ millions)
Bell WirelineAdjusted EBITDA(in $ millions)(% adjusted EBITDA margin)
19 20
$12,206$12,317
29%
65%
2% 2%5% 4%
30%
63%
$5,365in 201943.6%
$5,246in 202043.0%
Retail high-speed Internet
+4.2%Subscriber growthin 2020
Retail high-speed Internet
148,989Total net subscriber activationsin 2020
Fibre and WTTP footprint
10.3 millionHomes and businessesat the end of 2020
Retail TV
(1.2%)Subscriber declinein 2020
Retail IPTV
39,191Total net subscriber activationsin 2020
Retail residential NAS lines
(7.9%)Subscriber declinein 2020
Data services Voice Product Other services
(0.9%) (2.2%)

5M
D&
ABu
sine
ss s
egm
ent a
naly
sis
Bell
Wir
elin
e
BCE InC. 2020 AnnuAl REpoRt | 73
BELL WIRELINE RESULTS
REVENUES
2020 2019 $ CHANGE % CHANGE
Data 7,691 7,617 74 1.0%
Voice 3,402 3,564 (162) (4.5%)
Other services 248 251 (3) (1.2%)
Total external service revenues 11,341 11,432 (91) (0.8%)
Inter-segment service revenues 321 281 40 14.2%
Total operating service revenues 11,662 11,713 (51) (0.4%)
Data 494 556 (62) (11.2%)
Equipment and other 49 48 1 2.1%
Total external product revenues 543 604 (61) (10.1%)
Inter-segment product revenues 1 – 1 n.m.
Total operating product revenues 544 604 (60) (9.9%)
Total Bell Wireline revenues 12,206 12,317 (111) (0.9%)
n.m.: not meaningful
Bell Wireline operating revenues declined by 0.9% in 2020, compared to last year, from the ongoing erosion in voice revenues combined with lower product sales, moderated by higher data service revenues.
Bell Wireline operating service revenues decreased by 0.4% in the year, compared to 2019.
• Data revenues grew by 1.0% in 2020, compared to the prior year, driven by:
• Higher retail Internet and IPTV subscribers coupled with the flow-through of pricing changes
These factors were partly offset by:
• Ongoing decline in our satellite TV subscriber base
• Greater acquisition, retention and bundle discounts on residential services
• Continued legacy data erosion
• Delayed implementation of planned price increases and waiving of residential Internet overage charges due to the accommodations provided to customers as a result of the COVID-19 pandemic
• Reduced business solutions services revenues, driven by lower customer spending and delays in accessing customer sites as a result of the COVID-19 pandemic
• Voice revenues declined by 4.5% in 2020, compared to last year, resulting from:
• Greater NAS line erosion due to technological substitution to wireless and Internet based services
• Large business customer conversions to IP and Internet-based data services
• Delayed implementation of planned price increases and other customer accommodations, due to the COVID-19 pandemic
These factors were partly offset by:
• Higher usage of conferencing services by business customers as a result of an increased number of employees working from home due to the COVID-19 pandemic
• The flow-through of pricing changes
Bell Wireline operating product revenues decreased by 9.9% in 2020, compared to last year, due to lower customer spending and difficulties accessing customer premises, as a result of the COVID-19 pandemic, and lower sales, mainly to the government sector.
OPERATING COSTS AND ADJUSTED EBITDA
2020 2019 $ CHANGE % CHANGE
Operating costs (6,960) (6,952) (8) (0.1%)
Adjusted EBITDA 5,246 5,365 (119) (2.2%)
Adjusted EBITDA margin 43.0% 43.6% (0.6) pts
Bell Wireline operating costs were essentially stable in 2020, increasing 0.1%, compared to last year, due to:
• Higher costs attributable to the COVID-19 pandemic, mainly related to employee redeployment, purchase of PPE, incremental building cleaning and supplies, and increased donations
• Increased bad debt expense driven by greater financial difficulties experienced by customers as a result of the COVID-19 pandemic
• Greater pension expense reflecting a higher DB cost due to a lower discount rate

5M
D&
ABu
sine
ss s
egm
ent a
naly
sis
Bell
Wir
elin
e
74 | BCE InC. 2020 AnnuAl REpoRt
These factors were partly offset by:
• Lower cost of goods sold and TV programming and content costs, associated with the revenue decline
• Reduced discretionary spending mainly on employee travel, advertising and sales promotions, along with delayed sponsorships, as a result of the COVID-19 pandemic
• Labour savings from reduced vendor contract costs, lower headcount and fewer call volumes to our customer service centres
Bell Wireline adjusted EBITDA declined by 2.2% in 2020, compared to 2019, driven by lower revenues and higher operating expenses. Adjusted EBITDA margin of 43.0% in 2020 decreased by 0.6 pts, compared to the 43.6% achieved last year, attributable to lower revenue flow-through and incremental expenses driven by the COVID-19 pandemic.
BELL WIRELINE OPERATING METRICS
DATA
Retail high-speed Internet2020 2019 CHANGE % CHANGE
Retail net activations 148,989 135,861 13,128 9.7%
Retail subscribers 3,704,590 3,555,601 148,989 4.2%
Retail high-speed Internet subscriber net activations increased by 9.7% in the year, compared to 2019, driven by greater retail residential net additions due to reduced deactivations as a result of the COVID-19 pandemic and fewer customers coming off of promotional offers, as well as increased net activations in our FTTP and WTTP footprints. This was moderated by lower gross activations primarily in
our residential and small business markets, resulting from lower market activity, mainly attributable to reduced traffic in our retail distribution channels during the year, due to the COVID-19 pandemic.
Retail high-speed Internet subscribers totaled 3,704,590 at December 31, 2020, up 4.2% from the end of 2019.
Retail TV2020 2019 CHANGE % CHANGE
Retail net subscriber (losses) activations (33,859) 6,053 (39,912) n.m.
IPTV 39,191 91,476 (52,285) (57.2%)
Satellite (73,050) (85,423) 12,373 14.5%
Total retail subscribers 2,738,605 2,772,464 (33,859) (1.2%)
IPTV 1,806,373 1,767,182 39,191 2.2%
Satellite 932,232 1,005,282 (73,050) (7.3%)
n.m.: not meaningful
Retail IPTV net subscriber activations declined by 57.2% in 2020, compared to last year, driven by reduced market activity, mainly attributable to fewer promotional offers and lower traffic in our retail distribution channels, including the impact from the temporary closure of retail distribution channels during the year, due to the COVID-19 pandemic. Maturing Fibe TV and Alt TV markets, reduced new service footprint expansion, and higher substitution of traditional TV services with OTT services, also unfavourably impacted activations. This was partly mitigated by fewer deactivations as a result of the COVID-19 pandemic, a lower number of customers coming off of promotional offers, and a ramp-up in activations from Virgin TV, which launched in Ontario and Québec in July 2020.
Retail satellite TV net customer losses improved by 14.5% in the year, compared to 2019, due to lower deactivations attributable to the COVID-19 pandemic, fewer customers coming off of promotional offers, and reflected a more mature subscriber base geographically better-suited for satellite TV service.
Total retail TV net customer losses (IPTV and satellite TV combined) were unfavourable year over year by 39,912 in 2020, compared to the same period last year, driven by lower IPTV net activations, moderated by fewer satellite TV net losses.
Retail IPTV subscribers at December 31, 2020 totaled 1,806,373, up 2.2% from 1,767,182 subscribers reported at the end of 2019.
Retail satellite TV subscribers at December 31, 2020 totaled 932,232, down 7.3% from 1,005,282 subscribers reported at the end of 2019.
Total retail TV subscribers (IPTV and satellite TV combined) at December 31, 2020 were 2,738,605, representing a 1.2% decline from 2,772,464 subscribers at the end of 2019.
VOICE2020 2019 CHANGE % CHANGE
Retail residential NAS lines net losses (213,551) (263,325) 49,774 18.9%
Retail residential NAS lines 2,483,932 2,697,483 (213,551) (7.9%)
Retail residential NAS net losses improved by 18.9% in 2020, compared to 2019, due to fewer deactivations, resulting from the COVID-19 pandemic, along with a lower number of customers coming off of promotional offers. This was partly offset by continued substitution to wireless and Internet-based technologies.
Retail residential NAS subscribers at December 31, 2020 of 2,483,932 declined by 7.9%, compared to the end of 2019. This represented an improvement over the 8.9% rate of erosion experienced in 2019, driven by fewer deactivations primarily due to the COVID-19 pandemic.
5M
D&
ABu
sine
ss s
egm
ent a
naly
sis
Bell
Wir
elin
e
BCE InC. 2020 AnnuAl REpoRt | 75
COMPETITIVE LANDSCAPE AND INDUSTRY TRENDSThis section contains forward-looking statements, including relating to our business outlook. Refer to the section Caution regarding forward-looking statements at the beginning of this MD&A.
COMPETITIVE LANDSCAPESimilar to the Canadian wireless industry, wireline markets and operations were significantly affected by the COVID-19 pandemic. Physical distancing requirements impacted traditional wireline installations as installers were restricted from entering customers’ premises. Conversely, with large numbers of workers and students working and learning from home, demand for wireline services surged, with network traffic reaching historic levels during the COVID-19 pandemic. Although the residential high-speed Internet market is maturing, with a penetration rate of approximately 88% across Canada, subscriber growth is expected to continue over the coming years. An estimated 7.3 million Internet subscribers received their service over the networks of the four largest cable companies at the end of 2020, up 2% from approximately 7.1 million at the end of 2019. An estimated 6.6 million Internet subscribers received their service over the networks of incumbent local exchange carriers (ILECs) like Bell at the end of 2020, up 4% from approximately 6.3 million at the end of 2019. Bell continues to make gains in market share as a result of the expansion of our FTTP direct fibre network and our rollout of Wireless Home Internet in rural markets.
While Canadians still watch traditional TV, digital platforms are playing an increasingly important role in the broadcasting industry and in respect of content. Popular online video services are providing Canadians with more choice about what, where, when and how to access their video content. In 2020, ILECs offering IPTV service grew their subscriber base by an estimated 3% to reach 3.1 million customers, driven by expanded network coverage, enhanced differentiated service offerings, and marketing and promotions focused on IPTV. Conversely, the combined cable TV and satellite TV subscriber penetration rate declined. Canada’s four largest cable companies have an estimated 5.0 million TV subscribers, or a 52% market share, a decrease from 53% at the end of 2019. The balance of industry subscribers were served by satellite TV and regional providers.
In recent years, three of the largest Canadian cable TV companies have launched new TV services based on the Comcast X1 video platform, including Shaw, Rogers and most recently Québecor’s Vidéotron brand. Our IPTV platform (Fibe TV, Alt TV and Virgin TV) continues to offer numerous service advantages over this cable platform.
The financial performance of the overall Canadian wireline telecommunications market continues to be impacted by the ongoing declines in legacy voice service revenues resulting from technological substitution to wireless and OTT services, as well as by ongoing conversion to IP-based data services and networks by large business customers. Sustained competition from cable companies is also continuing to erode traditional telephone providers’ market share of residential local telephony. Canada’s four largest cable companies had approximately 3.3 million telephony subscribers at the end of 2020, representing a national residential market share of approximately 46%. Other non-facilities-based competitors also offer local and long distance VoIP services and resell high-speed Internet services.
Competitors• Cable TV providers offering cable TV, Internet and cable telephony
services, including:
• Rogers in Ontario, New Brunswick, Newfoundland and Labrador
• Vidéotron in Québec
• Cogeco Cable Inc. (a subsidiary of Cogeco Inc.) (Cogeco) in Ontario and Québec
• Shaw in British Columbia, Alberta, Saskatchewan, Manitoba and Ontario
• Shaw Direct, providing satellite TV service nationwide
• Eastlink in every province except Saskatchewan, where it does not provide cable TV and Internet service
• Telus provides residential voice, Internet and IPTV services in British Columbia, Alberta and Eastern Québec
• Telus and Allstream Inc. provide wholesale products and business services across Canada
• Various others (such as TekSavvy Solutions, Distributel, VMedia, and Vonage Canada (a division of Vonage Holdings Corp.) offer resale or VoIP-based local, long distance and Internet services
• OTT voice and/or video services, such as Skype, Netflix, Amazon Prime Video, Disney+, CBS All Access and YouTube
• Digital media streaming devices such as Apple TV, Roku and Google Chromecast
• Other Canadian ILECs and cable TV operators
• Substitution to wireless services, including those offered by Bell
• Customized managed outsourcing solutions competitors, such as systems integrators CGI and IBM
• Wholesale competitors include cable operators, domestic CLECs, U.S. or other international carriers for certain services, and electrical utility-based telecommunications providers
• Competitors for home security range from local to national companies, such as Telus, Rogers, Chubb-Edwards and Stanley Security
INDUSTRY TRENDS
INVESTMENT IN BROADBAND FIBRE DEPLOYMENT
The Canadian ILECs continue to make substantial investments in deploying broadband fibre within their territories, with a focus on direct FTTP access to maintain and enhance their ability to support enhanced IP-based services and higher broadband speeds. Cable TV companies are investing increasingly in ILECs’ FTTP footprint in conjunction with their DOCSIS 3.1 platforms, enabling them to achieve speed parity with ILEC competitors where they have fibre deployed. The DOCSIS 3.1 platform does not however offer the same advanced capabilities as FTTP over the longer term in terms of reduced latency or upload speed potential. FTTP delivers total broadband access speeds of up to 1.5 Gbps currently, with faster speeds expected in the near future as network and in-home equipment evolves to support these higher speeds. Increasing speeds beyond 1.5 Gbps in the home will be enabled through modernization of the core network, but will not require any changes to the fibre.

5M
D&
ABu
sine
ss s
egm
ent a
naly
sis
Bell
Wir
elin
e
76 | BCE InC. 2020 AnnuAl REpoRt
ALTERNATIVE TV AND OTT SERVICES
The growing popularity of watching TV and on-demand content anywhere, particularly on handheld devices, is expected to continue as customers adopt services that enable them to view content on multiple screens. Streaming media providers, such as Netflix, Amazon Prime Video and Disney+ continue to enhance OTT streaming services in order to compete for share of viewership in response to evolving viewing habits and consumer demand. TV providers are monitoring OTT developments and evolving their content and market strategy to compete with these non-traditional offerings. We view OTT as an opportunity to add increased capabilities to our linear and on-demand assets, provide customers with flexible options to choose the content they want, and drive greater usage of Bell’s high-speed Internet and wireless networks. We continue to enhance our Fibe TV service with additional content and capabilities, including the ability to watch recorded content on the go and access Netflix, Amazon Prime Video and YouTube on STBs. We launched Virgin TV in 2020, bringing our industry-leading app-based live TV service to the Virgin internet base. Virgin TV customers can enjoy live and on-demand content on a variety of devices. In addition, we introduced the Bell Streamer Android TV box, which allows customers to bring all of their favourite live TV, movies, and on-demand content directly to their big screens with Alt TV. This breakthrough device is also a key enabler of our video aggregation strategy.
TECHNOLOGY SUBSTITUTION
Technology substitution, enabled by the broad deployment of higher speed Internet; the pervasive use of e-mail, messaging and social media as alternatives to voice services; and the growth of wireless and VoIP services, continue to drive legacy voice revenue declines for telecommunications companies. Wireless-only households were estimated to represent approximately 53% of households in our wireline footprint at the end of 2020, compared to approximately 51% at the end of 2019, while the disconnection of and reduction in spending for traditional TV (cord-cutting and cord-shaving) continues to rise. Although Bell is a key provider of these substitution services, the decline in this legacy business continues as anticipated.
ADOPTION OF IP-BASED SERVICES
The convergence of IT and telecommunications, facilitated by the ubiquity of IP, continues to shape competitive investments for business customers. Telecommunications companies are providing professional and managed services, as well as other IT services and support, while IT service providers are bundling network connectivity with their software as service offerings. In addition, manufacturers continue to bring all-IP and converged (IP plus legacy) equipment to market, enabling ongoing migration to IP-based solutions. The development of IP-based platforms, which provide combined IP voice, data and video solutions, creates potential cost efficiencies that compensate, in part, for reduced margins resulting from the continuing shift from legacy to IP-based services. The evolution of IT has created significant opportunities for our business markets services, such as cloud services and data hosting, that can have a greater business impact than traditional telecommunications services.
BUSINESS OUTLOOK AND ASSUMPTIONSThis section contains forward-looking statements, including relating to our projected financial performance for 2021 and our 2021 business outlook, objectives, plans and strategic priorities. Refer to the section Caution regarding forward-looking statements at the beginning of this MD&A.
2021 OUTLOOKOur overall wireline financial growth profile is expected to strengthen progressively in 2021 as the COVID-19 pandemic impacts begin to dissipate. This is predicated on continued expansion of our retail Internet and TV subscriber bases, supported by a broader FTTP service footprint together with higher household penetration; further deployment of Wireless Home Internet access technology in more rural communities; further scaling of Bell’s app-based live TV streaming services Alt TV and Virgin TV (launched in 2020); the introduction of new TV products and features; improving year-over-year business markets operating profitability; as well as cost reductions to offset competitive pricing pressures and the ongoing decline in voice revenue.
The broadband network advantage that we are building across our urban, suburban and rural service footprint areas positions us extremely well in both our consumer and business markets to continue growing Internet market share and revenue faster than our competitors. We will continue to focus on winning the home by delivering the fastest broadband speeds; the best content on the customer’s TV platform of choice; and a superior Wi-Fi experience that leverages Bell’s Smart Home automation leadership with services such as Whole Home Wi-Fi, home security, and video and automation, in order to drive higher year-over-year Internet and TV net customer additions.
In business wireline, customers continue to look for opportunities to leverage new technologies to grow and transform the workforce of the future, as well as to lower costs. As a result of these factors, and the unpredictable pace of the economy’s recovery from the COVID-19 pandemic, spending by large enterprise customers on telecommunications services and products is expected to be variable. Ongoing customer migrations from traditional technologies to IP-based systems and demand for cheaper bandwidth alternatives will continue to create pressure on overall business markets results in 2021. We intend to offset the revenue decline from traditional legacy telecommunications services by continuing to develop unique services and value enhancements to improve the client experience through new features such as cloud access, and security and collaboration services. Furthermore, we intend to use marketing initiatives and other customer-specific strategies to slow the pace of NAS erosion, while also investing in direct fibre expansion, 5G and new solutions in key portfolios such as Internet and private networks, cloud services, unified communications, security and IoT. We will also continue to focus on delivering network-centric managed and professional services solutions to large and medium-sized businesses that increase the value of connectivity services.

5M
D&
ABu
sine
ss s
egm
ent a
naly
sis
Bell
Wir
elin
e
BCE InC. 2020 AnnuAl REpoRt | 77
We expect the overall level of competitive intensity in our small and medium-sized business markets to remain high, despite the current COVID-19 situation, as cable operators and other telecom competitors look to these customer segments as potential growth opportunities. We also intend to introduce service offerings that help drive innovative solutions and value for our small and medium-sized customers by leveraging Bell’s network assets, broadband fibre expansion and service capabilities to expand our relationships with them. We will maintain a focus on overall profitability by seeking to increase revenue per customer and customer retention, as well as through improving our processes to achieve further operating efficiencies and productivity gains.
We are also maintaining a sharp focus on our operating cost structure to help offset pressures related to the growth and retention of IPTV, Internet, IP broadband and hosted IP voice subscribers, the ongoing erosion of high-margin wireline voice and other legacy revenues, competitive repricing pressures in our residential, business and wholesale markets, as well as the financial impacts of the COVID-19 pandemic. This, combined with further operating efficiencies, enabled by the ongoing deployment of new broadband technologies (fibre and fixed WTTP) and incremental service improvement, is expected to deliver meaningful cost savings and productivity gains across the organization.
ASSUMPTIONS• Continued growth in retail Internet and IPTV subscribers
• Increasing wireless and Internet-based technological substitution
• Continued aggressive residential service bundle offers from cable TV competitors in our local wireline areas
• Continued large business customer migration to IP-based systems
• Ongoing competitive repricing pressures in our business and wholesale markets
• Continued competitive intensity in our small and medium-sized business markets as cable operators and other telecommunications competitors continue to intensify their focus on business customers
• Traditional high-margin product categories challenged by large global cloud and OTT providers of business voice and data solutions expanding into Canada with on-demand services
• Accelerating customer adoption of OTT services resulting in downsizing of TV packages
• Further deployment of direct fibre to more homes and businesses within our wireline footprint and fixed WTTP technology in rural communities
• Growing consumption of OTT TV services and on-demand streaming video, as well as the proliferation of devices, such as tablets, that consume large quantities of bandwidth, will require ongoing capital investment
• Realization of cost savings related to management workforce reductions including attrition and retirements, lower contracted rates from our suppliers, operating efficiencies enabled by a growing direct fibre footprint, changes in consumer behaviour and product innovation, new call centre technology that is enabling self-serve capabilities, and other improvements to the customer service experience
• No material financial, operational or competitive consequences of changes in regulations affecting our wireline business
KEY GROWTH DRIVERS• Expansion of FTTP and WTTP footprints
• Increasing FTTP and WTTP customer penetration
• Higher market share of industry retail Internet and IPTV subscribers
• Increased business customer spending on connectivity services and managed and professional services solutions
• Expansion of our business customer relationships to drive higher revenue per customer
• Ongoing service innovation and product value enhancements
5M
D&
ABu
sine
ss s
egm
ent a
naly
sis
Bell
Wir
elin
e
78 | BCE InC. 2020 AnnuAl REpoRt
PRINCIPAL BUSINESS RISKSThis section discusses certain principal business risks specifically related to the Bell Wireline segment. For a detailed description of the other principal risks that could have a material adverse effect on our business, including those related to the COVID-19 pandemic, refer to section 9, Business risks.
AGGRESSIVE COMPETITION
RISK
• The intensity of competitive activity coupled with new product launches for retail customers (e.g., IoT, smart home systems and devices, innovative TV platforms, etc.) and business customers (e.g., OTT VoIP, collaboration and SD WAN solutions) from national operators, non-traditional players and wholesalers
POTENTIAL IMPACT
• An increase in the intensity level of competitive activity could result in lost revenue, higher churn and increased acquisition and retention expenses, all of which would put pressure on Bell Wireline’s adjusted EBITDA
REGULATORY ENVIRONMENT
RISK
• The CRTC mandates rates for the new disaggregated wholesale high-speed access service available on FTTP facilities that are materially different from the rates we proposed, and which do not sufficiently account for the investment required in these facilities or modifies the network configuration of this new service in a way that materially improves the business position of our competitors
• The CRTC does not materially revise the rates for aggregated wholesale high-speed access service (available on FTTN facilities and the cable facilities of large cable carriers), which rates the CRTC substantially reduced in August 2019 although this reduction is currently stayed by the CRTC pending its final decision on the review and vary applications
POTENTIAL IMPACT
• In respect of the new disaggregated wholesale high-speed access service available on FTTP facilities, the mandating of rates that are materially different from the rates we proposed or the adoption of a network configuration advantageous for our competitors, or the implementation of the rates reduced by the CRTC in August 2019 for aggregated wholesale high-speed access services, could change our investment strategy, especially in relation to investment in next-generation wireline networks in smaller communities and rural areas, improve the business position of our competitors, further accelerate penetration and disintermediation by OTT players, and negatively impact the financial performance of our wireline business
TECHNOLOGICAL ADVANCEMENT AND CHANGING CUSTOMER BEHAVIOUR
RISK
• With technological advancement, the traditional TV viewing model (i.e., the subscription for bundled channels) is challenged by an increasing number of legal and illegal viewing options available in the market offered by traditional, non-traditional and global players, as well as increasing cord-cutting and cord-shaving trends
• The proliferation of network technologies impacts business customers’ decision to migrate to OTT, VoIP and/or leverage SD WAN architecture
• Changing customer habits further contribute to the erosion of NAS lines
POTENTIAL IMPACT
• Our market penetration and number of TV subscribers could decline as a result of offerings by BDUs and an increasing number of domestic and global unregulated OTT providers, as well as a significant volume of content piracy
• The proliferation of IP-based products, including OTT content and OTT software offerings directly to consumers, may accelerate the disconnection of TV services or the reduction of TV spending, as well as the reduction in business IT investments by customers
• The ongoing loss of NAS lines from technological substitution challenges our traditional voice revenues and compels us to develop other service offerings

5M
D&
A
Busi
ness
seg
men
t ana
lysi
s Be
ll M
edia
BCE InC. 2020 AnnuAl REpoRt | 79BCE InC. 2020 AnnuAl REpoRt | 79
5.3 Bell MediaOperating performance was impacted materially in 2020 by reduced advertiser spending across all platforms – TV, radio, out of home and digital –, reflecting lower commercial activity during the COVID-19 pandemic as well as the related impacts on major league sports and other live TV events and programming.
FINANCIAL PERFORMANCE ANALYSIS2020 PERFORMANCE HIGHLIGHTS
Bell MediaRevenues(in $ millions)
Bell MediaAdjusted EBITDA(in $ millions)
19 20
$2,750
$3,217
19 20
$695
$850
Bell MediaRevenue mix(product)
Bell MediaRevenue mix(line of business)
2019
3%
62%
35%2020
3%
57%
40%2019
9%
12%
79%
2020
5%10%
85%
62% Advertising 35% Subscriber 3% Other
57% Advertising 40% Subscriber 3% Other
79% TV 12% Radio 9% OOH
85% TV 10% Radio 5% OOH
BELL MEDIA RESULTS
REVENUES
2020 2019 $ CHANGE % CHANGE
Total external revenues 2,369 2,811 (442) (15.7%)
Inter-segment revenues 381 406 (25) (6.2%)
Total Bell Media revenues 2,750 3,217 (467) (14.5%)
(14.5%) (18.2%)
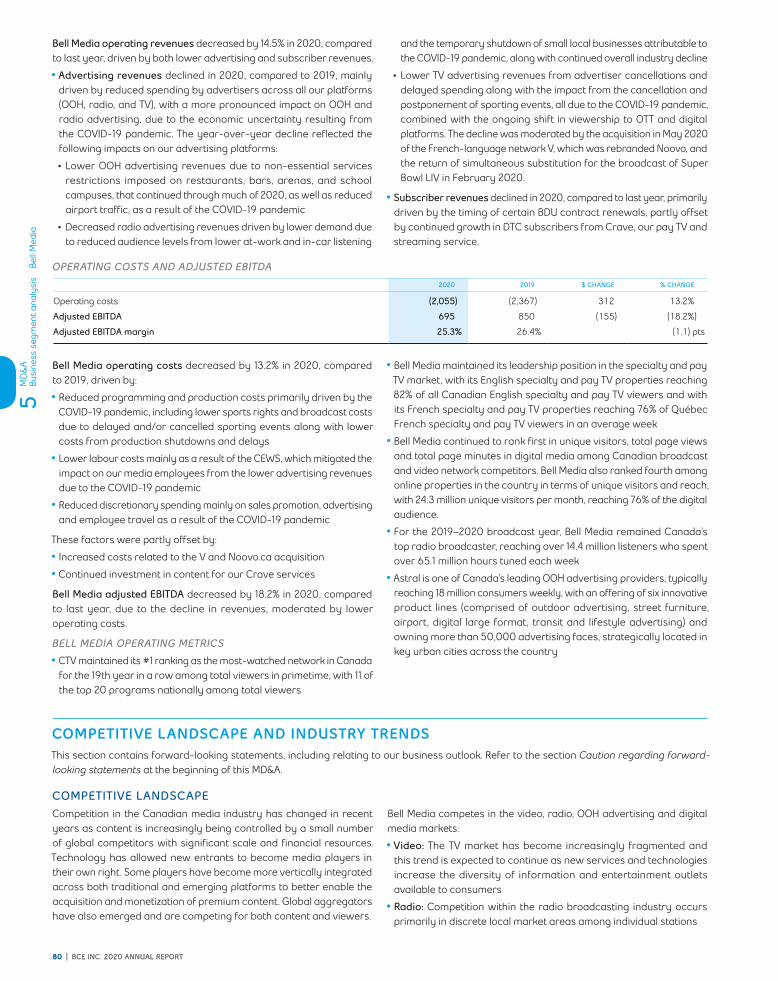
5M
D&
A
Busi
ness
seg
men
t ana
lysi
s Be
ll M
edia
80 | BCE InC. 2020 AnnuAl REpoRt80 | BCE InC. 2020 AnnuAl REpoRt
Bell Media operating revenues decreased by 14.5% in 2020, compared to last year, driven by both lower advertising and subscriber revenues.
• Advertising revenues declined in 2020, compared to 2019, mainly driven by reduced spending by advertisers across all our platforms (OOH, radio, and TV), with a more pronounced impact on OOH and radio advertising, due to the economic uncertainty resulting from the COVID-19 pandemic. The year-over-year decline reflected the following impacts on our advertising platforms:
• Lower OOH advertising revenues due to non-essential services restrictions imposed on restaurants, bars, arenas, and school campuses, that continued through much of 2020, as well as reduced airport traffic, as a result of the COVID-19 pandemic
• Decreased radio advertising revenues driven by lower demand due to reduced audience levels from lower at-work and in-car listening
and the temporary shutdown of small local businesses attributable to the COVID-19 pandemic, along with continued overall industry decline
• Lower TV advertising revenues from advertiser cancellations and delayed spending along with the impact from the cancellation and postponement of sporting events, all due to the COVID-19 pandemic, combined with the ongoing shift in viewership to OTT and digital platforms. The decline was moderated by the acquisition in May 2020 of the French-language network V, which was rebranded Noovo, and the return of simultaneous substitution for the broadcast of Super Bowl LIV in February 2020.
• Subscriber revenues declined in 2020, compared to last year, primarily driven by the timing of certain BDU contract renewals, partly offset by continued growth in DTC subscribers from Crave, our pay TV and streaming service.
OPERATING COSTS AND ADJUSTED EBITDA
2020 2019 $ CHANGE % CHANGE
Operating costs (2,055) (2,367) 312 13.2%
Adjusted EBITDA 695 850 (155) (18.2%)
Adjusted EBITDA margin 25.3% 26.4% (1.1) pts
Bell Media operating costs decreased by 13.2% in 2020, compared to 2019, driven by:
• Reduced programming and production costs primarily driven by the COVID-19 pandemic, including lower sports rights and broadcast costs due to delayed and/or cancelled sporting events along with lower costs from production shutdowns and delays
• Lower labour costs mainly as a result of the CEWS, which mitigated the impact on our media employees from the lower advertising revenues due to the COVID-19 pandemic
• Reduced discretionary spending mainly on sales promotion, advertising and employee travel as a result of the COVID-19 pandemic
These factors were partly offset by:
• Increased costs related to the V and Noovo.ca acquisition
• Continued investment in content for our Crave services
Bell Media adjusted EBITDA decreased by 18.2% in 2020, compared to last year, due to the decline in revenues, moderated by lower operating costs.
BELL MEDIA OPERATING METRICS
• CTV maintained its #1 ranking as the most-watched network in Canada for the 19th year in a row among total viewers in primetime, with 11 of the top 20 programs nationally among total viewers
• Bell Media maintained its leadership position in the specialty and pay TV market, with its English specialty and pay TV properties reaching 82% of all Canadian English specialty and pay TV viewers and with its French specialty and pay TV properties reaching 76% of Québec French specialty and pay TV viewers in an average week
• Bell Media continued to rank first in unique visitors, total page views and total page minutes in digital media among Canadian broadcast and video network competitors. Bell Media also ranked fourth among online properties in the country in terms of unique visitors and reach, with 24.3 million unique visitors per month, reaching 76% of the digital audience.
• For the 2019–2020 broadcast year, Bell Media remained Canada’s top radio broadcaster, reaching over 14.4 million listeners who spent over 65.1 million hours tuned each week
• Astral is one of Canada’s leading OOH advertising providers, typically reaching 18 million consumers weekly, with an offering of six innovative product lines (comprised of outdoor advertising, street furniture, airport, digital large format, transit and lifestyle advertising) and owning more than 50,000 advertising faces, strategically located in key urban cities across the country
COMPETITIVE LANDSCAPE AND INDUSTRY TRENDSThis section contains forward-looking statements, including relating to our business outlook. Refer to the section Caution regarding forward-looking statements at the beginning of this MD&A.
COMPETITIVE LANDSCAPECompetition in the Canadian media industry has changed in recent years as content is increasingly being controlled by a small number of global competitors with significant scale and financial resources. Technology has allowed new entrants to become media players in their own right. Some players have become more vertically integrated across both traditional and emerging platforms to better enable the acquisition and monetization of premium content. Global aggregators have also emerged and are competing for both content and viewers.
Bell Media competes in the video, radio, OOH advertising and digital media markets:
• Video: The TV market has become increasingly fragmented and this trend is expected to continue as new services and technologies increase the diversity of information and entertainment outlets available to consumers
• Radio: Competition within the radio broadcasting industry occurs primarily in discrete local market areas among individual stations
5M
D&
A
Busi
ness
seg
men
t ana
lysi
s Be
ll M
edia
BCE InC. 2020 AnnuAl REpoRt | 81BCE InC. 2020 AnnuAl REpoRt | 81
• OOH: The Canadian OOH advertising industry is fragmented, consisting of a few large companies as well as numerous smaller and local companies operating in a few local markets
• Digital media: Consumers continue to shift their media consumption towards digital and online media, mobile devices and on-demand content, requiring industry players to increase their efforts in digital content and capabilities in order to compete. This trend is also causing advertisers to direct more of their spending to digital and online rather than traditional media. In addition, the number of competitors has increased as more digital and online media companies, including large global companies, enter the market.
The media industry in 2020 was particularly hit hard by the effects of the COVID-19 pandemic. Advertising revenues declined significantly due to the market-wide contraction of demand from COVID-19 restrictions, resulting in campaign cancellations or deferrals. As the year progressed, demand for TV advertising improved with the return of live sporting events and the start of the fall TV season. However, unlike TV, where consumption patterns were less affected by the COVID-19 pandemic, radio and OOH have been slower to rebound due to stay-at-home measures, global travel restrictions and service restrictions imposed on non-essential businesses.
Competitors
TV
• Conventional Canadian TV stations (local and distant signals) and specialty and pay channels, such as those owned by Corus Entertainment Inc. (Corus), Rogers, Québecor and Canadian Broadcasting Corporation (CBC)/Société Radio-Canada
• U.S. conventional TV stations and specialty channels
• OTT streaming providers such as Netflix, Amazon Prime Video, Disney+, Apple TV+, CBS All Access and DAZN
• Video-sharing websites such as YouTube
RADIO
• Large radio operators, such as Rogers, Corus, Cogeco and Stingray Group Inc. that also own and operate radio station clusters in various local markets
• Radio stations in specific local markets
• Satellite radio provider SiriusXM
• Music streaming services such as Spotify and Apple Music
• Music downloading services such as Apple’s iTunes Store
• Other media such as newspapers, local weeklies, TV, magazines, outdoor advertising and the Internet
OOH ADVERTISING
• Large outdoor advertisers, such as Jim Pattison Broadcast Group, Outfront Media, Québecor, Dynamic and Clear Channel Outdoor
• Numerous smaller and local companies operating a limited number of display faces in a few local markets
• Other media such as TV, radio, print media and the Internet
INDUSTRY TRENDS
TECHNOLOGY AND CONSUMER HABITS TRANSFORMING THE WAY TV IS DELIVERED
Technology used in the media industry continues to evolve rapidly, which has led to alternative methods for the distribution, storage and consumption of content. These technological developments have driven and reinforced changes in consumer behaviour as consumers seek more control over when, where and how they consume content. Consumers now have the ability to watch content from a variety of media services on the screen of their choice, including TVs, computers, and mobile devices. The number of Canadian users who are connected to the Internet through their TVs is growing as connection becomes easier and more affordable. Changes in technology and consumer behaviour have resulted in a number of challenges for content aggregators and distributors. Ubiquitous access to content enabled by connected devices introduces risk to traditional distribution platforms by enabling content owners to provide content directly to distributors and consumers, thus bypassing traditional content aggregators.
GROWTH OF ALTERNATIVES TO TRADITIONAL LINEAR TV
Consumers continue to have access to an array of online entertainment and information alternatives that did not previously exist. While traditional linear TV has historically been the only way to access entertainment programming, the increase in alternative entertainment options has led to a fragmentation in consumption habits. Although more time is still spent on traditional linear TV compared to other forms of video consumption, people are increasingly consuming content on their own terms from an assortment of services and in a variety of formats. In particular, today’s viewers are consuming more content online, watching less scheduled programming live, time-shifting original broadcasts through PVRs, viewing more video on mobile devices, and catching up on an expanded library of past programming on-demand. While the majority of households use pure OTT services, like Crave, Netflix, Amazon Prime Video, Disney+ and Apple TV+, to complement linear TV consumption, an increasing number are using these services as alternatives to a traditional linear package.
ESCALATING CONTENT COSTS
Premium video content has become increasingly important to media companies in attracting and retaining viewers and advertisers. This content, including live sports and special events, should continue to draw audiences and advertisers moving forward. Heightened competition for these rights from global competitors, including Netflix, Amazon Prime Video, Disney+ and DAZN, has already resulted in higher program rights costs and may also make it more difficult to secure content, which is a trend that is expected to continue into the future.
MEDIA COMPANIES ARE EVOLVING TO REMAIN COMPETITIVE
In recognition of changing consumer behaviour, media companies are evolving their content and launching their own solutions with the objective of better competing with non-traditional offerings through DTC products such as Bell Media’s bilingual Crave service, Super Écran, TSN and RDS, as well as CTV, Noovo and Discovery, all of which offer streaming on a variety of platforms. Access to live sports and other premium content has become even more important for acquiring and retaining audiences that in turn attract advertisers and subscriber revenue. Therefore, ownership of content and/or long-term agreements with content owners has also become increasingly important to media companies.
5M
D&
A
Busi
ness
seg
men
t ana
lysi
s Be
ll M
edia
82 | BCE InC. 2020 AnnuAl REpoRt82 | BCE InC. 2020 AnnuAl REpoRt
BUSINESS OUTLOOK AND ASSUMPTIONSThis section contains forward-looking statements, including relating to our projected financial performance for 2021 and our 2021 business outlook, objectives, plans and strategic priorities. Refer to the section Caution regarding forward-looking statements at the beginning of this MD&A.
2021 OUTLOOKBell Media’s financial performance is projected to reflect a gradual economic recovery in 2021, which should result in stronger advertiser demand, as well as strategic pricing on advertising sales and subscriber revenue growth. However, the COVID-19 pandemic is expected to continue to negatively affect overall results.
Subscriber revenue performance is projected to reflect the benefits from BDU carriage renewals, and continued scaling of DTC products, including Crave. However, the effects of shifting media consumption towards competing OTT and digital platforms, as well as further TV cord-shaving and cord-cutting, will continue to negatively impact traditional subscriber volumes.
While the advertising market continues to be adversely impacted by cancelled or delayed advertising campaigns from many sectors due to the economic downturn caused by the COVID-19 pandemic, we anticipate a gradual recovery during the year.
We also intend to continue controlling costs by achieving productivity gains and pursuing operational efficiencies across all of our media properties, while continuing to invest in premium content across all screens and platforms.
Across our media properties, particularly in video, we intend to leverage the strength of our market position combined with enhanced audience targeting to continue offering advertisers, both nationally and locally, premium opportunities to reach their target audiences. Success in this area requires that we focus on a number of factors, including: successfully acquiring highly rated programming and differentiated content; building and maintaining strategic supply arrangements for content across all screens and platforms; producing and commissioning high-quality Canadian content, including market-leading news; and further leveraging Bell Media’s smart data Strategic Audience Management (SAM) tool, which helps marketers and planners identify, understand and connect with the right audiences on the right channels, with the addition of new features and functionalities such as best-in-class proprietary data, an improved user experience and a larger pool of available inventory.
With the return of key live sports broadcasts, including from the National Hockey League (NHL), NBA and CFL, our sports video offerings are expected to continue to deliver premium content and exceptional viewing experiences to our TV and DTC audiences. Our sports offerings, combined with the integration of our digital platforms, are integral parts of our strategy to enhance viewership and engagement. We will also continue to focus on creating innovative high-quality productions in the areas of sports news and editorial coverage.
In non-sports specialty TV, audiences and advertising revenues are expected to be driven by investment in quality programming and production. We intend to capitalize on our competitive position in key specialty services to drive revenue growth.
Through Crave, our bilingual TV and streaming service, we will continue to leverage our investments in premium content (including HBO, HBO Max, SHOWTIME and STARZ) in order to attract pay TV and DTC subscribers. We intend to continue expanding platform availability and delivering user experience improvements.
In our French-language TV services, we will continue to optimize our programming with a view to increasing our appeal to audiences, supported in particular by the investment in Noovo News and more French language originals.
In radio, we intend to leverage the strength of our market position to continue offering advertisers, both nationally and locally, premium opportunities to reach their target audiences. Additionally, in conjunction with our local TV properties, we will continue to pursue opportunities that leverage our promotional capabilities, provide an expanded platform for content sharing, and offer other synergistic efficiencies.
In our OOH operations, we plan to leverage the strength of our products to provide advertisers with premium opportunities in key Canadian markets. We will also continue to seek new opportunities in digital markets, including converting certain premium outdoor structures to digital and adding new boards.
ASSUMPTIONS• Overall revenue is expected to reflect a gradual economic recovery
in 2021 combined with subscriber revenue growth and strategic pricing on advertising sales. However, revenue performance is expected to continue to be negatively impacted by the effects of the COVID-19 pandemic on many sectors of the economy.
• Continued escalation of media content costs to secure quality programming, as well as the return of sports and entertainment programming; however, in the short term, savings can still be expected due to production delays, shortened sports seasons, and possible cancellations from the ongoing COVID-19 pandemic
• Continued scaling of Crave through broader content offering and user experience improvements
• Investment in Noovo news and more French-language original content to better serve our French-language customers with a wider array of content, in the language of their choice, on their preferred platforms
• Enhanced market-leading attribution through our SAM tool
• Ability to successfully acquire and produce highly rated programming and differentiated content
• Building and maintaining strategic supply arrangements for content across all screens and platforms
• Continued monetization of content rights and Bell Media properties across all platforms
• No material financial, operational or competitive consequences of changes in regulations affecting our media business

5M
D&
A
Busi
ness
seg
men
t ana
lysi
s Be
ll M
edia
BCE InC. 2020 AnnuAl REpoRt | 83BCE InC. 2020 AnnuAl REpoRt | 83
KEY GROWTH DRIVERS• Gradual economic recovery in 2021, including the return of key live
sports programming and events
• Strategic pricing on advertising sales
• Further integrate the use of our data across our media properties to better inform media planning, activation, and measurement, combined with an improved buying experience for advertisers
• Ongoing growth in BDU rates
• Optimizing unique partnerships and strategic content investments
• Enhancing digital strategy, including scaling of DTC products
• Grow market share and generate revenue from investments in Noovo News and French-language original productions
PRINCIPAL BUSINESS RISKSThis section discusses certain principal business risks specifically related to the Bell Media segment. For a detailed description of the other principal risks that could have a material adverse effect on our business, including those related to the COVID-19 pandemic, refer to section 9, Business risks.
AGGRESSIVE COMPETITION, PIRACY AND REGULATORY CONSTRAINTS
RISK
• The intensity of competitive activity from new technologies and alternative distribution platforms such as unregulated OTT content offerings, VOD, personal video platforms, DTC distribution and pirated content, in addition to traditional TV services, in combination with the development of more aggressive product and sales strategies from non-traditional global players and regulations that require all BDUs to make TV services available à la carte
POTENTIAL IMPACT
• Adverse impact on the level of subscriptions and/or viewership for Bell Media’s TV services and on Bell Media’s revenue streams
ADVERTISING AND SUBSCRIPTION REVENUE UNCERTAINTY
RISK
• Advertising is heavily dependent on economic conditions and viewership, as well as on our ability to grow alternative advertising media such as digital and OOH platforms, in the context of a changing and fragmented advertising market. Conventional media is under increasing pressure for advertising spend against dominant non-traditional/global digital services.
• The advertising market could be further impacted by cancelled/delayed advertising campaigns from many sectors due to the economic downturn during the COVID-19 pandemic
• Bell Media has contracts with a variety of BDUs, under which monthly subscription fees for specialty and pay TV services are earned, that expire on a specific date
POTENTIAL IMPACT
• Economic uncertainty could reduce advertisers’ spending. Our failure to increase or maintain viewership or capture our share of the changing and fragmented advertising market could result in the loss of advertising revenue.
• The COVID-19 pandemic could continue to drive a material decline in advertising revenue across all Bell Media platforms
• If we are not successful in obtaining favourable agreements with BDUs, it could result in the loss of subscription revenue
RISING CONTENT COSTS AND ABILITY TO SECURE KEY CONTENT
RISK
• Rising content costs, as an increasing number of domestic and global competitors seek to acquire the same content or to restrict content within their own ecosystems, and the ability to acquire or develop key differentiated content to drive revenues and subscriber growth.
• Production delays attributable to the COVID-19 pandemic could further pressure our ability to secure key content in the short term.
POTENTIAL IMPACT
• Rising programming costs could require us to incur unplanned expenses, which could result in negative pressure on adjusted EBITDA
• Our inability to acquire or develop popular programming content could adversely affect Bell Media’s viewership and subscription levels and, consequently, advertising and subscription revenues
6M
D&
AFi
nanc
ial a
nd c
apita
l man
agem
ent
84 | BCE InC. 2020 AnnuAl REpoRt
6 Financial and capital managementThis section tells you how we manage our cash and capital resources to carry out our strategy and deliver financial results. It provides an analysis of our financial condition, cash flows and liquidity on a consolidated basis.
6.1 Net debt2020 2019 $ CHANGE % CHANGE
Debt due within one year 2,417 3,881 (1,464) (37.7%)
Long-term debt 23,906 22,415 1,491 6.7%
Preferred shares (1) 2,002 2,002 – –
Cash and cash equivalents (224) (145) (79) (54.5%)
Net debt 28,101 28,153 (52) (0.2%)
(1) 50% of outstanding preferred shares of $4,003 million and $4,004 million in 2020 and 2019, respectively, are classified as debt consistent with the treatment by some credit rating agencies.
The increase of $27 million in total debt, comprised of debt due within one year and long-term debt, was due to:
• the issuance by Bell Canada of Series M-51, Series M-47, Series M-52 and Series M-53 MTN debentures, with total principal amounts of $1,250 million, $1 billion, $1 billion and $750 million in Canadian dollars, respectively
Partly offset by:
• the early redemption of Series M-42, Series M-30 and Series M-24 MTN debentures with total principal amounts of $850 million, $750 million and $500 million in Canadian dollars, respectively
• a decrease in our notes payable (net of issuances) of $1,641 million
• a net decrease of $232 million due to lower lease liabilities and other debt
Additionally, during the first half of 2020, Bell Canada drew $1,450 million in U.S. dollars ($2,035 million in Canadian dollars) under its committed credit facilities. In Q2 2020, Bell Canada repaid all of the U.S. dollar borrowings under such facilities.
The increase in cash and cash equivalents of $79 million was mainly due to:
• $3,348 million of free cash flow
• $892 million of cash from discontinued operations (included in cash flows from investing activities) which includes net proceeds of $933 million (net of debt and other items) from the completion of the sale of substantially all of our data centre operations in Q4 2020
Partly offset by:
• $2,975 million of dividends paid on BCE common shares
• $638 million of debt repayments (net of issuances)
• $263 million for the purchase on the open market of BCE common shares for the settlement of share-based payments
• $93 million for other financing which includes the payments for early debt redemption costs
• $86 million for the acquisition of spectrum licences
• $79 million for other investing activities
6.2 Outstanding share dataCOMMON SHARES OUTSTANDING
NUMBER OF SHARES
Outstanding, January 1, 2020 903,908,182
Shares issued under employee stock option plan 506,828
Outstanding, December 31, 2020 904,415,010
STOCK OPTIONS OUTSTANDINGNUMBER
OF OPTIONSWEIGHTED AVERAGE
EXERCISE PRICE ($)
Outstanding, January 1, 2020 12,825,541 57
Granted 3,420,407 65
Exercised (1) (506,828) 52
Forfeited or expired (88,886) 61
Outstanding, December 31, 2020 15,650,234 59
Exercisable, December 31, 2020 5,186,600 58
(1) The weighted average market share price for options exercised in 2020 was $63.
At March 4, 2021, 904,559,124 common shares and 15,506,120 stock options were outstanding.

6M
D&
AFi
nanc
ial a
nd c
apita
l man
agem
ent
BCE InC. 2020 AnnuAl REpoRt | 85
6.3 Cash flows2020 2019 $ CHANGE % CHANGE
Cash flows from operating activities 7,754 7,958 (204) (2.6%)
Capital expenditures (4,202) (3,974) (228) (5.7%)
Cash dividends paid on preferred shares (132) (147) 15 10.2%
Cash dividends paid by subsidiaries to non-controlling interest (53) (65) 12 18.5%
Acquisition and other costs paid 35 60 (25) (41.7%)
Cash from discontinued operations (included in cash flows from operating activities) (54) (94) 40 42.6%
Free cash flow 3,348 3,738 (390) (10.4%)
Cash from discontinued operations (included in cash flows from operating activities) 54 94 (40) (42.6%)
Business acquisitions (65) (51) (14) (27.5%)
Acquisition and other costs paid (35) (60) 25 41.7%
Acquisition of spectrum licences (86) – (86) n.m.
Other investing activities (79) 7 (86) n.m.
Cash from (used in) discontinued operations (included in cash flows from investing activities) 892 (18) 910 n.m.
Net repayment of debt instruments (638) (1,209) 571 47.2%
Issue of common shares 26 240 (214) (89.2%)
Purchase of shares for settlement of share-based payments (263) (142) (121) (85.2%)
Cash dividends paid on common shares (2,975) (2,819) (156) (5.5%)
Other financing activities (93) (54) (39) (72.2%)
Cash used in discontinued operations (included in cash flows from financing activities) (7) (6) (1) (16.7%)
Net increase (decrease) in cash and cash equivalents 79 (280) 359 n.m.
n.m.: not meaningful
CASH FLOWS FROM OPERATING ACTIVITIES AND FREE CASH FLOWIn 2020, BCE’s cash flows from operating activities decreased by $204 million, compared to 2019, mainly due to lower adjusted EBITDA and higher income taxes paid due to timing of installments, partly offset by higher cash from working capital and lower severance and other costs paid.
Free cash flow decreased by $390 million in 2020, compared to 2019, mainly due to higher capital expenditures and lower cash flows from operating activities, excluding cash from discontinued operations and acquisition and other costs paid.
CAPITAL EXPENDITURES2020 2019 $ CHANGE % CHANGE
Bell Wireless 916 671 (245) (36.5%)
Capital intensity ratio 10.5% 7.5% (3.0) pts
Bell Wireline 3,161 3,195 34 1.1%
Capital intensity ratio 25.9% 25.9% –
Bell Media 125 108 (17) (15.7%)
Capital intensity ratio 4.5% 3.4% (1.1) pts
BCE 4,202 3,974 (228) (5.7%)
Capital intensity ratio 18.4% 16.7% (1.7) pts
BCE capital expenditures totaled $4,202 million in 2020, increasing 5.7% or $228 million over last year, driven by higher spending in Bell Wireless and Bell Media, moderated by reduced spending in Bell Wireline. This resulted in a corresponding capital intensity ratio of 18.4% in 2020, up 1.7 pts compared to the 16.7% achieved in 2019. Capital spending in the year reflected the following:
• Higher capital spending in our wireless segment of $245 million in 2020, compared to last year, primarily driven by our continued network investments with the launch of our mobile 5G network in June 2020 and the continued rollout of our LTE-A network, which at the end of 2020 reached 26% and 96% of the Canadian population, respectively. The COVID-19 pandemic drove increased investment in IT enhancements relating to online fulfillment and capacity expansion to support increased demand.

6M
D&
AFi
nanc
ial a
nd c
apita
l man
agem
ent
86 | BCE InC. 2020 AnnuAl REpoRt
• Reduced capital spending in our wireline segment of $34 million in 2020, compared to 2019, mainly driven by fewer new customer service installations and delayed network construction attributable to the COVID-19 pandemic. We continued to invest in the expansion of our FTTP network to more homes and businesses and the rollout of our fixed WTTP network to rural locations. Additionally, we invested in capacity expansion driven by increased demand due to the COVID-19 pandemic,
along with investments in online fulfillment, customer self-serve and automation tools as well as improved app functionality, also driven by the COVID-19 pandemic.
• Higher capital investments in our media segment of $17 million in 2020, compared to last year, mainly due to the integration of Noovo along with enhancements to network, digital and video platforms
CASH FROM DISCONTINUED OPERATIONS (INCLUDED IN CASH FLOWS FROM INVESTING ACTIVITIES)In 2020, cash from discontinued operations (included in cash flows from investing activities) increased by $910 million mainly due to $933 million (net of debt and other items) received in Q4 2020 from the completion of the sale of substantially all of our data centre operations.
DEBT INSTRUMENTSWe use a combination of short-term and long-term debt to finance our operations. Our short-term debt consists mostly of notes payable under commercial paper programs, loans securitized by trade receivables and bank facilities. We usually pay fixed rates of interest on our long-term debt and floating rates on our short-term debt. As at December 31, 2020, all of our debt was denominated in Canadian dollars with the exception of our commercial paper, and Series US-1 and Series US -2 Notes, which are denominated in U.S. dollars and have been hedged for foreign currency fluctuations through forward currency contracts and cross currency interest rate swaps.
2020We repaid $638 million of debt, net of issuances. This included the repayment (net of issuances) of $1,641 million of notes payable, the early redemption of Series M-42, Series M-30 and Series M-24 MTN debentures with total principal amounts of $850 million, $750 million and $500 million in Canadian dollars, respectively, and net payments of leases and other debt of $897 million, partly offset by the issuance of Series M-51, Series M-47, Series M-52 and Series M-53 MTN debentures, with total principal amounts of $1,250 million, $1 billion, $1 billion and $750 million in Canadian dollars, respectively. Additionally, during the first half of 2020, Bell Canada drew $1,450 million in U.S. dollars ($2,035 million in Canadian dollars) under its committed credit facilities. In Q2 2020, Bell Canada repaid all of the U.S. dollar borrowings under such facilities.
2019We repaid $1,209 million of debt, net of issuances. This included the early redemption of Series M-27 MTN debentures and Series M-37 debentures in the principal amounts of $1 billion and $400 million in Canadian dollars, respectively, the repayments (net of issuances) of $1,073 million of notes payable, and net payments of lease liabilities and other debt of $825 million. These repayments were partly offset by the issuances of Series M-49 and Series M-50 MTN debentures with total principal amounts of $600 million and $550 million in Canadian dollars, respectively, Series US-2 Notes with a total principal amount of $600 million in U.S. dollars ($808 million in Canadian dollars), and an increase in securitized trade receivables of $131 million.
ISSUANCE OF COMMON SHARESThe issuance of common shares in 2020 decreased by $214 million, compared to 2019, mainly due to a lower number of exercised stock options.
CASH DIVIDENDS PAID ON COMMON SHARESIn 2020, cash dividends paid on common shares of $2,975 million increased by $156 million, compared to 2019, due to a higher dividend paid in 2020 of $3.2900 per common share compared to $3.1325 per common share in 2019.
6.4 Post-employment benefit plansFor the year ended December 31, 2020, we recorded an increase in our post-employment benefit plans and a gain, before taxes, in OCI from continuing operations of $687 million. This was due to a higher-than-expected return on plan assets in 2020, partly offset by a lower actual discount rate of 2.6% at December 31, 2020, compared to 3.1% at December 31, 2019.
For the year ended December 31, 2019, we recorded an increase in our post-employment benefit plans and a gain, before taxes, in OCI from continuing operations of $191 million. This was due to a higher-than-expected return on plan assets in 2019, partly offset by a lower actual discount rate of 3.1% at December 31, 2019, compared to 3.8% at December 31, 2018.

6M
D&
AFi
nanc
ial a
nd c
apita
l man
agem
ent
BCE InC. 2020 AnnuAl REpoRt | 87
6.5 Financial risk managementManagement’s objectives are to protect BCE and its subsidiaries on a consolidated basis against material economic exposures and variability of results from various financial risks including credit risk, liquidity risk, foreign currency risk, interest rate risk, commodity price risk, equity price risk and longevity risk. These risks are further described in Note 2, Significant accounting policies, Note 9, Other (expense) income, Note 26, Post-employment benefit plans and Note 28, Financial and capital management in BCE’s 2020 consolidated financial statements.
The following table outlines our financial risks, how we manage these risks and their financial statement classification.
FINANCIAL RISK
DESCRIPTION OF RISK
MANAGEMENT OF RISK AND FINANCIAL STATEMENT CLASSIFICATION
Credit risk We are exposed to credit risk from operating activities and certain financing activities, the maximum exposure of which is represented by the carrying amounts reported in the statements of financial position. We are exposed to credit risk if counterparties to our trade receivables, wireless device financing plan receivables, and derivative instruments are unable to meet their obligations.
• Large and diverse customer base
• Deal with institutions with investment-grade credit ratings
• Regularly monitor our credit risk and exposure
• Our trade receivables and allowance for doubtful accounts balances at December 31, 2020, which both include the current portion of wireless device financing plan receivables, were $3,414 million and $149 million, respectively. The allowance for doubtful accounts reflects an increase of $87 million for the period ended December 31, 2020, mainly as a result of the impact of the COVID-19 pandemic.
• Our contract assets and allowance for doubtful accounts balances at December 31, 2020 were $1,002 million and $59 million, respectively
• Our non-current wireless device financing plan receivables and allowance for doubtful accounts balances at December 31, 2020 were $399 million and $16 million, respectively
Liquidity risk We are exposed to liquidity risk for financial liabilities.
• Sufficient cash from operating activities, possible capital markets financing and committed bank facilities to fund our operations and fulfill our obligations as they become due
• Refer to section 6.7, Liquidity – Contractual obligations, for a maturity analysis of our recognized financial liabilities
Foreign currency risk We are exposed to foreign currency risk related to anticipated transactions and certain foreign currency debt.
A 10% depreciation (appreciation) in the value of the Canadian dollar relative to the U.S. dollar would result in a gain (loss) of $7 million ($19 million) recognized in net earnings from continuing operations at December 31, 2020 and a gain (loss) of $245 million ($215 million) recognized in OCI from continuing operations at December 31, 2020, with all other variables held constant.
A 10% depreciation (appreciation) in the value of the Canadian dollar relative to the Philippine peso would result in a gain (loss) of $4 million recognized in OCI from continuing operations at December 31, 2020, with all other variables held constant.
Refer to the following Fair value section for details on our derivative financial instruments.
• Foreign currency forward contracts and options on our anticipated transactions and commercial paper maturing in 2021 to 2022 of $2.2 billion in U.S. dollars ($2.9 billion in Canadian dollars) and $2.2 billion in Philippine pesos ($59 million in Canadian dollars) at December 31, 2020, to manage foreign currency risk related to anticipated transactions and certain foreign currency debt
• For cash flow hedges, changes in the fair value are recognized in OCI from continuing operations, except for any ineffective portion, which is recognized immediately in earnings in Other (expense) income. Realized gains and losses in Accumulated OCI are reclassified to the income statements or to the initial cost of the non-financial asset in the same periods as the corresponding hedged transactions are recognized.
• For economic hedges, changes in the fair value are recognized in Other (expense) income
• At December 31, 2020, we had outstanding cross currency interest rate swaps with notional amounts of $1,750 million in U.S. dollars ($2,301 million in Canadian dollars) to hedge the U.S. currency exposure of our Series US-1 and Series US-2 Notes maturing in 2048 and 2049, respectively
• For cross currency interest rate swaps, changes in the fair value of these derivatives and the related debt are recognized in Other (expense) income in the income statements and offset, unless a portion of the hedging relationship is ineffective
Interest rate risk We are exposed to risk on the interest rates of our debt, our post-employment benefit plans and on dividend rate resets on our preferred shares.
A 1% increase (decrease) in interest rates would result in an increase (decrease) of $20 million ($26 million) in net earnings from continuing operations at December 31, 2020.
Refer to the following Fair value section for details on our derivative financial instruments.
• We use interest rate swaps to economically hedge dividend rate resets on preferred shares. We also use interest rate locks to hedge the interest rates on future debt issuances.
• In 2020, we entered into interest rate options to economically hedge the dividend rate resets on $582 million of our preferred shares having varying reset dates in 2021
• For interest rate options, changes in the fair value of these derivatives are recognized immediately in Other (expense) income in the income statements
• There were no interest rate locks outstanding as of December 31, 2020
• For our post-employment benefit plans, the interest rate risk is managed using a liability matching approach which reduces the exposure of the DB pension plans to a mismatch between investment growth and obligation growth
6M
D&
AFi
nanc
ial a
nd c
apita
l man
agem
ent
88 | BCE InC. 2020 AnnuAl REpoRt
FINANCIAL RISK
DESCRIPTION OF RISK
MANAGEMENT OF RISK AND FINANCIAL STATEMENT CLASSIFICATION
Equity price risk We are exposed to risk on our cash flow related to the settlement of equity settled share-based compensation plans and the equity price risk related to a cash-settled share-based payment plan.
A 5% increase (decrease) in the market price of BCE’s common shares at December 31, 2020 would result in a gain (loss) of $39 million recognized in net earnings from continuing operations for 2020, with all other variables held constant.
Refer to the following Fair value section for details on our derivative financial instruments.
• Equity forward contracts with a fair value liability of $82 million at December 31, 2020 on BCE’s common shares to economically hedge the cash flow exposure related to the settlement of equity settled share-based compensation plans and the equity price risk related to a cash-settled share-based payment plan
• Changes in the fair value of these derivatives are recorded in the income statements in Operating costs for derivatives used to hedge a cash-settled share-based payment plan and Other (expense) income for derivatives used to hedge equity settled share-based payment plans
Commodity price risk We are exposed to risk on the purchase cost of fuel.
A 25% increase (decrease) in the market price of fuel at December 31, 2020 would result in a gain (loss) of $3 million recognized in net earnings from continuing operations, with all other variables held constant.
Refer to the following Fair value section for details on our derivative financial instruments.
• In 2020, we entered into fuel swaps to economically hedge the purchase cost of fuel in 2020 and 2021. The fair value of our fuel swaps at December 31, 2020 was an asset of $3 million.
• Changes in the fair value of these derivatives are recorded in the income statements in Other (expense) income
Longevity risk We are exposed to life expectancy risk on our post-employment benefit plans.
• The Bell Canada pension plan has an investment arrangement which hedges part of its exposure to potential increases in longevity, which covers approximately $4 billion of post-employment benefit obligations
FAIR VALUEFair value is the price that would be received to sell an asset or paid to transfer a liability in an orderly transaction between market participants at the measurement date.
Certain fair value estimates are affected by assumptions we make about the amount and timing of future cash flows and discount rates, all of which reflect varying degrees of risk. Income taxes and other expenses that may be incurred on disposition of financial instruments are not reflected in the fair values. As a result, the fair values may not be the net amounts that would be realized if these instruments were settled.
The carrying values of our cash and cash equivalents, trade and other receivables, dividends payable, trade payables and accruals, compensation payable, severance and other costs payable, interest payable, notes payable and loans secured by trade receivables approximate fair value as they are short-term. The carrying value of wireless device financing plan receivables approximates fair value given that their average remaining duration is short and the carrying value is reduced by an allowance for doubtful accounts and an allowance for revenue adjustments.
The following table provides the fair value details of other financial instruments measured at amortized cost in the statements of financial position.
DECEMBER 31, 2020 DECEMBER 31, 2019
CLASSIFICATION FAIR VALUE METHODOLOGYCARRYING
VALUEFAIR
VALUECARRYING
VALUEFAIR
VALUE
CRTC deferral account obligation
Trade payables and other liabilities and other non-current liabilities
Present value of estimated future cash flows discounted using observable market interest rates
82 86 82 85
Debt securities and other debt
Debt due within one year and long-term debt
Quoted market price of debt 20,525 24,366 18,653 20,905
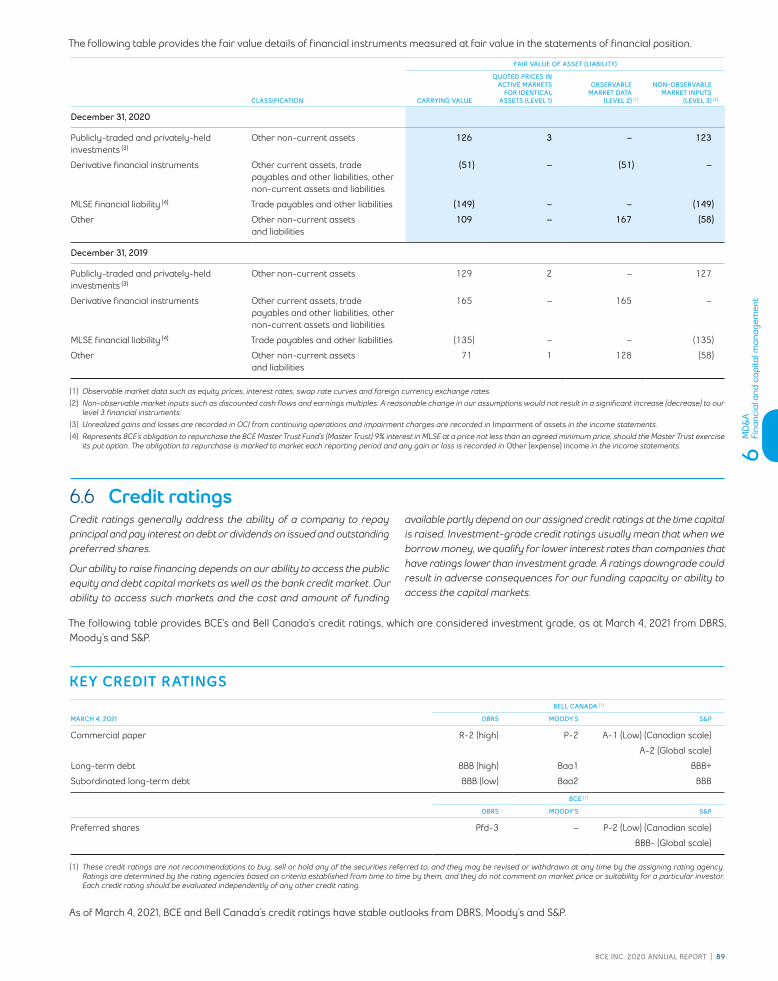
6M
D&
AFi
nanc
ial a
nd c
apita
l man
agem
ent
BCE InC. 2020 AnnuAl REpoRt | 89
The following table provides the fair value details of financial instruments measured at fair value in the statements of financial position.
FAIR VALUE OF ASSET (LIABILITY)
CLASSIFICATION CARRYING VALUE
QUOTED PRICES IN ACTIVE MARKETS
FOR IDENTICAL ASSETS (LEVEL 1)
OBSERVABLE MARKET DATA
(LEVEL 2) (1)
NON-OBSERVABLE MARKET INPUTS
(LEVEL 3) (2)
December 31, 2020
Publicly-traded and privately-held investments (3)
Other non-current assets 126 3 – 123
Derivative financial instruments Other current assets, trade payables and other liabilities, other non-current assets and liabilities
(51) – (51) –
MLSE financial liability (4) Trade payables and other liabilities (149) – – (149)
Other Other non-current assets and liabilities
109 – 167 (58)
December 31, 2019
Publicly-traded and privately-held investments (3)
Other non-current assets 129 2 – 127
Derivative financial instruments Other current assets, trade payables and other liabilities, other non-current assets and liabilities
165 – 165 –
MLSE financial liability (4) Trade payables and other liabilities (135) – – (135)
Other Other non-current assets and liabilities
71 1 128 (58)
(1) Observable market data such as equity prices, interest rates, swap rate curves and foreign currency exchange rates.(2) Non-observable market inputs such as discounted cash flows and earnings multiples. A reasonable change in our assumptions would not result in a significant increase (decrease) to our
level 3 financial instruments.(3) Unrealized gains and losses are recorded in OCI from continuing operations and impairment charges are recorded in Impairment of assets in the income statements.(4) Represents BCE’s obligation to repurchase the BCE Master Trust Fund’s (Master Trust) 9% interest in MLSE at a price not less than an agreed minimum price, should the Master Trust exercise
its put option. The obligation to repurchase is marked to market each reporting period and any gain or loss is recorded in Other (expense) income in the income statements.
6.6 Credit ratingsCredit ratings generally address the ability of a company to repay principal and pay interest on debt or dividends on issued and outstanding preferred shares.
Our ability to raise financing depends on our ability to access the public equity and debt capital markets as well as the bank credit market. Our ability to access such markets and the cost and amount of funding
available partly depend on our assigned credit ratings at the time capital is raised. Investment-grade credit ratings usually mean that when we borrow money, we qualify for lower interest rates than companies that have ratings lower than investment grade. A ratings downgrade could result in adverse consequences for our funding capacity or ability to access the capital markets.
The following table provides BCE’s and Bell Canada’s credit ratings, which are considered investment grade, as at March 4, 2021 from DBRS, Moody’s and S&P.
KEY CREDIT RATINGSBELL CANADA (1)
MARCH 4, 2021 DBRS MOODY’S S&P
Commercial paper R-2 (high) P-2 A-1 (Low) (Canadian scale)
A-2 (Global scale)
Long-term debt BBB (high) Baa1 BBB+
Subordinated long-term debt BBB (low) Baa2 BBB
BCE (1)
DBRS MOODY’S S&P
Preferred shares Pfd-3 – P-2 (Low) (Canadian scale)
BBB- (Global scale)
(1) These credit ratings are not recommendations to buy, sell or hold any of the securities referred to, and they may be revised or withdrawn at any time by the assigning rating agency. Ratings are determined by the rating agencies based on criteria established from time to time by them, and they do not comment on market price or suitability for a particular investor. Each credit rating should be evaluated independently of any other credit rating.
As of March 4, 2021, BCE and Bell Canada’s credit ratings have stable outlooks from DBRS, Moody’s and S&P.

6M
D&
AFi
nanc
ial a
nd c
apita
l man
agem
ent
90 | BCE InC. 2020 AnnuAl REpoRt
6.7 LiquidityThis section contains forward-looking statements, including relating to the sources of liquidity we expect to use to meet our 2021 cash requirements. Refer to the section Caution regarding forward-looking statements at the beginning of this MD&A.
SOURCES OF LIQUIDITYTotal available liquidity at December 31, 2020 was $3.8 billion, comprised of $224 million in cash and cash equivalents, $400 million available under our securitized trade receivable programs and $3.15 billion available under our $3.5 billion committed bank credit facilities (given $349 million of commercial paper outstanding).
We expect that our available liquidity, 2021 estimated cash flows from operations and capital markets financing, including commercial paper, will permit us to meet our cash requirements in 2021 for capital expenditures, post-employment benefit plans funding, dividend payments, the payment of contractual obligations, maturing debt, ongoing operations and other cash requirements.
Should our 2021 cash requirements exceed our cash and cash equivalents balance, cash generated from our operations, and funds raised under
capital markets financings and our securitized trade receivable programs, we would expect to cover such a shortfall by drawing under committed credit facilities that are currently in place or through new facilities to the extent available.
In 2021, our cash flows from operations, cash and cash equivalents balance, capital markets financings, securitized trade receivable programs and credit facilities should give us flexibility in carrying out our plans for business growth, including business acquisitions and spectrum auctions, as well as for the payment of contingencies.
We continuously monitor the rapidly changing COVID-19 pandemic for impacts on operations, capital markets and the Canadian economy with the objective of maintaining adequate liquidity.
The table below is a summary of our total bank credit facilities at December 31, 2020.
DECEMBER 31, 2020TOTAL
AVAILABLE DRAWNLETTERS
OF CREDIT
COMMERCIAL PAPER
OUTSTANDINGNET
AVAILABLE
Committed credit facilities
Unsecured revolving and expansion credit facilities (1) (2) 3,500 – – 349 3,151
Other 106 – 106 – –
Total committed credit facilities 3,606 – 106 349 3,151
Total non-committed credit facilities 1,939 – 1,082 – 857
Total committed and non-committed credit facilities 5,545 – 1,188 349 4,008
(1) Bell Canada’s $2.5 billion committed revolving credit facility expires in November 2024 and its $1 billion committed expansion credit facility expires in November 2022.(2) As of December 31, 2020, Bell Canada’s outstanding commercial paper included $274 million in U.S. dollars ($349 million in Canadian dollars). All of Bell Canada’s commercial paper
outstanding is included in debt due within one year.
Bell Canada may issue notes under its Canadian and U.S. commercial paper programs up to the maximum aggregate principal amount of $3 billion in either Canadian or U.S. currency provided that at no time shall such maximum amount of notes exceed $3.5 billion in Canadian currency which equals the aggregate amount available under Bell Canada’s committed supporting revolving and expansion credit facilities as at December 31, 2020. The total amount of the net available committed revolving and expansion credit facilities may be drawn at any time.
Some of our credit agreements require us to meet specific financial ratios and to offer to repay and cancel the credit agreements upon a change of control of BCE or Bell Canada. In addition, some of our debt agreements require us to offer to repurchase certain series of debt securities upon the occurrence of a change of control event as defined in the relevant debt agreements. We are in compliance with all conditions and restrictions under such agreements.
CASH REQUIREMENTSCAPITAL EXPENDITURESIn 2021, our planned capital spending will be focused on our strategic imperatives, reflecting an appropriate level of investment in our networks and services. On February 4, 2021, Bell announced a capital investment acceleration of $1 billion to $1.2 billion over the next two years to roll out its fibre, rural Wireless Home Internet and 5G networks to even more Canadians of which approximately $700 million is expected to be invested in 2021. The investment acceleration will be substantially funded by the $933 million of proceeds (net of debt and other items) received in 2020 from the sale of substantially all of our data centre operations.
POST-EMPLOYMENT BENEFIT PLANS FUNDINGOur post-employment benefit plans include DB pension and defined contribution (DC) pension plans, as well as other post-employment benefits (OPEBs) plans. The funding requirements of our post-employment benefit plans, resulting from valuations of our plan assets and liabilities, depend on a number of factors, including actual returns on post-employment benefit plan assets, long-term interest rates, plan demographics, and applicable regulations and actuarial standards. Our expected funding for 2021 is detailed in the following table and is subject to actuarial valuations that will be completed in mid-2021. Actuarial valuations were last performed for our significant post-employment benefit plans as at December 31, 2019.

6M
D&
AFi
nanc
ial a
nd c
apita
l man
agem
ent
BCE InC. 2020 AnnuAl REpoRt | 91
2021 EXPECTED FUNDING TOTAL
DB pension plans 180
DC pension plans 120
OPEBs 70
Total net post-employment benefit plans 370
DIVIDEND PAYMENTSIn 2021, the cash dividends to be paid on BCE’s common shares are expected to be higher than in 2020 as BCE’s annual common share dividend increased by 5.1% to $3.50 per common share from $3.33 per common share effective with the dividend payable on April 15, 2021. The declaration of dividends is subject to the discretion of the BCE Board.
CONTRACTUAL OBLIGATIONSThe following table is a summary of our contractual obligations at December 31, 2020 that are due in each of the next five years and thereafter.
AT DECEMBER 31, 2020 2021 2022 2023 2024 2025THERE- AFTER TOTAL
Recognized financial liabilities
Long-term debt 221 1,785 1,665 1,278 2,125 13,540 20,614
Notes payable 392 – – – – – 392
Lease liabilities (1) 921 832 611 459 406 2,077 5,306
Loan secured by trade receivables 1,050 – – – – – 1,050
Interest payable on long-term debt, notes payable and loan secured by trade receivables 844 824 756 693 641 7,623 11,381
Net (receipts) payments on cross currency basis swaps (1) (1) – – – 64 62
MLSE financial liability 149 – – – – – 149
Commitments (off-balance sheet)
Commitments for property, plant and equipment and intangible assets 975 835 608 416 250 352 3,436
Purchase obligations 545 479 331 225 144 269 1,993
Leases committed not yet commenced 2 2 1 1 – – 6
Total 5,098 4,756 3,972 3,072 3,566 23,925 44,389
(1) Includes imputed interest of $950 million.
Our commitments for property, plant and equipment and intangible assets include program and feature film rights and investments to expand and update our networks to meet customer demand.
Purchase obligations consist of contractual obligations under service and product contracts for operating expenditures and other purchase obligations.
Our commitments for leases not yet commenced include OOH advertising spaces and real estate. These leases are non-cancellable.
INDEMNIFICATIONS AND GUARANTEES (OFF-BALANCE SHEET)As a regular part of our business, we enter into agreements that provide for indemnifications and guarantees to counterparties in transactions involving business dispositions, sales of assets, sales of services, purchases and development of assets, securitization agreements and leases. While some of the agreements specify a maximum potential exposure, many do not specify a maximum amount or termination date.
We cannot reasonably estimate the maximum potential amount we could be required to pay counterparties because of the nature of almost all of these indemnifications and guarantees. As a result, we cannot determine how they could affect our future liquidity, capital resources or credit risk profile. We have not made any significant payments under indemnifications or guarantees in the past.
LITIGATIONIn the ordinary course of our business, we become involved in various claims and legal proceedings seeking monetary damages and other relief. In particular, because of the nature of our consumer-facing business, we are exposed to class actions pursuant to which substantial monetary damages may be claimed. Due to the inherent risks and uncertainties of the litigation process, we cannot predict the final outcome or timing of claims and legal proceedings. Subject to the foregoing, and based on information currently available and management’s assessment of the
merits of the claims and legal proceedings pending at March 4, 2021, management believes that the ultimate resolution of these claims and legal proceedings is unlikely to have a material and negative effect on our financial statements or operations. We believe that we have strong defences and we intend to vigorously defend our positions.
For a description of important legal proceedings pending at March 4, 2021, please see the section entitled Legal proceedings contained in the BCE 2020 AIF.

7M
D&
A
Sele
cted
ann
ual a
nd q
uart
erly
info
rmat
ion
92 | BCE InC. 2020 AnnuAl REpoRt
7 Selected annual and quarterly information
7.1 Annual financial informationThe following table shows selected consolidated financial data of BCE for 2020, 2019 and 2018 based on the annual consolidated financial statements, which are prepared in accordance with IFRS as issued by the International Accounting Standards Board (IASB). We discuss the factors that caused our results to vary over the past two years throughout this MD&A.
The emergency measures put in place in Canada to combat the COVID-19 pandemic significantly disrupted retail and commercial activities across most sectors of the economy and had an adverse and pervasive impact on our financial and operating performance throughout most of 2020. Consequently, this unfavourably affected all three of our segments, with a more pronounced impact on our Bell Wireless and Bell Media segments. See section 1, Overview – COVID-19, in this MD&A for more details.
On June 1, 2020, BCE announced that it had entered into an agreement to sell substantially all of its data centre operations in an all-cash transaction valued at $1.04 billion. We have reclassified amounts related to the sale for the previous years to discontinued operations in our consolidated income statements and consolidated statements of cash flows to make them consistent with the presentation for the current
year. Property, plant and equipment and intangible assets that were sold were no longer depreciated or amortized effective June 1, 2020. In Q4 2020, we completed the sale for proceeds of $933 million (net of debt and other items) and recorded a gain on sale, net of taxes, of $211 million. The capital gain as a result of the sale is mainly offset by the recognition of previously unrecognized capital loss carry forwards.
In 2020, we updated our definitions of adjusted net earnings, adjusted EPS and free cash flow to exclude the impacts of discontinued operations as they may affect the comparability of our financial results and could potentially distort the analysis of trends in business performance. As a result of this change, prior periods have been restated for comparative purposes. See section 10.2, Non-GAAP financial measures and key performance indicators (KPIs), in this MD&A for more details.
As required, we adopted IFRS 16 – Leases effective January 1, 2019. We adopted IFRS 16 using a modified retrospective approach whereby the financial statements of prior periods presented were not restated and continue to be reported under IAS 17 – Leases, as permitted by the specific transition provisions of IFRS 16. The cumulative effect of the initial adoption of IFRS 16 was reflected as an adjustment to the deficit at January 1, 2019.
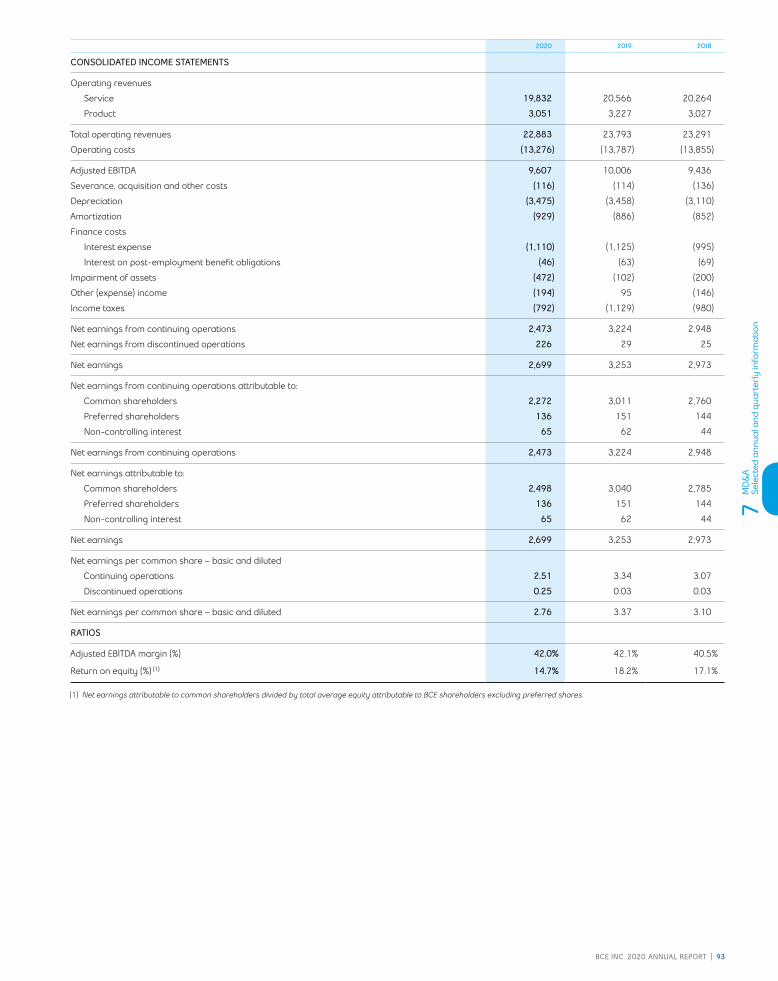
7M
D&
A
Sele
cted
ann
ual a
nd q
uart
erly
info
rmat
ion
BCE InC. 2020 AnnuAl REpoRt | 93
2020 2019 2018
CONSOLIDATED INCOME STATEMENTS
Operating revenues
Service 19,832 20,566 20,264
Product 3,051 3,227 3,027
Total operating revenues 22,883 23,793 23,291
Operating costs (13,276) (13,787) (13,855)
Adjusted EBITDA 9,607 10,006 9,436
Severance, acquisition and other costs (116) (114) (136)
Depreciation (3,475) (3,458) (3,110)
Amortization (929) (886) (852)
Finance costs
Interest expense (1,110) (1,125) (995)
Interest on post-employment benefit obligations (46) (63) (69)
Impairment of assets (472) (102) (200)
Other (expense) income (194) 95 (146)
Income taxes (792) (1,129) (980)
Net earnings from continuing operations 2,473 3,224 2,948
Net earnings from discontinued operations 226 29 25
Net earnings 2,699 3,253 2,973
Net earnings from continuing operations attributable to:
Common shareholders 2,272 3,011 2,760
Preferred shareholders 136 151 144
Non-controlling interest 65 62 44
Net earnings from continuing operations 2,473 3,224 2,948
Net earnings attributable to:
Common shareholders 2,498 3,040 2,785
Preferred shareholders 136 151 144
Non-controlling interest 65 62 44
Net earnings 2,699 3,253 2,973
Net earnings per common share – basic and diluted
Continuing operations 2.51 3.34 3.07
Discontinued operations 0.25 0.03 0.03
Net earnings per common share – basic and diluted 2.76 3.37 3.10
RATIOS
Adjusted EBITDA margin (%) 42.0% 42.1% 40.5%
Return on equity (%) (1) 14.7% 18.2% 17.1%
(1) Net earnings attributable to common shareholders divided by total average equity attributable to BCE shareholders excluding preferred shares.

7M
D&
A
Sele
cted
ann
ual a
nd q
uart
erly
info
rmat
ion
94 | BCE InC. 2020 AnnuAl REpoRt
2020 2019 2018
CONSOLIDATED STATEMENTS OF FINANCIAL POSITION
Property, plant and equipment 27,513 27,636 24,844
Total assets 60,665 60,146 57,100
Debt due within one year (including notes payable and loans secured by trade receivables) 2,417 3,881 4,645
Long-term debt 23,906 22,415 19,760
Total non-current liabilities 31,065 28,961 25,982
Equity attributable to BCE shareholders 20,989 21,074 20,363
Total equity 21,329 21,408 20,689
CONSOLIDATED STATEMENTS OF CASH FLOWS
Cash flows from operating activities 7,754 7,958 7,384
Cash flows used in investing activities (3,540) (4,036) (4,386)
Capital expenditures (4,202) (3,974) (3,956)
Business acquisitions (65) (51) (395)
Cash from (used in) discontinued operations 892 (18) (15)
Cash flows used in financing activities (4,135) (4,202) (3,198)
Issue of common shares 26 240 11
Net (repayment) issuance of debt instruments (638) (1,209) 160
Cash dividends paid on common shares (2,975) (2,819) (2,679)
Cash dividends paid on preferred shares (132) (147) (149)
Cash dividends paid by subsidiaries to non-controlling interest (53) (65) (16)
Free cash flow 3,348 3,738 3,489
SHARE INFORMATION
Average number of common shares (millions) 904.3 900.8 898.6
Common shares outstanding at end of year (millions) 904.4 903.9 898.2
Market capitalization (1) 49,226 54,379 48,440
Dividends declared per common share (dollars) 3.33 3.17 3.02
Dividends declared on common shares (3,011) (2,857) (2,712)
Dividends declared on preferred shares (136) (151) (144)
Closing market price per common share (dollars) 54.43 60.16 53.93
Total shareholder return (4.1%) 17.5% (5.6%)
RATIOS
Capital intensity (%) 18.4% 16.7% 17.0%
Price to earnings ratio (times) (2) 19.72 17.85 17.40
OTHER DATA
Number of employees (thousands) 51 52 53
(1) BCE’s common share price at the end of the year multiplied by the number of common shares outstanding at the end of the year.(2) BCE’s common share price at the end of the year divided by EPS.

7M
D&
A
Sele
cted
ann
ual a
nd q
uart
erly
info
rmat
ion
BCE InC. 2020 AnnuAl REpoRt | 95
7.2 Quarterly financial informationThe following table shows selected BCE consolidated financial data by quarter for 2020 and 2019. This quarterly information is unaudited but has been prepared on the same basis as the annual consolidated financial statements. We discuss the factors that caused our results to vary over the past eight quarters throughout this MD&A. Refer to section 1, Overview – COVID-19, in this MD&A for a description of the impacts of the COVID-19 pandemic on our financial results during 2020.
2020 2019
Q4 Q3 Q2 Q1 Q4 Q3 Q2 Q1
Operating revenues
Service 5,090 4,924 4,800 5,018 5,235 5,141 5,190 5,000
Product 1,012 863 554 622 1,040 799 699 689
Total operating revenues 6,102 5,787 5,354 5,640 6,275 5,940 5,889 5,689
Adjusted EBITDA 2,404 2,454 2,331 2,418 2,484 2,568 2,572 2,382
Severance, acquisition and other costs (52) (26) (22) (16) (28) (23) (39) (24)
Depreciation (872) (876) (869) (858) (854) (852) (879) (873)
Amortization (233) (232) (234) (230) (224) (225) (220) (217)
Finance costs
Interest expense (274) (279) (280) (277) (285) (280) (279) (281)
Interest on post-employment benefit obligations (11) (12) (11) (12) (16) (16) (15) (16)
Impairment of assets (12) (4) (449) (7) (96) (1) (1) (4)
Other (expense) income (38) (29) (80) (47) (18) 62 (54) 105
Income taxes (191) (262) (96) (243) (245) (319) (275) (290)
Net earnings from continuing operations 721 734 290 728 718 914 810 782
Net earnings from discontinued operations 211 6 4 5 5 8 7 9
Net earnings 932 740 294 733 723 922 817 791
Net earnings from continuing operations attributable to common shareholders 678 686 233 675 667 859 754 731
Net earnings attributable to common shareholders 889 692 237 680 672 867 761 740
Net earnings per common share – basic and diluted
Continuing operations 0.75 0.76 0.26 0.74 0.73 0.96 0.84 0.81
Discontinued operations 0.23 0.01 – 0.01 0.01 – 0.01 0.01
Net earnings per common share – basic and diluted 0.98 0.77 0.26 0.75 0.74 0.96 0.85 0.82
Weighted average number of common shares outstanding – basic (millions) 904.4 904.3 904.3 904.1 903.8 901.4 899.5 898.4
OTHER INFORMATION
Cash flows from operating activities 1,631 2,110 2,562 1,451 2,091 2,258 2,093 1,516
Free cash flow 92 1,034 1,611 611 874 1,169 1,076 619
Capital expenditures (1,494) (1,031) (900) (777) (1,150) (1,009) (967) (848)
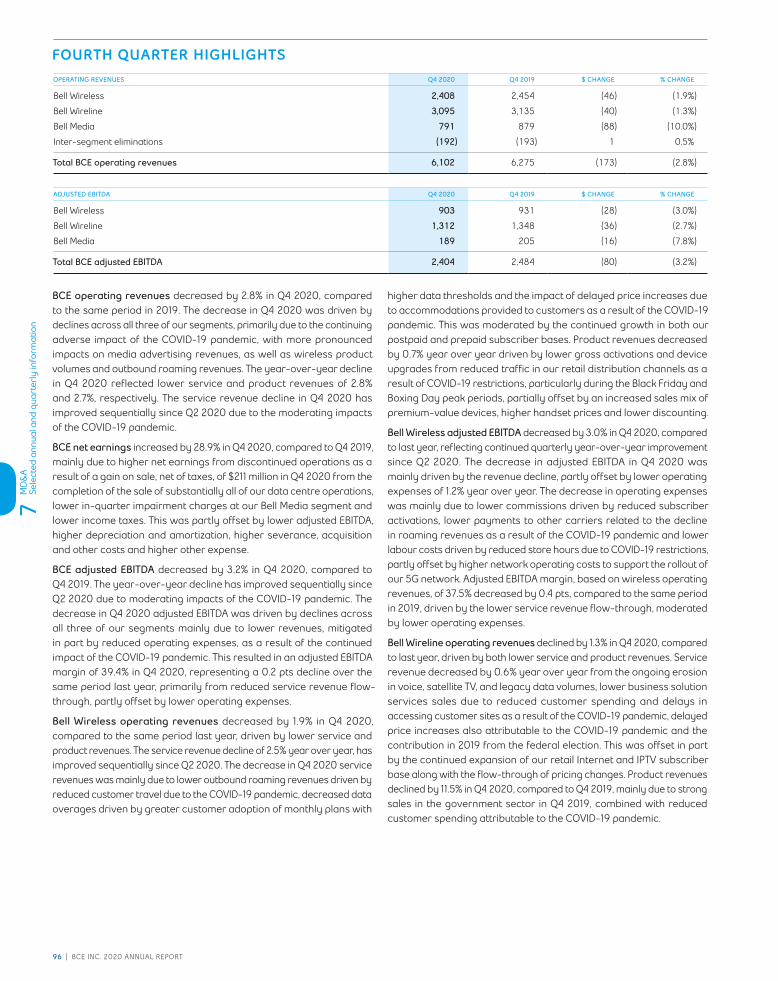
7M
D&
A
Sele
cted
ann
ual a
nd q
uart
erly
info
rmat
ion
96 | BCE InC. 2020 AnnuAl REpoRt
FOURTH QUARTER HIGHLIGHTSOPERATING REVENUES Q4 2020 Q4 2019 $ CHANGE % CHANGE
Bell Wireless 2,408 2,454 (46) (1.9%)
Bell Wireline 3,095 3,135 (40) (1.3%)
Bell Media 791 879 (88) (10.0%)
Inter-segment eliminations (192) (193) 1 0.5%
Total BCE operating revenues 6,102 6,275 (173) (2.8%)
ADJUSTED EBITDA Q4 2020 Q4 2019 $ CHANGE % CHANGE
Bell Wireless 903 931 (28) (3.0%)
Bell Wireline 1,312 1,348 (36) (2.7%)
Bell Media 189 205 (16) (7.8%)
Total BCE adjusted EBITDA 2,404 2,484 (80) (3.2%)
BCE operating revenues decreased by 2.8% in Q4 2020, compared to the same period in 2019. The decrease in Q4 2020 was driven by declines across all three of our segments, primarily due to the continuing adverse impact of the COVID-19 pandemic, with more pronounced impacts on media advertising revenues, as well as wireless product volumes and outbound roaming revenues. The year-over-year decline in Q4 2020 reflected lower service and product revenues of 2.8% and 2.7%, respectively. The service revenue decline in Q4 2020 has improved sequentially since Q2 2020 due to the moderating impacts of the COVID-19 pandemic.
BCE net earnings increased by 28.9% in Q4 2020, compared to Q4 2019, mainly due to higher net earnings from discontinued operations as a result of a gain on sale, net of taxes, of $211 million in Q4 2020 from the completion of the sale of substantially all of our data centre operations, lower in-quarter impairment charges at our Bell Media segment and lower income taxes. This was partly offset by lower adjusted EBITDA, higher depreciation and amortization, higher severance, acquisition and other costs and higher other expense.
BCE adjusted EBITDA decreased by 3.2% in Q4 2020, compared to Q4 2019. The year-over-year decline has improved sequentially since Q2 2020 due to moderating impacts of the COVID-19 pandemic. The decrease in Q4 2020 adjusted EBITDA was driven by declines across all three of our segments mainly due to lower revenues, mitigated in part by reduced operating expenses, as a result of the continued impact of the COVID-19 pandemic. This resulted in an adjusted EBITDA margin of 39.4% in Q4 2020, representing a 0.2 pts decline over the same period last year, primarily from reduced service revenue flow-through, partly offset by lower operating expenses.
Bell Wireless operating revenues decreased by 1.9% in Q4 2020, compared to the same period last year, driven by lower service and product revenues. The service revenue decline of 2.5% year over year, has improved sequentially since Q2 2020. The decrease in Q4 2020 service revenues was mainly due to lower outbound roaming revenues driven by reduced customer travel due to the COVID-19 pandemic, decreased data overages driven by greater customer adoption of monthly plans with
higher data thresholds and the impact of delayed price increases due to accommodations provided to customers as a result of the COVID-19 pandemic. This was moderated by the continued growth in both our postpaid and prepaid subscriber bases. Product revenues decreased by 0.7% year over year driven by lower gross activations and device upgrades from reduced traffic in our retail distribution channels as a result of COVID-19 restrictions, particularly during the Black Friday and Boxing Day peak periods, partially offset by an increased sales mix of premium-value devices, higher handset prices and lower discounting.
Bell Wireless adjusted EBITDA decreased by 3.0% in Q4 2020, compared to last year, reflecting continued quarterly year-over-year improvement since Q2 2020. The decrease in adjusted EBITDA in Q4 2020 was mainly driven by the revenue decline, partly offset by lower operating expenses of 1.2% year over year. The decrease in operating expenses was mainly due to lower commissions driven by reduced subscriber activations, lower payments to other carriers related to the decline in roaming revenues as a result of the COVID-19 pandemic and lower labour costs driven by reduced store hours due to COVID-19 restrictions, partly offset by higher network operating costs to support the rollout of our 5G network. Adjusted EBITDA margin, based on wireless operating revenues, of 37.5% decreased by 0.4 pts, compared to the same period in 2019, driven by the lower service revenue flow-through, moderated by lower operating expenses.
Bell Wireline operating revenues declined by 1.3% in Q4 2020, compared to last year, driven by both lower service and product revenues. Service revenue decreased by 0.6% year over year from the ongoing erosion in voice, satellite TV, and legacy data volumes, lower business solution services sales due to reduced customer spending and delays in accessing customer sites as a result of the COVID-19 pandemic, delayed price increases also attributable to the COVID-19 pandemic and the contribution in 2019 from the federal election. This was offset in part by the continued expansion of our retail Internet and IPTV subscriber base along with the flow-through of pricing changes. Product revenues declined by 11.5% in Q4 2020, compared to Q4 2019, mainly due to strong sales in the government sector in Q4 2019, combined with reduced customer spending attributable to the COVID-19 pandemic.

7M
D&
A
Sele
cted
ann
ual a
nd q
uart
erly
info
rmat
ion
BCE InC. 2020 AnnuAl REpoRt | 97
Bell Wireline adjusted EBITDA declined by 2.7% in Q4 2020, compared to Q4 2019, driven by lower revenues, offset in part by reduced operating costs. The decrease in operating costs was mainly due to lower product cost of goods sold and programming and content costs relating to the revenue decline, along with labour savings mainly attributable to vendor contract savings, as well as lower employee travel due to the COVID-19 pandemic. This was offset in part by higher costs related to the COVID-19 pandemic, mainly from employee redeployment, purchase of PPE, and incremental building cleaning and supplies, along with higher advertising spend to drive greater activations in the quarter. Adjusted EBITDA margin of 42.4% in Q4 2020 decreased by 0.6 pts compared to last year, reflecting lower service revenue flow-through.
Bell Media operating revenue decline of 10.0% in Q4 2020, compared to the same period last year, improved sequentially since Q2 2020, mainly due to higher demand by TV advertisers. The Q4 2020 year-over-year decline was driven by lower advertising revenues mainly due to the continuing but moderating impact of the COVID-19 pandemic resulting in reduced spending by advertisers across all platforms from the economic uncertainty and delayed and/or cancelled sporting events (delayed start of the NHL and NBA 2020/2021 season and cancellation of the CFL season). This decline was mitigated in part by the contribution from the V acquisition to conventional TV advertising revenue. Subscriber revenues also declined year over year primarily due to the renewal in Q4 2019 of certain BDU contracts, partly offset by continued growth in subscribers from DTC Crave and sports streaming services.
Bell Media adjusted EBITDA decreased by 7.8% in Q4 2020, compared to the same period last year, which continued to improve on a sequential quarterly basis. The year-over-year decline was due to lower revenues, moderated by reduced operating costs. The year-over-year decrease in operating costs was mainly driven by lower programming and production costs attributable to the COVID-19 pandemic from reduced sports rights and broadcasting costs due to delays and/or cancellations of sporting events along with lower foreign and Canadian programming costs from production shutdowns and delays. This decline in operating expenses was offset in part by higher costs related to the V and Noovo.ca acquisition.
BCE capital expenditures of $1,494 million grew by 29.9%, or $344 million in Q4 2020, compared to the same period last year. This resulted in a corresponding capital intensity ratio of 24.5% in the quarter, up 6.2 pts compared to 18.3% achieved in Q4 2019. Capital spending ramped up in Q4 2020 due to greater construction activity following the slower pace of spending earlier in the year as a result of the COVID-19 pandemic. The year-over-year increase was driven by greater spending across all three of our segments. Wireless capital spending increased by $189 million year over year, primarily due to the ongoing deployment of our mobile 5G network. Wireline capital investments grew by $143 million year over year, mainly due to the timing of our spending, as we continued to roll out our FTTP and WTTP networks to more locations. Bell Media capital spending was $12 million higher year over year, due to the integration of Noovo combined with network and digital platform enhancements.
BCE severance, acquisition and other costs of $52 million in Q4 2020 increased by $24 million, compared to Q4 2019, mainly due to higher acquisition and other costs, partly offset by lower severance costs.
BCE depreciation of $872 million in Q4 2020 increased by $18 million, year over year, mainly due to a higher asset base as we continued to invest in our broadband and wireless networks as well as our IPTV services.
BCE amortization of $233 million in Q4 2020 increased by $9 million, year over year, mainly due to a higher asset base.
BCE interest expense of $274 million in Q4 2020 decreased by $11 million, compared to Q4 2019, mainly due to lower average interest rates, partly offset by higher average debt levels.
BCE impairment of assets of $12 million in Q4 2020 decreased by $84 million, year over year, mainly due to lower in-quarter impairment charges at our Bell Media segment.
BCE other expense of $38 million in Q4 2020 increased by $20 million, year over year, mainly due to lower gains on investments as a result of a gain in Q4 2019 on BCE’s obligation to repurchase at fair value the minority interest in one of BCE’s subsidiaries, higher losses on operations from our equity investments, higher losses on retirements and disposals of property, plant and equipment and intangible assets and higher early debt redemption costs. This was partly offset by lower net mark-to-market losses on derivatives used to economically hedge equity settled share-based compensation plans.
BCE income taxes of $191 million in Q4 2020 decreased by $54 million, compared to Q4 2019, mainly as a result of a higher value of previously unrecognized tax benefits and lower taxable income.
BCE net earnings attributable to common shareholders of $889 million in Q4 2020, or $0.98 per share, were higher than the $672 million, or $0.74 per share, reported in Q4 2019. The year-over-year increase was mainly due to higher net earnings from discontinued operations as a result of a gain on sale, net of taxes, of $211 million in Q4 2020 from the completion of the sale of substantially all of our data centre operations, lower in-quarter impairment charges at our Bell Media segment and lower income taxes. This was partly offset by lower adjusted EBITDA, higher depreciation and amortization, higher severance, acquisition and other costs and higher other expense. Adjusted net earnings decreased to $731 million in Q4 2020, compared to $784 million in Q4 2019, and adjusted EPS decreased to $0.81, from $0.86 in Q4 2019.
BCE cash flows from operating activities was $1,631 million in Q4 2020 compared to $2,091 million in Q4 2019. The decrease is mainly attributable to lower cash from working capital driven mainly by growth in accounts receivable from increased consumer activity, including a higher volume of wireless device financing plan sales, and the timing of supplier payments, higher income taxes paid due to timing of installments and lower adjusted EBITDA.
BCE free cash flow generated in Q4 2020 was $92 million, compared to $874 million in Q4 2019. The decrease was mainly attributable to lower cash flows from operating activities, excluding cash from discontinued operations and acquisition and other costs paid, and higher capital expenditures.

7M
D&
A
Sele
cted
ann
ual a
nd q
uart
erly
info
rmat
ion
98 | BCE InC. 2020 AnnuAl REpoRt
SEASONALITY CONSIDERATIONSSome of our segments’ revenues and expenses vary slightly by season, which may impact quarter-to-quarter financial results. The COVID-19 pandemic has had significant impacts on our business and financial results for the most part of 2020. Due to uncertainties relating to the severity and duration of the COVID-19 pandemic, it is difficult at this time to estimate the impacts of the COVID-19 pandemic on our business and future financial results. Therefore, the typical seasonal variations described below may not fully reflect the trends experienced during the COVID-19 pandemic which affected and continue to affect customer behaviour and spending, as well as the way we operate our business. Accordingly, it is difficult at this time to estimate the impacts of the COVID-19 pandemic on the seasonality trends that normally characterize our business.
Bell Wireless operating results are influenced by the timing of new mobile device launches and seasonal promotional periods, such as back-to-school, Black Friday and the Christmas holiday period, as well as the level of overall competitive intensity. Because of these seasonal effects, subscriber additions and retention costs due to device upgrades related to contract renewals are typically higher in the third and fourth quarters. For ABPU, historically we have experienced seasonal sequential increases in the second and third quarters, due to higher levels of usage and roaming in the spring and summer months, followed by historical seasonal sequential declines in the fourth and first quarters. However, this seasonal effect on ABPU has moderated, as unlimited voice and data options have become more prevalent, resulting in less variability in chargeable data usage.
Bell Wireline revenue tends to be higher in the fourth quarter because of historically higher data and equipment product sales to business customers. However, this may vary from year to year depending on the strength of the economy and the presence of targeted sales initiatives, which can influence customer spending. Home Phone, TV and Internet subscriber activity is subject to modest seasonal fluctuations, attributable largely to residential moves during the summer months and the back-to-school period in the third quarter. Targeted marketing efforts conducted during various times of the year to coincide with special events or broad-based marketing campaigns also may have an impact on overall wireline operating results.
Bell Media revenue and related expenses from TV and radio broadcasting are largely derived from the sale of advertising, the demand for which is affected by prevailing economic conditions as well as cyclical and seasonal variations. Seasonal variations are driven by the strength of TV ratings, particularly during the fall programming season, major sports league seasons and other special sporting events such as the Olympic Games, NHL and NBA playoffs and World Cup soccer, as well as fluctuations in consumer retail activity during the year.
8M
D&
A
Regu
lato
ry e
nviro
nmen
t
BCE InC. 2020 AnnuAl REpoRt | 99
8 Regulatory environment
8.1 IntroductionThis section describes certain legislation that governs our business and provides highlights of recent regulatory initiatives and proceedings, government consultations and government positions that affect us, influence our business and may continue to affect our ability to compete in the marketplace. Bell Canada and several of its direct and indirect subsidiaries, including Bell Mobility, Bell ExpressVu Limited Partnership (ExpressVu), Bell Media, NorthernTel, Limited Partnership (NorthernTel), Télébec, Limited Partnership (Télébec) and Northwestel, are governed by the Telecommunications Act, the Broadcasting Act, the Radiocommunication Act and/or the Bell Canada Act. Our business is affected by regulations, policies and decisions made by various regulatory agencies, including the CRTC, a quasi-judicial agency of the Government of Canada responsible for regulating Canada’s telecommunications and broadcasting industries, and other federal government departments, in particular ISED and the Competition Bureau. As a result of the COVID-19 pandemic, additional legislation or regulations, regulatory initiatives or proceedings, or government consultations or positions, may further be adopted or instituted, as the case may be, that impose additional constraints on our operations and may adversely impact our ability to compete in the marketplace.
In particular, the CRTC regulates the prices we can charge for retail telecommunications services when it determines there is not enough competition to protect the interests of consumers. The CRTC has determined that competition is sufficient to grant forbearance from retail price regulation under the Telecommunications Act for the vast majority of our retail wireline and wireless telecommunications services. The CRTC can also mandate the provision of access by competitors to our wireline and wireless networks and the rates we can charge them. Notably, it currently mandates wholesale high-speed access for wireline broadband as well as domestic wireless roaming services. Additional mandated services, as well as lower mandated wholesale rates, could undermine our incentives to invest in network improvements and extensions, limit our flexibility, influence the market structure, improve the business position of our competitors, limit network-based differentiation of our services and negatively impact the financial performance of our businesses. Our TV distribution and our TV and radio broadcasting businesses are subject to the Broadcasting Act and are, for the most part, not subject to retail price regulation.
Although most of our retail services are not price-regulated, government agencies and departments such as the CRTC, ISED, Canadian Heritage and the Competition Bureau continue to play a significant role in regulatory matters such as mandatory access to networks, spectrum auctions, the imposition of consumer-related codes of conduct, approval of acquisitions, broadcast and spectrum licensing, foreign ownership requirements, and control of copyright piracy. Adverse decisions by governments or regulatory agencies, increasing regulation or a lack of effective anti-piracy remedies could have negative financial, operational, reputational or competitive consequences for our business.
REVIEW OF KEY LEGISLATIONOn June 5, 2018, the Minister of Innovation, Science and Industry and the Minister of Canadian Heritage announced the launch of a review of the Broadcasting Act, the Radiocommunication Act and the Telecommunications Act (the Acts). The legislative review is intended to modernize the Acts to better address new realities impacting the broadcasting and telecommunications industries. The review was led by a panel of external experts tasked with consulting industry members and Canadian consumers. On January 29, 2020, the review panel issued a report that included 97 recommendations. Reforms of these key pieces of legislation could have material impacts for our broadcasting, telecommunications and wireless businesses.
On November 3, 2020, the Government of Canada tabled Bill C-10, An Act to amend the Broadcasting Act and to make related and consequential amendments to other Acts. Key among the proposed amendments is that both foreign and domestic online broadcasting undertakings doing business in Canada could be required to contribute to the Canadian broadcasting system in a manner that the CRTC deems appropriate. The specifics of such contribution will be determined through the CRTC’s public consultation processes and enforced by way of conditions imposed by the CRTC. It is anticipated that additional reform to fully modernize the Broadcasting Act will be forthcoming at a later date.
It is unclear which of the panel’s remaining recommendations, if any, may be adopted by the government, whether Bill C-10 will receive royal assent and when any adopted reforms would come into force. Therefore, the impact, if any, of these recommendations and the draft amendments to the Broadcasting Act on our business and financial results is unclear at this time.
8.2 Telecommunications ActThe Telecommunications Act governs telecommunications in Canada. It defines the broad objectives of Canada’s telecommunications policy and provides the Government of Canada with the power to give general direction to the CRTC on any of its policy objectives. It applies to several of the BCE group of companies and partnerships, including Bell Canada, Bell Mobility, NorthernTel, Télébec and Northwestel.
Under the Telecommunications Act, all facilities-based telecommuni-cations service providers in Canada, known as telecommunications common carriers (TCCs), must seek regulatory approval for all tele-communications services, unless the services are exempt or forborne from regulation. The CRTC may exempt an entire class of carriers from regulation under the Telecommunications Act if the exemption meets
the objectives of Canada’s telecommunications policy. In addition, a few large TCCs, including those in the BCE group, must also meet certain Canadian ownership requirements. BCE monitors and periodically reports on the level of non-Canadian ownership of its common shares.
REVIEW OF MOBILE WIRELESS SERVICESOn February 28, 2019, the CRTC launched its planned review of the regulatory framework for mobile wireless services. The purpose of the proceeding is to consider changes to the wireless regulatory framework developed in 2015. The main issues in the CRTC’s consultation include (i) competition in the retail market; (ii) the current wholesale mobile wireless service regulatory framework, with a focus on
8M
D&
A
Regu
lato
ry e
nviro
nmen
t
100 | BCE InC. 2020 AnnuAl REpoRt
wholesale mobile virtual network operator (MVNO) access; and (iii) the future of mobile wireless services in Canada, with a focus on reducing barriers to infrastructure deployment. With respect to MVNOs, the CRTC expressed the preliminary view that it would be appropriate for the national wireless carriers to provide wholesale MVNO access. The CRTC held a public hearing in February 2020 and a decision is expected in 2021. It is unclear what impact, if any, the results of this consultation could have on our business and financial results. However, a decision by the CRTC mandating MVNO access would negatively impact our capacity to make investments at the same levels as we have in the past and, accordingly, it would put at risk our ability to invest in next-generation networks.
MANDATED DISAGGREGATED WHOLESALE ACCESS TO FTTP NETWORKSOn July 22, 2015, in Telecom Regulatory Policy CRTC 2015-326, the CRTC mandated the introduction of a new disaggregated wholesale high-speed access service, including over FTTP facilities. The first stage of its implementation took place only in Ontario and Québec. This adverse regulatory decision may impact the specific nature, magnitude, location and timing of our future FTTP investment decisions. In particular, the introduction by the CRTC of mandated wholesale services over FTTP undermines the incentives for facilities-based digital infrastructure providers to invest in next-generation wireline networks, particularly in smaller communities and rural areas.
On August 29, 2017, in Telecom Order CRTC 2017-312, the CRTC set interim rates for the new disaggregated wholesale high-speed access service. The final rates remain to be determined. On June 11, 2020, the CRTC launched a new proceeding (refer to Review of network configuration for disaggregated wholesale access below) to reconsider the network configuration of the disaggregated wholesale high-speed access service it mandated in 2015 and suspended the finalization of the interim rates and terms of tariff that were set in 2017 until further notice. The mandating of final rates that are materially different from the rates we proposed could further impact our investment strategy, improve the business position of our competitors and adversely impact our financial results.
CNOC’S APPLICATION ON RETAIL FTTP BROADBAND SERVICESOn January 8, 2021, Canadian Network Operators Consortium Inc. (CNOC) filed an application with the CRTC asking for an order mandating Bell Canada and other large providers to sell retail FTTP broadband services to Internet service providers (ISPs), at a mandated discount off the retail price. ISPs would then resell these services under their own brands. CNOC proposed that this mandated access to retail FTTP services would last until the CRTC completes its reviews of all current and near-term proceedings related to wholesale high-speed services. The implementation of CNOC’s proposal would undermine the incentives for facilities-based digital infrastructure providers to invest in next-generation wireline networks, particularly in smaller communities and rural areas, as well as improve the business position of our competitors and adversely impact our financial results.
REVIEW OF WHOLESALE FTTN HIGH-SPEED ACCESS SERVICE RATESAs part of its ongoing review of wholesale Internet rates, on October 6, 2016, the CRTC significantly reduced, on an interim basis, some of the wholesale rates that Bell Canada and other major providers charge for access by third-party Internet resellers to FTTN or cable networks, as applicable. On August 15, 2019, the CRTC further reduced the wholesale
rates that Internet resellers pay to access network infrastructure built by facilities-based providers like Bell Canada, with retroactive effect back to March 2016 (the Decision). The estimated cost impact to Bell Canada of the Decision could be in excess of $100 million, if not overturned or otherwise modified. In response to this Decision, Bell Canada reduced the scope of its broadband wireless Internet build-out plan for smaller towns and rural communities by approximately 200,000 households.
Bell Canada and five major cable carriers (Cogeco Communications Inc., Eastlink, Rogers, Shaw and Vidéotron) (together, the Applicants) obtained leave to appeal the Decision from the Federal Court of Appeal, and the Federal Court of Appeal granted a stay of the Decision until making a final ruling. The Federal Court of Appeal issued a decision on September 10, 2020 in which it rejected the appeal and lifted the stay. The Applicants’ request for leave to appeal the decision of the Federal Court of Appeal to the Supreme Court of Canada was denied on February 25, 2021.
The Applicants and TELUS Communications Inc. also filed review and vary applications of the Decision with the CRTC. On September 28, 2020, the CRTC issued a stay of the Decision pending its final decision on the review and vary applications. The Applicants and TELUS Communications Inc. also appealed the Decision to the Federal Cabinet. On August 19, 2020, the Federal Cabinet issued an Order in Council noting that a further decision from the CRTC regarding the review and vary applications is pending. While it did not overturn the Decision, the Order in Council also stated that: “the final rates set by the decision do not, in all instances, appropriately balance the objectives of the wholesale services framework”. The implementation of final wholesale rates that are significantly below those in the market today and/or the requirement to refund monies to third-party resellers could improve the business position of our competitors, further impact our investment strategy and adversely impact our financial results.
REVIEW OF NETWORK CONFIGURATION FOR DISAGGREGATED WHOLESALE ACCESSOn June 11, 2020, the CRTC launched a proceeding to reconsider the network configuration of the disaggregated wholesale high-speed access service mandated of Bell Canada and large cable carriers. The consultation aims to adopt a model applicable to wholesale providers across the country. It may also result in the adoption of a different level of disaggregation for Bell Canada than had been mandated in 2015 as discussed under Mandated disaggregated wholesale access to FTTP networks above. The launch of this new consultation has suspended the finalization of the rates of Bell Canada’s existing disaggregated high-speed access service, which will remain at their current interim level until further notice. Revisions that facilitate reseller access to disaggregated wholesale access and/or the mandating of final rates that are materially different from the rates Bell Canada has proposed could undermine the incentives for facilities-based digital infrastructure providers to invest in next-generation wireline networks, improve the business position of resellers of high-speed access services and adversely impact our financial results.
REVIEW OF THE APPROACH TO RATE SETTING FOR WHOLESALE TELECOMMUNICATIONS SERVICESOn April 24, 2020, the CRTC launched a proceeding to reconsider the current approach used by the CRTC to set rates for mandated wholesale telecommunications services. The proceeding aims to consider the most appropriate methodology for ensuring that such rates are just and reasonable and are established in an efficient manner. This may

8M
D&
A
Regu
lato
ry e
nviro
nmen
t
BCE InC. 2020 AnnuAl REpoRt | 101
result in the adoption of a new costing approach that substantially differs from the current ‘Phase II’ costing methodology. Phase II is a prospective incremental costing methodology currently used by the CRTC to determine rates for regulated wholesale services. If the current Phase II costing methodology is revised or replaced, the impact of such changes may result in more efficient and transparent rate setting, or it may result in a rate-setting process that favours resellers and undermines incentives for facilities-based investment. At this time, it is unclear what impact, if any, the results of the proceeding could have on our business and financial results.
CRTC REVIEW OF ACCESS TO POLESOn October 30, 2020, the CRTC launched a proceeding to request comments on potential regulatory measures to make access to poles owned by TCCs, such as Bell Canada, more efficient. As part of this proceeding, the CRTC specifically requested comments on whether there should be maximum time limits for the completion of make ready work; whether all occupants of a pole should be responsible for the costs associated with pole maintenance and make ready work; whether there should be a limit on the amount of time for which a pole owner
can reserve spare capacity on a pole; and whether the CRTC can and should take steps to improve access to electric utility pole, having regard to the limit of its jurisdiction. We have implemented improvements to our pole access procedures and requested CRTC approval for the implementation of a one touch make ready process, starting with a trial in Québec. This proceeding may result in other modifications to the current regulatory process for access to poles. At this time, it is unclear what impact, if any, the results of the proceeding could have on our business and financial results.
CANADA’S TELECOMMUNICATIONS FOREIGN OWNERSHIP RULESUnder the Telecommunications Act, there are no foreign investment restrictions applicable to TCCs that have less than a 10% share of the total Canadian telecommunications market as measured by annual revenues. However, foreign investment in telecommunications companies can still be refused by the government under the Investment Canada Act. The absence of foreign ownership restrictions on such small or new entrant TCCs could result in more foreign companies entering the Canadian market, including by acquiring spectrum licences or Canadian TCCs.
8.3 Broadcasting ActThe Broadcasting Act outlines the broad objectives of Canada’s broadcasting policy and assigns the regulation and supervision of the broadcasting system to the CRTC. Key policy objectives of the Broadcasting Act are to protect and strengthen the cultural, political, social and economic fabric of Canada and to encourage the development of Canadian expression.
Most broadcasting activities require a programming or broadcasting distribution licence from the CRTC. The CRTC may exempt broadcasting undertakings from complying with certain licensing and regulatory requirements if it is satisfied that non-compliance will not materially affect the implementation of Canadian broadcasting policy. A corporation
must also meet certain Canadian ownership and control requirements to obtain a broadcasting or broadcasting distribution licence, and corporations must have the CRTC’s approval before they can transfer effective control of a broadcasting licensee.
Our TV distribution operations and our TV and radio broadcasting operations are subject to the requirements of the Broadcasting Act, the policies and decisions of the CRTC and their respective broadcasting licences. Any changes in the Broadcasting Act, amendments to regulations or the adoption of new ones, or amendments to licences, could negatively affect our competitive position or the cost of providing services.
8.4 Radiocommunication ActISED regulates the use of radio spectrum under the Radiocommunication Act to ensure that radiocommunication in Canada is developed and operated efficiently. All companies wishing to operate a wireless system in Canada must hold a spectrum licence to do so. Under the Radiocommunication Regulations, companies that are eligible for radio licences, such as Bell Canada and Bell Mobility, must meet the same ownership requirements that apply to companies under the Telecommunications Act.
ISED DECISION AND CONSULTATION ON 3500 MHZ AND OTHER SPECTRUMOn June 5, 2019, ISED released its Decision on Revisions to the 3500 MHz Band to Accommodate Flexible Use and Preliminary Decisions on Changes to the 3800 MHz Band. ISED decided that it will allow flexible use (which allows spectrum to be used for both fixed and mobile services) in the 3450–3650 MHz band. This allows ISED to issue flexible use licences in this frequency range. ISED will require existing licensees to return a portion of their existing licences in return for a flexible use licence following the auction. Existing licensees that currently hold 75 MHz of spectrum or more of fixed use licences in a given area will be eligible to apply for a new flexible use licence of 60 MHz in the related area; those with 50 MHz of spectrum will be eligible to apply for 50 MHz; and
all other licensees will be eligible to apply for 20 MHz. Existing licensees will be allowed to continue operating where they do not prevent the deployment of new licences. If they are required to transition, they will be subject to a protection period of six months to three years, depending on the size of the population centre in the area in which they operate. As discussed under ISED consultation on 3800 MHz spectrum below, ISED launched a consultation to determine the amount of spectrum that would be assigned for flexible use in the 3700–4200 MHz band. It is unclear what impact the results of this decision and future related processes could have on our business and financial results.
3500 MHZ SPECTRUM AUCTIONOn March 5, 2020, ISED released its Policy and Licensing Framework for Spectrum in the 3500 MHz Band, which will govern the auction of spectrum licences in the 3500 MHz band. ISED will set aside 50 MHz of spectrum for regional service providers in all areas where at least 50 MHz will be available for auction or all available spectrum in areas with a large population centre where less than 50 MHz is available. The auctioned licences will have a 20-year term and set-aside licences will not be transferable to set-aside ineligible entities for the first 5 to 7 years of the licence term. In addition, licensees will need to meet general network coverage targets in each licence area at 5, 10 and 20 years

8M
D&
A
Regu
lato
ry e
nviro
nmen
t
102 | BCE InC. 2020 AnnuAl REpoRt
following licence issuance. Licensees with existing LTE networks will be subject to additional deployment requirements based on their existing LTE coverage. While the adoption of set-aside provisions limits the amount of spectrum that Bell Mobility can bid on, ISED will not apply a spectrum cap on licensees. Initially scheduled to begin on December 15, 2020, bidding in the auction has been rescheduled to begin on June 15, 2021.
ISED CONSULTATION ON 3800 MHZ SPECTRUMOn August 27, 2020, ISED released a Consultation on the Technical and Policy Framework for the 3650–4200 MHz Band and Changes to the Frequency Allocation of the 3500–3650 MHz Band. In this consultation, ISED is seeking input on how to introduce flexible use services (i.e., fixed and mobile) in the 3650–4200 MHz band (referred to as the 3800 MHz band) and the amount of spectrum to be made available. ISED is proposing to clear fixed satellite services from the 3700–4000 MHz frequency range (with some exceptions) by December 2023 to allow flexible use service. ISED is also proposing to move wireless broadband services from 3650–3700 MHz to 3900–3980 MHz. In addition, ISED
is seeking comments on a proposal by Telesat Canada (Telesat) to allocate flexible use spectrum in 3700–3900 MHz via a private sale in the secondary market and to clear the 3900–4100 MHz portion of the band for flexible use services through a future ISED auction licensing process. It is unclear what impact the results of this consultation and future related processes could have on our business and financial results.
DECISION ON RELEASING MILLIMETRE WAVE SPECTRUM TO SUPPORT 5GOn June 5, 2019, ISED issued its Decision on Releasing Millimetre Wave Spectrum to Support 5G. In this decision, ISED announced that spectrum in the 26 GHz, 28 GHz, and 37-40 GHz bands will transition from satellite use to flexible use (i.e., mobile or fixed use). ISED will designate the 64-71 GHz band for licence-exempt operations on a no-interference, no-protection basis. ISED indicated that it will establish the details and specific rules through one or more future consultations. It is unclear what impact the results of this decision and future related processes could have on our business and financial results.
8.5 Bell Canada ActAmong other things, the Bell Canada Act limits how Bell Canada voting shares and Bell Canada facilities may be sold or transferred. Specifically, under the Bell Canada Act, the CRTC must approve any sale or other disposal of Bell Canada voting shares that are held by BCE, unless the sale or disposal would result in BCE retaining at least
80% of all of the issued and outstanding voting shares of Bell Canada. Except in the ordinary course of business, the sale or other disposal of facilities integral to Bell Canada’s telecommunications activities must also receive CRTC approval.
8.6 OtherCOPYRIGHT ACT REVIEWOn December 13, 2017, the federal government passed a motion in Parliament to formally launch a review of the Copyright Act. This review is mandated by the Copyright Act itself, which requires that the legislation be examined every five years. The Standing Committee on Industry, Science and Technology, working in collaboration with the Standing Committee on Canadian Heritage, led the process, which began in February 2018. The Standing Committee on Canadian Heritage released its report on May 15, 2019 and the Standing Committee on Industry, Science and Technology released its report on June 3, 2019. Each Committee made a series of recommendations in respect of the rights of Canadian copyright holders and users and the effectiveness of Canadian copyright law. At this time, it is not known whether these reports will lead to amendments to the Copyright Act and the impact of any potential amendments on our business and financial results is unknown.
REVIEW OF THE CRTC’S REGULATORY FRAMEWORK FOR NORTHWESTELOn November 2, 2020, the CRTC launched a proceeding to review the regulatory framework for Northwestel and the state of telecommunications services in Canada’s North. This proceeding may result in modifications to the current regulatory framework for Northwestel, including with respect to issues such as rates, wholesale
access and subsidies. Modifications to the current regulatory framework may result in additional subsidies and rate flexibility for Northwestel, which would encourage investment, or it may result in rate restrictions or additional wholesale obligations, which would undermine incentives for investment in the North. At this time, it is unclear what impact, if any, the results of the proceeding could have on our business and financial results.
BILL C-11: THE DIGITAL CHARTER IMPLEMENTATION ACT, 2020On November 17, 2020, the Minister of Innovation, Science and Industry tabled Bill C-11, entitled the Digital Charter Implementation Act, 2020. If passed, the Bill will establish a new private sector privacy law in Canada, the Consumer Privacy Protection Act (CPPA), and a new Personal Information and Data Protection Tribunal. The proposed changes to Canada’s privacy regime include new consumer rights to data mobility and a new private right of action for individuals. The CPPA includes strong new enforcement tools that give the newly constituted Personal Information and Data Protection Tribunal the power to impose, upon recommendation by the Office of the Privacy Commissioner of Canada, administrative monetary penalties amounting to the greater of $10 million or 3 per cent of global revenue and in some cases, for serious offences, the greater of $25 million or 5 per cent of global revenue. No coming into force date has yet been released but public statements by the Minister indicate that it is likely to come into effect in 2022.
9M
D&
A
Busi
ness
ris
ks
BCE InC. 2020 AnnuAl REpoRt | 103
9 Business risksA risk is the possibility that an event might happen in the future that could have a negative effect on our business, financial condition, liquidity, financial results or reputation. The actual effect of any event could be materially different from what we currently anticipate. The risks described in this MD&A are not the only ones that could affect us. Additional risks and uncertainties not currently known to us or that we currently deem to be immaterial may also materially and adversely affect our business, financial condition, liquidity, financial results or reputation.
This section describes the principal business risks that could have a material adverse effect on our business, financial condition, liquidity, financial results or reputation, and cause actual results or events to differ materially from our expectations expressed in, or implied by, our forward-looking statements. Certain of these principal business risks have already been discussed in other sections of this MD&A, and we refer the reader to those sections for a discussion of such risks. All of the risk discussions set out in the sections referred to in the table below, as well as the risk discussion relating to the COVID-19 pandemic and general economic conditions set out in Section 3.2, Principal business risks, are incorporated by reference in this section 9.
RISKS DISCUSSED IN OTHER SECTIONS OF THIS MD&A SECTION REFERENCES
Competitive environment Section 3.2, Principal business risks
Section 5, Business segment analysis (Competitive landscape and industry trends section for each segment)
Regulatory environment Section 3.2, Principal business risks
Section 8, Regulatory environment
Security management Section 3.2, Principal business risks
Risks specifically relating to our Bell Wireless, Bell Wireline and Bell Media segments
Section 5, Business segment analysis (Principal business risks section for each segment)
The other principal business risks that could also have a material adverse effect on our business, financial condition, liquidity, financial results or reputation are discussed below.
TECHNOLOGY/INFRASTRUCTURE TRANSFORMATIONThe failure to transform our operations, enabling a truly customer-centric service experience across a constantly evolving profile of world-class products and services at all points of interaction, while lowering our cost structure, could have an adverse impact on our business and financial results
Globalization, increased competition and ongoing technological advances are driving customer expectations of faster market responses, enhanced user experiences and cost-effective delivery. Meeting these expectations requires the deployment of new service and product technologies that are network-neutral and based on a more collaborative and integrated development environment. The availability of improved networks and software technologies further provides the foundation for better and faster connections, which have in turn led to a significant growth in IoT applications. Change can be difficult and may present unforeseen obstacles that might impact successful execution, and this transition is made more challenging by the complexity of our multi-product environment, combined with the complexity of our network and IT infrastructure. The failure to accurately assess the potential of new technologies, or to invest and evolve in the appropriate direction in an environment of changing business models, could have an adverse impact on our business and financial results.
In particular, our network and IT evolution activities seek to use new as well as evolving and developing technologies, including network functions virtualization, software-defined networks, cloud technologies, open source software, artificial intelligence and machine learning. They also seek to transform our network and systems through consolidation,
virtualization and automation to achieve our objectives of becoming more agile in our service delivery and operations, as well as providing omni-channel capabilities for our customers, ensuring best quality and customer experience, and developing a new network infrastructure that enables a competitive cost structure and rapidly growing capacity. These evolution activities require an operational and cultural shift. Alignment across technology, product development and operations is increasingly critical to ensure appropriate trade-offs and optimization of capital allocation. Failure to transform our operations fast enough, enabling a truly customer-centric service experience across a constantly evolving profile of world-class products and services at all points of interaction, while lowering our cost structure, could hinder our ability to compete on footprint, service experience and cost structure, and have an adverse impact on our business and financial results.
If this cannot be achieved in accordance with our deployment schedules while maintaining network availability and performance through the migration process, we may lose customers as a result of poor service performance, which could adversely affect our ability to achieve our operational and financial objectives. Failure to maximize adaptable infrastructures, processes and technologies to quickly and efficiently respond to evolving customer patterns and behaviours and leverage IP across all facets of our network and product and service portfolio could inhibit a fully customer-centric approach, limiting or preventing comprehensive self-serve convenience, real-time provisioning, cost savings and flexibility in delivery and consumption, leading to negative business and financial outcomes.

9M
D&
A
Busi
ness
ris
ks
104 | BCE InC. 2020 AnnuAl REpoRt
Parallel to our focus on next-generation investment, adverse regulatory decisions may impact the specific nature, magnitude, location and timing of investment decisions. In particular, the lowering of rates by the CRTC of mandated wholesale services over FTTN or FTTP, the potential for additional mandated access to our networks or the imposition of wholesale obligations on wireless networks will undermine the incentives for facilities-based digital infrastructure providers to invest in next-generation wireline and wireless networks. Failure to continue investment in next-generation capabilities in a disciplined and strategic manner could limit our ability to compete effectively and achieve desired business and financial results.
Other examples of risks affecting the achievement of our desired technology/infrastructure transformation include the following:
• The COVID-19 pandemic may bring about further incremental costs, delays, unavailability of equipment and materials or inability to access customer premises, as well as unavailability of our employees or those of our suppliers or contractors, due to government actions, illness, quarantines, absenteeism, workforce reduction initiatives or other restrictions, all of which may impact our ability to expand our networks or to start, advance or complete both currently planned network deployment projects and other projects
• We, and other telecommunications carriers we rely on to provide services, must be able to purchase high-quality network equipment and services from third-party suppliers on a timely basis and at a reasonable cost (refer to Dependence on third-party suppliers below for more details)
• Network construction and deployment on municipal or private property requires the issuance of municipal or property owner consents, respectively, for the installation of network equipment, which could increase the cost of, and cause delays in, FTTP, WTTP and wireless rollouts
• Suboptimal capital deployment in network build, infrastructure and process upgrade, and customer service improvements, could hinder our ability to compete effectively
• The successful deployment of WTTP and 5G mobile services could be impacted by various factors, including environmental factors, affecting coverage and costs
• Higher demand for faster Internet speed and capacity, coupled with governmental policies and initiatives, creates tensions around FTTP and WTTP deployment in terms of geographic preference and pace of rollout
• The increasing dependence on apps for content delivery, sales, customer engagement and service experience drives the need for new and scarce capabilities (sourced internally or externally), which may not be available, as well as the need for associated operating processes integrated into ongoing operations
• New products, services or apps could reduce demand for our existing, more profitable service offerings or cause prices for those services to decline, and could result in shorter estimated useful lives for existing technologies, which could increase depreciation and amortization expense
• As content consumption habits evolve and viewing options increase, our ability to develop alternative delivery vehicles in order to seek to compete in new markets and increase customer engagement and revenue streams may be hindered by the significant software development and network investment required
• Successfully managing the development and deployment of relevant product solutions on a timely basis to match the speed of adoption of IoT in the areas of retail, business and government could be challenging
• We must be able to take advantage of new opportunities, in order to meet our business objectives, such as those introduced by “big data” which is subject to many challenges including evolving customer perceptions as well as legal and regulatory developments. If we cannot build market-leading competencies in this field across sales, service and operational platforms that respect societal values and meet legal and regulatory requirements, we may miss important opportunities to grow our business through enhanced market intelligence and a more proactive customer service model.
CUSTOMER EXPERIENCEDriving a positive customer experience in all aspects of our engagement with customers is important to avoid brand degradation and other adverse impacts on our business and financial performance
As the bar continues to be raised based on customers’ evolving expectations of service and value, failure to get ahead of such expectations and build a more robust and consistent service experience at a fair value proposition could hinder product and service differentiation and customer loyalty. The foundation of effective customer service stems from our ability to deliver high-quality, consistent and simple solutions to customers in an expeditious manner and on mutually agreeable terms. However, complexity in our operations resulting from multiple technology platforms, billing systems, sales channels, marketing databases and a myriad of rate plans, promotions and product offerings, in the context of a large customer base and a workforce that continuously requires to be trained, monitored and replaced, may limit our ability to respond quickly to market changes and reduce costs, and may lead to customer confusion or billing, service or other errors, which could adversely affect customer satisfaction, acquisition and retention. These challenges may be exacerbated as services become more complex. Media attention to customer complaints could also erode our brand and reputation and adversely affect customer acquisition and retention.
With the proliferation of connectivity services, apps and devices, customers are accustomed to doing things when, how and where they want through websites, self-serve options, web chat, call centres and social media forums. These customer demands have intensified in response to the COVID-19 pandemic and, while we introduced new services and tools, including self-managed solutions, designed to accelerate our customer experience evolution, we are unable to predict whether such services and tools will be sufficient to meet customer expectations. The shift to online transactions during the COVID-19 pandemic amid store closures and reduced store traffic adversely impacted our ability to leverage our extensive retail network to increase the number of subscribers and sell our products and services. This could continue during the COVID-19 pandemic and thereafter, and potentially worsen if temporary closures of our retail outlets are maintained. Failure to develop true omni-channel capabilities and improve self-serve tools could adversely affect our business, financial results, reputation and brand value.

9M
D&
A
Busi
ness
ris
ks
BCE InC. 2020 AnnuAl REpoRt | 105
Understanding the customer relationship as a whole in a multi-product environment and delivering a simple, seamless experience at a fair price is increasingly central to an evolving competitive dynamic. Failure to improve our customer experience by digitizing and developing a
consistent, fast and on-demand end-to-end experience before, during and after sales using new technologies such as artificial intelligence and machine learning, in parallel to our network evolution, could also adversely affect our business, financial results, reputation and brand value.
OPERATIONAL PERFORMANCEOur networks and IT systems are the foundation of high-quality consistent services, which are critical to meeting service expectations
Our ability to provide consistent wireless, wireline and media services to customers in a complex and constantly changing operating environment is crucial for sustained success. In particular, network capacity demands for TV and other content offerings and other bandwidth-intensive applications on our wireline and wireless networks have been growing at unprecedented rates. Unexpected capacity pressures on our networks may negatively affect our network performance and our ability to provide services. Issues relating to network availability, speed, consistency and traffic management on our more current as well as our aging networks could have an adverse impact on our business and financial performance. Furthermore, as we transition towards newer technologies, including software-defined networks and cloud services, we will need to manage the possibility of some instability during the transition.
Stay-at-home and work-from-home measures implemented by governments and businesses during the COVID-19 pandemic have impacted the nature of our customers’ use of our networks, products and services. This has created unprecedented capacity pressure on certain areas of our wireless, wireline and broadcast media networks. Although, as a result of various steps we have taken aimed at maintaining the continuity of essential services, our networks have, in general, adequately sustained such increased usage, there can be no assurance that this will continue to be the case. Home offices can be anywhere in the country and network performance and/or reliability may vary depending on the location. Network failures and slowdowns could have an adverse effect on our brand and reputation and adversely affect subscriber acquisition and retention as well as our financial results. We may also need to incur significant capital expenditures in order to provide additional capacity and reduce network congestion during the COVID-19 pandemic and beyond.
In addition, we currently use a very large number of interconnected internal and third-party operational and business support systems for provisioning, networking, distribution, broadcast management, billing and accounting, which may hinder our operational efficiency. If we fail to implement, maintain or manage highly effective IT systems supported by an effective governance and operating framework, this may lead to inconsistent performance and dissatisfied customers, which over time could result in higher churn.
Further examples of risks to operational performance that could impact our reputation, business operations and financial performance include the following:
• The COVID-19 pandemic may bring about further incremental costs, delays or unavailability of equipment and materials as well as unavailability of our employees or those of our suppliers or contractors, due to government actions, illness, quarantines, absenteeism, workforce reduction initiatives or other restrictions, which may impact our ability to maintain or upgrade our networks in order to accommodate substantially increased network usage due to stay-at-home and work-at-home measures and to provide the desired levels of customer service
• Corporate restructurings, system replacements and upgrades, process redesigns, staff reductions and the integration of business acquisitions may not deliver the benefits contemplated and could adversely impact our ongoing operations
• If we fail to streamline our significant IT legacy system portfolio and proactively improve operating performance, this could adversely affect our business and financial results
• We may experience more service interruptions or outages due to aging legacy infrastructure. In some cases, vendor support is no longer available or legacy vendor operations have ceased.
• There may be a lack of competent and cost-effective resources to perform the lifecycle management and upgrades necessary to maintain the operational status of legacy networks and IT systems
Our operations and business continuity depend on how well we protect, test, maintain, replace and upgrade our networks, IT systems, equipment and other facilities
Our operations, service performance, reputation and business continuity depend on how well we and our contracted product and service providers, as well as other telecommunications carriers on which we rely to provide services, protect networks and IT systems, as well as other infrastructure and facilities, from events such as information security attacks, unauthorized access or entry, fire, natural disasters (including, without limitation, seismic and severe weather-related events such as ice, snow and wind storms, wildfires, flooding, extended heat waves, hurricanes, tornadoes and tsunamis), power loss, building cooling loss, acts of war or terrorism, sabotage, vandalism, actions of neighbours and other events. As discussed in more detail below in Environmental and health concerns – Climate change and other environmental concerns could have an adverse effect on our business, climate change, especially in areas of greater environmental sensitivity, could heighten the occurrence of the above-mentioned environmental risks. Establishing response strategies and business continuity protocols to maintain service consistency if any disruptive event materializes is critical to the achievement of effective customer service. Any of the above-mentioned events, as well as the failure by us, or by other telecommunications carriers on which we rely to provide services, to complete planned and sufficient testing, maintenance, replacement or upgrade of our or their networks, equipment and other facilities, which is, among others, dependent on our or their ability to purchase equipment and services from third-party suppliers, could disrupt our operations (including through disruptions such as network failures, billing errors or delays in customer service), require significant resources and result in significant remediation costs, which in turn could have an adverse effect on our business and financial performance, or impair our ability to keep existing subscribers or attract new ones.
In addition, the COVID-19 pandemic may bring about further incremental costs, delays or unavailability of equipment and materials as well as unavailability of our employees or those of our suppliers or contractors, all of which could impact our operations and business continuity strategies.
9M
D&
A
Busi
ness
ris
ks
106 | BCE InC. 2020 AnnuAl REpoRt
Satellites used to provide our satellite TV services are subject to significant operational risks that could have an adverse effect on our business and financial performance
Pursuant to a set of commercial arrangements between ExpressVu and Telesat, we currently have satellites under contract with Telesat. Telesat operates or directs the operation of these satellites, which utilize highly complex technology and operate in the harsh environment of space and are therefore subject to significant operational risks while in orbit. These risks include in-orbit equipment failures, malfunctions and
other problems, commonly referred to as anomalies, that could reduce the commercial usefulness of a satellite used to provide our satellite TV services. Acts of war or terrorism, magnetic, electrostatic or solar storms, or space debris or meteoroids could also damage such satellites. Any loss, failure, manufacturing defect, damage or destruction of these satellites, of our terrestrial broadcasting infrastructure or of Telesat’s tracking, telemetry and control facilities to operate the satellites could have an adverse effect on our business and financial performance and could result in customers terminating their subscriptions to our satellite TV service.
PEOPLEOur employees and contractors are key resources and there is a broad and complex range of risks that must be managed effectively to drive a winning corporate culture and outstanding performance
Our business depends on the efforts, engagement and expertise of our management and non-management employees and contractors, who must be able to operate efficiently and safely based on the tasks they are completing and the environment in which they are functioning. Failure to achieve these basic expectations could adversely affect our organizational culture, reputation, business and financial results, as well as our ability to attract high-performing team members. Competition for highly skilled team members is intense, which makes essential the development of a comprehensive human resources strategy to adequately compete for talent and to identify and secure high-performing candidates for a broad range of job functions, roles and responsibilities. Failure to appropriately train, motivate, remunerate or deploy employees on initiatives that further our strategic imperatives, or to efficiently replace retiring employees, could have an adverse impact on our ability to attract and retain talent and drive performance across the organization. The positive engagement of members of our team represented by unions is contingent on negotiating collective agreements that deliver competitive labour conditions and uninterrupted service, both of which are critical to achieving our business objectives. In addition, if the skill sets, diversity and size of the workforce do not match the operational requirements of the business and foster a winning culture, we will likely not be able to sustain our performance.
The COVID-19 pandemic introduced new, and amplified existing, people-related risks. From the beginning of the COVID-19 pandemic, we prioritized the health and safety of our team by implementing strict sanitation and safety procedures and equipping our teams with required personal protective equipment and additional tools, accelerated remote work arrangements, reallocated impacted employees to different functions where possible, ensured wage support for employees impacted by temporary closures or workload reduction, and provided enhanced access to workplace mental health services. However, we must nonetheless manage health and safety concerns related to the COVID-19 pandemic in relation to our regular daily activities, in addition to the challenges brought about by remote work arrangements. A further
extended period of remote work arrangements could strain our business continuity plans, impair our ability to engage and motivate employees, impact our ability to develop and launch new products and services and introduce additional operational risks or exacerbate our exposure to existing ones, which could impair our ability to manage our business. Potential social or mental fatigue from adjusting to prolonged remote work arrangements could further impact productivity and work-life balance. In addition, labour disruptions and shortages would also negatively affect our ability to sell our products and services, install new services or make repairs on customer premises. Any prolonged illness of our senior executives could have an adverse effect on the management of our business and on our financial results.
Other examples of people-related risks include the following:
• The increasing technical and operational complexity of our businesses and the high demand in the market for skilled resources in strategic areas create a challenging environment for hiring, retaining and developing such skilled resources
• Failure to establish a complete and effective succession plan, including preparation of internal talent and identification of potential external candidates, where relevant, for key roles, could impair our business until qualified replacements are found
• Renewal of collective agreements could result in higher labour costs and be challenging in the context of a declining workload due to transformation, a maturing footprint and improved efficiencies. During the bargaining process there may be project delays and work disruptions, including work stoppages or work slowdowns, which could adversely affect service to our customers and, in turn, our customer relationships and financial performance.
• Ensuring the safety of our workforce operating in different environments, including manholes, telephone poles, cell towers, vehicles, foreign news bureaus and war zones, and/or in times of pandemic, requires focus, effective processes and flexibility to avoid injury, illness, service interruption, fines and reputational impact
• Deterioration in employee morale and engagement resulting from staff reductions, ongoing cost reductions or reorganizations could adversely affect our business and financial results
DEPENDENCE ON THIRD-PARTY SUPPLIERSWe depend on third-party suppliers, outsourcers and consultants, some of which are critical, to provide an uninterrupted supply of the products and services we need to operate our business, deploy new network and other technologies, and offer new products and services, as well as comply with various obligations
We depend on key third-party suppliers and outsourcers, over which we have no operational or financial control, for products and services, some of which are critical to our operations. If there are gaps in our vendor selection, governance and oversight processes established to seek to ensure full risk transparency at point of purchase and throughout the relationship, including any contract renegotiations, there is the potential
9M
D&
A
Busi
ness
ris
ks
BCE InC. 2020 AnnuAl REpoRt | 107
for a breakdown in supply, which could impact our ability to make sales, service customers and achieve our business and financial objectives. In addition, any such gaps could result in suboptimal management of our vendor base, increased costs and missed opportunities. Some of our third-party suppliers and outsourcers are located in foreign countries, which increases the potential for a breakdown in supply due to the risks of operating in foreign jurisdictions with different laws, geopolitical environments and cultures, as well as the potential for localized natural disasters.
We may have to select different third-party suppliers of equipment and other products and services, as well as outsourcers, in order to meet evolving internal company policies and guidelines as well as regulatory requirements. Should we decide, or be required by a governmental authority or otherwise, to terminate our relationship with an existing supplier or outsourcer, this would decrease the number of available suppliers or outsourcers and could result in increased costs, as well as transitional, support, service, quality or continuity issues; delay our ability to deploy new network and other technologies and offer new products and services; and adversely affect our business and financial results.
The outsourcing of services generally involves transfer of risk, and we must take appropriate steps to ensure that the outsourcers’ approach to risk management is aligned with our own standards in order to maintain continuity of supply and brand strength. Further, as cloud-based supplier models continue to evolve, our procurement and vendor management practices must also continue to evolve to fully address associated risk exposures.
In addition, certain company initiatives rely heavily on professional consulting services provided by third parties, and a failure of such third parties may not be reasonably evident until their work is delivered or delayed. Difficulties in implementing remedial strategies in respect of professional consulting services provided by third parties that are not performed in a proper or timely fashion could result in an adverse effect on our ability to comply with various obligations, including applicable legal and accounting requirements.
Other examples of risks associated with our dependence on third-party suppliers include the following:
• We rely upon the successful implementation and execution of business continuity plans by our product and service suppliers. To the extent that such plans do not successfully mitigate the impacts of the COVID-19 pandemic and our suppliers or vendors experience operational failures, such failures could result in supply chain disruptions that could adversely affect our business. Such risk of supply chain disruptions would be increased in the event of further economic downturn and/or liquidity issues affecting our suppliers. Incremental costs, delays or unavailability of equipment, materials and products, as well as unavailability of our suppliers and contractors’ employees, due to government actions, illness, quarantines, absenteeism, workforce reduction initiatives or other restrictions, could further adversely affect our business.
• The insolvency of one or more of our suppliers could cause a breakdown in supply and have an adverse effect on our operations, including our ability to make sales or service customers, as well as on our financial results
• The consequences of the COVID-19 pandemic could adversely impact the operations of our call centres and, consequently, our customer service. Although we have trained certain of our employees to perform
customer service functions, there can be no assurance that a sufficient number of employees have been trained or that they are acquiring the same level of knowledge or efficiency as those in our call centres. Also, as a result of COVID-19 restrictions, many of our call centre operators have had to move their resources to work from home. We rely upon our suppliers to ensure that such employees comply with security requirements while working from a remote location.
• Demand for products and services available from only a limited number of suppliers, some of which dominate their global market, may lead to decreased availability, increased costs or delays in the delivery of such products and services, since suppliers may choose to favour global competitors that are larger than we are and, accordingly, purchase a larger volume of products and services. In addition, production issues affecting any such suppliers, or other suppliers, could result in decreased quantities or a total lack of supply of products or services. Any of these events could adversely impact our ability to meet customer commitments and demand.
• Cloud-based solutions may increase the risk of security and data leakage exposure if security control protocols affecting our suppliers are bypassed
• Failure to maintain strong discipline around vendor administration (especially around initial account setup) may mask potential financial or operational risks and complicate future problem resolutions
• If products and services important to our operations have manufacturing defects or do not comply with applicable government regulations and standards (including product safety practices), our ability to sell products and provide services on a timely basis may be negatively impacted. We work with our suppliers to identify serious product defects (including safety incidents) and develop appropriate remedial strategies, which may include a recall of products. To the extent that a supplier does not actively participate in, and/or bear primary financial responsibility for, a recall of its products, our ability to perform such recall programs at a reasonable cost and/or in a timely fashion may be negatively impacted. Any of the events referred to above could have an adverse effect on our operations and financial results.
• Products (including software) and services supplied to us may contain security issues including, but not limited to, latent security issues that would not be apparent upon an inspection. Should we or a supplier fail to correct a security issue in a timely fashion, there could be an adverse effect on our business, financial results and reputation.
• We rely on other telecommunications carriers from time to time to deliver services. Should these carriers fail to roll out new networks or fail to upgrade existing networks, or should their networks be affected by operational failures or service interruptions, such issues could adversely affect our ability to provide services using such carriers’ networks and could, consequently, have an adverse effect on our business, financial results and reputation.
• BCE depends on call centre and technical support services provided by a number of external suppliers and outsourcers, some of which are located in foreign countries. These vendors have access to customer and internal BCE information necessary for the support services that they provide. Information access and service delivery issues that are not managed appropriately may have an adverse impact on our business, reputation, the quality and speed of services provided to customers, and our ability to address technical issues.

9M
D&
A
Busi
ness
ris
ks
108 | BCE InC. 2020 AnnuAl REpoRt
FINANCIAL MANAGEMENTIf we are unable to raise the capital we need or generate sufficient cash flows from operating activities, we may need to limit our capital expenditures or our investments in new businesses, or try to raise capital by disposing of assets
Our ability to meet our cash requirements, fund capital expenditures and provide for planned growth depends on having access to adequate sources of capital and on our ability to generate cash flows from operating activities, which is subject to various risks, including those described in this MD&A.
Our ability to raise financing depends on our ability to access the public equity, debt capital and money markets, as well as the bank credit market. Our ability to access such markets and the cost and amount of funding available depend largely on prevailing market conditions and the outlook for our business and credit ratings at the time capital is raised.
Risk factors such as capital market disruptions, political, economic and financial market instability in Canada or abroad, government policies, central bank monetary policies, changes to bank capitalization or other regulations, reduced bank lending in general or fewer banks as a result of reduced activity or consolidation, could reduce capital available or increase the cost of such capital. In addition, an increased level of debt borrowings could result in lower credit ratings, increased borrowing costs and a reduction in the amount of funding available to us, including through equity offerings. Business acquisitions could also adversely affect our outlook and credit ratings and have similar adverse consequences. In addition, participants in the public capital and bank credit markets have internal policies limiting their ability to invest in, or extend credit to, any single entity or entity group or a particular industry.
Our bank credit facilities, including credit facilities supporting our commercial paper program, are provided by various financial institutions. While it is our intention to renew certain of such credit facilities from time to time, there are no assurances that these facilities will be renewed on favourable terms or in similar amounts.
Global financial markets have experienced, and could again experience, significant volatility and weakness as a result of the COVID-19 pandemic. Governments and central banks have reacted with significant monetary and fiscal interventions designed to stabilize economic conditions and financial markets. However, the efficacy of the governments’ and central banks’ interventions is uncertain. In addition, it is uncertain whether and for how long such interventions will continue. Economic uncertainty could negatively impact equity and debt capital markets, could cause interest rate and currency volatility and movements, and could adversely affect our ability to raise financing in the public capital, bank credit and/or commercial paper markets as well as the cost thereof. Additionally, the negative impact of the COVID-19 pandemic on our customers’ financial condition could further adversely affect our ability to recover payment of receivables from customers and lead to further increases in bad debts, thereby negatively affecting our revenues and cash flows, as well as our position under our securitized trade receivables programs.
Differences between BCE’s actual or anticipated financial results and the published expectations of financial analysts, as well as events affecting our business or operating environment, may contribute to volatility in BCE’s securities. A major decline in the capital markets in general, or an adjustment in the market price or trading volumes of BCE’s securities, may negatively affect our ability to raise debt or equity capital, retain senior executives and other key employees, make strategic acquisitions or enter into joint ventures.
If we cannot access the capital we need or generate cash flows to implement our business plan or meet our financial obligations on acceptable terms, we may have to limit our ongoing capital expenditures and our investment in new businesses or try to raise additional capital by selling or otherwise disposing of assets. Any of these could have an adverse effect on our cash flows from operating activities and on our growth prospects.
We cannot guarantee that dividends will be increased or declared
Increases in the BCE common share dividend and the declaration of dividends on any of BCE’s outstanding shares are subject to the discretion of the BCE Board and, consequently, there can be no guarantee that the dividend on common shares will be increased or that dividends will be declared. Dividend increases and the declaration of dividends by the BCE Board are ultimately dependent on BCE’s operations and financial results which are, in turn, subject to various assumptions and risks, including those set out in this MD&A.
We are exposed to various credit, liquidity and market risks
Our exposure to credit, liquidity and market risks, including equity price, interest rate and currency fluctuations, is discussed in section 6.5, Financial risk management of this MD&A and in Note 28 to BCE’s 2020 consolidated financial statements.
Our failure to identify and manage our exposure to changes in interest rates, foreign exchange rates, BCE’s share price and other market conditions could lead to missed opportunities, reduced profit margins, cash flow shortages, inability to complete planned capital expenditures, reputational damage, equity and debt securities devaluations, and challenges in raising capital on market-competitive terms.
The economic environment, pension rules or ineffective governance could have an adverse effect on our pension obligations, liquidity and financial performance, and we may be required to increase contributions to our post-employment benefit plans in the future
With a large pension plan membership and DB pension plans that are subject to the pressures of the global economic environment and changing regulatory and reporting requirements, our pension obligations are exposed to potential volatility. Failure to recognize and manage economic exposure and pension rule changes, or to ensure that effective governance is in place for the management and funding of pension plan assets and obligations, could have an adverse impact on our liquidity and financial performance.
The funding requirements of our post-employment benefit plans, based on valuations of plan assets and obligations, depend on a number of factors, including actual returns on post-employment benefit plan assets, long-term interest rates, plan demographics, and applicable regulations and actuarial standards. Changes in these factors could cause future contributions to significantly differ from our current estimates, require us to increase contributions to our post-employment benefit plans in the future and, therefore, have a negative effect on our liquidity and financial performance. In addition, the return on our pension plan assets and/or the discount rate used for valuing our post-employment benefit obligations may both be negatively impacted in the near to medium term by the COVID-19 pandemic. This could have an adverse effect on our post-employment benefit plan obligations and pension contributions in future years.

9M
D&
A
Busi
ness
ris
ks
BCE InC. 2020 AnnuAl REpoRt | 109
There is no assurance that the assets of our post-employment benefit plans will earn their assumed rate of return. A substantial portion of our post-employment benefit plans’ assets is invested in public equity and debt securities. As a result, the ability of our post-employment benefit plans’ assets to earn the rate of return that we have assumed depends significantly on the performance of capital markets. Market conditions also impact the discount rate used to calculate our pension plan solvency obligations and could therefore also significantly affect our cash funding requirements.
Income and commodity tax amounts may materially differ from the expected amounts
Our complex business operations are subject to various tax laws. The adoption of new tax laws, or regulations or rules thereunder, or changes thereto or in the interpretation thereof, could result in higher tax rates, new taxes or other adverse tax implications. In addition, while we believe that we have adequately provided for all income and commodity taxes based on all of the information that is currently available, the calculation of income taxes and the applicability of commodity taxes in many cases require significant judgment in interpreting tax rules and regulations. Our tax filings are subject to government audits that could result in material changes to the amount of current and deferred income tax assets and liabilities and other liabilities and could, in certain circumstances, result in an assessment of interest and penalties.
The failure to reduce costs as well as unexpected increases in costs could adversely affect our ability to achieve our strategic imperatives and financial guidance
Our objectives for targeted cost reductions continue to be aggressive but there is no assurance that we will be successful in reducing costs, especially since incremental cost savings are more difficult to achieve on an ongoing basis. Examples of risks to our ability to reduce costs or limit potential cost increases include the following:
• Increased costs related to the COVID-19 pandemic could continue for a certain period of time
• Our cost reduction objectives require aggressive negotiations with our suppliers and there can be no assurance that such negotiations will be successful or that replacement products or services provided will not lead to operational issues
• Achieving timely cost reductions while moving to an IP-based network is dependent on disciplined network decommissioning, which can be delayed by customer contractual commitments, regulatory considerations and other unforeseen obstacles
• Failure to contain growing operational costs related to network sites, network performance, footprint expansion, spectrum licences and content and equipment acquisition could have a negative effect on our financial performance
• Fluctuations in energy prices are partly influenced by government policies to address climate change such as carbon pricing which, combined with growing data demand that increases our energy requirements, could increase our energy costs beyond our current expectations
• Failure to successfully deliver on our contractual commitments, whether due to security events, operational challenges or other reasons, may result in financial penalties and loss of revenues
The failure to evolve practices to effectively monitor and control fraudulent activities could result in financial loss and brand degradation
As a public company with a range of desirable and valuable products and services and a large number of employees, BCE requires a disciplined program covering governance, exposure identification and assessment, prevention, detection and reporting that considers corruption, misappropriation of assets and intentional manipulation of financial statements by employees and/or external parties. Fraud events can result in financial loss and brand degradation.
Specific examples relevant to us include:
• Copyright theft and other forms of unauthorized use that undermine the exclusivity of Bell Media’s content offerings, which could potentially divert users to unlicensed or otherwise illegitimate platforms, thus impacting our ability to derive distribution and advertising revenues
• Subscription fraud on accounts established with a false identity or paid with a stolen credit card
• Fraudulent (unauthorized) access and manipulation of customer accounts, including through sim-swap and port out fraud
• Network usage fraud such as call/sell operations using our wireline or wireless networks
• Ongoing efforts to steal the services of TV distributors, including Bell Canada and ExpressVu, through compromise or circumvention of signal security systems, causing revenue loss
Economic conditions and changing customer behaviour could lead to further impairment charges and changes to estimates
As a result of the COVID-19 pandemic, in the second quarter of 2020, we recorded an impairment charge in our Bell Media segment relating to certain assets for our English TV, French TV and radio services. It is possible that the estimates currently recorded in our financial results for the year ended December 31, 2020 could change again in the future. This may include valuations and estimates related to allowance for doubtful accounts and impairment of contract assets, both of which take into account current economic conditions, as well as historical and forward-looking information, inventory valuation reserves, impairment of non-financial assets, derivative financial instruments, post-employment benefit plans and other provisions.
LITIGATION AND LEGAL OBLIGATIONSLegal proceedings, changes in applicable laws and the failure to proactively address our legal and regulatory obligations could have an adverse effect on our business and financial performance
We become involved in various claims and legal proceedings as part of our business. Plaintiffs are able to launch and obtain certification of class actions on behalf of a large group of people with increasing ease, and securities laws facilitate the introduction of class action lawsuits by secondary market investors against public companies for alleged misrepresentations in public disclosure documents and
oral statements. Changes in laws or regulations, or in how they are interpreted, and the adoption of new laws or regulations, as well as pending or future litigation, including an increase in certified class actions which, by their nature, could result in sizeable damage awards and costs relating to litigation, could have an adverse effect on our business, financial performance and reputation. In addition, the increase in laws and regulations around customer interactions and the technological evolution of our business create an environment of complex compliance requirements which must be adequately managed.
9M
D&
A
Busi
ness
ris
ks
110 | BCE InC. 2020 AnnuAl REpoRt
Examples of legal and regulatory obligations that we must comply with include those resulting from:
• As discussed in more detail in section 8, Regulatory environment, policies and other initiatives of the CRTC, ISED, the Competition Bureau and other governmental agencies, as well as laws of a regulatory nature
• Consumer protection legislation
• Privacy legislation, such as Canada’s anti-spam legislation (CASL) and the Personal Information Protection and Electronic Documents Act, as well as other privacy legislation we may become subject to via mandatory flow-through of privacy-related obligations by our customers, including the General Data Protection Regulation (EU)
• Tax legislation
• Corporate and securities legislation
• IFRS requirements
• Environmental protection and health and safety laws
• Payment card industry standards for protection against customer credit card infractions
The failure to comply with any of the above or other legal or regulatory obligations could expose us to litigation, including pursuant to class actions, and significant fines and penalties, as well as result in reputational harm.
For a description of important legal proceedings involving us, please see the section entitled Legal proceedings contained in the BCE 2020 AIF.
Finally, the failure of our employees, suppliers or other business partners to comply with applicable legal and ethical standards including, without limitation, anti-bribery laws, as well as our policies and contractual obligations, could also expose us to litigation and significant fines and penalties, and result in reputational harm or being disqualified from bidding on contracts.
ENVIRONMENTAL AND HEALTH CONCERNSClimate change and other environmental concerns could have an adverse effect on our business
Global climate change could exacerbate certain of the threats facing our business, including the frequency and severity of weather-related events referred to in Operational performance – Our operations and business continuity depend on how well we protect, test, maintain, replace and upgrade our networks, IT systems, equipment and other facilities in this section 9. Given that some of our third-party suppliers and outsourcers are located in foreign countries, localized natural disasters in such countries could further negatively impact our business. In addition, rising mean temperatures and extended heat waves could increase the need for cooling capacity in our network infrastructure, thus increasing our energy consumption and associated costs. Several areas of our operations also raise environmental considerations, such as fuel storage, GHG emissions, disposal of hazardous residual materials, and recovery and recycling of end-of-life electronic products we sell or lease. In addition, our team members, customers and investors expect that we regard environmental protection as an integral part of doing business and that we seek to minimize the negative environmental impacts of our operations and create positive impacts where possible. Failure to recognize and adequately respond to their changing expectations as well as those of governments on environmental matters, and to take action to reduce our negative impacts on the environment, could result in fines, missed opportunities, additional regulatory scrutiny, loss of team members, customers and investors, and harm our brand and reputation.
Health concerns about radiofrequency emissions from wireless communication devices and equipment could have an adverse effect on our business
Many studies have been performed or are ongoing to assess whether wireless phones, networks and towers pose a potential health risk. While some studies suggest links to certain conditions, others conclude there
is no established causation between mobile phone usage and adverse health effects. In 2011, the International Agency for Research on Cancer (IARC) of the World Health Organization classified radiofrequency electromagnetic fields from wireless phones as possibly carcinogenic to humans, but also indicated that chance, bias or confounding could not be ruled out with reasonable confidence. The IARC also called for additional research into long-term heavy use of mobile phones.
ISED is responsible for approving radiofrequency equipment and performing compliance assessments and has chosen Health Canada’s Safety Code 6, which sets the limits for safe exposure to radiofrequency emissions at home or at work, as its exposure standard. This code also outlines safety requirements for the installation and operation of devices that emit radiofrequency fields such as mobile phones, Wi-Fi technologies and base station antennas. ISED has made compliance to Safety Code 6 mandatory for all proponents and operators of radio installations.
Our business is heavily dependent on radiofrequency technologies, which could present significant challenges to our business and financial performance, such as the following:
• We may face lawsuits relating to alleged adverse health effects on customers, as well as relating to our marketing and disclosure practices in connection therewith, and the likely outcome of such potential lawsuits would be unpredictable and could change over time
• Changes in scientific evidence and/or public perceptions could lead to additional government regulations and costs for retrofitting infrastructure and handsets to achieve compliance
• Public concerns could result in a slower deployment of, or in our inability to deploy, infrastructure necessary to maintain and/or expand our wireless network as required by market evolution
Any of these events could have an adverse effect on our business and financial performance.

10M
D&
A
Fina
ncia
l mea
sure
s, a
ccou
ntin
g po
licie
s an
d co
ntro
ls
BCE InC. 2020 AnnuAl REpoRt | 111
10 Financial measures, accounting policies and controls
10.1 Our accounting policiesThis section discusses key estimates and assumptions that management has made and how they affect the amounts reported in the financial statements and notes. It also describes key changes in accounting standards and our accounting policies, and how they affect our financial statements.
We have prepared our consolidated financial statements using IFRS. Other significant accounting policies, not involving the same level of measurement uncertainty as those discussed in this section, are nevertheless important to an understanding of our financial statements. See Note 2, Significant accounting policies, and Note 3, Discontinued operations, in BCE’s 2020 consolidated financial statements for more information about the accounting principles we used to prepare our consolidated financial statements.
CRITICAL ACCOUNTING ESTIMATES AND KEY JUDGMENTSWhen preparing the financial statements, management makes estimates and judgments relating to:
• reported amounts of revenues and expenses
• reported amounts of assets and liabilities
• disclosure of contingent assets and liabilities
We base our estimates on a number of factors, including historical experience, current events, including but not limited to the COVID-19 pandemic, and actions that the company may undertake in the future, as well as other assumptions that we believe are reasonable under the circumstances. By their nature, these estimates and judgments are subject to measurement uncertainty and actual results could differ.
We consider the estimates and judgments described in this section to be an important part of understanding our financial statements because they require management to make assumptions about matters that were highly uncertain at the time the estimates and judgments were made, and changes to these estimates and judgments could have a material impact on our financial statements and our segments.
Our senior management has reviewed the development and selection of the critical accounting estimates and judgments described in this section with the Audit Committee of the BCE Board.
Any sensitivity analysis included in this section should be used with caution as the changes are hypothetical and the impact of changes in each key assumption may not be linear.
Our more significant estimates and judgments are described below.
ESTIMATES
USEFUL LIVES OF PROPERTY, PLANT AND EQUIPMENT AND FINITE-LIFE INTANGIBLE ASSETS
We review our estimates of the useful lives of property, plant and equipment and finite-life intangible assets on an annual basis and adjust depreciation or amortization on a prospective basis, as required.
Property, plant and equipment represent a significant proportion of our total assets. Changes in technology or our intended use of these assets, as well as changes in business prospects or economic and industry factors, may cause the estimated useful lives of these assets to change.
The estimated useful lives of property, plant and equipment and finite-life intangible assets are determined by internal asset life studies, which take into account actual and expected future usage, physical wear and tear, replacement history and assumptions about technology evolution. When factors indicate that assets’ useful lives are different from the prior assessment, we depreciate or amortize the remaining carrying value prospectively over the adjusted estimated useful lives.
POST-EMPLOYMENT BENEFIT PLANS
The amounts reported in the financial statements relating to DB pension plans and OPEBs are determined using actuarial calculations that are based on several assumptions.
Our actuaries perform a valuation at least every three years to determine the actuarial present value of the accrued DB pension plan and OPEB obligations. The actuarial valuation uses management’s assumptions for, among other things, the discount rate, life expectancy, the rate of compensation increase, trends in healthcare costs and expected average remaining years of service of employees.
While we believe that these assumptions are reasonable, differences in actual results or changes in assumptions could materially affect post-employment benefit obligations and future net post-employment benefit plans cost.
We account for differences between actual and expected results in benefit obligations and plan performance in OCI, which are then recognized immediately in the deficit.
The most significant assumptions used to calculate the net post-employment benefit plans cost are the discount rate and life expectancy.
A discount rate is used to determine the present value of the future cash flows that we expect will be needed to settle post-employment benefit obligations.
The discount rate is based on the yield on long-term, high-quality corporate fixed income investments, with maturities matching the estimated cash flows of the post-employment benefit plans. Life expectancy is based on publicly available Canadian mortality tables and is adjusted for the company’s specific experience.
A lower discount rate and a higher life expectancy result in a higher net post-employment benefit obligation and a higher current service cost.
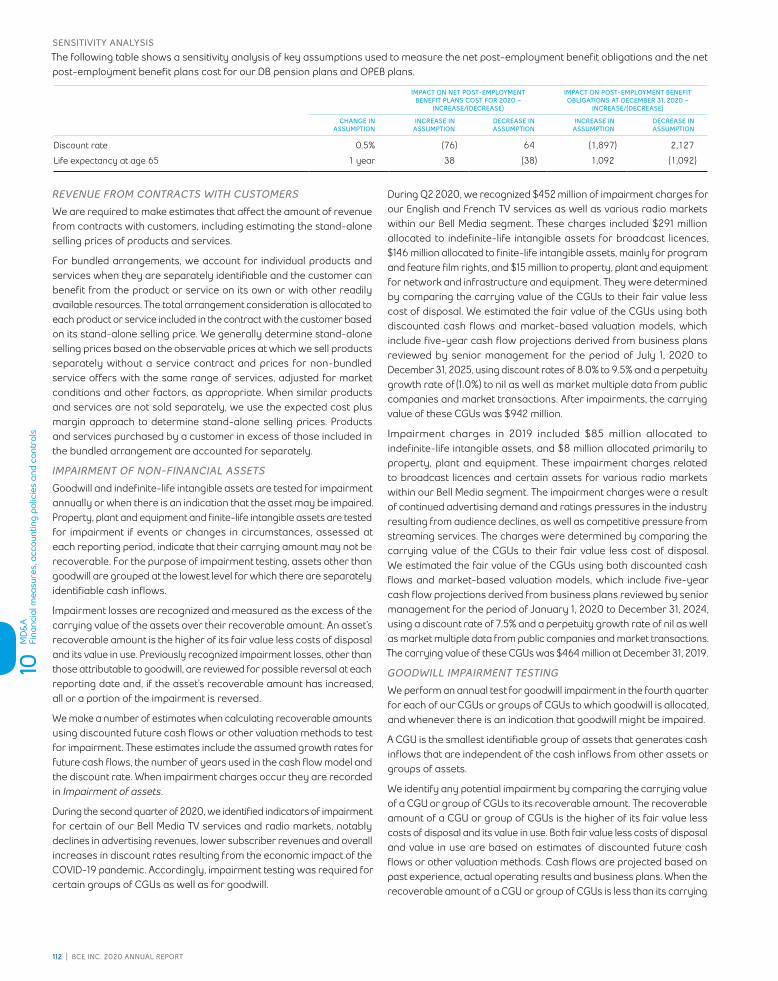
10M
D&
A
Fina
ncia
l mea
sure
s, a
ccou
ntin
g po
licie
s an
d co
ntro
ls
112 | BCE InC. 2020 AnnuAl REpoRt
SENSITIVITY ANALYSIS
The following table shows a sensitivity analysis of key assumptions used to measure the net post-employment benefit obligations and the net post-employment benefit plans cost for our DB pension plans and OPEB plans.
IMPACT ON NET POST-EMPLOYMENT BENEFIT PLANS COST FOR 2020 –
INCREASE/(DECREASE)
IMPACT ON POST-EMPLOYMENT BENEFIT OBLIGATIONS AT DECEMBER 31, 2020 –
INCREASE/(DECREASE)
CHANGE IN ASSUMPTION
INCREASE IN ASSUMPTION
DECREASE IN ASSUMPTION
INCREASE IN ASSUMPTION
DECREASE IN ASSUMPTION
Discount rate 0.5% (76) 64 (1,897) 2,127
Life expectancy at age 65 1 year 38 (38) 1,092 (1,092)
REVENUE FROM CONTRACTS WITH CUSTOMERS
We are required to make estimates that affect the amount of revenue from contracts with customers, including estimating the stand-alone selling prices of products and services.
For bundled arrangements, we account for individual products and services when they are separately identifiable and the customer can benefit from the product or service on its own or with other readily available resources. The total arrangement consideration is allocated to each product or service included in the contract with the customer based on its stand-alone selling price. We generally determine stand-alone selling prices based on the observable prices at which we sell products separately without a service contract and prices for non-bundled service offers with the same range of services, adjusted for market conditions and other factors, as appropriate. When similar products and services are not sold separately, we use the expected cost plus margin approach to determine stand-alone selling prices. Products and services purchased by a customer in excess of those included in the bundled arrangement are accounted for separately.
IMPAIRMENT OF NON-FINANCIAL ASSETS
Goodwill and indefinite-life intangible assets are tested for impairment annually or when there is an indication that the asset may be impaired. Property, plant and equipment and finite-life intangible assets are tested for impairment if events or changes in circumstances, assessed at each reporting period, indicate that their carrying amount may not be recoverable. For the purpose of impairment testing, assets other than goodwill are grouped at the lowest level for which there are separately identifiable cash inflows.
Impairment losses are recognized and measured as the excess of the carrying value of the assets over their recoverable amount. An asset’s recoverable amount is the higher of its fair value less costs of disposal and its value in use. Previously recognized impairment losses, other than those attributable to goodwill, are reviewed for possible reversal at each reporting date and, if the asset’s recoverable amount has increased, all or a portion of the impairment is reversed.
We make a number of estimates when calculating recoverable amounts using discounted future cash flows or other valuation methods to test for impairment. These estimates include the assumed growth rates for future cash flows, the number of years used in the cash flow model and the discount rate. When impairment charges occur they are recorded in Impairment of assets.
During the second quarter of 2020, we identified indicators of impairment for certain of our Bell Media TV services and radio markets, notably declines in advertising revenues, lower subscriber revenues and overall increases in discount rates resulting from the economic impact of the COVID-19 pandemic. Accordingly, impairment testing was required for certain groups of CGUs as well as for goodwill.
During Q2 2020, we recognized $452 million of impairment charges for our English and French TV services as well as various radio markets within our Bell Media segment. These charges included $291 million allocated to indefinite-life intangible assets for broadcast licences, $146 million allocated to finite-life intangible assets, mainly for program and feature film rights, and $15 million to property, plant and equipment for network and infrastructure and equipment. They were determined by comparing the carrying value of the CGUs to their fair value less cost of disposal. We estimated the fair value of the CGUs using both discounted cash flows and market-based valuation models, which include five-year cash flow projections derived from business plans reviewed by senior management for the period of July 1, 2020 to December 31, 2025, using discount rates of 8.0% to 9.5% and a perpetuity growth rate of (1.0%) to nil as well as market multiple data from public companies and market transactions. After impairments, the carrying value of these CGUs was $942 million.
Impairment charges in 2019 included $85 million allocated to indefinite-life intangible assets, and $8 million allocated primarily to property, plant and equipment. These impairment charges related to broadcast licences and certain assets for various radio markets within our Bell Media segment. The impairment charges were a result of continued advertising demand and ratings pressures in the industry resulting from audience declines, as well as competitive pressure from streaming services. The charges were determined by comparing the carrying value of the CGUs to their fair value less cost of disposal. We estimated the fair value of the CGUs using both discounted cash flows and market-based valuation models, which include five-year cash flow projections derived from business plans reviewed by senior management for the period of January 1, 2020 to December 31, 2024, using a discount rate of 7.5% and a perpetuity growth rate of nil as well as market multiple data from public companies and market transactions. The carrying value of these CGUs was $464 million at December 31, 2019.
GOODWILL IMPAIRMENT TESTING
We perform an annual test for goodwill impairment in the fourth quarter for each of our CGUs or groups of CGUs to which goodwill is allocated, and whenever there is an indication that goodwill might be impaired.
A CGU is the smallest identifiable group of assets that generates cash inflows that are independent of the cash inflows from other assets or groups of assets.
We identify any potential impairment by comparing the carrying value of a CGU or group of CGUs to its recoverable amount. The recoverable amount of a CGU or group of CGUs is the higher of its fair value less costs of disposal and its value in use. Both fair value less costs of disposal and value in use are based on estimates of discounted future cash flows or other valuation methods. Cash flows are projected based on past experience, actual operating results and business plans. When the recoverable amount of a CGU or group of CGUs is less than its carrying

10M
D&
A
Fina
ncia
l mea
sure
s, a
ccou
ntin
g po
licie
s an
d co
ntro
ls
BCE InC. 2020 AnnuAl REpoRt | 113
value, the recoverable amount is determined for its identifiable assets and liabilities. The excess of the recoverable amount of the CGU or group of CGUs over the total of the amounts assigned to its assets and liabilities is the recoverable amount of goodwill.
An impairment charge is recognized in Impairment of assets in the income statements for any excess of the carrying value of goodwill over its recoverable amount. For purposes of impairment testing of goodwill, our CGUs or groups of CGUs correspond to our reporting segments as disclosed in Note 4, Segmented information, in BCE’s 2020 consolidated financial statements.
Any significant change in each of the estimates used could have a material impact on the calculation of the recoverable amount and resulting impairment charge. As a result, we are unable to reasonably quantify the changes in our overall financial performance if we had used different assumptions.
We cannot predict whether an event that triggers impairment will occur, when it will occur or how it will affect the asset values we have reported.
We believe that any reasonable possible change in the key assumptions on which the estimate of recoverable amounts of the Bell Wireless or Bell Wireline groups of CGUs is based would not cause their carrying amounts to exceed their recoverable amounts.
During the second quarter of 2020, we identified indicators that goodwill for our Bell Media group of CGUs may be impaired as a result of the economic impact of the COVID-19 pandemic, notably declines in advertising revenues, lower subscriber revenues and increases in discount rates. The impairment testing did not result in an impairment of goodwill.
For the Bell Media group of CGUs, the recoverable amount determined in the second quarter of 2020 has been carried forward and used in the annual impairment test. A decrease of (0.6%) in the perpetuity growth rate or an increase of 0.4% in the discount rate would have resulted in its recoverable amount being equal to its carrying value.
There were no goodwill impairment charges in 2020 or 2019.
DEFERRED TAXES
Deferred tax assets and liabilities are calculated at the tax rates that are expected to apply when the asset or liability is recovered or settled. Both our current and deferred tax assets and liabilities are calculated using tax rates that have been enacted or substantively enacted at the reporting date.
Deferred taxes are provided on temporary differences arising from investments in subsidiaries, joint arrangements and associates, except where we control the timing of the reversal of the temporary difference and it is probable that the temporary difference will not reverse in the foreseeable future.
The amounts of deferred tax assets and liabilities are estimated with consideration given to the timing, sources and amounts of future taxable income.
LEASES
The application of IFRS 16 requires us to make estimates that affect the measurement of right-of-use assets and liabilities, including determining the appropriate discount rate used to measure lease liabilities. Lease liabilities are initially measured at the present value of the lease payments that are not paid at the commencement date, discounted using our
incremental borrowing rate, unless the rate implicit in the lease is readily determinable. Our incremental borrowing rate is derived from publicly available risk-free interest rates, adjusted for applicable credit spreads and lease terms. We apply a single incremental borrowing rate to a portfolio of leases with similar characteristics.
FAIR VALUE OF FINANCIAL INSTRUMENTS
Certain financial instruments, such as investments in equity securities, derivative financial instruments and certain elements of borrowings, are carried in the statements of financial position at fair value, with changes in fair value reflected in the income statements and the statements of comprehensive income. Fair values are estimated by reference to published price quotations or by using other valuation techniques that may include inputs that are not based on observable market data, such as discounted cash flows and earnings multiples.
CONTINGENCIES
In the ordinary course of business, we become involved in various claims and legal proceedings seeking monetary damages and other relief. Pending claims and legal proceedings represent a potential cost to our business. We estimate the amount of a loss by analyzing potential outcomes and assuming various litigation and settlement strategies, based on information that is available at the time.
If the final resolution of a legal or regulatory matter results in a judgment against us or requires us to pay a large settlement, it could have a material adverse effect on our consolidated financial statements in the period in which the judgment or settlement occurs.
ONEROUS CONTRACTS
A provision for onerous contracts is recognized when the unavoidable costs of meeting our obligations under a contract exceed the expected benefits to be received under the contract. The provision is measured at the present value of the lower of the expected cost of terminating the contract and the expected net cost of completing the contract.
JUDGMENTS
POST-EMPLOYMENT BENEFIT PLANS
The determination of the discount rate used to value our post-employment benefit obligations requires judgment. The rate is set by reference to market yields of long-term, high-quality corporate fixed income investments at the beginning of each fiscal year. Significant judgment is required when setting the criteria for fixed income investments to be included in the population from which the yield curve is derived. The most significant criteria considered for the selection of investments include the size of the issue and credit quality, along with the identification of outliers, which are excluded.
INCOME TAXES
The calculation of income taxes requires judgment in interpreting tax rules and regulations. There are transactions and calculations for which the ultimate tax determination is uncertain. Our tax filings are also subject to audits, the outcome of which could change the amount of current and deferred tax assets and liabilities. Management believes that it has sufficient amounts accrued for outstanding tax matters based on information that currently is available.
Management judgment is used to determine the amounts of deferred tax assets and liabilities to be recognized. In particular, judgment is required when assessing the timing of the reversal of temporary differences to which future income tax rates are applied.

10M
D&
A
Fina
ncia
l mea
sure
s, a
ccou
ntin
g po
licie
s an
d co
ntro
ls
114 | BCE InC. 2020 AnnuAl REpoRt
LEASES
The application of IFRS 16 requires us to make judgments that affect the measurement of right-of-use assets and liabilities. A lease contract conveys the right to control the use of an identified asset for a period of time in exchange for consideration. At inception of the contract, we assess whether the contract contains an identified asset, whether we have the right to obtain substantially all of the economic benefits from use of the asset and whether we have the right to direct how and for what purpose the asset is used. In determining the lease term, we include periods covered by renewal options when we are reasonably certain to exercise those options. Similarly, we include periods covered by termination options when we are reasonably certain not to exercise those options. To assess if we are reasonably certain to exercise an option, we consider all facts and circumstances that create an economic incentive to exercise renewal options (or not exercise termination options). Economic incentives include the costs related to the termination of the lease, the significance of any leasehold improvements and the importance of the underlying assets to our operations.
REVENUE FROM CONTRACTS WITH CUSTOMERS
The identification of performance obligations within a contract and the timing of satisfaction of performance obligations under long-term contracts requires judgment. For bundled arrangements, we account for individual products and services when they are separately identifiable and the customer can benefit from the product or service on its own or with other readily available resources. When our right to consideration from a customer corresponds directly with the value to the customer of the products and services transferred to date, we recognize revenue in the amount to which we have a right to invoice. We recognize product revenues from the sale of wireless handsets and devices and wireline equipment when a customer takes possession of the product. We
recognize service revenues over time, as the services are provided. Revenues on certain long-term contracts are recognized using output methods based on products delivered, performance completed to date, time elapsed or milestones met.
Additionally, the determination of costs to obtain a contract, including the identification of incremental costs, also requires judgment. Incremental costs of obtaining a contract with a customer, principally comprised of sales commissions and prepaid contract fulfillment costs, are included in contract costs in the statements of financial position, except where the amortization period is one year or less, in which case costs of obtaining a contract are immediately expensed. Capitalized costs are amortized on a systematic basis that is consistent with the period and pattern of transfer to the customer of the related products or services.
CGUs
The determination of CGUs or groups of CGUs for the purpose of impairment testing requires judgment.
CONTINGENCIES
The determination of whether a loss is probable from claims and legal proceedings and whether an outflow of resources is likely requires judgment.
We accrue a potential loss if we believe a loss is probable and an outflow of resources is likely and can be reasonably estimated, based on information that is available at the time. Any accrual would be charged to earnings and included in Trade payables and other liabilities or Other non-current liabilities. Any payment as a result of a judgment or cash settlement would be deducted from cash from operating activities. We estimate the amount of a loss by analyzing potential outcomes and assuming various litigation and settlement strategies.
ADOPTION OF NEW OR AMENDED ACCOUNTING STANDARDSAs required, effective January 1, 2020, we adopted the following new or amended accounting standards.
STANDARD DESCRIPTION IMPACT
IFRIC Agenda Decision on IFRS 16 – Leases
International Financial Reporting Interpretations Committee (IFRIC) agenda decision clarifying the determination of the lease term for cancellable or renewable leases under IFRS 16.
This agenda decision did not have a significant impact on our financial statements.
Definition of a Business, Amendments to IFRS 3 – Business Combinations
These amendments to the implementation guidance of IFRS 3 clarify the definition of a business to assist entities to determine whether a transaction should be accounted for as a business combination or an asset acquisition.
These amendments did not have any impact on our financial statements. They may affect whether future acquisitions are accounted for as business combinations or asset acquisitions, along with the resulting allocation of the purchase price between the net identifiable assets acquired and goodwill.
FUTURE CHANGES TO ACCOUNTING STANDARDSThe following amended accounting standards issued by the IASB have an effective date after December 31, 2020 and have not yet been adopted by BCE.
STANDARD DESCRIPTION IMPACT EFFECTIVE DATE
COVID-19-Related Rent Concessions, Amendment to IFRS 16 – Leases
This amendment provides an optional relief to lessees from applying IFRS 16’s guidance on lease modification accounting for rent concessions arising as a direct consequence of the COVID-19 pandemic.
We did not adopt the optional relief.
Effective for annual reporting periods beginning on or after June 1, 2020. Early application is permitted.
Onerous Contracts – Cost of Fulfilling a Contract, Amendments to IAS 37 – Provisions, contingent liabilities and contingent assets
These amendments clarify which costs should be included in determining the cost of fulfilling a contract when assessing whether a contract is onerous.
We are currently assessing the impact of these amendments.
Effective for annual reporting periods beginning on or after January 1, 2022. Early application is permitted.

10M
D&
A
Fina
ncia
l mea
sure
s, a
ccou
ntin
g po
licie
s an
d co
ntro
ls
BCE InC. 2020 AnnuAl REpoRt | 115
10.2 Non-GAAP financial measures and key performance indicators (KPIs)This section describes the non-GAAP financial measures and KPIs we use in this MD&A to explain our financial results. It also provides reconciliations of the non-GAAP financial measures to the most comparable IFRS financial measures.
In 2020, we updated our definitions of adjusted net earnings, adjusted EPS and free cash flow to exclude the impacts of discontinued operations as they may affect the comparability of our financial results and could potentially distort the analysis of trends in business performance. As a result of this change, prior periods have been restated for comparative purposes.
ADJUSTED EBITDA AND ADJUSTED EBITDA MARGINThe terms adjusted EBITDA and adjusted EBITDA margin do not have any standardized meaning under IFRS. Therefore, they are unlikely to be comparable to similar measures presented by other issuers.
We define adjusted EBITDA as operating revenues less operating costs as shown in BCE’s consolidated income statements. Adjusted EBITDA for BCE’s segments is the same as segment profit as reported in Note 4, Segmented information, in BCE’s 2020 consolidated financial statements. We define adjusted EBITDA margin as adjusted EBITDA divided by operating revenues.
We use adjusted EBITDA and adjusted EBITDA margin to evaluate the performance of our businesses as they reflect their ongoing profitability. We believe that certain investors and analysts use adjusted EBITDA to measure a company’s ability to service debt and to meet other payment obligations or as a common measurement to value companies in the telecommunications industry. We believe that certain investors and analysts also use adjusted EBITDA and adjusted EBITDA margin to evaluate the performance of our businesses. Adjusted EBITDA is also one component in the determination of short-term incentive compensation for all management employees.
Adjusted EBITDA and adjusted EBITDA margin have no directly comparable IFRS financial measure. Alternatively, the following table provides a reconciliation of net earnings to adjusted EBITDA.
2020 2019
Net earnings 2,699 3,253
Severance, acquisition and other costs 116 114
Depreciation 3,475 3,458
Amortization 929 886
Finance costs
Interest expense 1,110 1,125
Interest on post-employment benefit obligations 46 63
Impairment of assets 472 102
Other expense (income) 194 (95)
Income taxes 792 1,129
Net earnings from discontinued operations (226) (29)
Adjusted EBITDA 9,607 10,006
BCE operating revenues 22,883 23,793
Adjusted EBITDA margin 42.0% 42.1%
ADJUSTED NET EARNINGS AND ADJUSTED EPSThe terms adjusted net earnings and adjusted EPS do not have any standardized meaning under IFRS. Therefore, they are unlikely to be comparable to similar measures presented by other issuers.
We define adjusted net earnings as net earnings attributable to common shareholders before severance, acquisition and other costs, net mark-to-market losses (gains) on derivatives used to economically hedge equity settled share-based compensation plans, net losses (gains) on investments, early debt redemption costs, impairment of assets and discontinued operations, net of tax and NCI. We define adjusted EPS as adjusted net earnings per BCE common share.
We use adjusted net earnings and adjusted EPS, and we believe that certain investors and analysts use these measures, among other ones, to assess the performance of our businesses without the effects of severance, acquisition and other costs, net mark-to-market losses (gains) on derivatives used to economically hedge equity settled share-based compensation plans, net losses (gains) on investments, early debt redemption costs, impairment of assets and discontinued operations, net of tax and NCI. We exclude these items because they affect the comparability of our financial results and could potentially distort the analysis of trends in business performance. Excluding these items does not imply they are non-recurring.
The most comparable IFRS financial measures are net earnings attributable to common shareholders and EPS.

10M
D&
A
Fina
ncia
l mea
sure
s, a
ccou
ntin
g po
licie
s an
d co
ntro
ls
116 | BCE InC. 2020 AnnuAl REpoRt
The following table is a reconciliation of net earnings attributable to common shareholders and EPS to adjusted net earnings on a consolidated basis and per BCE common share (adjusted EPS), respectively.
2020 2019
TOTAL PER SHARE TOTAL PER SHARE
Net earnings attributable to common shareholders 2,498 2.76 3,040 3.37
Severance, acquisition and other costs 85 0.10 83 0.10
Net mark-to-market losses (gains) on derivatives used to economically hedge equity settled share-based compensation plans 37 0.04 (101) (0.11)
Net (gains) losses on investments (46) (0.05) 39 0.04
Early debt redemption costs 37 0.04 13 0.01
Impairment of assets 345 0.38 74 0.08
Net earnings from discontinued operations (226) (0.25) (29) (0.03)
Adjusted net earnings 2,730 3.02 3,119 3.46
FREE CASH FLOW AND DIVIDEND PAYOUT RATIOThe terms free cash flow and dividend payout ratio do not have any standardized meaning under IFRS. Therefore, they are unlikely to be comparable to similar measures presented by other issuers.
We define free cash flow as cash flows from operating activities, excluding cash from discontinued operations, acquisition and other costs paid (which include significant litigation costs) and voluntary pension funding, less capital expenditures, preferred share dividends and dividends paid by subsidiaries to NCI. We exclude cash from discontinued operations, acquisition and other costs paid and voluntary pension funding because they affect the comparability of our financial results and could potentially distort the analysis of trends in business performance. Excluding these items does not imply they are non-recurring.
We consider free cash flow to be an important indicator of the financial strength and performance of our businesses because it shows how much cash is available to pay dividends on common shares, repay debt and reinvest in our company. We believe that certain investors and analysts use free cash flow to value a business and its underlying assets and to evaluate the financial strength and performance of our businesses. The most comparable IFRS financial measure is cash flows from operating activities.
We define dividend payout ratio as dividends paid on common shares divided by free cash flow. We consider dividend payout ratio to be an important indicator of the financial strength and performance of our businesses because it shows the sustainability of the company’s dividend payments.
The following table is a reconciliation of cash flows from operating activities to free cash flow on a consolidated basis.
2020 2019
Cash flows from operating activities 7,754 7,958
Capital expenditures (4,202) (3,974)
Cash dividends paid on preferred shares (132) (147)
Cash dividends paid by subsidiaries to NCI (53) (65)
Acquisition and other costs paid 35 60
Cash from discontinued operations (included in cash flows from operating activities) (54) (94)
Free cash flow 3,348 3,738
NET DEBTThe term net debt does not have any standardized meaning under IFRS. Therefore, it is unlikely to be comparable to similar measures presented by other issuers.
We define net debt as debt due within one year plus long-term debt and 50% of preferred shares, less cash and cash equivalents, as shown in BCE’s consolidated statements of financial position. We include 50% of outstanding preferred shares in our net debt as it is consistent with the treatment by certain credit rating agencies.
We consider net debt to be an important indicator of the company’s financial leverage because it represents the amount of debt that is not covered by available cash and cash equivalents. We believe that certain investors and analysts use net debt to determine a company’s financial leverage.
Net debt has no directly comparable IFRS financial measure, but rather is calculated using several asset and liability categories from the statements of financial position, as shown in the following table.
2020 2019
Debt due within one year 2,417 3,881
Long-term debt 23,906 22,415
50% of outstanding preferred shares 2,002 2,002
Cash and cash equivalents (224) (145)
Net debt 28,101 28,153
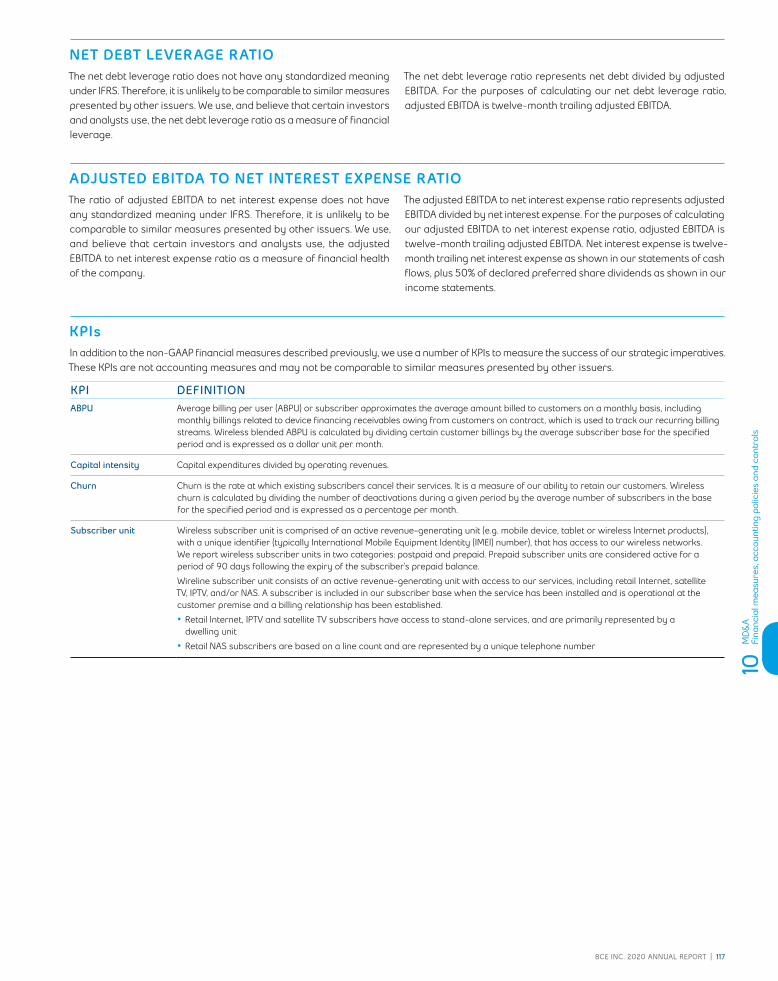
10M
D&
A
Fina
ncia
l mea
sure
s, a
ccou
ntin
g po
licie
s an
d co
ntro
ls
BCE InC. 2020 AnnuAl REpoRt | 117
NET DEBT LEVERAGE RATIOThe net debt leverage ratio does not have any standardized meaning under IFRS. Therefore, it is unlikely to be comparable to similar measures presented by other issuers. We use, and believe that certain investors and analysts use, the net debt leverage ratio as a measure of financial leverage.
The net debt leverage ratio represents net debt divided by adjusted EBITDA. For the purposes of calculating our net debt leverage ratio, adjusted EBITDA is twelve-month trailing adjusted EBITDA.
ADJUSTED EBITDA TO NET INTEREST EXPENSE RATIOThe ratio of adjusted EBITDA to net interest expense does not have any standardized meaning under IFRS. Therefore, it is unlikely to be comparable to similar measures presented by other issuers. We use, and believe that certain investors and analysts use, the adjusted EBITDA to net interest expense ratio as a measure of financial health of the company.
The adjusted EBITDA to net interest expense ratio represents adjusted EBITDA divided by net interest expense. For the purposes of calculating our adjusted EBITDA to net interest expense ratio, adjusted EBITDA is twelve-month trailing adjusted EBITDA. Net interest expense is twelve-month trailing net interest expense as shown in our statements of cash flows, plus 50% of declared preferred share dividends as shown in our income statements.
KPIsIn addition to the non-GAAP financial measures described previously, we use a number of KPIs to measure the success of our strategic imperatives. These KPIs are not accounting measures and may not be comparable to similar measures presented by other issuers.
KPI DEFINITIONABPU Average billing per user (ABPU) or subscriber approximates the average amount billed to customers on a monthly basis, including
monthly billings related to device financing receivables owing from customers on contract, which is used to track our recurring billing streams. Wireless blended ABPU is calculated by dividing certain customer billings by the average subscriber base for the specified period and is expressed as a dollar unit per month.
Capital intensity Capital expenditures divided by operating revenues.
Churn Churn is the rate at which existing subscribers cancel their services. It is a measure of our ability to retain our customers. Wireless churn is calculated by dividing the number of deactivations during a given period by the average number of subscribers in the base for the specified period and is expressed as a percentage per month.
Subscriber unit Wireless subscriber unit is comprised of an active revenue-generating unit (e.g. mobile device, tablet or wireless Internet products), with a unique identifier (typically International Mobile Equipment Identity (IMEI) number), that has access to our wireless networks. We report wireless subscriber units in two categories: postpaid and prepaid. Prepaid subscriber units are considered active for a period of 90 days following the expiry of the subscriber’s prepaid balance.
Wireline subscriber unit consists of an active revenue-generating unit with access to our services, including retail Internet, satellite TV, IPTV, and/or NAS. A subscriber is included in our subscriber base when the service has been installed and is operational at the customer premise and a billing relationship has been established.
• Retail Internet, IPTV and satellite TV subscribers have access to stand-alone services, and are primarily represented by a dwelling unit
• Retail NAS subscribers are based on a line count and are represented by a unique telephone number

10M
D&
A
Fina
ncia
l mea
sure
s, a
ccou
ntin
g po
licie
s an
d co
ntro
ls
118 | BCE InC. 2020 AnnuAl REpoRt
10.3 Effectiveness of internal controlsDISCLOSURE CONTROLS AND PROCEDURESOur disclosure controls and procedures are designed to provide reasonable assurance that information required to be disclosed by us in reports filed or submitted under Canadian and U.S. securities laws is recorded, processed, summarized and reported within the time periods specified under those laws, and include controls and procedures that are designed to ensure that the information is accumulated and communicated to management, including BCE’s President and CEO and Executive Vice-President and Chief Financial Officer (CFO), to allow timely decisions regarding required disclosure.
As at December 31, 2020, management evaluated, under the supervision of and with the participation of the CEO and the CFO, the effectiveness of our disclosure controls and procedures, as defined in Rule 13a-15(e) under the U.S. Securities Exchange Act of 1934, as amended, and under National Instrument 52-109 – Certification of Disclosure in Issuers’ Annual and Interim Filings.
Based on that evaluation, the CEO and CFO concluded that our disclosure controls and procedures were effective as at December 31, 2020.
INTERNAL CONTROL OVER FINANCIAL REPORTINGManagement is responsible for establishing and maintaining adequate internal control over financial reporting, as defined in Rule 13a-15(f) under the U.S. Securities Exchange Act of 1934, as amended, and under National Instrument 52-109. Our internal control over financial reporting is a process designed under the supervision of the CEO and CFO, and effected by the Board, management and other personnel of BCE, to provide reasonable assurance regarding the reliability of financial reporting and the preparation of financial statements for external purposes in accordance with IFRS as issued by the IASB. However, because of its inherent limitations, internal control over financial reporting may not prevent or detect misstatements on a timely basis.
Management evaluated, under the supervision of and with the participation of the CEO and the CFO, the effectiveness of our internal control over financial reporting as at December 31, 2020, based on the criteria established in Internal Control – Integrated Framework (2013) issued by the Committee of Sponsoring Organizations of the Treadway Commission (COSO).
Based on that evaluation, the CEO and CFO concluded that our internal control over financial reporting was effective as at December 31, 2020.
CHANGES IN INTERNAL CONTROL OVER FINANCIAL REPORTINGNo changes were made in our internal control over financial reporting during the year ended December 31, 2020 that have materially affected, or are reasonably likely to materially affect, our internal control over financial reporting.

Repo
rts
on
inte
rnal
con
trol
s
BCE InC. 2020 AnnuAl REpoRt | 119
Reports on internal controls
MANAGEMENT’S REPORT ON INTERNAL CONTROL OVER FINANCIAL REPORTINGThe management of BCE Inc. (BCE) is responsible for establishing and maintaining adequate internal control over financial reporting. Our internal control over financial reporting is a process designed under the supervision of the President and Chief Executive Officer and the Executive Vice-President and Chief Financial Officer and effected by the board of directors, management and other personnel of BCE, to provide reasonable assurance regarding the reliability of financial reporting and the preparation of financial statements for external purposes in accordance with International Financial Reporting Standards (IFRS) as issued by the International Accounting Standards Board (IASB).
Due to its inherent limitations, internal control over financial reporting may not prevent or detect misstatements on a timely basis. Also, projections of any evaluation of the effectiveness of internal control over financial reporting to future periods are subject to the risk that the controls may become inadequate because of changes in conditions, or that the degree of compliance with the policies or procedures may deteriorate.
Management evaluated, under the supervision of and with the participation of the President and Chief Executive Officer and the Executive Vice-President and Chief Financial Officer, the effectiveness of our internal control over financial reporting as at December 31, 2020, based on the criteria established in Internal Control – Integrated Framework (2013) issued by the Committee of Sponsoring Organizations of the Treadway Commission (COSO).
Based on that evaluation, the President and Chief Executive Officer and the Executive Vice-President and Chief Financial Officer concluded that our internal control over financial reporting was effective as at December 31, 2020. There were no material weaknesses that have been identified by BCE’s management in internal control over financial reporting as at December 31, 2020.
Our internal control over financial reporting as at December 31, 2020 has been audited by Deloitte LLP, independent registered public accounting firm, who also audited our consolidated financial statements for the year ended December 31, 2020. Deloitte LLP issued an unqualified opinion on the effectiveness of our internal control over financial reporting as at December 31, 2020.
(signed) Mirko Bibic President and Chief Executive Officer
(signed) Glen LeBlanc Executive Vice-President and Chief Financial Officer
(signed) Thierry Chaumont Senior Vice-President, Controller and Tax
March 4, 2021
Repo
rts
on
inte
rnal
con
trol
s
120 | BCE InC. 2020 AnnuAl REpoRt
REPORT OF INDEPENDENT REGISTERED PUBLIC ACCOUNTING FIRMTo the Shareholders and the Board of Directors of BCE Inc.
OPINION ON INTERNAL CONTROL OVER FINANCIAL REPORTINGWe have audited the internal control over financial reporting of BCE Inc. and subsidiaries (the “Company”) as of December 31, 2020, based on criteria established in Internal Control – Integrated Framework (2013) issued by the Committee of Sponsoring Organizations of the Treadway Commission (COSO). In our opinion, the Company maintained, in all material respects, effective internal control over financial reporting as of December 31, 2020, based on criteria established in Internal Control – Integrated Framework (2013) issued by COSO.
We have also audited, in accordance with the standards of the Public Company Accounting Oversight Board (United States) (PCAOB), the consolidated financial statements as at and for the year ended December 31, 2020, of the Company and our report dated March 4, 2021, expressed an unqualified opinion on those financial statements.
BASIS FOR OPINIONThe Company’s management is responsible for maintaining effective internal control over financial reporting and for its assessment of the effectiveness of internal control over financial reporting, included in the accompanying Management’s Report on Internal Control over Financial Reporting. Our responsibility is to express an opinion on the Company’s internal control over financial reporting based on our audit. We are a public accounting firm registered with the PCAOB and are required to be independent with respect to the Company in accordance with the U.S. federal securities laws and the applicable rules and regulations of the Securities and Exchange Commission and the PCAOB.
We conducted our audit in accordance with the standards of the PCAOB. Those standards require that we plan and perform the audit to obtain reasonable assurance about whether effective internal control over financial reporting was maintained in all material respects. Our audit included obtaining an understanding of internal control over financial reporting, assessing the risk that a material weakness exists, testing and evaluating the design and operating effectiveness of internal control based on the assessed risk, and performing such other procedures as we considered necessary in the circumstances. We believe that our audit provides a reasonable basis for our opinion.
DEFINITION AND LIMITATIONS OF INTERNAL CONTROL OVER FINANCIAL REPORTINGA company’s internal control over financial reporting is a process designed to provide reasonable assurance regarding the reliability of financial reporting and the preparation of financial statements for external purposes in accordance with generally accepted accounting principles. A company’s internal control over financial reporting includes those policies and procedures that (1) pertain to the maintenance of records that, in reasonable detail, accurately and fairly reflect the transactions and dispositions of the assets of the company; (2) provide reasonable assurance that transactions are recorded as necessary to permit preparation of financial statements in accordance with generally accepted accounting principles, and that receipts and expenditures of the company are being made only in accordance with authorizations of management and directors of the company; and (3) provide reasonable assurance regarding prevention or timely detection of unauthorized acquisition, use, or disposition of the company’s assets that could have a material effect on the financial statements.
Because of its inherent limitations, internal control over financial reporting may not prevent or detect misstatements. Also, projections of any evaluation of effectiveness to future periods are subject to the risk that controls may become inadequate because of changes in conditions, or that the degree of compliance with the policies or procedures may deteriorate.
/s/ Deloitte LLP Chartered Professional Accountants
Montréal, Canada March 4, 2021
Con
solid
ated
fi n
anci
al s
tate
men
ts
BCE InC. 2020 AnnuAl REpoRt | 121
Consolidated financial statements
MANAGEMENT’S RESPONSIBILITY FOR FINANCIAL REPORTINGThese financial statements form the basis for all of the financial information that appears in this annual report.
The financial statements and all of the information in this annual report are the responsibility of the management of BCE Inc. (BCE) and have been reviewed and approved by the board of directors. The board of directors is responsible for ensuring that management fulfills its financial reporting responsibilities. Deloitte LLP, Independent Registered Public Accounting Firm, have audited the financial statements.
Management has prepared the financial statements in accordance with International Financial Reporting Standards (IFRS) as issued by the International Accounting Standards Board. Under these principles, management has made certain estimates and assumptions that are reflected in the financial statements and notes. Management believes that these financial statements fairly present BCE’s consolidated financial position, results of operations and cash flows.
Management has a system of internal controls designed to provide reasonable assurance that the financial statements are accurate and complete in all material respects. This is supported by an internal audit group that reports to the Audit Committee, and includes communication with employees about policies for ethical business conduct. Management believes that the internal controls provide reasonable assurance that our financial records are reliable and form a proper basis for preparing the financial statements, and that our assets are properly accounted for and safeguarded.
The board of directors has appointed an Audit Committee, which is made up of unrelated and independent directors. The Audit Committee’s responsibilities include reviewing the financial statements and other information in this annual report, and recommending them to the board of directors for approval. You will find a description of the Audit Committee’s other responsibilities on page 170 of this annual report. The internal auditors and the shareholders’ auditors have free and independent access to the Audit Committee.
(signed) Mirko Bibic President and Chief Executive Officer
(signed) Glen LeBlanc Executive Vice-President and Chief Financial Officer
(signed) Thierry Chaumont Senior Vice-President, Controller and Tax
March 4, 2021

Con
solid
ated
fi n
anci
al s
tate
men
ts
122 | BCE InC. 2020 AnnuAl REpoRt
REPORT OF INDEPENDENT REGISTERED PUBLIC ACCOUNTING FIRMTo the Shareholders and the Board of Directors of BCE Inc.
OPINION ON THE FINANCIAL STATEMENTSWe have audited the accompanying consolidated statements of financial position of BCE Inc. and subsidiaries (the “Company”) as at December 31, 2020 and 2019, the related consolidated income statements, statements of comprehensive income, changes in equity, and cash flows for each of the two years in the period ended December 31, 2020, and the related notes (collectively referred to as the “financial statements”). In our opinion, the financial statements present fairly, in all material respects, the financial position of the Company as at December 31, 2020 and 2019, and its financial performance and its cash flows for each of the two years in the period ended December 31, 2020, in conformity with International Financial Reporting Standards as issued by the International Accounting Standards Board.
We have also audited, in accordance with the standards of the Public Company Accounting Oversight Board (United States) (PCAOB), the Company’s internal control over financial reporting as of December 31, 2020, based on criteria established in Internal Control – Integrated Framework (2013) issued by the Committee of Sponsoring Organizations of the Treadway Commission and our report dated March 4, 2021, expressed an unqualified opinion on the Company’s internal control over financial reporting.
BASIS FOR OPINIONThese financial statements are the responsibility of the Company’s management. Our responsibility is to express an opinion on the Company’s financial statements based on our audits. We are a public accounting firm registered with the PCAOB and are required to be independent with respect to the Company in accordance with the U.S. federal securities laws and the applicable rules and regulations of the Securities and Exchange Commission and the PCAOB.
We conducted our audits in accordance with the standards of the PCAOB. Those standards require that we plan and perform the audit to obtain reasonable assurance about whether the financial statements are free of material misstatement, whether due to error or fraud. Our audits included performing procedures to assess the risks of material misstatement of the financial statements, whether due to error or fraud, and performing procedures that respond to those risks. Such procedures included examining, on a test basis, evidence regarding the amounts and disclosures in the financial statements. Our audits also included evaluating the accounting principles used and significant estimates made by management, as well as evaluating the overall presentation of the financial statements. We believe that our audits provide a reasonable basis for our opinion.

Con
solid
ated
fi n
anci
al s
tate
men
ts
BCE InC. 2020 AnnuAl REpoRt | 123
CRITICAL AUDIT MATTERThe critical audit matter communicated below is a matter arising from the current-period audit of the financial statements that was communicated or required to be communicated to the audit committee and that (1) relates to accounts or disclosures that are material to the financial statements and (2) involved our especially challenging, subjective, or complex judgments. The communication of critical audit matters does not alter in any way our opinion on the financial statements, taken as a whole, and we are not, by communicating the critical audit matter below, providing a separate opinion on the critical audit matter or on the accounts or disclosures to which it relates.
Goodwill and Intangible Assets – Bell Media Group – Refer to Notes 8, 18 and 21 to the financial statements
CRITICAL AUDIT MATTER DESCRIPTION
Goodwill and indefinite-life intangible assets (specifically broadcast licenses) for the Bell Media group of cash generating units (“Bell Media”) are tested annually or when there is an indication that the asset may be impaired. During the second quarter of 2020, Bell Media identified declines in advertising revenue, lower subscriber revenues and overall increases in discount rates as indicators that certain assets may be impaired. As a result of the second quarter and annual assessments of impairment of goodwill and intangible assets for Bell Media, management has determined that there was no impairment of goodwill and there was an impairment for intangible assets.
When testing goodwill for Bell Media, while there are several assumptions that are required to determine the recoverable amount, the judgments with the highest degree of subjectivity and impact, are the forecasts of future operating performance, determination of EBITDA multiples, discount rates and perpetuity growth rates. When testing intangible assets, the judgments with the highest degree of subjectivity and impact are forecasts of future operating performance, discount rates and perpetuity growth rates. Changes in these assumptions could have a significant impact on the recoverable amount of Bell Media, resulting in an impairment charge to goodwill or intangible assets as required. Given the significant judgments made by management, regarding the forecasts of future operating performance, determination of EBITDA multiples, discount rates and perpetuity growth rates, a high degree of auditor judgment was required and resulted in an increased extent of audit effort, which included the need to involve fair value specialists.
HOW THE CRITICAL AUDIT MATTER WAS ADDRESSED IN THE AUDIT
Our audit procedures related to forecasts of future operating performance, determination of EBITDA multiples, discount rates, and perpetuity growth rates used by management to determine the recoverable amounts for Bell Media included the following, among others:
• Evaluated the effectiveness of controls over the assessment of goodwill and intangible assets for impairment, including those over the forecasts of future operating performance, and the determination of the EBITDA multiples, discount rates and perpetuity growth rates.
• Evaluated management’s ability to accurately forecast future operating performance by comparing actual results to management’s historical forecasts.
• Evaluated the reasonableness of management’s forecasts of future operating performance by comparing the forecasts to:
• Historical operating performance;
• Analyst and industry reports for the Company and certain of its peer companies, and other relevant publicly available information;
• Known changes in Bell Media’s operations or the industry in which it operates, including the impact of the COVID-19 pandemic, which are expected to impact future operating performance;
• Internal communications to management and the Board of Directors.
• With the assistance of fair value specialists, evaluated the reasonableness of the (1) EBITDA multiples, (2) discount rates, and (3) perpetuity growth rates by:
• Testing the source information underlying the determination of the discount rates;
• Reviewing relevant internal and external information, including analyst and industry reports, to assess the reasonability of the selected EBITDA multiples, discount rates, and perpetuity growth rates;
• Developing a range of independent estimates and comparing those to the EBITDA multiples, discount rates, and perpetuity growth rates selected by management.
/s/ Deloitte LLP Chartered Professional Accountants
Montréal, Canada March 4, 2021
We have served as the Company’s auditor since 1880.

Con
solid
ated
fi n
anci
al s
tate
men
ts
124 | BCE InC. 2020 AnnuAl REpoRt
CONSOLIDATED INCOME STATEMENTSFOR THE YEAR ENDED DECEMBER 31 (IN MILLIONS OF CANADIAN DOLLARS, EXCEPT SHARE AMOUNTS) NOTE 2020 2019
Operating revenues 4 22,883 23,793
Operating costs 4, 5 (13,276) (13,787)
Severance, acquisition and other costs 6 (116) (114)
Depreciation 16 (3,475) (3,458)
Amortization 18 (929) (886)
Finance costs
Interest expense 7 (1,110) (1,125)
Interest on post-employment benefit obligations 26 (46) (63)
Impairment of assets 8, 16, 18 (472) (102)
Other (expense) income 9 (194) 95
Income taxes 10 (792) (1,129)
Net earnings from continuing operations 2,473 3,224
Net earnings from discontinued operations 3 226 29
Net earnings 2,699 3,253
Net earnings from continuing operations attributable to:
Common shareholders 2,272 3,011
Preferred shareholders 136 151
Non-controlling interest 65 62
Net earnings from continuing operations 2,473 3,224
Net earnings attributable to:
Common shareholders 2,498 3,040
Preferred shareholders 136 151
Non-controlling interest 35 65 62
Net earnings 2,699 3,253
Net earnings per common share – basic and diluted 11
Continuing operations 2.51 3.34
Discontinued operations 3 0.25 0.03
Net earnings per common share – basic and diluted 2.76 3.37
Weighted average number of common shares outstanding – basic (millions) 904.3 900.8

Con
solid
ated
fi n
anci
al s
tate
men
ts
BCE InC. 2020 AnnuAl REpoRt | 125
CONSOLIDATED STATEMENTS OF COMPREHENSIVE INCOMEFOR THE YEAR ENDED DECEMBER 31 (IN MILLIONS OF CANADIAN DOLLARS) NOTE 2020 2019
Net earnings from continuing operations 2,473 3,224
Other comprehensive income from continuing operations, net of income taxes
Items that will be subsequently reclassified to net earnings
Net change in value of publicly-traded and privately-held investments, net of income taxes of nil for 2020 and 2019 (15) 6
Net change in value of derivatives designated as cash flow hedges, net of income taxes of $12 million and ($45) million for 2020 and 2019, respectively (33) 112
Items that will not be reclassified to net earnings
Actuarial gains on post-employment benefit plans, net of income taxes of ($184) million and ($51) million for 2020 and 2019, respectively 26 503 140
Net change in value of derivatives designated as cash flow hedges, net of income taxes of nil and $9 million for 2020 and 2019, respectively (1) (25)
Other comprehensive income from continuing operations 454 233
Net earnings from discontinued operations attributable to common shareholders 226 29
Total comprehensive income 3,153 3,486
Total comprehensive income attributable to:
Common shareholders 2,953 3,277
Preferred shareholders 136 151
Non-controlling interest 35 64 58
Total comprehensive income 3,153 3,486

Con
solid
ated
fi n
anci
al s
tate
men
ts
126 | BCE InC. 2020 AnnuAl REpoRt
CONSOLIDATED STATEMENTS OF FINANCIAL POSITION(IN MILLIONS OF CANADIAN DOLLARS) NOTE DECEMBER 31, 2020 DECEMBER 31, 2019
ASSETSCurrent assets
Cash 224 141
Cash equivalents – 4
Trade and other receivables 12 3,528 3,038
Inventory 13 439 427
Contract assets 14 687 1,111
Contract costs 15 402 415
Prepaid expenses 209 194
Other current assets 199 190
Total current assets 5,688 5,520
Non-current assets
Contract assets 14 256 533
Contract costs 15 362 368
Property, plant and equipment 16 27,513 27,636
Intangible assets 18 13,102 13,352
Deferred tax assets 10 106 98
Investments in associates and joint ventures 19 756 698
Post-employment benefit assets 26 1,277 558
Other non-current assets 20 1,001 716
Goodwill 21 10,604 10,667
Total non-current assets 54,977 54,626
Total assets 60,665 60,146
LIABILITIESCurrent liabilities
Trade payables and other liabilities 22 3,935 3,954
Contract liabilities 14 717 683
Interest payable 222 227
Dividends payable 766 729
Current tax liabilities 214 303
Debt due within one year 23 2,417 3,881
Total current liabilities 8,271 9,777
Non-current liabilities
Contract liabilities 14 242 207
Long-term debt 24 23,906 22,415
Deferred tax liabilities 10 3,810 3,561
Post-employment benefit obligations 26 1,962 1,907
Other non-current liabilities 27 1,145 871
Total non-current liabilities 31,065 28,961
Total liabilities 39,336 38,738
Commitments and contingencies 33
EQUITYEquity attributable to BCE shareholders
Preferred shares 29 4,003 4,004
Common shares 29 20,390 20,363
Contributed surplus 29 1,174 1,178
Accumulated other comprehensive income 103 161
Deficit (4,681) (4,632)
Total equity attributable to BCE shareholders 20,989 21,074
Non-controlling interest 35 340 334
Total equity 21,329 21,408
Total liabilities and equity 60,665 60,146

Con
solid
ated
fi n
anci
al s
tate
men
ts
BCE InC. 2020 AnnuAl REpoRt | 127
CONSOLIDATED STATEMENTS OF CHANGES IN EQUITYATTRIBUTABLE TO BCE SHAREHOLDERS
FOR THE YEAR ENDED DECEMBER 31, 2020 (IN MILLIONS OF CANADIAN DOLLARS) NOTE
PREFERRED SHARES
COMMON SHARES
CONTRI-BUTED
SURPLUS
ACCUM-ULATED OTHER
COMPRE-HENSIVE INCOME DEFICIT TOTAL
NON-CONTROL-
LING INTEREST
TOTAL EQUITY
Balance at December 31, 2019 4,004 20,363 1,178 161 (4,632) 21,074 334 21,408
Net earnings – – – – 2,634 2,634 65 2,699
Other comprehensive (loss) income from continuing operations – – – (48) 503 455 (1) 454
Total comprehensive (loss) income – – – (48) 3,137 3,089 64 3,153
Common shares issued under employee stock option plan 29 – 27 (1) – – 26 – 26
Other share-based compensation 29 – – (3) – (35) (38) – (38)
Repurchase of preferred shares 29 (1) – – – – (1) – (1)
Dividends declared on BCE common and preferred shares – – – – (3,147) (3,147) – (3,147)
Dividends declared by subsidiaries to non-controlling interest – – – – – – (53) (53)
Settlement of cash flow hedges transferred to the cost basis of hedged items – – – (10) – (10) – (10)
Other – – – – (4) (4) (5) (9)
Balance at December 31, 2020 4,003 20,390 1,174 103 (4,681) 20,989 340 21,329
ATTRIBUTABLE TO BCE SHAREHOLDERS
FOR THE YEAR ENDED DECEMBER 31, 2019 (IN MILLIONS OF CANADIAN DOLLARS) NOTE
PREFERRED SHARES
COMMON SHARES
CONTRI-BUTED
SURPLUS
ACCUM-ULATED OTHER
COMPRE-HENSIVE INCOME DEFICIT TOTAL
NON-CONTROL-
LING INTEREST
TOTAL EQUITY
Balance at December 31, 2018 4,004 20,036 1,170 90 (4,937) 20,363 326 20,689
Adoption of IFRS 16 2 – – – – (19) (19) (1) (20)
Balance at January 1, 2019 4,004 20,036 1,170 90 (4,956) 20,344 325 20,669
Net earnings – – – – 3,191 3,191 62 3,253
Other comprehensive income (loss) from continuing operations – – – 97 140 237 (4) 233
Total comprehensive income – – – 97 3,331 3,428 58 3,486
Common shares issued under employee stock option plan 29 – 251 (11) – – 240 – 240
Common shares issued under employee savings plan (ESP) 29 – 75 – – – 75 – 75
Other share-based compensation 29 – 1 19 – 1 21 – 21
Dividends declared on BCE common and preferred shares – – – – (3,008) (3,008) – (3,008)
Dividends declared by subsidiaries to non-controlling interest – – – – – – (64) (64)
Settlement of cash flow hedges transferred to the cost basis of hedged items – – – (26) – (26) – (26)
Other – – – – – – 15 15
Balance at December 31, 2019 4,004 20,363 1,178 161 (4,632) 21,074 334 21,408

Con
solid
ated
fi n
anci
al s
tate
men
ts
128 | BCE InC. 2020 AnnuAl REpoRt
CONSOLIDATED STATEMENTS OF CASH FLOWSFOR THE YEAR ENDED DECEMBER 31 (IN MILLIONS OF CANADIAN DOLLARS) NOTE 2020 2019
Cash flows from operating activities
Net earnings from continuing operations 2,473 3,224
Adjustments to reconcile net earnings from continuing operations to cash flows from operating activities
Severance, acquisition and other costs 6 116 114
Depreciation and amortization 16, 18 4,404 4,344
Post-employment benefit plans cost 26 315 309
Net interest expense 1,087 1,101
Impairment of assets 8 472 102
Gains on investments 9 (3) (18)
Income taxes 10 792 1,129
Contributions to post-employment benefit plans 26 (297) (290)
Payments under other post-employment benefit plans 26 (61) (72)
Severance and other costs paid (78) (167)
Interest paid (1,112) (1,079)
Income taxes paid (net of refunds) (846) (725)
Acquisition and other costs paid (35) (60)
Net change in operating assets and liabilities 473 (48)
Cash from discontinued operations 3 54 94
Cash flows from operating activities 7,754 7,958
Cash flows used in investing activities
Capital expenditures 4 (4,202) (3,974)
Business acquisitions (65) (51)
Acquisition of spectrum licences (86) –
Other investing activities (79) 7
Cash from (used in) discontinued operations 3 892 (18)
Cash flows used in investing activities (3,540) (4,036)
Cash flows used in financing activities
Decrease in notes payable (1,641) (1,073)
Increase in securitized trade receivables – 131
Issue of long-term debt 24 6,006 1,954
Repayment of long-term debt 24 (5,003) (2,221)
Issue of common shares 29 26 240
Purchase of shares for settlement of share-based payments 30 (263) (142)
Cash dividends paid on common shares (2,975) (2,819)
Cash dividends paid on preferred shares (132) (147)
Cash dividends paid by subsidiaries to non-controlling interest (53) (65)
Other financing activities (93) (54)
Cash used in discontinued operations 3 (7) (6)
Cash flows used in financing activities (4,135) (4,202)
Net increase (decrease) in cash 83 (284)
Cash at beginning of year 141 425
Cash at end of year 224 141
Net (decrease) increase in cash equivalents (4) 4
Cash equivalents at beginning of year 4 –
Cash equivalents at end of year – 4

Not
es to
con
solid
ated
fi n
anci
al s
tate
men
ts
BCE InC. 2020 AnnuAl REpoRt | 129
Notes to consolidated financial statementsWe, us, our, BCE and the company mean, as the context may require, either BCE Inc. or, collectively, BCE Inc., Bell Canada, their subsidiaries, joint arrangements and associates.
Note 1 | Corporate informationBCE is incorporated and domiciled in Canada. BCE’s head office is located at 1, Carrefour Alexander-Graham-Bell, Verdun, Québec, Canada. BCE is a telecommunications and media company providing wireless, wireline, Internet and television (TV) services to residential, business and wholesale customers in Canada. Our Bell Media segment
provides conventional TV, specialty TV, pay TV, streaming services, digital media services, radio broadcasting services and out-of-home (OOH) advertising services to customers in Canada. The consolidated financial statements (financial statements) were approved by BCE’s board of directors on March 4, 2021.
Note 2 | Significant accounting policiesA) BASIS OF PRESENTATIONThe financial statements were prepared in accordance with International Financial Reporting Standards (IFRS), as issued by the International Accounting Standards Board (IASB). The financial statements have been prepared on a historical cost basis, except for certain financial instruments that are measured at fair value as described in our accounting policies.
All amounts are in millions of Canadian dollars, except where noted.
FUNCTIONAL CURRENCYThe financial statements are presented in Canadian dollars, the company’s functional currency.
B) BASIS OF CONSOLIDATIONWe consolidate the financial statements of all of our subsidiaries. Subsidiaries are entities we control, where control is achieved when the company is exposed or has the right to variable returns from its involvement with the investee and has the current ability to direct the activities of the investee that significantly affect the investee’s returns.
The results of subsidiaries acquired during the year are consolidated from the date of acquisition and the results of subsidiaries sold during the year are deconsolidated from the date of disposal. Where necessary, adjustments are made to the financial statements of
acquired subsidiaries to conform their accounting policies to ours. All intercompany transactions, balances, income and expenses are eliminated on consolidation.
Changes in our ownership interest in a subsidiary that do not result in a loss of control are accounted for as equity transactions, with no effect on net earnings or on Other comprehensive income from continuing operations. Any difference between the change in the carrying amount of non-controlling interest (NCI) and the consideration paid or received is attributed to owner’s equity.
C) REVENUE FROM CONTRACTS WITH CUSTOMERSRevenue is measured based on the value of the expected consideration in a contract with a customer and excludes sales taxes and other amounts we collect on behalf of third parties. We recognize revenue when control of a product or service is transferred to a customer. When our right to consideration from a customer corresponds directly with the value to the customer of the products and services transferred to date, we recognize revenue in the amount to which we have a right to invoice.
For bundled arrangements, we account for individual products and services when they are separately identifiable and the customer can benefit from the product or service on its own or with other readily available resources. The total arrangement consideration is allocated to each product or service included in the contract with the customer based on its stand-alone selling price. We generally determine stand-alone selling prices based on the observable prices at which we sell products separately without a service contract and prices for non-bundled service offers with the same range of services, adjusted for market conditions and other factors, as appropriate. When similar products and services are not sold separately, we use the expected cost plus
margin approach to determine stand-alone selling prices. Products and services purchased by a customer in excess of those included in the bundled arrangement are accounted for separately.
We may enter into arrangements with subcontractors and others who provide services to our customers. When we act as the principal in these arrangements, we recognize revenues based on the amounts billed to our customers. Otherwise, we recognize the net amount that we retain as revenues.
A contract asset is recognized in the consolidated statements of financial position (statements of financial position) when our right to consideration from the transfer of products or services to a customer is conditional on our obligation to transfer other products or services. Contract assets are transferred to trade receivables when our right to consideration becomes conditional only as to the passage of time. A contract liability is recognized in the statements of financial position when we receive consideration in advance of the transfer of products or services to the customer. Contract assets and liabilities relating to the same contract are presented on a net basis.

Not
es to
con
solid
ated
fi n
anci
al s
tate
men
ts
130 | BCE InC. 2020 AnnuAl REpoRt
Incremental costs of obtaining a contract with a customer, principally comprised of sales commissions and prepaid contract fulfillment costs, are included in contract costs in the statements of financial position, except where the amortization period is one year or less, in which case costs of obtaining a contract are immediately expensed. Capitalized costs are amortized on a systematic basis that is consistent with the period and pattern of transfer to the customer of the related products or services.
WIRELESS SEGMENT REVENUESOur Wireless segment principally generates revenue from providing integrated digital wireless voice and data communications products and services to residential and business customers.
We recognize product revenues from the sale of wireless handsets and devices when a customer takes possession of the product. We recognize wireless service revenues over time, as the services are provided. For bundled arrangements, stand-alone selling prices are determined using observable prices adjusted for market conditions and other factors, as appropriate.
For wireless products and services that are sold separately, customers usually pay in full at the point of sale for products and on a monthly basis for services. For wireless products and services sold in bundled arrangements, including device financing plans, customers pay monthly over a contract term of up to 24 months for residential customers and up to 36 months for business customers. If they include a significant financing component, device financing plan receivables are discounted at market rates and interest revenue is accreted over the contractual repayment period.
WIRELINE SEGMENT REVENUESOur Wireline segment principally generates revenue from providing data, including Internet access and Internet protocol television (IPTV), local telephone, long distance, satellite TV service and connectivity, as well as other communications services and products to residential and business customers. Our Wireline segment also includes revenues from our wholesale business, which buys and sells local telephone, long distance, data and other services from or to resellers and other carriers.
We recognize product revenues from the sale of wireline equipment when a customer takes possession of the product. We recognize service revenues over time, as the services are provided. Revenues on certain long-term contracts are recognized using output methods based on products delivered, performance completed to date, time elapsed or milestones met. For bundled arrangements, stand-alone selling prices are determined using observable prices adjusted for market conditions and other factors, as appropriate, or the expected cost plus margin approach for customized business arrangements.
For wireline customers, products are usually paid in full at the point of sale. Services are paid for on a monthly basis except where a billing schedule has been established with certain business customers under long-term contracts that can generally extend up to seven years.
MEDIA SEGMENT REVENUESOur Media segment principally generates revenue from conventional TV, specialty TV, digital media, radio broadcasting and OOH advertising and subscriber fees from specialty TV, pay TV and streaming services.
We recognize advertising revenue when advertisements are aired on the radio or TV, posted on our websites or appear on our advertising panels and street furniture. Revenues relating to subscriber fees are recorded on a monthly basis as the services are provided. Customer payments are due monthly as the services are provided.
D) SHARE-BASED PAYMENTSOur share-based payment arrangements include stock options, restricted share units and performance share units (RSUs/PSUs), deferred share units (DSUs), an employee savings plan (ESP) and a deferred share plan (DSP).
STOCK OPTIONSWe use a fair value-based method to measure the cost of our employee stock options, based on the number of stock options that are expected to vest. We recognize compensation expense in Operating costs in the consolidated income statements (income statements). Compensation expense is adjusted for subsequent changes in management’s estimate of the number of stock options that are expected to vest.
We credit contributed surplus for stock option expense recognized over the vesting period. When stock options are exercised, we credit share capital for the amount received and the amounts previously credited to contributed surplus.
RSUs/PSUsFor each RSU/PSU granted, we recognize compensation expense in Operating costs in the income statements, equal to the market value of a BCE common share at the date of grant and based on the number of RSUs/PSUs expected to vest, recognized over the term of the vesting period, with a corresponding credit to contributed surplus. Additional RSUs/PSUs are issued to reflect dividends declared on the common shares.
Compensation expense is adjusted for subsequent changes in management’s estimate of the number of RSUs/PSUs that are expected to vest. The effect of these changes is recognized in the period of the change. Upon settlement of the RSUs/PSUs, any difference between the cost of shares purchased on the open market and the amount credited to contributed surplus is reflected in the deficit. Vested RSUs/PSUs are settled in BCE common shares, DSUs, or a combination thereof.
DSUsIf compensation is elected to be taken in DSUs, we issue DSUs equal to the fair value of the services received. Additional DSUs are issued to reflect dividends declared on the common shares. DSUs are settled in BCE common shares purchased on the open market following the cessation of employment or when a director leaves the board. We credit contributed surplus for the fair value of DSUs at the issue date. Upon settlement of the DSUs, any difference between the cost of shares purchased on the open market and the amount credited to contributed surplus is reflected in the deficit.
ESPWe recognize our ESP contributions as compensation expense in Operating costs in the income statements. We credit contributed surplus for the ESP expense recognized over the two-year vesting period, based on management’s estimate of the accrued contributions that are expected to vest. Upon settlement of shares under the ESP, any difference between the cost of shares purchased on the open market and the amount credited to contributed surplus is reflected in the deficit.

Not
es to
con
solid
ated
fi n
anci
al s
tate
men
ts
BCE InC. 2020 AnnuAl REpoRt | 131
DSPFor each deferred share granted under the DSP, we recognize compensation expense in Operating costs in the income statements equal to the market value of a BCE common share. Deferred shares are no longer granted, except those issued to reflect dividends declared on common shares.
Compensation expense is adjusted for subsequent changes in the market value of BCE common shares. The cumulative effect of any change in value is recognized in the period of the change. Participants have the option to receive either BCE common shares or a cash equivalent for each vested deferred share upon qualifying for payout under the terms of the grant.
E) INCOME AND OTHER TAXESCurrent and deferred income tax expense is recognized in the income statements, except to the extent that the expense relates to items recognized in Other comprehensive income from continuing operations or directly in equity.
A current or non-current tax asset (liability) is the estimated tax receivable (payable) on taxable earnings (loss) for the current or past periods.
We use the liability method to account for deferred tax assets and liabilities, which arise from:
• temporary differences between the carrying amount of assets and liabilities recognized in the statements of financial position and their corresponding tax bases
• the carryforward of unused tax losses and credits, to the extent they can be used in the future
Deferred tax assets and liabilities are calculated at the tax rates that are expected to apply when the asset or liability is recovered or settled. Both our current and deferred tax assets and liabilities are calculated
using tax rates that have been enacted or substantively enacted at the reporting date.
Deferred taxes are provided on temporary differences arising from investments in subsidiaries, joint arrangements and associates, except where we control the timing of the reversal of the temporary difference and it is probable that the temporary difference will not reverse in the foreseeable future.
Tax liabilities are, where permitted, offset against tax assets within the same taxable entity and tax jurisdiction.
INVESTMENT TAX CREDITS (ITCs), OTHER TAX CREDITS AND GOVERNMENT GRANTSWe recognize ITCs, other tax credits and government grants given on eligible expenditures when it is reasonably assured that they will be realized. They are presented as part of Trade and other receivables in the statements of financial position when they are expected to be utilized in the next year. We use the cost reduction method to account for ITCs and government grants, under which the credits are applied against the expense or asset to which the ITC or government grant relates.
F) CASH EQUIVALENTSCash equivalents are comprised of highly liquid investments with original maturities of three months or less from the date of purchase and are measured at amortized cost.
G) SECURITIZATION OF TRADE RECEIVABLESProceeds on the securitization of trade receivables are recognized as a collateralized borrowing as we do not transfer control and substantially all the risks and rewards of ownership to another entity.
H) INVENTORYWe measure inventory at the lower of cost and net realizable value. Inventory includes all costs to purchase, convert and bring the inventories to their present location and condition. We determine cost using specific identification for major equipment held for resale and the weighted
average cost formula for all other inventory. We maintain inventory valuation reserves for inventory that is slow-moving or potentially obsolete, calculated using an inventory aging analysis.
I) PROPERTY, PLANT AND EQUIPMENTWe record property, plant and equipment at historical cost. Historical cost includes expenditures that are attributable directly to the acquisition or construction of the asset, including the purchase cost, and labour.
Borrowing costs are capitalized for qualifying assets, if the time to build or develop is in excess of one year, at a rate that is based on our weighted average interest rate on our outstanding long-term debt. Gains or losses on the sale or retirement of property, plant and equipment are recorded in Other (expense) income in the income statements.
LEASESWe enter into leases for network infrastructure and equipment, land and buildings in the normal course of business. Lease contracts are typically made for fixed periods but may include purchase, renewal or termination options. Leases are negotiated on an individual basis and contain a wide range of different terms and conditions.
We adopted IFRS 16 – Leases as of January 1, 2019. Certain finance leases entered into prior to January 1, 2019 were initially measured under IAS 17 – Leases, as permitted by the specific transition provisions of IFRS 16.

Not
es to
con
solid
ated
fi n
anci
al s
tate
men
ts
132 | BCE InC. 2020 AnnuAl REpoRt
IFRS 16
We assess whether a contract contains a lease at inception of the contract. A lease contract conveys the right to control the use of an identified asset for a period in exchange for consideration. We recognize lease liabilities with corresponding right-of-use assets for all lease agreements, except for short-term leases and leases of low value assets, which are expensed on a straight-line basis over the lease term. Consideration in a contract is allocated to lease and non-lease components on a relative stand-alone value basis. We generally account for lease components and any associated non-lease components as a single lease component.
Lease liabilities are initially measured at the present value of the lease payments that are not paid at the commencement date, discounted using our incremental borrowing rate, unless the rate implicit in the lease is readily determinable. We apply a single incremental borrowing rate to a portfolio of leases with similar characteristics. Lease payments included in the measurement of the lease liability comprise:
• fixed (and in-substance fixed) lease payments, less any lease incentives
• variable lease payments that depend on an index or rate
• payments expected under residual value guarantees and payments relating to purchase options and renewal option periods that are reasonably certain to be exercised (or periods subject to termination options that are not reasonably certain to be exercised)
Lease liabilities are subsequently measured at amortized cost using the effective interest method. Lease liabilities are remeasured, with a corresponding adjustment to the related right-of-use assets, when there is a change in variable lease payments arising from a change in an index or rate, or when we change our assessment of whether purchase, renewal or termination options will be exercised.
Right-of-use assets are measured at cost, and are comprised of the initial measurement of the corresponding lease liabilities, lease payments
made at or before the commencement date and any initial direct costs. They are subsequently depreciated on a straight-line basis and reduced by impairment losses, if any. Right-of-use assets may also be adjusted to reflect the remeasurement of related lease liabilities. If we obtain ownership of the leased asset by the end of the lease term or the cost of the right-of-use asset reflects the exercise of a purchase option, we depreciate the right-of-use asset from the lease commencement date to the end of the useful life of the underlying asset. Otherwise, we depreciate the right-of-use asset from the commencement date to the earlier of the end of the useful life of the underlying asset or the end of the lease term.
Variable lease payments that do not depend on an index or rate are not included in the measurement of lease liabilities and right-of-use assets. The related payments are expensed in Operating costs in the period in which the event or condition that triggers those payments occurs.
IAS 17Under IAS 17, leases of property, plant and equipment are recognized as finance leases when we obtain substantially all the risks and rewards of ownership of the underlying assets. At the inception of the lease, we record an asset together with a corresponding long-term lease liability, at the lower of the fair value of the leased asset or the present value of the minimum future lease payments, excluding non-lease components.
ASSET RETIREMENT OBLIGATIONS (AROs)We initially measure and record AROs at management’s best estimate using a present value methodology, adjusted subsequently for any changes in the timing or amount of cash flows and changes in discount rates. We capitalize asset retirement costs as part of the related assets and amortize them into earnings over time. We also increase the ARO and record a corresponding amount in interest expense to reflect the passage of time.
J) INTANGIBLE ASSETS
FINITE-LIFE INTANGIBLE ASSETSFinite-life intangible assets are recorded at cost less accumulated amortization and accumulated impairment losses, if any.
SOFTWARE
We record internal-use software at historical cost. Cost includes expenditures that are attributable directly to the acquisition or development of the software, including the purchase cost and labour.
Software development costs are capitalized when all the following conditions are met:
• technical feasibility can be demonstrated
• management has the intent and the ability to complete the asset for use or sale
• it is probable that economic benefits will be generated
• costs attributable to the asset can be measured reliably
CUSTOMER RELATIONSHIPS
Customer relationship assets are acquired through business combinations and are recorded at fair value at the date of acquisition.
PROGRAM AND FEATURE FILM RIGHTS
We account for program and feature film rights as intangible assets when these assets are acquired for the purpose of broadcasting. Program and feature film rights, which include producer advances and licence fees paid in advance of receipt of the program or film, are stated
at acquisition cost less accumulated amortization, and accumulated impairment losses, if any. Programs and feature films under licence agreements are recorded as assets for rights acquired and liabilities for obligations incurred when:
• we receive a broadcast master and the cost is known or reasonably determinable for new program and feature film licences; or
• the licence term commences for licence period extensions or syndicated programs
Related liabilities of programs and feature films are classified as current or non-current, based on the payment terms. Amortization of program and feature film rights is recorded in Operating costs in the income statements.
INDEFINITE-LIFE INTANGIBLE ASSETSBrand assets, mainly comprised of the Bell, Bell Media and Bell MTS brands, and broadcast licences are acquired through business combinations and are recorded at fair value at the date of acquisition, less accumulated impairment losses, if any. Wireless spectrum licences are recorded at acquisition cost, including borrowing costs when the time to build or develop the related network is in excess of one year. Borrowing costs are calculated at a rate that is based on our weighted average interest rate on our outstanding long-term debt.
Currently, there are no legal, regulatory, competitive or other factors that limit the useful lives of our brands or spectrum licences.

Not
es to
con
solid
ated
fi n
anci
al s
tate
men
ts
BCE InC. 2020 AnnuAl REpoRt | 133
K) DEPRECIATION AND AMORTIZATIONWe depreciate property, plant and equipment and amortize finite-life intangible assets on a straight-line basis over their estimated useful lives. We review our estimates of useful lives on an annual basis and adjust depreciation and amortization on a prospective basis, as required. Land and assets under construction or development are not depreciated.
ESTIMATED USEFUL LIFE
Property, plant and equipment
Network infrastructure and equipment 2 to 50 years
Buildings 5 to 50 years
Finite-life intangible assets
Software 2 to 12 years
Customer relationships 2 to 26 years
Program and feature film rights Up to 5 years
L) INVESTMENTS IN ASSOCIATES AND JOINT ARRANGEMENTSOur financial statements incorporate our share of the results of our associates and joint ventures using the equity method of accounting, except when the investment is classified as held for sale. Equity income from investments is recorded in Other (expense) income in the income statements.
Investments in associates and joint ventures are recognized initially at cost and adjusted thereafter to include the company’s share of income or loss and comprehensive income or loss on an after-tax basis.
Investments are reviewed for impairment at each reporting period and we compare their recoverable amount to their carrying amount when there is an indication of impairment.
We recognize our share of the assets, liabilities, revenues and expenses of joint operations in accordance with the related contractual agreements.
M) BUSINESS COMBINATIONS AND GOODWILLBusiness combinations are accounted for using the acquisition method. The consideration transferred in a business combination is measured at fair value at the date of acquisition. Acquisition-related transaction costs are expensed as incurred and recorded in Severance, acquisition and other costs in the income statements.
Identifiable assets and liabilities, including intangible assets, of acquired businesses are recorded at their fair values at the date of acquisition. When we acquire control of a business, any previously-held
equity interest is remeasured to fair value and any gain or loss on remeasurement is recognized in Other (expense) income in the income statements. The excess of the purchase consideration and any previously-held equity interest over the fair value of identifiable net assets acquired is recorded as Goodwill in the statements of financial position. If the fair value of identifiable net assets acquired exceeds the purchase consideration and any previously-held equity interest, the difference is recognized in Other (expense) income in the income statements immediately as a bargain purchase gain.
N) IMPAIRMENT OF NON-FINANCIAL ASSETSGoodwill and indefinite-life intangible assets are tested for impairment annually or when there is an indication that the asset may be impaired. Property, plant and equipment and finite-life intangible assets are tested for impairment if events or changes in circumstances, assessed at each reporting period, indicate that their carrying amount may not be recoverable. For the purpose of impairment testing, assets other than goodwill are grouped at the lowest level for which there are separately identifiable cash inflows.
Impairment losses are recognized and measured as the excess of the carrying value of the assets over their recoverable amount. An asset’s recoverable amount is the higher of its fair value less costs of disposal and its value in use. Previously recognized impairment losses, other than those attributable to goodwill, are reviewed for possible reversal at each reporting date and, if the asset’s recoverable amount has increased, all or a portion of the impairment is reversed.
GOODWILL IMPAIRMENT TESTINGWe perform an annual test for goodwill impairment in the fourth quarter for each of our cash generating units (CGUs) or groups of CGUs to which goodwill is allocated, and whenever there is an indication that goodwill might be impaired.
A CGU is the smallest identifiable group of assets that generates cash inflows that are independent of the cash inflows from other assets or groups of assets.
We identify any potential impairment by comparing the carrying value of a CGU or group of CGUs to its recoverable amount. The recoverable amount of a CGU or group of CGUs is the higher of its fair value less costs of disposal and its value in use. Both fair value less costs of disposal and value in use are based on estimates of discounted future cash flows or other valuation methods. Cash flows are projected based on past experience, actual operating results and business plans. When the recoverable amount of a CGU or group of CGUs is less than its carrying value, the recoverable amount is determined for its identifiable assets and liabilities. The excess of the recoverable amount of the CGU or group of CGUs over the total of the amounts assigned to its assets and liabilities is the recoverable amount of goodwill.
An impairment charge is recognized in the income statements for any excess of the carrying value of goodwill over its recoverable amount. For purposes of impairment testing of goodwill, our CGUs or groups of CGUs correspond to our reporting segments as disclosed in Note 4, Segmented information.

Not
es to
con
solid
ated
fi n
anci
al s
tate
men
ts
134 | BCE InC. 2020 AnnuAl REpoRt
O) FINANCIAL INSTRUMENTS AND CONTRACT ASSETSWe measure trade and other receivables, including wireless device financing plan receivables, at amortized cost using the effective interest method, net of any allowance for doubtful accounts.
Our portfolio investments in equity securities are classified as fair value through other comprehensive income and are presented in our statements of financial position as Other non-current assets. These securities are recorded at fair value on the date of acquisition, including related transaction costs, and are adjusted to fair value at each reporting date. The corresponding unrealized gains and losses are recorded in Other comprehensive income from continuing operations in the consolidated statements of comprehensive income (statements of comprehensive income) and are reclassified from Accumulated other comprehensive income to Deficit in the statements of financial position when realized.
Other financial liabilities, which include trade payables and accruals, compensation payable, obligations imposed by the Canadian Radio-television and Telecommunications Commission (CRTC), interest payable and long-term debt, are recorded at amortized cost using the effective interest method.
We measure the allowance for doubtful accounts and impairment of contract assets based on an expected credit loss (ECL) model, which takes into account current economic conditions, historical information, and forward-looking information. We use the simplified approach for measuring losses based on the lifetime ECL for trade and other receivables and contract assets. Amounts considered uncollectible are written off and recognized in Operating costs in the income statements.
The cost of issuing debt is included as part of long-term debt and is accounted for at amortized cost using the effective interest method. The cost of issuing equity is reflected in the consolidated statements of changes in equity as a charge to the deficit.
P) DERIVATIVE FINANCIAL INSTRUMENTSWe use derivative financial instruments to manage risks related to changes in interest rates, foreign currency rates, commodity prices and cash flow exposures related to share-based payment plans, capital expenditures, long-term debt instruments and operating revenues and expenses. We do not use derivative financial instruments for speculative or trading purposes.
Derivatives that mature within one year are included in Other current assets or Trade payables and other liabilities in the statements of financial position, whereas derivatives that have a maturity of more than one year are included in Other non-current assets or Other non-current liabilities.
HEDGE ACCOUNTINGTo qualify for hedge accounting, we document the relationship between the derivative and the related identified risk exposure, and our risk management objective and strategy. This includes associating each derivative to a specific asset or liability, commitment, or anticipated transaction.
We assess the effectiveness of a derivative in managing an identified risk exposure when hedge accounting is initially applied, and on an ongoing basis thereafter. If a hedging relationship ceases to meet the qualifying criteria, we discontinue hedge accounting prospectively.
CASH FLOW HEDGES
We enter into cash flow hedges to mitigate foreign currency risk on certain debt instruments and anticipated purchases and sales, as well as interest rate risk related to anticipated debt issuances.
We use foreign currency forward contracts and options to manage the foreign currency exposure relating to anticipated purchases and sales denominated in foreign currencies. Changes in the fair value of these foreign currency forward contracts and options are recognized in our statements of comprehensive income, except for any ineffective portion, which is recognized immediately in Other (expense) income in the income statements. Realized gains and losses in Accumulated other comprehensive income are reclassified to the income statements or to the initial cost of the non-financial asset in the same periods as the corresponding hedged transactions are recognized.
We use foreign currency forward contracts and cross currency interest rate swaps to manage our U.S. dollar debt under our committed credit facilities and commercial paper program and our U.S. dollar long-term debt. Changes in the fair value of these derivatives and the related debt are recognized in Other (expense) income in the income statements and offset, unless a portion of the hedging relationship is ineffective.
DERIVATIVES USED AS ECONOMIC HEDGESWe use derivatives to manage cash flow exposures related to equity settled share-based payment plans and anticipated purchases in foreign currencies, equity price risk related to a cash-settled share-based payment plan, interest rate risk related to preferred share dividend rate resets and commodity price risk related to the purchase cost of fuel. As these derivatives do not qualify for hedge accounting, the changes in their fair value are recorded in the income statements in Operating costs for derivatives used to hedge cash-settled share-based payments and in Other (expense) income for other derivatives.
Q) POST-EMPLOYMENT BENEFIT PLANSDEFINED BENEFIT (DB) AND OTHER POST-EMPLOYMENT BENEFIT (OPEB) PLANSWe maintain DB pension plans that provide pension benefits for certain employees and retirees. Benefits are based on the employee’s length of service and average rate of pay during the highest paid consecutive five years of service. Most employees are not required to contribute to the plans. Certain plans provide cost of living adjustments to help protect the income of retired employees against inflation.
We are responsible for adequately funding our DB pension plans. We make contributions to them based on various actuarial cost methods permitted by pension regulatory bodies. Contributions reflect actuarial assumptions about future investment returns, salary projections, future service and life expectancy.
Not
es to
con
solid
ated
fi n
anci
al s
tate
men
ts
BCE InC. 2020 AnnuAl REpoRt | 135
We provide OPEBs to some of our employees, including:
• healthcare and life insurance benefits during retirement, which were phased out for new retirees since December 31, 2016. Most of these OPEB plans are unfunded and benefits are paid when incurred.
• other benefits, including workers’ compensation and medical benefits to former or inactive employees, their beneficiaries and dependants, from the time their employment ends until their retirement starts, under certain circumstances
We accrue our obligations and related costs under post-employment benefit plans, net of the fair value of the benefit plan assets. Pension and OPEB costs are determined using:
• the projected unit credit method, prorated on years of service, which takes into account future pay levels
• a discount rate based on market interest rates of high-quality corporate fixed income investments with maturities that match the timing of benefits expected to be paid under the plans
• management’s best estimate of pay increases, retirement ages of employees, expected healthcare costs and life expectancy
We value post-employment benefit plan assets at fair value using current market values.
Post-employment benefit plans current service cost is included in Operating costs in the income statements. Interest on our post-employment benefit plan assets and obligations is recognized in Finance
costs in the income statements and represents the accretion of interest on the assets and obligations under our post-employment benefit plans. The interest rate is based on market conditions that existed at the beginning of the year. Actuarial gains and losses for all post-employment benefit plans are recorded in Other comprehensive income from continuing operations in the statements of comprehensive income in the period in which they occur and are recognized immediately in the deficit.
December 31 is the measurement date for our significant post-employment benefit plans. Our actuaries perform a valuation based on management’s assumptions at least every three years to determine the actuarial present value of the accrued DB pension plans and OPEB obligations. The most recent actuarial valuation of our significant pension plans was as at December 31, 2019.
DEFINED CONTRIBUTION (DC) PENSION PLANSWe maintain DC pension plans that provide certain employees with benefits. Under these plans, we are responsible for contributing a predetermined amount to an employee’s retirement savings, based on a percentage of the employee’s salary.
We recognize a post-employment benefit plans service cost for DC pension plans when the employee provides service to the company, essentially coinciding with our cash contributions.
Generally, new employees can only participate in the DC pension plans.
R) PROVISIONSProvisions are recognized when all the following conditions are met:
• the company has a present legal or constructive obligation based on past events
• it is probable that an outflow of economic resources will be required to settle the obligation
• the amount can be reasonably estimated
Provisions are measured at the present value of the estimated expenditures expected to settle the obligation, if the effect of the time value of money is material. The present value is determined using current market assessments of the discount rate and risks specific to the obligation. The obligation increases as a result of the passage of time, resulting in interest expense which is recognized in Finance costs in the income statements.
S) ESTIMATES AND KEY JUDGMENTSWhen preparing the financial statements, management makes estimates and judgments relating to:
• reported amounts of revenues and expenses
• reported amounts of assets and liabilities
• disclosure of contingent assets and liabilities
We base our estimates on a number of factors, including historical experience, current events, including but not limited to the COVID-19 pandemic, and actions that the company may undertake in the future, as well as other assumptions that we believe are reasonable under the circumstances. By their nature, these estimates and judgments are subject to measurement uncertainty and actual results could differ. Our more significant estimates and judgments are described below.
ESTIMATESUSEFUL LIVES OF PROPERTY, PLANT AND EQUIPMENT AND FINITE-LIFE INTANGIBLE ASSETS
Property, plant and equipment represent a significant proportion of our total assets. Changes in technology or our intended use of these assets, as well as changes in business prospects or economic and industry factors, may cause the estimated useful lives of these assets to change.
POST-EMPLOYMENT BENEFIT PLANS
The amounts reported in the financial statements relating to DB pension plans and OPEBs are determined using actuarial calculations that are based on several assumptions.
The actuarial valuation uses management’s assumptions for, among other things, the discount rate, life expectancy, the rate of compensation increase, trends in healthcare costs and expected average remaining years of service of employees.
Not
es to
con
solid
ated
fi n
anci
al s
tate
men
ts
136 | BCE InC. 2020 AnnuAl REpoRt
The most significant assumptions used to calculate the net post-employment benefit plans cost are the discount rate and life expectancy.
The discount rate is based on the yield on long-term, high-quality corporate fixed income investments, with maturities matching the estimated cash flows of the post-employment benefit plans. Life expectancy is based on publicly available Canadian mortality tables and is adjusted for the company’s specific experience.
REVENUE FROM CONTRACTS WITH CUSTOMERS
We are required to make estimates that affect the amount of revenue from contracts with customers, including estimating the stand-alone selling prices of products and services.
IMPAIRMENT OF NON-FINANCIAL ASSETS
We make a number of estimates when calculating recoverable amounts using discounted future cash flows or other valuation methods to test for impairment. These estimates include the assumed growth rates for future cash flows, the number of years used in the cash flow model and the discount rate.
DEFERRED TAXES
The amounts of deferred tax assets and liabilities are estimated with consideration given to the timing, sources and amounts of future taxable income.
LEASES
The application of IFRS 16 requires us to make estimates that affect the measurement of right-of-use assets and liabilities, including determining the appropriate discount rate used to measure lease liabilities. Lease liabilities are initially measured at the present value of the lease payments that are not paid at the commencement date, discounted using our incremental borrowing rate, unless the rate implicit in the lease is readily determinable. Our incremental borrowing rate is derived from publicly available risk-free interest rates, adjusted for applicable credit spreads and lease terms. We apply a single incremental borrowing rate to a portfolio of leases with similar characteristics.
FAIR VALUE OF FINANCIAL INSTRUMENTS
Certain financial instruments, such as investments in equity securities, derivative financial instruments and certain elements of borrowings, are carried in the statements of financial position at fair value, with changes in fair value reflected in the income statements and the statements of comprehensive income. Fair values are estimated by reference to published price quotations or by using other valuation techniques that may include inputs that are not based on observable market data, such as discounted cash flows and earnings multiples.
CONTINGENCIES
In the ordinary course of business, we become involved in various claims and legal proceedings seeking monetary damages and other relief. Pending claims and legal proceedings represent a potential cost to our business. We estimate the amount of a loss by analyzing potential outcomes and assuming various litigation and settlement strategies, based on information that is available at the time.
ONEROUS CONTRACTS
A provision for onerous contracts is recognized when the unavoidable costs of meeting our obligations under a contract exceed the expected benefits to be received under the contract. The provision is measured at the present value of the lower of the expected cost of terminating the contract and the expected net cost of completing the contract.
JUDGMENTSPOST-EMPLOYMENT BENEFIT PLANS
The determination of the discount rate used to value our post-employment benefit obligations requires judgment. The rate is set by reference to market yields of long-term, high-quality corporate fixed income investments at the beginning of each fiscal year. Significant judgment is required when setting the criteria for fixed income investments to be included in the population from which the yield curve is derived. The most significant criteria considered for the selection of investments include the size of the issue and credit quality, along with the identification of outliers, which are excluded.
INCOME TAXES
The calculation of income taxes requires judgment in interpreting tax rules and regulations. There are transactions and calculations for which the ultimate tax determination is uncertain. Our tax filings are also subject to audits, the outcome of which could change the amount of current and deferred tax assets and liabilities.
Management judgment is used to determine the amounts of deferred tax assets and liabilities to be recognized. In particular, judgment is required when assessing the timing of the reversal of temporary differences to which future income tax rates are applied.
LEASES
The application of IFRS 16 requires us to make judgments that affect the measurement of right-of-use assets and liabilities. A lease contract conveys the right to control the use of an identified asset for a period of time in exchange for consideration. At inception of the contract, we assess whether the contract contains an identified asset, whether we have the right to obtain substantially all of the economic benefits from use of the asset and whether we have the right to direct how and for what purpose the asset is used. In determining the lease term, we include periods covered by renewal options when we are reasonably certain to exercise those options. Similarly, we include periods covered by termination options when we are reasonably certain not to exercise those options. To assess if we are reasonably certain to exercise an option, we consider all facts and circumstances that create an economic incentive to exercise renewal options (or not exercise termination options). Economic incentives include the costs related to the termination of the lease, the significance of any leasehold improvements and the importance of the underlying assets to our operations.
REVENUE FROM CONTRACTS WITH CUSTOMERS
The identification of performance obligations within a contract and the timing of satisfaction of performance obligations under long-term contracts requires judgment. Additionally, the determination of costs to obtain a contract, including the identification of incremental costs, also requires judgment.
CGUs
The determination of CGUs or groups of CGUs for the purpose of impairment testing requires judgment.
CONTINGENCIES
The determination of whether a loss is probable from claims and legal proceedings and whether an outflow of resources is likely requires judgment.
Not
es to
con
solid
ated
fi n
anci
al s
tate
men
ts
BCE InC. 2020 AnnuAl REpoRt | 137
T) ADOPTION OF NEW OR AMENDED ACCOUNTING STANDARDSAs required, effective January 1, 2020, we adopted the following new or amended accounting standards.
STANDARD DESCRIPTION IMPACT
IFRIC Agenda Decision on IFRS 16 – Leases
International Financial Reporting Interpretations Committee (IFRIC) agenda decision clarifying the determination of the lease term for cancellable or renewable leases under IFRS 16.
This agenda decision did not have a significant impact on our financial statements.
Definition of a Business, Amendments to IFRS 3 – Business Combinations
These amendments to the implementation guidance of IFRS 3 clarify the definition of a business to assist entities to determine whether a transaction should be accounted for as a business combination or an asset acquisition.
These amendments did not have any impact on our financial statements. They may affect whether future acquisitions are accounted for as business combinations or asset acquisitions, along with the resulting allocation of the purchase price between the net identifiable assets acquired and goodwill.
U) FUTURE CHANGES TO ACCOUNTING STANDARDSThe following amended accounting standards issued by the IASB have an effective date after December 31, 2020 and have not yet been adopted by BCE.
STANDARD DESCRIPTION IMPACT EFFECTIVE DATE
COVID-19-Related Rent Concessions, Amendment to IFRS 16 – Leases
This amendment provides an optional relief to lessees from applying IFRS 16’s guidance on lease modification accounting for rent concessions arising as a direct consequence of the COVID-19 pandemic.
We did not adopt the optional relief.
Effective for annual reporting periods beginning on or after June 1, 2020. Early application is permitted.
Onerous Contracts – Cost of Fulfilling a Contract, Amendments to IAS 37 – Provisions, contingent liabilities and contingent assets
These amendments clarify which costs should be included in determining the cost of fulfilling a contract when assessing whether a contract is onerous.
We are currently assessing the impact of these amendments.
Effective for annual reporting periods beginning on or after January 1, 2022. Early application is permitted.
Note 3 | Discontinued operationsOn June 1, 2020, BCE announced that it had entered into an agreement to sell substantially all of its data centre operations in an all-cash transaction valued at $1.04 billion.
We have reclassified amounts related to the sale for the previous year to discontinued operations in our consolidated income statements and consolidated statements of cash flows to make them consistent with
the presentation for the current year. Property, plant and equipment and intangible assets that were sold were no longer depreciated or amortized effective June 1, 2020.
In Q4 2020, we completed the sale for proceeds of $933 million (net of debt and other items) and recorded a gain on sale, net of taxes, of $211 million. The capital gain as a result of the sale is mainly offset by the recognition of previously unrecognized capital loss carry forwards.
The following table summarizes the carrying value of the assets and liabilities sold:
2020
Contract assets 1
Contract costs 2
Property, plant and equipment 484
Intangible assets 227
Goodwill 115
Total assets sold 829
Long-term debt 113
Deferred tax liability 37
Other non-current liabilities 9
Total liabilities sold 159
Net assets sold 670
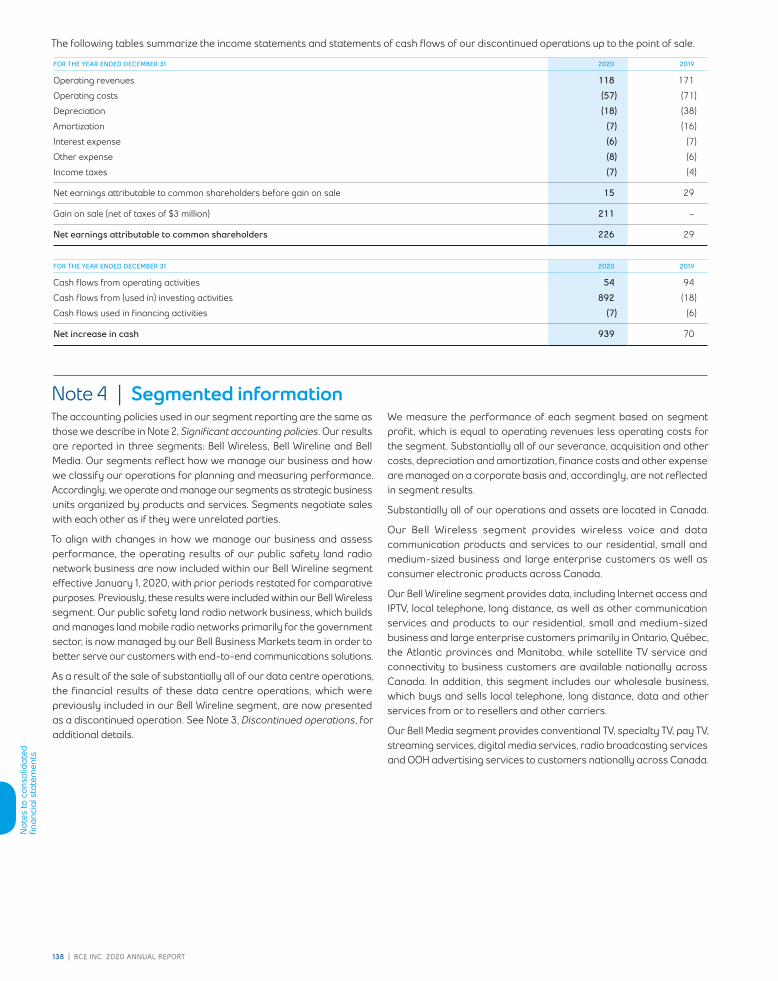
Not
es to
con
solid
ated
fi n
anci
al s
tate
men
ts
138 | BCE InC. 2020 AnnuAl REpoRt
The following tables summarize the income statements and statements of cash flows of our discontinued operations up to the point of sale.
FOR THE YEAR ENDED DECEMBER 31 2020 2019
Operating revenues 118 171
Operating costs (57) (71)
Depreciation (18) (38)
Amortization (7) (16)
Interest expense (6) (7)
Other expense (8) (6)
Income taxes (7) (4)
Net earnings attributable to common shareholders before gain on sale 15 29
Gain on sale (net of taxes of $3 million) 211 –
Net earnings attributable to common shareholders 226 29
FOR THE YEAR ENDED DECEMBER 31 2020 2019
Cash flows from operating activities 54 94
Cash flows from (used in) investing activities 892 (18)
Cash flows used in financing activities (7) (6)
Net increase in cash 939 70
Note 4 | Segmented informationThe accounting policies used in our segment reporting are the same as those we describe in Note 2, Significant accounting policies. Our results are reported in three segments: Bell Wireless, Bell Wireline and Bell Media. Our segments reflect how we manage our business and how we classify our operations for planning and measuring performance. Accordingly, we operate and manage our segments as strategic business units organized by products and services. Segments negotiate sales with each other as if they were unrelated parties.
To align with changes in how we manage our business and assess performance, the operating results of our public safety land radio network business are now included within our Bell Wireline segment effective January 1, 2020, with prior periods restated for comparative purposes. Previously, these results were included within our Bell Wireless segment. Our public safety land radio network business, which builds and manages land mobile radio networks primarily for the government sector, is now managed by our Bell Business Markets team in order to better serve our customers with end-to-end communications solutions.
As a result of the sale of substantially all of our data centre operations, the financial results of these data centre operations, which were previously included in our Bell Wireline segment, are now presented as a discontinued operation. See Note 3, Discontinued operations, for additional details.
We measure the performance of each segment based on segment profit, which is equal to operating revenues less operating costs for the segment. Substantially all of our severance, acquisition and other costs, depreciation and amortization, finance costs and other expense are managed on a corporate basis and, accordingly, are not reflected in segment results.
Substantially all of our operations and assets are located in Canada.
Our Bell Wireless segment provides wireless voice and data communication products and services to our residential, small and medium-sized business and large enterprise customers as well as consumer electronic products across Canada.
Our Bell Wireline segment provides data, including Internet access and IPTV, local telephone, long distance, as well as other communication services and products to our residential, small and medium-sized business and large enterprise customers primarily in Ontario, Québec, the Atlantic provinces and Manitoba, while satellite TV service and connectivity to business customers are available nationally across Canada. In addition, this segment includes our wholesale business, which buys and sells local telephone, long distance, data and other services from or to resellers and other carriers.
Our Bell Media segment provides conventional TV, specialty TV, pay TV, streaming services, digital media services, radio broadcasting services and OOH advertising services to customers nationally across Canada.

Not
es to
con
solid
ated
fi n
anci
al s
tate
men
ts
BCE InC. 2020 AnnuAl REpoRt | 139
SEGMENTED INFORMATION
FOR THE YEAR ENDED DECEMBER 31, 2020 NOTEBELL
WIRELESSBELL
WIRELINEBELL
MEDIAINTER-SEGMENT
ELIMINATIONS BCE
Operating revenues
External customers 8,630 11,884 2,369 – 22,883
Inter-segment 53 322 381 (756) –
Total operating revenues 8,683 12,206 2,750 (756) 22,883
Operating costs 5 (5,017) (6,960) (2,055) 756 (13,276)
Segment profit (1) 3,666 5,246 695 – 9,607
Severance, acquisition and other costs 6 (116)
Depreciation and amortization 16, 18 (4,404)
Finance costs
Interest expense 7 (1,110)
Interest on post-employment benefit obligations 26 (46)
Impairment of assets 8 (472)
Other expense 9 (194)
Income taxes 10 (792)
Net earnings from continuing operations 2,473
Net earnings from discontinued operations 3 226
Net earnings 2,699
Goodwill 21 3,046 4,612 2,946 – 10,604
Indefinite-life intangible assets 18 4,063 1,692 2,085 – 7,840
Capital expenditures 916 3,161 125 – 4,202
(1) The chief operating decision maker uses primarily one measure of profit to make decisions and assess performance, being operating revenues less operating costs.
FOR THE YEAR ENDED DECEMBER 31, 2019 NOTEBELL
WIRELESSBELL
WIRELINEBELL
MEDIAINTER-SEGMENT
ELIMINATIONS BCE
Operating revenues
External customers 8,946 12,036 2,811 – 23,793
Inter-segment 55 281 406 (742) –
Total operating revenues 9,001 12,317 3,217 (742) 23,793
Operating costs 5 (5,210) (6,952) (2,367) 742 (13,787)
Segment profit (1) 3,791 5,365 850 – 10,006
Severance, acquisition and other costs 6 (114)
Depreciation and amortization 16, 18 (4,344)
Finance costs
Interest expense 7 (1,125)
Interest on post-employment benefit obligations 26 (63)
Impairment of assets 8 (102)
Other income 9 95
Income taxes 10 (1,129)
Net earnings from continuing operations 3,224
Net earnings from discontinued operations 3 29
Net earnings 3,253
Goodwill 21 3,046 4,675 2,946 – 10,667
Indefinite-life intangible assets 18 3,948 1,692 2,381 – 8,021
Capital expenditures 671 3,195 108 – 3,974
(1) The chief operating decision maker uses primarily one measure of profit to make decisions and assess performance, being operating revenues less operating costs.

Not
es to
con
solid
ated
fi n
anci
al s
tate
men
ts
140 | BCE InC. 2020 AnnuAl REpoRt
REVENUES BY SERVICES AND PRODUCTSThe following table presents our revenues disaggregated by type of services and products.
FOR THE YEAR ENDED DECEMBER 31 2020 2019
Services (1)
Wireless 6,122 6,323
Wireline data 7,691 7,617
Wireline voice 3,402 3,564
Media 2,369 2,811
Other wireline services 248 251
Total services 19,832 20,566
Products (2)
Wireless 2,508 2,623
Wireline data 494 556
Wireline equipment and other 49 48
Total products 3,051 3,227
Total operating revenues 22,883 23,793
(1) Our service revenues are generally recognized over time.(2) Our product revenues are generally recognized at a point in time.
Note 5 | Operating costsFOR THE YEAR ENDED DECEMBER 31 NOTE 2020 2019
Labour costs
Wages, salaries and related taxes and benefits (1) (4,108) (4,281)
Post-employment benefit plans service cost (net of capitalized amounts) 26 (269) (246)
Other labour costs (2) (975) (1,004)
Less:
Capitalized labour 1,007 1,028
Total labour costs (4,345) (4,503)
Cost of revenues (3) (6,967) (7,356)
Other operating costs (4) (1,964) (1,928)
Total operating costs (13,276) (13,787)
(1) Costs reported in 2020 are net of amounts from the Canada Emergency Wage Subsidy, a wage subsidy program offered by the federal government to eligible employers as a result of the COVID-19 pandemic.
(2) Other labour costs include contractor and outsourcing costs.(3) Cost of revenues includes costs of wireless devices and other equipment sold, network and content costs, and payments to other carriers.(4) Other operating costs include marketing, advertising and sales commission costs, bad debt expense, taxes other than income taxes, information technology costs, professional service
fees and rent.
Research and development expenses of $47 million and $109 million are included in operating costs for 2020 and 2019, respectively.
Note 6 | Severance, acquisition and other costsFOR THE YEAR ENDED DECEMBER 31 2020 2019
Severance (35) (63)
Acquisition and other (81) (51)
Total severance, acquisition and other costs (116) (114)

Not
es to
con
solid
ated
fi n
anci
al s
tate
men
ts
BCE InC. 2020 AnnuAl REpoRt | 141
SEVERANCE COSTSSeverance costs consist of charges related to involuntary and voluntary employee terminations.
ACQUISITION AND OTHER COSTSAcquisition and other costs consist of transaction costs, such as legal and financial advisory fees, related to completed or potential acquisitions, employee severance costs related to the purchase of a business, the costs to integrate acquired companies into our operations, costs relating to litigation and regulatory decisions, when they are significant, and other costs.
Note 7 | Interest expenseFOR THE YEAR ENDED DECEMBER 31 2020 2019
Interest expense on long-term debt (1,072) (1,017)
Interest expense on other debt (87) (153)
Capitalized interest 49 45
Total interest expense (1,110) (1,125)
Included in interest expense on long-term debt is interest on lease liabilities of $199 million and $213 million for 2020 and 2019, respectively.
Capitalized interest was calculated using an average rate of 3.95% and 3.96% for 2020 and 2019, respectively, which represents the weighted average interest rate on our outstanding long-term debt.
Note 8 | Impairment of assets2020During the second quarter of 2020, we identified indicators of impairment for certain of our Bell Media TV services and radio markets, notably declines in advertising revenues, lower subscriber revenues and overall increases in discount rates resulting from the economic impact of the COVID-19 pandemic. Accordingly, impairment testing was required for certain groups of CGUs as well as for goodwill.
During Q2 2020, we recognized $452 million of impairment charges for our English and French TV services as well as various radio markets within our Bell Media segment. These charges included $291 million allocated to indefinite-life intangible assets for broadcast licences, $146 million allocated to finite-life intangible assets, mainly for program and feature film rights, and $15 million to property, plant and equipment for network and infrastructure and equipment. They were determined by comparing the carrying value of the CGUs to their fair value less cost of disposal. We estimated the fair value of the CGUs using both discounted cash flows and market-based valuation models, which include five-year cash flow projections derived from business plans reviewed by senior management for the period of July 1, 2020 to December 31, 2025, using discount rates of 8.0% to 9.5% and a perpetuity growth rate of (1.0%) to nil as well as market multiple data from public companies and market transactions. After impairments, the carrying value of these CGUs was $942 million.
There was no impairment of Bell Media goodwill. See Note 21, Goodwill, for further details.
2019Impairment charges in 2019 included $85 million allocated to indefinite-life intangible assets, and $8 million allocated primarily to property, plant and equipment. These impairment charges related to broadcast licences and certain assets for various radio markets within our Bell Media segment. The impairment charges were a result of continued advertising demand and ratings pressures in the industry resulting from audience declines, as well as competitive pressure from streaming services. The charges were determined by comparing the carrying value of the CGUs to their fair value less cost of disposal. We estimated the fair value of the CGUs using both discounted cash flows and market-based valuation models, which include five-year cash flow projections derived from business plans reviewed by senior management for the period of January 1, 2020 to December 31, 2024, using a discount rate of 7.5% and a perpetuity growth rate of nil as well as market multiple data from public companies and market transactions. The carrying value of these CGUs was $464 million at December 31, 2019.

Not
es to
con
solid
ated
fi n
anci
al s
tate
men
ts
142 | BCE InC. 2020 AnnuAl REpoRt
Note 9 | Other (expense) incomeFOR THE YEAR ENDED DECEMBER 31 NOTE 2020 2019
Losses on retirements and disposals of property, plant and equipment and intangible assets (83) (9)
Net mark-to-market (losses) gains on derivatives used to economically hedge equity settled share-based compensation plans (51) 138
Early debt redemption costs 24 (50) (18)
Equity gains (losses) from investments in associates and joint ventures 19
Gain (loss) on investment 43 (53)
Operations (38) (19)
Gains on investments 3 18
Other (18) 38
Total other (expense) income (194) 95
LOSSES ON RETIREMENTS AND DISPOSALS OF PROPERTY, PLANT AND EQUIPMENT AND INTANGIBLE ASSETSIn 2020, we recorded a loss of $45 million due to a change in strategic direction related to the ongoing development of some of our TV platform assets under construction.
EQUITY GAINS (LOSSES) FROM INVESTMENTS IN ASSOCIATES AND JOINT VENTURESWe recorded a gain (loss) on investment of $43 million and ($53) million in 2020 and 2019, respectively, related to equity gains (losses) on our share of an obligation to repurchase at fair value the minority interest
in one of BCE’s joint ventures. The obligation is marked to market each reporting period and the gain or loss on investment is recorded as equity gains or losses from investments in associates and joint ventures.
GAINS ON INVESTMENTSIn 2019, we recorded gains of $18 million, which included a gain on an obligation to repurchase at fair value the minority interest in one of our subsidiaries.
Note 10 | Income taxesThe following table shows the significant components of income taxes deducted from net earnings from continuing operations.
FOR THE YEAR ENDED DECEMBER 31 2020 2019
Current taxes
Current taxes (776) (761)
Uncertain tax positions 26 6
Change in estimate relating to prior periods 32 22
Previously unrecognized tax benefits 40 –
Deferred taxes
Deferred taxes relating to the origination and reversal of temporary differences (107) (316)
Change in estimate relating to prior periods (26) (8)
Recognition and utilization of loss carryforwards 15 (106)
Effect of change in provincial corporate tax rate 9 25
Uncertain tax positions (5) 9
Total income taxes (792) (1,129)
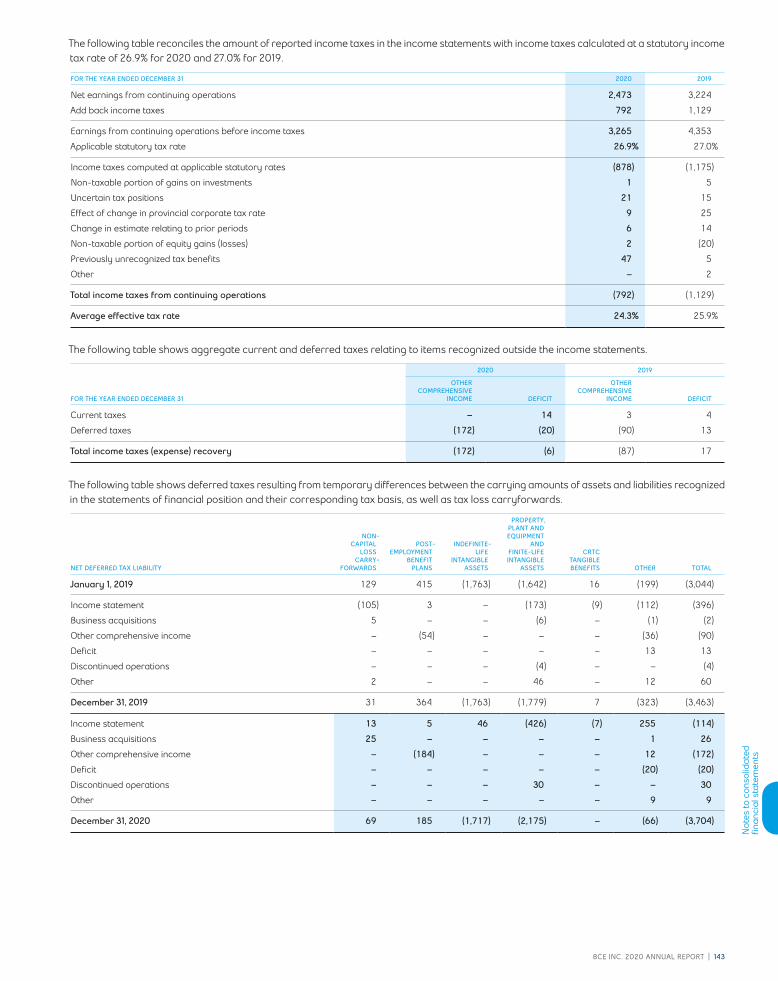
Not
es to
con
solid
ated
fi n
anci
al s
tate
men
ts
BCE InC. 2020 AnnuAl REpoRt | 143
The following table reconciles the amount of reported income taxes in the income statements with income taxes calculated at a statutory income tax rate of 26.9% for 2020 and 27.0% for 2019.
FOR THE YEAR ENDED DECEMBER 31 2020 2019
Net earnings from continuing operations 2,473 3,224
Add back income taxes 792 1,129
Earnings from continuing operations before income taxes 3,265 4,353
Applicable statutory tax rate 26.9% 27.0%
Income taxes computed at applicable statutory rates (878) (1,175)
Non-taxable portion of gains on investments 1 5
Uncertain tax positions 21 15
Effect of change in provincial corporate tax rate 9 25
Change in estimate relating to prior periods 6 14
Non-taxable portion of equity gains (losses) 2 (20)
Previously unrecognized tax benefits 47 5
Other – 2
Total income taxes from continuing operations (792) (1,129)
Average effective tax rate 24.3% 25.9%
The following table shows aggregate current and deferred taxes relating to items recognized outside the income statements.
2020 2019
FOR THE YEAR ENDED DECEMBER 31
OTHER COMPREHENSIVE
INCOME DEFICIT
OTHER COMPREHENSIVE
INCOME DEFICIT
Current taxes – 14 3 4
Deferred taxes (172) (20) (90) 13
Total income taxes (expense) recovery (172) (6) (87) 17
The following table shows deferred taxes resulting from temporary differences between the carrying amounts of assets and liabilities recognized in the statements of financial position and their corresponding tax basis, as well as tax loss carryforwards.
NET DEFERRED TAX LIABILITY
NON- CAPITAL
LOSS CARRY-
FORWARDS
POST- EMPLOYMENT
BENEFIT PLANS
INDEFINITE- LIFE
INTANGIBLE ASSETS
PROPERTY,PLANT AND EQUIPMENT
AND FINITE-LIFE INTANGIBLE
ASSETS
CRTC TANGIBLE BENEFITS OTHER TOTAL
January 1, 2019 129 415 (1,763) (1,642) 16 (199) (3,044)
Income statement (105) 3 – (173) (9) (112) (396)
Business acquisitions 5 – – (6) – (1) (2)
Other comprehensive income – (54) – – – (36) (90)
Deficit – – – – – 13 13
Discontinued operations – – – (4) – – (4)
Other 2 – – 46 – 12 60
December 31, 2019 31 364 (1,763) (1,779) 7 (323) (3,463)
Income statement 13 5 46 (426) (7) 255 (114)
Business acquisitions 25 – – – – 1 26
Other comprehensive income – (184) – – – 12 (172)
Deficit – – – – – (20) (20)
Discontinued operations – – – 30 – – 30
Other – – – – – 9 9
December 31, 2020 69 185 (1,717) (2,175) – (66) (3,704)
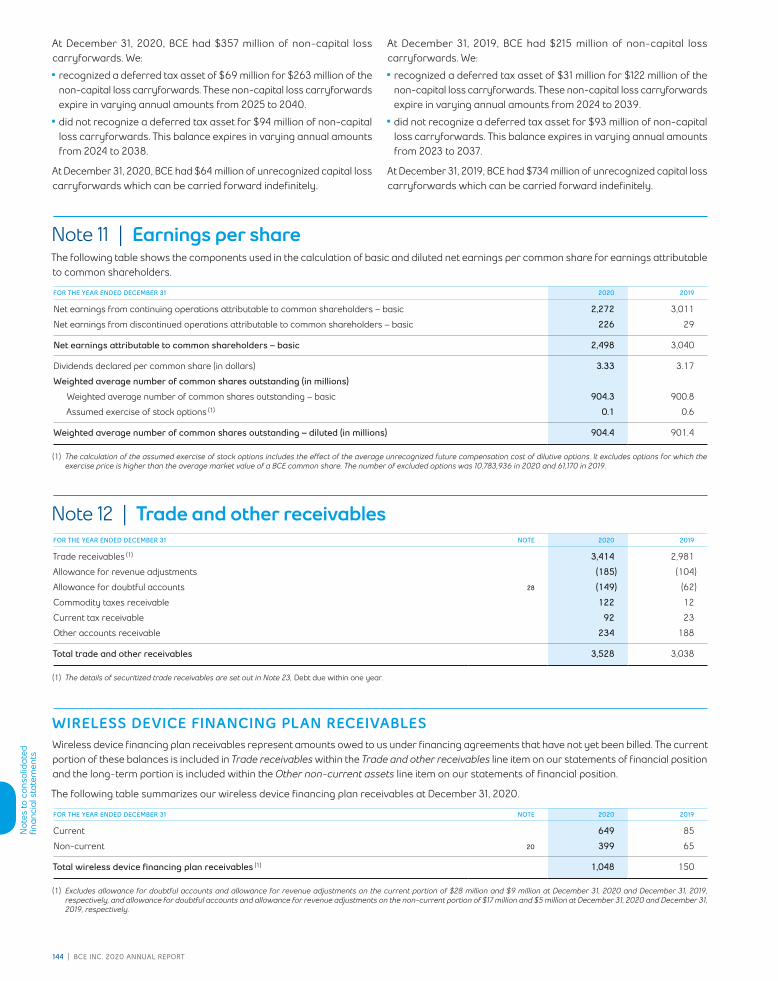
Not
es to
con
solid
ated
fi n
anci
al s
tate
men
ts
144 | BCE InC. 2020 AnnuAl REpoRt
At December 31, 2020, BCE had $357 million of non-capital loss carryforwards. We:
• recognized a deferred tax asset of $69 million for $263 million of the non-capital loss carryforwards. These non-capital loss carryforwards expire in varying annual amounts from 2025 to 2040.
• did not recognize a deferred tax asset for $94 million of non-capital loss carryforwards. This balance expires in varying annual amounts from 2024 to 2038.
At December 31, 2020, BCE had $64 million of unrecognized capital loss carryforwards which can be carried forward indefinitely.
At December 31, 2019, BCE had $215 million of non-capital loss carryforwards. We:
• recognized a deferred tax asset of $31 million for $122 million of the non-capital loss carryforwards. These non-capital loss carryforwards expire in varying annual amounts from 2024 to 2039.
• did not recognize a deferred tax asset for $93 million of non-capital loss carryforwards. This balance expires in varying annual amounts from 2023 to 2037.
At December 31, 2019, BCE had $734 million of unrecognized capital loss carryforwards which can be carried forward indefinitely.
Note 11 | Earnings per shareThe following table shows the components used in the calculation of basic and diluted net earnings per common share for earnings attributable to common shareholders.
FOR THE YEAR ENDED DECEMBER 31 2020 2019
Net earnings from continuing operations attributable to common shareholders – basic 2,272 3,011
Net earnings from discontinued operations attributable to common shareholders – basic 226 29
Net earnings attributable to common shareholders – basic 2,498 3,040
Dividends declared per common share (in dollars) 3.33 3.17
Weighted average number of common shares outstanding (in millions)
Weighted average number of common shares outstanding – basic 904.3 900.8
Assumed exercise of stock options (1) 0.1 0.6
Weighted average number of common shares outstanding – diluted (in millions) 904.4 901.4
(1) The calculation of the assumed exercise of stock options includes the effect of the average unrecognized future compensation cost of dilutive options. It excludes options for which the exercise price is higher than the average market value of a BCE common share. The number of excluded options was 10,783,936 in 2020 and 61,170 in 2019.
Note 12 | Trade and other receivablesFOR THE YEAR ENDED DECEMBER 31 NOTE 2020 2019
Trade receivables (1) 3,414 2,981
Allowance for revenue adjustments (185) (104)
Allowance for doubtful accounts 28 (149) (62)
Commodity taxes receivable 122 12
Current tax receivable 92 23
Other accounts receivable 234 188
Total trade and other receivables 3,528 3,038
(1) The details of securitized trade receivables are set out in Note 23, Debt due within one year.
WIRELESS DEVICE FINANCING PLAN RECEIVABLESWireless device financing plan receivables represent amounts owed to us under financing agreements that have not yet been billed. The current portion of these balances is included in Trade receivables within the Trade and other receivables line item on our statements of financial position and the long-term portion is included within the Other non-current assets line item on our statements of financial position.
The following table summarizes our wireless device financing plan receivables at December 31, 2020.
FOR THE YEAR ENDED DECEMBER 31 NOTE 2020 2019
Current 649 85
Non-current 20 399 65
Total wireless device financing plan receivables (1) 1,048 150
(1) Excludes allowance for doubtful accounts and allowance for revenue adjustments on the current portion of $28 million and $9 million at December 31, 2020 and December 31, 2019, respectively, and allowance for doubtful accounts and allowance for revenue adjustments on the non-current portion of $17 million and $5 million at December 31, 2020 and December 31, 2019, respectively.

Not
es to
con
solid
ated
fi n
anci
al s
tate
men
ts
BCE InC. 2020 AnnuAl REpoRt | 145
Note 13 | InventoryFOR THE YEAR ENDED DECEMBER 31 2020 2019
Wireless devices and accessories 189 199
Merchandise and other 250 228
Total inventory 439 427
The total amount of inventory subsequently recognized as an expense in cost of revenues was $2,927 million and $3,141 million for 2020 and 2019, respectively.
Note 14 | Contract assets and liabilitiesThe table below provides a reconciliation of the significant changes in the contract assets and the contract liabilities balances.
CONTRACT ASSETS (1) CONTRACT LIABILITIES
FOR THE YEAR ENDED DECEMBER 31 NOTE 2020 2019 2020 2019
Opening balance, January 1 1,644 1,493 890 899
Revenue recognized included in contract liabilities at the beginning of the year – – (643) (666)
Revenue recognized from contract liabilities included in contract assets at the beginning of the year 188 131 – –
Increase in contract liabilities during the year – – 688 644
Increase in contract liabilities included in contract assets during the year (186) (175) – –
Increase in contract assets from revenue recognized during the year 834 1,915 – –
Contract assets transferred to trade receivables (1,376) (1,461) 51 47
Acquisitions – – – (4)
Contract terminations transferred to trade receivables (145) (205) 19 24
Discontinued operations 3 (1) – – –
Other (15) (54) (46) (54)
Ending balance, December 31 943 1,644 959 890
(1) Net of allowance for doubtful accounts of $59 million and $68 million at December 31, 2020 and December 31, 2019, respectively. See Note 28, Financial and capital management, for additional details.
Note 15 | Contract costsThe table below provides a reconciliation of the contract costs balance.
FOR THE YEAR ENDED DECEMBER 31 NOTE 2020 2019
Opening balance, January 1 783 707
Incremental costs of obtaining a contract and contract fulfillment costs 535 602
Amortization included in operating costs (552) (523)
Impairment charges included in operating costs – (3)
Discontinued operations 3 (2) –
Ending balance, December 31 764 783
Contract costs are amortized over a period ranging from 12 to 84 months.
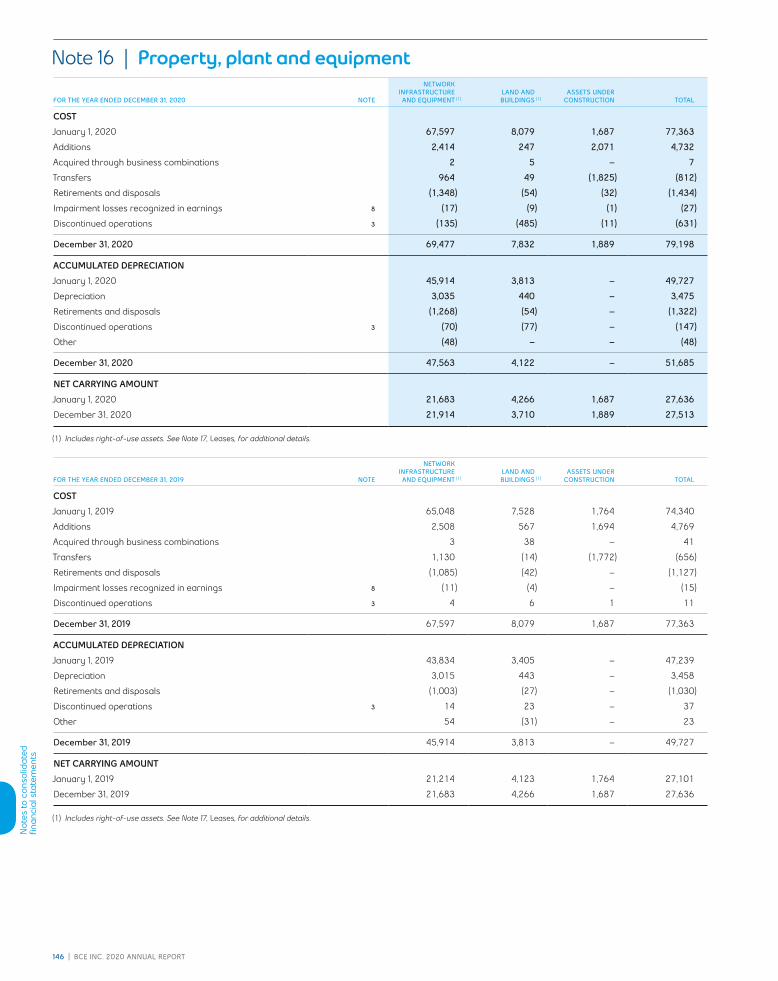
Not
es to
con
solid
ated
fi n
anci
al s
tate
men
ts
146 | BCE InC. 2020 AnnuAl REpoRt
Note 16 | Property, plant and equipment
FOR THE YEAR ENDED DECEMBER 31, 2020 NOTE
NETWORKINFRASTRUCTUREAND EQUIPMENT (1)
LAND ANDBUILDINGS (1)
ASSETS UNDER CONSTRUCTION TOTAL
COSTJanuary 1, 2020 67,597 8,079 1,687 77,363
Additions 2,414 247 2,071 4,732
Acquired through business combinations 2 5 – 7
Transfers 964 49 (1,825) (812)
Retirements and disposals (1,348) (54) (32) (1,434)
Impairment losses recognized in earnings 8 (17) (9) (1) (27)
Discontinued operations 3 (135) (485) (11) (631)
December 31, 2020 69,477 7,832 1,889 79,198
ACCUMULATED DEPRECIATIONJanuary 1, 2020 45,914 3,813 – 49,727
Depreciation 3,035 440 – 3,475
Retirements and disposals (1,268) (54) – (1,322)
Discontinued operations 3 (70) (77) – (147)
Other (48) – – (48)
December 31, 2020 47,563 4,122 – 51,685
NET CARRYING AMOUNTJanuary 1, 2020 21,683 4,266 1,687 27,636
December 31, 2020 21,914 3,710 1,889 27,513
(1) Includes right-of-use assets. See Note 17, Leases, for additional details.
FOR THE YEAR ENDED DECEMBER 31, 2019 NOTE
NETWORKINFRASTRUCTUREAND EQUIPMENT (1)
LAND ANDBUILDINGS (1)
ASSETS UNDER CONSTRUCTION TOTAL
COSTJanuary 1, 2019 65,048 7,528 1,764 74,340
Additions 2,508 567 1,694 4,769
Acquired through business combinations 3 38 – 41
Transfers 1,130 (14) (1,772) (656)
Retirements and disposals (1,085) (42) – (1,127)
Impairment losses recognized in earnings 8 (11) (4) – (15)
Discontinued operations 3 4 6 1 11
December 31, 2019 67,597 8,079 1,687 77,363
ACCUMULATED DEPRECIATIONJanuary 1, 2019 43,834 3,405 – 47,239
Depreciation 3,015 443 – 3,458
Retirements and disposals (1,003) (27) – (1,030)
Discontinued operations 3 14 23 – 37
Other 54 (31) – 23
December 31, 2019 45,914 3,813 – 49,727
NET CARRYING AMOUNTJanuary 1, 2019 21,214 4,123 1,764 27,101
December 31, 2019 21,683 4,266 1,687 27,636
(1) Includes right-of-use assets. See Note 17, Leases, for additional details.

Not
es to
con
solid
ated
fi n
anci
al s
tate
men
ts
BCE InC. 2020 AnnuAl REpoRt | 147
Note 17 | LeasesRIGHT-OF-USE ASSETSBCE’s significant right-of-use assets under leases are satellites, office premises, land, cellular tower sites, retail outlets and OOH advertising spaces. Right-of-use assets are presented in Property, plant and equipment in the statements of financial position.
FOR THE YEAR ENDED DECEMBER 31, 2020 NOTE
NETWORK INFRASTRUCTURE
AND EQUIPMENTLAND AND BUILDINGS TOTAL
COSTJanuary 1, 2020 3,609 2,933 6,542
Additions 470 200 670
Transfers (360) (2) (362)
Acquired through business combinations – 4 4
Lease terminations (20) (10) (30)
Impairment losses recognized in earnings 8 (1) (9) (10)
Discontinued operations 3 (8) (121) (129)
December 31, 2020 3,690 2,995 6,685
ACCUMULATED DEPRECIATIONJanuary 1, 2020 1,301 817 2,118
Depreciation 377 294 671
Transfers (199) – (199)
Lease terminations (2) (6) (8)
Discontinued operations 3 (4) (19) (23)
December 31, 2020 1,473 1,086 2,559
NET CARRYING AMOUNTJanuary 1, 2020 2,308 2,116 4,424
December 31, 2020 2,217 1,909 4,126
FOR THE YEAR ENDED DECEMBER 31, 2019 NOTE
NETWORK INFRASTRUCTURE
AND EQUIPMENTLAND AND BUILDINGS TOTAL
COSTJanuary 1, 2019 3,329 2,453 5,782
Additions 526 512 1,038
Transfers (233) – (233)
Acquired through business combinations – 8 8
Lease terminations (12) (38) (50)
Impairment losses recognized in earnings 8 (2) (3) (5)
Discontinued operations 3 1 1 2
December 31, 2019 3,609 2,933 6,542
ACCUMULATED DEPRECIATIONJanuary 1, 2019 1,042 536 1,578
Depreciation 372 298 670
Transfers (111) – (111)
Lease terminations (3) (22) (25)
Discontinued operations 3 1 5 6
December 31, 2019 1,301 817 2,118
NET CARRYING AMOUNTJanuary 1, 2019 2,287 1,917 4,204
December 31, 2019 2,308 2,116 4,424

Not
es to
con
solid
ated
fi n
anci
al s
tate
men
ts
148 | BCE InC. 2020 AnnuAl REpoRt
LEASES IN NET EARNINGS FROM CONTINUING OPERATIONSThe following table provides the expenses related to leases recognized in net earnings from continuing operations.
FOR THE YEAR ENDED DECEMBER 31 2020 2019
Interest expense on lease liabilities 199 213
Variable lease payment expenses not included in the measurement of lease liabilities 150 148
Expenses for leases of low value assets 60 58
Expenses for short-term leases 31 30
LEASES IN THE STATEMENTS OF CASH FLOWSTotal cash outflow related to leases was $1,219 million and $1,214 million for the period ended December 31, 2020 and December 31, 2019, respectively.
ADDITIONAL DISCLOSURESSee Note 23, Debt due within one year, and Note 24, Long-term debt, for lease liabilities balances included in the statements of financial position.
See Note 28, Financial and capital management, for a maturity analysis of lease liabilities.
See Note 33, Commitments and contingencies, for leases committed but not yet commenced as at December 31, 2020.
Note 18 | Intangible assetsFINITE-LIFE INDEFINITE-LIFE
FOR THE YEAR ENDED DECEMBER 31, 2020 NOTE SOFTWARE
CUSTOMER RELATION-
SHIPS
PROGRAM AND FEATURE
FILM RIGHTS OTHER TOTAL BRANDS
SPECTRUM AND OTHER
LICENCESBROADCAST
LICENCES TOTAL
TOTAL INTANGIBLE
ASSETS
COSTJanuary 1, 2020 10,522 2,017 716 489 13,744 2,409 3,586 2,026 8,021 21,765
Additions 344 – 874 41 1,259 – 116 – 116 1,375
Acquired through business combinations 1 – 10 – 11 – – – – 11
Transfers 810 – – – 810 – – – – 810
Retirements and disposals (2,479) – – (36) (2,515) – – – – (2,515)
Impairment losses recognized in earnings 8 (13) – (110) (25) (148) – (1) (296) (297) (445)
Amortization included in operating costs – – (845) – (845) – – – – (845)
Discontinued operations 3 (16) (281) – – (297) – – – – (297)
December 31, 2020 9,169 1,736 645 469 12,019 2,409 3,701 1,730 7,840 19,859
ACCUMULATED AMORTIZATIONJanuary 1, 2020 7,345 839 – 229 8,413 – – – – 8,413
Amortization 787 99 – 43 929 – – – – 929
Retirements and disposals (2,480) – – (37) (2,517) – – – – (2,517)
Discontinued operations 3 (8) (60) – – (68) – – – – (68)
December 31, 2020 5,644 878 – 235 6,757 – – – – 6,757
NET CARRYING AMOUNTJanuary 1, 2020 3,177 1,178 716 260 5,331 2,409 3,586 2,026 8,021 13,352
December 31, 2020 3,525 858 645 234 5,262 2,409 3,701 1,730 7,840 13,102

Not
es to
con
solid
ated
fi n
anci
al s
tate
men
ts
BCE InC. 2020 AnnuAl REpoRt | 149
FINITE-LIFE INDEFINITE-LIFE
FOR THE YEAR ENDED DECEMBER 31, 2019 NOTE SOFTWARE
CUSTOMER RELATION-
SHIPS
PROGRAM AND FEATURE
FILM RIGHTS OTHER TOTAL BRANDS
SPECTRUM AND OTHER
LICENCESBROADCAST
LICENCES TOTAL
TOTAL INTANGIBLE
ASSETS
COSTJanuary 1, 2019 9,525 2,014 704 500 12,743 2,409 3,587 2,111 8,107 20,850
Additions 388 – 1,004 4 1,396 – – – – 1,396
Acquired through business combinations – 6 – – 6 – – – – 6
Transfers 657 – – – 657 – – – – 657
Retirements and disposals (52) (3) – (14) (69) – – – – (69)
Impairment losses recognized in earnings 8 – – – (1) (1) – (1) (85) (86) (87)
Amortization included in operating costs – – (992) – (992) – – – – (992)
Discontinued operations 3 4 – – – 4 – – – – 4
December 31, 2019 10,522 2,017 716 489 13,744 2,409 3,586 2,026 8,021 21,765
ACCUMULATED AMORTIZATIONJanuary 1, 2019 6,720 727 – 198 7,645 – – – – 7,645
Amortization 743 98 – 45 886 – – – – 886
Retirements and disposals (51) – – (14) (65) – – – – (65)
Discontinued operations 3 2 14 – – 16 – – – – 16
Other (69) – – – (69) – – – – (69)
December 31, 2019 7,345 839 – 229 8,413 – – – – 8,413
NET CARRYING AMOUNTJanuary 1, 2019 2,805 1,287 704 302 5,098 2,409 3,587 2,111 8,107 13,205
December 31, 2019 3,177 1,178 716 260 5,331 2,409 3,586 2,026 8,021 13,352
Note 19 | Investments in associates and joint venturesThe following tables provide summarized financial information with respect to BCE’s associates and joint ventures. For more details on our associates and joint ventures, see Note 34, Related party transactions.
STATEMENTS OF FINANCIAL POSITIONFOR THE YEAR ENDED DECEMBER 31 2020 2019
Assets 3,953 4,045
Liabilities (2,448) (2,689)
Total net assets 1,505 1,356
BCE’s share of net assets 756 698
INCOME STATEMENTSFOR THE YEAR ENDED DECEMBER 31 NOTE 2020 2019
Revenues 1,359 2,398
Expenses (1,351) (2,545)
Total net income (losses) 8 (147)
BCE’s share of net income (losses) 9 5 (72)

Not
es to
con
solid
ated
fi n
anci
al s
tate
men
ts
150 | BCE InC. 2020 AnnuAl REpoRt
Note 20 | Other non-current assetsFOR THE YEAR ENDED DECEMBER 31 NOTE 2020 2019
Long-term wireless device financing plan receivables 12 399 65
Investments (1) 28 167 128
Publicly-traded and privately-held investments 28 126 129
Long-term receivables 128 83
Derivative assets 28 92 200
Other 89 111
Total other non-current assets 1,001 716
(1) These amounts have been pledged as security related to obligations for certain employee benefits and are not available for general use.
Note 21 | GoodwillThe following table provides details about the changes in the carrying amounts of goodwill for the years ended December 31, 2020 and 2019. BCE’s groups of CGUs correspond to our reporting segments.
NOTEBELL
WIRELESSBELL
WIRELINEBELL
MEDIA BCE
Balance at January 1, 2019 3,046 4,681 2,931 10,658
Acquisitions and other – (6) 15 9
Balance at December 31, 2019 3,046 4,675 2,946 10,667
Acquisitions and other – 52 – 52
Discontinued operations 3 – (115) – (115)
Balance at December 31, 2020 3,046 4,612 2,946 10,604
IMPAIRMENT TESTINGAs described in Note 2, Significant accounting policies, goodwill is tested annually for impairment or when there is an indication that goodwill may be impaired, by comparing the carrying value of a CGU or group of CGUs to the recoverable amount, where the recoverable amount is the higher of fair value less costs of disposal or value in use.
During the second quarter of 2020, we identified indicators that goodwill for our Bell Media group of CGUs may be impaired as a result of the economic impact of the COVID-19 pandemic, notably declines in advertising revenues, lower subscriber revenues and increases in discount rates. Impairment testing of goodwill during 2020 for the Bell Media group of CGUs did not result in an impairment of goodwill.
RECOVERABLE AMOUNTThe recoverable amount for each of the Bell Wireless and Bell Wireline groups of CGUs is its value in use. The recoverable amount for the Bell Media group of CGUs is its fair value less costs of disposal.
The recoverable amount for a CGU or group of CGUs is determined by discounting five-year cash flow projections derived from business plans reviewed by senior management. The projections reflect management’s expectations of revenue, segment profit, capital expenditures, working capital and operating cash flows, based on past experience and future expectations of operating performance. Revenue and cost projections for the Bell Media group of CGUs also reflect market participant assumptions.
Cash flows beyond the five-year period are extrapolated using perpetuity growth rates. None of the perpetuity growth rates exceed the long-term historical growth rates for the markets in which we operate.
The discount rates are applied to the cash flow projections and are derived from the weighted average cost of capital for each CGU or group of CGUs.
The following table shows the key assumptions used to estimate the recoverable amounts of the groups of CGUs.
ASSUMPTIONS USED
GROUPS OF CGUsPERPETUITY
GROWTH RATEDISCOUNT
RATE
Bell Wireless 0.8% 9.1%
Bell Wireline 1.0% 6.0%
Bell Media 0.5% 8.5%
The recoverable amounts determined in a prior year for the Bell Wireless and Bell Wireline groups of CGUs exceed their corresponding current carrying values by a substantial margin and have been carried forward and used in the impairment test for the current year. We believe that any reasonable possible change in the key assumptions on which the estimate of recoverable amounts of the Bell Wireless or Bell Wireline groups of CGUs is based would not cause their carrying amounts to exceed their recoverable amounts.
For the Bell Media group of CGUs, the recoverable amount determined in the second quarter of 2020 has been carried forward and used in the annual impairment test. A decrease of (0.6%) in the perpetuity growth rate or an increase of 0.4% in the discount rate would have resulted in its recoverable amount being equal to its carrying value.

Not
es to
con
solid
ated
fi n
anci
al s
tate
men
ts
BCE InC. 2020 AnnuAl REpoRt | 151
Note 22 | Trade payables and other liabilitiesFOR THE YEAR ENDED DECEMBER 31 NOTE 2020 2019
Trade payables and accruals 2,595 2,604
Compensation payable 592 589
Maple Leaf Sports and Entertainment Ltd. (MLSE) financial liability (1) 28 149 135
Derivative liabilities 28 69 49
Provisions 25 53 33
Commodity taxes payable 33 101
Severance and other costs payable 23 35
CRTC deferral account obligation 28 13 13
Other current liabilities 408 395
Total trade payables and other liabilities 3,935 3,954
(1) Represents BCE’s obligation to repurchase the BCE Master Trust Fund’s (Master Trust Fund) 9% interest in MLSE at a price not less than an agreed minimum price should the Master Trust Fund exercise its put option. The obligation to repurchase is marked to market each reporting period and the gain or loss is recorded in Other (expense) income in the income statements.
Note 23 | Debt due within one year
FOR THE YEAR ENDED DECEMBER 31 NOTE
WEIGHTED AVERAGE
INTEREST RATE AT DECEMBER 31, 2020 2020 2019
Notes payable (1) 28 0.24% 392 1,994
Loans secured by trade receivables 28 1.10% 1,050 1,050
Long-term debt due within one year (2) 24 5.52% 975 837
Total debt due within one year 2,417 3,881
(1) Includes commercial paper of $274 million in U.S. dollars ($349 million in Canadian dollars) and $1,502 million in U.S. dollars ($1,951 million in Canadian dollars) as at December 31, 2020 and December 31, 2019, respectively, which were issued under our U.S. commercial paper program and have been hedged for foreign currency fluctuations through forward currency contracts. See Note 28, Financial and capital management, for additional details.
(2) Included in long-term debt due within one year is the current portion of lease liabilities of $754 million and $775 million as at December 31, 2020 and December 31, 2019, respectively.
SECURITIZED TRADE RECEIVABLESOur securitized trade receivables programs are recorded as floating rate revolving loans secured by certain trade receivables and expire on December 31, 2021 and December 1, 2022.
The following table provides further details on our securitized trade receivables programs.
FOR THE YEAR ENDED DECEMBER 31 2020 2019
Average interest rate throughout the year 1.58% 2.79%
Securitized trade receivables 2,007 2,185
We continue to service these trade receivables. The buyers’ interest in the collection of these trade receivables ranks ahead of our interests, which means that we are exposed to certain risks of default on the amounts securitized.
We have provided various credit enhancements in the form of overcollateralization and subordination of our retained interests.
The buyers will reinvest the amounts collected by buying additional interests in our trade receivables until the securitized trade receivables agreements expire or are terminated. The buyers and their investors have no further claim on our other assets if customers do not pay the amounts owed.
CREDIT FACILITIESBell Canada may issue notes under its Canadian and U.S. commercial paper programs up to the maximum aggregate principal amount of $3 billion in either Canadian or U.S. currency provided that at no time shall such maximum amount of notes exceed $3.5 billion in Canadian
currency which equals the aggregate amount available under Bell Canada’s committed supporting revolving and expansion credit facilities as at December 31, 2020. The total amount of the net available committed revolving and expansion credit facilities may be drawn at any time.
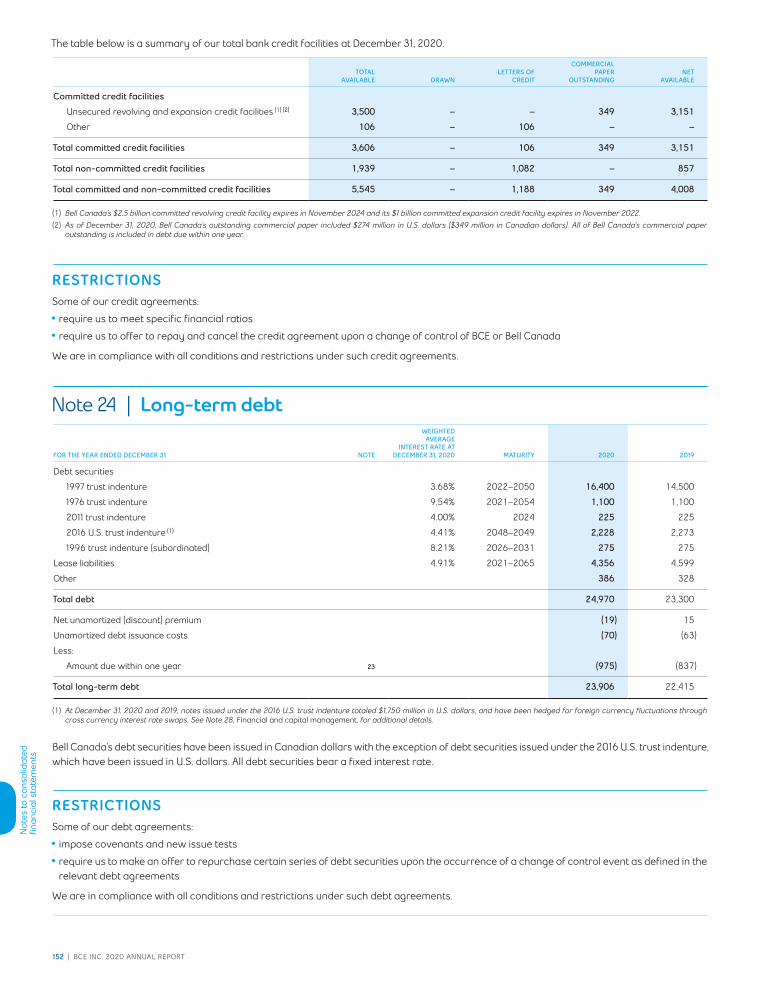
Not
es to
con
solid
ated
fi n
anci
al s
tate
men
ts
152 | BCE InC. 2020 AnnuAl REpoRt
The table below is a summary of our total bank credit facilities at December 31, 2020.
TOTAL AVAILABLE DRAWN
LETTERS OF CREDIT
COMMERCIAL PAPER
OUTSTANDINGNET
AVAILABLE
Committed credit facilities
Unsecured revolving and expansion credit facilities (1) (2) 3,500 – – 349 3,151
Other 106 – 106 – –
Total committed credit facilities 3,606 – 106 349 3,151
Total non-committed credit facilities 1,939 – 1,082 – 857
Total committed and non-committed credit facilities 5,545 – 1,188 349 4,008
(1) Bell Canada’s $2.5 billion committed revolving credit facility expires in November 2024 and its $1 billion committed expansion credit facility expires in November 2022.(2) As of December 31, 2020, Bell Canada’s outstanding commercial paper included $274 million in U.S. dollars ($349 million in Canadian dollars). All of Bell Canada’s commercial paper
outstanding is included in debt due within one year.
RESTRICTIONSSome of our credit agreements:
• require us to meet specific financial ratios
• require us to offer to repay and cancel the credit agreement upon a change of control of BCE or Bell Canada
We are in compliance with all conditions and restrictions under such credit agreements.
Note 24 | Long-term debt
FOR THE YEAR ENDED DECEMBER 31 NOTE
WEIGHTED AVERAGE
INTEREST RATE AT DECEMBER 31, 2020 MATURITY 2020 2019
Debt securities
1997 trust indenture 3.68% 2022–2050 16,400 14,500
1976 trust indenture 9.54% 2021–2054 1,100 1,100
2011 trust indenture 4.00% 2024 225 225
2016 U.S. trust indenture (1) 4.41% 2048–2049 2,228 2,273
1996 trust indenture (subordinated) 8.21% 2026–2031 275 275
Lease liabilities 4.91% 2021–2065 4,356 4,599
Other 386 328
Total debt 24,970 23,300
Net unamortized (discount) premium (19) 15
Unamortized debt issuance costs (70) (63)
Less:
Amount due within one year 23 (975) (837)
Total long-term debt 23,906 22,415
(1) At December 31, 2020 and 2019, notes issued under the 2016 U.S. trust indenture totaled $1,750 million in U.S. dollars, and have been hedged for foreign currency fluctuations through cross currency interest rate swaps. See Note 28, Financial and capital management, for additional details.
Bell Canada’s debt securities have been issued in Canadian dollars with the exception of debt securities issued under the 2016 U.S. trust indenture, which have been issued in U.S. dollars. All debt securities bear a fixed interest rate.
RESTRICTIONSSome of our debt agreements:
• impose covenants and new issue tests
• require us to make an offer to repurchase certain series of debt securities upon the occurrence of a change of control event as defined in the relevant debt agreements
We are in compliance with all conditions and restrictions under such debt agreements.

Not
es to
con
solid
ated
fi n
anci
al s
tate
men
ts
BCE InC. 2020 AnnuAl REpoRt | 153
All outstanding debt securities have been issued under trust indentures and are unsecured. All debt securities have been issued in series and certain series are redeemable at Bell Canada’s option prior to maturity at the prices, times and conditions specified for each series.
2020On November 6, 2020, Bell Canada redeemed, prior to maturity, its 2.00% Series M-42 medium term note (MTN) debentures, having an outstanding principal amount of $850 million, which were due on October 1, 2021.
On September 14, 2020, Bell Canada redeemed, prior to maturity, its 3.15% Series M-30 MTN debentures, having an outstanding principal amount of $750 million, which were due on September 29, 2021.
On August 14, 2020, Bell Canada issued 1.65% Series M-53 MTN debentures under its 1997 trust indenture, with a principal amount of $750 million, which mature on August 16, 2027.
On May 14, 2020, Bell Canada issued 2.50% Series M-52 MTN debentures under its 1997 trust indenture, with a principal amount of $1 billion, which mature on May 14, 2030.
On May 14, 2020 and February 13, 2020, Bell Canada issued 3.50% Series M-51 MTN debentures under its 1997 trust indenture, with a principal amount of $500 million and $750 million, respectively, which mature on September 30, 2050.
On March 25, 2020, Bell Canada issued 3.35% Series M-47 MTN debentures under its 1997 trust indenture, with a principal amount of $1 billion, which mature on March 12, 2025.
On March 16, 2020, Bell Canada redeemed, prior to maturity, its 4.95% Series M-24 MTN debentures, having an outstanding principal amount of $500 million, which were due on May 19, 2021.
During the first half of 2020, Bell Canada drew $1,450 million in U.S. dollars ($2,035 million in Canadian dollars) under its committed credit facilities. In Q2 2020, Bell Canada repaid all of the U.S. dollar borrowings under such facilities. The borrowings, which were included in long-term debt, were hedged for foreign currency fluctuations through foreign exchange forward contracts. Accordingly, in Q2 2020, the forward contracts used to hedge these borrowings were settled. See Note 28, Financial and capital management, for additional details.
For the year ended December 31, 2020, we incurred early debt redemption charges of $50 million, which were recorded in Other (expense) income in the income statements.
2019On September 10, 2019, Bell Canada issued 2.90% Series M-50 MTN debentures under its 1997 trust indenture, with a principal amount of $550 million, which mature on September 10, 2029.
On June 13, 2019, Bell Canada redeemed, prior to maturity, its 3.25% Series M-27 MTN debentures, having an outstanding principal amount of $1 billion, which were due on June 17, 2020.
On May 24, 2019, Bell Canada redeemed, prior to maturity, its 3.54% Series M-37 debentures, having an outstanding principal amount of $400 million, which were due on June 12, 2020.
On May 13, 2019, Bell Canada issued 2.75% Series M-49 MTN debentures under its 1997 trust indenture, with a principal amount of $600 million, which mature on January 29, 2025. In addition, on the same date, Bell Canada issued 4.30% Series US-2 Notes under its 2016 trust indenture, with a principal amount of $600 million in U.S. dollars ($808 million in Canadian dollars), which mature on July 29, 2049.
For the year ended December 31, 2019, we incurred early debt redemption charges of $18 million, which were recorded in Other (expense) income in the income statements.
Note 25 | ProvisionsFOR THE YEAR ENDED DECEMBER 31 NOTE AROs OTHER (1) TOTAL
January 1, 2020 199 132 331
Additions 21 95 116
Usage (8) (20) (28)
Reversals (1) (1) (2)
Discontinued operations 3 (9) – (9)
December 31, 2020 202 206 408
Current 22 15 38 53
Non-current 27 187 168 355
December 31, 2020 202 206 408
(1) Other includes environmental, legal, vacant space and other provisions.
AROs reflect management’s best estimates of expected future costs to restore current leased premises to their original condition prior to lease inception. Cash outflows associated with our ARO liabilities are generally expected to occur at the restoration dates of the assets to which they relate, which are long-term in nature. The timing and extent of restoration work that will be ultimately required for these sites is uncertain.

Not
es to
con
solid
ated
fi n
anci
al s
tate
men
ts
154 | BCE InC. 2020 AnnuAl REpoRt
Note 26 | Post-employment benefit plansPOST-EMPLOYMENT BENEFIT PLANS COSTWe provide pension and other benefits for most of our employees. These include DB pension plans, DC pension plans and OPEBs.
We operate our DB and DC pension plans under applicable Canadian and provincial pension legislation, which prescribes minimum and maximum DB funding requirements. Plan assets are held in trust, and the oversight of governance of the plans, including investment decisions, contributions to DB plans and the selection of the DC plans investment options offered to plan participants, lies with the Risk and Pension Fund Committee, a committee of our board of directors.
The interest rate risk is managed using a liability matching approach, which reduces the exposure of the DB plans to a mismatch between investment growth and obligation growth.
The longevity risk is managed using a longevity swap, which reduces the exposure of the DB plans to an increase in life expectancy.
COMPONENTS OF POST-EMPLOYMENT BENEFIT PLANS SERVICE COST
FOR THE YEAR ENDED DECEMBER 31 2020 2019
DB pension (219) (193)
DC pension (113) (109)
OPEBs (2) (3)
Less:
Capitalized benefit plans cost 65 59
Total post-employment benefit plans service cost (269) (246)
COMPONENTS OF POST-EMPLOYMENT BENEFIT PLANS FINANCING COST
FOR THE YEAR ENDED DECEMBER 31 2020 2019
DB pension (10) (19)
OPEBs (36) (44)
Total interest on post-employment benefit obligations (46) (63)
The statements of comprehensive income include the following amounts before income taxes.
2020 2019
Cumulative losses recognized directly in equity, January 1 (2,701) (2,892)
Actuarial gains in other comprehensive income from continuing operations (1) 732 191
Increase in the effect of the asset limit in other comprehensive income from continuing operations (2) (45) –
Cumulative losses recognized directly in equity, December 31 (2,014) (2,701)
(1) The cumulative actuarial losses recognized in the statements of comprehensive income are $2,215 million in 2020.
(2) The cumulative decrease in the effect of the asset limit recognized in the statements of comprehensive income is $201 million in 2020.
COMPONENTS OF POST-EMPLOYMENT BENEFIT (OBLIGATIONS) ASSETSThe following table shows the change in post-employment benefit obligations and the fair value of plan assets.
DB PENSION PLANS OPEB PLANS TOTAL
2020 2019 2020 2019 2020 2019
Post-employment benefit obligations, January 1 (25,650) (23,404) (1,529) (1,469) (27,179) (24,873)
Current service cost (219) (193) (2) (3) (221) (196)
Interest on obligations (782) (872) (46) (55) (828) (927)
Actuarial losses (1) (1,830) (2,498) (90) (80) (1,920) (2,578)
Benefit payments 1,342 1,326 67 77 1,409 1,403
Employee contributions (10) (10) – – (10) (10)
Other – 1 – 1 – 2
Post-employment benefit obligations, December 31 (27,149) (25,650) (1,600) (1,529) (28,749) (27,179)
Fair value of plan assets, January 1 25,530 23,071 320 287 25,850 23,358
Expected return on plan assets (2) 772 853 10 11 782 864
Actuarial gains (1) 2,632 2,742 20 27 2,652 2,769
Benefit payments (1,342) (1,326) (67) (77) (1,409) (1,403)
Employer contributions 183 180 61 72 244 252
Employee contributions 10 10 – – 10 10
Fair value of plan assets, December 31 27,785 25,530 344 320 28,129 25,850
Plan asset (deficit) 636 (120) (1,256) (1,209) (620) (1,329)
Effect of asset limit (65) (20) – – (65) (20)
Post-employment benefit asset (liability), December 31 571 (140) (1,256) (1,209) (685) (1,349)
Post-employment benefit assets 1,277 558 – – 1,277 558
Post-employment benefit obligations (706) (698) (1,256) (1,209) (1,962) (1,907)
(1) Actuarial gains (losses) include experience gains of $2,613 million in 2020 and $2,525 million in 2019.(2) The actual return on plan assets was $3,434 million or 13.7% in 2020 and $3,633 million or 16.0% in 2019.

Not
es to
con
solid
ated
fi n
anci
al s
tate
men
ts
BCE InC. 2020 AnnuAl REpoRt | 155
FUNDED STATUS OF POST-EMPLOYMENT BENEFIT PLANS COSTThe following table shows the funded status of our post-employment benefit obligations.
FUNDED PARTIALLY FUNDED (1) UNFUNDED (2) TOTAL
FOR THE YEAR ENDED DECEMBER 31 2020 2019 2020 2019 2020 2019 2020 2019
Present value of post-employment benefit obligations (26,421) (24,961) (2,011) (1,918) (317) (300) (28,749) (27,179)
Fair value of plan assets 27,727 25,474 402 376 – – 28,129 25,850
Plan surplus (deficit) 1,306 513 (1,609) (1,542) (317) (300) (620) (1,329)
(1) The partially funded plans consist of supplementary executive retirement plans (SERPs) for eligible employees and certain OPEBs. The company partially funds the SERPs through letters of credit and a retirement compensation arrangement account with Canada Revenue Agency. Certain paid-up life insurance benefits are funded through life insurance contracts.
(2) Our unfunded plans consist of certain OPEBs, which are paid as claims are incurred.
SIGNIFICANT ASSUMPTIONSWe used the following key assumptions to measure the post-employment benefit obligations and the net benefit plans cost for the DB pension plans and OPEB plans. These assumptions are long-term, which is consistent with the nature of post-employment benefit plans.
DB PENSION PLANS AND OPEB PLANS
FOR THE YEAR ENDED DECEMBER 31 2020 2019
Post-employment benefit obligations
Discount rate 2.6% 3.1%
Rate of compensation increase 2.25% 2.25%
Cost of living indexation rate (1) 1.6% 1.6%
Life expectancy at age 65 (years) 23.2 23.2
(1) Cost of living indexation rate is only applicable to DB pension plans.
DB PENSION PLANS AND OPEB PLANS
FOR THE YEAR ENDED DECEMBER 31 2020 2019
Net post-employment benefit plans cost
Discount rate 3.2% 4.0%
Rate of compensation increase 2.25% 2.25%
Cost of living indexation rate (1) 1.6% 1.6%
Life expectancy at age 65 (years) 23.2 23.1
(1) Cost of living indexation rate is only applicable to DB pension plans.
The weighted average duration of the post-employment benefit obligation is 15 years.
We assumed the following trend rates in healthcare costs:
• an annual increase in the cost of medication of 6.5% for 2020 decreasing to 4.0% over 20 years
• an annual increase in the cost of covered dental benefits of 4%
• an annual increase in the cost of covered hospital benefits of 3.7%
• an annual increase in the cost of other covered healthcare benefits of 4%
Assumed trend rates in healthcare costs have a significant effect on the amounts reported for the healthcare plans.
The following table shows the effect of a 1% change in the assumed trend rates in healthcare costs.
EFFECT ON POST-EMPLOYMENT BENEFITS – INCREASE/(DECREASE) 1% INCREASE 1% DECREASE
Total service and interest cost 3 (3)
Post-employment benefit obligations 110 (95)
SENSITIVITY ANALYSIS
The following table shows a sensitivity analysis of key assumptions used to measure the net post-employment benefit obligations and the net post-employment benefit plans cost for our DB pension plans and OPEB plans.
IMPACT ON NET POST-EMPLOYMENT BENEFIT PLANS COST FOR 2020 –
INCREASE/(DECREASE)
IMPACT ON POST-EMPLOYMENT BENEFIT OBLIGATIONS AT DECEMBER 31, 2020 –
INCREASE/(DECREASE)
CHANGE IN ASSUMPTION
INCREASE IN ASSUMPTION
DECREASE IN ASSUMPTION
INCREASE IN ASSUMPTION
DECREASE IN ASSUMPTION
Discount rate 0.5% (76) 64 (1,897) 2,127
Life expectancy at age 65 1 year 38 (38) 1,092 (1,092)
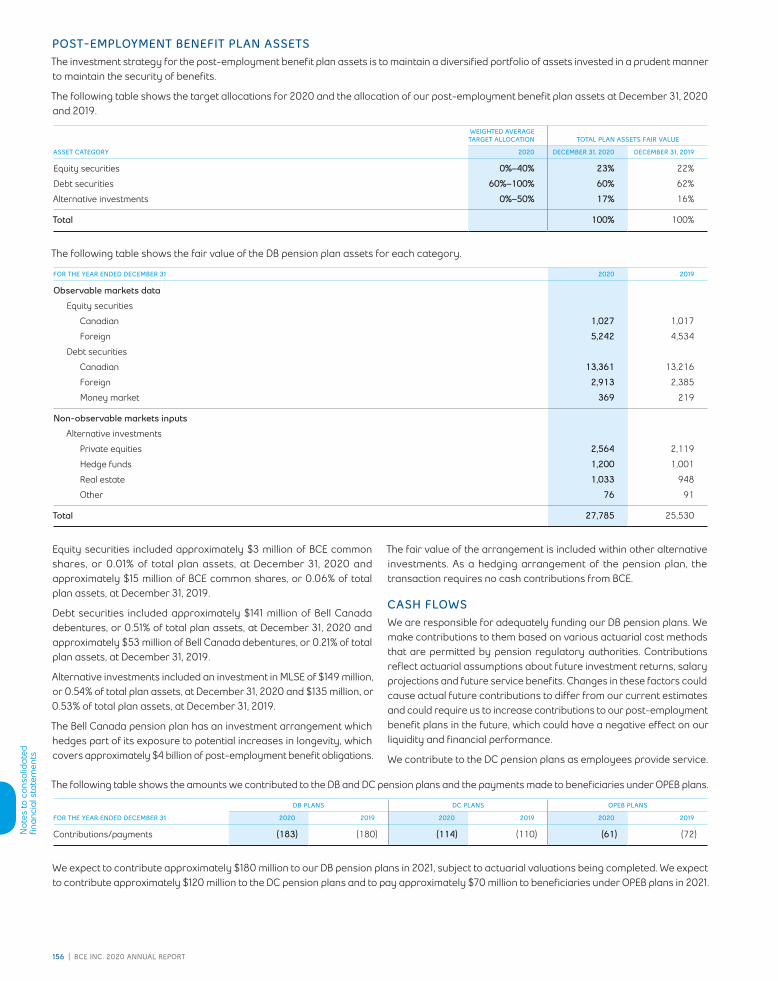
Not
es to
con
solid
ated
fi n
anci
al s
tate
men
ts
156 | BCE InC. 2020 AnnuAl REpoRt
POST-EMPLOYMENT BENEFIT PLAN ASSETSThe investment strategy for the post-employment benefit plan assets is to maintain a diversified portfolio of assets invested in a prudent manner to maintain the security of benefits.
The following table shows the target allocations for 2020 and the allocation of our post-employment benefit plan assets at December 31, 2020 and 2019.
WEIGHTED AVERAGE TARGET ALLOCATION TOTAL PLAN ASSETS FAIR VALUE
ASSET CATEGORY 2020 DECEMBER 31, 2020 DECEMBER 31, 2019
Equity securities 0%–40% 23% 22%
Debt securities 60%–100% 60% 62%
Alternative investments 0%–50% 17% 16%
Total 100% 100%
The following table shows the fair value of the DB pension plan assets for each category.
FOR THE YEAR ENDED DECEMBER 31 2020 2019
Observable markets data
Equity securities
Canadian 1,027 1,017
Foreign 5,242 4,534
Debt securities
Canadian 13,361 13,216
Foreign 2,913 2,385
Money market 369 219
Non-observable markets inputs
Alternative investments
Private equities 2,564 2,119
Hedge funds 1,200 1,001
Real estate 1,033 948
Other 76 91
Total 27,785 25,530
Equity securities included approximately $3 million of BCE common shares, or 0.01% of total plan assets, at December 31, 2020 and approximately $15 million of BCE common shares, or 0.06% of total plan assets, at December 31, 2019.
Debt securities included approximately $141 million of Bell Canada debentures, or 0.51% of total plan assets, at December 31, 2020 and approximately $53 million of Bell Canada debentures, or 0.21% of total plan assets, at December 31, 2019.
Alternative investments included an investment in MLSE of $149 million, or 0.54% of total plan assets, at December 31, 2020 and $135 million, or 0.53% of total plan assets, at December 31, 2019.
The Bell Canada pension plan has an investment arrangement which hedges part of its exposure to potential increases in longevity, which covers approximately $4 billion of post-employment benefit obligations.
The fair value of the arrangement is included within other alternative investments. As a hedging arrangement of the pension plan, the transaction requires no cash contributions from BCE.
CASH FLOWSWe are responsible for adequately funding our DB pension plans. We make contributions to them based on various actuarial cost methods that are permitted by pension regulatory authorities. Contributions reflect actuarial assumptions about future investment returns, salary projections and future service benefits. Changes in these factors could cause actual future contributions to differ from our current estimates and could require us to increase contributions to our post-employment benefit plans in the future, which could have a negative effect on our liquidity and financial performance.
We contribute to the DC pension plans as employees provide service.
The following table shows the amounts we contributed to the DB and DC pension plans and the payments made to beneficiaries under OPEB plans.
DB PLANS DC PLANS OPEB PLANS
FOR THE YEAR ENDED DECEMBER 31 2020 2019 2020 2019 2020 2019
Contributions/payments (183) (180) (114) (110) (61) (72)
We expect to contribute approximately $180 million to our DB pension plans in 2021, subject to actuarial valuations being completed. We expect to contribute approximately $120 million to the DC pension plans and to pay approximately $70 million to beneficiaries under OPEB plans in 2021.

Not
es to
con
solid
ated
fi n
anci
al s
tate
men
ts
BCE InC. 2020 AnnuAl REpoRt | 157
Note 27 | Other non-current liabilitiesFOR THE YEAR ENDED DECEMBER 31 NOTE 2020 2019
Long-term disability benefits obligation 361 305
Provisions 25 355 298
Derivative liabilities 28 98 7
CRTC deferral account obligation 28 69 69
Other 262 192
Total other non-current liabilities 1,145 871
Note 28 | Financial and capital managementFINANCIAL MANAGEMENTManagement’s objectives are to protect BCE and its subsidiaries on a consolidated basis against material economic exposures and variability of results from various financial risks, including credit risk, liquidity risk, foreign currency risk, interest rate risk, commodity price risk and equity price risk.
DERIVATIVESWe use derivative instruments to manage our exposure to foreign currency risk, interest rate risk, commodity price risk and changes in the price of BCE common shares.
The following derivative instruments were outstanding during 2020 and/or 2019:
• foreign currency forward contracts and options that manage the foreign currency risk of certain anticipated purchases and sales and U.S. commercial paper
• foreign currency forward contracts and cross currency interest rate swaps that hedge foreign currency risk on a portion of our debt due within one year and long-term debt
• forward contracts on BCE common shares that mitigate the cash flow exposure and equity price risk related to common shares issued under our share-based payment plans
• interest rate swaps and options that hedge future dividend rate resets on preferred shares
• fuel swaps that mitigate the purchase cost of fuel
FAIR VALUEFair value is the price that would be received to sell an asset or paid to transfer a liability in an orderly transaction between market participants at the measurement date.
Certain fair value estimates are affected by assumptions we make about the amount and timing of future cash flows and discount rates, all of which reflect varying degrees of risk. Income taxes and other expenses that may be incurred on disposition of financial instruments are not reflected in the fair values. As a result, the fair values may not be the net amounts that would be realized if these instruments were settled.
The carrying values of our cash and cash equivalents, trade and other receivables, dividends payable, trade payables and accruals, compensation payable, severance and other costs payable, interest payable, notes payable and loans secured by trade receivables approximate fair value as they are short-term. The carrying value of wireless device financing plan receivables approximates fair value given that their average remaining duration is short and the carrying value is reduced by an allowance for doubtful accounts and an allowance for revenue adjustments.
The following table provides the fair value details of other financial instruments measured at amortized cost in the statements of financial position.
DECEMBER 31, 2020 DECEMBER 31, 2019
CLASSIFICATION FAIR VALUE METHODOLOGY NOTECARRYING
VALUEFAIR
VALUECARRYING
VALUEFAIR
VALUE
CRTC deferral account obligation
Trade payables and other liabilities and other non-current liabilities
Present value of estimated future cash flows discounted using observable market interest rates
22, 27 82 86 82 85
Debt securities and other debt
Debt due within one year and long-term debt
Quoted market price of debt 23, 24 20,525 24,366 18,653 20,905
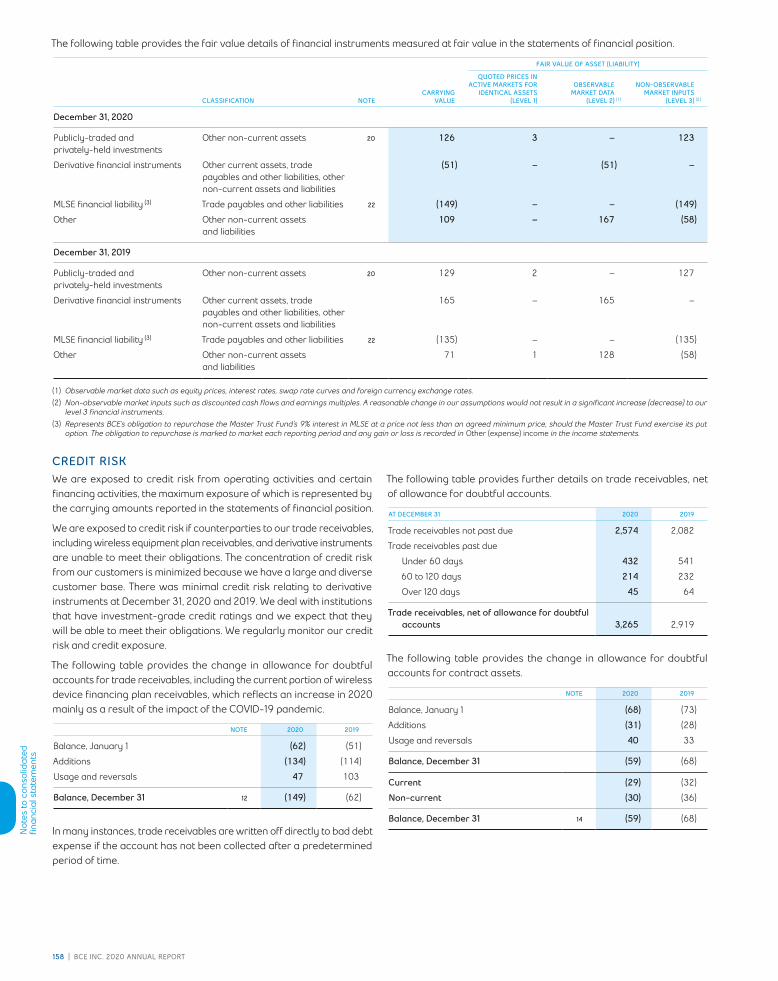
Not
es to
con
solid
ated
fi n
anci
al s
tate
men
ts
158 | BCE InC. 2020 AnnuAl REpoRt
The following table provides the fair value details of financial instruments measured at fair value in the statements of financial position.
FAIR VALUE OF ASSET (LIABILITY)
CLASSIFICATION NOTECARRYING
VALUE
QUOTED PRICES IN ACTIVE MARKETS FOR
IDENTICAL ASSETS (LEVEL 1)
OBSERVABLE MARKET DATA
(LEVEL 2) (1)
NON-OBSERVABLE MARKET INPUTS
(LEVEL 3) (2)
December 31, 2020
Publicly-traded and privately-held investments
Other non-current assets 20 126 3 – 123
Derivative financial instruments Other current assets, trade payables and other liabilities, other non-current assets and liabilities
(51) – (51) –
MLSE financial liability (3) Trade payables and other liabilities 22 (149) – – (149)
Other Other non-current assets and liabilities
109 – 167 (58)
December 31, 2019
Publicly-traded and privately-held investments
Other non-current assets 20 129 2 – 127
Derivative financial instruments Other current assets, trade payables and other liabilities, other non-current assets and liabilities
165 – 165 –
MLSE financial liability (3) Trade payables and other liabilities 22 (135) – – (135)
Other Other non-current assets and liabilities
71 1 128 (58)
(1) Observable market data such as equity prices, interest rates, swap rate curves and foreign currency exchange rates.(2) Non-observable market inputs such as discounted cash flows and earnings multiples. A reasonable change in our assumptions would not result in a significant increase (decrease) to our
level 3 financial instruments.(3) Represents BCE’s obligation to repurchase the Master Trust Fund’s 9% interest in MLSE at a price not less than an agreed minimum price, should the Master Trust Fund exercise its put
option. The obligation to repurchase is marked to market each reporting period and any gain or loss is recorded in Other (expense) income in the income statements.
CREDIT RISKWe are exposed to credit risk from operating activities and certain financing activities, the maximum exposure of which is represented by the carrying amounts reported in the statements of financial position.
We are exposed to credit risk if counterparties to our trade receivables, including wireless equipment plan receivables, and derivative instruments are unable to meet their obligations. The concentration of credit risk from our customers is minimized because we have a large and diverse customer base. There was minimal credit risk relating to derivative instruments at December 31, 2020 and 2019. We deal with institutions that have investment-grade credit ratings and we expect that they will be able to meet their obligations. We regularly monitor our credit risk and credit exposure.
The following table provides the change in allowance for doubtful accounts for trade receivables, including the current portion of wireless device financing plan receivables, which reflects an increase in 2020 mainly as a result of the impact of the COVID-19 pandemic.
NOTE 2020 2019
Balance, January 1 (62) (51)
Additions (134) (114)
Usage and reversals 47 103
Balance, December 31 12 (149) (62)
In many instances, trade receivables are written off directly to bad debt expense if the account has not been collected after a predetermined period of time.
The following table provides further details on trade receivables, net of allowance for doubtful accounts.
AT DECEMBER 31 2020 2019
Trade receivables not past due 2,574 2,082
Trade receivables past due
Under 60 days 432 541
60 to 120 days 214 232
Over 120 days 45 64
Trade receivables, net of allowance for doubtful accounts 3,265 2,919
The following table provides the change in allowance for doubtful accounts for contract assets.
NOTE 2020 2019
Balance, January 1 (68) (73)
Additions (31) (28)
Usage and reversals 40 33
Balance, December 31 (59) (68)
Current (29) (32)
Non-current (30) (36)
Balance, December 31 14 (59) (68)

Not
es to
con
solid
ated
fi n
anci
al s
tate
men
ts
BCE InC. 2020 AnnuAl REpoRt | 159
LIQUIDITY RISKOur cash and cash equivalents, cash flows from operations and possible capital markets financing are expected to be sufficient to fund our operations and fulfill our obligations as they become due. Should our cash requirements exceed the above sources of cash, we would expect to cover such a shortfall by drawing on existing committed bank facilities and new ones, to the extent available.
The following table is a maturity analysis for recognized financial liabilities at December 31, 2020 for each of the next five years and thereafter.
AT DECEMBER 31, 2020 NOTE 2021 2022 2023 2024 2025THERE- AFTER TOTAL
Long-term debt 24 221 1,785 1,665 1,278 2,125 13,540 20,614
Notes payable 23 392 – – – – – 392
Lease liabilities (1) 921 832 611 459 406 2,077 5,306
Loan secured by trade receivables 23 1,050 – – – – – 1,050
Interest payable on long-term debt, notes payable and loan secured by trade receivables 844 824 756 693 641 7,623 11,381
Net (receipts) payments on cross currency basis swaps (1) (1) – – – 64 62
MLSE financial liability 22 149 – – – – – 149
Total 3,576 3,440 3,032 2,430 3,172 23,304 38,954
(1) Includes imputed interest of $950 million.
We are also exposed to liquidity risk for financial liabilities due within one year as shown in the statements of financial position.
MARKET RISK
CURRENCY EXPOSURES
We use forward contracts, options and cross currency interest rate swaps to manage foreign currency risk related to anticipated purchases and sales and certain foreign currency debt.
In the first half of 2020, we entered into foreign currency forward contracts with a notional amount of $1,453 million in U.S. dollars ($2,039 million in Canadian dollars) to hedge the foreign currency risk associated with amounts drawn under our committed credit facilities. These foreign currency forward contracts matured in Q2 2020 and a loss of $14 million relating to these foreign currency forward contracts was recognized in Other (expense) income in the consolidated income statements, which offsets the foreign currency gain on the repayment of drawdowns under the credit facilities.
At December 31, 2020, we had outstanding cross currency interest rate swaps with a notional amount of $1,750 million in U.S. dollars ($2,301 million in Canadian dollars), to hedge the U.S. currency exposure of our Series US-1 and Series US-2 Notes maturing in 2048 and 2049, respectively. See Note 24, Long-term debt, for additional details.
A 10% depreciation (appreciation) in the value of the Canadian dollar relative to the U.S. dollar would result in a gain (loss) of $7 million ($19 million) recognized in net earnings from continuing operations at December 31, 2020 and a gain (loss) of $245 million ($215 million) recognized in Other comprehensive income from continuing operations at December 31, 2020, with all other variables held constant.
A 10% depreciation (appreciation) in the value of the Canadian dollar relative to the Philippine peso would result in a gain (loss) of $4 million recognized in Other comprehensive income from continuing operations at December 31, 2020, with all other variables held constant.
The following table provides further details on our outstanding foreign currency forward contracts and options as at December 31, 2020.
TYPE OF HEDGEBUY
CURRENCYAMOUNT
TO RECEIVESELL
CURRENCYAMOUNT
TO PAY MATURITY HEDGED ITEM
Cash flow USD 675 CAD 885 2021 Anticipated transactions
Cash flow USD 274 CAD 349 2021 Commercial paper
Cash flow PHP 2,174 CAD 59 2021 Anticipated transactions
Cash flow USD 479 CAD 614 2022 Anticipated transactions
Cash flow – call options USD 231 CAD 299 2022 Anticipated transactions
Cash flow – put options USD 231 CAD 295 2022 Anticipated transactions
Economic USD 130 CAD 180 2021 Anticipated transactions
Economic – call options USD 12 CAD 17 2021 Anticipated transactions
Economic – call options CAD 17 USD 12 2021 Anticipated transactions
Economic – put options USD 120 CAD 154 2021 Anticipated transactions
Economic – put options USD 99 CAD 123 2022 Anticipated transactions
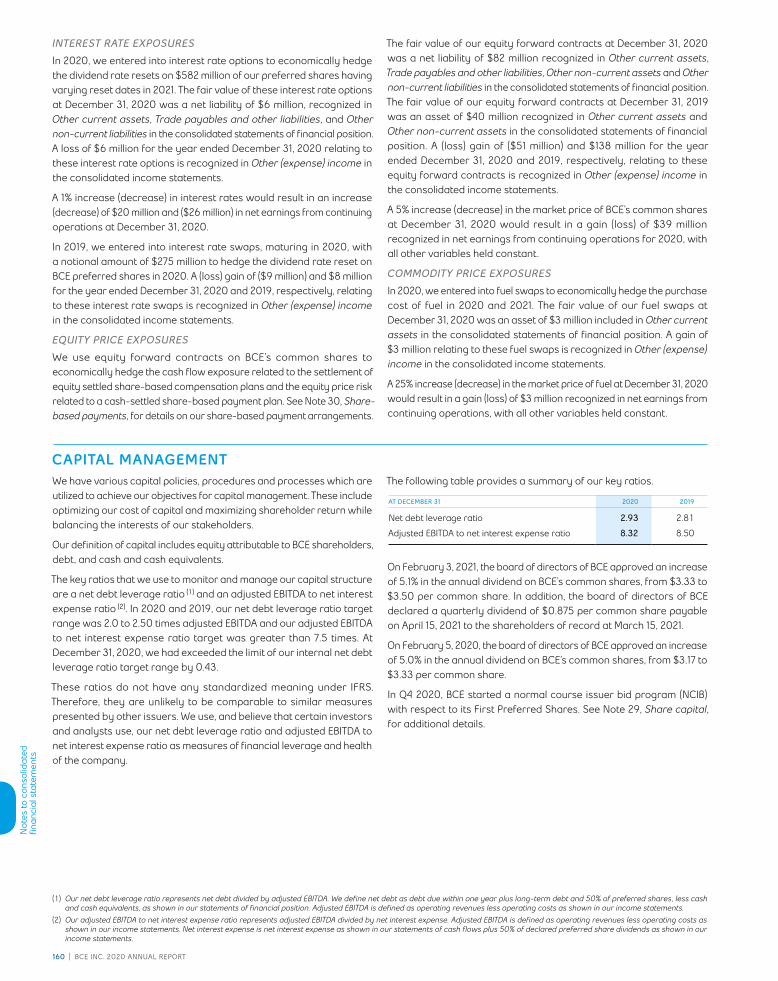
Not
es to
con
solid
ated
fi n
anci
al s
tate
men
ts
160 | BCE InC. 2020 AnnuAl REpoRt
INTEREST RATE EXPOSURES
In 2020, we entered into interest rate options to economically hedge the dividend rate resets on $582 million of our preferred shares having varying reset dates in 2021. The fair value of these interest rate options at December 31, 2020 was a net liability of $6 million, recognized in Other current assets, Trade payables and other liabilities, and Other non-current liabilities in the consolidated statements of financial position. A loss of $6 million for the year ended December 31, 2020 relating to these interest rate options is recognized in Other (expense) income in the consolidated income statements.
A 1% increase (decrease) in interest rates would result in an increase (decrease) of $20 million and ($26 million) in net earnings from continuing operations at December 31, 2020.
In 2019, we entered into interest rate swaps, maturing in 2020, with a notional amount of $275 million to hedge the dividend rate reset on BCE preferred shares in 2020. A (loss) gain of ($9 million) and $8 million for the year ended December 31, 2020 and 2019, respectively, relating to these interest rate swaps is recognized in Other (expense) income in the consolidated income statements.
EQUITY PRICE EXPOSURES
We use equity forward contracts on BCE’s common shares to economically hedge the cash flow exposure related to the settlement of equity settled share-based compensation plans and the equity price risk related to a cash-settled share-based payment plan. See Note 30, Share-based payments, for details on our share-based payment arrangements.
The fair value of our equity forward contracts at December 31, 2020 was a net liability of $82 million recognized in Other current assets, Trade payables and other liabilities, Other non-current assets and Other non-current liabilities in the consolidated statements of financial position. The fair value of our equity forward contracts at December 31, 2019 was an asset of $40 million recognized in Other current assets and Other non-current assets in the consolidated statements of financial position. A (loss) gain of ($51 million) and $138 million for the year ended December 31, 2020 and 2019, respectively, relating to these equity forward contracts is recognized in Other (expense) income in the consolidated income statements.
A 5% increase (decrease) in the market price of BCE’s common shares at December 31, 2020 would result in a gain (loss) of $39 million recognized in net earnings from continuing operations for 2020, with all other variables held constant.
COMMODITY PRICE EXPOSURES
In 2020, we entered into fuel swaps to economically hedge the purchase cost of fuel in 2020 and 2021. The fair value of our fuel swaps at December 31, 2020 was an asset of $3 million included in Other current assets in the consolidated statements of financial position. A gain of $3 million relating to these fuel swaps is recognized in Other (expense) income in the consolidated income statements.
A 25% increase (decrease) in the market price of fuel at December 31, 2020 would result in a gain (loss) of $3 million recognized in net earnings from continuing operations, with all other variables held constant.
CAPITAL MANAGEMENTWe have various capital policies, procedures and processes which are utilized to achieve our objectives for capital management. These include optimizing our cost of capital and maximizing shareholder return while balancing the interests of our stakeholders.
Our definition of capital includes equity attributable to BCE shareholders, debt, and cash and cash equivalents.
The key ratios that we use to monitor and manage our capital structure are a net debt leverage ratio (1) and an adjusted EBITDA to net interest expense ratio (2). In 2020 and 2019, our net debt leverage ratio target range was 2.0 to 2.50 times adjusted EBITDA and our adjusted EBITDA to net interest expense ratio target was greater than 7.5 times. At December 31, 2020, we had exceeded the limit of our internal net debt leverage ratio target range by 0.43.
These ratios do not have any standardized meaning under IFRS. Therefore, they are unlikely to be comparable to similar measures presented by other issuers. We use, and believe that certain investors and analysts use, our net debt leverage ratio and adjusted EBITDA to net interest expense ratio as measures of financial leverage and health of the company.
The following table provides a summary of our key ratios.
AT DECEMBER 31 2020 2019
Net debt leverage ratio 2.93 2.81
Adjusted EBITDA to net interest expense ratio 8.32 8.50
On February 3, 2021, the board of directors of BCE approved an increase of 5.1% in the annual dividend on BCE’s common shares, from $3.33 to $3.50 per common share. In addition, the board of directors of BCE declared a quarterly dividend of $0.875 per common share payable on April 15, 2021 to the shareholders of record at March 15, 2021.
On February 5, 2020, the board of directors of BCE approved an increase of 5.0% in the annual dividend on BCE’s common shares, from $3.17 to $3.33 per common share.
In Q4 2020, BCE started a normal course issuer bid program (NCIB) with respect to its First Preferred Shares. See Note 29, Share capital, for additional details.
(1) Our net debt leverage ratio represents net debt divided by adjusted EBITDA. We define net debt as debt due within one year plus long-term debt and 50% of preferred shares, less cash and cash equivalents, as shown in our statements of financial position. Adjusted EBITDA is defined as operating revenues less operating costs as shown in our income statements.
(2) Our adjusted EBITDA to net interest expense ratio represents adjusted EBITDA divided by net interest expense. Adjusted EBITDA is defined as operating revenues less operating costs as shown in our income statements. Net interest expense is net interest expense as shown in our statements of cash flows plus 50% of declared preferred share dividends as shown in our income statements.

Not
es to
con
solid
ated
fi n
anci
al s
tate
men
ts
BCE InC. 2020 AnnuAl REpoRt | 161
Note 29 | Share capitalPREFERRED SHARESBCE’s articles of amalgamation, as amended, provide for an unlimited number of First Preferred Shares and Second Preferred Shares, all without par value. The terms set out in the articles authorize BCE’s directors to issue the shares in one or more series and to set the number of shares and the conditions for each series.
The following table provides a summary of the principal terms of BCE’s First Preferred Shares as at December 31, 2020. There were no Second Preferred Shares issued and outstanding at December 31, 2020. BCE’s articles of amalgamation, as amended, describe the terms and conditions of these shares in detail.
SERIES
ANNUAL DIVIDEND
RATECONVERTIBLE
INTO CONVERSION DATE REDEMPTION DATEREDEMPTION
PRICE
NUMBER OF SHARES STATED CAPITAL
AUTHORIZEDISSUED AND
OUTSTANDINGDECEMBER 31,
2020DECEMBER 31,
2019
Q floating Series R December 1, 2030 $25.50 8,000,000 – – –
R (1) 3.018% Series Q December 1, 2025 December 1, 2025 $25.00 8,000,000 7,998,900 200 200
S floating Series T November 1, 2021 At any time $25.50 8,000,000 3,511,848 88 88
T (1) 3.019% Series S November 1, 2021 November 1, 2021 $25.00 8,000,000 4,486,552 112 112
Y floating Series Z December 1, 2022 At any time $25.50 10,000,000 8,079,291 202 202
Z (1) 3.904% Series Y December 1, 2022 December 1, 2022 $25.00 10,000,000 1,918,509 48 48
AA (1) 3.61% Series AB September 1, 2022 September 1, 2022 $25.00 20,000,000 11,397,196 291 291
AB floating Series AA September 1, 2022 At any time $25.50 20,000,000 8,599,204 219 219
AC (1) 4.38% Series AD March 1, 2023 March 1, 2023 $25.00 20,000,000 10,027,991 256 256
AD floating Series AC March 1, 2023 At any time $25.50 20,000,000 9,963,209 254 254
AE floating Series AF February 1, 2025 At any time $25.50 24,000,000 6,512,913 163 232
AF (1) 3.865% Series AE February 1, 2025 February 1, 2025 $25.00 24,000,000 9,481,487 237 168
AG (1) 2.80% Series AH May 1, 2021 May 1, 2021 $25.00 22,000,000 4,984,851 125 125
AH floating Series AG May 1, 2021 At any time $25.50 22,000,000 9,012,249 225 225
AI (1) 2.75% Series AJ August 1, 2021 August 1, 2021 $25.00 22,000,000 5,949,884 149 149
AJ floating Series AI August 1, 2021 At any time $25.50 22,000,000 8,050,116 201 201
AK (1) 2.954% Series AL December 31, 2021 December 31, 2021 $25.00 25,000,000 22,735,621 568 569
AL (2) floating Series AK December 31, 2021 At any time 25,000,000 2,254,079 56 56
AM (1) 2.764% Series AN March 31, 2021 March 31, 2021 $25.00 30,000,000 9,542,615 218 218
AN (2) floating Series AM March 31, 2021 At any time 30,000,000 1,952,085 45 45
AO (1) 4.26% Series AP March 31, 2022 March 31, 2022 $25.00 30,000,000 4,600,000 118 118
AP (3) floating Series AO March 31, 2027 30,000,000 – – –
AQ (1) 4.812% Series AR September 30, 2023 September 30, 2023 $25.00 30,000,000 9,200,000 228 228
AR (3) floating Series AQ September 30, 2028 30,000,000 – – –
4,003 4,004
(1) BCE may redeem each of these series of First Preferred Shares on the applicable redemption date and every five years after that date.(2) BCE may redeem Series AL and AN First Preferred Shares at $25.00 per share on December 31, 2021 and March 31, 2021, respectively, and every five years thereafter (each, a Series
conversion date). Alternatively, BCE may redeem Series AL or AN First Preferred Shares at $25.50 per share on any date which is not a Series conversion date for the applicable series of First Preferred Shares.
(3) If Series AP or AR First Preferred Shares are issued on March 31, 2022 and September 30, 2023, respectively, BCE may redeem such shares at $25.00 per share on March 31, 2027 and September 30, 2028, respectively, and every five years thereafter (each, a Series conversion date). Alternatively, BCE may redeem Series AP or AR First Preferred Shares at $25.50 per share on any date which is not a Series conversion date for the applicable series of First Preferred Shares.

Not
es to
con
solid
ated
fi n
anci
al s
tate
men
ts
162 | BCE InC. 2020 AnnuAl REpoRt
NORMAL COURSE ISSUER BID FOR BCE FIRST PREFERRED SHARESOn November 4, 2020, BCE’s Board of Directors authorized the company to commence a normal course issuer bid (NCIB) to purchase for cancellation up to 10% of the public float of each series of BCE’s outstanding First Preferred Shares that are listed on the Toronto Stock Exchange. In 2020, BCE repurchased and canceled 41,400 First Preferred Shares for a total cost of $1 million. The NCIB will extend up to November 8, 2021, or an earlier date should BCE complete its purchases under the NCIB.
VOTING RIGHTSAll of the issued and outstanding First Preferred Shares at December 31, 2020 are non-voting, except under special circumstances when the holders are entitled to one vote per share.
PRIORITY AND ENTITLEMENT TO DIVIDENDSThe First Preferred Shares of all series rank at parity with each other and in priority to all other shares of BCE with respect to payment of dividends and with respect to distribution of assets in the event of liquidation, dissolution or winding up of BCE.
Holders of Series R, T, Z, AA, AC, AF, AG, AI, AK, AM, AO and AQ First Preferred Shares are entitled to fixed cumulative quarterly dividends. The dividend rate on these shares is reset every five years, as set out in BCE’s articles of amalgamation, as amended.
Holders of Series S, Y, AB, AD, AE, AH and AJ First Preferred Shares are entitled to floating adjustable cumulative monthly dividends. The floating dividend rate on these shares is calculated every month, as set out in BCE’s articles of amalgamation, as amended.
Holders of Series AL and AN First Preferred Shares are entitled to floating cumulative quarterly dividends. The floating dividend rate on these shares is calculated every quarter, as set out in BCE’s articles of amalgamation, as amended.
Dividends on all series of First Preferred Shares are paid as and when declared by the board of directors of BCE.
CONVERSION FEATURESAll of the issued and outstanding First Preferred Shares at December 31, 2020 are convertible at the holder’s option into another associated series of First Preferred Shares on a one-for-one basis according to the terms set out in BCE’s articles of amalgamation, as amended.
COMMON SHARES AND CLASS B SHARESBCE’s articles of amalgamation provide for an unlimited number of voting common shares and non-voting Class B shares, all without par value. The common shares and the Class B shares rank equally in the payment of dividends and in the distribution of assets if BCE is liquidated, dissolved or wound up, after payments due to the holders of preferred shares. No Class B shares were outstanding at December 31, 2020 and 2019.
The following table provides details about the outstanding common shares of BCE.
2020 2019
NOTENUMBER OF
SHARESSTATED
CAPITALNUMBER OF
SHARESSTATED
CAPITAL
Outstanding, January 1 903,908,182 20,363 898,200,415 20,036
Shares issued under employee stock option plan 30 506,828 27 4,459,559 251
Shares issued under ESP – – 1,231,479 75
Shares issued under DSP – – 16,729 1
Outstanding, December 31 904,415,010 20,390 903,908,182 20,363
CONTRIBUTED SURPLUSContributed surplus in 2020 and 2019 includes premiums in excess of par value upon the issuance of BCE common shares and share-based compensation expense net of settlements.
Note 30 | Share-based paymentsThe following share-based payment amounts are included in the income statements as operating costs.
FOR THE YEAR ENDED DECEMBER 31 2020 2019
ESP (31) (29)
RSUs/PSUs (51) (54)
Other (1) (9) (10)
Total share-based payments (91) (93)
(1) Includes DSP, DSUs and stock options.

Not
es to
con
solid
ated
fi n
anci
al s
tate
men
ts
BCE InC. 2020 AnnuAl REpoRt | 163
DESCRIPTION OF THE PLANSESPThe ESP is designed to encourage employees of BCE and its participating subsidiaries to own shares of BCE. Each year, employees can choose to have up to 12% of their eligible annual earnings withheld through regular payroll deductions for the purchase of BCE common shares. In some cases, the employer also will contribute up to 2% of the employee’s eligible annual earnings to the plan. Dividends are credited to the participant’s account on each dividend payment date and are equivalent in value to the dividends paid on BCE common shares.
Employer contributions to the ESP and related dividends are subject to employees holding their shares for a two-year vesting period.
The trustee of the ESP buys BCE common shares for the participants on the open market, by private purchase or from treasury. BCE determines the method the trustee uses to buy the shares.
At December 31, 2020, 4,360,087 common shares were authorized for issuance from treasury under the ESP.
The following table summarizes the status of unvested employer contributions at December 31, 2020 and 2019.
NUMBER OF ESP SHARES 2020 2019
Unvested contributions, January 1 1,124,198 1,120,426
Contributions (1) 648,812 623,705
Dividends credited 62,171 57,083
Vested (581,119) (523,359)
Forfeited (107,082) (153,657)
Unvested contributions, December 31 1,146,980 1,124,198
(1) The weighted average fair value of the shares contributed was $57 in 2020 and $60 in 2019.
RSUs/PSUsRSUs/PSUs are granted to executives and other eligible employees. The value of an RSU/PSU at the grant date is equal to the value of one BCE common share. Dividends in the form of additional RSUs/PSUs are credited to the participant’s account on each dividend payment date and are equivalent in value to the dividend paid on BCE common shares.
Executives and other eligible employees are granted a specific number of RSUs/PSUs for a given performance period based on their position and level of contribution. RSUs/PSUs vest fully after three years of continuous employment from the date of grant and, in certain cases, if performance objectives are met, as determined by the board of directors.
The following table summarizes outstanding RSUs/PSUs at December 31, 2020 and 2019.
NUMBER OF RSUs/PSUs 2020 2019
Outstanding, January 1 2,915,118 2,812,697
Granted (1) 866,127 975,348
Dividends credited 165,435 149,648
Settled (935,117) (932,133)
Forfeited (38,170) (90,442)
Outstanding, December 31 2,973,393 2,915,118
Vested, December 31 (2) 1,065,454 904,266
(1) The weighted average fair value of the RSUs/PSUs granted was $63 in 2020 and $58 in 2019.(2) The RSUs/PSUs vested on December 31, 2020 were fully settled in February 2021 with BCE common shares and/or DSUs.
DSPThe value of a deferred share is equal to the value of one BCE common share. Dividends in the form of additional deferred shares are credited to the participant’s account on each dividend payment date and are equivalent in value to the dividend paid on BCE common shares. The liability related to the DSP is recorded in Trade payables and other liabilities in the statements of financial position and was $19 million and $22 million at December 31, 2020 and 2019, respectively.
DSUsEligible bonuses and RSUs/PSUs may be paid in the form of DSUs when executives or other eligible employees elect to or are required to participate in the plan. The value of a DSU at the issuance date is equal to the value of one BCE common share. For non-management directors, compensation is paid in DSUs until the minimum share ownership requirement is met; thereafter, at least 50% of their compensation is paid in DSUs. There are no vesting requirements relating to DSUs. Dividends in the form of additional DSUs are credited to the participant’s account on each dividend payment date and are equivalent in value to the dividends paid on BCE common shares. DSUs are settled when the holder leaves the company.
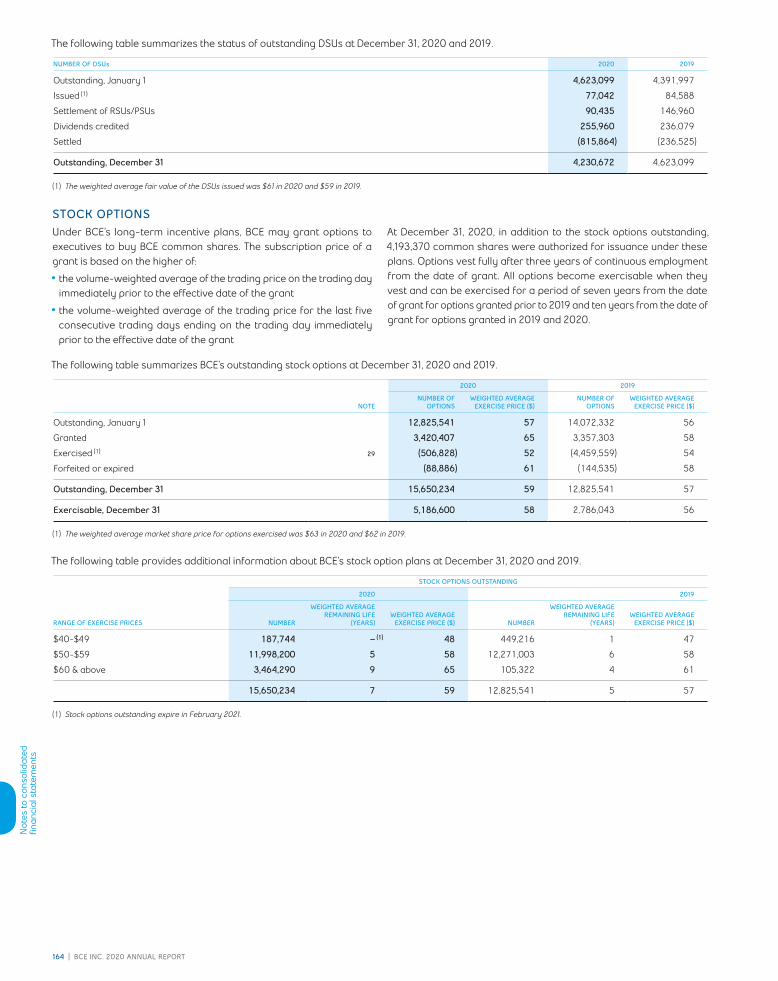
Not
es to
con
solid
ated
fi n
anci
al s
tate
men
ts
164 | BCE InC. 2020 AnnuAl REpoRt
The following table summarizes the status of outstanding DSUs at December 31, 2020 and 2019.
NUMBER OF DSUs 2020 2019
Outstanding, January 1 4,623,099 4,391,997
Issued (1) 77,042 84,588
Settlement of RSUs/PSUs 90,435 146,960
Dividends credited 255,960 236,079
Settled (815,864) (236,525)
Outstanding, December 31 4,230,672 4,623,099
(1) The weighted average fair value of the DSUs issued was $61 in 2020 and $59 in 2019.
STOCK OPTIONSUnder BCE’s long-term incentive plans, BCE may grant options to executives to buy BCE common shares. The subscription price of a grant is based on the higher of:
• the volume-weighted average of the trading price on the trading day immediately prior to the effective date of the grant
• the volume-weighted average of the trading price for the last five consecutive trading days ending on the trading day immediately prior to the effective date of the grant
At December 31, 2020, in addition to the stock options outstanding, 4,193,370 common shares were authorized for issuance under these plans. Options vest fully after three years of continuous employment from the date of grant. All options become exercisable when they vest and can be exercised for a period of seven years from the date of grant for options granted prior to 2019 and ten years from the date of grant for options granted in 2019 and 2020.
The following table summarizes BCE’s outstanding stock options at December 31, 2020 and 2019.
2020 2019
NOTENUMBER OF
OPTIONSWEIGHTED AVERAGE
EXERCISE PRICE ($)NUMBER OF
OPTIONSWEIGHTED AVERAGE
EXERCISE PRICE ($)
Outstanding, January 1 12,825,541 57 14,072,332 56
Granted 3,420,407 65 3,357,303 58
Exercised (1) 29 (506,828) 52 (4,459,559) 54
Forfeited or expired (88,886) 61 (144,535) 58
Outstanding, December 31 15,650,234 59 12,825,541 57
Exercisable, December 31 5,186,600 58 2,786,043 56
(1) The weighted average market share price for options exercised was $63 in 2020 and $62 in 2019.
The following table provides additional information about BCE’s stock option plans at December 31, 2020 and 2019.
STOCK OPTIONS OUTSTANDING
2020 2019
RANGE OF EXERCISE PRICES NUMBER
WEIGHTED AVERAGE REMAINING LIFE
(YEARS)WEIGHTED AVERAGE
EXERCISE PRICE ($) NUMBER
WEIGHTED AVERAGE REMAINING LIFE
(YEARS)WEIGHTED AVERAGE
EXERCISE PRICE ($)
$40-$49 187,744 – (1) 48 449,216 1 47
$50-$59 11,998,200 5 58 12,271,003 6 58
$60 & above 3,464,290 9 65 105,322 4 61
15,650,234 7 59 12,825,541 5 57
(1) Stock options outstanding expire in February 2021.
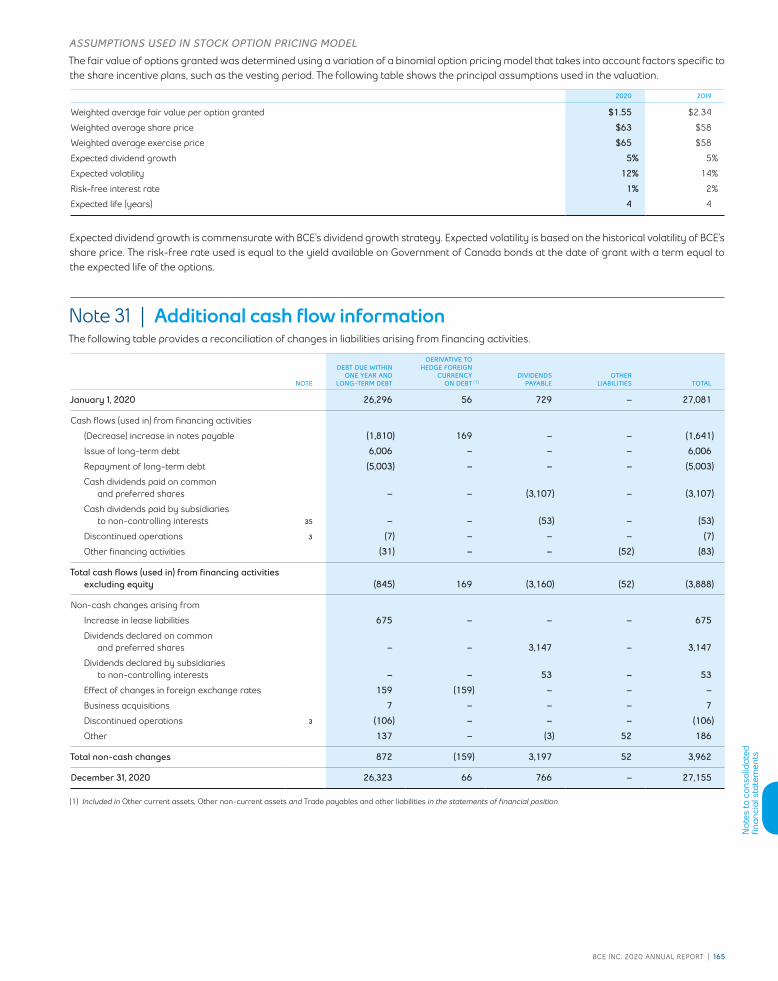
Not
es to
con
solid
ated
fi n
anci
al s
tate
men
ts
BCE InC. 2020 AnnuAl REpoRt | 165
ASSUMPTIONS USED IN STOCK OPTION PRICING MODEL
The fair value of options granted was determined using a variation of a binomial option pricing model that takes into account factors specific to the share incentive plans, such as the vesting period. The following table shows the principal assumptions used in the valuation.
2020 2019
Weighted average fair value per option granted $1.55 $2.34
Weighted average share price $63 $58
Weighted average exercise price $65 $58
Expected dividend growth 5% 5%
Expected volatility 12% 14%
Risk-free interest rate 1% 2%
Expected life (years) 4 4
Expected dividend growth is commensurate with BCE’s dividend growth strategy. Expected volatility is based on the historical volatility of BCE’s share price. The risk-free rate used is equal to the yield available on Government of Canada bonds at the date of grant with a term equal to the expected life of the options.
Note 31 | Additional cash flow informationThe following table provides a reconciliation of changes in liabilities arising from financing activities.
NOTE
DEBT DUE WITHIN ONE YEAR AND
LONG-TERM DEBT
DERIVATIVE TO HEDGE FOREIGN
CURRENCY ON DEBT (1)
DIVIDENDS PAYABLE
OTHER LIABILITIES TOTAL
January 1, 2020 26,296 56 729 – 27,081
Cash flows (used in) from financing activities
(Decrease) increase in notes payable (1,810) 169 – – (1,641)
Issue of long-term debt 6,006 – – – 6,006
Repayment of long-term debt (5,003) – – – (5,003)
Cash dividends paid on common and preferred shares – – (3,107) – (3,107)
Cash dividends paid by subsidiaries to non-controlling interests 35 – – (53) – (53)
Discontinued operations 3 (7) – – – (7)
Other financing activities (31) – – (52) (83)
Total cash flows (used in) from financing activities excluding equity (845) 169 (3,160) (52) (3,888)
Non-cash changes arising from
Increase in lease liabilities 675 – – – 675
Dividends declared on common and preferred shares – – 3,147 – 3,147
Dividends declared by subsidiaries to non-controlling interests – – 53 – 53
Effect of changes in foreign exchange rates 159 (159) – – –
Business acquisitions 7 – – – 7
Discontinued operations 3 (106) – – – (106)
Other 137 – (3) 52 186
Total non-cash changes 872 (159) 3,197 52 3,962
December 31, 2020 26,323 66 766 – 27,155
(1) Included in Other current assets, Other non-current assets and Trade payables and other liabilities in the statements of financial position.
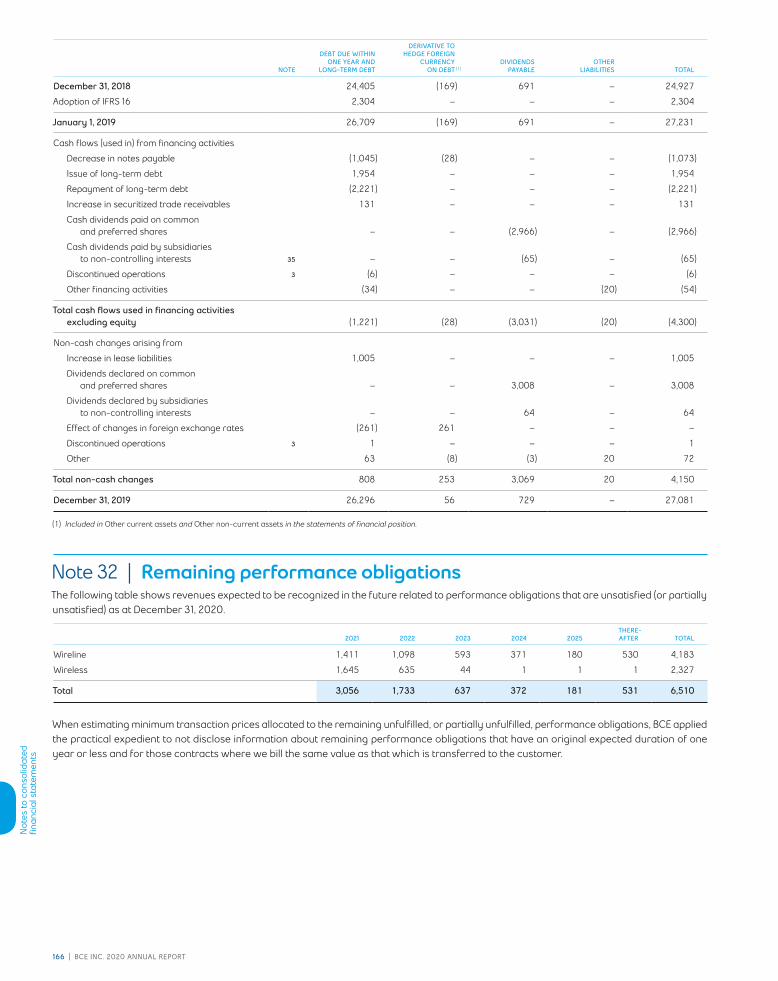
Not
es to
con
solid
ated
fi n
anci
al s
tate
men
ts
166 | BCE InC. 2020 AnnuAl REpoRt
NOTE
DEBT DUE WITHIN ONE YEAR AND
LONG-TERM DEBT
DERIVATIVE TO HEDGE FOREIGN
CURRENCY ON DEBT (1)
DIVIDENDS PAYABLE
OTHER LIABILITIES TOTAL
December 31, 2018 24,405 (169) 691 – 24,927
Adoption of IFRS 16 2,304 – – – 2,304
January 1, 2019 26,709 (169) 691 – 27,231
Cash flows (used in) from financing activities
Decrease in notes payable (1,045) (28) – – (1,073)
Issue of long-term debt 1,954 – – – 1,954
Repayment of long-term debt (2,221) – – – (2,221)
Increase in securitized trade receivables 131 – – – 131
Cash dividends paid on common and preferred shares – – (2,966) – (2,966)
Cash dividends paid by subsidiaries to non-controlling interests 35 – – (65) – (65)
Discontinued operations 3 (6) – – – (6)
Other financing activities (34) – – (20) (54)
Total cash flows used in financing activities excluding equity (1,221) (28) (3,031) (20) (4,300)
Non-cash changes arising from
Increase in lease liabilities 1,005 – – – 1,005
Dividends declared on common and preferred shares – – 3,008 – 3,008
Dividends declared by subsidiaries to non-controlling interests – – 64 – 64
Effect of changes in foreign exchange rates (261) 261 – – –
Discontinued operations 3 1 – – – 1
Other 63 (8) (3) 20 72
Total non-cash changes 808 253 3,069 20 4,150
December 31, 2019 26,296 56 729 – 27,081
(1) Included in Other current assets and Other non-current assets in the statements of financial position.
Note 32 | Remaining performance obligationsThe following table shows revenues expected to be recognized in the future related to performance obligations that are unsatisfied (or partially unsatisfied) as at December 31, 2020.
2021 2022 2023 2024 2025THERE-AFTER TOTAL
Wireline 1,411 1,098 593 371 180 530 4,183
Wireless 1,645 635 44 1 1 1 2,327
Total 3,056 1,733 637 372 181 531 6,510
When estimating minimum transaction prices allocated to the remaining unfulfilled, or partially unfulfilled, performance obligations, BCE applied the practical expedient to not disclose information about remaining performance obligations that have an original expected duration of one year or less and for those contracts where we bill the same value as that which is transferred to the customer.

Not
es to
con
solid
ated
fi n
anci
al s
tate
men
ts
BCE InC. 2020 AnnuAl REpoRt | 167
Note 33 | Commitments and contingenciesCOMMITMENTSThe following table is a summary of our contractual obligations at December 31, 2020 that are due in each of the next five years and thereafter.
2021 2022 2023 2024 2025THERE- AFTER TOTAL
Commitments for property, plant and equipment and intangible assets 975 835 608 416 250 352 3,436
Purchase obligations 545 479 331 225 144 269 1,993
Leases committed not yet commenced 2 2 1 1 – – 6
Total 1,522 1,316 940 642 394 621 5,435
Our commitments for property, plant and equipment and intangible assets include program and feature film rights and investments to expand and update our networks to meet customer demand.
Purchase obligations consist of contractual obligations under service and product contracts for operating expenditures and other purchase obligations.
Our commitments for leases not yet commenced include OOH advertising spaces and real estate. These leases are non-cancellable.
CONTINGENCIESAs part of its ongoing review of wholesale Internet rates, on October 6, 2016, the Canadian Radio-television and Telecommunications Commission (CRTC) significantly reduced, on an interim basis, some of the wholesale rates that Bell Canada and other major providers charge for access by third-party Internet resellers to fibre-to-the-node (FTTN) or cable networks, as applicable. On August 15, 2019, the CRTC further reduced the wholesale rates that Internet resellers pay to access network infrastructure built by facilities-based providers like Bell Canada, with retroactive effect back to March 2016 (the Decision). The estimated cost impact to Bell Canada of the Decision could be in excess of $100 million, if not overturned or otherwise modified.
Bell Canada and five major cable carriers (the Applicants) obtained leave to appeal the Decision from the Federal Court of Appeal and the Federal Court of Appeal granted a stay of the Decision until making a final ruling. As a result of the stay, the impact of the Decision was not recorded in our 2019 financial statements.
The Federal Court of Appeal issued a decision on September 10, 2020 in which it rejected the appeal and lifted the stay. The Applicants’ request for leave to appeal the decision of the Federal Court of Appeal to the Supreme Court of Canada was denied on February 25, 2021.
The Applicants and TELUS Communications Inc. (Telus) also filed review and vary applications of the Decision with the CRTC. On September 28, 2020, the CRTC issued a stay of the Decision pending its final decision on the review and vary applications.
The Applicants and Telus also appealed the Decision to the Federal Cabinet. On August 19, 2020, the Federal Cabinet issued an Order in Council which did not overturn the Decision, noting that a further decision from the CRTC regarding the review and vary applications is pending.
As a result of the stay issued by the CRTC, the impact of the Decision continues to not be recorded in our 2020 financial statements.
In the ordinary course of business, we become involved in various claims and legal proceedings seeking monetary damages and other relief. In particular, because of the nature of our consumer-facing business, we are exposed to class actions pursuant to which substantial monetary damages may be claimed. Due to the inherent risks and uncertainties of the litigation process, we cannot predict the final outcome or timing of claims and legal proceedings. Subject to the foregoing, and based on information currently available and management’s assessment of the merits of the claims and legal proceedings pending at March 4, 2021, management believes that the ultimate resolution of these claims and legal proceedings is unlikely to have a material and negative effect on our financial statements. We believe that we have strong defences and we intend to vigorously defend our positions.

Not
es to
con
solid
ated
fi n
anci
al s
tate
men
ts
168 | BCE InC. 2020 AnnuAl REpoRt
Note 34 | Related party transactionsSUBSIDIARIESThe following table shows BCE’s significant subsidiaries at December 31, 2020. BCE has other subsidiaries which have not been included in the table as each represents less than 10% individually and less than 20% in aggregate of total consolidated revenues.
All of these significant subsidiaries are incorporated in Canada and provide services to each other in the normal course of operations. The value of these transactions is eliminated on consolidation.
OWNERSHIP PERCENTAGE
SUBSIDIARY 2020 2019
Bell Canada 100% 100%
Bell Mobility Inc. 100% 100%
Bell Media Inc. 100% 100%
TRANSACTIONS WITH JOINT ARRANGEMENTS AND ASSOCIATESDuring 2020 and 2019, BCE provided communication services and received programming content and other services in the normal course of business on an arm’s length basis to and from its joint arrangements and associates. Our joint arrangements and associates include MLSE, Glentel Inc. and Dome Productions Partnership. From time to time, BCE may be required to make capital contributions in its investments.
In 2020, BCE recognized revenues and incurred expenses with our joint arrangements and associates of $14 million (2019 – $17 million) and $133 million (2019 – $200 million), respectively.
BCE MASTER TRUST FUNDBimcor Inc. (Bimcor), a wholly-owned subsidiary of Bell Canada, is the administrator of the Master Trust Fund. Bimcor recognized management fees of $13 million from the Master Trust Fund for 2020 and $12 million for 2019. The details of BCE’s post-employment benefit plans are set out in Note 26, Post-employment benefit plans.
COMPENSATION OF KEY MANAGEMENT PERSONNEL AND BOARD OF DIRECTORSThe following table includes compensation of key management personnel and the board of directors for the years ended December 31, 2020 and 2019 included in our income statements. Key management personnel included the company’s Chief Executive Officer, Chief Operating Officer, Group Presidents and the Presidents who reported directly to them.
FOR THE YEAR ENDED DECEMBER 31 2020 2019
Wages, salaries, fees and related taxes and benefits (30) (24)
Post-employment benefit plans and OPEBs cost (3) (3)
Share-based compensation (26) (29)
Key management personnel and board of directors compensation expense (59) (56)

Not
es to
con
solid
ated
fi n
anci
al s
tate
men
ts
BCE InC. 2020 AnnuAl REpoRt | 169
Note 35 | Significant partly-owned subsidiaryThe following tables show summarized financial information for our subsidiary with significant non-controlling interest (NCI).
SUMMARIZED STATEMENTS OF FINANCIAL POSITIONCTV SPECIALTY (1) (2)
FOR THE YEAR ENDED DECEMBER 31 2020 2019
Current assets 357 314
Non-current assets 1,032 994
Total assets 1,389 1,308
Current liabilities 159 151
Non-current liabilities 227 192
Total liabilities 386 343
Total equity attributable to BCE shareholders 699 671
NCI 304 294
(1) At December 31, 2020 and 2019, the ownership interest held by NCI in CTV Specialty Television Inc. (CTV Specialty) was 29.9%. CTV Specialty was incorporated and operated in Canada as at such dates.
(2) CTV Specialty’s net assets at December 31, 2020 and 2019 include $6 million and $8 million, respectively, directly attributable to NCI.
SELECTED INCOME AND CASH FLOW INFORMATIONCTV SPECIALTY (1)
FOR THE YEAR ENDED DECEMBER 31 2020 2019
Operating revenues 754 878
Net earnings 202 193
Net earnings attributable to NCI 64 61
Total comprehensive income 200 181
Total comprehensive income attributable to NCI 63 58
Cash dividends paid to NCI 53 65
(1) CTV Specialty’s net earnings and total comprehensive income include $5 million directly attributable to NCI for 2020 and 2019.
Note 36 | COVID-19Starting in the latter part of the first quarter of 2020, our business has been negatively impacted by the emergency measures adopted to combat the spread of COVID-19 and the resulting adverse economic conditions. All of our segments have been adversely affected with a more pronounced impact on media advertising revenues, wireless product volumes and outbound roaming revenues. Depending on the severity and duration of the COVID-19 pandemic disruptions, including the number and intensity of resurgences in COVID-19 cases and the scope and duration of measures adopted in response thereto, our operations and financial results could continue to be significantly and negatively impacted in future periods. It is difficult at this time to estimate the magnitude of such future impacts.

Boar
d of
dire
ctor
s /
Exec
utiv
es
170 | BCE InC. 2020 AnnuAl REpoRt
Board of directorsAS oF MARCH 4, 2021
Gordon M. NixonONTARIO, CANADA
Corporate Director Chair of the Board,BCE Inc. and Bell CanadaDirector since November 2014
Barry K. AllenFLORIDA, UNITED STATES
Operating Partner,Providence Equity Partners LLCDirector since May 2009
Mirko BibicONTARIO, CANADA
President andChief Executive Officer, BCE Inc. and Bell CanadaDirector since January 2020
Robert E. BrownQUÉBEC, CANADA
Corporate DirectorDirector since May 2009
David F. Denison, FCPA, FCAONTARIO, CANADA
Corporate DirectorDirector since October 2012
Robert P. DexterNOVA SCOTIA, CANADA
Chair andChief Executive Officer, Maritime Travel Inc.Director since November 2014
Ian GreenbergQUÉBEC, CANADA
Corporate DirectorDirector since July 2013
Katherine LeeONTARIO, CANADA
Corporate DirectorDirector since August 2015
Monique F. Leroux, C.M., O.Q., FCPA, FCAQUÉBEC, CANADA
Corporate DirectorDirector since April 2016
Sheila A. MurrayONTARIO, CANADA
Corporate DirectorDirector since May 2020
Louis P. Pagnutti, FCPA, FCAONTARIO, CANADA
Corporate DirectorDirector since November 2020
Thomas E. RichardsFLORIDA, UNITED STATES
Corporate DirectorDirector since May 2020
Calin RovinescuQUÉBEC, CANADA
Corporate DirectorDirector since April 2016
Karen SheriffTORONTO, ONTARIO
Corporate DirectorDirector since April 2017
Robert C. SimmondsONTARIO, CANADA
Chair, Lenbrook CorporationDirector since May 2011
Paul R. Weiss, FCPA, FCAONTARIO, CANADA
Corporate DirectorDirector since May 2009
COMMITTEES OF THE BOARD
AUDIT COMMITTEE
L.P. Pagnutti (Chair), I. Greenberg, K. Lee, M.F. Leroux, T.E. Richards, P.R. Weiss
The audit committee assists the board in the oversight of:
• the integrity of BCE’s financial statements and related information
• BCE’s compliance with applicable legal and regulatory requirements
• the independence, qualifications and appointment of the external auditors
• the performance of both the external and internal auditors
• management’s responsibility for assessing and reporting on the effectiveness of internal controls
• BCE’s risks as it relates to financial reporting.
CORPORATE GOVERNANCE COMMITTEE
M.F. Leroux (Chair), B.K. Allen, R.E. Brown, D.F. Denison, K. Lee, R.C. Simmonds
The CGC assists the board to:
• develop and implement BCE’s corporate governance policies and guidelines
• identify individuals qualified to become members of the board
• determine the composition of the board and its committees
• determine the directors’ remuneration for board and committee service
• develop and oversee a process to assess the Chair of the board, the board, committees of the board, Chairs of committees and individual directors
• review and recommend for board approval BCE’s policies concerning business conduct, ethics, public disclosure of material information and other matters
• review BCE’s ESG strategy and disclosure.
MANAGEMENT RESOURCES AND COMPENSATION COMMITTEE
D.F. Denison (Chair), B.K. Allen, R.E. Brown, R.P. Dexter, I. Greenberg, S.A. Murray, T.E. Richards, C. Rovinescu
The MRCC assists the board in the oversight of:
• the compensation, nomination, evaluation and succession of officers and other management personnel
• BCE’s workplace policies and practices (including health and safety policies, policies ensuring a respectful workplace free from harassment and policies ensuring a diverse and inclusive workplace).
RISK AND PENSION FUND COMMITTEE
C. Rovinescu (Chair), R.P. Dexter, S.A. Murray, L.P. Pagnutti, K. Sheriff, R.C. Simmonds, P.R. Weiss
The RPFC assists the board in the oversight of:
• BCE’s enterprise risk governance framework and the policies, procedures and controls management uses to evaluate and manage key risks to which BCE is exposed
• BCE’s exposure to key risks, except for risks that remain the primary responsibility of another Committee of the Board
• the administration, funding and investment of BCE’s pension plans and funds
• the unitized pooled funds sponsored by BCE for the collective investment of the funds and the participant subsidiaries’ pension funds.
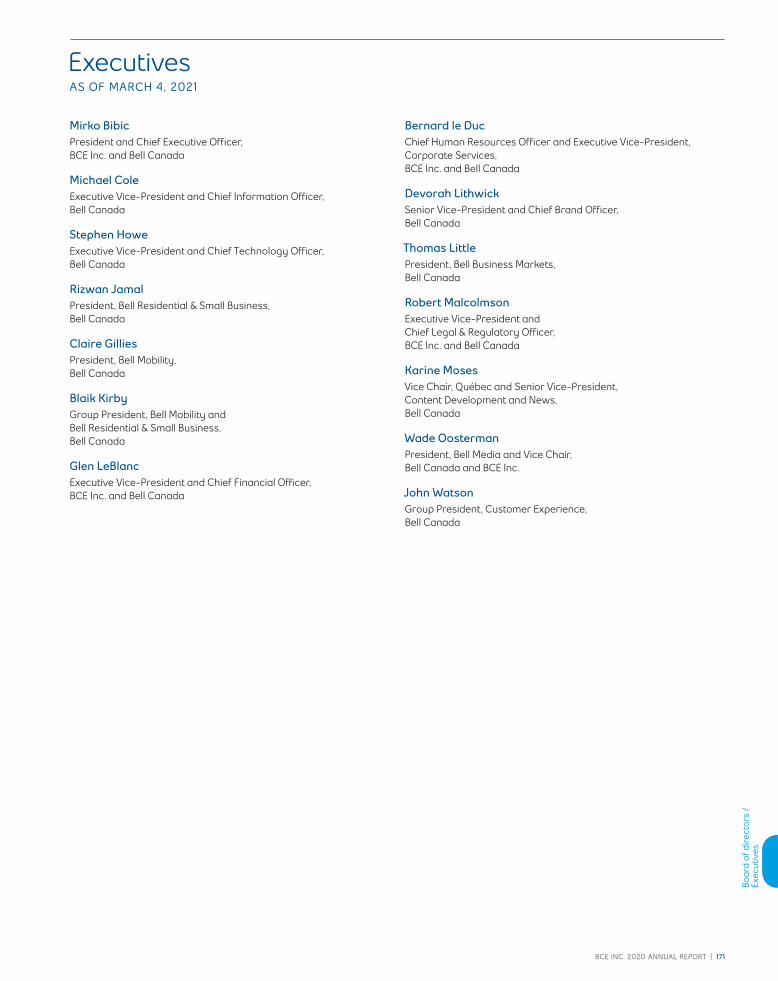
Boar
d of
dire
ctor
s /
Exec
utiv
es
BCE InC. 2020 AnnuAl REpoRt | 171
ExecutivesAS oF MARCH 4, 2021
Mirko BibicPresident and Chief Executive Officer, BCE Inc. and Bell Canada
Michael ColeExecutive Vice-President and Chief Information Officer, Bell Canada
Stephen HoweExecutive Vice-President and Chief Technology Officer, Bell Canada
Rizwan JamalPresident, Bell Residential & Small Business, Bell Canada
Claire Gillies President, Bell Mobility, Bell Canada
Blaik KirbyGroup President, Bell Mobility and Bell Residential & Small Business, Bell Canada
Glen LeBlancExecutive Vice-President and Chief Financial Officer, BCE Inc. and Bell Canada
Bernard le DucChief Human Resources Officer and Executive Vice-President, Corporate Services, BCE Inc. and Bell Canada
Devorah LithwickSenior Vice-President and Chief Brand Officer, Bell Canada
Thomas LittlePresident, Bell Business Markets, Bell Canada
Robert MalcolmsonExecutive Vice-President and Chief Legal & Regulatory Officer, BCE Inc. and Bell Canada
Karine MosesVice Chair, Québec and Senior Vice-President, Content Development and News, Bell Canada
Wade OostermanPresident, Bell Media and Vice Chair, Bell Canada and BCE Inc.
John WatsonGroup President, Customer Experience, Bell Canada

Inve
stor
in
form
atio
n
172 | BCE InC. 2020 AnnuAl REpoRt
Investor information
SHARE FACTS
SYMBOL
BCE
LISTINGSTSX and NYSE stock exchangesYou will find a summary of the differences between our governance practices and the NYSE corporate governance rules in the Governance section of our website at BCE.ca.
COMMON SHARES OUTSTANDINGDecember 31, 2020 – 904,415,010
QUARTERLY DIVIDEND*$0.875 per common share
2021 DIVIDEND SCHEDULE*Record date Payment date**
March 15, 2021 April 15, 2021
June 15, 2021 July 15, 2021
September 15, 2021 October 15, 2021
December 15, 2021 January 15, 2022
* Subject to dividends being declared by the board of directors** When a dividend payment date falls on a weekend, the payment is
made on the following business day
2021 QUARTERLY EARNINGS RELEASE DATES
First quarter April 29, 2021
Second quarter August 5, 2021
Third quarter November 4, 2021
Fourth quarter February 3, 2022
Quarterly and annual reports as well as other corporate documents can be found on our website. Copies can be requested from the Investor Relations group.
TAX ASPECTSShareholders are required to pay tax on dividends received as well as on capital gains they realize, if any, when they sell their shares or are deemed to have sold them.
THE SALE OR DISPOSITION OF YOUR SHARES COULD TRIGGER A CAPITAL GAINIMPORTANT: If you received Nortel Networks common shares in May 2000 and/or Bell Aliant Regional Communications Income Fund units in July 2006, you should contact the Investor Relations group to learn more about the tax implications of these plans of arrangement and the impact on the calculation of your cost, or visit BCE.ca.
DIVIDENDSSince January 1, 2006 and unless stated otherwise, dividends paid by BCE Inc. to Canadian residents are eligible dividends as per the Canadian Income Tax Act. Since March 24, 2006 and unless stated otherwise, dividends paid by BCE Inc. to Québec residents also qualify as eligible dividends.
NON-RESIDENTS OF CANADA
Dividends paid or credited to non-residents of Canada are subject to a 25% withholding tax unless reduced by a tax treaty. Under current tax treaties, U.S. and U.K. residents are subject to a 15% withholding tax.
Beginning in 2012, the Canada Revenue Agency introduced new rules requiring residents of any country with which Canada has a tax treaty to certify that they reside in that country and are eligible to have Canadian non-resident tax withheld on the payment of their dividends at the tax treaty rate. Registered shareholders should have completed the Declaration of Eligibility for Benefits under a Tax Treaty for a Non-Resident Taxpayer and returned it to the transfer agent.
U.S. RESIDENTS
In addition to the Declaration of Eligibility for Benefits under a Tax Treaty for a Non-Resident Taxpayer mentioned above, we are required to solicit taxpayer identification numbers and Internal Revenue Service (IRS) Form W-9 certifications of residency from certain U.S. residents. If these have not been received, we may be required to deduct the IRS’s specified backup withholding tax. For more information, please contact the transfer agent or the Investor Relations group.
NORMAL COURSE ISSUER BIDOn November 5, 2020, BCE received acceptance from the Toronto Stock Exchange (TSX) of its Notice of Intention to Make a Normal Course Issuer Bid (Notice of Intention). The filing of the Notice of Intention allows BCE to purchase for cancellation up to 10% of the public float of each series of BCE’s outstanding First Preferred Shares (Preferred Shares) that are listed on the TSX. The normal course issuer bid (NCIB) will extend from November 9, 2020 to November 8, 2021, or an earlier date should BCE complete its purchases under the NCIB. BCE is making this NCIB because it believes that, from time to time, its Preferred Shares may trade in price ranges that do not fully reflect their value. BCE believes that, in such circumstances, the repurchase of its Preferred Shares represents an appropriate use of funds. Purchases under the NCIB may be conducted through a combination of discretionary transactions and purchases under an automatic securities purchase plan through the facilities of the TSX or alternative trading systems, if eligible, and by such other means as may be permitted by the TSX and under applicable laws. You can obtain a copy of the Notice of Intention on request, without charge, from BCE’s Investor Relations group.

SHAREHOLDER SERVICES
DIVIDEND REINVESTMENT AND STOCK PURCHASE PLANA convenient method for eligible shareholders to reinvest their dividends and make optional cash contributions to purchase additional common shares without brokerage costs.
DIVIDEND DIRECT DEPOSIT SERVICEAvoid postal delays and trips to the bank by subscribing to the dividend direct deposit service.
DIRECT REGISTRATION (DRS)
HOLDING YOUR SHARES ELECTRONICALLY IN LIEU OF SHARE CERTIFICATES
Holdings are represented by a statement issued when establishing or subsequently modifying your DRS balance. This option removes the risks of holding share certificates, including their safekeeping, and, most importantly, eases the replacement process. Note that there is a cost to replace lost or stolen certificates as well as certificates mailed and never received by the shareholder (if claimed two years after mailing). Generally, this cost is a percentage of the value of the shares represented.
E-DELIVERY SERVICEEnrol in the e-delivery service to receive the proxy material, the annual report and/or quarterly reports by e-mail. By doing so, you will receive your documents faster and in an environmentally friendly manner while helping your company reduce its costs.
DUPLICATE MAILINGSEliminate duplicate mailings by consolidating your accounts.
MANAGE YOUR SHAREHOLDER ACCOUNTEnrol in Investor Central at www.astfinancial.com and benefit from a wide variety of self-service tools to help track and manage your shares.
For more details on any of these services, registered shareholders (shares are registered under your name) must contact the transfer agent. Non-registered shareholders must contact their brokers.
CONTACT INFORMATION
TRANSFER AGENT AND REGISTRARFor information on shareholder services or any other inquiries regarding your account (including stock transfer, address change, lost certificates and tax forms), contact:
AST Trust Company (Canada) 1 Toronto Street, Suite 1200 Toronto, Ontario M5C 2V6
e-mail [email protected]
tel 416 682-3861 or 1 800 561-0934 (toll free in Canada and the U.S.)
fax 514 985-8843 or 1 888 249-6189 (toll free in Canada and the U.S.)
website www.astfinancial.com
INVESTOR RELATIONSFor financial inquiries: Building A, 8th Floor 1 Carrefour Alexander-Graham-Bell Verdun, Québec H3E 3B3
e-mail [email protected]
tel 1 800 339-6353
fax 514 786-3970
or visit the Investors section of our website at BCE.ca
Trademarks in this annual report which are owned or used under licence by BCE Inc., Bell Canada or their subsidiaries include, without limitation, BCE, BELL Design, BELL MOBILITY and BELL MEDIA. This annual report also includes trademarks of other parties. The trademarks referred to in this annual report may be listed without the ® and ™ symbols.
© BCE Inc., 2021. All rights reserved.