Embed Size (px)
Citation preview
Disclaimer/DisclosureAviva Life Insurance Company India Limited Aviva Towers ,Sector road,Opp.Golf Course, DLF Phase-V,Sector 43,Gurgoan,Haryana-122 003Tel:+91(0)1242709000-01, Fax: +91(0)124 2571 214 Registered office:2nd Floor,Prakashdeep Building, 7,Tolstoy Marg, New Delhi -110 001
Aviva Investor
IN ULIP PRODUCTS THE INVESTMENT RISK IN THE INVESTMENT PORTFOLIO SHALL BE BORNE BY THE POLICY HOLDER
THE LINKED INSURANCE PRODUCTS DO NOT OFFER ANY LIQUIDITY DURING THE FIRST FIVE YEARS OF THE CONTRACT. THE POLICYHOLDER WILLNOT BE ABLE TO SURRENDER/WITHDRAW THE MONIES INVESTED IN LINKED INSURANCE PRODUCTS COMPLETELY OR PARTIALLY TILL THE END OFTHE FIFTH YEAR.
November 2018
Equity Commentary:
November 2018
MARKET REVIEW
Indian equities markets remained positive during the month with Nifty increasing by 4.7 % mainly led by the uptick in the following sectors –Financial services +7.5%; Banks +6.8%, private banks +6.7%, FMCG +5.5% and Auto +5.1%. India is one of the key beneficiaries of fall in crude prices. Crude prices have further come off significantly and are at much lower levels of ~US$ 59$ /bbl and oil basket forms nearly 25-30% of our total import bill. The gyrations in the crude oil markets led by geopolitics caused the brent and WTI to decline 30% in 2months to the lowest levels of the year and this supported a 13% rally in the Indian Rupee which is the 4th best performer among 17 emerging markets in the past 1 month and the INR as well strengthened past the 70/- mark.
On the economy front, CPI inflation eased to 3.31% in October from a downward revised print of 3.7% in September while WPI inflation firmed up to 5.28% in October from 5.13% in September on account of higher manufactured products and fuel inflation. The increase in imports led to the trade deficit spiking to USD17.1bn, from a shortfall of USD14bn in September. In the quarter ended June, overall Balance of Payments (BoP) deficit (highest since Dec’17) was ~40% of crude imported during the quarter.FIIs have been net sellers to the tune of ~$13.3 billion so far in 2018.Out of this $13.3 billion, net sell in equity was $5.7 billion and net sell in Debt was $7.6 billion.
Global Markets
The Chairman of US Fed in a statement said the benchmark policy rate seems to be just below neutral which led to cheer across capital markets globally. Comments from Fed governors continue acknowledging the slowing down in global growth, led to expectations of lower rate hikes for 2019.The expectations that US Fed will not be aggressive in hiking policy rates led to Risk on scenario across equities and fixed income. The US earnings outlook remains strong with Q3 earnings surprising on the upside (+28 %) and Q4 earnings are expected to remain solid (+20%).The economic data out of Germany and China wasn’t encouraging either with manufacturing PMI in China just holding at 50 for Oct 2018 below which it’ll show contraction. The Brexit continues to be a key issue with the UK parliamentarians being vocally critical of the exit agreement which now has the approval of the EU. The UK Parliament has time till 21st Jan 2019 to approve the bill .The hopes for a resolution of the 11 month old trade war are hinged over the meeting between the President of the United States and President of China over the month end. These are crucial from the perspectives of risk of downgrades to global growth estimates.Pound sterling tumbled after Brexit Secretary Dominic Raab announced his resignation. Doubts over whether the U.K. can exit the bloc in an orderly manner mounted as Brexit Secretary Dominic Raab resigned, followed by cabinet minister Esther McVey.
Outlook
The global markets are swinging between prospects of an economic recovery and worries over rising interest rates as major central banks look to tighten monetary policies. Indian markets too are caught in a similar dilemma with fairly improving micro (GDP growth and the improvement in corporate profit growth) vis a vis deteriorating macros (fiscal deficit, current account deficit, inflation, currency and interest rates all on way upwards). While recent correction in crude oil prices reduces some concerns, continued disappointment in GST collections and an extended risk off in the short term debt markets can impact growth in the near term.
Worries over tightening monetary policy by central banks in USA, Europe and geopolitical issues and increasing risks from tariff wars are expected to keep global markets volatile in near term. In addition, increasing macro risks have led to a correction in the Indian markets. However, over the medium to long term, domestic economic growth and corporate earnings will drive Indian markets more than global issues. The Indian equity markets in year FY2019 will also be influenced by sentiments over political developments as the country prepares for central elections in next 12 months.
Going ahead, there are sufficient catalysts for domestic economy to gain momentum and potential for a consolidation and healthy revival in the equity markets over the medium term that incorporates events like elections. .
1) Indian markets will have renewed focus on the possible outcomes of thenext general elections (due in April/May 2019) and the electoral prospectsof the BJP and the ruling-coalition (NDA). The market could get jittery if thereis increased possibility of a divided mandate.
2) India’s growth rates continue to remain amongst the best globally.
3) India’s exports growth can revive with world economy on upswing and weaker currency.
4) Rural focus by Government has the potential for change in sentimentsand rising consumption by rural India
5) Capex cycle recovery led by the Government has already commencedin Road and Rail sectors with Power distribution likely to catch up as statesimplement necessary reforms for “Power for All” mission.
Fixed Income Outlook:
November 2018
MARKET REVIEW
The month of November continued with the momentum in fixed income markets which resulted in 10 year Government security to rally 24 bps to close at 7.61% versus 7.85% last month. The market took positive cues from numbers of favorable macro economic factors like falling crude, benign inflation, stabilization of the INR, positive outcome of RBI board meet, continuous OMO’s etc. FYTD RBI has conducted OMO purchases to the tune of Rs. 1.36 trillion and have already announced Rs. 400 billion OMO plan for the month of December. The double-trouble for India of crude and currency continues to take breather this month also. The INR appreciated 6% for the month to settle around levels of 69.59 versus 73.95 last month. Crude prices also came off considerable over the month. Brent crude corrected 22% from levels north of US$ 75/bbl to hover around levels of US$ 59/bbl.
CPI Inflation in the month of October moderated further to stand at 3.31% compared to Sep-18 reading of 3.77%. The lower-than-expected reading was because of deflation in the food and beverage segment. Food and beverage inflation stood at -0.1% YoY in October 2018, down from 1% in the previous month. Vegetable prices declined 0.33% MoM. Prices of pulses declined 2.22% MoM, that of milk and milk products declined 0.7% MoM, prices of sugar fell 1.1% MoM while that of oils and fats declined 0.41% MoM. Core inflation (including petrol and diesel) increased to 6.19% YoY, up from 5.80% in the previous month. The increase in the transport and communication segment at 7.72% YoY was broadly in line, reflecting the movement in petrol and diesel prices. However, healthcare costs rose 2.38% MoM and the cost of household goods and services rose 1.43% MoM. The personal care and effects segment rose 1.45% MoM which reflects the increase in gold prices over the past month. Overall, higher goods and services inflation reflects the pass-through of higher input costs including INR depreciation and higher import duties. Inflation in the pan, tobacco and intoxicants segment also rose 1.07% MoM, adding to the pressure on core inflation.
Headline WPI inflation rose to 5.3% from 5.1% last month led by rise in fuel and power and core inflation. Core WPI inflation printed at 5.1%, higher than the previous month’s number of 4.8%. The divergent trend between CPI and WPI in October, with the former surprising on the downside at 3.3%, reflects the greater weight of fuel and the lower weight of food in WPI. Consolidated WPI food prices (primary plus manufactured) contracted by 0.6%y-o-y in October from 0.1%y-o-y rise last month and is mostly due to a favourable base. Food prices rose on a M-o-M basis by 0.6% in October against a decline of 0.1% last month. On a y-o-y basis fuel and power prices rose by 18.4% in October on top of a 16.6% rise last month, led by a rise in mineral fuels (30.3% v/s 28% last month) and electricity prices (5.9% v/s 3.3% last month). Petrol prices rose by 3.5% (3.6% last month) and diesel prices rose by 3.9%, same as last month. The excise duty cuts on petrol and diesel by Centre and state governments will only be captured in CPI which is based on retail prices, while WPI is based on producer prices (pre-tax). India’s GDP growth in 2QFY19 stood at 7.1%, down from 8.2% in the previous quarter despite a relatively low base of 6.3% in 2QFY18. This was also significantly below consensus estimate of 7.5%. Industry excluding construction grew 6.5%YoY, down from a high of 10.8% YoY in the previous quarter. Manufacturing grew 7.4% YoY, while the mining sector declined 2.4%YoY. Electricity, gas and water supply grew 9.2% YoY, up from 7.3% in the previous quarter and 7.7% a year ago. Services sector activity (including construction) remained steady at 7.5% YoY in 2QFY19, and was up from 6.4% a year ago. Construction activity rose 7.8% YoY, supported by a low base, but was down from 8.7% in the previous quarter. Trade, hotels and transportation grew 6.8%YoY, while financial; real estate and professional services grew 6.3% YoY. Agricultural growth came in at 3.8% YoY. Agricultural activity was pulled down by kharif food grain output rising just 0.6% YoY. On the other hand, robust activity in allied agricultural segments such as forestry, dairy and fisheries was robust, registering a growth of 6.7% YoY.
Fiscal deficit for April–October 2018 stood at 103.9% of the budget, compared to 96.1% a year ago. The shortfall is on account of lower tax and divestment revenues. Divestment witnessed a pick-up in November 2018, but indirect taxes may not receive the expected boost as growth slows. With the revenue shortfall, and slowing growth warranting higher revenue expenditure, market sees rising risk of fiscal slippage in FY19.
OutlookThe outlook for the month of December continues to look brighter. As crude comes off on the back of increasing inventories and concerns on strength of global economy, the INR too has recouped a portion of its losses as it stabilizes at more viable levels. In addition, the continuation of OMO purchase cycle has provided more impetus to the southward trajectory of yields. From a monetary policy standpoint, CPI continues to be the key variable to track as WPI provides a peek into producer price inflation. All these developments add comfort to the outlook for the month of December. However, the main risks or source of volatility may arise from political developments (both at the global and domestic level), RBI monetary policy outcome, further liquidity strain arising from NBFCs concerns and crude behavior going forward. We still remain underweight the benchmark with respect to duration as we assess that the extent of upside looks limited amidst looming concerns and market may take longer to stabilize.
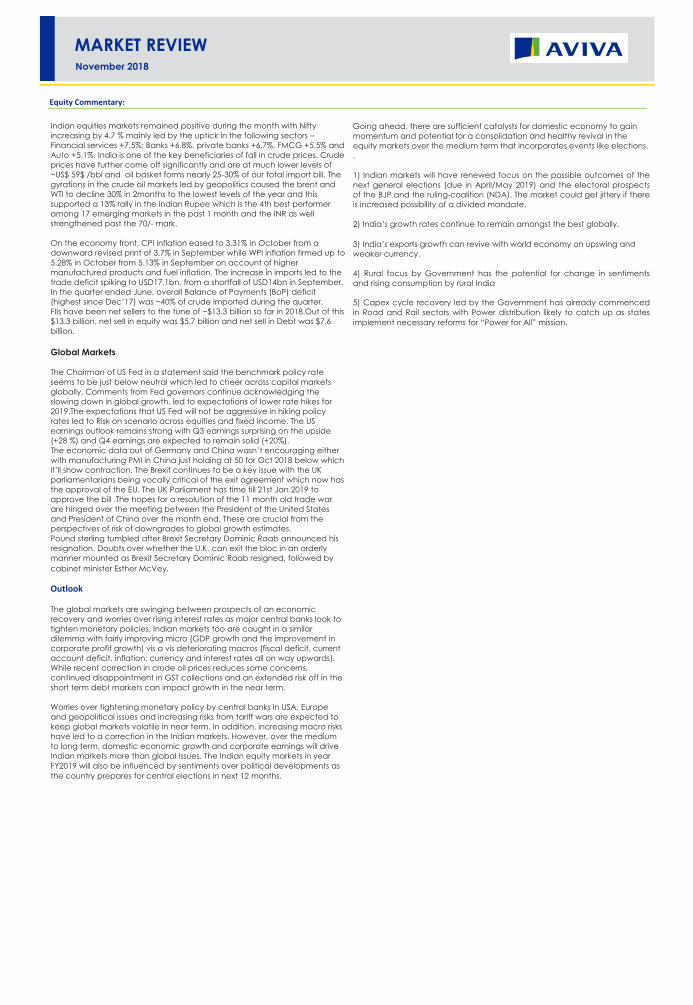
Fund Details Security Name Net Asset (%)Goverment Securities 52.95%6.84% GOI 2022 15.43%7.17% GOI 2028 13.22%6.90% GOI 2019 7.70%
NAV as on November 30,2018: 24.0635 8.85% Tamil Nadu SDL 2022 5.04%
Inception Date: 06-Feb-08 6.05% GOI 2019 3.77%
Fund Manager: Nitin Garg 9.15% GOI 2024 2.81%
8.3% GOI 2042 2.58%
Fund v/s Benchmark Return (%) 8.33% GOI 2036 2.07%
1 Month 6 Months 1 Year 2 Years* 3 Years* Inception* 8.08% GOI 2022 0.33%
Portfolio return 1.42% 2.92% 1.63% 1.89% 6.43% 8.45% Corporate Bonds 34.10%
Benchmark** 1.86% 4.28% 3.77% 3.81% 7.41% 7.07% Housing Development Finance Corporation Ltd. 6.58%
Reliance Capital Ltd. 4.69%
L&T Infra Debt Fund Ltd. 4.05%
Targeted Asset Allocation (%) Mahindra & Mahindra Ltd. 3.62%
Security Type Min Max Yes Bank Ltd. 3.36%
Cash and Money Market Instruments 0.00% 40.00% Indiabulls Housing Finance Ltd. 3.24%
Government and other Debt Securities 60.00% 100.00% Adani Ports and Special Economic Zone Ltd. 1.68%
Dewan Housing Finance Corporation Ltd. 1.67%
Capital First Ltd 1.63%
Shriram Transport Finance Co. Ltd. 1.63%
Others 1.95%
Asset Class Wise AUM Cash and Money Markets 12.95%Asset Class AUM (in Cr.) Portfolio Total 100.00%Equity 0.00
Debt 6.10
Total 6.10
Modified Duration#
Security Type Duration
Fixed Income Investments 3.75
Asset Mix
Sectoral Break-Up$
Rating Profile
* Compound Annual Growth Rate (CAGR)
$Sector Classification is as per National Industrial Classification ( All Economic Activities) -2008 NIC
**Benchmark for this fund is CRISIL Composite Bond Fund Index#Duration of Fixed Income Investments is a measure of sensitivity of the assets price to interest rate movement. Shorter the duration lesser is the sensitivity due to movement in interest rates.
Investment Objective: The investment objective of the debt fund is to provide progressive
capital growth with relatively lower investment risks
The risk profile for this fund is Low
November 2018
The actual asset allocation will remain within the 'minimum' and 'maximum' range based on
market opportunities and future outlook of the markets.
12.95%
1.68%
3.62%
28.80%
52.95%
Others
Warehousing & support activit. fortransp.
Manf. of motor vehic ,trailr & semi-trailr
Financial & insur. activit.
Soveriegn
52.95
34.1
12.95
Goverment Securities Corporate Bonds Cash and Money Markets
Life Unit Linked
Bond FundULIF01306/02/2008LIFEDEBTFU122
53.22%
32.11%
8.09% 6.59%
Sovereign AAA AA AA+
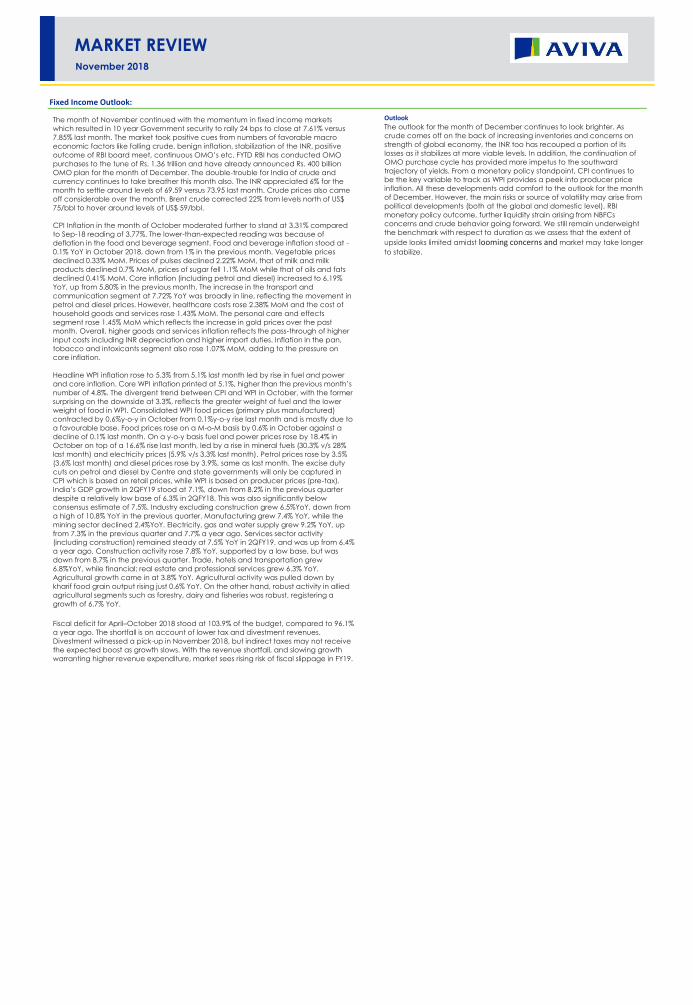
Fund Details Security Name Net Asset (%)Equities 12.33%HDFC Bank Ltd. 1.93%Reliance Industries Ltd. 1.59%ICICI Bank Ltd. 0.96%
NAV as on November 30,2018: 28.4323 Infosys Ltd. 0.81%
Inception Date: 27-Jan-04 ITC Ltd. 0.63%
Fund Manager: Jayesh Sundar, Nitin Garg Larsen & Toubro Ltd. 0.59%
Housing Development Finance Corporation Ltd. 0.57%
Fund v/s Benchmark Return (%) Tata Consultancy Services Ltd. 0.56%
1 Month 6 Months 1 Year 2 Years* 3 Years* Inception* Kotak Mahindra Bank Ltd. 0.42%
Portfolio return 1.87% 2.60% 2.14% 3.74% 7.18% 7.95% Axis Bank Ltd. 0.36%
Benchmark** 2.29% 3.87% 4.25% 5.50% 8.06% 7.33% Others 3.91%
Goverment Securities 42%6.05% GOI 2019 9.70%
Targeted Asset Allocation (%) 6.84% GOI 2022 6.22%
Security Type Min Max 7.17% GOI 2028 5.95%
Cash and Money Market Instrument 0.00% 40.00% 6.90% GOI 2019 5.06%
Equity 0.00% 20.00% 7.28% GOI 2019 4.31%
Government and other Debt Securities 60.00% 100.00% 8.4% GOI 2024 3.18%
9.15% GOI 2024 2.53%
8.3% GOI 2042 2.18%
8.33% GOI 2036 1.79%
Asset Class Wise AUM 8.27% GOI 2020 0.71%
Asset Class AUM (in Cr.) Others 0.37%
Equity 21.61 Corporate Bonds 35.30%Debt 153.49 Yes Bank Ltd. 7.31%
Total 175.10 Mahindra & Mahindra Ltd. 6.80%
Adani Ports and Special Economic Zone Ltd. 3.73%Modified Duration# Indiabulls Housing Finance Ltd. 3.72%
Security Type Duration LIC Housing Finance Ltd. 2.92%
Fixed Income Investments 3.67 L&T Fincance Corporation Ltd 1.95%
Dewan Housing Finance Corporation Ltd. 1.57%
Shriram Transport Finance Co. Ltd. 1.48%
L&T Infra Debt Fund Ltd. 1.40%
Rural Electrification Corporation 1.00%
Others 3.42%
Cash and Money Markets 10.37%Asset Mix Portfolio Total 100.00%
Sectoral Break-Up$
Rating Profile
* Compound Annual Growth Rate (CAGR)
$Sector Classification is as per National Industrial Classification ( All Economic Activities) -2008 NIC
**Benchmark return has been computed by applying benchmark weightages on CRISIL Composite Bond Fund Index and NIFTY 50 INDEX#Duration of Fixed Income Investments is a measure of sensitivity of the assets price to interest rate movement. Shorter the duration lesser is the sensitivity due to movement in interest rates.
Investment Objective: The investment objective of the fund is to provide progressive returnson your investment and carry capital guarantee as defined in the policy terms &conditions.The risk profile for this fund is Low
November 2018
The actual asset allocation will remain within the 'minimum' and 'maximum' range based on
market opportunities and future outlook of the markets.
11.97%
0.28%
0.36%
0.63%
0.63%
1.59%
1.79%
3.85%
7.36%
29.54%
42.00%
Others
Manuf of pharmicals,mdicinl chmcal& btancl pro
Mutual Funds
Civil engineering
Manf. of tobacco prod.
Manf. of coke & refined petrol. prod.
Compt prgm, consult. & relatedactivit.
Warehousing & support activit. fortransp.
Manf. of motor vehic ,trailr & semi-trailr
Financial & insur. activit.
Soveriegn
12.33
42
35.3
10.37
Equities Goverment Securities Corporate Bonds Cash and Money Markets
Life Unit Linked
Secure FundULIF00627/01/2004LIFESECURE122
47.93%
8.35%
35.71%
8.01%
Sovereign AA AAA AA+

Fund Details Security Name Net Asset (%)Equities 12.31%HDFC Bank Ltd. 1.92%Reliance Industries Ltd. 1.58%ICICI Bank Ltd. 0.96%
NAV as on November 30,2018: 24.8118 Infosys Ltd. 0.80%
Inception Date: 11-Jul-06 ITC Ltd. 0.63%
Fund Manager: Jayesh Sundar, Nitin Garg Larsen & Toubro Ltd. 0.60%
Housing Development Finance Corporation Ltd. 0.57%
Fund v/s Benchmark Return (%) Tata Consultancy Services Ltd. 0.56%
1 Month 6 Months 1 Year 2 Years* 3 Years* Inception* Kotak Mahindra Bank Ltd. 0.42%
Portfolio return 1.85% 2.49% 2.05% 3.79% 7.38% 7.61% Reliance Mutual Fund 0.36%
Benchmark** 2.29% 3.87% 4.25% 5.50% 8.06% 7.93% Others 3.91%
Goverment Securities 40.69%6.05% GOI 2019 8.44%
Targeted Asset Allocation (%) 6.90% GOI 2019 6.72%
Security Type Min Max 6.84% GOI 2022 6.62%
Cash and Money Market Instruments 0.00% 40.00% 7.17% GOI 2028 4.54%
Equity 0.00% 20.00% 7.28% GOI 2019 4.34%
Government and other Debt Securities 60.00% 100.00% 8.4% GOI 2024 3.03%
9.15% GOI 2024 2.57%
8.3% GOI 2042 2.18%
8.33% GOI 2036 1.76%
Asset Class Wise AUM 8.08% GOI 2022 0.29%
Asset Class AUM (in Cr.) Others 0.20%
Equity 4.25 Corporate Bonds 33.89%Debt 30.39 Mahindra & Mahindra Ltd. 6.69%
Total 34.64 Yes Bank Ltd. 5.91%
L&T Infra Debt Fund Ltd. 4.25%Modified Duration# Indiabulls Housing Finance Ltd. 3.71%
Security Type Duration Adani Ports and Special Economic Zone Ltd. 3.54%
Fixed Income Investments 3.65 Dewan Housing Finance Corporation Ltd. 2.35%
Reliance Capital Ltd. 2.20%
Shriram Transport Finance Co. Ltd. 1.43%
LIC Housing Finance Ltd. 1.15%
Capital First Ltd 0.86%
Others 1.80%
Cash and Money Markets 13.11%Asset Mix Portfolio Total 100.00%
Sectoral Break-Up$
Rating Profile
* Compound Annual Growth Rate (CAGR)
$Sector Classification is as per National Industrial Classification ( All Economic Activities) -2008 NIC
**Benchmark return has been computed by applying benchmark weightages on CRISIL Composite Bond Fund Index and NIFTY 50 INDEX#Duration of Fixed Income Investments is a measure of sensitivity of the assets price to interest rate movement. Shorter the duration lesser is the sensitivity due to movement in interest rates.
Investment Objective: Progressive return on your investment by investing majority portion in
debt securities, with a minimum exposure to equities.
The risk profile for this fund is Low
November 2018
The actual asset allocation will remain within the 'minimum' and 'maximum' range based on
market opportunities and future outlook of the markets.
14.71%
0.28%
0.36%
0.63%
0.64%
1.58%
1.78%
3.66%
7.25%
28.42%
40.69%
Others
Manuf of pharmicals,mdicinl chmcal& btancl pro
Mutual Funds
Manf. of tobacco prod.
Civil engineering
Manf. of coke & refined petrol. prod.
Compt prgm, consult. & relatedactivit.
Warehousing & support activit. fortransp.
Manf. of motor vehic ,trailr & semi-trailr
Financial & insur. activit.
Soveriegn
12.31
40.69
33.89
13.11
Equities Goverment Securities Corporate Bonds Cash and Money Markets
Life Unit Linked
Protector FundULIF00911/07/2006LIFPROTECT122
46.04%37.21%
9.18% 7.57%
Sovereign AAA AA AA+

Fund Details Security Name Net Asset (%)Equities 31.31%HDFC Bank Ltd. 4.44%Reliance Industries Ltd. 3.76%ICICI Bank Ltd. 2.45%
NAV as on November 30,2018: 67.1480 Infosys Ltd. 2.05%
Inception Date: 06-Jun-02 ITC Ltd. 1.85%
Fund Manager: Jayesh Sundar, Nitin Garg Housing Development Finance Corporation Ltd. 1.44%
Tata Consultancy Services Ltd. 1.43%
Fund v/s Benchmark Return (%) Larsen & Toubro Ltd. 1.33%
1 Month 6 Months 1 Year 2 Years* 3 Years* Inception* Kotak Mahindra Bank Ltd. 1.16%
Portfolio return 2.60% 2.18% 2.41% 6.15% 8.18% 12.76% Axis Bank Ltd. 1.09%
Benchmark** 2.86% 3.30% 4.85% 7.75% 8.87% 10.46% Others 10.31%
Goverment Securities 36.39%7.28% GOI 2019 6.75%
Targeted Asset Allocation (%) 6.84% GOI 2022 6.67%
Security Type Min Max 7.17% GOI 2028 6.27%
Cash and Money Market Instruments 0.00% 40.00% 6.65% GOI 2020 4.23%
Equity 0.00% 45.00% 6.05% GOI 2019 3.34%
Government and other Debt Securities 50.00% 90.00% 8.4% GOI 2024 2.35%
9.15% GOI 2024 1.94%
6.90% GOI 2019 1.91%
8.3% GOI 2042 1.66%
Asset Class Wise AUM 8.28% GOI 2032 0.94%
Asset Class AUM (in Cr.) Others 0.33%
Equity 113.91 Corporate Bonds 23.99%Debt 250.08 Mahindra & Mahindra Ltd. 4.73%
Total 363.99 Indiabulls Housing Finance Ltd. 2.71%
Reliance Capital Ltd. 2.62%Modified Duration# Food Corporation of India 2.29%
Security Type Duration Adani Ports and Special Economic Zone Ltd. 1.54%
Fixed Income Investments 3.57 LIC Housing Finance Ltd. 1.41%
Yes Bank Ltd. 1.41%
LIC Housing Finance Ltd. 1.12%
Shriram Transport Finance Co. Ltd. 1.12%
L&T Fincance Corporation Ltd 0.81%
Others 4.23%
Cash and Money Markets 8.31%Asset Mix Portfolio Total 100.00%
Sectoral Break-Up$
Rating Profile
* Compound Annual Growth Rate (CAGR)
$Sector Classification is as per National Industrial Classification ( All Economic Activities) -2008 NIC
**Benchmark return has been computed by applying benchmark weightages on CRISIL Composite Bond Fund Index and NIFTY 50 INDEX#Duration of Fixed Income Investments is a measure of sensitivity of the assets price to interest rate movement. Shorter the duration lesser is the sensitivity due to movement in interest rates.
Investment Objective: The fund is designed to provide long-term cumulative capital growth
while controlling risk, by availing opportunities in debt and equity markets.
The risk profile for this fund is Medium
November 2018
The actual asset allocation will remain within the 'minimum' and 'maximum' range based on
market opportunities and future outlook of the markets.
13.61%
0.86%
1.42%
1.85%
1.85%
2.29%
3.76%
4.64%
6.28%
27.05%
36.39%
Others
Electricity, gas, steam and airconditioning supply
Civil engineering
Manf. of tobacco prod.
Warehousing & support activit. fortransp.
Wholesale trd, except of motorvehicles and motorcycles
Manf. of coke & refined petrol. prod.
Compt prgm, consult. & relatedactivit.
Manf. of motor vehic ,trailr & semi-trailr
Financial & insur. activit.
Soveriegn
31.31
36.39
23.998.31
Equities Goverment Securities Corporate Bonds Cash and Money Markets
Life Unit Linked
Balanced FundULIF00106/06/2002LIFBALANCE122
53.19%
35.08%
5.88% 5.84%
Sovereign AAA AA AA+
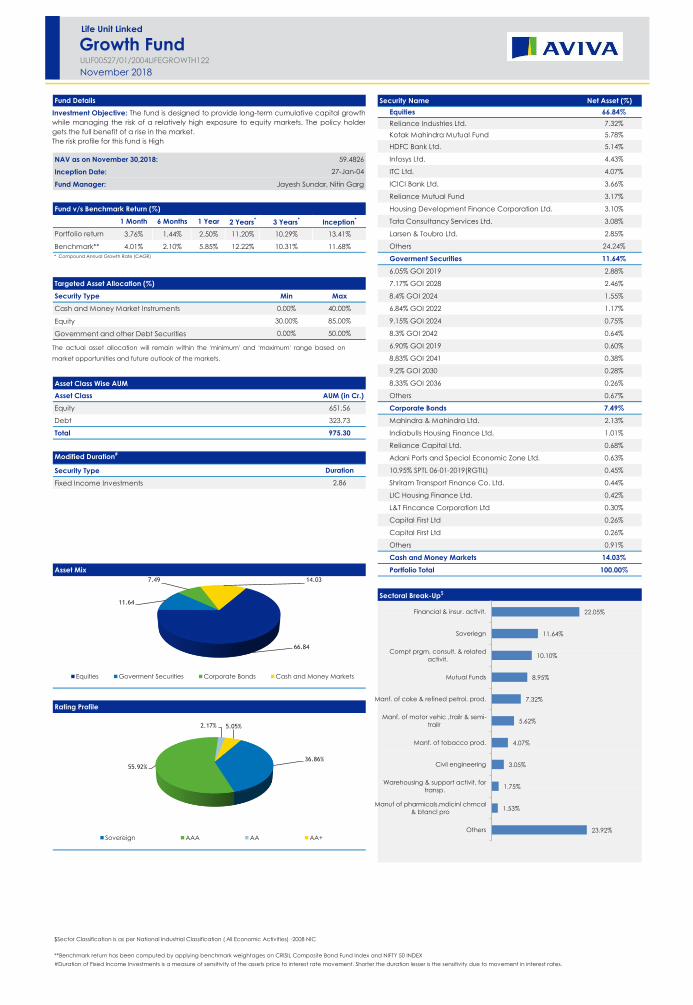
Fund Details Security Name Net Asset (%)Equities 66.84%Reliance Industries Ltd. 7.32%Kotak Mahindra Mutual Fund 5.78%HDFC Bank Ltd. 5.14%
NAV as on November 30,2018: 59.4826 Infosys Ltd. 4.43%
Inception Date: 27-Jan-04 ITC Ltd. 4.07%
Fund Manager: Jayesh Sundar, Nitin Garg ICICI Bank Ltd. 3.66%
Reliance Mutual Fund 3.17%
Fund v/s Benchmark Return (%) Housing Development Finance Corporation Ltd. 3.10%
1 Month 6 Months 1 Year 2 Years* 3 Years* Inception* Tata Consultancy Services Ltd. 3.08%
Portfolio return 3.76% 1.44% 2.50% 11.20% 10.29% 13.41% Larsen & Toubro Ltd. 2.85%
Benchmark** 4.01% 2.10% 5.85% 12.22% 10.31% 11.68% Others 24.24%
Goverment Securities 11.64%6.05% GOI 2019 2.88%
Targeted Asset Allocation (%) 7.17% GOI 2028 2.46%
Security Type Min Max 8.4% GOI 2024 1.55%
Cash and Money Market Instruments 0.00% 40.00% 6.84% GOI 2022 1.17%
Equity 30.00% 85.00% 9.15% GOI 2024 0.75%
Government and other Debt Securities 0.00% 50.00% 8.3% GOI 2042 0.64%
6.90% GOI 2019 0.60%
8.83% GOI 2041 0.38%
9.2% GOI 2030 0.28%
Asset Class Wise AUM 8.33% GOI 2036 0.26%
Asset Class AUM (in Cr.) Others 0.67%
Equity 651.56 Corporate Bonds 7.49%Debt 323.73 Mahindra & Mahindra Ltd. 2.13%
Total 975.30 Indiabulls Housing Finance Ltd. 1.01%
Reliance Capital Ltd. 0.68%Modified Duration# Adani Ports and Special Economic Zone Ltd. 0.63%
Security Type Duration 10.95% SPTL 06-01-2019(RGTIL) 0.45%
Fixed Income Investments 2.86 Shriram Transport Finance Co. Ltd. 0.44%
LIC Housing Finance Ltd. 0.42%
L&T Fincance Corporation Ltd 0.30%
Capital First Ltd 0.26%
Capital First Ltd 0.26%
Others 0.91%
Cash and Money Markets 14.03%Asset Mix Portfolio Total 100.00%
Sectoral Break-Up$
Rating Profile
* Compound Annual Growth Rate (CAGR)
$Sector Classification is as per National Industrial Classification ( All Economic Activities) -2008 NIC
**Benchmark return has been computed by applying benchmark weightages on CRISIL Composite Bond Fund Index and NIFTY 50 INDEX#Duration of Fixed Income Investments is a measure of sensitivity of the assets price to interest rate movement. Shorter the duration lesser is the sensitivity due to movement in interest rates.
Investment Objective: The fund is designed to provide long-term cumulative capital growthwhile managing the risk of a relatively high exposure to equity markets. The policy holdergets the full benefit of a rise in the market.The risk profile for this fund is High
November 2018
The actual asset allocation will remain within the 'minimum' and 'maximum' range based on
market opportunities and future outlook of the markets.
23.92%
1.53%
1.75%
3.05%
4.07%
5.62%
7.32%
8.95%
10.10%
11.64%
22.05%
Others
Manuf of pharmicals,mdicinl chmcal& btancl pro
Warehousing & support activit. fortransp.
Civil engineering
Manf. of tobacco prod.
Manf. of motor vehic ,trailr & semi-trailr
Manf. of coke & refined petrol. prod.
Mutual Funds
Compt prgm, consult. & relatedactivit.
Soveriegn
Financial & insur. activit.
66.84
11.64
7.49 14.03
Equities Goverment Securities Corporate Bonds Cash and Money Markets
Life Unit Linked
Growth FundULIF00527/01/2004LIFEGROWTH122
36.86%55.92%
2.17% 5.05%
Sovereign AAA AA AA+

Fund Details Security Name Net Asset (%)Equities 88.12%Kotak Mahindra Mutual Fund 9.62%Reliance Industries Ltd. 9.00%Infosys Ltd. 6.38%
NAV as on November 30,2018: 25.6224 HDFC Bank Ltd. 6.23%
Inception Date: 30-Jan-08 ITC Ltd. 5.88%
Fund Manager: Jayesh Sundar Housing Development Finance Corporation Ltd. 4.57%
Tata Consultancy Services Ltd. 4.43%
Fund v/s Benchmark Return (%) ICICI Bank Ltd. 4.16%
1 Month 6 Months 1 Year 2 Years* 3 Years* Inception* Larsen & Toubro Ltd. 3.68%
Portfolio return 4.33% 1.00% 2.87% 14.12% 11.29% 9.11% Mahindra & Mahindra Ltd. 2.45%
Benchmark** 4.72% 1.31% 6.36% 15.00% 11.07% 7.11% Others 31.72%
Cash and Money Markets 11.88%Portfolio Total 100.00%
Targeted Asset Allocation (%)Security Type Min MaxDebt and Money Market Instruments 0.00% 40.00%
Equity 60.00% 100.00%
Asset Class Wise AUMAsset Class AUM (in Cr.)Equity 62.62
Debt 8.46
Total 71.08
Modified Duration#
Security Type Duration
Fixed Income Investments
Asset Mix
Sectoral Break-Up$
* Compound Annual Growth Rate (CAGR)
$Sector Classification is as per National Industrial Classification ( All Economic Activities) -2008 NIC
**Benchmark for this fund is NIFTY 50 INDEX#Duration of Fixed Income Investments is a measure of sensitivity of the assets price to interest rate movement. Shorter the duration lesser is the sensitivity due to movement in interest rates.
Investment Objective: The fund is designed to provide long-term cumulative capital growthwhile managing the risk of exposure to equity markets. The policy holder gets the full benefitof a rise in the market.The risk profile for this fund is High
November 2018
The actual asset allocation will remain within the 'minimum' and 'maximum' range based on
market opportunities and future outlook of the markets.
22.97%
1.45%
1.51%
2.11%
3.91%
4.82%
5.88%
9.00%
10.62%
14.29%
23.44%
Others
Manf. of other transport equipment
Electricity, gas, steam and airconditioning supply
Manuf of pharmicals,mdicinl chmcal& btancl pro
Civil engineering
Manf. of motor vehic ,trailr & semi-trailr
Manf. of tobacco prod.
Manf. of coke & refined petrol. prod.
Mutual Funds
Compt prgm, consult. & relatedactivit.
Financial & insur. activit.
88.12
11.88
Equities Cash and Money Markets
Life Unit Linked
Enhancer FundULIF01230/01/2008LIENHANCER122

Fund Details Security Name Net Asset (%)Equities 96.22%Kotak Mahindra Mutual Fund 9.58%Reliance Industries Ltd. 9.38%HDFC Bank Ltd. 6.96%
NAV as on November 30,2018: 18.3672 Infosys Ltd. 6.28%
Inception Date: 02-Jan-08 ITC Ltd. 5.81%
Fund Manager: Jayesh Sundar Housing Development Finance Corporation Ltd. 5.63%
Tata Consultancy Services Ltd. 4.65%
Fund v/s Benchmark Return (%) Larsen & Toubro Ltd. 3.86%
1 Month 6 Months 1 Year 2 Years* 3 Years* Inception* ICICI Bank Ltd. 3.63%
Portfolio return 4.40% 1.45% 6.07% 15.02% 11.20% 5.75% Mahindra & Mahindra Ltd. 2.29%
Benchmark** 4.72% 1.31% 6.36% 15.00% 11.07% 5.32% Others 38.15%
Cash and Money Markets 3.78%Portfolio Total 100.00%
Targeted Asset Allocation (%)Security Type Min MaxDebt Securities Incl. Money Market Instruments 0.00% 20.00%
Equity 80.00% 100.00%
Asset Class Wise AUMAsset Class AUM (in Cr.)Equity 66.18
Debt 2.63
Total 68.81
Modified Duration#
Security Type Duration
Fixed Income Investments
Asset Mix
Sectoral Break-Up$
* Compound Annual Growth Rate (CAGR)
$Sector Classification is as per National Industrial Classification ( All Economic Activities) -2008 NIC
**Benchmark for this fund is NIFTY 50 INDEX#Duration of Fixed Income Investments is a measure of sensitivity of the assets price to interest rate movement. Shorter the duration lesser is the sensitivity due to movement in interest rates.
Investment Objective: The investment objective of this fund is to generate returns in line withthe stock market index - NIFTY 50.Subject to exposure norms applicable under the IRDA ofIndia (Investment) regulations.The risk profile for this fund is High
November 2018
The actual asset allocation will remain within the 'minimum' and 'maximum' range based on
market opportunities and future outlook of the markets.
16.48%
2.45%
2.87%
3.81%
3.86%
4.98%
5.81%
10.14%
10.60%
14.29%
24.71%
Others
Electricity, gas, steam and airconditioning supply
Manuf of pharmicals,mdicinl chmcal& btancl pro
Manf. of chemic.s & chemic. prod.
Civil engineering
Manf. of motor vehic ,trailr & semi-trailr
Manf. of tobacco prod.
Manf. of coke & refined petrol. prod.
Mutual Funds
Compt prgm, consult. & relatedactivit.
Financial & insur. activit.
96.22
3.78
Equities Cash and Money Markets
Life Unit Linked
Index FundULIF01002/01/2008LIFEINDEXF122

Fund Details Security Name Net Asset (%)Equities 92.88%State Bank of India 10.04%NTPC Ltd. 9.07%Oil & Natural Gas Corpn Ltd. 8.15%
NAV as on November 30,2018: 12.1363 Coal India Ltd. 8.04%
Inception Date: 08-Jan-10 Gail (India) Ltd. 6.67%
Fund Manager: Jayesh Sundar National Mineral Development Corporation Ltd. 5.65%
Oil India Ltd. 5.61%
Fund v/s Benchmark Return (%) Container Corporation Of India Ltd. 4.76%
1 Month 6 Months 1 Year 2 Years* 3 Years* Inception* Gujarat State Petronet Ltd. 4.52%
Portfolio return -3.61% -13.25% -23.18% -3.23% 4.89% 2.20% Bharat Petroleum Corporation Ltd. 4.18%
Benchmark** -3.39% -13.34% -25.51% -6.83% -0.20% -3.88% Others 26.19%
Cash and Money Markets 7.12%Portfolio Total 100.00%
Targeted Asset Allocation (%)Security Type Min MaxMoney Market & Other Cash Instruments 0.00% 40.00%
Equity 60.00% 100.00%
Debt 0.00% 40.00%
Asset Class Wise AUMAsset Class AUM (in Cr.)Equity 92.88
Debt 7.14
Total 100.02
Modified Duration#
Security Type Duration
Fixed Income Investments
Asset Mix
Sectoral Break-Up$
* Compound Annual Growth Rate (CAGR)
$Sector Classification is as per National Industrial Classification ( All Economic Activities) -2008 NIC
**Benchmark for this fund is BSE PSU Index#Duration of Fixed Income Investments is a measure of sensitivity of the assets price to interest rate movement. Shorter the duration lesser is the sensitivity due to movement in interest rates.
Investment Objective: To generate steady returns through investment in PSU and related
equities.
The risk profile for this fund is High
November 2018
The actual asset allocation will remain within the 'minimum' and 'maximum' range based on
market opportunities and future outlook of the markets.
8.64%
1.92%
2.31%
4.52%
4.76%
5.65%
8.04%
8.33%
13.76%
20.23%
21.84%
Others
Specialized construction activities
Manf. of basic metals
Land Transport & Transport ViaPipelines
Warehousing & support activit. fortransp.
Mining of metal ores
Mining of coal & lignite
Manf. of coke & refined petrol. prod.
Extrac. of crude petrol. & natural gas
Financial & insur. activit.
Electricity, gas, steam and airconditioning supply
92.88
7.12
Equities Cash and Money Markets
Life Unit Linked
PSU FundULIF02208/01/2010LIFEPSUFND122

Fund Details Security Name Net Asset (%)Equities 87.52%Larsen & Toubro Ltd. 8.99%Bharti Airtel Ltd. 8.85%NTPC Ltd. 8.84%
NAV as on November 30,2018: 10.9399 Adani Ports and Special Economic Zone Ltd. 7.53%
Inception Date: 08-Jan-10 Power Grid Corporation of India Ltd. 5.84%
Fund Manager: Jayesh Sundar Container Corporation Of India Ltd. 5.50%
Tata Power Co. Ltd. 4.70%
Fund v/s Benchmark Return (%) Axis Bank Ltd. 4.02%
1 Month 6 Months 1 Year 2 Years* 3 Years* Inception* Coal India Ltd. 3.66%
Portfolio return 3.51% -13.30% -21.13% 1.57% 4.61% 1.01% NCC Ltd. 3.57%
Benchmark** 3.94% -7.47% -12.23% 5.15% 3.66% -1.93% Others 26.02%
Cash and Money Markets 12.48%Portfolio Total 100.00%
Targeted Asset Allocation (%)Security Type Min MaxMoney Market & Other Cash Instruments 0.00% 40.00%
Equity 60.00% 100.00%
Debt 0.00% 40.00%
Asset Class Wise AUMAsset Class AUM (in Cr.)Equity 28.20
Debt 4.03
Total 32.23
Modified Duration#
Security Type Duration
Fixed Income Investments
Asset Mix
Sectoral Break-Up$
* Compound Annual Growth Rate (CAGR)
$Sector Classification is as per National Industrial Classification ( All Economic Activities) -2008 NIC
**Benchmark for this fund is Nifty Infrastructure#Duration of Fixed Income Investments is a measure of sensitivity of the assets price to interest rate movement. Shorter the duration lesser is the sensitivity due to movement in interest rates.
Investment Objective: To generate steady returns through investment in infrastructure and
related equities
The risk profile for this fund is High
November 2018
The actual asset allocation will remain within the 'minimum' and 'maximum' range based on
market opportunities and future outlook of the markets.
12.63%
1.33%
1.91%
2.11%
3.66%
7.10%
9.97%
10.32%
14.28%
16.38%
20.31%
Others
Manuf of fbricted metl prdut, exceptmchn, equp
Manuf of compu, electronic andoptcl prodt
Manf. of machi. & equipment n.e.c.
Mining of coal & lignite
Construction of buildings
Telecommunications
Financial & insur. activit.
Warehousing & support activit. fortransp.
Civil engineering
Electricity, gas, steam and airconditioning supply
87.52
12.48
Equities Cash and Money Markets
Life Unit Linked
Infrastructure FundULIF01908/01/2010LIFEINFRAF122
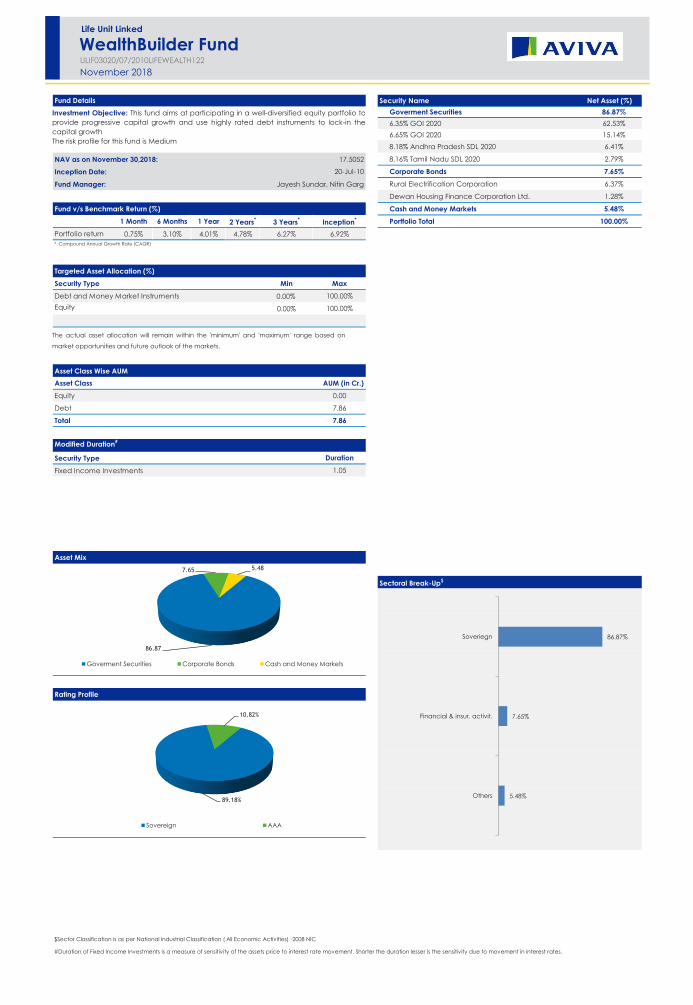
Fund Details Security Name Net Asset (%)Goverment Securities 86.87%6.35% GOI 2020 62.53%6.65% GOI 2020 15.14%8.18% Andhra Pradesh SDL 2020 6.41%
NAV as on November 30,2018: 17.5052 8.16% Tamil Nadu SDL 2020 2.79%
Inception Date: 20-Jul-10 Corporate Bonds 7.65%
Fund Manager: Jayesh Sundar, Nitin Garg Rural Electrification Corporation 6.37%
Dewan Housing Finance Corporation Ltd. 1.28%
Fund v/s Benchmark Return (%) Cash and Money Markets 5.48%1 Month 6 Months 1 Year 2 Years* 3 Years* Inception* Portfolio Total 100.00%
Portfolio return 0.75% 3.10% 4.01% 4.78% 6.27% 6.92%
Targeted Asset Allocation (%)Security Type Min MaxDebt and Money Market Instruments 0.00% 100.00%Equity 0.00% 100.00%
Asset Class Wise AUMAsset Class AUM (in Cr.)Equity 0.00
Debt 7.86
Total 7.86
Modified Duration#
Security Type Duration
Fixed Income Investments 1.05
Asset Mix
Sectoral Break-Up$
Rating Profile
$Sector Classification is as per National Industrial Classification ( All Economic Activities) -2008 NIC
#Duration of Fixed Income Investments is a measure of sensitivity of the assets price to interest rate movement. Shorter the duration lesser is the sensitivity due to movement in interest rates.
* Compound Annual Growth Rate (CAGR)
Investment Objective: This fund aims at participating in a well-diversified equity portfolio toprovide progressive capital growth and use highly rated debt instruments to lock-in thecapital growthThe risk profile for this fund is Medium
November 2018
The actual asset allocation will remain within the 'minimum' and 'maximum' range based on
market opportunities and future outlook of the markets.
5.48%
7.65%
86.87%
Others
Financial & insur. activit.
Soveriegn
86.87
7.65 5.48
Goverment Securities Corporate Bonds Cash and Money Markets
Life Unit Linked
WealthBuilder FundULIF03020/07/2010LIFEWEALTH122
89.18%
10.82%
Sovereign AAA
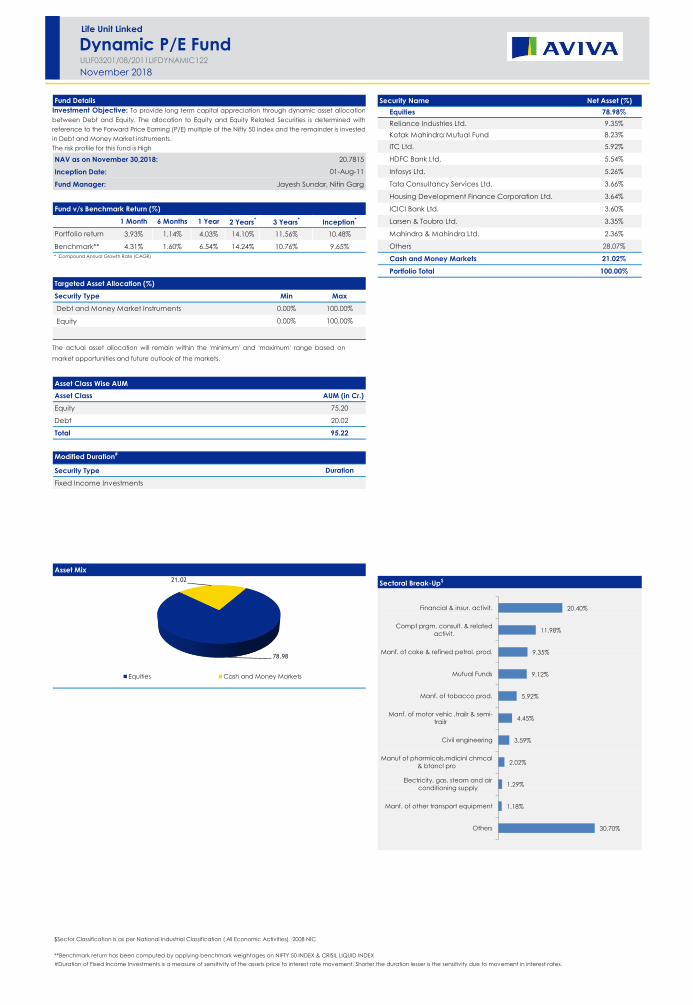
Fund Details Security Name Net Asset (%)Equities 78.98%Reliance Industries Ltd. 9.35%Kotak Mahindra Mutual Fund 8.23%ITC Ltd. 5.92%
NAV as on November 30,2018: 20.7815 HDFC Bank Ltd. 5.54%
Inception Date: 01-Aug-11 Infosys Ltd. 5.26%
Fund Manager: Jayesh Sundar, Nitin Garg Tata Consultancy Services Ltd. 3.66%
Housing Development Finance Corporation Ltd. 3.64%
Fund v/s Benchmark Return (%) ICICI Bank Ltd. 3.60%
1 Month 6 Months 1 Year 2 Years* 3 Years* Inception* Larsen & Toubro Ltd. 3.35%
Portfolio return 3.93% 1.14% 4.03% 14.10% 11.56% 10.48% Mahindra & Mahindra Ltd. 2.36%
Benchmark** 4.31% 1.60% 6.54% 14.24% 10.76% 9.65% Others 28.07%
Cash and Money Markets 21.02%Portfolio Total 100.00%
Targeted Asset Allocation (%)Security Type Min Max Debt and Money Market Instruments 0.00% 100.00%
Equity 0.00% 100.00%
Asset Class Wise AUMAsset Class AUM (in Cr.)Equity 75.20
Debt 20.02
Total 95.22
Modified Duration#
Security Type Duration
Fixed Income Investments
Asset Mix
Sectoral Break-Up$
* Compound Annual Growth Rate (CAGR)
$Sector Classification is as per National Industrial Classification ( All Economic Activities) -2008 NIC
**Benchmark return has been computed by applying benchmark weightages on NIFTY 50 INDEX & CRISIL LIQUID INDEX#Duration of Fixed Income Investments is a measure of sensitivity of the assets price to interest rate movement. Shorter the duration lesser is the sensitivity due to movement in interest rates.
Investment Objective: To provide long term capital appreciation through dynamic asset allocationbetween Debt and Equity. The allocation to Equity and Equity Related Securities is determined withreference to the Forward Price Earning (P/E) multiple of the Nifty 50 index and the remainder is investedin Debt and Money Market instruments.The risk profile for this fund is High
November 2018
The actual asset allocation will remain within the 'minimum' and 'maximum' range based on
market opportunities and future outlook of the markets.
30.70%
1.18%
1.29%
2.02%
3.59%
4.45%
5.92%
9.12%
9.35%
11.98%
20.40%
Others
Manf. of other transport equipment
Electricity, gas, steam and airconditioning supply
Manuf of pharmicals,mdicinl chmcal& btancl pro
Civil engineering
Manf. of motor vehic ,trailr & semi-trailr
Manf. of tobacco prod.
Mutual Funds
Manf. of coke & refined petrol. prod.
Compt prgm, consult. & relatedactivit.
Financial & insur. activit.
78.98
21.02
Equities Cash and Money Markets
Life Unit Linked
Dynamic P/E FundULIF03201/08/2011LIFDYNAMIC122
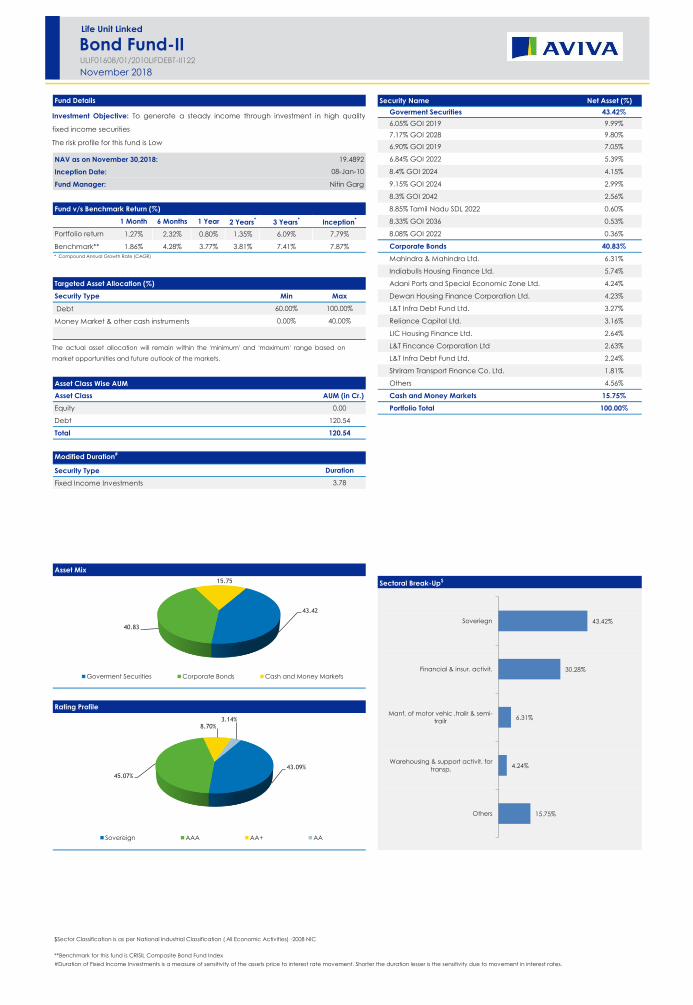
Fund Details Security Name Net Asset (%)Goverment Securities 43.42%6.05% GOI 2019 9.99%7.17% GOI 2028 9.80%6.90% GOI 2019 7.05%
NAV as on November 30,2018: 19.4892 6.84% GOI 2022 5.39%
Inception Date: 08-Jan-10 8.4% GOI 2024 4.15%
Fund Manager: Nitin Garg 9.15% GOI 2024 2.99%
8.3% GOI 2042 2.56%
Fund v/s Benchmark Return (%) 8.85% Tamil Nadu SDL 2022 0.60%
1 Month 6 Months 1 Year 2 Years* 3 Years* Inception* 8.33% GOI 2036 0.53%
Portfolio return 1.27% 2.32% 0.80% 1.35% 6.09% 7.79% 8.08% GOI 2022 0.36%
Benchmark** 1.86% 4.28% 3.77% 3.81% 7.41% 7.87% Corporate Bonds 40.83%Mahindra & Mahindra Ltd. 6.31%
Indiabulls Housing Finance Ltd. 5.74%
Targeted Asset Allocation (%) Adani Ports and Special Economic Zone Ltd. 4.24%
Security Type Min Max Dewan Housing Finance Corporation Ltd. 4.23%
Debt 60.00% 100.00% L&T Infra Debt Fund Ltd. 3.27%
Money Market & other cash instruments 0.00% 40.00% Reliance Capital Ltd. 3.16%
LIC Housing Finance Ltd. 2.64%
L&T Fincance Corporation Ltd 2.63%
L&T Infra Debt Fund Ltd. 2.24%
Shriram Transport Finance Co. Ltd. 1.81%
Asset Class Wise AUM Others 4.56%
Asset Class AUM (in Cr.) Cash and Money Markets 15.75%Equity 0.00 Portfolio Total 100.00%Debt 120.54
Total 120.54
Modified Duration#
Security Type Duration
Fixed Income Investments 3.78
Asset Mix
Sectoral Break-Up$
Rating Profile
* Compound Annual Growth Rate (CAGR)
$Sector Classification is as per National Industrial Classification ( All Economic Activities) -2008 NIC
**Benchmark for this fund is CRISIL Composite Bond Fund Index#Duration of Fixed Income Investments is a measure of sensitivity of the assets price to interest rate movement. Shorter the duration lesser is the sensitivity due to movement in interest rates.
Investment Objective: To generate a steady income through investment in high quality
fixed income securities
The risk profile for this fund is Low
November 2018
The actual asset allocation will remain within the 'minimum' and 'maximum' range based on
market opportunities and future outlook of the markets.
15.75%
4.24%
6.31%
30.28%
43.42%
Others
Warehousing & support activit. fortransp.
Manf. of motor vehic ,trailr & semi-trailr
Financial & insur. activit.
Soveriegn43.42
40.83
15.75
Goverment Securities Corporate Bonds Cash and Money Markets
Life Unit Linked
Bond Fund-IIULIF01608/01/2010LIFDEBT-II122
43.09%45.07%
8.70%3.14%
Sovereign AAA AA+ AA

Fund Details Security Name Net Asset (%)Equities 12.35%HDFC Bank Ltd. 1.93%Reliance Industries Ltd. 1.58%ICICI Bank Ltd. 0.97%
NAV as on November 30,2018: 19.2283 Infosys Ltd. 0.81%
Inception Date: 08-Jan-10 ITC Ltd. 0.64%
Fund Manager: Jayesh Sundar, Nitin Garg Larsen & Toubro Ltd. 0.60%
Housing Development Finance Corporation Ltd. 0.57%
Fund v/s Benchmark Return (%) Tata Consultancy Services Ltd. 0.56%
1 Month 6 Months 1 Year 2 Years* 3 Years* Inception* Kotak Mahindra Bank Ltd. 0.43%
Portfolio return 1.87% 2.35% 1.88% 3.43% 7.06% 7.62% Reliance Mutual Fund 0.36%
Benchmark** 2.29% 3.87% 4.25% 5.50% 8.06% 8.11% Others 3.90%
Goverment Securities 41.74%7.17% GOI 2028 10.82%
Targeted Asset Allocation (%) 6.05% GOI 2019 8.43%
Security Type Min Max 6.84% GOI 2022 8.08%
Money Market & other cash instruments 0.00% 40.00% 6.90% GOI 2019 6.74%
Equity 0.00% 20.00% 9.15% GOI 2024 2.55%
Debt 25.00% 100.00% 8.3% GOI 2042 2.17%
8.33% GOI 2036 1.78%
8.4% GOI 2024 0.44%
8.79% Gujarat SDL 2022 0.43%
Asset Class Wise AUM 8.08% GOI 2022 0.30%
Asset Class AUM (in Cr.) Corporate Bonds 30.74%Equity 6.76 Mahindra & Mahindra Ltd. 5.04%
Debt 47.95 Indiabulls Housing Finance Ltd. 3.43%
Total 54.70 Dewan Housing Finance Corporation Ltd. 3.35%
Adani Ports and Special Economic Zone Ltd. 2.80%Modified Duration# Reliance Capital Ltd. 2.61%
Security Type Duration L&T Infra Debt Fund Ltd. 2.26%
Fixed Income Investments 3.63 L&T Fincance Corporation Ltd 1.79%
L&T Infra Debt Fund Ltd. 1.79%
LIC Housing Finance Ltd. 1.64%
Shriram Transport Finance Co. Ltd. 1.45%
Others 4.58%
Cash and Money Markets 15.17%Portfolio Total 100.00%
Asset Mix
Sectoral Break-Up$
Rating Profile
* Compound Annual Growth Rate (CAGR)
$Sector Classification is as per National Industrial Classification ( All Economic Activities) -2008 NIC
**Benchmark return has been computed by applying benchmark weightages on CRISIL Composite Bond Fund Index and NIFTY 50 INDEX#Duration of Fixed Income Investments is a measure of sensitivity of the assets price to interest rate movement. Shorter the duration lesser is the sensitivity due to movement in interest rates.
Investment Objective: To generate steady returns with a minimum exposure to equities
The risk profile for this fund is Low
November 2018
The actual asset allocation will remain within the 'minimum' and 'maximum' range based on
market opportunities and future outlook of the markets.
16.85%
0.36%
0.43%
0.63%
0.64%
1.58%
1.79%
3.65%
5.60%
26.73%
41.74%
Others
Mutual Funds
Electricity, gas, steam and airconditioning supply
Civil engineering
Manf. of tobacco prod.
Manf. of coke & refined petrol. prod.
Compt prgm, consult. & relatedactivit.
Warehousing & support activit. fortransp.
Manf. of motor vehic ,trailr & semi-trailr
Financial & insur. activit.
Soveriegn
12.35
41.74
30.74
15.17
Equities Goverment Securities Corporate Bonds Cash and Money Markets
Life Unit Linked
Protector Fund-IIULIF02108/01/2010LIPROTE-II122
47.44%
42.89%
6.69% 2.97%
Sovereign AAA AA+ AA
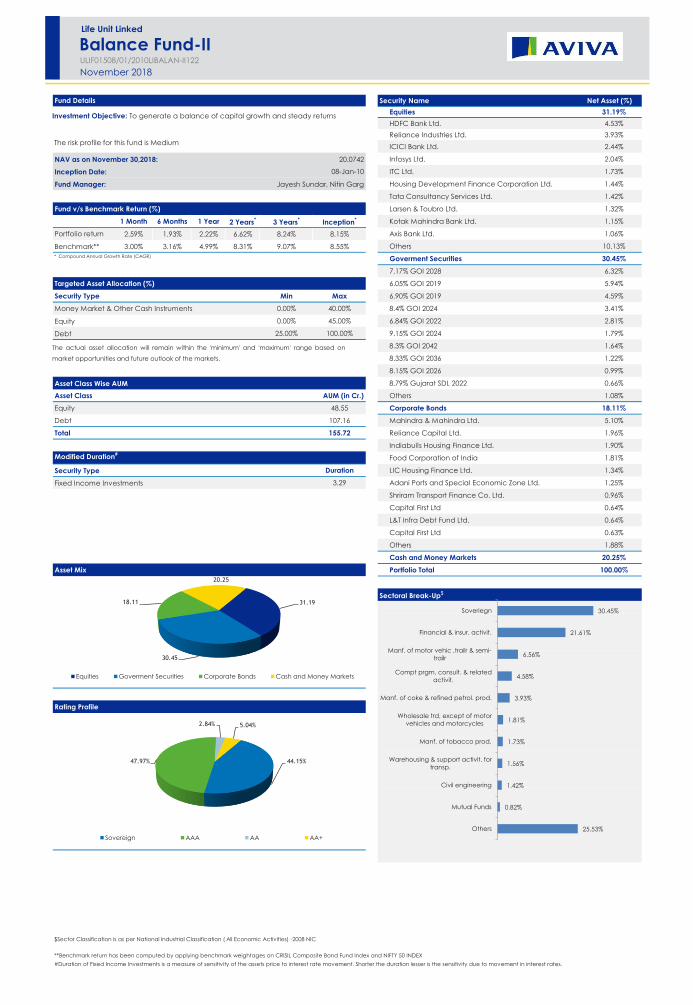
Fund Details Security Name Net Asset (%)Equities 31.19%HDFC Bank Ltd. 4.53%Reliance Industries Ltd. 3.93%ICICI Bank Ltd. 2.44%
NAV as on November 30,2018: 20.0742 Infosys Ltd. 2.04%
Inception Date: 08-Jan-10 ITC Ltd. 1.73%
Fund Manager: Jayesh Sundar, Nitin Garg Housing Development Finance Corporation Ltd. 1.44%
Tata Consultancy Services Ltd. 1.42%
Fund v/s Benchmark Return (%) Larsen & Toubro Ltd. 1.32%
1 Month 6 Months 1 Year 2 Years* 3 Years* Inception* Kotak Mahindra Bank Ltd. 1.15%
Portfolio return 2.59% 1.93% 2.22% 6.62% 8.24% 8.15% Axis Bank Ltd. 1.06%
Benchmark** 3.00% 3.16% 4.99% 8.31% 9.07% 8.55% Others 10.13%
Goverment Securities 30.45%7.17% GOI 2028 6.32%
Targeted Asset Allocation (%) 6.05% GOI 2019 5.94%
Security Type Min Max 6.90% GOI 2019 4.59%
Money Market & Other Cash Instruments 0.00% 40.00% 8.4% GOI 2024 3.41%
Equity 0.00% 45.00% 6.84% GOI 2022 2.81%
Debt 25.00% 100.00% 9.15% GOI 2024 1.79%
8.3% GOI 2042 1.64%
8.33% GOI 2036 1.22%
8.15% GOI 2026 0.99%
Asset Class Wise AUM 8.79% Gujarat SDL 2022 0.66%
Asset Class AUM (in Cr.) Others 1.08%
Equity 48.55 Corporate Bonds 18.11%Debt 107.16 Mahindra & Mahindra Ltd. 5.10%
Total 155.72 Reliance Capital Ltd. 1.96%
Indiabulls Housing Finance Ltd. 1.90%Modified Duration# Food Corporation of India 1.81%
Security Type Duration LIC Housing Finance Ltd. 1.34%
Fixed Income Investments 3.29 Adani Ports and Special Economic Zone Ltd. 1.25%
Shriram Transport Finance Co. Ltd. 0.96%
Capital First Ltd 0.64%
L&T Infra Debt Fund Ltd. 0.64%
Capital First Ltd 0.63%
Others 1.88%
Cash and Money Markets 20.25%Asset Mix Portfolio Total 100.00%
Sectoral Break-Up$
Rating Profile
* Compound Annual Growth Rate (CAGR)
$Sector Classification is as per National Industrial Classification ( All Economic Activities) -2008 NIC
**Benchmark return has been computed by applying benchmark weightages on CRISIL Composite Bond Fund Index and NIFTY 50 INDEX#Duration of Fixed Income Investments is a measure of sensitivity of the assets price to interest rate movement. Shorter the duration lesser is the sensitivity due to movement in interest rates.
Investment Objective: To generate a balance of capital growth and steady returns
The risk profile for this fund is Medium
November 2018
The actual asset allocation will remain within the 'minimum' and 'maximum' range based on
market opportunities and future outlook of the markets.
25.53%
0.82%
1.42%
1.56%
1.73%
1.81%
3.93%
4.58%
6.56%
21.61%
30.45%
Others
Mutual Funds
Civil engineering
Warehousing & support activit. fortransp.
Manf. of tobacco prod.
Wholesale trd, except of motorvehicles and motorcycles
Manf. of coke & refined petrol. prod.
Compt prgm, consult. & relatedactivit.
Manf. of motor vehic ,trailr & semi-trailr
Financial & insur. activit.
Soveriegn31.19
30.45
18.11
20.25
Equities Goverment Securities Corporate Bonds Cash and Money Markets
Life Unit Linked
Balance Fund-IIULIF01508/01/2010LIBALAN-II122
44.15%47.97%
2.84% 5.04%
Sovereign AAA AA AA+

Fund Details Security Name Net Asset (%)Equities 66.23%Reliance Industries Ltd. 7.56%Kotak Mahindra Mutual Fund 5.27%HDFC Bank Ltd. 5.09%
NAV as on November 30,2018: 20.9653 Infosys Ltd. 4.36%
Inception Date: 08-Jan-10 ITC Ltd. 4.32%
Fund Manager: Jayesh Sundar, Nitin Garg ICICI Bank Ltd. 3.62%
Reliance Mutual Fund 3.08%
Fund v/s Benchmark Return (%) Housing Development Finance Corporation Ltd. 3.07%
1 Month 6 Months 1 Year 2 Years* 3 Years* Inception* Tata Consultancy Services Ltd. 3.03%
Portfolio return 3.77% 1.39% 2.86% 11.37% 10.25% 8.67% Larsen & Toubro Ltd. 2.80%
Benchmark** 4.01% 2.10% 5.85% 12.22% 10.31% 8.61% Others 24.03%
Goverment Securities 11.78%7.17% GOI 2028 2.50%
Targeted Asset Allocation (%) 6.05% GOI 2019 2.44%
Security Type Min Max 8.4% GOI 2024 1.28%
Money Market & other cash instruments 0.00% 40.00% 6.84% GOI 2022 1.22%
Equity 30.00% 85.00% 8.32% GOI 2032 1.08%
Debt 0.00% 50.00% 9.15% GOI 2024 0.74%
6.90% GOI 2019 0.71%
8.3% GOI 2042 0.64%
7.16% GOI 2023 0.57%
Asset Class Wise AUM 8.33% GOI 2036 0.51%
Asset Class AUM (in Cr.) Others 0.09%
Equity 105.30 Corporate Bonds 7.70%Debt 53.69 Mahindra & Mahindra Ltd. 1.73%
Total 158.99 LIC Housing Finance Ltd. 1.00%
Indiabulls Housing Finance Ltd. 0.93%Modified Duration# Food Corporation of India 0.79%
Security Type Duration Reliance Capital Ltd. 0.72%
Fixed Income Investments 2.78 L&T Fincance Corporation Ltd 0.46%
Adani Ports and Special Economic Zone Ltd. 0.45%
Shriram Transport Finance Co. Ltd. 0.44%
L&T Infra Debt Fund Ltd. 0.31%
Capital First Ltd 0.25%
Others 0.62%
Cash and Money Markets 14.29%Asset Mix Portfolio Total 100.00%
Sectoral Break-Up$
Rating Profile
* Compound Annual Growth Rate (CAGR)
$Sector Classification is as per National Industrial Classification ( All Economic Activities) -2008 NIC
**Benchmark return has been computed by applying benchmark weightages on CRISIL Composite Bond Fund Index and NIFTY 50 INDEX#Duration of Fixed Income Investments is a measure of sensitivity of the assets price to interest rate movement. Shorter the duration lesser is the sensitivity due to movement in interest rates.
Investment Objective: To generate long term capital appreciation with high equity
exposure.
The risk profile for this fund is High
November 2018
The actual asset allocation will remain within the 'minimum' and 'maximum' range based on
market opportunities and future outlook of the markets.
24.40%
1.11%
1.56%
2.97%
4.32%
5.23%
7.56%
8.35%
9.91%
11.78%
22.81%
Others
Warehousing & support activit. fortransp.
Manuf of pharmicals,mdicinl chmcal& btancl pro
Civil engineering
Manf. of tobacco prod.
Manf. of motor vehic ,trailr & semi-trailr
Manf. of coke & refined petrol. prod.
Mutual Funds
Compt prgm, consult. & relatedactivit.
Soveriegn
Financial & insur. activit.
66.23
11.78
7.7 14.29
Equities Goverment Securities Corporate Bonds Cash and Money Markets
Life Unit Linked
Growth Fund-IIULIF01808/01/2010LIGROWT-II122
36.43%57.06%
2.22% 4.29%
Sovereign AAA AA AA+

Fund Details Security Name Net Asset (%)Equities 87.08%Kotak Mahindra Mutual Fund 9.43%Reliance Industries Ltd. 8.98%Infosys Ltd. 6.34%
NAV as on November 30,2018: 24.5451 HDFC Bank Ltd. 6.18%
Inception Date: 08-Jan-10 ITC Ltd. 5.63%
Fund Manager: Jayesh Sundar Housing Development Finance Corporation Ltd. 4.57%
Tata Consultancy Services Ltd. 4.41%
Fund v/s Benchmark Return (%) ICICI Bank Ltd. 4.16%
1 Month 6 Months 1 Year 2 Years* 3 Years* Inception* Larsen & Toubro Ltd. 3.63%
Portfolio return 4.35% 1.23% 3.54% 14.56% 11.80% 10.62% Mahindra & Mahindra Ltd. 2.43%
Benchmark** 4.72% 1.31% 6.36% 15.00% 11.07% 8.54% Others 31.32%
Cash and Money Markets 12.92%Portfolio Total 100.00%
Targeted Asset Allocation (%)Security Type Min MaxMoney Market & Other Cash Instruments 0.00% 40.00%
Equity 60.00% 100.00%
Debt 0.00% 40.00%
Asset Class Wise AUMAsset Class AUM (in Cr.)Equity 314.83
Debt 46.76
Total 361.60
Modified Duration#
Security Type Duration
Fixed Income Investments
Asset Mix
Sectoral Break-Up$
* Compound Annual Growth Rate (CAGR)
$Sector Classification is as per National Industrial Classification ( All Economic Activities) -2008 NIC
**Benchmark for this fund is NIFTY 50 INDEX#Duration of Fixed Income Investments is a measure of sensitivity of the assets price to interest rate movement. Shorter the duration lesser is the sensitivity due to movement in interest rates.
Investment Objective: To provide aggressive, long term capital growth with high equity
exposure.
The risk profile for this fund is High
November 2018
The actual asset allocation will remain within the 'minimum' and 'maximum' range based on
market opportunities and future outlook of the markets.
23.83%
1.45%
1.50%
2.10%
3.84%
4.76%
5.63%
8.98%
10.42%
14.20%
23.29%
Others
Manf. of other transport equipment
Electricity, gas, steam and airconditioning supply
Manuf of pharmicals,mdicinl chmcal& btancl pro
Civil engineering
Manf. of motor vehic ,trailr & semi-trailr
Manf. of tobacco prod.
Manf. of coke & refined petrol. prod.
Mutual Funds
Compt prgm, consult. & relatedactivit.
Financial & insur. activit.
87.08
12.92
Equities Cash and Money Markets
Life Unit Linked
Enhancer Fund-IIULIF01708/01/2010LIFENHN-II122

Fund Details Security Name Net Asset (%)Equities 94.40%Kotak Mahindra Mutual Fund 9.34%Reliance Industries Ltd. 9.20%HDFC Bank Ltd. 6.53%
NAV as on November 30,2018: 20.0969 Infosys Ltd. 6.27%
Inception Date: 08-Jan-10 Housing Development Finance Corporation Ltd. 5.93%
Fund Manager: Jayesh Sundar ITC Ltd. 5.69%
Tata Consultancy Services Ltd. 4.64%
Fund v/s Benchmark Return (%) Larsen & Toubro Ltd. 3.77%
1 Month 6 Months 1 Year 2 Years* 3 Years* Inception* ICICI Bank Ltd. 3.49%
Portfolio return 4.26% 1.13% 5.42% 14.41% 10.68% 8.16% Hindustan Unilever Ltd. 2.17%
Benchmark** 4.72% 1.31% 6.36% 15.00% 11.07% 8.54% Others 37.37%
Cash and Money Markets 5.60%Portfolio Total 100.00%
Targeted Asset Allocation (%)Security Type Min MaxDebt and Money Market Instruments 0.00% 20.00%
Equity 80.00% 100.00%
Asset Class Wise AUMAsset Class AUM (in Cr.)Equity 84.73
Debt 5.06
Total 89.80
Modified Duration#
Security Type Duration
Fixed Income Investments
Asset Mix
Sectoral Break-Up$
* Compound Annual Growth Rate (CAGR)
$Sector Classification is as per National Industrial Classification ( All Economic Activities) -2008 NIC
**Benchmark for this fund is NIFTY 50 INDEX#Duration of Fixed Income Investments is a measure of sensitivity of the assets price to interest rate movement. Shorter the duration lesser is the sensitivity due to movement in interest rates.
Investment Objective: To generate returns in line with the stock market index - NIFTY 50.
The risk profile for this fund is High
November 2018
The actual asset allocation will remain within the 'minimum' and 'maximum' range based on
market opportunities and future outlook of the markets.
18.04%
2.44%
2.69%
3.71%
3.77%
4.82%
5.69%
9.95%
10.34%
14.24%
24.31%
Others
Electricity, gas, steam and airconditioning supply
Manuf of pharmicals,mdicinl chmcal& btancl pro
Manf. of chemic.s & chemic. prod.
Civil engineering
Manf. of motor vehic ,trailr & semi-trailr
Manf. of tobacco prod.
Manf. of coke & refined petrol. prod.
Mutual Funds
Compt prgm, consult. & relatedactivit.
Financial & insur. activit.
94.4
5.6
Equities Cash and Money Markets
Life Unit Linked
Index Fund-IIULIF02008/01/2010LIFINDX-II122
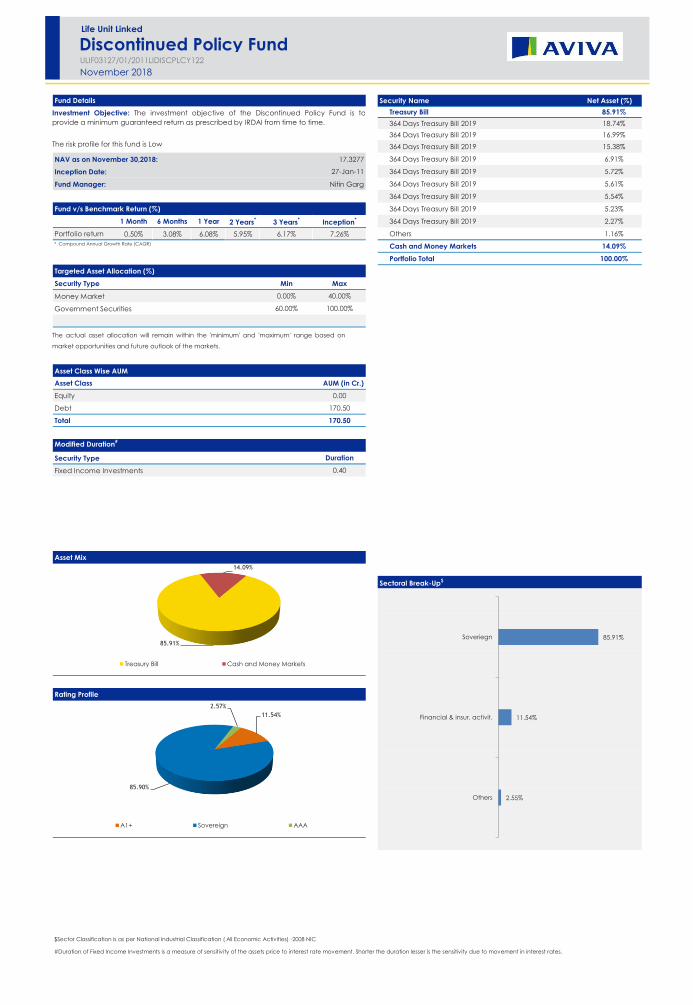
Fund Details Security Name Net Asset (%)Treasury Bill 85.91%364 Days Treasury Bill 2019 18.74%364 Days Treasury Bill 2019 16.99%364 Days Treasury Bill 2019 15.38%
NAV as on November 30,2018: 17.3277 364 Days Treasury Bill 2019 6.91%
Inception Date: 27-Jan-11 364 Days Treasury Bill 2019 5.72%
Fund Manager: Nitin Garg 364 Days Treasury Bill 2019 5.61%
364 Days Treasury Bill 2019 5.54%
Fund v/s Benchmark Return (%) 364 Days Treasury Bill 2019 5.23%
1 Month 6 Months 1 Year 2 Years* 3 Years* Inception* 364 Days Treasury Bill 2019 2.27%
Portfolio return 0.50% 3.08% 6.08% 5.95% 6.17% 7.26% Others 1.16%
Cash and Money Markets 14.09%Portfolio Total 100.00%
Targeted Asset Allocation (%)Security Type Min Max
Money Market 0.00% 40.00%
Government Securities 60.00% 100.00%
Asset Class Wise AUMAsset Class AUM (in Cr.)Equity 0.00
Debt 170.50
Total 170.50
Modified Duration#
Security Type Duration
Fixed Income Investments 0.40
Asset Mix
Sectoral Break-Up$
Rating Profile
$Sector Classification is as per National Industrial Classification ( All Economic Activities) -2008 NIC
#Duration of Fixed Income Investments is a measure of sensitivity of the assets price to interest rate movement. Shorter the duration lesser is the sensitivity due to movement in interest rates.
* Compound Annual Growth Rate (CAGR)
Investment Objective: The investment objective of the Discontinued Policy Fund is toprovide a minimum guaranteed return as prescribed by IRDAI from time to time.
The risk profile for this fund is Low
November 2018
The actual asset allocation will remain within the 'minimum' and 'maximum' range based on
market opportunities and future outlook of the markets.
2.55%
11.54%
85.91%
Others
Financial & insur. activit.
Soveriegn85.91%
14.09%
Treasury Bill Cash and Money Markets
Life Unit Linked
Discontinued Policy FundULIF03127/01/2011LIDISCPLCY122
11.54%
85.90%
2.57%
A1+ Sovereign AAA
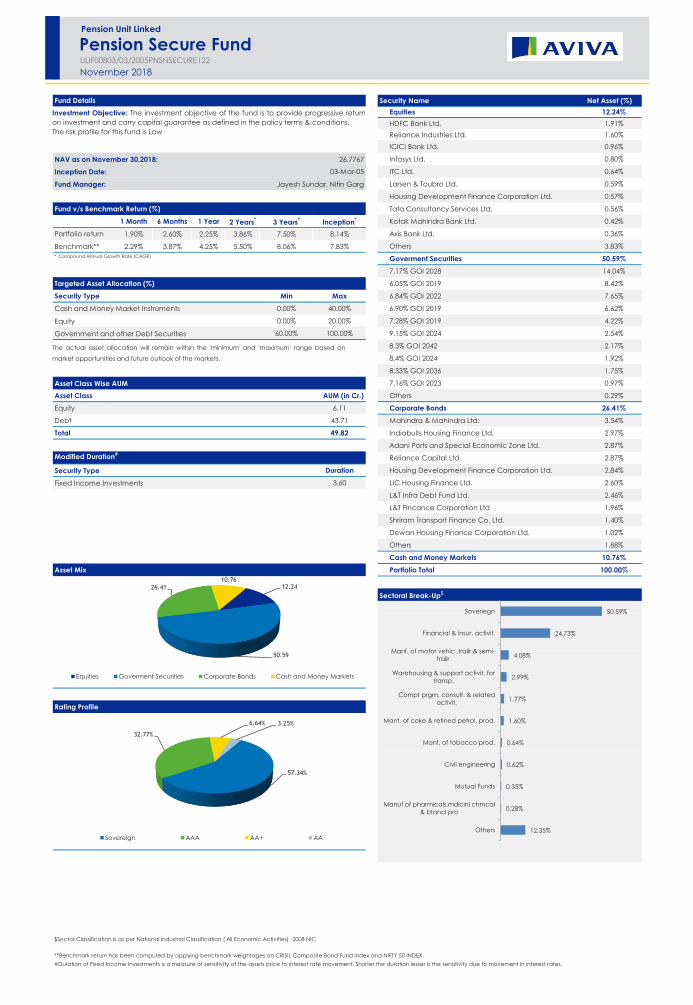
Fund Details Security Name Net Asset (%)Equities 12.24%HDFC Bank Ltd. 1.91%Reliance Industries Ltd. 1.60%ICICI Bank Ltd. 0.96%
NAV as on November 30,2018: 26.7767 Infosys Ltd. 0.80%
Inception Date: 03-Mar-05 ITC Ltd. 0.64%
Fund Manager: Jayesh Sundar, Nitin Garg Larsen & Toubro Ltd. 0.59%
Housing Development Finance Corporation Ltd. 0.57%
Fund v/s Benchmark Return (%) Tata Consultancy Services Ltd. 0.56%
1 Month 6 Months 1 Year 2 Years* 3 Years* Inception* Kotak Mahindra Bank Ltd. 0.42%
Portfolio return 1.90% 2.60% 2.25% 3.86% 7.50% 8.14% Axis Bank Ltd. 0.36%
Benchmark** 2.29% 3.87% 4.25% 5.50% 8.06% 7.83% Others 3.83%
Goverment Securities 50.59%7.17% GOI 2028 14.04%
Targeted Asset Allocation (%) 6.05% GOI 2019 8.42%
Security Type Min Max 6.84% GOI 2022 7.65%
Cash and Money Market Instruments 0.00% 40.00% 6.90% GOI 2019 6.62%
Equity 0.00% 20.00% 7.28% GOI 2019 4.22%
Government and other Debt Securities 60.00% 100.00% 9.15% GOI 2024 2.54%
8.3% GOI 2042 2.17%
8.4% GOI 2024 1.92%
8.33% GOI 2036 1.75%
Asset Class Wise AUM 7.16% GOI 2023 0.97%
Asset Class AUM (in Cr.) Others 0.29%
Equity 6.11 Corporate Bonds 26.41%Debt 43.71 Mahindra & Mahindra Ltd. 3.54%
Total 49.82 Indiabulls Housing Finance Ltd. 2.97%
Adani Ports and Special Economic Zone Ltd. 2.87%Modified Duration# Reliance Capital Ltd. 2.87%
Security Type Duration Housing Development Finance Corporation Ltd. 2.84%
Fixed Income Investments 3.60 LIC Housing Finance Ltd. 2.60%
L&T Infra Debt Fund Ltd. 2.46%
L&T Fincance Corporation Ltd 1.96%
Shriram Transport Finance Co. Ltd. 1.40%
Dewan Housing Finance Corporation Ltd. 1.02%
Others 1.88%
Cash and Money Markets 10.76%Asset Mix Portfolio Total 100.00%
Sectoral Break-Up$
Rating Profile
* Compound Annual Growth Rate (CAGR)
$Sector Classification is as per National Industrial Classification ( All Economic Activities) -2008 NIC
**Benchmark return has been computed by applying benchmark weightages on CRISIL Composite Bond Fund Index and NIFTY 50 INDEX#Duration of Fixed Income Investments is a measure of sensitivity of the assets price to interest rate movement. Shorter the duration lesser is the sensitivity due to movement in interest rates.
Investment Objective: The investment objective of the fund is to provide progressive returnon investment and carry capital guarantee as defined in the policy terms & conditions.The risk profile for this fund is Low
November 2018
The actual asset allocation will remain within the 'minimum' and 'maximum' range based on
market opportunities and future outlook of the markets.
12.35%
0.28%
0.35%
0.62%
0.64%
1.60%
1.77%
2.99%
4.08%
24.73%
50.59%
Others
Manuf of pharmicals,mdicinl chmcal& btancl pro
Mutual Funds
Civil engineering
Manf. of tobacco prod.
Manf. of coke & refined petrol. prod.
Compt prgm, consult. & relatedactivit.
Warehousing & support activit. fortransp.
Manf. of motor vehic ,trailr & semi-trailr
Financial & insur. activit.
Soveriegn
12.24
50.59
26.4110.76
Equities Goverment Securities Corporate Bonds Cash and Money Markets
Pension Unit Linked
Pension Secure FundULIF00803/03/2005PNSNSECURE122
57.34%
32.77%
6.64% 3.25%
Sovereign AAA AA+ AA

Fund Details Security Name Net Asset (%)Equities 12.27%HDFC Bank Ltd. 1.93%Reliance Industries Ltd. 1.51%ICICI Bank Ltd. 0.96%
NAV as on November 30,2018: 22.1402 Infosys Ltd. 0.81%
Inception Date: 08-Feb-08 ITC Ltd. 0.61%
Fund Manager: Jayesh Sundar, Nitin Garg Larsen & Toubro Ltd. 0.59%
Housing Development Finance Corporation Ltd. 0.57%
Fund v/s Benchmark Return (%) Tata Consultancy Services Ltd. 0.56%
1 Month 6 Months 1 Year 2 Years* 3 Years* Inception* Kotak Mahindra Bank Ltd. 0.43%
Portfolio return 1.97% 2.55% 1.91% 3.64% 7.34% 7.62% Axis Bank Ltd. 0.37%
Benchmark** 2.29% 3.87% 4.25% 5.50% 8.06% 7.32% Others 3.93%
Goverment Securities 32.50%6.05% GOI 2019 6.78%
Targeted Asset Allocation (%) 7.17% GOI 2028 6.16%
Security Type Min Max 7.28% GOI 2019 4.30%
Cash and Money Market Instruments 0.00% 40.00% 6.90% GOI 2019 4.24%
Equity 0.00% 20.00% 6.84% GOI 2022 4.21%
Government and other Debt Securities 60.00% 100.00% 9.15% GOI 2024 2.57%
8.3% GOI 2042 2.15%
8.33% GOI 2036 1.78%
8.08% GOI 2022 0.31%
Asset Class Wise AUM Corporate Bonds 42.77%Asset Class AUM (in Cr.) Mahindra & Mahindra Ltd. 7.16%
Equity 2.46 Housing Development Finance Corporation Ltd. 5.54%
Debt 17.56 Adani Ports and Special Economic Zone Ltd. 4.59%
Total 20.02 Reliance Capital Ltd. 2.86%
Indian Railway Finance Corporation Ltd. 2.57%Modified Duration# L&T Infra Debt Fund Ltd. 2.45%
Security Type Duration L&T Fincance Corporation Ltd 2.44%
Fixed Income Investments 3.66 Dewan Housing Finance Corporation Ltd. 2.04%
LIC Housing Finance Ltd. 1.98%
Indiabulls Housing Finance Ltd. 1.97%
Others 9.17%
Cash and Money Markets 12.46%Portfolio Total 100.00%
Asset Mix
Sectoral Break-Up$
Rating Profile
* Compound Annual Growth Rate (CAGR)
$Sector Classification is as per National Industrial Classification ( All Economic Activities) -2008 NIC
**Benchmark return has been computed by applying benchmark weightages on CRISIL Composite Bond Fund Index and NIFTY 50 INDEX#Duration of Fixed Income Investments is a measure of sensitivity of the assets price to interest rate movement. Shorter the duration lesser is the sensitivity due to movement in interest rates.
Investment Objective: Progressive return on your investment by investing majority portion in
debt securities, with a minimum exposure to equities
The risk profile for this fund is Low
November 2018
The actual asset allocation will remain within the 'minimum' and 'maximum' range based on
market opportunities and future outlook of the markets.
14.08%
0.28%
0.36%
0.61%
0.63%
1.51%
1.80%
4.71%
7.71%
32.50%
35.81%
Others
Manuf of pharmicals,mdicinl chmcal& btancl pro
Mutual Funds
Manf. of tobacco prod.
Civil engineering
Manf. of coke & refined petrol. prod.
Compt prgm, consult. & relatedactivit.
Warehousing & support activit. fortransp.
Manf. of motor vehic ,trailr & semi-trailr
Soveriegn
Financial & insur. activit.
12.27
32.5
42.77
12.46
Equities Goverment Securities Corporate Bonds Cash and Money Markets
Pension Unit Linked
Pension Protector FundULIF01408/02/2008PNSPROTECT122
36.94%48.92%
9.16%
4.99%
Sovereign AAA AA+ AA
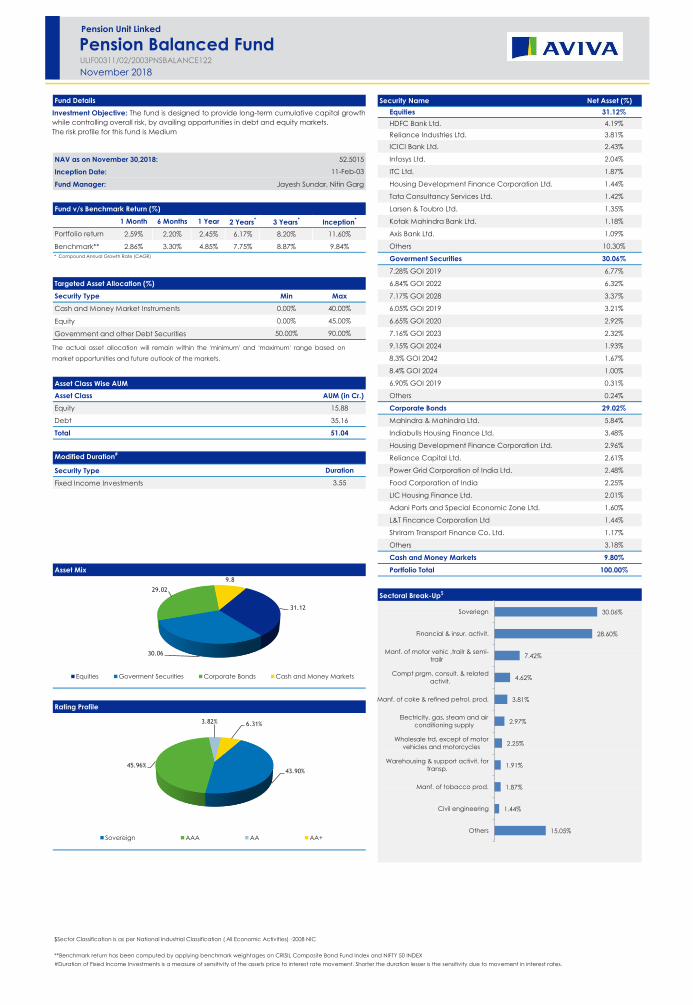
Fund Details Security Name Net Asset (%)Equities 31.12%HDFC Bank Ltd. 4.19%Reliance Industries Ltd. 3.81%ICICI Bank Ltd. 2.43%
NAV as on November 30,2018: 52.5015 Infosys Ltd. 2.04%
Inception Date: 11-Feb-03 ITC Ltd. 1.87%
Fund Manager: Jayesh Sundar, Nitin Garg Housing Development Finance Corporation Ltd. 1.44%
Tata Consultancy Services Ltd. 1.42%
Fund v/s Benchmark Return (%) Larsen & Toubro Ltd. 1.35%
1 Month 6 Months 1 Year 2 Years* 3 Years* Inception* Kotak Mahindra Bank Ltd. 1.18%
Portfolio return 2.59% 2.20% 2.45% 6.17% 8.20% 11.60% Axis Bank Ltd. 1.09%
Benchmark** 2.86% 3.30% 4.85% 7.75% 8.87% 9.84% Others 10.30%
Goverment Securities 30.06%7.28% GOI 2019 6.77%
Targeted Asset Allocation (%) 6.84% GOI 2022 6.32%
Security Type Min Max 7.17% GOI 2028 3.37%
Cash and Money Market Instruments 0.00% 40.00% 6.05% GOI 2019 3.21%
Equity 0.00% 45.00% 6.65% GOI 2020 2.92%
Government and other Debt Securities 50.00% 90.00% 7.16% GOI 2023 2.32%
9.15% GOI 2024 1.93%
8.3% GOI 2042 1.67%
8.4% GOI 2024 1.00%
Asset Class Wise AUM 6.90% GOI 2019 0.31%
Asset Class AUM (in Cr.) Others 0.24%
Equity 15.88 Corporate Bonds 29.02%Debt 35.16 Mahindra & Mahindra Ltd. 5.84%
Total 51.04 Indiabulls Housing Finance Ltd. 3.48%
Housing Development Finance Corporation Ltd. 2.96%Modified Duration# Reliance Capital Ltd. 2.61%
Security Type Duration Power Grid Corporation of India Ltd. 2.48%
Fixed Income Investments 3.55 Food Corporation of India 2.25%
LIC Housing Finance Ltd. 2.01%
Adani Ports and Special Economic Zone Ltd. 1.60%
L&T Fincance Corporation Ltd 1.44%
Shriram Transport Finance Co. Ltd. 1.17%
Others 3.18%
Cash and Money Markets 9.80%Asset Mix Portfolio Total 100.00%
Sectoral Break-Up$
Rating Profile
* Compound Annual Growth Rate (CAGR)
$Sector Classification is as per National Industrial Classification ( All Economic Activities) -2008 NIC
**Benchmark return has been computed by applying benchmark weightages on CRISIL Composite Bond Fund Index and NIFTY 50 INDEX#Duration of Fixed Income Investments is a measure of sensitivity of the assets price to interest rate movement. Shorter the duration lesser is the sensitivity due to movement in interest rates.
Investment Objective: The fund is designed to provide long-term cumulative capital growthwhile controlling overall risk, by availing opportunities in debt and equity markets.The risk profile for this fund is Medium
November 2018
The actual asset allocation will remain within the 'minimum' and 'maximum' range based on
market opportunities and future outlook of the markets.
15.05%
1.44%
1.87%
1.91%
2.25%
2.97%
3.81%
4.62%
7.42%
28.60%
30.06%
Others
Civil engineering
Manf. of tobacco prod.
Warehousing & support activit. fortransp.
Wholesale trd, except of motorvehicles and motorcycles
Electricity, gas, steam and airconditioning supply
Manf. of coke & refined petrol. prod.
Compt prgm, consult. & relatedactivit.
Manf. of motor vehic ,trailr & semi-trailr
Financial & insur. activit.
Soveriegn31.12
30.06
29.02
9.8
Equities Goverment Securities Corporate Bonds Cash and Money Markets
Pension Unit Linked
Pension Balanced FundULIF00311/02/2003PNSBALANCE122
43.90%45.96%
3.82% 6.31%
Sovereign AAA AA AA+
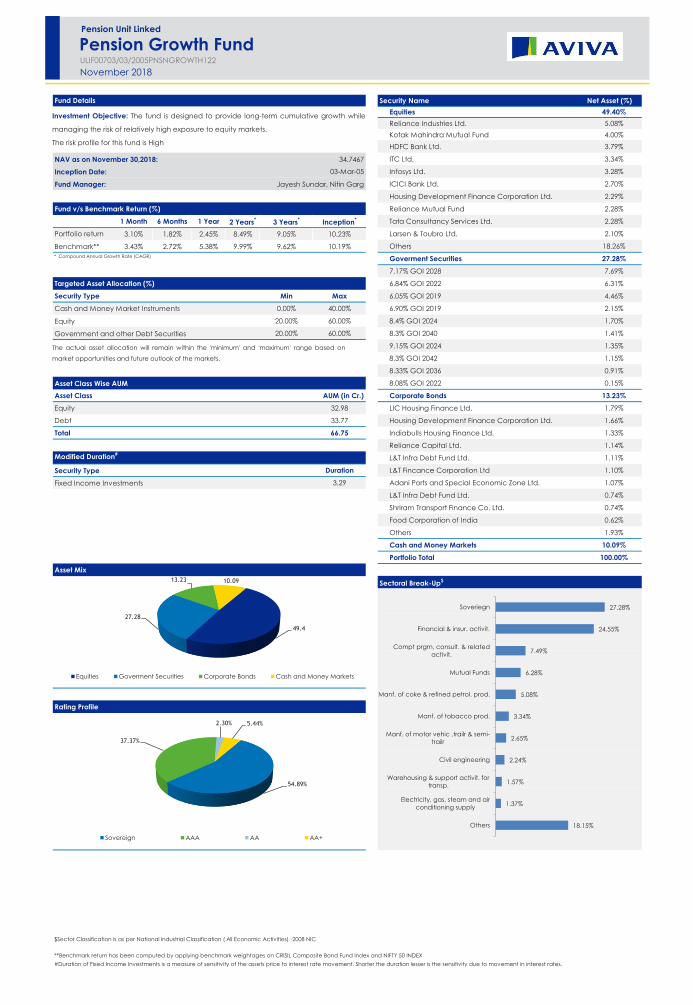
Fund Details Security Name Net Asset (%)Equities 49.40%Reliance Industries Ltd. 5.08%Kotak Mahindra Mutual Fund 4.00%HDFC Bank Ltd. 3.79%
NAV as on November 30,2018: 34.7467 ITC Ltd. 3.34%
Inception Date: 03-Mar-05 Infosys Ltd. 3.28%
Fund Manager: Jayesh Sundar, Nitin Garg ICICI Bank Ltd. 2.70%
Housing Development Finance Corporation Ltd. 2.29%
Fund v/s Benchmark Return (%) Reliance Mutual Fund 2.28%
1 Month 6 Months 1 Year 2 Years* 3 Years* Inception* Tata Consultancy Services Ltd. 2.28%
Portfolio return 3.10% 1.82% 2.45% 8.49% 9.05% 10.23% Larsen & Toubro Ltd. 2.10%
Benchmark** 3.43% 2.72% 5.38% 9.99% 9.62% 10.19% Others 18.26%
Goverment Securities 27.28%7.17% GOI 2028 7.69%
Targeted Asset Allocation (%) 6.84% GOI 2022 6.31%
Security Type Min Max 6.05% GOI 2019 4.46%
Cash and Money Market Instruments 0.00% 40.00% 6.90% GOI 2019 2.15%
Equity 20.00% 60.00% 8.4% GOI 2024 1.70%
Government and other Debt Securities 20.00% 60.00% 8.3% GOI 2040 1.41%
9.15% GOI 2024 1.35%
8.3% GOI 2042 1.15%
8.33% GOI 2036 0.91%
Asset Class Wise AUM 8.08% GOI 2022 0.15%
Asset Class AUM (in Cr.) Corporate Bonds 13.23%Equity 32.98 LIC Housing Finance Ltd. 1.79%
Debt 33.77 Housing Development Finance Corporation Ltd. 1.66%
Total 66.75 Indiabulls Housing Finance Ltd. 1.33%
Reliance Capital Ltd. 1.14%Modified Duration# L&T Infra Debt Fund Ltd. 1.11%
Security Type Duration L&T Fincance Corporation Ltd 1.10%
Fixed Income Investments 3.29 Adani Ports and Special Economic Zone Ltd. 1.07%
L&T Infra Debt Fund Ltd. 0.74%
Shriram Transport Finance Co. Ltd. 0.74%
Food Corporation of India 0.62%
Others 1.93%
Cash and Money Markets 10.09%Portfolio Total 100.00%
Asset Mix
Sectoral Break-Up$
Rating Profile
* Compound Annual Growth Rate (CAGR)
$Sector Classification is as per National Industrial Classification ( All Economic Activities) -2008 NIC
**Benchmark return has been computed by applying benchmark weightages on CRISIL Composite Bond Fund Index and NIFTY 50 INDEX#Duration of Fixed Income Investments is a measure of sensitivity of the assets price to interest rate movement. Shorter the duration lesser is the sensitivity due to movement in interest rates.
Investment Objective: The fund is designed to provide long-term cumulative growth while
managing the risk of relatively high exposure to equity markets.
The risk profile for this fund is High
November 2018
The actual asset allocation will remain within the 'minimum' and 'maximum' range based on
market opportunities and future outlook of the markets.
18.15%
1.37%
1.57%
2.24%
2.65%
3.34%
5.08%
6.28%
7.49%
24.55%
27.28%
Others
Electricity, gas, steam and airconditioning supply
Warehousing & support activit. fortransp.
Civil engineering
Manf. of motor vehic ,trailr & semi-trailr
Manf. of tobacco prod.
Manf. of coke & refined petrol. prod.
Mutual Funds
Compt prgm, consult. & relatedactivit.
Financial & insur. activit.
Soveriegn
49.4
27.28
13.23 10.09
Equities Goverment Securities Corporate Bonds Cash and Money Markets
Pension Unit Linked
Pension Growth FundULIF00703/03/2005PNSNGROWTH122
54.89%
37.37%
2.30% 5.44%
Sovereign AAA AA AA+

Fund Details Security Name Net Asset (%)Equities 95.47%Kotak Mahindra Mutual Fund 9.49%Reliance Industries Ltd. 9.32%HDFC Bank Ltd. 6.72%
NAV as on November 30,2018: 22.6447 Infosys Ltd. 6.26%
Inception Date: 22-Jan-08 Housing Development Finance Corporation Ltd. 5.96%
Fund Manager: Jayesh Sundar ITC Ltd. 5.76%
Tata Consultancy Services Ltd. 4.64%
Fund v/s Benchmark Return (%) Larsen & Toubro Ltd. 3.82%
1 Month 6 Months 1 Year 2 Years* 3 Years* Inception* ICICI Bank Ltd. 3.54%
Portfolio return 4.35% 1.55% 6.16% 15.12% 11.30% 7.86% Mahindra & Mahindra Ltd. 2.23%
Benchmark** 4.72% 1.31% 6.36% 15.00% 11.07% 7.62% Others 37.73%
Cash and Money Markets 4.53%Portfolio Total 100.00%
Targeted Asset Allocation (%)Security Type Min MaxDebt Securities Incl. Money Market Instruments 0.00% 20.00%
Equity 80.00% 100.00%
Asset Class Wise AUMAsset Class AUM (in Cr.)Equity 120.16
Debt 5.73
Total 125.89
Modified Duration#
Security Type Duration
Fixed Income Investments
Asset Mix
Sectoral Break-Up$
* Compound Annual Growth Rate (CAGR)
$Sector Classification is as per National Industrial Classification ( All Economic Activities) -2008 NIC
**Benchmark for this fund is NIFTY 50 INDEX#Duration of Fixed Income Investments is a measure of sensitivity of the assets price to interest rate movement. Shorter the duration lesser is the sensitivity due to movement in interest rates.
Investment Objective: The investment objective of this fund is to generate returns in line with
the stock market index - NIFTY 50
The risk profile for this fund is High
November 2018
The actual asset allocation will remain within the 'minimum' and 'maximum' range based on
market opportunities and future outlook of the markets.
17.10%
2.44%
2.76%
3.76%
3.82%
4.90%
5.76%
10.07%
10.51%
14.24%
24.64%
Others
Electricity, gas, steam and airconditioning supply
Manuf of pharmicals,mdicinl chmcal& btancl pro
Manf. of chemic.s & chemic. prod.
Civil engineering
Manf. of motor vehic ,trailr & semi-trailr
Manf. of tobacco prod.
Manf. of coke & refined petrol. prod.
Mutual Funds
Compt prgm, consult. & relatedactivit.
Financial & insur. activit.
95.47
4.53
Equities Cash and Money Markets
Pension Unit Linked
Pension Index FundULIF01122/01/2008PNSNINDEXF122
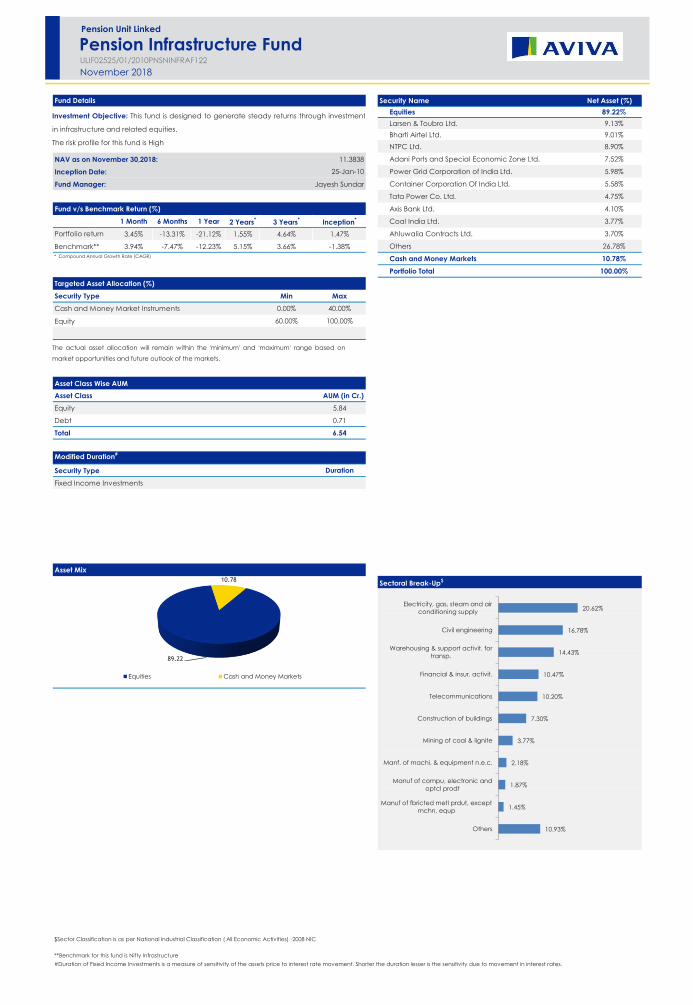
Fund Details Security Name Net Asset (%)Equities 89.22%Larsen & Toubro Ltd. 9.13%Bharti Airtel Ltd. 9.01%NTPC Ltd. 8.90%
NAV as on November 30,2018: 11.3838 Adani Ports and Special Economic Zone Ltd. 7.52%
Inception Date: 25-Jan-10 Power Grid Corporation of India Ltd. 5.98%
Fund Manager: Jayesh Sundar Container Corporation Of India Ltd. 5.58%
Tata Power Co. Ltd. 4.75%
Fund v/s Benchmark Return (%) Axis Bank Ltd. 4.10%
1 Month 6 Months 1 Year 2 Years* 3 Years* Inception* Coal India Ltd. 3.77%
Portfolio return 3.45% -13.31% -21.12% 1.55% 4.64% 1.47% Ahluwalia Contracts Ltd. 3.70%
Benchmark** 3.94% -7.47% -12.23% 5.15% 3.66% -1.38% Others 26.78%
Cash and Money Markets 10.78%Portfolio Total 100.00%
Targeted Asset Allocation (%)Security Type Min MaxCash and Money Market Instruments 0.00% 40.00%
Equity 60.00% 100.00%
Asset Class Wise AUMAsset Class AUM (in Cr.)Equity 5.84
Debt 0.71
Total 6.54
Modified Duration#
Security Type Duration
Fixed Income Investments
Asset Mix
Sectoral Break-Up$
* Compound Annual Growth Rate (CAGR)
$Sector Classification is as per National Industrial Classification ( All Economic Activities) -2008 NIC
**Benchmark for this fund is Nifty Infrastructure#Duration of Fixed Income Investments is a measure of sensitivity of the assets price to interest rate movement. Shorter the duration lesser is the sensitivity due to movement in interest rates.
Investment Objective: This fund is designed to generate steady returns through investment
in infrastructure and related equities.
The risk profile for this fund is High
November 2018
The actual asset allocation will remain within the 'minimum' and 'maximum' range based on
market opportunities and future outlook of the markets.
10.93%
1.45%
1.87%
2.18%
3.77%
7.30%
10.20%
10.47%
14.43%
16.78%
20.62%
Others
Manuf of fbricted metl prdut, exceptmchn, equp
Manuf of compu, electronic andoptcl prodt
Manf. of machi. & equipment n.e.c.
Mining of coal & lignite
Construction of buildings
Telecommunications
Financial & insur. activit.
Warehousing & support activit. fortransp.
Civil engineering
Electricity, gas, steam and airconditioning supply
89.22
10.78
Equities Cash and Money Markets
Pension Unit Linked
Pension Infrastructure FundULIF02525/01/2010PNSNINFRAF122

Fund Details Security Name Net Asset (%)Equities 93.99%State Bank of India 10.05%NTPC Ltd. 9.09%Oil & Natural Gas Corpn Ltd. 8.15%
NAV as on November 30,2018: 12.3256 Coal India Ltd. 8.04%
Inception Date: 25-Jan-10 Gail (India) Ltd. 6.69%
Fund Manager: Jayesh Sundar National Mineral Development Corporation Ltd. 5.64%
Oil India Ltd. 5.64%
Fund v/s Benchmark Return (%) Gujarat State Petronet Ltd. 4.79%
1 Month 6 Months 1 Year 2 Years* 3 Years* Inception* Container Corporation Of India Ltd. 4.77%
Portfolio return -3.64% -13.36% -23.35% -3.17% 4.99% 2.39% Bharat Petroleum Corporation Ltd. 4.17%
Benchmark** -3.39% -13.34% -25.51% -6.83% -0.20% -3.89% Others 26.96%
Cash and Money Markets 6.01%Portfolio Total 100.00%
Targeted Asset Allocation (%)Security Type Min MaxCash and Money Market Instruments 0.00% 40.00%
Equity 60.00% 100.00%
Asset Class Wise AUMAsset Class AUM (in Cr.)Equity 13.30
Debt 0.85
Total 14.15
Modified Duration#
Security Type Duration
Fixed Income Investments
Asset Mix
Sectoral Break-Up$
* Compound Annual Growth Rate (CAGR)
$Sector Classification is as per National Industrial Classification ( All Economic Activities) -2008 NIC
**Benchmark for this fund is BSE PSU Index#Duration of Fixed Income Investments is a measure of sensitivity of the assets price to interest rate movement. Shorter the duration lesser is the sensitivity due to movement in interest rates.
Investment Objective: This fund is designed to generate steady returns through investment
in PSU and related equities.
The risk profile for this fund is High
November 2018
The actual asset allocation will remain within the 'minimum' and 'maximum' range based on
market opportunities and future outlook of the markets.
7.65%
2.00%
2.32%
4.77%
4.79%
5.64%
8.04%
8.32%
13.79%
20.63%
22.05%
Others
Specialized construction activities
Manf. of basic metals
Warehousing & support activit. fortransp.
Land Transport & Transport ViaPipelines
Mining of metal ores
Mining of coal & lignite
Manf. of coke & refined petrol. prod.
Extrac. of crude petrol. & natural gas
Financial & insur. activit.
Electricity, gas, steam and airconditioning supply
93.99
6.01
Equities Cash and Money Markets
Pension Unit Linked
Pension PSU FundULIF02725/01/2010PNSNPSUFND122

Fund Details Security Name Net Asset (%)Equities 12.55%HDFC Bank Ltd. 1.97%Reliance Industries Ltd. 1.55%ICICI Bank Ltd. 0.98%
NAV as on November 30,2018: 19.2600 Infosys Ltd. 0.82%
Inception Date: 08-Jan-10 ITC Ltd. 0.78%
Fund Manager: Jayesh Sundar, Nitin Garg Larsen & Toubro Ltd. 0.60%
Housing Development Finance Corporation Ltd. 0.58%
Fund v/s Benchmark Return (%) Tata Consultancy Services Ltd. 0.57%
1 Month 6 Months 1 Year 2 Years* 3 Years* Inception* Kotak Mahindra Bank Ltd. 0.42%
Portfolio return 1.75% 1.96% 0.86% 2.80% 6.52% 7.69% Axis Bank Ltd. 0.37%
Benchmark** 2.29% 3.87% 4.25% 5.50% 8.06% 8.14% Others 3.91%
Goverment Securities 36.21%6.05% GOI 2019 8.34%
Targeted Asset Allocation (%) 6.65% GOI 2020 7.11%
Security Type Min Max 8.79% Gujarat SDL 2022 6.10%
Debt and Money Market Instruments 80.00% 100.00% 7.17% GOI 2028 4.41%
Equity 0.00% 20.00% 6.84% GOI 2022 4.21%
9.15% GOI 2024 2.56%
8.3% GOI 2042 2.25%
8.4% GOI 2024 0.99%
8.08% GOI 2022 0.24%
Asset Class Wise AUM Corporate Bonds 33.26%Asset Class AUM (in Cr.) Mahindra & Mahindra Ltd. 7.90%
Equity 0.53 Reliance Capital Ltd. 6.82%
Debt 3.66 L&T Infra Debt Fund Ltd. 5.86%
Total 4.19 Dewan Housing Finance Corporation Ltd. 4.86%
Shriram Transport Finance Co. Ltd. 2.37%Modified Duration# Capital First Ltd 2.36%
Security Type Duration Indiabulls Housing Finance Ltd. 2.36%
Fixed Income Investments 3.67 Indiabulls Housing Finance Ltd. 0.73%
Cash and Money Markets 17.98%Portfolio Total 100.00%
Asset Mix
Sectoral Break-Up$
Rating Profile
* Compound Annual Growth Rate (CAGR)
$Sector Classification is as per National Industrial Classification ( All Economic Activities) -2008 NIC
**Benchmark return has been computed by applying benchmark weightages on CRISIL Composite Bond Fund Index and NIFTY 50 INDEX#Duration of Fixed Income Investments is a measure of sensitivity of the assets price to interest rate movement. Shorter the duration lesser is the sensitivity due to movement in interest rates.
Investment Objective: Progressive return on your investment by investing majority portion in
debt securities, with a minimum exposure to equities
The risk profile for this fund is Low
November 2018
The actual asset allocation will remain within the 'minimum' and 'maximum' range based on
market opportunities and future outlook of the markets.
19.52%
0.20%
0.28%
0.37%
0.64%
0.78%
1.55%
1.82%
8.44%
30.19%
36.21%
Others
Electricity, gas, steam and airconditioning supply
Manuf of pharmicals,mdicinl chmcal& btancl pro
Mutual Funds
Civil engineering
Manf. of tobacco prod.
Manf. of coke & refined petrol. prod.
Compt prgm, consult. & relatedactivit.
Manf. of motor vehic ,trailr & semi-trailr
Financial & insur. activit.
Soveriegn
12.55
36.21
33.26
17.98
Equities Goverment Securities Corporate Bonds Cash and Money Markets
Pension Unit Linked
Pension Protector Fund-IIULIF02825/01/2010PNPROTE-II122
40.92%
46.03%
7.71% 5.34%
Sovereign AAA AA AA+

Fund Details Security Name Net Asset (%)Equities 30.90%HDFC Bank Ltd. 4.55%Reliance Industries Ltd. 3.76%ICICI Bank Ltd. 2.41%
NAV as on November 30,2018: 19.3667 Infosys Ltd. 2.02%
Inception Date: 25-Jan-10 ITC Ltd. 1.71%
Fund Manager: Jayesh Sundar, Nitin Garg Housing Development Finance Corporation Ltd. 1.43%
Tata Consultancy Services Ltd. 1.40%
Fund v/s Benchmark Return (%) Larsen & Toubro Ltd. 1.27%
1 Month 6 Months 1 Year 2 Years* 3 Years* Inception* Kotak Mahindra Bank Ltd. 1.16%
Portfolio return 2.66% 2.33% 2.20% 5.89% 8.15% 7.75% Axis Bank Ltd. 1.09%
Benchmark** 2.86% 3.30% 4.85% 7.75% 8.87% 8.64% Others 10.10%
Goverment Securities 27.34%7.17% GOI 2028 7.40%
Targeted Asset Allocation (%) 6.05% GOI 2019 6.44%
Security Type Min Max 6.84% GOI 2022 3.45%
Debt and Money Market Instruments 55.00% 100.00% 6.90% GOI 2019 3.12%
Equity 0.00% 45.00% 8.79% Gujarat SDL 2022 2.50%
8.4% GOI 2024 2.34%
9.15% GOI 2024 1.89%
8.08% GOI 2022 0.20%
Corporate Bonds 24.82%
Asset Class Wise AUM Mahindra & Mahindra Ltd. 6.47%
Asset Class AUM (in Cr.) Indiabulls Housing Finance Ltd. 3.86%
Equity 3.16 Housing Development Finance Corporation Ltd. 2.96%
Debt 7.07 LIC Housing Finance Ltd. 2.92%
Total 10.24 L&T Infra Debt Fund Ltd. 2.41%
Adani Ports and Special Economic Zone Ltd. 2.00%Modified Duration# Dewan Housing Finance Corporation Ltd. 1.00%
Security Type Duration Capital First Ltd 0.97%
Fixed Income Investments 3.28 Shriram Transport Finance Co. Ltd. 0.97%
Capital First Ltd 0.96%
Others 0.30%
Cash and Money Markets 16.94%Portfolio Total 100.00%
Asset Mix
Sectoral Break-Up$
Rating Profile
* Compound Annual Growth Rate (CAGR)
$Sector Classification is as per National Industrial Classification ( All Economic Activities) -2008 NIC
**Benchmark return has been computed by applying benchmark weightages on CRISIL Composite Bond Fund Index and NIFTY 50 INDEX#Duration of Fixed Income Investments is a measure of sensitivity of the assets price to interest rate movement. Shorter the duration lesser is the sensitivity due to movement in interest rates.
Investment Objective: The fund is designed to provide long-term cumulative capital growthwhile controlling overall risk, by availing opportunities in debt and equity markets.The risk profile for this fund is Medium
November 2018
The actual asset allocation will remain within the 'minimum' and 'maximum' range based on
market opportunities and future outlook of the markets.
21.16%
0.67%
0.82%
1.37%
1.71%
2.31%
3.76%
4.55%
7.94%
27.34%
28.37%
Others
Manuf of pharmicals,mdicinl chmcal& btancl pro
Mutual Funds
Civil engineering
Manf. of tobacco prod.
Warehousing & support activit. fortransp.
Manf. of coke & refined petrol. prod.
Compt prgm, consult. & relatedactivit.
Manf. of motor vehic ,trailr & semi-trailr
Soveriegn
Financial & insur. activit.30.9
27.34
24.82
16.94
Equities Goverment Securities Corporate Bonds Cash and Money Markets
Pension Unit Linked
Pension Balanced Fund-IIULIF02325/01/2010PNBALAN-II122
40.42%52.33%
7.25%
Sovereign AAA AA+
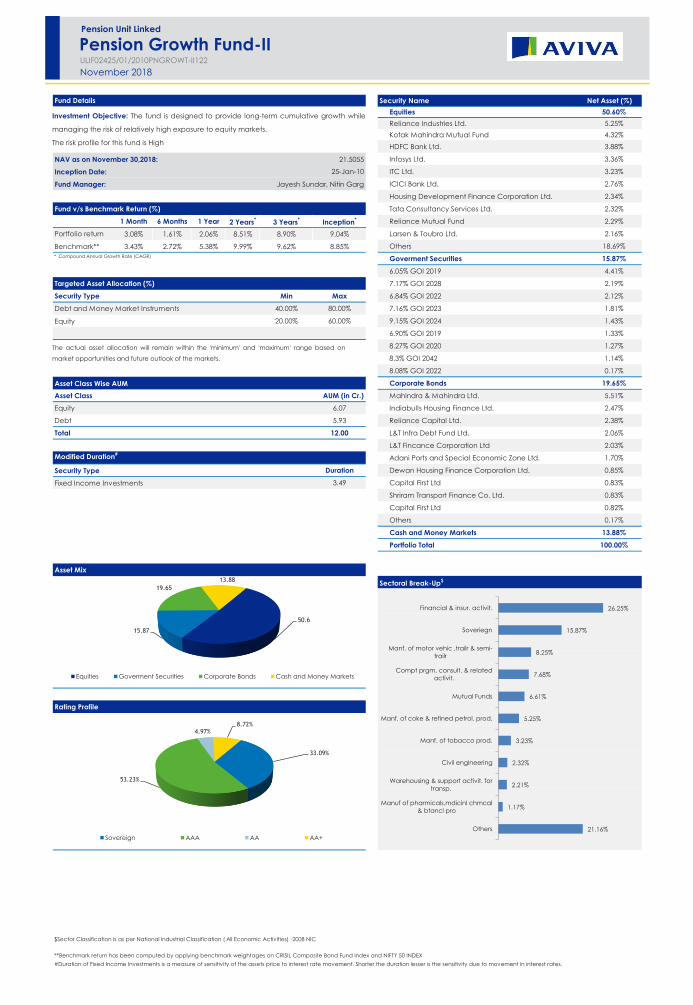
Fund Details Security Name Net Asset (%)Equities 50.60%Reliance Industries Ltd. 5.25%Kotak Mahindra Mutual Fund 4.32%HDFC Bank Ltd. 3.88%
NAV as on November 30,2018: 21.5055 Infosys Ltd. 3.36%
Inception Date: 25-Jan-10 ITC Ltd. 3.23%
Fund Manager: Jayesh Sundar, Nitin Garg ICICI Bank Ltd. 2.76%
Housing Development Finance Corporation Ltd. 2.34%
Fund v/s Benchmark Return (%) Tata Consultancy Services Ltd. 2.32%
1 Month 6 Months 1 Year 2 Years* 3 Years* Inception* Reliance Mutual Fund 2.29%
Portfolio return 3.08% 1.61% 2.06% 8.51% 8.90% 9.04% Larsen & Toubro Ltd. 2.16%
Benchmark** 3.43% 2.72% 5.38% 9.99% 9.62% 8.85% Others 18.69%
Goverment Securities 15.87%6.05% GOI 2019 4.41%
Targeted Asset Allocation (%) 7.17% GOI 2028 2.19%
Security Type Min Max 6.84% GOI 2022 2.12%
Debt and Money Market Instruments 40.00% 80.00% 7.16% GOI 2023 1.81%
Equity 20.00% 60.00% 9.15% GOI 2024 1.43%
6.90% GOI 2019 1.33%
8.27% GOI 2020 1.27%
8.3% GOI 2042 1.14%
8.08% GOI 2022 0.17%
Asset Class Wise AUM Corporate Bonds 19.65%Asset Class AUM (in Cr.) Mahindra & Mahindra Ltd. 5.51%
Equity 6.07 Indiabulls Housing Finance Ltd. 2.47%
Debt 5.93 Reliance Capital Ltd. 2.38%
Total 12.00 L&T Infra Debt Fund Ltd. 2.06%
L&T Fincance Corporation Ltd 2.03%Modified Duration# Adani Ports and Special Economic Zone Ltd. 1.70%
Security Type Duration Dewan Housing Finance Corporation Ltd. 0.85%
Fixed Income Investments 3.49 Capital First Ltd 0.83%
Shriram Transport Finance Co. Ltd. 0.83%
Capital First Ltd 0.82%
Others 0.17%
Cash and Money Markets 13.88%Portfolio Total 100.00%
Asset Mix
Sectoral Break-Up$
Rating Profile
* Compound Annual Growth Rate (CAGR)
$Sector Classification is as per National Industrial Classification ( All Economic Activities) -2008 NIC
**Benchmark return has been computed by applying benchmark weightages on CRISIL Composite Bond Fund Index and NIFTY 50 INDEX#Duration of Fixed Income Investments is a measure of sensitivity of the assets price to interest rate movement. Shorter the duration lesser is the sensitivity due to movement in interest rates.
Investment Objective: The fund is designed to provide long-term cumulative growth while
managing the risk of relatively high exposure to equity markets.
The risk profile for this fund is High
November 2018
The actual asset allocation will remain within the 'minimum' and 'maximum' range based on
market opportunities and future outlook of the markets.
21.16%
1.17%
2.21%
2.32%
3.23%
5.25%
6.61%
7.68%
8.25%
15.87%
26.25%
Others
Manuf of pharmicals,mdicinl chmcal& btancl pro
Warehousing & support activit. fortransp.
Civil engineering
Manf. of tobacco prod.
Manf. of coke & refined petrol. prod.
Mutual Funds
Compt prgm, consult. & relatedactivit.
Manf. of motor vehic ,trailr & semi-trailr
Soveriegn
Financial & insur. activit.
50.6
15.87
19.6513.88
Equities Goverment Securities Corporate Bonds Cash and Money Markets
Pension Unit Linked
Pension Growth Fund-IIULIF02425/01/2010PNGROWT-II122
33.09%
53.23%
4.97%8.72%
Sovereign AAA AA AA+
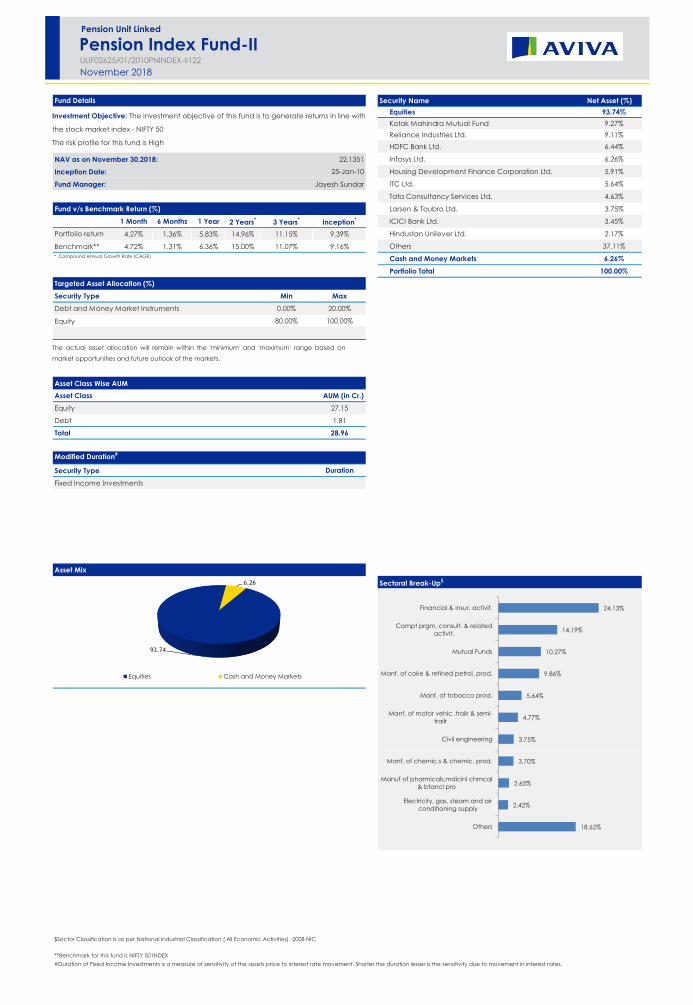
Fund Details Security Name Net Asset (%)Equities 93.74%Kotak Mahindra Mutual Fund 9.27%Reliance Industries Ltd. 9.11%HDFC Bank Ltd. 6.44%
NAV as on November 30,2018: 22.1351 Infosys Ltd. 6.26%
Inception Date: 25-Jan-10 Housing Development Finance Corporation Ltd. 5.91%
Fund Manager: Jayesh Sundar ITC Ltd. 5.64%
Tata Consultancy Services Ltd. 4.63%
Fund v/s Benchmark Return (%) Larsen & Toubro Ltd. 3.75%
1 Month 6 Months 1 Year 2 Years* 3 Years* Inception* ICICI Bank Ltd. 3.45%
Portfolio return 4.27% 1.36% 5.83% 14.96% 11.15% 9.39% Hindustan Unilever Ltd. 2.17%
Benchmark** 4.72% 1.31% 6.36% 15.00% 11.07% 9.16% Others 37.11%
Cash and Money Markets 6.26%Portfolio Total 100.00%
Targeted Asset Allocation (%)Security Type Min MaxDebt and Money Market Instruments 0.00% 20.00%
Equity 80.00% 100.00%
Asset Class Wise AUMAsset Class AUM (in Cr.)Equity 27.15
Debt 1.81
Total 28.96
Modified Duration#
Security Type Duration
Fixed Income Investments
Asset Mix
Sectoral Break-Up$
* Compound Annual Growth Rate (CAGR)
$Sector Classification is as per National Industrial Classification ( All Economic Activities) -2008 NIC
**Benchmark for this fund is NIFTY 50 INDEX#Duration of Fixed Income Investments is a measure of sensitivity of the assets price to interest rate movement. Shorter the duration lesser is the sensitivity due to movement in interest rates.
Investment Objective: The investment objective of this fund is to generate returns in line with
the stock market index - NIFTY 50
The risk profile for this fund is High
November 2018
The actual asset allocation will remain within the 'minimum' and 'maximum' range based on
market opportunities and future outlook of the markets.
18.62%
2.42%
2.65%
3.70%
3.75%
4.77%
5.64%
9.86%
10.27%
14.19%
24.13%
Others
Electricity, gas, steam and airconditioning supply
Manuf of pharmicals,mdicinl chmcal& btancl pro
Manf. of chemic.s & chemic. prod.
Civil engineering
Manf. of motor vehic ,trailr & semi-trailr
Manf. of tobacco prod.
Manf. of coke & refined petrol. prod.
Mutual Funds
Compt prgm, consult. & relatedactivit.
Financial & insur. activit.
93.74
6.26
Equities Cash and Money Markets
Pension Unit Linked
Pension Index Fund-IIULIF02625/01/2010PNINDEX-II122
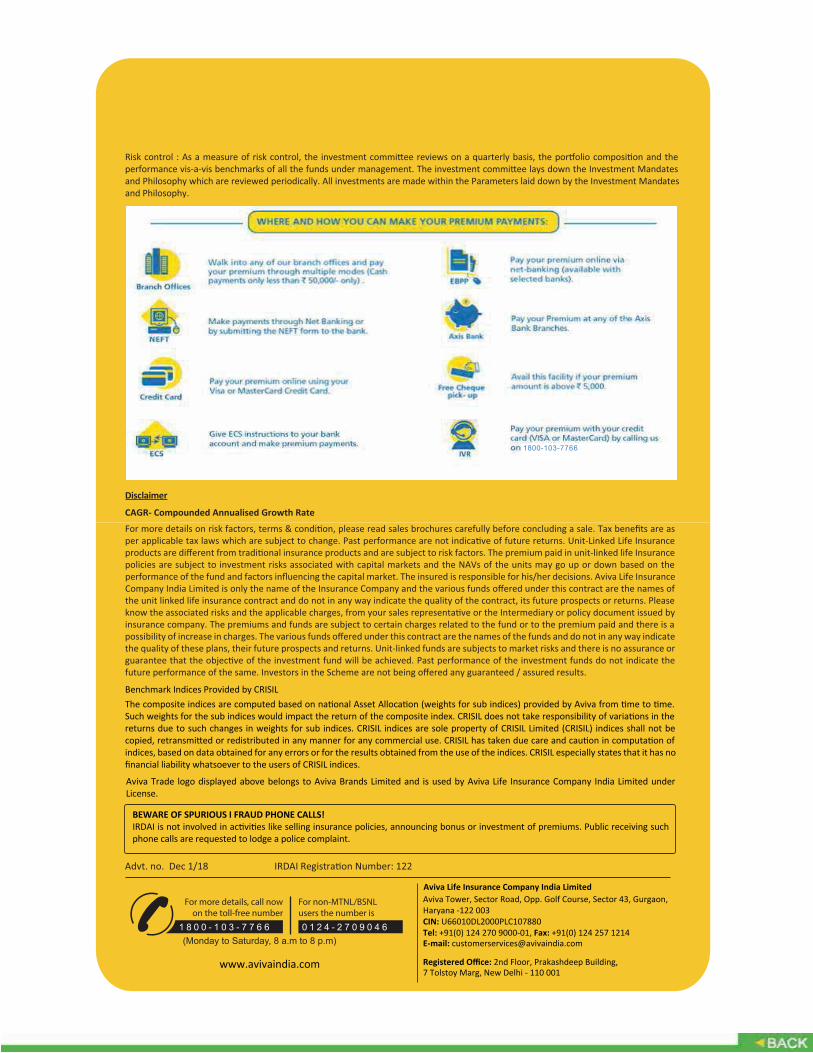
Advt. no. Dec 1/18 IRDAI Regist
For more details, call nowon the toll-free number
For non-MTNL/BSNLusers the number is
1 8 0 0 - 1 0 3 - 7 7 6 6 0 1 2 4 - 2 7 0 9 0 4 6(Monday to Saturday, 8 a.m to 8 p.m)
and Philosophy which are reviewed periodically. All investments are made within the Parameters laid down by the Investment Mandates and Philosophy.
Disclaimer
Benchmark Indices Provided by CRISIL
returns due to such changes in weights for sub indices. CRISIL indices are sole property of CRISIL Limited (CRISIL) indices shall not be
indices, based on data obtained for any errors or for the results obtained from the use of the indices. CRISIL especially states that it has no nancial liability whatsoever to the users of CRISIL indices.
www.avivaindia.com
1800-103-7766
Aviva Trade logo displayed above belongs to Aviva Brands Limited and is used by Aviva Life Insurance Company India Limited under License.
policies are subject to investment risks associated with capital markets and the NAVs of the units may go up or down based on the performance of the fund and factors influencing the capital market. The insured is responsible for his/her decisions. Aviva Life Insurance Company India Limited is only the name of the Insurance Company and the various funds offered under this contract are the names of the unit linked life insurance contract and do not in any way indicate the quality of the contract, its future prospects or returns. Please
insurance company. The premiums and funds are subject to certain charges related to the fund or to the premium paid and there is a possibility of increase in charges. The various funds offered under this contract are the names of the funds and do not in any way indicate the quality of these plans, their future prospects and returns. Unit-linked funds are subjects to market risks and there is no assurance or
future performance of the same. Investors in the Scheme are not being offered any guaranteed / assured results.
BEWARE OF SPURIOUS PHONE CALLS AND FICTITIOUS or FRAUDULENT OFFERS. IRDAI clarifies to public that IRDAI or its officials do
bonus. Public receiving such phone calls are requested to lodge a police complaint along with details of phone call, number.
CAGR- Compounded Annualised Growth Rate
Aviva Tower, Sector Road, Opp. Golf Course, Sector 43, Gurgaon, Haryana -122 003CIN: U66010DL2000PLC107880Tel: +91(0) 124 270 9000-01, Fax: +91(0) 124 257 1214E-mail: [email protected]
Registered Office: 2nd Floor, Prakashdeep Building,7 Tolstoy Marg, New Delhi - 110 001
Aviva Life Insurance Company India Limited
BEWARE OF SPURIOUS I FRAUD PHONE CALLS!IRDAI is not involved in activities like selling insurance policies, announcing bonus or investment of premiums. Public receiving such phone calls are requested to lodge a police complaint.