Embed Size (px)
Citation preview

CAFEE Center for Alternative Fuels, Engines and Emissions
In-Use NTE PM Measurement Methodology using an In-Line, Real-Time Exhaust PM
Emissions Sensor
Marc C. Besch1, Arvind Thiruvengadam1, Hemanth Kappanna1, Alessandro Cozzolini1, Peter Bonsack1, Daniel K. Carder1,
Juha Tikkanen2, Mridul Gautam1
Department of Mechanical and Aerospace Engineering
West Virginia University
1Pegasor Ltd, Tampere, Finland
15th ETH Conference on Combustion Generated Nanoparticles June 26-29, 2011, Zurich, Switzerland

15th ETH Conference on Combustion Generated Nanoparticles June 26-29, 2011, Zurich, Switzerland
Content
• Particle Sensor Technology
• NTE Measurement Methodology
• Experimental Setup
• Results and Discussion
Engine Dynamometer Results
Chassis Dynamometer Results
(On-Road Testing Results)
• Conclusions
15th ETH Conference on Combustion Generated Nanoparticles June 26-29, 2011, Zurich, Switzerland
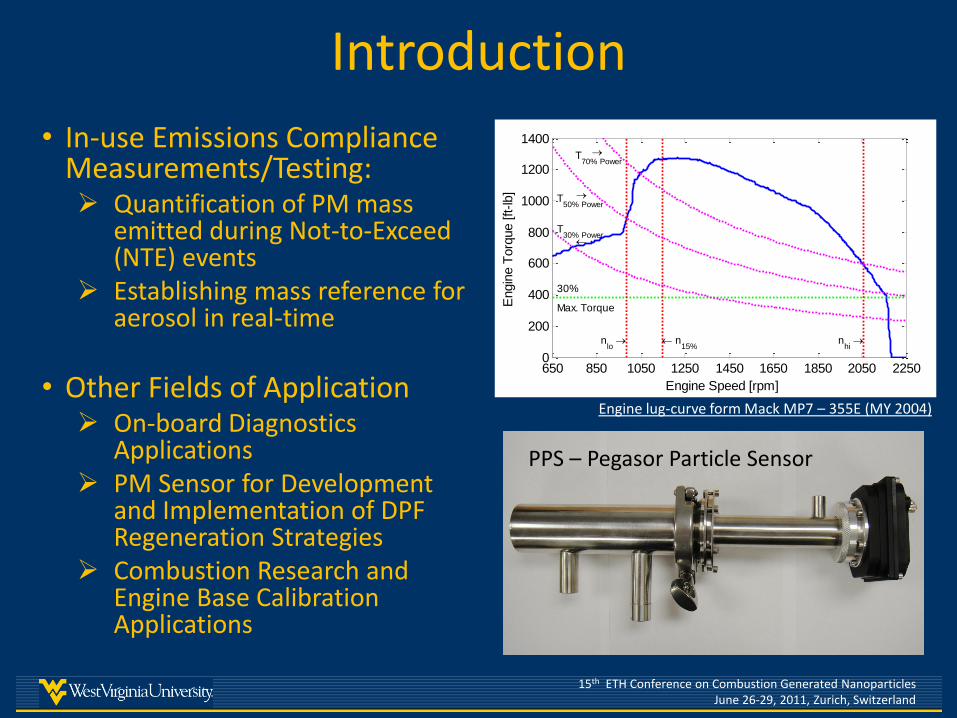
• In-use Emissions Compliance Measurements/Testing: Quantification of PM mass
emitted during Not-to-Exceed (NTE) events
Establishing mass reference for aerosol in real-time
• Other Fields of Application On-board Diagnostics
Applications PM Sensor for Development
and Implementation of DPF Regeneration Strategies
Combustion Research and Engine Base Calibration Applications
Introduction
650 850 1050 1250 1450 1650 1850 2050 22500
200
400
600
800
1000
1200
1400
30%
Max. Torque
nlo
n15%
nhi
T30% Power
T50% Power
T70% Power
Engine Speed [rpm]
Engin
e T
orq
ue [ft-lb]
Engine lug-curve form Mack MP7 – 355E (MY 2004)
PPS – Pegasor Particle Sensor

15th ETH Conference on Combustion Generated Nanoparticles June 26-29, 2011, Zurich, Switzerland
Sensor - Description of Technology
Advantages: • Real-time • Continuous operation • No PM sample collection • No external dilution of exhaust needed
Picture provided by Pegasor Oy
• Measurement based on escaping current principle
Operational Parameters: • Sampling rate up to 100 Hz • Sensor output can be calibrated to [mg/m3] or [#/m3]
Dilution Air in
Sample Inlet Turbulent mixing of
particles and ions
~2kV 5µA
Ionized Air out
High Voltage
Charged particles and excess ions
Only charged particles leave the
ion trapElectric field
removes all ions
Corona Needle
(Tungsten)
PPS Installation on Exhaust:

15th ETH Conference on Combustion Generated Nanoparticles June 26-29, 2011, Zurich, Switzerland
NTE In-use Measurement Method
Calculation of PM mass [mg] during NTE event:
0
1
NT
E E
ven
t [-
]
0 200 400 600 800 1000 1200 1400 1600
0
50
100
150
200
250
300
Time [sec]
PP
S S
ign
al [m
V]
ESC-Modes (Run 1)
ESC-Modes (Run 2) NTEEnd
NTEStart
t
tdttPPS
TestEnd
TestStart
t
tdttPPS
TestEnd
TestStart
NTEEnd
NTEStart
t
t
t
t
PPSRatio
dttPPS
dttPPSPM
CycleTotalMassPPSRatioNTEMass PMPMPM
CycleTotalMassPM
PMMass Total-Cycle = TPM from gravimetric filter sample

15th ETH Conference on Combustion Generated Nanoparticles June 26-29, 2011, Zurich, Switzerland
Experimental Setup Engine Dynamometer: Chassis Dynamometer: On-Road Testing:
• Full flow dilution tunnel (CVS-SSV) • 11L Mack MP7 - 355E (2004) • No aftertreatment system • EEPS (TSI, Model 3090) • CPC (TSI, Model 3025) • MSS (AVL, Model 483) • Intake Air Flow Measurement • Proportional Flow TPM Sampling
PPS
PPS PPS
TPM TPM TPM
• Full flow dilution tunnel (CVS-SSV) • 6.6L Duramax - GMC4500 (2004) • GVW ~ 12’000 pounds • Diesel Oxidation Catalyst (DOC) • Exhaust Flow Measurement • Horiba OBS and Sensors SEMTECH • Proportional Flow TPM Sampling
• 6.6L Duramax - GMC4500 (2004) • GVW ~ 12’500 pounds • Diesel Oxidation Catalyst (DOC) • Exhaust Flow Measurement • Horiba OBS and Sensors SEMTECH • Constant Flow TPM Sampling
15th ETH Conference on Combustion Generated Nanoparticles June 26-29, 2011, Zurich, Switzerland
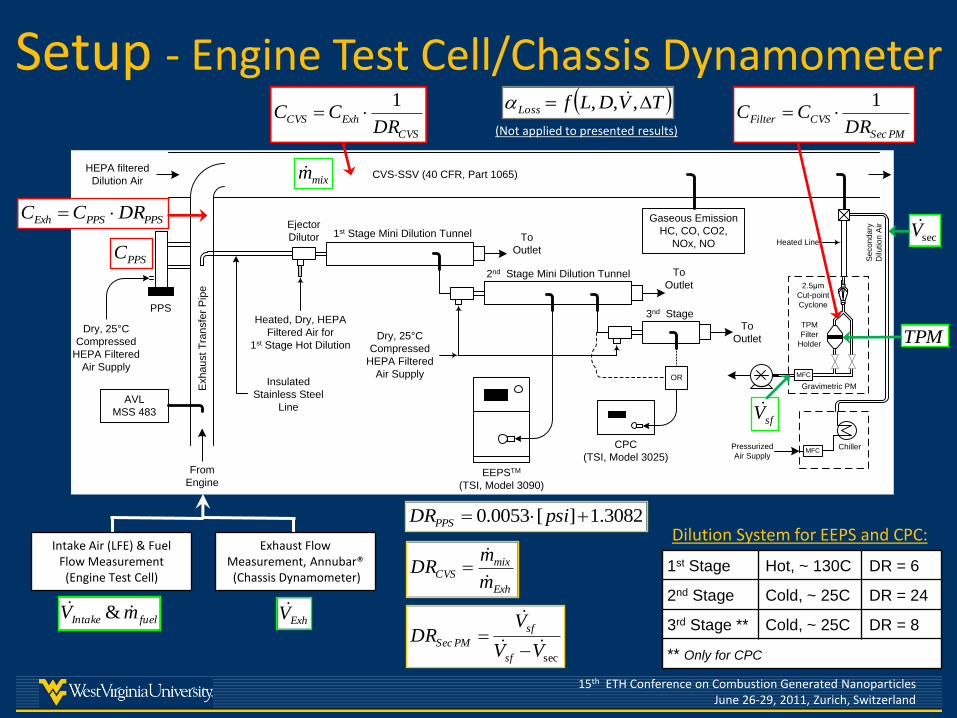
Setup - Engine Test Cell/Chassis Dynamometer
CVS-SSV (40 CFR, Part 1065)
Ejector
Dilutor
Dry, 25°C
Compressed
HEPA Filtered
Air Supply
EEPSTM
(TSI, Model 3090)
CPC
(TSI, Model 3025)
1st Stage Mini Dilution Tunnel To
Outlet
HEPA filtered
Dilution Air
To
Outlet
ORInsulated
Stainless Steel
Line
Heated, Dry, HEPA
Filtered Air for
1st Stage Hot Dilution
2nd Stage Mini Dilution Tunnel
Exh
au
st T
ran
sfe
r P
ipe
From
Engine
To
Outlet
3nd Stage
Dry, 25°C
Compressed
HEPA Filtered
Air Supply
PPS
Gaseous Emission
HC, CO, CO2,
NOx, NO
AVL
MSS 483
TPM
Filter
Holder
Gravimetric PM
2.5μm
Cut-point
Cyclone
Pressurized
Air SupplyChiller
Se
co
nd
ary
Dilu
tio
n A
ir
Heated Line
MFC
MFC
Exhaust Flow Measurement, Annubar® (Chassis Dynamometer)
Intake Air (LFE) & Fuel Flow Measurement
(Engine Test Cell)
PPSC
PPSPPSExh DRCC
CVS
ExhCVSDR
CC1
PMSec
CVSFilterDR
CC
1
3082.1][0053.0 psiDRPPS
Exh
mixCVS
m
mDR
sec
VV
VDR
sf
sf
PMSec
mixm
secV
sfV
ExhVfuelIntake mV &
1st Stage Hot, ~ 130C DR = 6
2nd Stage Cold, ~ 25C DR = 24
3rd Stage ** Cold, ~ 25C DR = 8
** Only for CPC
Dilution System for EEPS and CPC:
TPM
TVDLfLoss ,,,
(Not applied to presented results)

15th ETH Conference on Combustion Generated Nanoparticles June 26-29, 2011, Zurich, Switzerland
Exh
au
st S
tack
From Engine
Dry,
Compressed
HEPA Filtered
Air Supply
PPS
TPM
Filter
Holder
Gravimetric PM
2.5μm
Cut-point
Cyclone
Pressurized
Air Supply
Porous
Wall Dilutor
MFC
MFC
Heated
Line
Secondary
Dilution Air
Heated Tape
and Insulation
Pdiff
Pabs
Annubar®
Flow Device
T4
T5
Setup - On-Road Testing
TPM
sfV
secV
ExhV
PPSC
PPSPPSExh DRCC PMSec
CVSFilterDR
CC
1
TVDLfLoss ,,, (Not applied to presented results)
3082.1][0053.0 psiDRPPS
sec
VV
VDR
sf
sf
PMSec
y = 0.0053x + 1.3082R² = 0.9688
0.0
0.2
0.4
0.6
0.8
1.0
1.2
1.4
1.6
1.8
0 20 40 60 80
Dilu
tio
n R
ati
o [-]
Pressure [psi]
Dilution Ratio
Linear (Dilution Ratio)
PPSDR
PPS
EFM
TPM
Porous Wall Dilutor
Heated Line
Cyclone
OBS SEMTECH

15th ETH Conference on Combustion Generated Nanoparticles June 26-29, 2011, Zurich, Switzerland
Results - Engine Test Cell
0 200 400 600 800 1000 1200 1400 16000
50
100
150
200
250
300
Time [sec]
PP
S S
ignal [
mV
]
Raw PPS Signal
Filtered PPS Signal
0 200 400 600 800 1000 1200 1400 16000
50
100
150
200
250
300
350
400
PP
S C
oncentr
atio
n [m
V/(
Unit
Flo
w)]
Time [sec]
CPPS
CExh
CCVS
CPMFilter
PPS Signal Filtering/Smoothing: • Savitzky-Golay (Least-Squares
Smoothing Filters) • For Steady-State:
• Frame Size - 8.1 sec • Filter Order - 3
• For Transient Cycle: • Frame Size - 2.1 sec • Filter Order - 5
Instrument Grounding at On-Road
PPS Concentration as calculated at different locations in the measurement stream between PPS sample cell (blue line) and gravimetric filter face

15th ETH Conference on Combustion Generated Nanoparticles June 26-29, 2011, Zurich, Switzerland
Results - Engine Test Cell (ESC)
340 680 1020 13740
100
200
300
400
500
PMPPS
vs. TPM at 1228 rpm
PM
PPS [
mg]
and T
PM
[m
g]
340 680 1020 13740
100
200
300
400
500
PMMSS
vs. TPM at 1228 rpm
PM
MS
S [
mg]
and T
PM
[m
g]
Torque [ft-lb]
309 618 927 12490
50
100
150
200
250
300
PMPPS
vs. TPM at 1504 rpm
309 618 927 12490
50
100
150
200
250
300
PMMSS
vs. TPM at 1504 rpm
Torque [ft-lb]
267 534 802 10790
200
400
600
800
PMPPS
vs. TPM at 1780 rpm
PMPPS
TPM
267 534 802 10790
200
400
600
800
PMMSS
vs. TPM at 1780 rpm
Torque [ft-lb]
PMMSS
TPM
• AVL MSS => Corrected for temperature influence and thermophoretic losses • TPM includes absorbed SOF => PPS and AVL do not measure this fraction => Possible correction based on HC
Possible influence of PPS sample extraction method at high gas velocity?
For all modes: TPM not “Background” corrected.

15th ETH Conference on Combustion Generated Nanoparticles June 26-29, 2011, Zurich, Switzerland
0 500 1000 1500 2000 2500 3000 35000
1000
2000
3000
4000Engine Speed [rpm]
0 500 1000 1500 2000 2500 3000 35000
200
400
600
Engine Torque [ft-lb]
0 500 1000 1500 2000 2500 3000 35000
0.5
1NTE Zone [-]
0 500 1000 1500 2000 2500 3000 35000
100
200
300
400
500
600PPS Signal [mV]
Time [sec]
Results - Chassis Dynamometer
NTE Zones (t > 30sec)
From ECU
From ECU
From OBS

15th ETH Conference on Combustion Generated Nanoparticles June 26-29, 2011, Zurich, Switzerland
• Response of PPS to PM emissions during the transient test cycle (FTP) was similar to that of EEPS (R2 Value: 0.8969) and AVL MSS (R2 Value: 0.8479).
• Development of NTE In-use Measurement Method using the PPS Signal to calculate PM during NTE events.
• Demonstration of this method based on engine dynamometer experiments => PPS-Method captures general trends. – Possible influence of high exhaust flow rates on sample
extraction efficiency – Accounting for particle losses within transfer pipes – Influence of SOF on gravimetric filter weight
• Chassis Dynamometer and On-Road analysis is ongoing.
Conclusion and Outlook

15th ETH Conference on Combustion Generated Nanoparticles June 26-29, 2011, Zurich, Switzerland
Thank You for Your Attention

15th ETH Conference on Combustion Generated Nanoparticles June 26-29, 2011, Zurich, Switzerland
0 200 400 600 800 1000 12000
20
40
60
80
100
120
Time [sec]
PP
S M
ass C
on
c. M
od
el [m
g/m
3]
MS
S M
ass C
on
c. [m
g/m
3]
PPS (Linear Prediction Model)
AVL MSS-483
0 200 400 600 800 1000 12000
0.2
0.4
0.6
0.8
1
Time [sec]
No
rma
ilze
d P
PS
Sig
na
l a
nd
MS
S M
ass C
on
ce
ntr
atio
n
PPS
AVL MSS-483
Results - PPS vs. AVL MSS, Engine-out
• Engine: Mack MP-7 (MY 2004) • No aftertreatment, engine-out measurement • FTP-Cycle, Dynamometer Linear Regression Coefficients: (Least Squares Method)
PPS [mg/m3] = 0.1787+ 0.0581*PPS [mV]
R-Square Value: 0.8479 0 500 1000 1500 20000
20
40
60
80
100
MS
S S
oo
t C
on
ce
ntr
atio
n [m
g/m
3]
PPS Signal [mV]

15th ETH Conference on Combustion Generated Nanoparticles June 26-29, 2011, Zurich, Switzerland
0 200 400 600 800 1000 12000
0.5
1
1.5
2
2.5
3
3.5x 10
6
Time [sec]
PP
S N
um
be
r C
on
c. M
od
el [#
/m3
]E
EP
S T
ota
l N
um
be
r C
on
c. [#
/cm
3]
PPS (Linear Prediction Model)
EEPS (TSI, 3090)
0 200 400 600 800 1000 12000
0.2
0.4
0.6
0.8
1
Time [sec]
No
rma
ilze
d P
PS
Sig
na
l a
nd
EE
PS
To
tal N
um
be
r C
on
c.
PPS
EEPS (TSI, 3090)
Results - PPS vs. EEPS, Engine-out
• Engine: Mack MP-7 (MY 2004) • No aftertreatment, engine-out measurement • FTP-Cycle, Engine Dynamometer Linear Regression Coefficients: (Least Squares Method)
PPS [#/m3] = 2.244E4+ 1.777E3*PPS [mV]
R-Square Value: 0.8969
Forcing linear model through zero point: => Coeff(1) = 0
0 500 1000 1500 20000
0.5
1
1.5
2
2.5
3
3.5x 10
6
EE
PS
To
tal N
um
be
r C
on
c. [#
/cm
3]
PPS Signal [mV]

15th ETH Conference on Combustion Generated Nanoparticles June 26-29, 2011, Zurich, Switzerland
Sensor – Operational Parameters, cont’
• Low temperature version max 250 °C • High temperature version max. 850 °C • High concentration version 10 µg/m3-250 mg/m3
• High sensitivity version ~1µg/m3 • Sensor dimensions 20-40 mm diameter, 100-200 mm
long – to be decided together with customers • Electronics; 80x40x20 mm3 • Sensor output calibrated to mg/m3 or #-particles/cm3 • Sensor is installed outside the tailpipe with only inlet
and outlet in the tailpipe • Environmental conditions up to 85 degrees C, IP 45

15th ETH Conference on Combustion Generated Nanoparticles June 26-29, 2011, Zurich, Switzerland
Sample Outlet
Sample Inlet
Dilution Air
Sensor Electronics
Sensor - Description of Technology Cont’d
RS485 Connector
0
2
4
6
8
10
12
14
16
0 20 40 60 80
Flo
w R
ate
[lp
m]
Pressure [psi]
Sample Inlet
Sample Outlet
Dilution Air
y = 0.0053x + 1.3082R² = 0.9688
0.0
0.2
0.4
0.6
0.8
1.0
1.2
1.4
1.6
1.8
0 20 40 60 80
Dilu
tio
n R
ati
o [-]
Pressure [psi]
Dilution Ratio
Linear (Dilution Ratio)