Embed Size (px)
Citation preview
In vitro and in vivo characterization of selected Australian isolates of Marek’s disease virus
By
Katrin Renz
BSc, MSc (Agricultural Sciences, University of Hohenheim, Germany)
A thesis submitted for the degree of
Doctor of Philosophy
in the Centre of Animal Health and Welfare, School of Environmental
and Rural Sciences, the University of New England.
March 2008
Declaration of originality
I hereby certify that this work is the original work of the author except where
acknowledged in the text. My involvement in Experiment MD05-C-PT3 was as a
co-investigator to Prof. Stephen Walkden-Brown and these data were included in
this thesis with his permission. Any help I have received in preparing this thesis,
and all sources used, have been acknowledged in this thesis.
The substance of this thesis has not been submitted for any degree, either in full
or in part and it is not currently being submitted for any other degree orqualification at this or any other University.
{"1'+March 2008

iii
Dedication
I would like to dedicate this thesis to
my beloved father, Dieter Renz and my mother, Gundula Renz.

iv
Acknowledgements
This research was financially supported by the Rural Industries Research and
Development Corporation (RIRDC) project UNE-83J which is greatly appreciated.
Furthermore, I have received both a UNERA and IPRS postgraduate scholarship
from the University of New England for which I am grateful.
The journey towards a PhD degree can be treacherous but also exciting and
pleasurable. I have many to thank for helping me through the hard times and
sharing the good times throughout my graduate work. First and foremost, I would
like to thank my supervisor, Prof. Stephen Walkden-Brown, for his supervision,
support and overall guidance throughout my PhD candidature. His excitement
and enthusiasm for any research is unsurpassed and this has incited me along
until the end of my thesis and beyond. I would also like to thank my co- supervisor
Dr Brian Cheetham for his greatly appreciated advice and invaluable support
during the molecular work. His patience and knowledge has helped me to cope
with the challenges of molecular Biology.
Special thanks are also extended to Dr Fakhrul Islam (UNE), Dr Zhanhai Gao
(UNE), for their encouragement and helpful discussions.
For their technical assistance throughout my thesis, I would like to thank Susan
Burgess (UNE), Paul Reynolds (UNE), Megan Sutherland (UNE), Jenny Druitt
(UNE), Suresh Kumar (UNE), Kapil Chousalkar (UNE), Gary Taylor (UNE).
Last, but not least, I want to thank all my friends, especially Michael Zender,
Judith Reiser, Dr Frank Klempau and the Kontner family for their undying moral
support and inspiration. They always managed to make me smile during the hard
times of my PhD candidature. And although being thousands of kilometres apart,
both my family and friends always kept as close contact as possible with me and
gave me all the help and support they could.
Finally, I would like to extent my special tribute to my parents for their incredible
efforts, support and generosity to allow me to undertake the endeavour of a PhD
degree. Very special thanks also to my sisters, Verena and Anne Renz, who both
gave me continuous support and encouragement throughout the journey.
v
Publications
Materials from this thesis have been published in the following journals,
conference papers and abstracts:
Refereed journal papers:
1. Renz, K.G., Islam, A., Cheetham, B.F. and Walkden-Brown, S.W. (2006):
Absolute quantification using real-time polymerase chain reaction of
Marek's disease virus serotype 2 in field dust samples, feather tips and
spleens. J Virol Methods. 135, 186-91.
2. Renz, K.G., Cheetham, B.F. and Walkden-Brown, S.W. (2008): Sequence
analysis of the Marek’s EcoRI-Q-encoded (meq) gene of five Australian
isolates of Marek’s disease virus serotype 1 (MDV1) and association with
virulence. Vet. Microbiol. (under revision for re-submission).
Long conference papers (refereed):
3. Renz, K.G., Cheetham, B.F., Islam, A. and Walkden-Brown SW (2006).
Absolute quantification of Marek's disease virus serotype 2 using real-time
polymerase chain reaction and its application to field dust samples.
Proceedings of the Australian Poultry Science Symposium 18, 153-156.
4. Renz, K.G. and Walkden-Brown SW (2007): Environmental enrichment
strategies for improved welfare of experimental layer chickens housed in
isolators. Proceedings of the Australian Poultry Science Symposium 19,
41-44.
vi
Short conference papers (refereed):
5. Walkden-Brown, S.W., Cooke, J., Islam, A., Renz, K.G., Hussain, Z.,
Islam, A.M.F.M., Tannock, G. and Groves, P. (2007): Pathotyping of
Australian isolates of Marek’s disease virus. Proceedings of the Australian
Veterinary Poultry Association, Sydney, pp 32-37.
Conference abstracts (refereed):
6. Renz, K.G., Cheetham, B.F. and Walkden-Brown, S.W. (2008):
Association between Marek’s EcoRI-Q-encoded (meq) gene sequence
and virulence in Australian and international isolates of Marek’s disease
virus (Abstract). In 'Proceedings of the 8th International Marek’s Disease
Symposium: 6-10th July, Townsville, Australia'. Townsville p. (submitted).
7. Renz, K.G. and Walkden-Brown, S.W. (2008): Longitudinal quantification
of MDV serotype 1 and HVT in feather tips and relationship to clinical
Marek’s disease in commercial layer chickens. In 'Proceedings of the 8th
International Marek’s Disease Symposium: 6-10th July, Townsville,
Australia'. Townsville p. (submitted).
8. Renz, K.G. and Walkden-Brown, S.W. (2008): Virulence of MDV
challenge strain and vaccination influence the shedding profile of MDV in
feather dander. In 'Proceedings of the 8th International Marek’s Disease
Symposium: 6-10th July, Townsville, Australia'. Townsville p. (submitted).
9. Walkden-Brown, S.W., Cooke, J., Islam, A., Renz, K.G., Hussain, Z.,
Islam, A.M.F.M., Tannock, G. and Groves, P. (2008): Pathotyping of
Australian isolates of MDV. In 'Proceedings of the 8th International Marek’s
Disease Symposium: 6-10th July, Townsville, Australia'. Townsville p.
(submitted).
vii
Table of contents
Declaration of originality.................................................................................... ii
Dedication........................................................................................................... iii
Acknowledgements ........................................................................................... iv
Publications......................................................................................................... v
Table of contents .............................................................................................. vii
List of Tables................................................................................................... xvii
List of Figures .................................................................................................. xix
Abstract ........................................................................................................... xxv
List of abbreviations...................................................................................... xxix
General introduction........................................................................................... 1
Chapter 1: Review of literature.........................................................4
1.1 Introduction ................................................................................................... 4
1.2 Brief history of Marek’s disease .................................................................. 6
1.3. MD situation in Australia ............................................................................. 7
1.4 Economic significance ................................................................................. 9
1.5 Aetiology of Marek’s disease..................................................................... 10
1.5.1 Classification of MDVs ....................................................................... 10
viii
1.5.2 Morphology ........................................................................................ 13
1.5.3 Genome organisation......................................................................... 14
1.5.4 MDV genes and gene products.......................................................... 15
1.5.4.1 MDV1-specific genes and gene products............................. 17
1.5.4.2 MDV2 genes ........................................................................ 19
1.5.4.3 HVT genes ........................................................................... 19
1.5.5 Other Herpesviruses related to MDV ................................................. 20
1.6 Pathobiology and epidemiology................................................................ 21
1.6.1 Pathogenesis ..................................................................................... 21
1.6.1.1 Entry to the host and infection.............................................. 22
1.6.1.2 Phase 1: early cytolytic phase.............................................. 23
1.6.1.3 Phase 2: Latency ................................................................. 24
1.6.1.4 Phase 3: late cytolytic phase................................................ 26
1.6.1.5 Fully productive infection in the feather-follicle epithelium
(FFE) ..................................................................................... 26
1.6.1.6 Phase 4: Transformation ...................................................... 27
1.6.1.7 Immunosuppressive effects of MDV infection ...................... 28
1.6.1.8 Other consequences of MDV infection ................................. 30
1.6.2 Factors affecting pathogenesis .......................................................... 30
1.6.2.1 Virus serotype and pathotype............................................... 30
1.6.2.2 Host genotype ...................................................................... 31
1.6.2.3 Host immunity ...................................................................... 33
1.6.3 Co-infection with other pathogens...................................................... 34
1.6.4 Transmission...................................................................................... 35
1.7 Control of MD .............................................................................................. 36
1.7.1 Vaccination against MD ..................................................................... 36
1.7.2 Hygiene and biosecurity..................................................................... 38
1.8 Diagnosis of MD and characterization of MDV......................................... 38
1.8.1 Diagnosis of MD in vivo ..................................................................... 38
ix
1.8.2 Pathotyping of MDV isolates .............................................................. 40
1.8.3 Diagnosis of MD in vitro ..................................................................... 42
1.8.3.1 Virus isolation and identification ........................................... 42
1.8.4 Molecular methods for MDV diagnosis .............................................. 44
1.8.4.1 Polymerase chain reaction (PCR) ........................................ 44
1.8.4.2 Real – time PCR .................................................................. 45
1.8.4.3 PCR methods for detection of MDV ..................................... 47
1.8.4.4 Advantages and disadvantages of molecular diagnostic
methods................................................................................. 48
1.8.4.5 Genomic analysis of MDV .................................................... 49
1.8.4.6 Cloning vectors for sequencing purposes ............................ 50
1.8.4.7 Summary of the application and potential of MDV genome
analysis ................................................................................. 52
1.9 Conclusions ................................................................................................ 52
Chapter 2: Absolute quantification of MDV2 genome copy number in dust samples, spleens and feather tips using real-time PCR......................................................................................54
2.1 Introduction ................................................................................................. 54
2.2 Materials and Methods ............................................................................... 55
2.2.1 Development of plasmid standard...................................................... 55
2.2.2 Development of plasmid constructs ................................................... 56
2.2.3 Processing plasmid DNA for standard curve determination............... 57
2.2.4 Quantitative real-time PCR (qPCR) ................................................... 57
2.2.4.1 Primer/probe sets and qPCR protocol.................................. 57
2.2.4.2 Validation of assays ............................................................. 58
2.2.4.3 Conversion of previous MDV2 standard............................... 58
2.2.5 MDV samples..................................................................................... 58
x
2.3 Results......................................................................................................... 59
2.3.1 Development of plasmid constructs ................................................... 59
2.3.2 Sensitivity........................................................................................... 59
2.3.3 Reproducibility ................................................................................... 60
2.3.4 Conversion of previous MDV2 standards........................................... 62
2.3.5 Absolute quantification of MDV2 in field dust, spleen and feather tip. 63
2.4 Discussion................................................................................................... 65
2.5 Conclusion .................................................................................................. 66
Chapter 3: Association between Marek’s EcoRI-Q-encoded (meq) gene sequence and virulence in Australian and international isolates of Marek’s disease virus ..............................................67
3.1 Introduction ................................................................................................. 67
3.2 Materials and Methods ............................................................................... 69
3.2.1 Sample material for DNA extraction................................................... 69
3.2.2 PCR amplification of meq gene.......................................................... 71
3.2.3 Cloning of PCR fragments ................................................................. 71
3.2.4 DNA sequencing and analysis ........................................................... 72
3.2.5 Statistical analysis.............................................................................. 73
3.3 Results......................................................................................................... 73
3.3.1 Meq gene sequencing and alignment of Australian isolates .............. 73
3.3.2 Comparison of Australian meq sequences with meq of reference
isolates Md5 and Rispens/ CVI988..................................................... 76
3.3.3. Association between proline content and repeats and virulence....... 80
xi
3.3.4 Phylogenetic tree alignment............................................................... 81
3.4 Discussion................................................................................................... 83
3.4.1 Sequence variation in the meq gene of Australian and international
isolates of MDV1................................................................................. 83
3.4.2 Correlation between sequence variation and virulence...................... 84
3.4.3 Phylogenetic tree alignment............................................................... 86
Chapter 4: Pathotyping of recent Australian isolates of Marek’s disease virus (MDV) in commercial layer chickens.................88
4.1 Introduction ................................................................................................. 88
4.2 Materials and methods ............................................................................... 92
4.2.1 Experimental design .......................................................................... 92
4.2.2 Experimental time course .................................................................. 92
4.2.3 UNE isolator facility............................................................................ 93
4.2.4 Experimental chickens and their management .................................. 94
4.2.5 Vaccination ........................................................................................ 95
4.2.6 Challenge with MDV1 ........................................................................ 95
4.2.7 Post mortem procedure ..................................................................... 97
4.2.8 DNA extraction................................................................................... 98
4.2.9 Determination of MDV genome copy numbers by quantitative real-time
PCR (qPCR) ....................................................................................... 98
4.2.10 Statistical analysis............................................................................ 99
4.3 Results....................................................................................................... 100
4.3.1 Confirmation of successful application of treatments ....................... 101
4.3.2 Mortality/ Survival............................................................................. 101
4.3.3 MD incidence, protective index and virulence rank .......................... 103
xii
4.3.4 Anatomical distribution, number and severity of MD lesions ............ 106
4.3.5 Body weight, relative immune organ weights and MDV1 load in spleen
at 14 dpc and 56 dpc ........................................................................ 108
4.3.5.1 Bodyweight......................................................................... 108
4.3.5.2 Bursa of Fabricius .............................................................. 109
4.3.5.3 Thymus .............................................................................. 110
4.3.5.4 Spleen ................................................................................ 112
4.3.5.5 MDV1 load in spleen at 14 dpc .......................................... 113
4.3.6 Prediction of MD incidence .............................................................. 114
4.3.6.1 MDV load in spleen ............................................................ 114
4.3.6.2 Relative immune organ weight ........................................... 115
4.3.7 Association between incidence of MD lesions in unvaccinated and
vaccinated chickens.......................................................................... 116
4.4 Discussion................................................................................................. 117
Chapter 5: Longitudinal quantification of Marek’s disease virus serotype 1 (MDV1) and Herpesvirus of Turkeys (HVT) in feather tips and their relationship to clinical Marek’s disease in commercial layer chickens ..................................................122
5.1 Introduction ............................................................................................... 122
5.2 Materials and methods ............................................................................. 124
5.2.1 Experimental design ........................................................................ 124
5.2.2 Experimental chickens ..................................................................... 125
5.2.3 Scoring of MD lesions ...................................................................... 126
5.2.4 Feather sample processing for qPCR .............................................. 126
5.2.5 Statistical analysis............................................................................ 127
5.3 Results....................................................................................................... 128
xiii
5.3.1 Application of treatments ................................................................. 128
5.3.2 Mortality/ Survival............................................................................. 129
5.3.3 Incidence of MD and protective index .............................................. 130
5.3.4 Effect of vaccination and challenge virus on MDSS......................... 131
5.3.5 MDV1 load in feather tips................................................................. 132
5.3.5.1 Descriptive overview: Individual chicken profiles grouped by
MDSS.................................................................................. 132
5.3.5.2 Descriptive overview: Mean MDV1 and HVT load in individual
unvaccinated and HVT vaccinated chickens by MDSS ....... 134
5.3.5.3 Effect of challenge virus, vaccination and days post challenge
............................................................................................ 135
5.3.5.4 Effect of MDSS and days post challenge ........................... 137
5.3.6 MDV1 load in spleens at 14 dpc ...................................................... 138
5.3.7 MDV1 load in isolator exhaust dander ............................................. 139
5.3.8 HVT load in feather tips ................................................................... 139
5.3.8.1 Effect of challenge virus and days post vaccination ........... 139
5.3.8.2 Effect of MDSS and days post vaccination......................... 141
5.3.8.3 Association between MDV1 and HVT load in vaccinated
chickens .............................................................................. 142
5.3.9 Associations between MDV1 load in feather, dust and spleen and MD
outcome on a group (isolator) mean basis........................................ 143
5.4. Discussion................................................................................................ 145
Chapter 6: Shedding profile of three pathogenic isolates and two vaccinal strains (HVT and SB-1) of Marek’s disease virus in dander from commercial layer chickens ................................151
6.1 Introduction ............................................................................................... 151
6.2 Materials and methods ............................................................................. 153
xiv
6.2.1 Experimental design ........................................................................ 153
6.2.2 Experimental chickens ..................................................................... 154
6.2.3 Collection and processing of dander for qPCR analysis .................. 154
6.2.4 Estimation of daily dander production per chicken........................... 155
6.2.5 Statistical analysis............................................................................ 155
6.3 Results....................................................................................................... 156
6.3.1 MDV1 viral load in dander................................................................ 156
6.3.2 HVT load in dander .......................................................................... 158
6.3.3 MDV2 load in dander ....................................................................... 159
6.3.4 Viral load of all three serotypes in dander from chickens vaccinated
with bivalent vaccine and challenged with MDV1 ............................. 160
6.3.5 Daily dander production per chicken and daily shedding rates of MDV
.......................................................................................................... 161
6.3.6 Prediction of MD incidence .............................................................. 163
6.3.6.1 Association between MDV load in isolator exhaust dust and
the subsequent incidence of MD ......................................... 163
6.3.6.2 Association between HVT and MDV2 load in isolator exhaust
dust and the subsequent incidence of MD........................... 164
6.4 Discussion................................................................................................. 165
Chapter 7: Evaluation of two environmental enrichment strategies for improved welfare of layer chickens in pathotyping experiments .........................................................174
7.1. Introduction .............................................................................................. 174
7.2. Materials and Methods ............................................................................ 175
7.2.1 Experimental design ........................................................................ 175
xv
7.2.2 Measurements ................................................................................. 176
7.2.2.1 Feather pecking ................................................................. 176
7.2.2.2 Feather coverage ............................................................... 176
7.2.2.3 Feather condition score...................................................... 177
7.2.2.4 Skin injury score................................................................. 177
7.2.3 Statistical analysis............................................................................ 177
7.3. Results ...................................................................................................... 177
7.3.1 Incidence of feather pecking ............................................................ 177
7.3.2 Feather coverage............................................................................. 178
7.3.3 Skin injury and feather condition score ............................................ 179
7.4. Discussion................................................................................................ 180
Chapter 8: General discussion and conclusions .......................183
8.1 Molecular methods for absolute quantification of MDV2 using real-time PCR............................................................................................................. 183
8.2 Association between sequence variation in the meq gene and virulence of Australian and international isolates of MDV1 (Chapter 3) ............... 186
8.3 Pathotyping Australian isolates of MDV1 in commercial layer chickens (Chapter 4).................................................................................................. 188
8.4 Evaluation of various tissues/ sample materials for MD prediction and routine MD monitoring (Chapters 4, 5 and 6) .......................................... 191
8.5. Kinetics of MDV1 and HVT load in feather tips and dust (Chapters 5 and 6) ................................................................................................................. 195
8.6 Behavioural aspects of chickens kept under experimental conditions (Chapter 7).................................................................................................. 196
8.7 Applications of findings ........................................................................... 197
8.8 Future work ............................................................................................... 199
xvi
9. References .................................................................................200
xvii
List of Tables
Table 1.1 Current taxonomy and attributes for MDV. Table 1.2: Serotypes and pathotypes of MDV (modified from Witter, 1998). Table 2.1: Primers and probes used for quantitative real-time PCR assay and
primers used in standard PCR for amplification of fragments of DNApol gene for cloning into vector.
Table 2.2: qPCR analysis of 30 field dust samples (each from a different broiler
farm), grouped by the pattern of results for all three MDV serotypes. Data are taken from Islam (2006) and Renz, K.G. (unpublished data) and MDV1 and HVT were assayed as described by Islam et al., 2006a. (N.A. = not available, VCN= viral copy number).
Table 2.3: qPCR analysis of 6 feather tip samples and 10 spleen samples.
(VCN= viral copy number). Table 3.1: Details of the Australian MDV isolates used, the incidence of gross
MD lesions (%MD) in unvaccinated chickens by 56 dpc, the protective index (%PI) provided by HVT and the putative pathotype based on the classification of Witter (1997) in the pathotyping experiment (Walkden-Brown et al., 2007a).
Table 3.2: Sequences of meq-gene primers and pGEM® T-easy universal
primers used for PCR amplification and sequencing. Table 3.3: GenBank® accession numbers of the meq gene sequences and the
proline content of the derived amino acid sequences of the Meq protein used in this study.
Table 3.4: Amino acid substitutions in the 5 Australian and the international
isolates of the Meq protein. Table 4.1: Details of the challenge isolates used in this experiment. Table 4.2: Summary of number of chicken spleen samples positive for MDV1
and HVT at 14 dpc. Table 4.3: Summary of MD mortality between 6 dpc and 56 dpc. Table 4.4: Summary of MD incidence, protective index (PI) of vaccines, and
virulence rank of the 3 challenge isolates of MDV1. Table 4.5: Anatomical distribution of MD lesions in chickens showing gross
lesions.
xviii
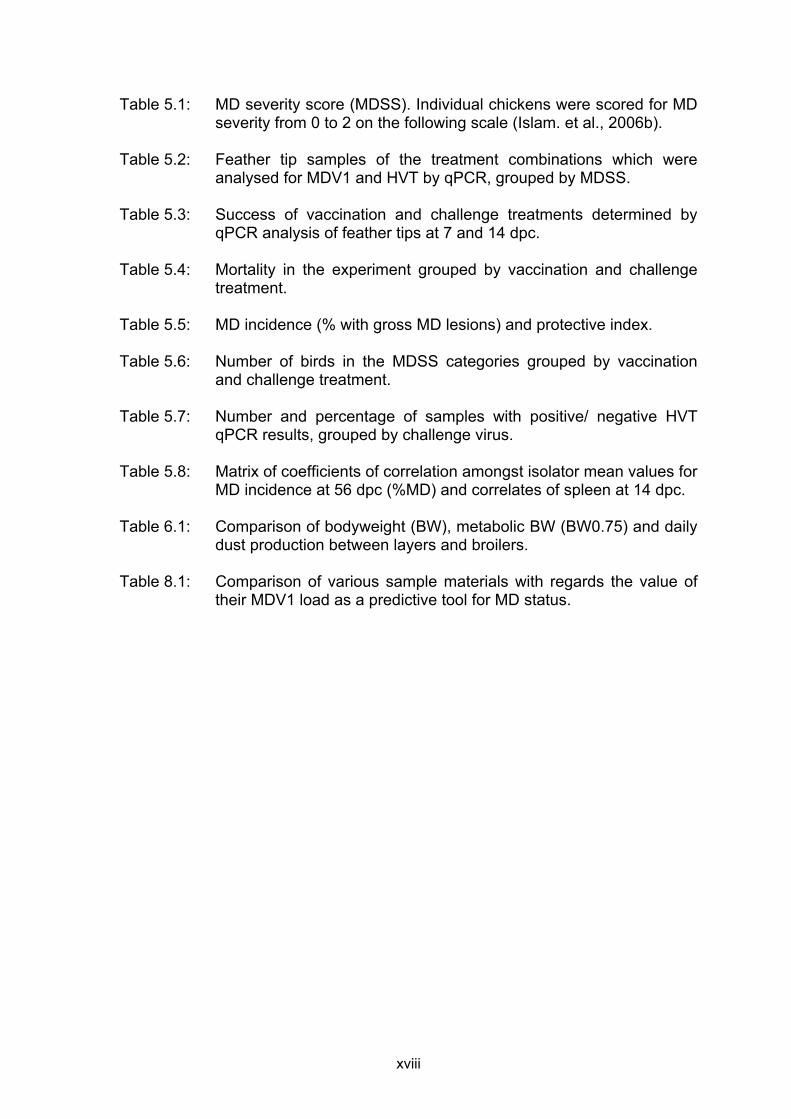
Table 5.1: MD severity score (MDSS). Individual chickens were scored for MD severity from 0 to 2 on the following scale (Islam. et al., 2006b).
Table 5.2: Feather tip samples of the treatment combinations which were
analysed for MDV1 and HVT by qPCR, grouped by MDSS. Table 5.3: Success of vaccination and challenge treatments determined by
qPCR analysis of feather tips at 7 and 14 dpc. Table 5.4: Mortality in the experiment grouped by vaccination and challenge
treatment. Table 5.5: MD incidence (% with gross MD lesions) and protective index. Table 5.6: Number of birds in the MDSS categories grouped by vaccination
and challenge treatment. Table 5.7: Number and percentage of samples with positive/ negative HVT
qPCR results, grouped by challenge virus. Table 5.8: Matrix of coefficients of correlation amongst isolator mean values for
MD incidence at 56 dpc (%MD) and correlates of spleen at 14 dpc. Table 6.1: Comparison of bodyweight (BW), metabolic BW (BW0.75) and daily
dust production between layers and broilers. Table 8.1: Comparison of various sample materials with regards the value of
their MDV1 load as a predictive tool for MD status.
xix
List of Figures
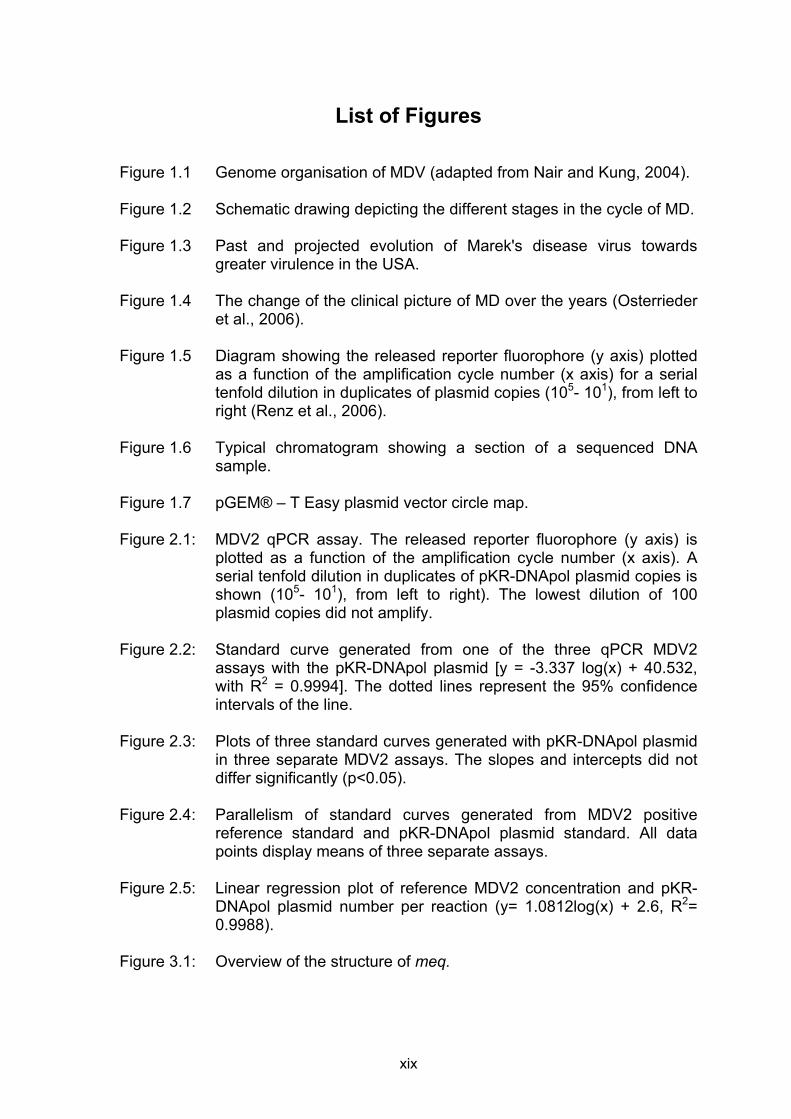
Figure 1.1 Genome organisation of MDV (adapted from Nair and Kung, 2004). Figure 1.2 Schematic drawing depicting the different stages in the cycle of MD. Figure 1.3 Past and projected evolution of Marek's disease virus towards
greater virulence in the USA. Figure 1.4 The change of the clinical picture of MD over the years (Osterrieder
et al., 2006). Figure 1.5 Diagram showing the released reporter fluorophore (y axis) plotted
as a function of the amplification cycle number (x axis) for a serial tenfold dilution in duplicates of plasmid copies (105- 101), from left to right (Renz et al., 2006).
Figure 1.6 Typical chromatogram showing a section of a sequenced DNA
sample. Figure 1.7 pGEM® – T Easy plasmid vector circle map. Figure 2.1: MDV2 qPCR assay. The released reporter fluorophore (y axis) is
plotted as a function of the amplification cycle number (x axis). A serial tenfold dilution in duplicates of pKR-DNApol plasmid copies is shown (105- 101), from left to right). The lowest dilution of 100 plasmid copies did not amplify.
Figure 2.2: Standard curve generated from one of the three qPCR MDV2
assays with the pKR-DNApol plasmid [y = -3.337 log(x) + 40.532, with R2 = 0.9994]. The dotted lines represent the 95% confidence intervals of the line.
Figure 2.3: Plots of three standard curves generated with pKR-DNApol plasmid
in three separate MDV2 assays. The slopes and intercepts did not differ significantly (p<0.05).
Figure 2.4: Parallelism of standard curves generated from MDV2 positive
reference standard and pKR-DNApol plasmid standard. All data points display means of three separate assays.
Figure 2.5: Linear regression plot of reference MDV2 concentration and pKR-
DNApol plasmid number per reaction (y= 1.0812log(x) + 2.6, R2= 0.9988).
Figure 3.1: Overview of the structure of meq.
xx
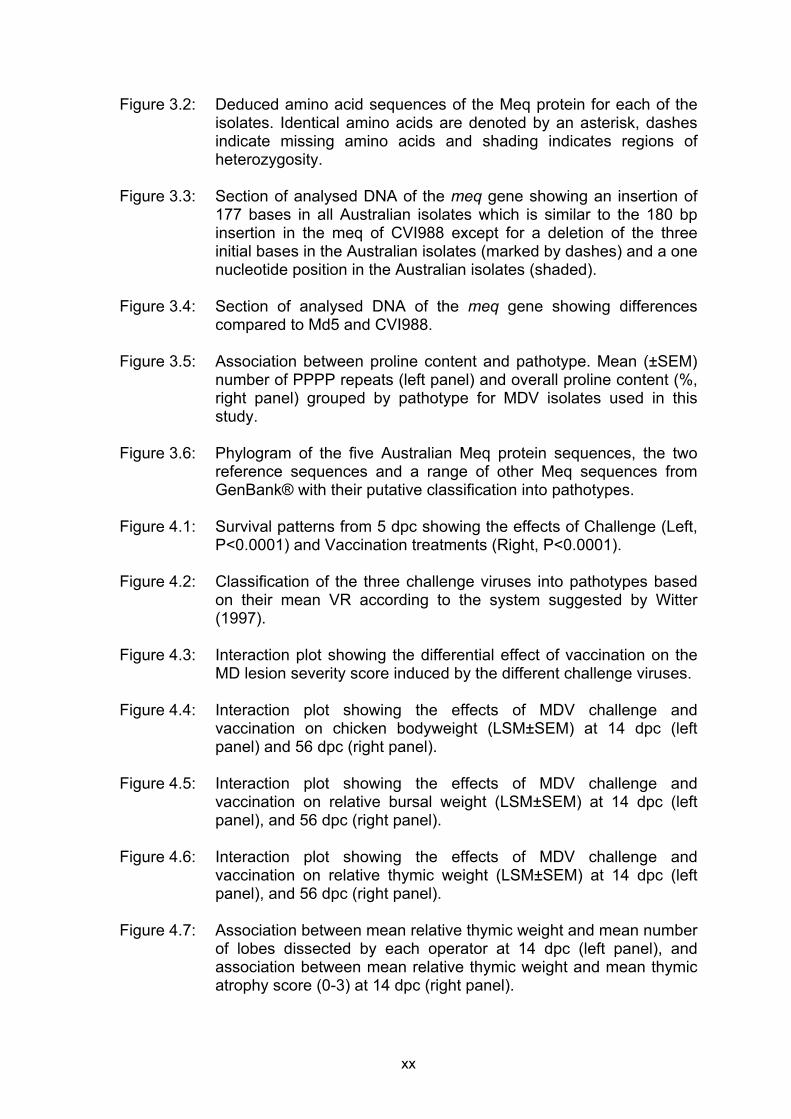
Figure 3.2: Deduced amino acid sequences of the Meq protein for each of the isolates. Identical amino acids are denoted by an asterisk, dashes indicate missing amino acids and shading indicates regions of heterozygosity.
Figure 3.3: Section of analysed DNA of the meq gene showing an insertion of
177 bases in all Australian isolates which is similar to the 180 bp insertion in the meq of CVI988 except for a deletion of the three initial bases in the Australian isolates (marked by dashes) and a one nucleotide position in the Australian isolates (shaded).
Figure 3.4: Section of analysed DNA of the meq gene showing differences
compared to Md5 and CVI988. Figure 3.5: Association between proline content and pathotype. Mean (±SEM)
number of PPPP repeats (left panel) and overall proline content (%, right panel) grouped by pathotype for MDV isolates used in this study.
Figure 3.6: Phylogram of the five Australian Meq protein sequences, the two
reference sequences and a range of other Meq sequences from GenBank® with their putative classification into pathotypes.
Figure 4.1: Survival patterns from 5 dpc showing the effects of Challenge (Left,
P<0.0001) and Vaccination treatments (Right, P<0.0001). Figure 4.2: Classification of the three challenge viruses into pathotypes based
on their mean VR according to the system suggested by Witter (1997).
Figure 4.3: Interaction plot showing the differential effect of vaccination on the
MD lesion severity score induced by the different challenge viruses. Figure 4.4: Interaction plot showing the effects of MDV challenge and
vaccination on chicken bodyweight (LSM±SEM) at 14 dpc (left panel) and 56 dpc (right panel).
Figure 4.5: Interaction plot showing the effects of MDV challenge and
vaccination on relative bursal weight (LSM±SEM) at 14 dpc (left panel), and 56 dpc (right panel).
Figure 4.6: Interaction plot showing the effects of MDV challenge and
vaccination on relative thymic weight (LSM±SEM) at 14 dpc (left panel), and 56 dpc (right panel).
Figure 4.7: Association between mean relative thymic weight and mean number
of lobes dissected by each operator at 14 dpc (left panel), and association between mean relative thymic weight and mean thymic atrophy score (0-3) at 14 dpc (right panel).
xxi
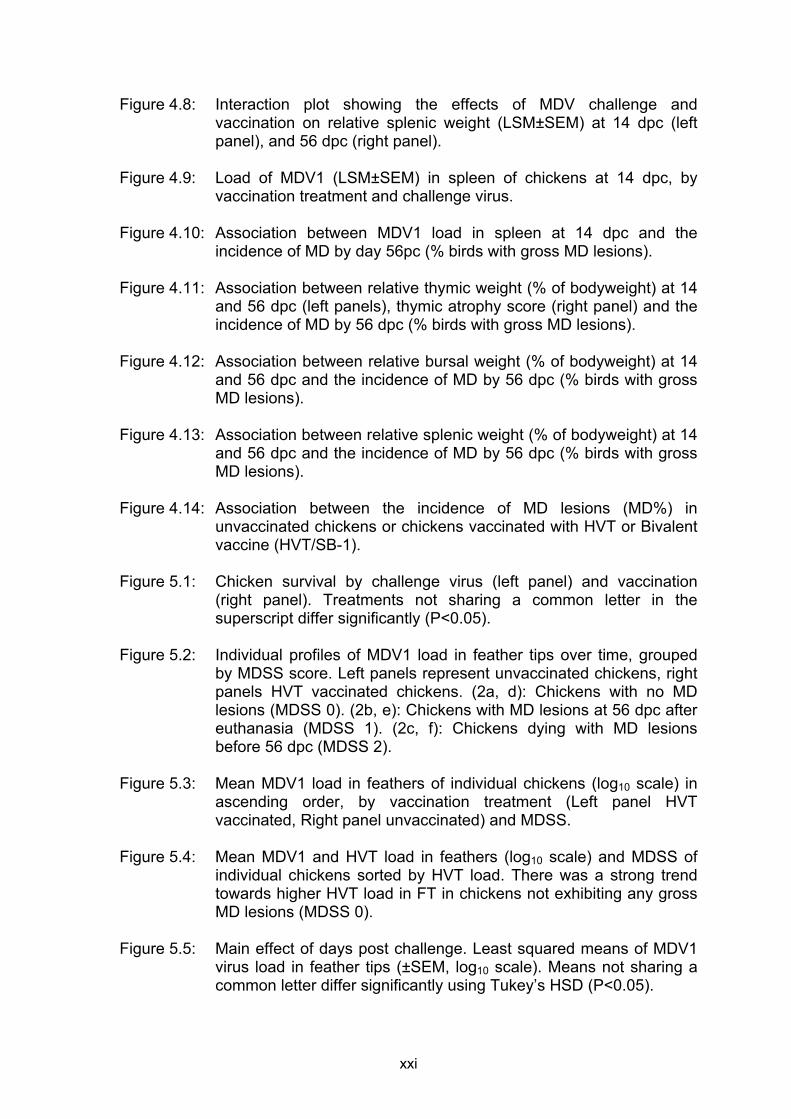
Figure 4.8: Interaction plot showing the effects of MDV challenge and vaccination on relative splenic weight (LSM±SEM) at 14 dpc (left panel), and 56 dpc (right panel).
Figure 4.9: Load of MDV1 (LSM±SEM) in spleen of chickens at 14 dpc, by
vaccination treatment and challenge virus. Figure 4.10: Association between MDV1 load in spleen at 14 dpc and the
incidence of MD by day 56pc (% birds with gross MD lesions). Figure 4.11: Association between relative thymic weight (% of bodyweight) at 14
and 56 dpc (left panels), thymic atrophy score (right panel) and the incidence of MD by 56 dpc (% birds with gross MD lesions).
Figure 4.12: Association between relative bursal weight (% of bodyweight) at 14
and 56 dpc and the incidence of MD by 56 dpc (% birds with gross MD lesions).
Figure 4.13: Association between relative splenic weight (% of bodyweight) at 14
and 56 dpc and the incidence of MD by 56 dpc (% birds with gross MD lesions).
Figure 4.14: Association between the incidence of MD lesions (MD%) in
unvaccinated chickens or chickens vaccinated with HVT or Bivalent vaccine (HVT/SB-1).
Figure 5.1: Chicken survival by challenge virus (left panel) and vaccination
(right panel). Treatments not sharing a common letter in the superscript differ significantly (P<0.05).
Figure 5.2: Individual profiles of MDV1 load in feather tips over time, grouped
by MDSS score. Left panels represent unvaccinated chickens, right panels HVT vaccinated chickens. (2a, d): Chickens with no MD lesions (MDSS 0). (2b, e): Chickens with MD lesions at 56 dpc after euthanasia (MDSS 1). (2c, f): Chickens dying with MD lesions before 56 dpc (MDSS 2).
Figure 5.3: Mean MDV1 load in feathers of individual chickens (log10 scale) in
ascending order, by vaccination treatment (Left panel HVT vaccinated, Right panel unvaccinated) and MDSS.
Figure 5.4: Mean MDV1 and HVT load in feathers (log10 scale) and MDSS of
individual chickens sorted by HVT load. There was a strong trend towards higher HVT load in FT in chickens not exhibiting any gross MD lesions (MDSS 0).
Figure 5.5: Main effect of days post challenge. Least squared means of MDV1
virus load in feather tips (±SEM, log10 scale). Means not sharing a common letter differ significantly using Tukey’s HSD (P<0.05).
xxii
Figure 5.6: (Left panel) Interaction plot of MDV1 virus load in feather tips (LSM±SEM, log10 scale) over time for the two challenge viruses. The interaction between challenge virus and days post challenge was highly significant (P<0.0001). (Right panel) Interaction plot of MDV1 virus load in feather tips (LSM±SEM, log10 scale) over time for unvaccinated and HVT vaccinated chickens. The effect of vaccine was not significant (P=0.54). Asterisks mark times when treatments differ using Tukey’s HSD (P<0.05).
Figure 5.7: Mean (LSM ±SEM) MDV1/ 106 cells in feather tips of chickens grouped by MDSS over time (log10 scale). The effect of days post challenge and MDSS was highly significant (P<0.001). The interaction between MDSS and days post challenge was not significant (P=0.32).
Figure 5.8: Mean MDV1/ 106 spleen cells at 14 dpc (LSM ±SEM, log10 scale)
grouped by challenge virus in unvaccinated and HVT vaccinated chickens. Means not sharing a common letter differ significantly using Tukey’s HSD (P<0.05).
Figure 5.9: Mean MDV1 load in dust (LSM±SEM, log10 scale) over time,
grouped by challenge isolate (left panel) and vaccination treatment (right panel). Asterisks mark times when treatments differ using Tukey’s HSD (P<0.05).
Figure 5.10: Plot of mean HVT virus load in feather tips (±SE, log10 scale) over
time. The solid line includes all chickens (many zero values) while the dashed line includes only chickens positive for HVT.
Figure 5.11: Proportion of chickens grouped by MDSS score that were positive
for HVT at each time point. Figure 5.12: (Left panel) Association between MDSS and mean log10 HVT load/
106 cells in feathers of individual chickens. Each data point represents the overall mean HVT value for one individual chicken. (Right panel) Relationship between MDV1 and HVT copy number at various days post vaccination. Each data point represents one chicken at a specific sampling time, all sampling times are included. The line is a linear regression.
Figure 6.1: MDV1 load in dander (LSM±SEM, log10 scale) over time by vaccine
treatment (Left panel) or challenge treatment (right panel). The effects of vaccine, challenge and day post challenge were significant (P<0.0001).
Figure 6.2: Interaction plot of challenge virus and vaccine. The asterisk marks
treatments which were significantly different using Tukey’s HSD test (P<0.05).
xxiii
Figure 6.3: HVT load in dander (LSM±SEM, log10 scale) over time by vaccine treatment (Left panel) or challenge treatment (right panel).The effects of challenge (P=0.59) and vaccination (P=0.95) were not significant.
Figure 6.4: MDV2 load in dander (LSM±SEM, log10 scale) over time by
challenge treatment. Chickens were vaccinated with bivalent vaccine at hatch. Each data point is the mean of two isolators in each challenge treatment. The effect of challenge was not significant (P=0.64).
Figure 6.5: (Left Panel) Interaction between the effects of MDV serotype and
dpc on viral load in dander from chickens vaccinated with bivalent vaccine and challenged with MDV1 (LSM±SEM) (n=6 isolators). (Right panel) Interaction between the effects of MDV serotype and challenge MDV on viral load in isolator exhaust dust from the same chickens (LSM±SEM) (n=6 isolators).
Figure 6.6: Mean 24 h dust production per chicken over time in randomly
selected isolators. Each data point represents the mean of six isolators.
Figure 6.7: (Left panel) Mean 24 h MDV1 shed per chicken over time by
vaccination status (LSM±SEM). Each data point represents the mean of six isolators. (Right panel) Mean 24 h MDV2/HVT shed per chicken over time (LSM±SEM). For MDV2, each data point represents the mean of two isolators, for HVT, each data point represents the mean of three isolators.
Figure 6.8: Association between MDV1 load in isolator exhaust dust at 7, 14 and 21 dpc and the incidence of MD by 56 dpc (% birds with gross MD lesions) in chickens challenged with MDV1 (unchallenged isolators excluded). Each point represents one isolator. The lines are linear regression curves.
Figure 6.9: Association between MDV2 load in isolator exhaust dust at 33, 40,
47 (upper panel), 54 and 61 dpv (lower panel) and the incidence of MD by 56 dpc (61 dpv, % birds with gross MD lesions) in chickens challenged with MDV1 (unchallenged isolators excluded). Each point represents one isolator. The lines are linear regression curves.
Figure 7.1: Mean incidence of feather pecking by treatment (left panel) and by
treatment and week of the experiment (right panel). Figure 7.2: Mean feather coverage score by treatment (left panel) and by
treatment and chicken age (right panel). Figure 7.3: Mean skin injury score by treatment (left panel) and by chicken age
(right panel).
xxiv
Figure 8.1: Association between MD incidence (%MD) induced in Cobb broilers and ISABROWN layers either unvaccinated, or vaccinated with HVT or bivalent vaccine (graph adapted with permission of Prof. S. W. Walkden-Brown).
xxv
Abstract
Chapter 1 reviews the literature on Marek’s disease relevant to the work carried
out in this thesis. Methods for TaqMan® quantitative real-time PCR (qPCR)
assays to detect the three serotypes of Marek’s disease virus (MDV) are already
available, and absolute quantification has been developed for MDV serotype 1
and serotype 3. The development of a method for absolute quantification of
Marek’s disease virus serotype 2 (MDV2) is described in Chapter 2. Using
plasmid DNA, the lower detection limit of the MDV2 assay was determined to be
10 copies of the viral genome. Three independent assay runs showed highly
reproducible Ct values and calculated copy numbers, with mean intra- and inter-
assay coefficients of variation of less than 3 % for Ct and 21.5 % for calculated
copy number. Absolute quantification of MDV2 was performed successfully on
dust samples collected from poultry farms across Australia, material from
infectious spleens and feather tips from chickens vaccinated with an avirulent
strain of MDV2. Thus, it is now possible to use qPCR assays for absolute
quantification of all three serotypes of MDV in a sample.
The sequencing of the meq gene of 5 Australian isolatres of MDV1 isolated
between 1992 and 2004 which had been pathotyped in an experiment using
unvaccinated and HVT-vaccinated specific pathogen free (SPF) chickens is
reported in Chapter 3. The sequencing results were compared with a range of
MDV1 meq sequences published in GenBank® and associations with virulence
examined. Compared to the USA strain Md5, there was a 177 bp insertion as well
as distinct point mutations in all of the five isolates. There was no clear
association between ascribed pathotype and meq sequence amongst Australian
isolates, but amino acid alignment revealed that the number of repeats of
sequences of 4 prolines in the meq gene (overall range 2-8) was strongly
associated with pathotype across all strains with the most pathogenic strains
having the fewest such repeats. All of the Australian isolates had 5 such repeats
placing them in the moderately virulent range. The number of PPPP repeats was
more closely associated with pathotype than the overall percentage of P in the
Meq protein. A phylogenetic tree based on published meq sequences from a
xxvi
range of American, Asian and European isolates placed the Australian isolates as
a separate group within a clade of attenuated and lower virulence isolates
containing the 177-180 bp insertion. Our results suggest that the insertion is not
an indicator of marked attenuation or low pathogenicity in its own right, as the
Australian isolates all contained the insertion but induced MD in 53-94 % of
challenged chickens. Rather, the number of PPPP repeats, independent of the
presence of the insertion is a better indicator of pathogenicity. In general the
insertion will increase the number of such repeats, leading to its association with
reduced virulence.
Two recent Australian isolates of MDV1, 02LAR and 04CRE, which showed a
range in pathogenicity in a previous experiment using specific pathogen free
(SPF) chickens, were evaluated for pathogenicity in commercial layer chickens
against the reference isolate MPF57 (Chapter 4). An adaptation of the USDA
ADOL pathotyping method was used which involved measuring MD incidence in
unvaccinated chickens and those vaccinated with HVT and HVT/MDV2 bivalent
vaccines and determining vaccinal protective index. There was clear
differentiation of the 3 challenge viruses with 02LAR inducing significantly more
MD (57.5 %) than MPF57 (45.8 %) which in turn induced significantly more MD
than 04CRE (30.8 %). There was also clear differentiation of HVT and Bivalent
vaccines, with HVT providing a mean protective index of 43.8 % and the Bivalent
vaccine 67.2 %. Compared to a similar recent study in commercial Cobb broiler
chickens, the results of the layer study indicated that the genetic background of
the host plays a vital role in the expression of MD in both vaccinated and
unvaccinated chickens and can significantly affect virulence ranks.
Serotype-specific quantitative real-time PCR (qPCR) assays were used to
investigate the shedding profile of all three MDV serotypes in feather tips (FT) of
individual layer chickens (Chapter 5) and isolator exhaust dust from the
pathotyping experiment reported in chapter 4 (Chapter 6). Feather dust
production by layer chickens and subsequent shedding of virus in the
dust/environment were also determined and results compared to the related
earlier study in broiler chickens. All three serotypes were detected from 7 days
post challenge (dpc) onwards in both feather tips and dust and continued to be
shed throughout the experimental period until 56 dpc.
xxvii
In the feather tips (Chapter 5), there was no effect of both vaccination (P=0.54)
on MDV1 load but there was a marked effect of challenge isolate which was
dependant on the time after challenge. The more virulent isolate (02LAR) had
significantly higher MDV load in FT up to 21 dpc than the less virulent MPF57, but
by day 35 the situation was reversed with 02LAR having very much lower MDV1
load, which continued for two weeks thereafter. This effect was linked with a
marked reduction in MDV1 load in FT observed after 21 dpc in chickens that went
on to develop MD tumours by 56 dpc had significantly lower load of MDV1 and
HVT in feather tips (P<0.05). This is a novel and unexpected finding and the
underlying mechanisms behind it are unknown. The lower level of MDV1 in FT of
chickens going on to develop MD helps explain the lack of an effect of vaccination
on MDV1 in FT as the expected effect of vaccination of reducing MDV1 load
would have been negated by the lower MDV values in unvaccinated chickens,
most of which went on to develop MD. There was no relationship between MDV1
and HVT load in feather tips of individual chickens, either overall (R2=0.0088,
P=0.18), or at any individual time point. A significant positive association between
MDV1 load in feathers and subsequent MD on a whole isolator basis was only
present at 14 dpc. This study has shown that despite the fact that feather tips can
be easily and regularly sampled, and are easy to store and transport, their value
as a prediction tool for subsequent MD outcome, is confounded by differential
effects on MDV load at different times. In this regard, MDV load in other tissues
such as spleen, peripheral lymphocytes or even dander which have been shown
to be closely related to MD outcome and are therefore likely to be superior to
feathers as robust predictors of future MD status.
In the MDV dust study (Chapter 6), the effect of vaccination with HVT and
bivalent vaccine was clearly demarcated from 14 dpc. HVT significantly reduced
MDV1 load relative to unvaccinated chickens by 4.7 % overall and the bivalent
vaccine reducing it significantly further, by 9.8 %. The MDV1 load in dander also
varied significantly in proportion to virulence, with the most virulent virus (02LAR)
inducing the highest levels of shedding. Differences in shedding between
challenge viruses were greatest at day 14 but were sustained throughout the
experiment. This is the first report of increased shedding of MDV with increasing
virulence, an important consideration in the modelling of evolution in virulence of
xxviii
MDVs. Unlike MDV1, HVT and MDV2 load in dander decreased after 19-26 days
post vaccination with a subsequent increase again around 54 days post
vaccination. There were strong relationships seen between the amount of MDV1
in dust and subsequent MD outcome at 14-49 dpc, but a poor relationship was
evident at 7 dpc, which is likely because of a sparing effect of maternal
antibodies. Measurement of MDV1 load in dust in groups of birds in the first few
weeks prior to challenge appeared to have excellent potential to predict MD
outcomes and replace full pathotyping experiments. These measurements can be
made prior to the onset of clinical MD, offering significant ethical advantages. This
study is the most powerful demonstration to date of the utility of qPCR assays in
poultry dust which integrates information from a number of birds in a single
sample.
Chapter 7 reports a behavioural study which aimed to reduce feather pecking in
layer chickens kept in isolators for research purposes by inclusion of bunches of
string and/or a sand box in a 49 day experiment in non beak trimmed SPF white
leghorn chickens. Inclusion of string from day 0 significantly reduced the
incidence of feather pecking and skin injury and significantly improved (P<0.001)
feather coverage and feather condition score. Inclusion of a sand box from day 14
onwards did not significantly affect these variables although there was a trend for
improvement in each case, particularly when combined with the presence of
string. The inclusion of a sand box at day 0 warrants further investigation. This
shows that simple environmental enrichment within isolators can lead to a
significant reduction in feather pecking behaviour and now routinely include string
in our experiments.
Chapter 8 presents a general discussion of the thesis with conclusions about
application of the findings and future work.
xxix
List of abbreviations
A Adenine aa Amino acid ab Antibody AEC Animal Ethics Committee ALV Avian Leukosis Virus ANOVA Analysis of variance AP-1 Activator protein 1, a transcription factor ATF Activation transcription factor BAC Bacterial artificial chromosome B-cell Bursa-derived cell BHQ Black hole quencher BLAST Basic local alignment search tool bp Base pairs BSA Bovine serum albumin bZIP Basic leucine zipper Bursa Bursa of Fabricius BW/BWT Body weight C Cytosine CAV Chicken infectious anaemia virus CD4+ A subpopulation of T cells that express the CD4 receptor. Also
referred to as T helper cells. CD8+ A subpopulation of T cells that express the CD8 receptor. Also
known as cytotoxic T cells. CEF Chicken embryo fibroblasts CEKC Chicken embryo kidney cells CKC Chicken kidney cells cm Centimeter CMI Cell-mediated immunity CPE Cytopathic effect (in cell culture) cDNA Complimentary DNA CNS Central nervous system CSIRO Australian Commonwealth Scientific and Industrial Research
Organisation Ct Critical threshold value CV Coefficient of variance CXC Chemokine CY5 Fluorescent reporter dye Da Dalton DEF Duck embryo fibroblasts DMSO Dimethyl sulfoxide DNA Deoxyribonucleic acid DNase Deoxyribonuclease dNTP generic term referring to the four deoxyribonucleotides: dATP,
dCTP, dGTP and dTTP DPC/dpc Days post-challenge DPI/dpi Days post-infection
xxx
DPV/dpv Days post-vaccination ds Double stranded EARC Ellipsoid-associated cell EBV Epstein Barr Virus Exp Exposure FAM 5 carboxyfluorescein (Fluorescent reporter dye) FFE Feather follicle epithelium Fos An oncogene, identified in a mouse osteosarcoma, encoding a
transcription factor FRET Fluorescence Resonance Energy Transfer FT Feather tip G Guanine g Gram h Hour HEPA High Efficiency Particulate air HEX Fluorescent reporter dye HSV-1 Herpes Simplex Virus-1 HVT Herpesvirus of Turkeys. Also known as Meleagrid herpesvirus 1
(MeHV-1) and Marek’s disease virus serotype 3 (MDV3). HWL Hybrid white leghorn IA/ia Intra-abdominal ICTV International Committee on Taxonomy of Viruses IP/ip Intra-peritoneal ICP Intracellular protein IFN Interferon Ig Immunoglobulin IL Interleukin IPTG isopropyl-β-D-thiogalactopyranosidase IRL Internal repeat long region of the MDV genome IRS Internal repeat short region of the MDV genome Jun Retrovirus-associated DNA sequence (jun) originally isolated from
the avian sarcoma virus 17 (asv 17). A proto-oncogene. kDa Kilo dalton kb Kilo base pairs LORF Long open reading frame LSM Least squares means mab maternal antibody MATSA Marek’s disease-associated tumour surface antigen mb Mega base pairs MCS Multiple cloning site MD Marek’s disease MDSS Marek’s disease severity score MDV Marek’s disease virus MDV1 Marek’s disease virus serotype 1. Also known as Gallid
herpesvirus 2 (GaHV-2). MDV2 Marek’s disease virus serotype 2. Also known as Gallid
herpesvirus type 3 (GaHV-3). MEM Minimal essential medium meq Marek’s EcoRI-Q encoded gene MHC Major histocompatibility complex
xxxi
min Minute mM Millimolar mMDV Mild MDV. A pathotype under the USDA ADOL classification.
MDV, which induces mainly paralysis and nerve lesions. HVT provides good protection.
ml Millilitre mRNA Messenger RNA ng Nanogram NK Natural killer nm Nanometer NO Nitric oxide ORF Open reading frame PBL Peripheral blood lymphocytes PBMC Peripheral blood mononuclear cells PBS Phosphate buffered saline pc Post challenge PC2 Physical contamination level 2 laboratory PCR Polymerase chain reaction (conventional, end point form) Pfu/PFU Plaque forming units PI Protective index. (%MD in Sham-vaccinated chickens – %MD in
HVT-vaccinated chickens) ÷ (%MD in Sham-vaccinated chickens) x 100
pp Phosphoprotein pv Post vaccination qPCR Quantitative real-time PCR qRT-PCR Quantitative reverse transcriptase real-time PCR REML Restricted maximum likelihood REV Reticuloendotheliosis virus RL Repeat long region of the MDV genome RMIT The Royal Melbourne Institute of Technology (RMIT University). RNA Ribonucleic acid RNase Ribonuclease ROX Fluorescent reporter dye rpm Revolutions per minute RS Repeat short region of the MDV genome RT-PCR Reverse transcriptase PCR (conventional, end point form) s Second sc subcutaneous SEM Standard error of the mean SNP Single nucleotide polymorphism SORF Short open reading frame SPF Specific pathogen free T Thymine T-cell Thymus-derived cell TR Telomerase TRL Terminal repeat long region of the MDV genome TRS Terminal repeat short region of the MDV genome µg Microgram µl Microliter UNE The University of New England
xxxii
UL Unique long region of the MDV genome US Unique short region of the MDV genome USDA ADOL United States Department of Agriculture Avian Diseases and
Oncology Laboratory VCN Viral copy number vIL Viral interleukin vMDV Virulent MDV. A pathotype under the USDA ADOL classification.
MDV, which causes low levels of mortality by day 56pc, but induces lymphomas and nerve lesions in a high proportion of susceptible unvaccinated chickens. HVT provides good protection.
vvMDV Very virulent MDV. A pathotype under the USDA ADOL classification. MDV, which causes moderate levels of mortality by day 56pc and induces lymphomas and nerve lesions in a high proportion of susceptible unvaccinated chickens. HVT is only partially protective but HVT/MDV2 vaccines provide a high level of protection.
vv+MDV Very virulent plus MDV. A pathotype under the USDA ADOL classification. MDV, which causes high levels of mortality by day 56pc and induces lymphomas and nerve lesions in a high proportion of susceptible unvaccinated chickens. HVT and HVT/MDV2 are only partially protective.
VN Virus neutralising VP Virus protein VR Virulence rank (100 – PI) vTR Viral telomerase RNA subunit VZV Varicella Zoster Virus wk Week wo week old WT-1 Wilm’s tumour suppressor protein X-gal 5-bromo-4-chloro-3-indolyl-β-galactoside YAC Yeast artificial chromosome