Embed Size (px)
Citation preview
In vivo and in vitro studies of immunodeficiency
in
Ataxia-telangiectasia
by
Ellen F. Carney
A thesis submitted to
The University of Birmingham
for the degree of
DOCTOR OF PHILOSOPHY
School of Cancer Sciences College of Medical and Dental Sciences
The University of Birmingham September 2010

University of Birmingham Research Archive
e-theses repository This unpublished thesis/dissertation is copyright of the author and/or third parties. The intellectual property rights of the author or third parties in respect of this work are as defined by The Copyright Designs and Patents Act 1988 or as modified by any successor legislation. Any use made of information contained in this thesis/dissertation must be in accordance with that legislation and must be properly acknowledged. Further distribution or reproduction in any format is prohibited without the permission of the copyright holder.
Abstract
Ataxia-telangiectasia (A-T) is a rare neurodegenerative disorder caused by mutations in the
ATM gene which has a central role in the cellular response to DNA double strand breaks, cell
cycle checkpoint control and initiation of the intrinsic pathway of apoptosis. Ataxia-
telangiectasia is classified as an immunodeficient disorder with patients commonly showing
lymphopenia and abnormalities in immunoglobulin production. They also have a high
incidence of leukaemia and lymphoma at young ages. I used multicolour flow cytometry and
immunological assays to characterise lymphocyte subsets in a group of 18 A-T patients and
analysed the sensitivity of A-T lymphoblastoid cell lines to CD95-mediated apoptosis. I also
investigated the potential role for ATM in immune surveillance via DNA damage-induced
upregulation of NKG2D ligands. My results confirm a deficiency in naive T and B cells as well
as high expression of the death receptor CD95 on all lymphocyte subsets excluding NK cells
which together may explain the lymphopaenia in A-T. Analysis of the sensitivity of A-T LCLs
to CD95-mediated apoptosis showed increased sensitivity of these cells to apoptosis but
there was no evidence for a role of ATM in regulating either CD95 or cFLIP expression.
Consistent with this was the increased sensitivity to CD95-mediated apoptosis of T cell
prolymphocytic leukaemia (T-PLL) cells. The cause of the tumour is primary loss of ATM
activity (either germline loss similar to A-T LCLs or somatic loss) allowing chromosome
translocations with malignant potential, as a result of a defect in immune system gene
rearrangements. An immediate consequence for A-T patients is an immunodeficiency that is
not progressive, but may be described as ‘congenitally aged’. Immunodeficiency per se is
not the cause of cancer in A-T but both immunodeficiency and cancer are consequences of
the same basic ATM defect affecting the lymphoid system. There was no evidence of a role
for ATM in NKG2D ligand upregulation following DNA damage.

For the virtual student, who may not have worn a lab coat in over thirty years but is still a
scientist at heart.

Acknowledgements
Firstly I would like to thank my supervisors Paul Moss and Malcolm Taylor for their valuable
advice, reviewing of this thesis and the many meetings. I am also grateful to everyone who
helped me in the lab or gave me reagents, without them this project would not have been
possible. In particular Venkat Srinivasan sequenced the mutations in the A-T PBMCs, Phil
Byrd made the panel of isogenic LCLs, Malcolm Taylor made the A-T LCLs, Tanya Stankovic
gave me the B-CLL samples, Jade Harris coordinated the selection of control PBMC samples,
James Last taught me western blots, Andy McLarnon taught me how to use the LSRll and
Oliver Goodyear taught me immunological assays and tissue culture techniques including the
‘black art’ of T cell cloning. Thanks also to Karen Piper for her advice, Annette Pachnio for
proof reading and all my friends in cancer studies for the chats, coffee breaks, cinema trips,
meals out and nights in the pub all of which made my PhD a more enjoyable experience. I
would also like to thank my family, my parents for their emotional and financial support,
Hannah for proof reading and Graeme for making me laugh. Finally thank you to Andy for
solving my IT crises, reading sections of my thesis, helping me print, keeping me calm and
generally looking after me throughout my PhD.
Table of Contents
Table of Contents
Chapter 1: Introduction. ............................................................................................................ 1
1:1: Ataxia-telangiectasia, the ATM gene and ATM protein kinase. ..................................... 2
1:1:1: Ataxia-telangiectasia. ............................................................................................... 2
1:1:2: The ATM gene. ......................................................................................................... 2
1:1:3: ATM protein kinase. ................................................................................................. 3
1:2: ATM regulates the cellular response to DNA double strand breaks. ............................. 5
1:2:1: ATM is activated in response to DNA double strand breaks. .................................. 5
1:2:2: ATM activates cell cycle checkpoints in response to DNA double strand breaks. .. 8
1:2:3: ATM activates pathways of DNA double strand break repair. ................................ 8
1:2:4: ATM activates the intrinsic apoptotic pathway in response to severe DNA damage
and may also be involved in other apoptotic pathways. .................................................. 12
1:3: The immune system in Ataxia-telangiectasia. .............................................................. 16
1:3:1: Ataxia-telangiectasia patients have immune system abnormalities. .................... 16
1:3:2: ATM has an important role in T cell development. ............................................... 17
1:3:3: ATM has an important role in B cell development. ............................................... 22
1:4: Other effects of ATM mutations. .................................................................................. 24
1:4:1: ATM mutations result in a defective response to oxidative stress........................ 24
1:4:2: ATM mutations predispose to cancer. ................................................................... 26
1:5: Ataxia-telangiectasia-related disorders. ....................................................................... 28
1:5:1: Ataxia-telangiectasia-like disorder. ........................................................................ 28
Table of Contents
1:5:2: Nijmegen breakage syndrome. .............................................................................. 28
1:5:3: NBS-like disorder. ................................................................................................... 29
1:5:4: RIDDLE syndrome. .................................................................................................. 29
1:5:5: Ataxia occulomotor apraxia 1 and 2. ..................................................................... 30
1:5:6: Spinocerebellar apraxia with axonal neuropathy. ................................................. 31
1:6: Current and future treatment strategies for Ataxia-telangiectasia. ............................ 33
1:6:1: Antioxidants. .......................................................................................................... 33
1:6:2: Steroids. ................................................................................................................. 33
1:6:3: Mutation-targeted therapies. ................................................................................ 34
1:7: Aims & Objectives. ........................................................................................................ 34
Chapter 2: Materials and Methods. ........................................................................................ 36
2:1: Collection and preparation of blood samples. ............................................................. 37
2:1:1: Donors. ................................................................................................................... 37
2:1:2: Isolation of PBMCs. ................................................................................................ 37
2:1:3: Freezing and storage of PBMCs. ............................................................................ 37
2:2: Cell culture. ................................................................................................................... 38
2:2:1: Lymphoblastoid cell lines. ...................................................................................... 38
2:2:2: Fibroblasts. ............................................................................................................. 38
2:2:3: HeLa, K562 and LB23 SARC. ................................................................................... 38
2:2:4: T cell cloning. .......................................................................................................... 39
2:3: Flow cytometry. ............................................................................................................ 41
Table of Contents
2:3:1: Phenotyping of lymphocyte subsets. ..................................................................... 41
2:3:2: Analysis of CD95 expression and CD95-mediated apoptosis. ............................... 42
2:3:3: Analysis of perforin/granzyme cytotoxic T cell killing using CFSE. ........................ 42
2:3:4: Analysis of NKG2D ligand expression on LCLs, fibroblasts and B cells. ................. 43
2:4: Western blots. ............................................................................................................... 44
2:4:1: Analysis of ATM activation, cFLIP expression and ATM activation. ....................... 44
2:4:2: siRNA knockdown of cFLIP. .................................................................................... 45
2:5: Activation and inhibition of ATM activity. .................................................................... 45
2:5:1: Activation of ATM. ................................................................................................. 45
2:5:2: Inhibition of ATM. .................................................................................................. 46
2:6: ELISAS ............................................................................................................................ 46
2:6:1: Measurement of plasma cytokine concentrations. ............................................... 46
2:6:2: Interferon gamma ELISA assay. .............................................................................. 46
2:7: Chromium release. ........................................................................................................ 48
2:7:1: CH11 Killing assays. ................................................................................................ 48
2:7:2: Cytotoxicity assays. ................................................................................................ 48
2:7:3: CD95 and perforin blocking assays. ....................................................................... 49
2:8: Statistical methods. ...................................................................................................... 49
Chapter 3: Phenotyping of A-T and normal PBMCs. ............................................................... 51
3:1: Introduction. ................................................................................................................. 52
3:2: PBMC sample collection, cell counts and correlations with age. ................................. 56
Table of Contents
3:2:1: PBMC sample collection, selection and age matching. ......................................... 56
3:2:2: PBMC cell counts and correlations with age.......................................................... 61
3:3: Analysis of lymphocyte subsets by flow cytometry. ..................................................... 63
3:3:1: Lymphocyte subsets can be defined using an eleven colour antibody panel. ...... 63
3:3:2: Lymphocyte subsets. .............................................................................................. 70
3:3:3: CD4+ and CD8+ T cells. ........................................................................................... 73
3:3:4: Naive and memory T cells. ..................................................................................... 76
3:3:5: Naive and memory B cells. ..................................................................................... 82
3:3:6: CD56bright and CD56dim NK cells. ........................................................................ 85
3:3:7: A-T patients with no ATM activity had a significantly lower percentage of naive
cells and higher percentage of memory cells than normal controls. ............................... 88
3:4: CD95 expression. .......................................................................................................... 92
3:4:1: CD95 expression on lymphocyte subsets. ............................................................. 92
3:4:2: CD95 expression on CD4+ and CD8+ T cells. .......................................................... 97
3:4:3: CD95 expression on naive and memory T cells. .................................................. 101
3:4:4: CD95 expression on naive and memory B cells. .................................................. 110
3:4:5: CD95 expression on CD56dim and CD56bright NK cells. ..................................... 114
3:4:6: CD95 expression was significantly increased on A-T lymphocytes compared to
normal controls. .............................................................................................................. 118
3:5: FasL expression. .......................................................................................................... 122
3:5:1: FasL expression on lymphocyte subsets. ............................................................. 122
3:5:2: Fas Ligand expression on CD4+ and CD8+ T cells................................................. 127
Table of Contents
3:5:3: Fas Ligand expression on naive and memory T cells. .......................................... 131
3:5:4: Fas ligand expression on naive and memory B cells. ........................................... 138
3:5:5: FasL expression on CD56bright and CD56dim NK cells. ....................................... 142
3:5:6: FasL MFI was reduced on lymphocytes from A-T patients with no ATM activity
compared to normal controls. ........................................................................................ 146
3:6: CD127 expression. ...................................................................................................... 150
3:6:1: CD127 expression on lymphocyte subsets. ......................................................... 150
3:6:2: CD127 expression on CD4+ and CD8+ T cells. ...................................................... 155
3:6:3: CD127 expression on naive and memory T cell subsets. ..................................... 159
3:6:4: CD127 expression on CD56dim and CD56bright NK cells. ................................... 167
3:6:5: Lymphocytes from A-T patients with no ATM activity express normal levels of
CD127. ............................................................................................................................. 171
3:7: Measurement of plasma cytokine concentrations by ELISA. ..................................... 176
3:7:1: Plasma cytokine concentrations of IL-7, IL-15 and IL-21. .................................... 176
3:8: Correlations between IL-7 concentrations, percentages of lymphocyte subsets and
expression of CD95, FasL and CD127. ................................................................................. 181
3:8:1: IL-7 concentration and lymphocyte subsets. ....................................................... 181
3:8:2: IL-7 concentration and CD95 expression on lymphocyte subsets. ...................... 185
3:8:3: IL-7 concentration and FasL expression on lymphocyte subsets. ........................ 193
3:8:4: IL-7 concentration and CD127 expression on lymphocyte subsets. .................... 200
Table of Contents
3:8:5: IL-7 concentration correlated positively with CD95 expression on CD4+ve T cells
and negatively with FasL expression on CD4+ve and CD8+ve T cells in A-T patients with
no ATM activity. .............................................................................................................. 205
3:9: Discussion. .................................................................................................................. 209
3:9:1: A-T patients were deficient in naive lymphocytes and had increased NK and NKT
cells. ................................................................................................................................. 209
3:9:2: A-T patients had increased CD95 expression. ...................................................... 212
3:9:3: A-T patients had reduced FasL expression. ......................................................... 214
3:9:4: A-T patients had normal CD127 expression. ....................................................... 216
3:9:5: A-T patients had normal plasma concentrations of IL-7. ..................................... 217
3:9:6: The immune system of A-T patients is congenitally aged. .................................. 218
Chapter 4: Investigating the sensitivity of A-T cells to CD95-mediated apoptosis. .............. 227
4:1: Introduction ................................................................................................................ 228
4:2: Development of assays for testing the sensitivity of LCLs to CD95-mediated apoptosis.
............................................................................................................................................ 231
4:2:1: Lymphoblastoid cell lines ..................................................................................... 231
4:2:2: Induction of cell death by CH11. .......................................................................... 234
4:2:3: Confirmation of the mechanism of cytotoxicity of CH11. ................................... 237
4:2:4: Analysing the sensitivity of LCLs to CH11-induced apoptosis using flow cytometry.
......................................................................................................................................... 244
4:2:5: Apoptosis assays using T cell clones. ................................................................... 247
4:3: Investigation of the effect of ATM mutations on CD95 expression. .......................... 252
Table of Contents
4:3:1: CD95 expression on normal and A-T LCLs. ........................................................... 252
4:3:2: The effect of inhibition of ATM activity on constitutive CD95 expression. ......... 255
4:3:3: The effect of ATM activation on cell surface expression of CD95. ...................... 259
4:4: The effect of ATM mutation on the sensitivity of A-T LCLs to CH11-induced apoptosis.
............................................................................................................................................ 262
4:4:1: Comparing the sensitivity of A-T and normal LCLs to CH11-induced apoptosis.. 262
4:4:2: The effect of CD95 expression on the viability in culture of A-T and normal LCLs.
......................................................................................................................................... 268
4:4:3: Comparing the sensitivity of normal and A-T LCLs to apoptosis induced by very
low concentrations of CH11. ........................................................................................... 270
4:4:4: Comparing the rate of CH11-induced apoptosis in normal and A-T LCLs. ........... 272
4:4:5: Analysis of the effect of ATM inhibition on the sensitivity of LCLs to CH11-induced
apoptosis. ........................................................................................................................ 276
4:5: cFLIP expression in normal and A-T LCLs. ................................................................... 280
4:5:1: Analysis of cFLIPL and cFLIPS expression by western blot. .................................. 280
4:5:2: cFLIP protein expression in normal and A-T LCLs ................................................ 287
4:5:3: Caspase 8 activation and cFLIP degradation in response to CH11 treatment. .... 293
4:5:4: The effect of ATM activation on cFLIP protein expression. ................................. 296
4:5:5: The effect of ATM inhibition on cFLIP expression. .............................................. 299
4:6: Analysis of the role of EBV in regulation of apoptotic sensitivity. ............................. 302
4:6:1: LMP1 expression in A-T and normal LCLs. ........................................................... 302
Table of Contents
4:7: Investigating the effect of ATM mutation on sensitivity to CD95-mediated apoptosis
using isogenic LCLs. ............................................................................................................. 307
4:7:1: Analysis of cFLIP and CD95 expression and sensitivity to CH11-induced apoptosis
of isogenic LCLs. .............................................................................................................. 307
4:8: ATM mutations and tumour resistance to CD95-mediated apoptosis. ..................... 314
4:8:1: Analysis of the sensitivity to CD95-mediated apoptosis of B-CLL and T-PLL
tumours. .......................................................................................................................... 314
4:9: Discussion. .................................................................................................................. 321
4:9:1: A-T LCLs showed increased sensitivity to CD95-mediated apoptosis. ................. 321
4:9:2: The immune system phenotype of A-T is similar to that of other lymphopenic
conditions associated with increased sensitivity to CD95-mediated apoptosis. ............ 323
4:9:3: T-PLL tumours were sensitive and B-CLL tumours resistant to CD95-mediated
apoptosis. ........................................................................................................................ 325
4:9:4: Loss of ATM function increases sensitivity to CD95-mediated apoptosis. .......... 326
Chapter 5: Investigating the role of ATM in DNA damage-induced upregulation of NKG2D
Ligands. ................................................................................................................................... 328
5:1: Introduction ................................................................................................................ 329
5:2: NKG2D ligand expression on LCLs. .............................................................................. 331
5:2:1: Detection of NKG2D ligand expression by flow cytometry. ................................ 331
5:2:2: NKG2D ligand expression on LCLs. ....................................................................... 333
5:2:3: The effect of irradiation-induced DNA damage on NKG2D ligand expression on
LCLs. ................................................................................................................................. 338
Table of Contents
5:3: MICA expression on B cells. ........................................................................................ 342
5:3:1: The effect of irradiation-induced DNA damage on MICA expression on normal B
cells. ................................................................................................................................. 342
5:4: NKG2D ligands expression on fibroblasts. .................................................................. 347
5:4:1: The effect of irradiation-induced DNA damage on NKG2D ligand expression on
fibroblasts. ....................................................................................................................... 347
5:5: Discussion. .................................................................................................................. 350
Chapter 6: General Discussion ............................................................................................... 352
References. ............................................................................................................................. 361
Appendix. ................................................................................................................................ 376
Appendix 1: Testing the ‘normality’ of anonymous surplus diagnostic blood samples. ... 377
List of Figures
List of Figures
Fig 1:2:1: ATM is activated in response to DNA double strand breaks. .................................... 7
Fig 1:2:3: DNA repair by non-homologous end joining and homologous recombination. ..... 10
Fig 1:2:4: Mechanisms of apoptosis. ....................................................................................... 15
Fig 3:2:1: A-T patients and normal controls were age matched. ............................................ 60
Fig 3:2:2: A-T patients were lymphopenic and there was no significant correlation between
age and cell count over the 1-30 year age range. .................................................................... 62
Fig 3:3:1: Gating to define lymphocyte subsets using the eleven colour antibody panel. ..... 66
Fig 3:3:2: A-T patients with no ATM activity had a significantly lower percentage of T cells
and higher percentage of NK cells than normal controls. ........................................................ 71
Fig 3:3:3: There was no significant difference between the percentage of CD4+ or CD8+ T
cells in A-T patients and normal controls. ................................................................................ 74
Fig 3:3:4: A-T patients with no ATM activity had a significantly smaller percentage of naive T
cells and higher percentage of memory T cells than normal controls. .................................... 78
Fig 3:3:5: A-T patients with no ATM activity had a reduced percentage of naive B cells and
increased memory B cells compared to normal controls. ....................................................... 83
Fig 3:3:6: There was no significant difference between the percentages of CD56dim or
CD56bright NK cells in A-T patients and normal controls. ....................................................... 86
Fig 3:4:1: CD95 expression was significantly increased on lymphocytes from A-T patients with
no ATM activity compared to normal controls. ....................................................................... 94
Fig 3:4:2: CD95 expression was significantly increased on CD4+ and CD8+ T cells from A-T
patients with no ATM activity compared to normal controls. ................................................. 98
Fig 3:4:3: CD95 expression was significantly increased on naive and memory T cell subsets
from A-T patients with no ATM activity compared to normal controls. ................................ 104
List of Figures
Fig 3:4:4: CD95 expression was significantly increased on naive and memory B cell subsets
from A-T patients with no ATM activity compared to normal controls. ................................ 111
Fig 3:4:5: CD95 expression was not increased on CD56dim and CD56bright NK cells from A-T
patients compared to normal controls. ................................................................................. 115
Fig 3:5:1: FasL expression was reduced on B cells and NKT cells from A-T patients with no
ATM activity compared to normal controls. .......................................................................... 124
Fig 3:5:2: Fas Ligand expression was reduced on CD4+ and CD8+ T cells from A-T patients
with no ATM activity compared to normal controls. ............................................................. 128
Fig 3:5:3: Fas Ligand MFI was reduced on naive, and memory T cell subsets from A-T patients
with no ATM activity compared to normal controls. ............................................................. 132
Fig 3:5:4: Fas ligand expression was reduced on naive and memory B cells from A-T patients
compared to normal controls. ................................................................................................ 139
Fig 3:5:5: There was no significant difference in FasL expression on NK cells from A-T
patients with no ATM activity and normal controls. .............................................................. 143
Fig 3:6:1: CD127 expression was increased on T cells from A-T patients with some ATM
activity. ................................................................................................................................... 152
Fig 3:6:2: CD127 expression on CD4+ve and CD8+ve T cells was increased in A-T patients with
some ATM activity. ................................................................................................................. 156
Fig 3:6:3: CD127 expression on T cell subsets in normal controls increased with age. ........ 161
Fig 3:6:4: There was no significant difference in CD127 expression on NK cells from A-T
patients and normal controls. ................................................................................................ 168
Fig 3:7:1: A-T patients did not have IL-7 or IL-15 deficiencies, however IL-7 concentration
decreased significantly with age in A-T patients with no ATM activity. ................................ 178
Fig 3:8:1: There were no correlations between percentages of lymphocyte subsets and IL-7
concentration in A-T patients or normal controls. ................................................................. 182
List of Figures
Fig 3:8:2: IL-7 concentration correlated positively with CD95 expression on CD4+ T cells but
not CD8+ T cells or NKT cells. ................................................................................................. 188
Fig 3:8:3: There were negative correlations between IL-7 concentration and FasL expression
on several lymphocyte subsets in A-T patients with no ATM activity. .................................. 195
Fig 3:8:4: There were no correlations between IL-7 concentration and cell surface CD127
expression on lymphocytes from A-T patients or normal controls. ....................................... 201
Fig 4:2:2: CH11 treatment induced lysis of normal and A-T LCLs in a dose dependent
manner. .................................................................................................................................. 236
Fig 4:2:3: CH11 induces CD95-mediated apoptosis leading to a caspase cascade and
phosphorylation of ATM. ........................................................................................................ 241
Fig 4:2:4: The sensitivity of LCLs to CH11-induced apoptosis can be analysed by flow
cytometry. .............................................................................................................................. 245
Fig 4:2:5: A-T LCLs do not show increased sensitivity to perforin/granzyme cytotoxic T cell
killing. ...................................................................................................................................... 249
Fig 4:3:1: Expression of CD95 on A-T LCLs with no ATM activity is significantly lower than on
normal LCLs. ............................................................................................................................ 253
Fig 4:3:2: Inhibition of ATM activity had no effect on constitutive CD95 expression of normal
or A-T LCLs. ............................................................................................................................. 256
Fig 4:3:3: Surface expression of CD95 increases following activation of ATM. .................... 260
Fig 4:4:1: A-T LCLs with no ATM activity are more sensitive to CH11-induced apoptosis than
normal LCLs despite their lower level of CD95 expression. ................................................... 265
Fig 4:4:2: A-T LCLs with no ATM activity and CD95 expression are more viable in culture than
normal LCLs. ............................................................................................................................ 269
Fig 4:4:3: A-T LCLs with no ATM activity are more sensitive to CH11-induced apoptosis than
normal LCLs over a range of CH11 concentrations. ............................................................... 271
List of Figures
Fig 4:4:4: CH11-induced apoptosis may progress at a faster rate in A-T LCLs with no ATM
activity than in normal LCLs. ................................................................................................... 275
Fig 4:4:5: Inhibition of ATM activity does not sensitise LCLs to CH11-induced apoptosis. .. 278
Fig 4:5:1: Analysis of cFLIPL and cFLIPS expression by western blot. .................................... 283
Fig 4:5:2: There was no significant difference in cFLIPL expression between normal and A-T
LCLs. ........................................................................................................................................ 289
Fig 4:5:3: cFLIP degradation in response to CH11 treatment is normal in A-T LCLs. ............ 295
Fig 4:5:4: cFLIP protein expression increases following IR independently of ATM. .............. 297
Fig 4:5:5: Inhibition of ATM activity increases cFLIP expression in both normal and A-T LCLs.
................................................................................................................................................ 300
Fig 4:6:1: The difference in CD95 expression of A-T and normal LCLs is not due to a
difference in expression of the EBV protein LMP1. ............................................................... 304
Fig 4:7:1: Transfection of an A-T LCL with an ATMwt construct reduces its sensitivity to
CH11-induced apoptosis. ........................................................................................................ 310
Fig 4:8:1: ATM mutations are not required for tumour resistance to CD95-mediated
apoptosis. ............................................................................................................................... 317
Fig 5:2:1: NKG2D ligands can be detected by flow cytometry. ............................................. 332
Fig 5:2:2: There was no significant difference in NKG2D ligand expression on A-T and normal
LCLs. ........................................................................................................................................ 335
Fig 5:2:3: NKG2D ligands are not significantly upregulated on normal or A-T LCLs in response
to irradiation-induced DNA damage. ..................................................................................... 339
Fig 5:3:1: Irradiation-induced DNA damage had no effect on MICA expression on normal B
cells. ........................................................................................................................................ 344
Fig 5:4:1: NKG2D ligands were not upregulated on fibroblasts in response to irradiation-
induced DNA damage. ............................................................................................................ 348
List of Figures
Fig A1: All but two of the anonymous surplus diagnostic blood samples had normal immune
system phenotypes similar to healthy lab donors. ................................................................ 380
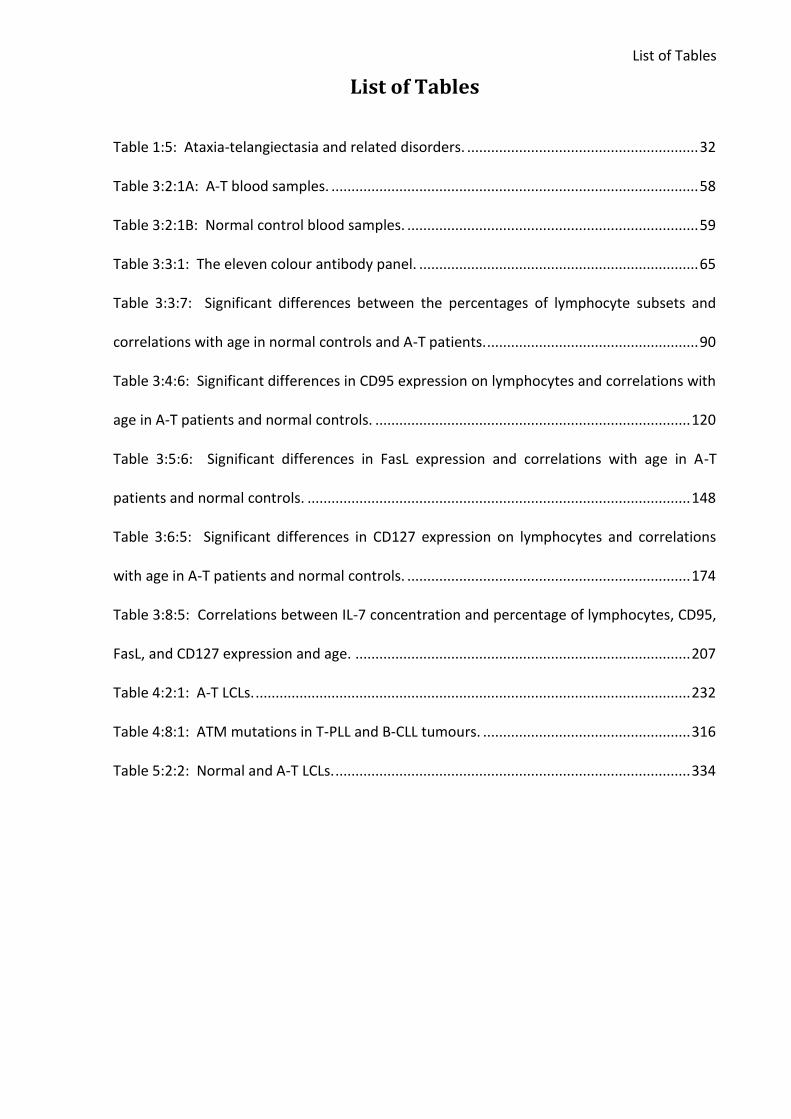
List of Tables
List of Tables
Table 1:5: Ataxia-telangiectasia and related disorders. .......................................................... 32
Table 3:2:1A: A-T blood samples. ............................................................................................ 58
Table 3:2:1B: Normal control blood samples. ......................................................................... 59
Table 3:3:1: The eleven colour antibody panel. ...................................................................... 65
Table 3:3:7: Significant differences between the percentages of lymphocyte subsets and
correlations with age in normal controls and A-T patients. ..................................................... 90
Table 3:4:6: Significant differences in CD95 expression on lymphocytes and correlations with
age in A-T patients and normal controls. ............................................................................... 120
Table 3:5:6: Significant differences in FasL expression and correlations with age in A-T
patients and normal controls. ................................................................................................ 148
Table 3:6:5: Significant differences in CD127 expression on lymphocytes and correlations
with age in A-T patients and normal controls. ....................................................................... 174
Table 3:8:5: Correlations between IL-7 concentration and percentage of lymphocytes, CD95,
FasL, and CD127 expression and age. .................................................................................... 207
Table 4:2:1: A-T LCLs. ............................................................................................................. 232
Table 4:8:1: ATM mutations in T-PLL and B-CLL tumours. .................................................... 316
Table 5:2:2: Normal and A-T LCLs. ......................................................................................... 334
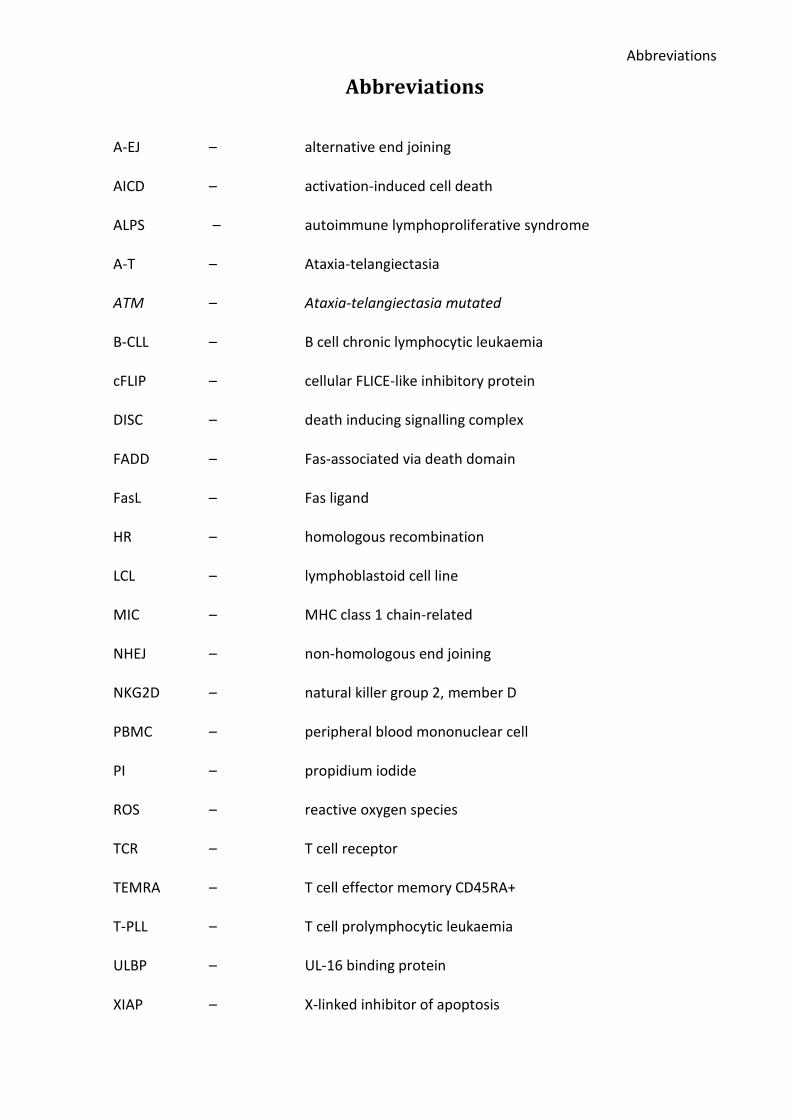
Abbreviations
Abbreviations
A-EJ – alternative end joining
AICD – activation-induced cell death
ALPS – autoimmune lymphoproliferative syndrome
A-T – Ataxia-telangiectasia
ATM – Ataxia-telangiectasia mutated
B-CLL – B cell chronic lymphocytic leukaemia
cFLIP – cellular FLICE-like inhibitory protein
DISC – death inducing signalling complex
FADD – Fas-associated via death domain
FasL – Fas ligand
HR – homologous recombination
LCL – lymphoblastoid cell line
MIC – MHC class 1 chain-related
NHEJ – non-homologous end joining
NKG2D – natural killer group 2, member D
PBMC – peripheral blood mononuclear cell
PI – propidium iodide
ROS – reactive oxygen species
TCR – T cell receptor
TEMRA – T cell effector memory CD45RA+
T-PLL – T cell prolymphocytic leukaemia
ULBP – UL-16 binding protein
XIAP – X-linked inhibitor of apoptosis

Chapter 1: Introduction
1
Chapter 1: Introduction.
Chapter 1: Introduction
2
1:1: Ataxia-telangiectasia, the ATM gene and ATM protein kinase.
1:1:1: Ataxia-telangiectasia.
Ataxia-telangiectasia is an autosomal recessive, severe neurodegenerative disorder caused
by mutations in the Ataxia-telangiectasia mutated (ATM) gene which has an important role
in repair of damaged DNA and apoptosis. Characteristic features include progressive
cerebellar degeneration, early onset ataxia (unsteady gait), occulocutaneous telangiectasia
(dilated superficial blood vessels), high levels of serum α-fetoprotein (Taylor et al., 1996) and
radiation sensitivity (Taylor et al., 1975). A-T patients have an increased incidence of cancer,
particularly lymphoid tumours (Morrell et al., 1986;Olsen et al., 2001) and a variable
immunodeficiency, most commonly lymphopenia and immunoglobulin deficiencies (Nowak-
Wegrzyn et al., 2004).
The disorder is relatively rare with an incidence in the UK of around one in three hundred
thousand live births (Woods et al., 1990). It was first reported by Syllaba and Henner in 1926
(Syllaba and Henner, 1926) and recognised as a separate disorder in 1957 (Boder and
Sedgwick, 1957). Ataxia-telangiectasia is clinically heterogeneous; the classic form presents
in infancy and shows steady progression whereas milder forms may present later and
proceed at a slower rate (McConville et al., 1996). Patients have a reduced life span (median
survival of around 19-25 years (Crawford et al., 2006) and usually die of cancer or respiratory
tract infections (Nowak-Wegrzyn et al., 2004).
1:1:2: The ATM gene.
The ATM gene was first identified and cloned by Savitsky in 1995 (Savitsky et al., 1995). It is
located on chromosome 11q22-q23 and spans approximately 160 kb of genomic DNA. This
Chapter 1: Introduction
3
encodes a 13 kb transcript of 66 exons with no evidence of different splice forms (Uziel et al.,
1996).
Over four hundred unique mutations in ATM have been described (Leiden Open Variation
database). The classic form of A-T results from two truncating mutations which lead to
complete loss of ATM protein and therefore total loss of ATM kinase activity. Milder forms
of A-T result from missense mutations which may allow expression of mutant protein with
some residual kinase activity or leaky splice site mutations which may allow some normal
ATM protein to be expressed (Staples et al., 2008;Taylor and Byrd, 2005).
1:1:3: ATM protein kinase.
The ATM gene encodes a serine/threonine protein kinase (ATM) which is a member of the
phosphoinositide 3-kinase (PI3K)-related protein kinase (PIKK) family. ATM is a 350kDa
protein which contains 3056 amino acids (reviewed in (Shiloh, 2003)). Like other members
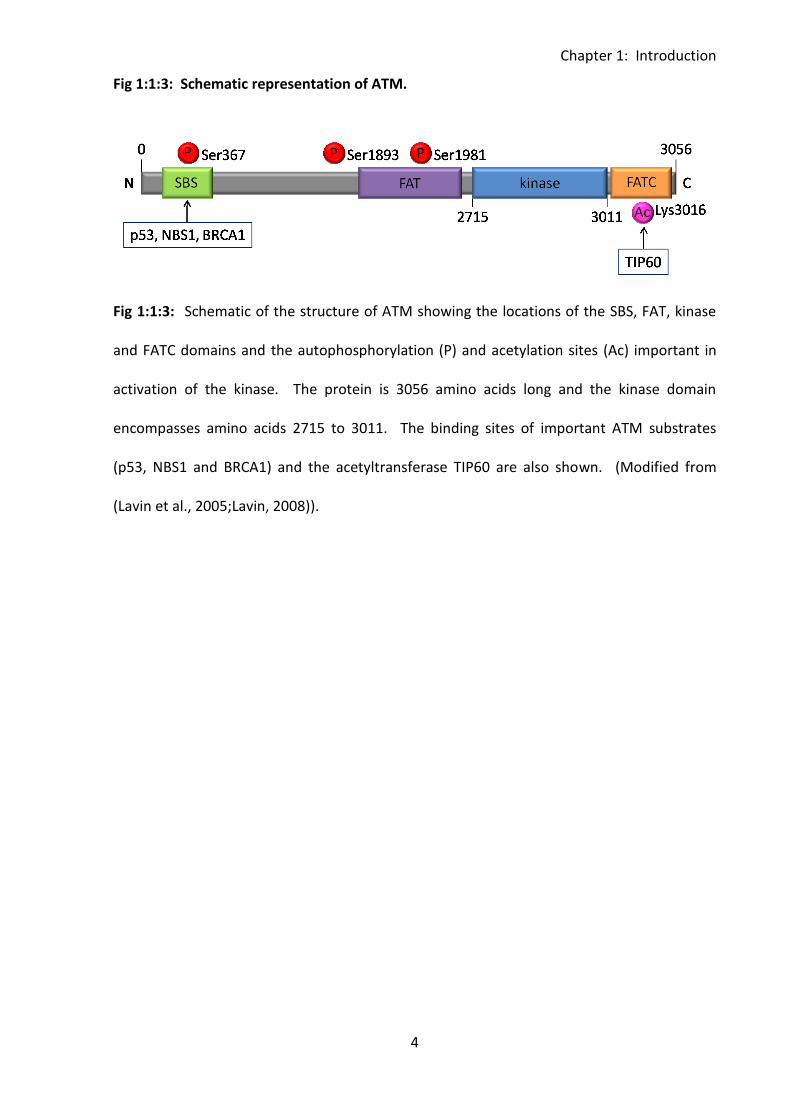
of its family it has a FAT domain, FATC domain and a kinase domain. A substrate binding site
located near the N-terminus is important for binding of several substrates including p53,
NBS1 and BRCA1 (Fernandes et al., 2005). Deletion of this site inactivates the protein
(Fernandes et al., 2005). ATM activation occurs through autophosphorylation of the protein,
this occurs on at least three sites, Ser367, Ser1983 and Ser1981. Acetylation of ATM at
Lys3016 is also required for its activation, this is carried out by the acetyltransferase TIP60
(Sun et al., 2005;Sun et al., 2007) (Fig 1:1:3). ATM kinase is predominantly located in the
nucleus although a small amount (~10-20%) is reportedly found in the cytoplasm (Lakin et
al., 1996;Watters et al., 1997). The majority of cytoplasmic ATM is located in peroxisomes
and endosomes, but it may also be present as a soluble protein (reviewed in (Lavin, 2008)).
Chapter 1: Introduction
4
Fig 1:1:3: Schematic representation of ATM.
Fig 1:1:3: Schematic of the structure of ATM showing the locations of the SBS, FAT, kinase
and FATC domains and the autophosphorylation (P) and acetylation sites (Ac) important in
activation of the kinase. The protein is 3056 amino acids long and the kinase domain
encompasses amino acids 2715 to 3011. The binding sites of important ATM substrates
(p53, NBS1 and BRCA1) and the acetyltransferase TIP60 are also shown. (Modified from
(Lavin et al., 2005;Lavin, 2008)).
Chapter 1: Introduction
5
1:2: ATM regulates the cellular response to DNA double strand
breaks.
1:2:1: ATM is activated in response to DNA double strand breaks.
ATM is activated in response to DNA double strand breaks and initiates cell cycle arrest and
either DNA repair or apoptosis (reviewed in (Lobrich and Jeggo, 2005b)). The related protein
ATR (ATM and Rad3-related protein) has a similar role in responding to DNA single strand
breaks.
DNA double strand breaks occur naturally due to collapse of replication forks, physical stress
during mitosis and genome rearrangements such as V(D)J recombination, class switching and
meiosis. They are also caused by DNA damaging agents such as ionising radiation and
certain chemicals (including some chemotherapy drugs). Damage to DNA can result in cell
death or genetic alterations including deletions, translocations and chromosome fusions.
Therefore an appropriate cellular response to DNA damage is essential for maintenance of
genome stability and cancer prevention.
The first stage in the response to a DNA double strand break is the rapid localisation of DNA
damage repair and recognition proteins to the site of the break. The proteins Mre11, Rad50
and Nbs1 form the MRN complex which is held at the site of the break by an adaptor protein
MDC1 (mediator of DNA-damage checkpoint protein-1). This complex tethers the broken
ends of the double strand break. ATM is quickly recruited to the site of damage and initially
localises to DNA regions either side of the break before associating with the MRN complex
through binding to Nbs1.
Under normal conditions ATM exists as an inactive dimer, however it dissociates into active
monomers following DNA damage (Bakkenist and Kastan, 2003). ATM is thought to be
Chapter 1: Introduction
6
partially activated in response to the relaxation of chromatin adjacent to the double strand
break. This partial activation allows the kinase to phosphorylate p53 and possibly other
substrates. However, localisation to the break itself through binding to the MRN complex is
required for monomerisation and full activation of ATM (reviewed in (Lavin, 2008)) (Fig
1:2:1). Both autophosphorylation of ATM at Ser1981 (Bakkenist & Kastan, 2003;Berkovich et
al., 2007) and acetylation at Lys3016 (Sun et al., 2007) are essential for monomerisation and
activation of the protein. Autophosphorylation at Ser1981 is also required for interaction
with MDC1 which stabilises ATM at the site of the DNA double strand break (So et al., 2009).
The function of ATM autophosphorylation at Ser367 and Ser1893 is not known, however this
is also essential for ATM activation (Kozlov et al., 2006).
Chapter 1: Introduction
7
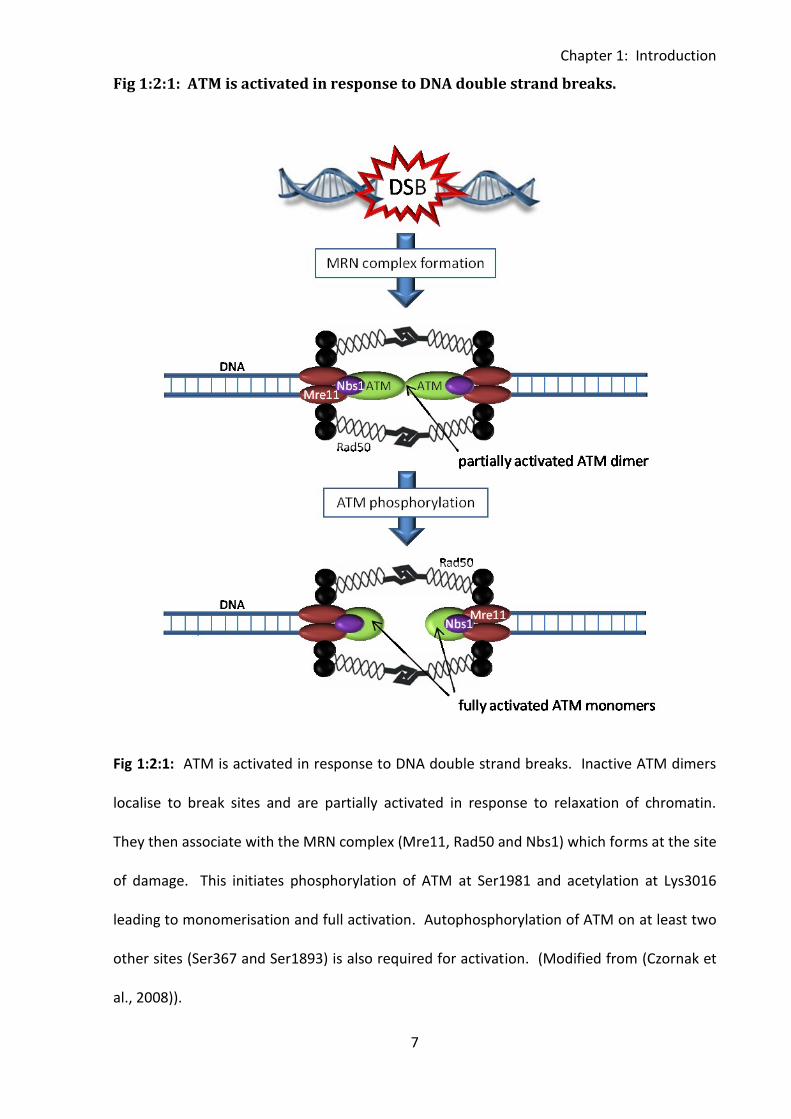
Fig 1:2:1: ATM is activated in response to DNA double strand breaks.
Fig 1:2:1: ATM is activated in response to DNA double strand breaks. Inactive ATM dimers
localise to break sites and are partially activated in response to relaxation of chromatin.
They then associate with the MRN complex (Mre11, Rad50 and Nbs1) which forms at the site
of damage. This initiates phosphorylation of ATM at Ser1981 and acetylation at Lys3016
leading to monomerisation and full activation. Autophosphorylation of ATM on at least two
other sites (Ser367 and Ser1893) is also required for activation. (Modified from (Czornak et
al., 2008)).
Chapter 1: Introduction
8
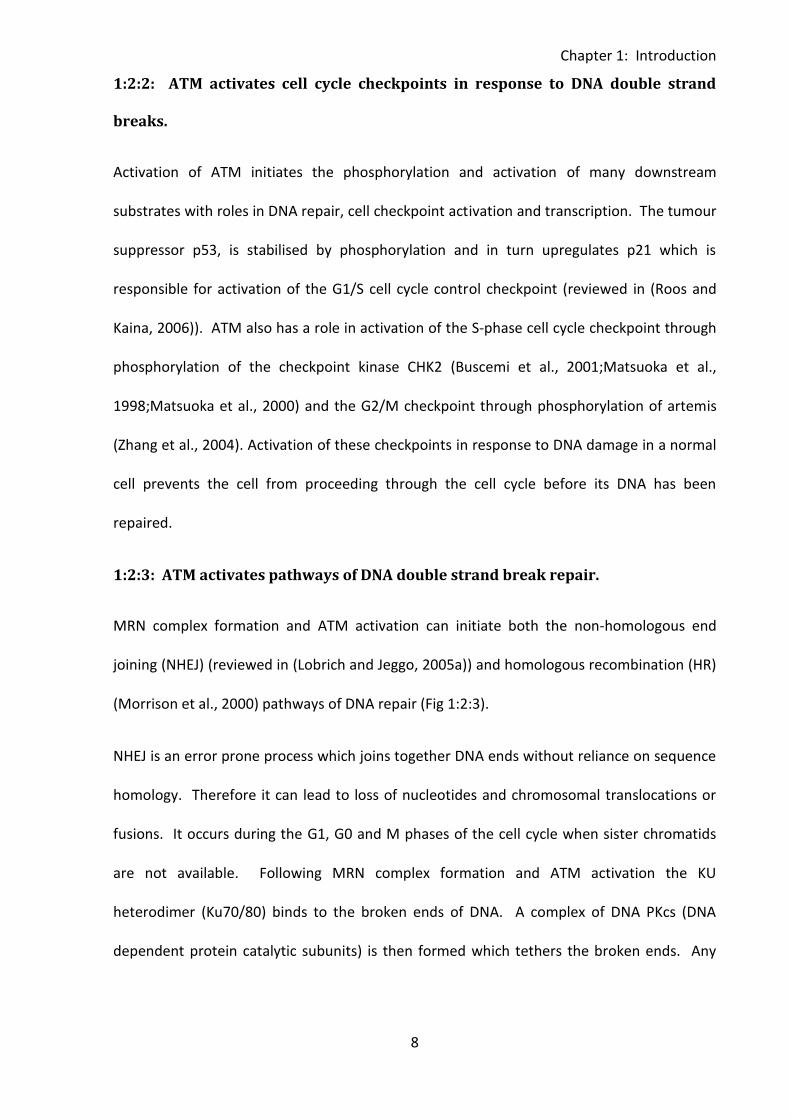
1:2:2: ATM activates cell cycle checkpoints in response to DNA double strand
breaks.
Activation of ATM initiates the phosphorylation and activation of many downstream
substrates with roles in DNA repair, cell checkpoint activation and transcription. The tumour
suppressor p53, is stabilised by phosphorylation and in turn upregulates p21 which is
responsible for activation of the G1/S cell cycle control checkpoint (reviewed in (Roos and
Kaina, 2006)). ATM also has a role in activation of the S-phase cell cycle checkpoint through
phosphorylation of the checkpoint kinase CHK2 (Buscemi et al., 2001;Matsuoka et al.,
1998;Matsuoka et al., 2000) and the G2/M checkpoint through phosphorylation of artemis
(Zhang et al., 2004). Activation of these checkpoints in response to DNA damage in a normal
cell prevents the cell from proceeding through the cell cycle before its DNA has been
repaired.
1:2:3: ATM activates pathways of DNA double strand break repair.
MRN complex formation and ATM activation can initiate both the non-homologous end
joining (NHEJ) (reviewed in (Lobrich and Jeggo, 2005a)) and homologous recombination (HR)
(Morrison et al., 2000) pathways of DNA repair (Fig 1:2:3).
NHEJ is an error prone process which joins together DNA ends without reliance on sequence
homology. Therefore it can lead to loss of nucleotides and chromosomal translocations or
fusions. It occurs during the G1, G0 and M phases of the cell cycle when sister chromatids
are not available. Following MRN complex formation and ATM activation the KU
heterodimer (Ku70/80) binds to the broken ends of DNA. A complex of DNA PKcs (DNA
dependent protein catalytic subunits) is then formed which tethers the broken ends. Any
Chapter 1: Introduction
9
single stranded overhang is filled in by nucleases and polymerases and the broken ends are
then ligated by the LigIV/XRCC4 complex (reviewed in (van Gent and van der Burg, 2007)).
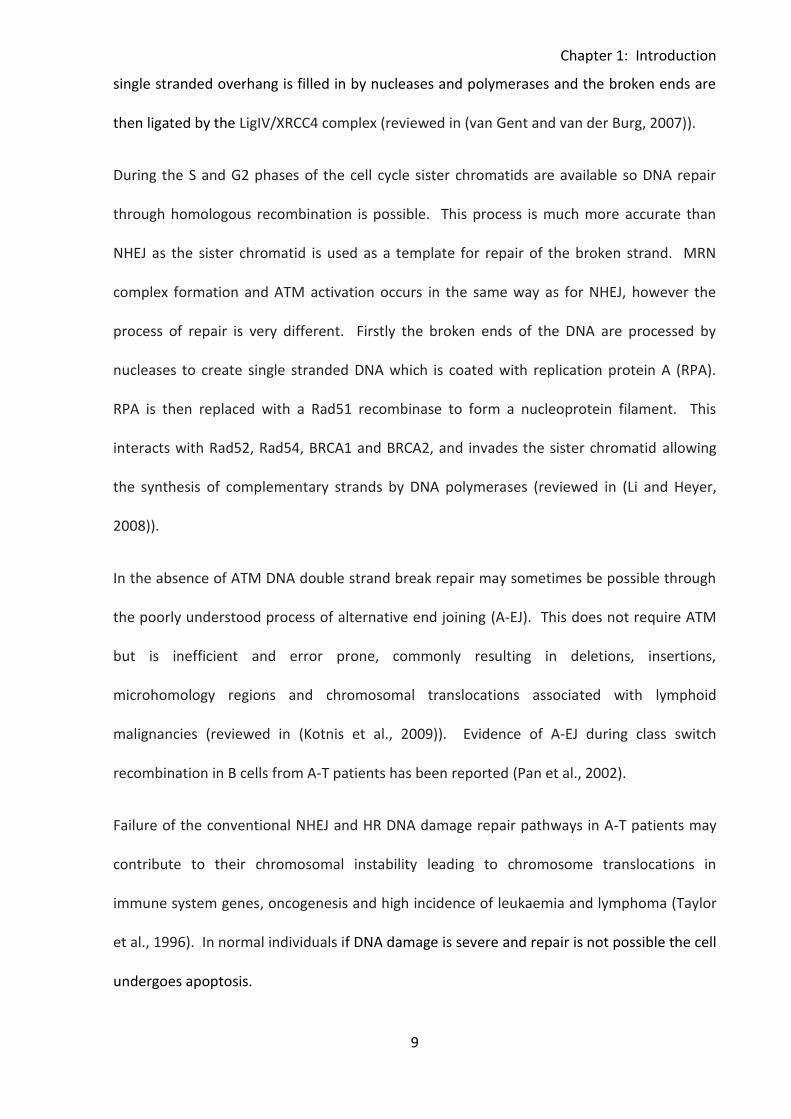
During the S and G2 phases of the cell cycle sister chromatids are available so DNA repair
through homologous recombination is possible. This process is much more accurate than
NHEJ as the sister chromatid is used as a template for repair of the broken strand. MRN
complex formation and ATM activation occurs in the same way as for NHEJ, however the
process of repair is very different. Firstly the broken ends of the DNA are processed by
nucleases to create single stranded DNA which is coated with replication protein A (RPA).
RPA is then replaced with a Rad51 recombinase to form a nucleoprotein filament. This
interacts with Rad52, Rad54, BRCA1 and BRCA2, and invades the sister chromatid allowing
the synthesis of complementary strands by DNA polymerases (reviewed in (Li and Heyer,
2008)).
In the absence of ATM DNA double strand break repair may sometimes be possible through
the poorly understood process of alternative end joining (A-EJ). This does not require ATM
but is inefficient and error prone, commonly resulting in deletions, insertions,
microhomology regions and chromosomal translocations associated with lymphoid
malignancies (reviewed in (Kotnis et al., 2009)). Evidence of A-EJ during class switch
recombination in B cells from A-T patients has been reported (Pan et al., 2002).
Failure of the conventional NHEJ and HR DNA damage repair pathways in A-T patients may
contribute to their chromosomal instability leading to chromosome translocations in
immune system genes, oncogenesis and high incidence of leukaemia and lymphoma (Taylor
et al., 1996). In normal individuals if DNA damage is severe and repair is not possible the cell
undergoes apoptosis.
Chapter 1: Introduction
10
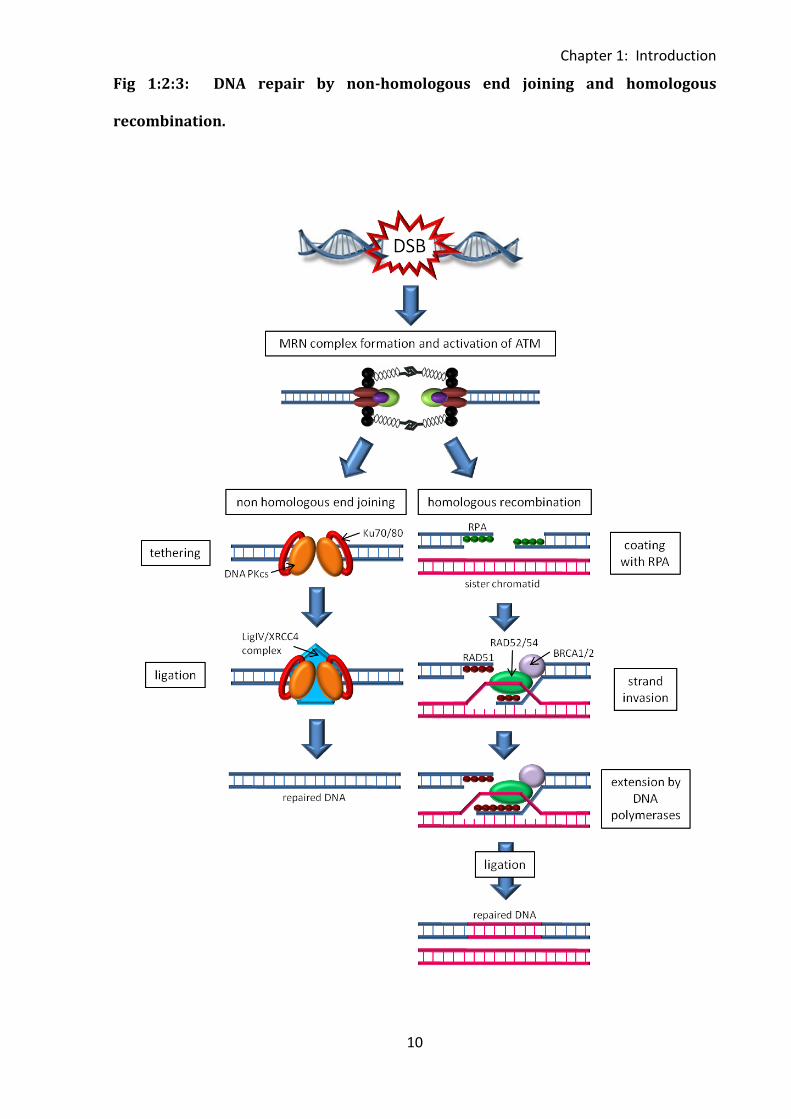
Fig 1:2:3: DNA repair by non-homologous end joining and homologous
recombination.
Chapter 1: Introduction
11
Fig 1:2:3: There are two mechanisms of DNA double strand break repair which can be
initiated by MRN complex formation and activation of ATM. Non-homologous end joining
begins with tethering of the broken ends by Ku70/80 and DNA PKcs. Missing nucleotides are
then filled in by nucleases and the broken ends rejoined by the LigIV/XRCC4 complex. In
homologous recombination the ends of the DNA are first processed to produce single
stranded DNA which is coated with RPA. This is replaced by Rad51 which together with
Rad52, Rad54, BRCA1 and BRCA2 carries out strand invasion of the sister chromatid,
providing a template for DNA polymerases to fill in the missing nucleotides. The broken
ends of the damaged DNA are then rejoined by ligation. (Modified from (Czornak et al.,
2008)).
Chapter 1: Introduction
12
1:2:4: ATM activates the intrinsic apoptotic pathway in response to severe DNA
damage and may also be involved in other apoptotic pathways.
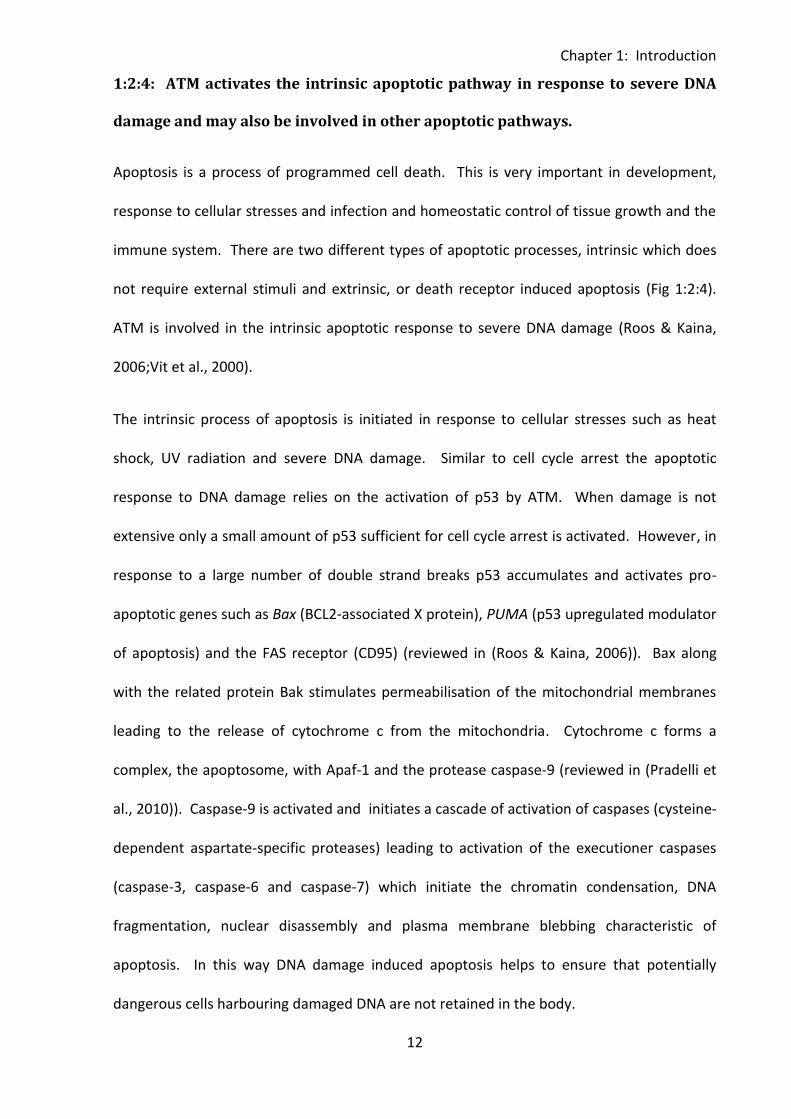
Apoptosis is a process of programmed cell death. This is very important in development,
response to cellular stresses and infection and homeostatic control of tissue growth and the
immune system. There are two different types of apoptotic processes, intrinsic which does
not require external stimuli and extrinsic, or death receptor induced apoptosis (Fig 1:2:4).
ATM is involved in the intrinsic apoptotic response to severe DNA damage (Roos & Kaina,
2006;Vit et al., 2000).
The intrinsic process of apoptosis is initiated in response to cellular stresses such as heat
shock, UV radiation and severe DNA damage. Similar to cell cycle arrest the apoptotic
response to DNA damage relies on the activation of p53 by ATM. When damage is not
extensive only a small amount of p53 sufficient for cell cycle arrest is activated. However, in
response to a large number of double strand breaks p53 accumulates and activates pro-
apoptotic genes such as Bax (BCL2-associated X protein), PUMA (p53 upregulated modulator
of apoptosis) and the FAS receptor (CD95) (reviewed in (Roos & Kaina, 2006)). Bax along
with the related protein Bak stimulates permeabilisation of the mitochondrial membranes
leading to the release of cytochrome c from the mitochondria. Cytochrome c forms a
complex, the apoptosome, with Apaf-1 and the protease caspase-9 (reviewed in (Pradelli et
al., 2010)). Caspase-9 is activated and initiates a cascade of activation of caspases (cysteine-
dependent aspartate-specific proteases) leading to activation of the executioner caspases
(caspase-3, caspase-6 and caspase-7) which initiate the chromatin condensation, DNA
fragmentation, nuclear disassembly and plasma membrane blebbing characteristic of
apoptosis. In this way DNA damage induced apoptosis helps to ensure that potentially
dangerous cells harbouring damaged DNA are not retained in the body.
Chapter 1: Introduction
13
Extrinsic apoptotic pathways are initiated in response to external cellular stimuli. There are
two main types, death receptor mediated apoptosis and the perforin/granzyme pathway.
Death receptors include CD95 (Fas) which binds to its cognate ligand; Fas ligand (FasL).
Death receptors or ligands may be expressed on the surface of a cell in response to stimuli
such as cytokines, cell activation and viral infection. Although the role of ATM in intrinsic
apoptotic processes has been investigated (Vit et al., 2000) little is known about the
potential role of ATM in extrinsic apoptotic pathways. Recent conflicting reports have
suggested that ATM may be involved in regulation of CD95-mediated apoptosis (Ivanov et
al., 2009;Stagni et al., 2008). It is possible that abnormalities in extrinsic apoptotic pathways
due to ATM mutation could contribute to the development of the lymphopenia and/or the
lymphoid tumours that are common in A-T patients.
Binding of a death receptor expressed on a potentially apoptotic cell to its ligand (e.g CD95
to FasL) initiates a caspase cascade leading to apoptosis of the cell. Unlike the intrinsic
process this does not involve formation of the apoptosome or activation of caspase-9.
Instead activation of the initiator caspases, caspase-8 and caspase-10 leads to executioner
caspase activation and apoptosis.
A role for ATM is perhaps least likely in the perforin/granzyme pathway of apoptosis. This is
the main mechanism by which cytotoxic T cells kill their target cells. The pore forming
protein perforin and the serine proteases granzymes are stored within secretory granules of
cytotoxic lymphocytes (T cells and NK cells). In response to the formation of an immune
synapse between the cytotoxic lymphocyte and a virus infected or transformed target cell
the granules are exocytosed into the synapse and can release their contents onto the target
cell membrane. Perforin facilitates the entry of granzymes into the target cell cytoplasm
although exactly how this is achieved is not yet resolved (reviewed in (Hoves et al., 2010)).
Chapter 1: Introduction
14
Granzymes are highly proapoptotic and cleave many cytoplasmic proteins. They are able to
cleave caspases either directly or indirectly leading to effector caspase activation and
apoptosis (reviewed in (Cullen and Martin, 2008)).
Interestingly ATM is cleaved and inactivated by caspase 3 during apoptosis but this does not
affect its ability to bind DNA. The presence of the inactive ATM protein may prevent DNA
repair and DNA damage signalling in response to the DNA double strand breaks generated
during apoptosis (Smith et al., 1999).
Chapter 1: Introduction
15
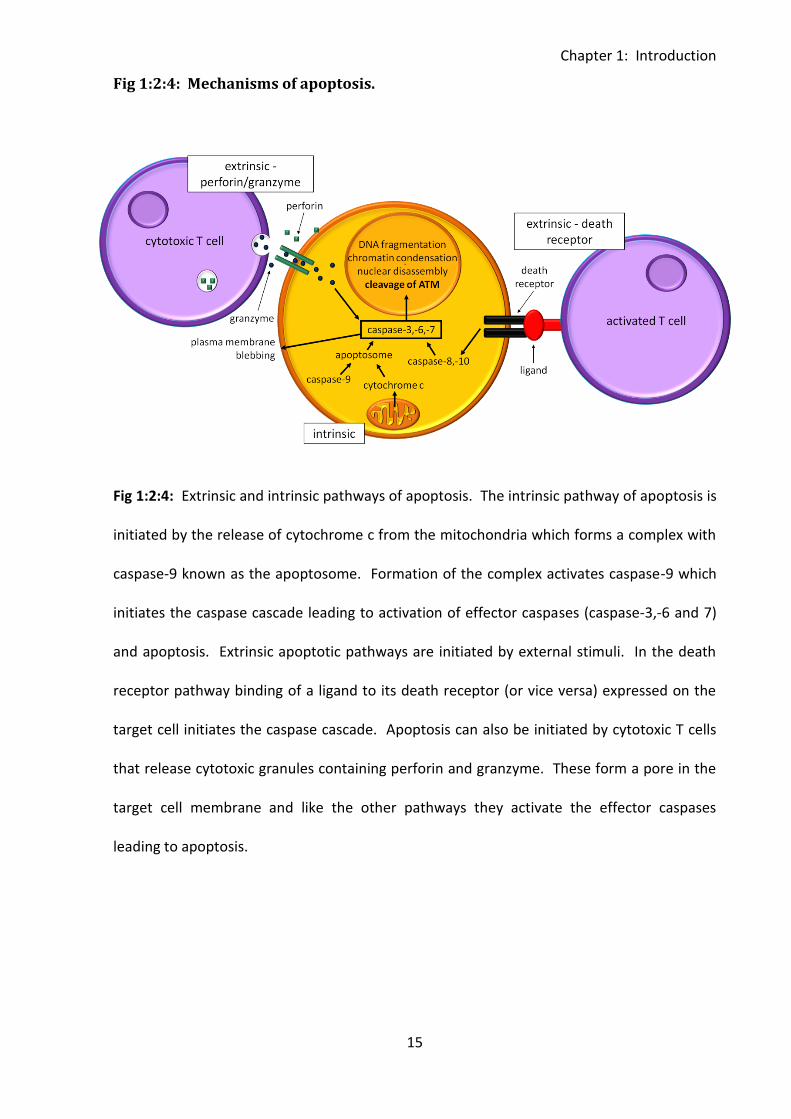
Fig 1:2:4: Mechanisms of apoptosis.
Fig 1:2:4: Extrinsic and intrinsic pathways of apoptosis. The intrinsic pathway of apoptosis is
initiated by the release of cytochrome c from the mitochondria which forms a complex with
caspase-9 known as the apoptosome. Formation of the complex activates caspase-9 which
initiates the caspase cascade leading to activation of effector caspases (caspase-3,-6 and 7)
and apoptosis. Extrinsic apoptotic pathways are initiated by external stimuli. In the death
receptor pathway binding of a ligand to its death receptor (or vice versa) expressed on the
target cell initiates the caspase cascade. Apoptosis can also be initiated by cytotoxic T cells
that release cytotoxic granules containing perforin and granzyme. These form a pore in the
target cell membrane and like the other pathways they activate the effector caspases
leading to apoptosis.
Chapter 1: Introduction
16
1:3: The immune system in Ataxia-telangiectasia.
1:3:1: Ataxia-telangiectasia patients have immune system abnormalities.
ATM has an important role in lymphocyte development as it responds to the breaks in DNA
that occur during differentiation of B and T cells (Lumsden et al., 2004), particularly during
V(D)J recombination (Bredemeyer et al., 2006) and class switching. Evidence for the
important role of ATM in the immune system comes from the immune system deficiencies
seen in A-T patients as well as their high incidence of lymphoid tumours. Interestingly unlike
neurological defects the immunodeficiency in A-T is rarely progressive (Nowak-Wegrzyn et
al., 2004). The degree of deficiency is highly variable and not all patients are affected
(Staples et al., 2008). In general patients who have no ATM kinase activity show a more
severe immunological phenotype than those who do retain some ATM activity (Staples et al.,
2008).
The principle features of immunodeficiency in A-T are:
1. Lymphopenia of both T and B cells. More than 70% of A-T patients may be lymphopenic
(Nowak-Wegrzyn et al., 2004). Naive T and B cell deficiencies are especially pronounced
leading to a predominance of memory cells. The naive cell deficiency may be a consequence
of thymic hypoplasia and the very low thymic output seen in A-T patients (Micheli et al.,
2003).
2. Defects in humoral immunity. Abnormal serum immunoglobulin levels especially
deficiencies in the class switched immunoglobulins IgA and/or IgG2 are common and may be
the result of a failure of class switching (Reina-San-Martin et al., 2004;Waldmann et al.,
1983). A-T patients may also show impaired antibody responses and gammopathy (Sadighi
Akha et al., 1999).
Chapter 1: Introduction
17
Despite these deficiencies systemic bacterial, severe viral and opportunistic infections are
rare in A-T patients (Nowak-Wegrzyn et al., 2004) possibly due to their intact T cell
responses (Pashankar et al., 2006). However, A-T patients do commonly suffer from
recurrent bacterial sinopulmonary infections (McGrath-Morrow et al., 2010) and the
incidence of lower respiratory tract infections increases with age. This may be related to
neurological decline leading to increased difficulties in chewing and swallowing, increased
pulmonary aspiration and poor nutrition (Lefton-Greif et al., 2000;Nowak-Wegrzyn et al.,
2004). Response to vaccination is variable with some patients showing normal and some
reduced responses (Nowak-Wegrzyn et al., 2004).
1:3:2: ATM has an important role in T cell development.
Haematopoietic stem cells arise in the bone marrow and have the capacity to self renew and
to differentiate into multipotent progenitors (MPPs). MPPs are unable to self renew but can
differentiate into lymphoid primed multipotent progenitors (LMPPs). These cells express
some lymphoid specific genes and have the potential to differentiate into both T and B cells.
They may also continue to differentiate in the bone marrow to produce additional
progenitor cells. It is possible that these progenitors are further restricted to the B or T cell
lineage although this is not yet clear. Some or all of the progenitor cells have the ability to
mobilise from the bone marrow, circulate in the blood and enter the thymus (reviewed in
(Zlotoff et al., 2008)) where they undergo differentiation into naive T cells.
In normal individuals the thymus is largest (proportional to body size) just before birth.
Although it increases in weight to a maximum during puberty the size of its functional
compartments, the medulla and cortex, decreases from one year of age onwards. The
thymus undergoes a process of involution defined as a decrease in size, weight and activity
with age (reviewed in (Appay et al., 2010)). Therefore, the output of naive T cells from the
Chapter 1: Introduction
18
thymus is greatest in young children and dramatically decreased in the elderly. However, A-
T patients may show thymic hypoplasia and their thymic output is very low even in infancy
(Micheli et al., 2003).
As they develop in the thymus T cells undergo a process of V(D)J recombination which
rearranges their DNA to create functional antigen receptor genes. This process also occurs
in developing B cells. Different gene segments which are initially separate from one another
are brought together by deletion of intervening DNA sequences. In T cells the joining of
different gene segments allows the generation of a huge diversity of antigen receptor
specificity. ATM has an important function in the joining together of DNA double strand
breaks between gene segments by non-homologous end joining (NHEJ) (Bredemeyer et al.,
2006;Corneo et al., 2007) and is also important in maintaining expression of the T cell
receptor during recombination. Therefore the process of V(D)J recombination is defective in
A-T patients and increased accumulation of unrepaired coding ends during antigen receptor
gene assembly has been reported in ATM deficient lymphocytes (Bredemeyer et al., 2006).
However, V(D)J recombination is not completely abrogated in A-T patients as joining
together of gene segments can occur in the absence of functional ATM through alternative
end joining (reviewed in (Kotnis et al., 2009)). This is an inefficient process which occurs only
when conventional NHEJ fails and often produces large deletions (Corneo et al., 2007).
Failure of conventional V(D)J recombination leading to an accumulation of unrepaired
coding ends (Bredemeyer et al., 2006) may contribute to the increased number of
chromosomal translocations involving immune system genes in A-T patients’ lymphocytes
(Matei et al., 2006).
The most immature subset of thymocyte precursors are the double negative (DN) cells which
reside in the cortex of the thymus and lack expression of the T cell receptor (TCR), CD4 and
Chapter 1: Introduction
19
CD8. At this pro-T cell stage the cells become committed to either the αβ or γδ T cell
lineage. In normal individuals the majority (>90%) will give rise to αβ T cells. However, A-T
patients have an increased proportion of γδ T cells. This may be due to a recombinational
defect and the inability to repair damaged DNA (Carbonari et al., 1990). In thymocytes
committed to the αβ lineage RAG-1 and RAG-2 proteins are expressed at the double
negative stage and the process of V(D)J recombination of the TCR β chain gene begins with
joining of D and J gene segments.
During the next stage of development, the pre-T cell stage, rearrangements between V and
DJ regions of the β chain genes occur and the pre-T cell receptor is expressed. Signals from
this pre-TCR stimulates proliferation of the pre-T cells and recombination of the α chain of
the T cell receptor. It also prevents further rearrangements of the β chain and stimulates
the transition to the next stage of development, the double positive stage. Double positive
thymocytes express both CD4 and CD8 and undergo rearrangement of α chain genes. The α
chain locus lacks D segments so rearrangement involves joining of V and J segments.
Following rearrangement of the α chain, double positive thymocytes express TCR αβ
heterodimers and migrate from the cortex of the thymus to the medulla.
Double positive cells expressing complete TCR complexes are able to respond to antigen and
undergo positive and negative selection processes. The receptors encounter self-peptides
displayed on self-MHC molecules in the thymus. Thymocytes which have TCRs which bind
with low avidity to self-peptide:self-MHC complexes are stimulated to survive (positive
selection) whereas those that bind with high avidity are deleted (negative selection).
Thymocytes which do not recognise self MHC also die through apoptosis. These processes
ensures that mature T cells which leave the thymus are self-MHC restricted and tolerant to
self antigens.
Chapter 1: Introduction
20
Following positive and negative selection the surviving thymocytes mature into single
positive CD4+ve or CD8+ve T cells. CD4+ve T cells acquire the ability to produce cytokines in
response to antigen stimulation and to express effector molecules required for interactions
with B cells and macrophages whereas CD8+ve T cells become specialised for their cytotoxic
function. The mature single positive T cells leave the thymus and migrate through the
bloodstream to populate peripheral lymphoid tissues.
Development and differentiation of γδ T cells is similar to that of αβ T cells. Rearrangement
of the γ and δ TCR chains occurs through rearrangement and recombination of V, D and J
gene segments. γδ T cells do not express CD4 or CD8 and the selection processes that they
undergo in the thymus are less well understood than those of αβ T cells. The first stages of
maturation take place in the thymic cortex, the cells then migrate to the medulla and
continue to mature before leaving the thymus and entering the circulation.
On exit from the thymus T cells are described as naive as they have not yet encountered
antigen. These cells express the CD45RA isoform of protein tyrosine phosphatase receptor
type C. They circulate between the bloodstream and secondary lymphoid tissues such as
lymph nodes, Peyer’s patches and the spleen (Weninger et al., 2001). If a naive T cell
encounters its cognate antigen presented by mature dendritic cells in the secondary
lymphoid tissue it becomes a lymphoblast, proliferates rapidly and acquires effector
functions. These effector cells migrate throughout the body and clear infected cells.
When the foreign antigen is no longer present the effector T cell population undergoes a
contraction phase during which approximately 95% of cells apoptose. The remaining antigen
specific T cells form the memory T cell population. There are three main subsets of memory
T cells, central memory (CD45RA-), effector memory (CD45RA-) and TEMRA (T cell effector
memory CD45RA+) cells. Central and effector memory T cells are functionally distinct
Chapter 1: Introduction
21
subsets which can be identified by the differential expression of the homing receptors CD62L
(L selectin) and the chemokine receptor CCR7. These receptors have an important role in
controlling entry and exit from different lymphoid and non-lymphoid tissues so their
expression determines the sites to which the memory T cells can localise.
Central memory T cells express both CD62L and CCR7 and are able to enter lymph nodes
spleen and blood. They do not have immediate effector function but are able to stimulate
dendritic cells, help B cells and differentiate into CCR7-ve effector cells in response to
secondary antigenic stimulation, thereby providing a secondary line of attack. Effector
memory T cells do not express CD62L or CCR7. They localise to peripheral non-lymphoid
tissues such as lung, liver and intestine as well as the spleen and blood and have immediate
effector function allowing them to rapidly respond to infection in peripheral tissues by
mediating inflammation and cytotoxicity (Sallusto et al., 1999).
The third subset of memory T cells, TEMRA cells is the only subset which expresses CD45RA.
They do not express CCR7 and were initially considered to be terminally differentiated or
resting effector memory T cells as they do not express markers of activation, have shortened
telomeres, a low proliferative capacity and an increased susceptibility to undergo apoptosis
in the absence of costimulation (reviewed in (Sallusto et al., 2004)). However, they also have
a high cytotoxic capacity and more recently it has been suggested that they may represent a
subset of highly functional long-lived effector memory T cells which do not require
proliferation to maintain their population (Cantisan et al., 2010). They accumulate during
chronic viral infections including cytomegalovirus (CMV) (Khan et al., 2002), Epstein-Barr
virus (EBV) (Dunne et al., 2002) and human immunodeficiency virus (HIV) (Meyer-Olson et
al., 2010) and may be involved in the preservation of lifelong immunity to chronic infectious
agents.
Chapter 1: Introduction
22
1:3:3: ATM has an important role in B cell development.
Primary B cell development begins in the bone marrow. Like T cells, B cells develop from
progenitor cells derived from haematopoietic stem cells. The most immature B-cell lineage
committed cells are known as pro-B cells, they do not produce immunoglobulin but do
express the B cell marker CD19. Pro-B cells express RAG genes and undergo V(D)J
recombination of the immunoglobulin heavy chain gene.
The next stage in development is the pre-B cell. These cells are the first B cell lineage cells to
synthesise immunoglobulin (cytoplasmic µ heavy chain) and express the pre-B cell receptor
which stimulates continued maturation and proliferation. It also has a role in allelic
exclusion, ensuring that the B cell is specific for only one antigen by providing a signal which
prevents rearrangement of the heavy chain genes on the other chromosome. The
immunoglobulin light chain is rearranged (V(D)J recombination) and associates with the µ
chain to produce complete IgM, the cell is now an immature B cell.
As discussed earlier conventional V(D)J recombination requires ATM, therefore the process
is impaired in ATM deficient pre-B cells (Bredemeyer et al., 2008). This may contribute to
the increased incidence of chromosome translocations in immune system genes which may
lead to the development of B cell tumours in A-T patients.
Like T cells immature B cells undergo a process of positive and negative selection. Those
that express functional immunoglobulin receive survival signals (positive selection). Unlike
mature B cells, immature B cells do not proliferate and differentiate in response to antigen.
Those that express high affinity receptors for self antigens and encounter these antigens in
the bone marrow either undergo apoptotic death, fail to mature or undergo an editing
Chapter 1: Introduction
23
process in which they change specificity by rearrangement of the light chain (negative
selection).
Immature B cells leave the bone marrow and complete their maturation in lymphoid organs.
Naive mature B cells express both membrane IgM and IgD. They are functionally competent
but will die within a few weeks if they do not encounter antigen. On encountering antigen
they undergo proliferation to give a clone of antigen specific cells and differentiate into
immunoglobulin secreting effector cells and memory cells. Responses to protein antigens
require CD4+ve T cell help, whereas responses to non-protein antigens (polysaccharides and
lipids) do not.
Effector B cells may undergo heavy chain isotype class switching which results in production
of antibodies of different isotypes and effector function but the same antigen specificity as
the original IgD and IgM antibodies. Similarly to V(D)J recombination the process of class
switch recombination involves the generation and repair of DNA double strand breaks and
requires ATM (Lumsden et al., 2004). The process involves intrachromosomal recombination
between tandemly repeated switch region sequences located upstream of each
immunoglobulin heavy chain constant region gene and excision of intervening DNA
sequences. Repair of the DNA double strand breaks generated during class switch
recombination predominantly occurs through non-homologous end joining and requires
ATM. However, when ATM function is impaired the alternative end joining pathway may be
utilised (Kotnis et al., 2009). Failure of the ATM-dependent joining process may account for
the low serum antibody levels of A-T patients (Reina-San-Martin et al., 2004).
Effector B cells also undergo a process of affinity maturation which increases the affinity of
antibodies for a particular protein. The process is known as somatic hypermutation and
involves somatic mutation of immunoglobulin genes and selective survival of the B cells
Chapter 1: Introduction
24
which produce the highest affinity antibodies. Somatic hypermutation involves the
formation of DNA single strand breaks or nicks so requires ATR rather than ATM (Pan-
Hammarstrom et al., 2006), therefore the process occurs normally in A-T patients (Pan-
Hammarstrom et al., 2003).
1:4: Other effects of ATM mutations.
1:4:1: ATM mutations result in a defective response to oxidative stress.
Elevated levels of oxidative stress leading to an increase in oxidative damage to lipids and
DNA has been reported in A-T patients (Reichenbach et al., 2002). The cause of the
increased oxidative stress is unclear, ATM may regulate or modify the activity of antioxidant
proteins, it may sense and respond to increased ROS levels directly, or alternatively oxidative
stress may result from the effect of unrepaired DNA double strand breaks on cell
metabolism (reviewed in (Barzilai et al., 2002)). In addition to increasing oxidative stress
ATM mutations also result in a defective response to reactive oxygen species (ROS) (Barlow
et al., 1999;Ito et al., 2004;Rotman and Shiloh, 1997).
Neurons are particularly sensitive to oxidative damage and oxidative stress has been
implicated in the neurodegeneration of A-T patients. A study by Kamsler et al. (2001) using
Atm-deficient mice investigated the prevalence of oxidative stress in the central nervous
system. They showed that the area that was most severely affected was the cerebellum
(Kamsler et al., 2001). This area contains Purkinje and granule neurons, the degeneration of
which causes the characteristic progressive ataxia of A-T patients (Boder, 1985). More recent
studies using ATM-/- mouse models of A-T have shown that oxidative stress in the absence
of ATM leads to reduced survival of Purkinje neurons (Chen et al., 2003), defective
Chapter 1: Introduction
25
proliferation and increased apoptosis of neural stem cells (Kim and Wong, 2009a) and
defective proliferation of astrocytes (Kim and Wong, 2009b).
Although high levels of ROS cause damage to cellular components resulting in cell death, at
low levels they have a role in signalling and are generated under normal physiological
conditions as by-products of metabolic processes or apoptotic signals and in the cytotoxic
response to pathogens. Interestingly they are also generated in response to T cell activation.
At low levels ROS amplify signals from the T cell receptor whilst at high levels they are
important in initiation of activation-induced cell death (AICD) through activation of the FasL
promoter (Devadas et al., 2002;Hildeman et al., 1999). The inability of A-T patients’ cells to
respond to the generation of ROS in response to T cell activation may contribute to their
immunodeficiency.
Bagley et al. showed that mature T cells obtained from ATM deficient mice underwent
apoptosis rather than proliferation in response to stimulation through the T cell receptor
(Bagley et al., 2007). This also occurred when mature T cells from wildtype mice were
stimulated through the T cell receptor in the presence of ATM inhibitors. However, when
both ATM deficient and ATM inhibited T cells were stimulated in the presence of the
antioxidant N-acetyl cysteine (NAC) cell death was prevented and normal levels of
proliferation occurred. This suggests that ATM has an important role in T cell activation by
regulating the response to reactive oxygen species produced in response to stimulation
through the TCR. In the absence of ATM T cells may be unable to proliferate normally and
gain effector function in response to antigenic stimulation and this could contribute to the
immunodeficiency of A-T patients. However, it seems unlikely that the proliferation defect is
as severe in A-T patients as that described in ATM deficient mice as A-T patients are not
Chapter 1: Introduction
26
generally highly susceptible to opportunistic infections other than those of the respiratory
tract and intact T cell responses have been reported (Pashankar et al., 2006).
1:4:2: ATM mutations predispose to cancer.
ATM mutations result in the inability to repair double strand breaks, defective V(D)J
recombination (Bredemeyer et al., 2006) and aberrant chromosomal translocations in
immune system genes (Matei et al., 2006). These, together with the failure to repair DNA
damage and remove damaged cells results in a high degree of genetic instability,
predisposing A-T patients to the development of cancer (Boultwood, 2001;Gumy-Pause et
al., 2003;Taylor et al., 1996).
The incidence of lymphoid tumours in A-T patients is particularly high (Tran et al., 2008),
fifteen percent of patients in the UK die of leukaemia or lymphoma as children (reviewed in
(Taylor & Byrd, 2005)). There are clear age differences in the types of tumours to which A-T
patients are predisposed. A-T children show a high frequency of T cell acute lymphocytic
leukaemia and lymphoma whereas young adults with A-T frequently develop T cell
prolymphocytic leukaemia (T-PLL) (Taylor et al., 1996). A-T patients may also develop B cell
tumours, Hodgkins and non-Hodgkins lymphoma (Olsen et al., 2001;Taylor et al., 1996).
Non-lymphoid tumours seen in A-T patients include brain tumours and some carcinomas
(Taylor & Byrd, 2005).
Chromosomal translocations in A-T patients typically result from defective repair of the DNA
double strand breaks generated in immune system genes during V(D)J recombination and
immunoglobulin class switch recombination. As cell cycle checkpoints are defective in A-T
broken ends persist and accumulate (Bredemeyer et al., 2006) so translocations are more
likely to occur. If such a translocation involves a proto-oncogene it may result in fusion of
Chapter 1: Introduction
27
the proto-oncogene to a locus that encodes an antigen receptor. The new oncogene will
then become activated in response to immunoglobulin or T cell receptor regulatory
elements leading to increased expression of the oncogene. Alternatively the fusion of two
unrelated genes may lead to the production of new fusion proteins with oncogenic
properties. These translocations are the first step in tumourigenesis, however in general
further genetic changes are required to provide a proliferative advantage and allow the
tumour to escape homeostatic control of cell number.
Interestingly ATM may have a role in signalling the presence of potentially malignant cells to
the immune system through the DNA damage-induced upregulation of natural killer group 2,
member D (NKG2D) ligands (Gasser et al., 2005). These ligands are recognised by cytotoxic
NK cells, NKT cells and T cells which express the NKG2D receptor. Binding of the receptor to
the ligand initiates degranulation of the cytotoxic cell which releases perforin and granzme
leading to apoptosis of the target cell. Failure to upregulate NKG2D ligands in response to
DNA damage in A-T patients due to their ATM mutations may allow cells harbouring
damaged DNA to escape this process of immunosurveillance. This could contribute to the
high incidence of cancer in A-T patients.
ATM mutations are also a frequent characteristic of tumours in non-A-T individuals. They
are found in approximately 40% of sporadic B cell chronic lymphocytic leukaemia (B-CLL)
(Stankovic et al., 1999) and the majority of T-PLL tumours (Matutes et al., 1991;Nowak et al.,
2009;Yamaguchi et al., 2003;Yuille et al., 1998). However, whilst T-PLL is relatively frequent
in A-T patients, perhaps because loss of ATM function is important in initiation of this
tumour type (Stankovic et al., 2002;Stoppa-Lyonnet et al., 1998), the incidence of B-CLL is
low possibly because ATM mutation is important in progression of this tumour type.
Chapter 1: Introduction
28
Approximately 0.5% of the UK population are carriers of mutations in the ATM gene. There
is evidence that female carriers have an increased risk of developing breast cancer
(Geoffroy-Perez et al., 2002;Olsen et al., 2001;Swift et al., 1991). However, as carriers of the
ATM gene do not show increased sensitivity to ionising radiation the tumours can be treated
with radiotherapy without adverse reactions.
1:5: Ataxia-telangiectasia-related disorders.
There are several Ataxia-telangiectasia-related disorders which result from mutations in
different components of the DNA damage repair pathway. These disorders have similar
clinical phenoypes to A-T but differ in their severity (Table 1:5).
1:5:1: Ataxia-telangiectasia-like disorder.
Ataxia-telangiectasia-like disorder (ATLD) results from mutations in the Mre11 gene (Stewart
et al., 1999) which encodes MRE11, an important component of the MRN complex. It is
clinically very similar to A-T and is difficult to distinguish neurologically. However ATLD
patients do not show telangiectasia (dilated blood vessels) or raised serum α-fetoprotein
levels, onset of ataxia is later and neurological degeneration is slower (reviewed in (Taylor et
al., 2004)). ATLD patients have normal levels of total IgG, IgA and IgM although there may
be reduced levels of specific functional antibodies (reviewed in (Taylor et al., 2004). The
disorder is very rare, and accounts for only a small proportion of patients diagnosed with A-T
(reviewed in (Taylor & Byrd, 2005)).
1:5:2: Nijmegen breakage syndrome.
Mutations in the NBS1 gene result in Nijmegen breakage syndrome (NBS). The gene
encodes NBS, another component of the MRN complex (reviewed in (Ball and Xiao, 2005)).
This disorder differs from both A-T and ATLD in that patients suffer from microcephaly rather
Chapter 1: Introduction
29
than neurodegeneration. Patients have a bird like face, short stature, immunodeficiency,
chromosomal instability and are predisposed to cancer, particularly B cell lymphomas
(Tauchi et al., 2002). The frequency of immunodeficiency and malignancy and the
percentage of chromosome rearrangements are higher in NBS than in A-T (Weemaes et al.,
1994). Similar to A-T and ATLD patients, NBS patients are radiosensitive (reviewed in (Taylor
& Byrd, 2005)).
1:5:3: NBS-like disorder.
Mutations in RAD50, the gene which encodes the final component protein of the MRN
complex, have been implicated in hereditary susceptibility to breast and ovarian cancers
(Heikkinen et al., 2003). However, a genetic disorder resulting from mutations in this gene
has only recently been identified (Waltes et al., 2009). Waltes et al. found compound
heterozygous mutations in the RAD50 gene resulting in production of low levels of unstable
Rad50 protein in a patient previously misdiagnosed with NBS due to her bird-like features,
short stature, microcephaly, mental retardation, cellular radiosensitivity and chromosomal
instability. However, unlike NBS patients she was not immunodeficient, had normal
immunoglobulin levels, and at time of publication had not developed a lymphoid malignancy
(at the age of 23). The patient’s cells failed to form DNA damage-induced MRN foci and
radiation induced activation of ATM and downstream signalling was impaired as was
activation of the G1/S cell cycle checkpoint. The disorder was classified as an NBS-like
disorder (NBSLD) (Waltes et al., 2009).
1:5:4: RIDDLE syndrome.
RIDDLE syndrome (radiosensitivity, immunodeficiency, dysmorphic features and learning
difficulties) is an extremely rare DNA repair deficiency disorder resulting from mutations in
Chapter 1: Introduction
30
the E3 ubiquitin ligase, RNF168, which may have a role in recruitment of the DNA repair
protein 53BP1 to sites of DNA damage (Stewart et al., 2009). The disorder has so far only
been identified in one patient and is characterised by an inability to produce IgG,
dysmorphic features, learning difficulties, stunted growth and a slight ataxic gait (Stewart et
al., 2007;Stewart et al., 2009).
1:5:5: Ataxia occulomotor apraxia 1 and 2.
Ataxia occulomotor apraxia 1 and 2 (AOA1 and AOA2) also have similarities to A-T. AOA1
results from mutations in the APTX1 gene which encodes aprataxin, a member of the HIT
domain superfamily of nucleotide hydrolases/transferases which may have a role in DNA
damage repair (Moreira et al., 2001). AOA1 has similar neurological features to A-T
including early onset ataxia, oculomotor apraxia (difficulties with eye movements) and
cerebellar atrophy. However AOA1 patients differ from A-T patients in that they do not
show immune deficiency, chromosomal instability or radiation sensitivity (Moreira et al.,
2001).
AOA2 has similar clinical features to AOA1 but the onset is later; 10-22 years compared to 2-
15 years for AOA1 (Moreira et al., 2004). Patients show progressive cerebellar ataxia with
peripheral neuropathy, cerebellar atrophy, occasional oculomotor apraxia and elevated
serum α-feto-protein levels (Anheim et al., 2009). AOA2 is caused by mutations in the SETX
gene which encodes sentaxin, a protein which is thought to have DNA/RNA helicase
activities and a role in DNA double strand break repair (Moreira et al., 2004). Patients do not
have increased radiation sensitivity or susceptibility to cancer (Anheim et al., 2009).
Chapter 1: Introduction
31
1:5:6: Spinocerebellar apraxia with axonal neuropathy.
Spinocerebellar apraxia with axonal neuropathy (SCAN1) is caused by mutation of the TDP1
gene which encodes the DNA repair protein tyrosyl DNA phosphodiesterase 1 (Tdp1)
(Takashima et al., 2002). Tdp1 is important in repair of DNA single strand breaks resulting
from abortive topoisomerase 1 activity, ionising radiation and oxidative stress (el-Khamisy et
al., 2005;el-Khamisy et al., 2007). Onset of SCAN1 occurs in late childhood. The disease
affects large, terminally differentiated, non-dividing neuronal cells and causes progressive
cerebellar ataxia and dysarthria (speech disorder) (Takashima et al., 2002). Lymphoblastoid
cell lines derived from SCAN1 patients may show slight radiosensitivity (Zhou et al., 2005).
The highly debilitating clinical phenotypes of Ataxia-telangiectasia and related disorders
which result from mutations in components of the DNA damage repair machinery illustrate
the importance of effective DNA damage repair in the normal functioning of the immune
and nervous systems, maintenance of genomic stability and cancer prevention.
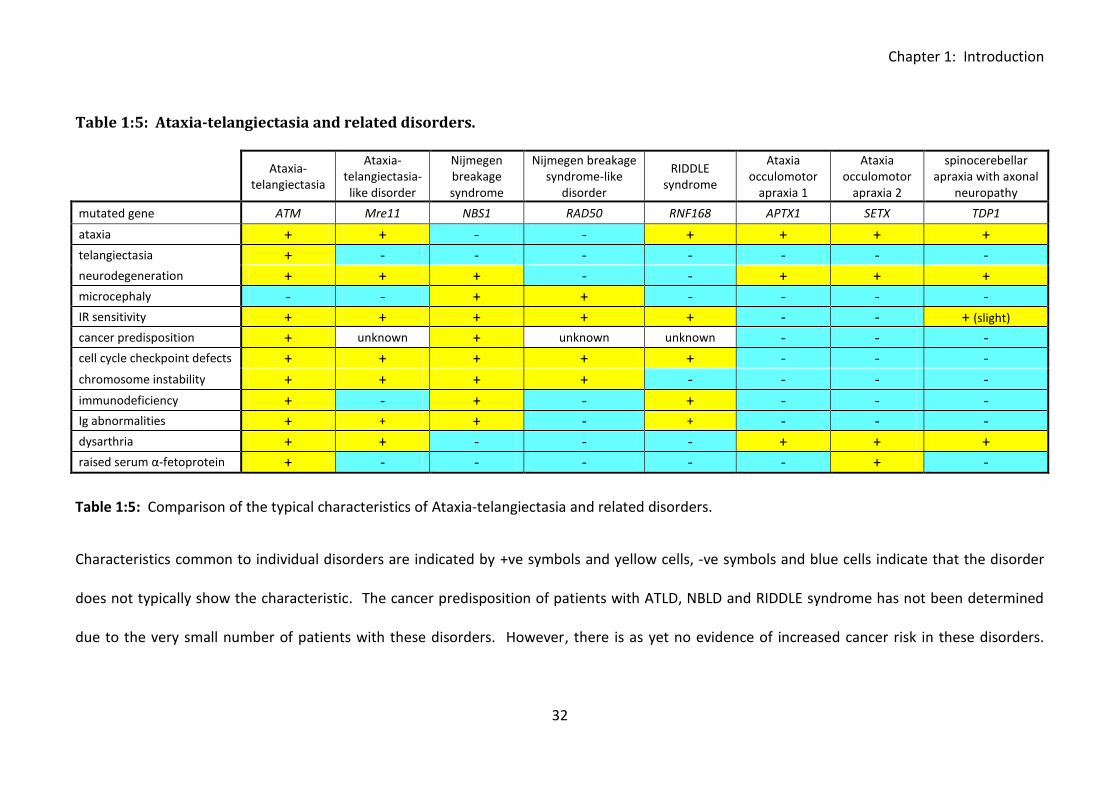
Chapter 1: Introduction
32
Table 1:5: Ataxia-telangiectasia and related disorders.
Ataxia-
telangiectasia
Ataxia-telangiectasia- like disorder
Nijmegen breakage syndrome
Nijmegen breakage syndrome-like
disorder
RIDDLE syndrome
Ataxia occulomotor
apraxia 1
Ataxia occulomotor
apraxia 2
spinocerebellar apraxia with axonal
neuropathy
mutated gene ATM Mre11 NBS1 RAD50 RNF168 APTX1 SETX TDP1
ataxia + + - - + + + + telangiectasia + - - - - - - - neurodegeneration + + + - - + + + microcephaly - - + + - - - - IR sensitivity + + + + + - - + (slight) cancer predisposition + unknown + unknown unknown - - - cell cycle checkpoint defects + + + + + - - -
chromosome instability + + + + - - - -
immunodeficiency + - + - + - - - Ig abnormalities + + + - + - - - dysarthria + + - - - + + + raised serum α-fetoprotein + - - - - - + -
Table 1:5: Comparison of the typical characteristics of Ataxia-telangiectasia and related disorders.
Characteristics common to individual disorders are indicated by +ve symbols and yellow cells, -ve symbols and blue cells indicate that the disorder
does not typically show the characteristic. The cancer predisposition of patients with ATLD, NBLD and RIDDLE syndrome has not been determined
due to the very small number of patients with these disorders. However, there is as yet no evidence of increased cancer risk in these disorders.
Chapter 1: Introduction
33
1:6: Current and future treatment strategies for Ataxia-telangiectasia.
At present there is no curative treatment for Ataxia-telangiectasia. Therefore current
treatment strategies aim to slow the progress of the neurodegeneration and treat tumours
with minimal side effects. Immunisations to reduce the risk of sinopulmonary infection and
immunoglobulin replacement therapy are commonly administered (reviewed in (Davies,
2009;Lavin et al., 2007)).
1:6:1: Antioxidants.
Possible future therapies include the use of antioxidants to reduce oxidative stress in A-T
patients’ cells. Studies using ATM deficient mice have suggested that treatment with
antioxidants such as N-acetyl-L-cysteine (NAC) may suppress genome rearrangements and
DNA deletions, reduce the incidence of lymphoma, increase lifespan and improve
neuromotor function possibly by reducing oxidative damage to purkinje cells (Gueven et al.,
2006;Reliene et al., 2008;Reliene and Schiestl, 2006). It is unclear if clinical trials analysing
the effect of antioxidant treatment on A-T patients are currently underway (Reliene and
Schiestl, 2007). However, the data collected using mouse models suggests that the
treatment would be advantageous.
1:6:2: Steroids.
Research is also being carried out to investigate the potential of steroid treatment for A-T.
There is both anecdotal and clinical evidence that steroids have beneficial effects on A-T
patients (Broccoletti et al., 2008;Buoni et al., 2006;Russo et al., 2009). Recent trials have
shown that betamethasone can reduce the neurological symptoms although this was not
sustained when treatment was discontinued (Broccoletti et al., 2008). Interestingly
Broccoletti et al. (2008) also reported an increase in lymphocyte cell count in A-T patients
Chapter 1: Introduction
34
during bethamethosone treatment. It is possible that the beneficial effects of the drug may
be due to an antioxidant mechanism (Russo et al., 2009). Unfortunately steroid treatment
has many deleterious side effects, these include immunosuppression which leads to
increased frequency of infections and could be very dangerous for already immunodeficient
A-T patients.
1:6:3: Mutation-targeted therapies.
Perhaps the most promising area of research into treatment of A-T and other primary
immunodeficiency disorders is that of mutation-targeted therapy. These treatment
strategies aim to correct mutations at the DNA level before their effects become systemic.
Therapies must be tailored to individual mutation type but include chemical suppression of
premature termination codons (nonsense mutations) and correction of splicing mutations
using antisense oligonucleotides to redirect the splicing machinery to an alternative splice
site. Strategies designed to correct frameshift, missense and in-frame mutations are also
being developed (reviewed in (Hu and Gatti, 2008)). Mutation-targeted therapy is a
relatively new area of research; however it could potentially be highly beneficial for
treatment of A-T and related disorders.
1:7: Aims & Objectives.
The aim of this project was to investigate the potential role of ATM in the extrinsic apoptotic
processes of CD95-mediated and NKG2D ligand-induced apoptosis and therefore gain a
fuller understanding of the cause of the immunodeficiency and cancer predisposition of A-T
patients.
Recent studies have suggested a role for ATM in regulation of CD95-mediated apoptosis,
however results from different research groups are conflicting. Evidence of both increased
Chapter 1: Introduction
35
sensitivity and increased resistance to CD95-mediated apoptosis as a result of ATM protein
kinase deficiency have been reported. I aimed to clarify the potential role of ATM in the
process and also investigate how abnormalities in CD95-mediated apoptosis resulting from
ATM mutations may affect the immune system in A-T.
The hypothesis of a role for ATM in immune surveillance through the DNA damage induced
upregulation of NKG2D ligands was also a new idea and evidence for the concept had only
been shown in fibroblasts. As A-T patients have a high incidence of leukaemia and
lymphoma I aimed to investigate the potential contributory role of a defect in immune
surveillance through NKG2D ligand upregulation on lymphocytes, to the development of
these tumours.

Chapter 2: Materials and Methods
36
Chapter 2: Materials and Methods.
Chapter 2: Materials and Methods
37
2:1: Collection and preparation of blood samples.
2:1:1: Donors.
Blood samples were obtained from healthy lab donors, A-T patients attending the
Nottingham A-T clinic and surplus diagnostic bloods from the Regional Genetics Laboratory,
Birmingham Women’s Hospital with appropriate ethical approval. Blood samples were
collected into heparinised syringes.
2:1:2: Isolation of PBMCs.
Isolation of peripheral blood mononuclear cells (PBMCs) was carried out as soon as possible
after sample collection. Blood samples were diluted 1:1 with RPMI 1640 (Sigma-Aldrich,
Poole, United Kingdom), layered onto lymphoprep (Nycomed, Sweden) and centrifuged at
1800rpm for 20 minutes with the brake off. The top layer of plasma was collected if
required, frozen and stored at -20°C. The buffy layer was then removed into a new sterile
tube using a Pasteur pipette and washed twice in RPMI 1640 at 1500rpm and 1200rpm for
10 minutes with the brake on before being resuspended in RPMI media (RPMI 1640
supplemented with 10% foetal calf serum, 2mM L-glutamine (Invitrogen, Auckland, New
Zealand) and 1% penicillin-streptomycin solution (Sigma)). Cells were counted using a
haemocytometer prior to use in assays or freezing.
2:1:3: Freezing and storage of PBMCs.
PBMCs that were not used immediately in assays were resuspended in freezing media (90%
FCS, 10% DMSO) placed in a “Mr Frosty” (Nalgene, Rochester, New York, USA and
transferred to a -80°C freezer. Frozen samples were then stored in liquid nitrogen.
Chapter 2: Materials and Methods
38
2:2: Cell culture.
2:2:1: Lymphoblastoid cell lines.
Lymphoblastoid cell lines were cultured at 37°C, 5% CO2 in RPMI media. Transfected LCLs
were cultured in the same media with the addition of 200µg/ml hygromycin B (Invitrogen).
LCL cultures were fed every 3 to 4 days by splitting 1 in 2 and topping up with fresh media.
2:2:2: Fibroblasts.
Human and mouse (NIH3T3) fibroblasts were cultured in horizontal flasks at 37°C, 5% CO2 in
DMEM media (Dulbecco’s Modified Eagle medium (Sigma) supplemented with 10% fetal calf
serum, 2mM L-glutamine (Invitrogen) and 1% penicillin-streptomycin solution (Sigma)). As
fibroblasts are adherent cells detachment was necessary prior to use in assays and for
splitting confluent cultures. The media was removed and the cells washed with PBS. 0.05%
trypsin-EDTA (Invitrogen) was then added to detach the cells. After a few minutes
incubation at 37°C and gentle tapping the cells lifted off the surface of the flask and could be
transferred to a sterile tube, washed, counted and reseeded in fresh media or used in
assays.
2:2:3: HeLa, K562 and LB23 SARC.
HeLa cells were cultured in DMEM media. As they are adherent cells trypsinisation (as
described in section 2:2:2) was necessary for splitting of confluent cultures. The non-
adherent cell lines K562 and LB23 SARC were cultured in RPMI media and fed as for LCLs
(section 2:2:1).
Chapter 2: Materials and Methods
39
2:2:4: T cell cloning.
The IFN-γ secretion assay (Miltenyi Biotech, Bergisch Gladback, Germany) was used to detect
and isolate viable IFN-γ secreting T cells which could then be cloned by limiting dilution. This
method of cloning is considerably more efficient than limiting dilution alone.
Preparation of cloning mix.
Three buffy coats were separated using lymphoprep (as described in section 2:1:2) and
individually resuspended in 20ml of RPMI media. They were stimulated overnight by the
addition of 1µl/ml PHA, harvested, washed 3 times in RPM1 1640 (Sigma), pooled and
resuspended in RPMI media. 20x106 cells of an LCL autologous to the donor whose cells
were to be cloned (HLA A2) was also harvested and washed in RPMI. The buffy coats and
LCL were irradiated (40Gy) and two separate T cell cloning feeder mixes prepared (one for
cloning CD4+ and one for cloning CD8+ T cells). Each mix consisted of 150x106 buffy and
10x106 LCL cells resuspended in 150ml of RPMI media supplemented with 15µl of IL-2.
IFN-γ capture.
A lab donor with the appropriate HLA type (A2) was bled (50ml) and PBMCs isolated using
lymphoprep (Nycomed). The PBMCs were resuspended in T cell cloning media (RPMI 1640
supplemented with 10% human serum and 2mM L-glutamine) at a concentration of
10x106cells/ml and plated out into 2 wells (1ml per well). Each well was stimulated for 3
hours with 10µg/ml CMV peptide (VLE for CD8+ T cell cloning, DYSN for CD4+ T cell cloning).
This step induces secretion of IFN-γ by VLE- or DYSN-peptide specific T cells. PBMC samples
were also stimulated with either DMSO or Staphylococcal Enterotoxin B (100ng/ml) (Sigma)
to provide negative and positive controls respectively.
Chapter 2: Materials and Methods
40
Following stimulation PBMCs were transferred to 15ml tubes, washed in cold MACs buffer
(PBS pH 7.2 containing 0.5% bovine serum albumin and 2mM EDTA) and resuspended in 80µl
of cold T cell cloning media. 20µl of bi-specific IFN-γ Catch reagent (Miltenyi Biotech) per 107
cells was added and the cells incubated for 5 minutes on ice. They were then diluted in
warm T cell cloning media to give a concentration of 0.5-1x10⁶ cells/ml and left under
continuous rotation at 37°C for 45 minutes. Cells were washed twice in cold MACS buffer
and resuspended in 80µl of the buffer. 20µl of IFN-γ detection antibody conjugated to PE
(Miltenyi Biotech) was added and the cells incubated on ice for 10 minutes. They were
washed again in cold MACS buffer, resuspended in 80µl and magnetically labelled by
incubation for 15 minutes at 4°C with 20µl of anti-PE magnetic beads (Miltenyi Biotech).
Cells were washed and resuspended in 500µl of cold MACS buffer. 50µl of each sample was
removed, stained with CD8-PCy5 (Beckman Coulter, High Wycombe, UK) and analysed on an
XL Beckman Coulter flow cytometer to analyse the frequency of IFN-γ secreting cells prior to
enrichment. Enrichment was performed by magnetic separation using the separation
program ‘Posseld’ on an auto-MACS (Miltenyi Biotech). A small sample of the positively
selected cells was also stained with CD8-PCy5 and analysed by flow cytometry to allow the
efficiency of enrichment to be determined.
Cloning by limiting dilution.
The positively selected VLE- or DYSN-stimulated T cells were counted, resuspended in T cell
cloning media, seeded into cloning mix and plated out in 96 well plates (100µl per well) as
follows – 3 plates 30 T cells/well (9000 T cells in 30ml cloning mix), 6 plates 3 T cells/well
(1800 T cells in 60ml cloning mix), 6 plates 0.3 T cells/well (180 T cells in 60ml cloning mix)
and one plate 0 T cells/well (10ml cloning mix). This gave 30 plates in total (15 plates of VLE-
stimulated T cells and 15 of DYSN-stimulated T cells). Plates were wrapped in foil and
Chapter 2: Materials and Methods
41
incubated at 37°C in 5% CO2 for 2 to 3 weeks. Growing clones were then expanded to 2ml
with cloning mix and incubated for a further week. They were tested for specificity by IFN-γ
ELISA (as described in section 2:6:2).
2:3: Flow cytometry.
2:3:1: Phenotyping of lymphocyte subsets.
Phenotyping of lymphocyte subsets (T cells, B cells, NK cells, NKT cells, CD4+ve T cells,
CD8+ve T cells, CD4+ve and CD8+ve naive, central memory, effector memory and TEMRA T
cell subsets, naive and memory B cells and CD56bright and CD56dim NK cells) and analysis of
CD95, FasL and CD127 (IL-7Rα) expression was carried out using an 11 colour panel
consisting of 10 conjugated antibodies: CD3-Amcyan (BD biosciences, San Jose, California,
USA), CD19-eflour 450 (eBiosciences, San Diego, California, USA), CD56-PCy7 (BD
biosciences), CD4-APC (BD biosciences), CD8-Q dot 655 (Invitrogen) CD45 RA-AF700
(Biolegend, San Diego, California, USA), CD27-APC AF780 (eBiosciences), CD95-PE (Dako,
Glostrup, Denmark), FasL-FITC (Abcam, Cambridge UK) and CD127-PerCP-Cy5.5 (BD
biosciences) and the dead cell exclusion die propidium iodide (PI) (Sigma).
Frozen PBMC samples were thawed in a water bath at 37°C for a few minutes, slowly
resuspended then washed in warm RPMI 1640 (Sigma) with 10% foetal calf serum. They
were washed again in cold MACs buffer prior to staining with an antibody cocktail
(conjugated antibodies without PI) for 20 minutes on ice and protected from light. They
were then washed in MACs buffer as before, resuspended in 400µl MACs buffer and
transferred to FACs tubes. Propidium iodide (Sigma) was added to each tube immediately
before analysis on a LSRll flow cytometer (BD biosciences). Data was analysed using DIVA
flow cytometry software (BD biosciences).
Chapter 2: Materials and Methods
42
2:3:2: Analysis of CD95 expression and CD95-mediated apoptosis.
CD95 expression and induction of apoptosis was assessed by flow cytometry on a XL
Beckman Coulter flow cytometer. For induction of CD95-mediated apoptosis cells were
incubated with 500ng/mL of anti-Fas IgM monoclonal antibody (Tran et al., 2008) (CH11:
Upstate, Millipore, Temcula, California, USA) for 15h or as indicated. Apoptosis was
quantified using Annexin V-FITC (BD Pharmingen, San Diego, California, USA) and propidium
iodide (Sigma) according to the manufacturer’s instructions (early apoptosis - AV+ve, PI-ve;
late apoptosis - AV+ve, PI+ve). Specific apoptosis was determined as follows: (% of apoptotic
cells with CH11/% of apoptotic cells without CH11).
CD95 expression was analysed using a CD95-PE conjugated antibody (DX2: Dako). Mean
fluorescence intensity of viable cells (Annexin V-ve, PI-ve) was used to compare the level of
CD95 expression. Flow cytometry data was analysed using Flowjo software (Tree Star Inc,
Ashland, Oregon USA).
2:3:3: Analysis of perforin/granzyme cytotoxic T cell killing using CFSE.
A flow cytometry assay was developed to analyse perforin/granzyme killing of LCL targets
using T cell clones. The clones were tested by chromium release with perforin/granzyme
blocking to confirm their mechanism of cytotoxicity (as described in section 2.7.2).
LCL target cells with the appropriate HLA type to allow recognition by the clones (A2 for VLE
and DYSN clones) were labelled with 10µM CFSE (Invitrogen) for 10 minutes at 37°C. The
reaction was stopped by adding an equal volume of FCS and incubating for 2 minutes at
room temperature. The cells were resuspended in RPMI media at a concentration of
5x10⁴cells/ml and plated out in 96 well plates, 100µl per well. T cell clones were counted,
resuspended at a concentration of 1x10⁴cells/ml and 100µl per well added to the CFSE
Chapter 2: Materials and Methods
43
labelled LCL target cells. 100µl per well of RPMI media was added to LCL only control plates.
The assay plates were incubated at 37°C for 5 hours.
Wells were harvested, the cells transferred to FACs tubes, washed in cold MACs buffer and
resuspended in 300µl. 10µl of counting beads (Caltag Laboratories, Burlingame, California,
USA) was added to each tube prior to flow cytometry analysis. This allowed the absolute
number of cells to be determined using the formula: absolute count = (number of cells
counted/total number of beads counted) x number of beads per µl. As LCLs were labelled
with CFSE but florescence is lost on lysis the viable LCL target cells could be distinguished
from the T cell clones. The percentage survival of the LCLs was calculated using the formula:
(absolute number of CFSE+ve cells after incubation with T cell clones/ absolute number of
CFSE+ve cells in the no T cell clone control) x 100/1.
2:3:4: Analysis of NKG2D ligand expression on LCLs, fibroblasts and B cells.
NKG2D ligand expression on LCLs, fibroblasts and B cells was analysed by flow cytometry
using an XL Beckman Coulter flow cytometer (Beckman Coulter). For analysis of NKG2D
ligand expression on LCLs or fibroblasts cells were harvested, washed in cold MACs buffer
and transferred to FACs tubes. 0.5x10⁶ cells per test were stained for 30min on ice with
single NKG2D antibodies (MICA-PE, MICB, ULBP-1, ULBP-2-PE, ULBP-3 (R&D systems,
Minneapolis, Minnesota, USA)) or isotype control antibodies (IgG2b-PE, IgG2b, IgG2a (BD
Pharmingen)). Cells were washed and those stained with congugated antibodies were
resuspended in 400µl of cold MACs buffer. Those stained with uncongugated antibodies
were blocked with 100µl goat serum for 10 minutes prior to staining with goat anti-mouse-
PE secondary antibody (Dako) for 20 minutes on ice. They were then also washed and
Chapter 2: Materials and Methods
44
resuspended as before. Propidium iodide (Sigma) was added to tubes immediately prior to
analysis.
For analysis of MICA expression on B cells staining was carried out as for LCLs but PBMC
samples were dual stained with either MICA-PE (R&D systems) and the B cell antibody CD20-
FITC (Dako) or the isotype control IgG2b-PE (BD Pharmingen) and CD20-FITC (Dako).
Flow cytometry data was analysed using Flowjo software (Tree Star Inc) and NKG2D ligand
expression calculated by subtracting any background staining in the appropriate isotype
control from the percentage or MFI of NKG2D+ve cells.
2:4: Western blots.
2:4:1: Analysis of ATM activation, cFLIP expression and ATM activation.
Cell extracts were washed in cold PBS and protein extracted by sonication in UTB buffer (8 M
urea, 150 mM β-mercaptoethanol, 50 mM Tris HCl, pH7.5). Protein concentrations of
extracts were determined using the Bradford protein assay (Bio-rad, Hercules, California,
USA). 30µg of protein extract was separated by electrophoresis on an 8% Tris-Bicine gel and
blotted onto nitrocellulose membrane. Following a 2 hour incubation in blocking solution
(5% milk in TBST) blots were probed overnight with primary antibodies; total ATM (11G12
mouse monoclonal raised against amino acids 992-1144), phospho ATM Ser1981 (R&D
systems), total SMC1 (Bethel Laboratories, Montgomery, Texas, USA), phospho SMC1 Ser966
(Bethel laboratories), total NBS1 (Abcam), phospho NBS1 Ser343 (Bethel laboratories), cFLIP
L/S (NF6; Alexis Biochemicals, Lausanne, Switzerland), caspase 8 (5F7; MBL, Watertown, MA,
USA), LMP1 (CS1-4) (Rowe et al., 1987), β-actin (A5316, Sigma), Rad50 (Sigma). After
washing in TBST they were incubated with the appropriate mouse or rabbit secondary
antibodies (Dako). Proteins were visualised using the enhanced chemiluminescence (ECL)
Chapter 2: Materials and Methods
45
technique (Amersham, Little Chalfont, Buckinghamshire, United Kingdom). Protein bands
were quantified by densitometry (Quantity One software).
2:4:2: siRNA knockdown of cFLIP.
2.5x10⁵ HeLa cells per 6cm dish were plated out in RPMI media and left to become
approximately 30-50% confluent overnight.
The next day 1ml warm OPTIMEM (Invitrogen) and 20µl sterile oligofectamine (Invitrogen)
were added to RNAse free tubes (Ambion, Austin, Texas, USA). 36µl of 20µM stock of
human C-FLAR RNA (ON-Target plusSMARTpool L-003772-00-0005, Human CFLAR (Thermo
Scientific Dharmacon, Lafayette, CO, USA)) or 7.2µl of 100µM stock of control RNA (Thermo
Scientific Dharmacon) was added and the solution mixed by pipetting then left for 30min to
allow RNA and lipids to complex together. The media was removed from the HeLa cells and
the cells rinsed with OPTIMEM. 1ml fresh OPTIMEM was then added to each 6cm dish. The
RNA was dropped onto the cells and evenly distributed across the dish by gentle rocking.
Following another overnight incubation 2ml of DMEM media (Sigma) with 20% foetal calf
serum (no antibiotics) was added to each 6cm dish to give a final concentration of 10% foetal
calf serum. Cells were again incubated overnight. The next morning cells were confluent so
were detached using 0.05% trypsin-EDTA (Invitrogen) and plated out in 10cm dishes. They
were cultured overnight and then harvested for western blotting.
2:5: Activation and inhibition of ATM activity.
2:5:1: Activation of ATM.
Irradiation was used to create double strand breaks in DNA and therefore induce activation
of ATM. Cells were irradiated with 5Gy or 10Gy of γ-rays (Cs137) and incubated at 37°C for 30
Chapter 2: Materials and Methods
46
minutes to allow sufficient time for ATM to be activated prior to use in assays.
2:5:2: Inhibition of ATM.
To inhibit ATM activity, cells were incubated with 10µM ATM inhibitor KU-55933 (KuDOS,
Cambridge, United Kingdom) for the times as indicated.
2:6: ELISAS
2:6:1: Measurement of plasma cytokine concentrations.
Analysis of IL-7, IL-15 and IL-21 concentration in plasma samples was carried out in triplicate
using commercial kits (Human IL-7 Quantikine HS ELISA kit (R&D systems), Human IL-15
ELISA kit (RayBiotech, North Metro-Atlanta, Georgia, USA), Human IL-21 R ELISA ready-SET-
Go! (eBioscience)) according to the manufacturer’s instructions.
2:6:2: Interferon gamma ELISA assay.
An IFN-γ ELISA assay (Endogen, Rockford, Il, USA) was used to test the ability of DYSN- and
VLE-specific T cell clones to recognise peptide loaded target cells. Irradiated (40Gy) LCLs
were used as targets, they were counted, harvested, washed in RPMI 1640 (Sigma) and
resuspended in 1ml RPMI 1640. The sample was then split into two 15ml tubes, the cells
pelleted and the supernatant poured off. The relevant CMV peptide (DYSN or VLE) was
added to one tube (10µg/ml) and an equivalent dilution of DMSO to the other. Cells were
incubated for 1 hour at 37°C and the tubes flicked every 15 minutes to optimise peptide
loading. They were then washed in RPMI, resuspended in RPMI media at a concentration of
1x10⁶cells/ml and plated out in 96 well plates, 50µl per well to give 5x10⁴cells/well.
T cell clones were counted, washed twice in RPMI 1640 (Sigma) and resuspended in RPMI
media at a concentration of 2x10⁵cells/ml. They were added to the LCL targets 50µl per well
Chapter 2: Materials and Methods
47
to give 1x10⁴T cells/well. The culture plate was incubated overnight then spun down and
the supernatant harvested and tested for IFN-γ production by ELISA.
A Maxisorp plate (Nunc, Hatfield, UK) was coated with 50µl per well anti-human IFNγ Ab
(Endogen) diluted to a concentration of 0.75µg/ml in coating buffer (0.1M Na2HPO4 adjusted
to pH 9 with 0.1M NaH2PO4). The plate was sealed and left overnight at 4°C. The antibody
was then flicked off, the plate blotted with tissue and 200µl of blocking buffer (filtered
1%BSA/PBS with 0.05% Tween-20 (Sigma)) added to each well. It was incubated for 2 hours
at room temperature and control standard dilutions of IFN-γ (Endogen) in RPMI media
ranging from 2000pg/ml to 31.25pg/ml were prepared.
The Maxisorp plate was washed 3 times with PBS/Tween and assay supernatants and control
standards immediately added (50µl/well). The plate was sealed and left at room
temperature for 2-4 hours. It was then washed 4 times with PBS/Tween before addition of
50µl/well biotinylated anti-IFN-γ Ab (Endogen) diluted in blocking buffer (2µg/ml). The plate
was sealed and incubated at room temperature for 1 hour. It was washed 4 times with
PBS/Tween and 50µl of Extra-avidin Peroxidase (Sigma) diluted 1/1000 in blocking buffer
added to each well. The plate was sealed and incubated for 30 minutes at room
temperature. It was washed a final 8 times with PBS/Tween and 100µl of TMB substrate
(TebuBio, Peterborough, UK) added to each well. The plate was incubated for 20 minutes in
the dark and then the reaction stopped by the addition of 100µl/well of 0.5M sulphuric acid.
The plate was read on an absorbance plate reader at 450nm.
Chapter 2: Materials and Methods
48
2:7: Chromium release.
2:7:1: CH11 Killing assays.
To test the sensitivity of LCLs to CD95-mediated apoptosis by chromium release LCL targets
were labelled with 100µCi of Na251CrO4 (Amersham-Pharmacia Biotech, UK) for 1 hour, then
washed twice, counted and plated out in triplicate to give 2500 cells per well in 100µl of
RPMI media. An additional 100µl of RPMI media supplemented with CH11 (Upstate) (to give
a final concentration of 10-1000ng/ml) was then added to appropriate wells. To measure
spontaneous and maximum lysis for each LCL 100µl of either RPMI media without CH11 (for
spontaneous lysis) or 1% SDS (for maximum lysis) was added to appropriate wells. Plates
were incubated for 15 hours at 37°C, 5% CO2 then spun at 1000rpm for 2 minutes to pellet
the cells. 100µl of supernatant was harvested from each well and release of radioactivity
(lysis) determined using a topcounter (Hewitt Packard). The percentage of CH11-induced
lysis was calculated using the equation: 100 x (CH11 release - spontaneous
release)/(maximum release - spontaneous release).
2:7:2: Cytotoxicity assays.
Chromium release assays to measure target cell killing by T cell clones were carried out as
described in section 2:7:1, however rather than adding 100µl of CH11 supplemented RPMI
media to wells containing autologous LCL target cells, 100µl of RPMI media containing
resuspended T cell clones was added to give varying effector:target ratios. Plates were
incubated for either 6 hours (for perforin killing assays) or 15 hours (for CD95-killing assays)
prior to harvest of supernatant.
Chapter 2: Materials and Methods
49
2:7:3: CD95 and perforin blocking assays.
CD95 and perforin blocking assays were used to determine the mechanism of cytotoxicity of
different T cell clones. These assays were variations on the chromium release assay
described in section 2:7:2. However to block the CD95-mediated pathway of apoptosis LCL
target cells were plated out 2500 cells/well in 90µl of RPMI media, 10µl of 2µg/ml ZB4
(Immunotech, Marseille, France) was added to each well and the plates incubated for 1 hour
at room temperature prior to addition of T cell clones. ZB4 blocked and unblocked LCLs
incubated with 500ng/ml CH11 (Upstate) were used as positive and negative controls for
inhibition of CD95-mediated apoptosis. Perforin blocking was carried out by incubating T
cell clones with concanamycin A (Sigma) before incubation with LCL targets. T cells were
plated out in 80µl/well of RPMI media and 20µl of 2µg/ml concanamycin A (Sigma) added to
each well. They were then incubated at 37°C for 2 hours and LCL targets added.
The percentage of target cell lysis in the presence and absence of blocking was compared. If
blocking significantly reduced the percentage of lysis compared to unblocked controls it was
concluded that the T cells primarily killed their targets through the blocked pathway.
However, if blocking had a no significant effect on the percentage of target cell lysis
compared to unblocked controls it was concluded that blocked pathway was not the primary
mechanism of cytotoxicity of the T cell clone.
2:8: Statistical methods.
Data was analysed using Graphpad PRISM software (GraphPad Software, INC, San Diego
California, USA). The significance of differences between populations of data were analysed
using students t test (Mann-Whitney) or one way anova (non-parametric) and Dunn’s
Chapter 2: Materials and Methods
50
multiple comparison test with a level of significance of p≤0.05. The Spearman test (non-
parametric) was used for analysis of correlations.
Chapter 3: Results
51
Chapter 3: Phenotyping of A-T and normal PBMCs.
Chapter 3: Results
52
3:1: Introduction.
The majority of A-T patients are lymphopenic due to reduced numbers of both T and B cells
(Nowak-Wegrzyn et al., 2004). They have reduced proportions of naive T cells and naive B
cells and increased proportions of memory T cells, memory B cells and NK cells compared to
normal healthy individuals (Giovannetti et al., 2002). The cause of the T cell lymphopenia in
A-T patients is thought to be reduced output from the thymus, although increased
spontaneous apoptosis of naive cells has been suggested as a contributing factor (Schubert
et al., 2000). Interestingly elderly individuals also have reduced numbers of naive cells and
an increase in both spontaneous and CD95-mediated apoptosis of lymphocytes as well as
increased CD95 expression on T cells has been associated with aging of the immune system
(Aggarwal and Gupta, 1998;Gupta and Gollapudi, 2008;Potestio et al., 1999). It is possible
that a similar sensitivity to CD95-mediated apoptosis in A-T patients could contribute to their
lymphopenic phenotype.
In terms of lymphocyte numbers the immune system in A-T is very similar to that of
lymphopenic patients such as HIV patients and bone marrow recipients. The cytokine IL-7 is
important in regulation of T cell homeostasis and proliferation in response in lymphopenia.
It is primarily produced by the stromal cells of the thymus and bone marrow and provides a
survival signal by binding to the IL-7 receptor complex on naive and memory T cells. Under
normal conditions production of the cytokine is relatively stable and T cell responses are
regulated through modulation of the IL-7 receptor α chain (IL7-Rα or CD127) which
dimerises with the γ chain to form the IL-7 receptor complex. Naive T cells downregulate
CD127 after contact with IL-7 and upregulate it in the absence of the cytokine, this works to
conserve IL-7 and control proliferation (Park et al., 2004). However a decrease in T cell
number leads to an increase in the amount of IL-7 available per T cell. This provides an
Chapter 3: Results
53
enhanced survival signal and, if the signal is strong enough, lymphopenia-induced
proliferation of naive cells (reviewed in (Overwijk and Schluns, 2009)).
Conversely increased availability of the cytokine IL-7 as a response to lymphopenia may also
contribute to the lymphopenia as a result of upregulation of CD95 on T cells and consequent
sensitivity to CD95-mediated apoptosis. Peripheral T cell depletion associated with
increased serum IL-7 concentration and consequent CD95 upregulation in lymphopenic
individuals has been reported in HIV patients (Rethi et al., 2008) and bone marrow
transplant recipients (Brugnoni et al., 1999). A-T patients are also likely to show increased
IL-7 production in response to their lymphopenia and may consequently upregulate CD95 on
their T cells leading to both increased sensitivity to CD95-mediated apoptosis and
spontaneous apoptosis. Significantly higher CD95 expression on A-T T cells compared to
normal controls has previously been described although IL-7 was not investigated
(Giovannetti et al., 2002;Schubert et al., 2000). An increased level of spontaneous apoptosis
has also been shown in A-T lymphocytes compared to normal controls (Duchaud et al.,
1996).
Rethi et al. suggested that the high IL-7 levels associated with lymphopenic conditions may
increase the sensitivity of naive T cells to CD95-mediated apoptosis, whilst, in combination
with TCR signalling, inducing proliferation of T cells recognising low-affinity antigens through
increasing CD95-mediated co-stimulatory signals (Rethi et al., 2008). If this is the case
increased sensitivity of A-T patients’ cells to CD95-mediated apoptosis could contribute to
both their naive T cell deficiency (by increasing CD95-mediated and spontaneous apoptosis)
and the predominance of activated memory cells (Schubert et al., 2000) (by inducing their
proliferation).
Chapter 3: Results
54
The cytokines IL-15 and IL-21 also have a role in lymphocyte homeostasis and proliferation.
IL-15 is thought to be mainly produced by monocytes and macrophages and is particularly
important for survival and proliferation of memory CD8+ T cells, NKT cells and NK cells
(reviewed in (Overwijk & Schluns, 2009)). IL-21 is produced by CD4+ T cells and NKT cells in
response to T cell receptor activation. It has a role in regulating differentiation and
proliferation of CD8+ T cells, B cells and NK cells (reviewed in (Sondergaard and Skak, 2009)).
Like IL-7, abnormal levels of IL-15 and IL-21 could have a role in shaping the immune system
phenotype of A-T patients.
In order to investigate the possible association of CD95 expression and IL-7, IL-15 and IL-21
availability with lymphopenia in A-T patients, PBMC and plasma samples were collected
from patients and age matched controls with an age range of 0 to 30 years. An 11 colour
antibody panel was developed in order to distinguish different cell subsets and also
investigate expression of CD95, Fas ligand (FasL) and the IL-7 receptor α chain (CD127).
Plasma concentrations of the cytokines IL-7, IL-15 and IL-21 were measured by ELISA and
correlation analysis carried out to investigate any effect of IL-7 concentration on expression
of CD95, FasL or CD127. The effect of aging on the proportions of different cell types and
CD95, FasL and CD127 expression in normal and A-T individuals was also analysed.
The results of my study were consistent with the reported lymphopenia and naive T and B
cell deficiency of A-T patients. As well as reduced naive and increased memory cells A-T
patients had significantly higher percentages of NK and NKT cells than normal controls.
Overall my findings suggested a congenitally aged immune system phenotype in A-T
patients. Samples from A-T patients with no ATM activity showed significantly higher
expression of CD95 on all cell types excluding NK cells. This suggests that A-T patients’ cells
may be more sensitive to CD95-mediated apoptosis than normal cells. There was no
Chapter 3: Results
55
significant difference in IL-7 or IL-15 plasma concentrations between A-T patients and
normal controls.
Chapter 3: Results
56
3:2: PBMC sample collection, cell counts and correlations with age.
3:2:1: PBMC sample collection, selection and age matching.
Blood samples were collected from 18 A-T patients with known ATM mutations (Table
3:2:1A), and 33 normal controls (Table 3:2:1B). The age range of the A-T patients at time of
bleed was 1 to 28 years. They were divided into two groups according to the presence or
absence of ATM kinase activity (previously determined by western blot). The majority of the
A-T patients (15) had no ATM activity. The age range of these patients was 1 year 7 months
to 28 years 8 months and the mean age was 9 years 4 months (112.1 months). As only three
A-T patients had some ATM activity the age range of this group was considerably smaller; 12
years 10 months to 19 years 11 months. The mean age of 16 years 3.7 months (195.7
months) was also older than that of the A-T patients with no ATM activity (Fig 3:2:1A&B).
The majority of the normal control samples (N PBMC1-30) were obtained from the Regional
Genetics Laboratory, Birmingham Women’s Hospital. These anonymous samples were the
surplus from diagnostic bloods obtained from patients aged 1 to 14 years; details of each
sample are given in Table 3:2:1B. In order to increase the age range of controls blood
samples from 3 healthy lab donors aged 22, 26 and 30 years were also collected (N PBMC31-
33). This gave an age range of 1 to 30 years. Blood samples were separated by lymphoprep
and matched PBMC and plasma samples collected.
The use of surplus bloods as normal controls is not ideal as although samples from patients
with non-haematological disorders were requested it could not be guaranteed that all would
have healthy immune systems. However as control samples were required to age match the
A-T patient cohort the use of surplus bloods was preferable to bleeding healthy children.
The lab donor blood samples were a useful control for checking the ‘normality’ of the
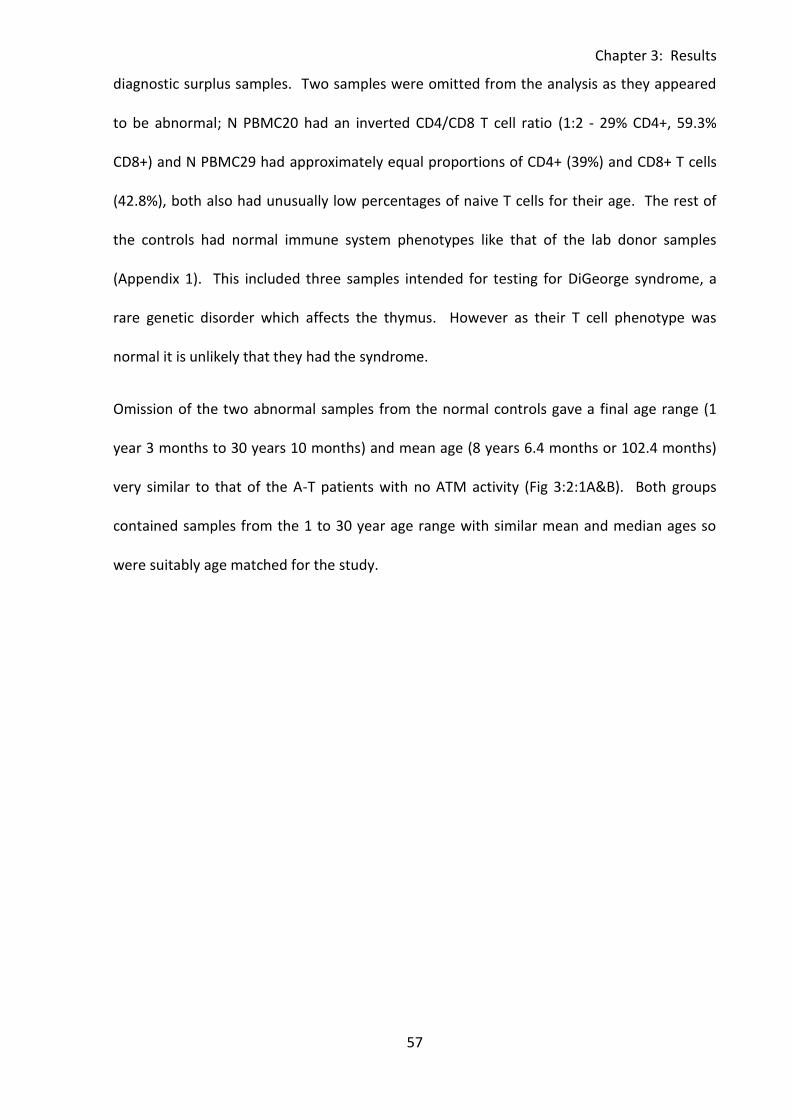
Chapter 3: Results
57
diagnostic surplus samples. Two samples were omitted from the analysis as they appeared
to be abnormal; N PBMC20 had an inverted CD4/CD8 T cell ratio (1:2 - 29% CD4+, 59.3%
CD8+) and N PBMC29 had approximately equal proportions of CD4+ (39%) and CD8+ T cells
(42.8%), both also had unusually low percentages of naive T cells for their age. The rest of
the controls had normal immune system phenotypes like that of the lab donor samples
(Appendix 1). This included three samples intended for testing for DiGeorge syndrome, a
rare genetic disorder which affects the thymus. However as their T cell phenotype was
normal it is unlikely that they had the syndrome.
Omission of the two abnormal samples from the normal controls gave a final age range (1
year 3 months to 30 years 10 months) and mean age (8 years 6.4 months or 102.4 months)
very similar to that of the A-T patients with no ATM activity (Fig 3:2:1A&B). Both groups
contained samples from the 1 to 30 year age range with similar mean and median ages so
were suitably age matched for the study.
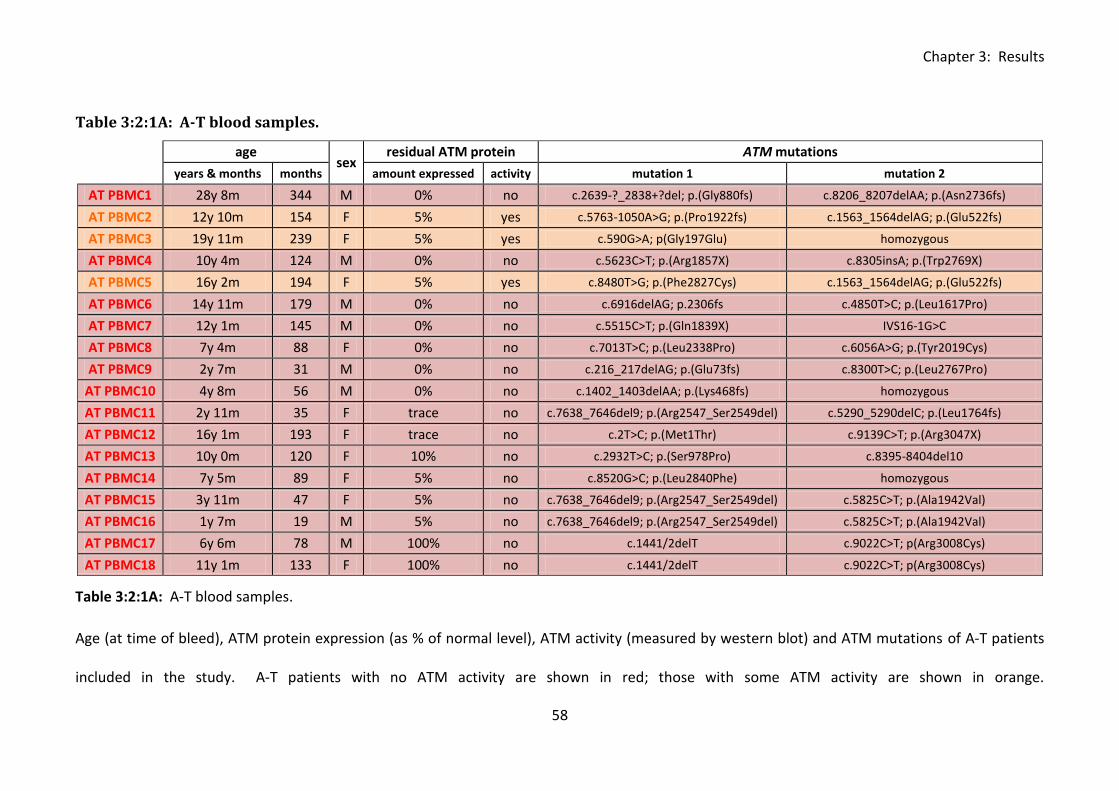
Chapter 3: Results
58
Table 3:2:1A: A-T blood samples.
age sex
residual ATM protein ATM mutations
years & months months amount expressed activity mutation 1 mutation 2
AT PBMC1 28y 8m 344 M 0% no c.2639-?_2838+?del; p.(Gly880fs) c.8206_8207delAA; p.(Asn2736fs)
AT PBMC2 12y 10m 154 F 5% yes c.5763-1050A>G; p.(Pro1922fs) c.1563_1564delAG; p.(Glu522fs)
AT PBMC3 19y 11m 239 F 5% yes c.590G>A; p(Gly197Glu) homozygous
AT PBMC4 10y 4m 124 M 0% no c.5623C>T; p.(Arg1857X) c.8305insA; p.(Trp2769X)
AT PBMC5 16y 2m 194 F 5% yes c.8480T>G; p.(Phe2827Cys) c.1563_1564delAG; p.(Glu522fs)
AT PBMC6 14y 11m 179 M 0% no c.6916delAG; p.2306fs c.4850T>C; p.(Leu1617Pro)
AT PBMC7 12y 1m 145 M 0% no c.5515C>T; p.(Gln1839X) IVS16-1G>C
AT PBMC8 7y 4m 88 F 0% no c.7013T>C; p.(Leu2338Pro) c.6056A>G; p.(Tyr2019Cys)
AT PBMC9 2y 7m 31 M 0% no c.216_217delAG; p.(Glu73fs) c.8300T>C; p.(Leu2767Pro)
AT PBMC10 4y 8m 56 M 0% no c.1402_1403delAA; p.(Lys468fs) homozygous
AT PBMC11 2y 11m 35 F trace no c.7638_7646del9; p.(Arg2547_Ser2549del) c.5290_5290delC; p.(Leu1764fs)
AT PBMC12 16y 1m 193 F trace no c.2T>C; p.(Met1Thr) c.9139C>T; p.(Arg3047X)
AT PBMC13 10y 0m 120 F 10% no c.2932T>C; p.(Ser978Pro) c.8395-8404del10
AT PBMC14 7y 5m 89 F 5% no c.8520G>C; p.(Leu2840Phe) homozygous
AT PBMC15 3y 11m 47 F 5% no c.7638_7646del9; p.(Arg2547_Ser2549del) c.5825C>T; p.(Ala1942Val)
AT PBMC16 1y 7m 19 M 5% no c.7638_7646del9; p.(Arg2547_Ser2549del) c.5825C>T; p.(Ala1942Val)
AT PBMC17 6y 6m 78 M 100% no c.1441/2delT c.9022C>T; p(Arg3008Cys)
AT PBMC18 11y 1m 133 F 100% no c.1441/2delT c.9022C>T; p(Arg3008Cys)
Table 3:2:1A: A-T blood samples.
Age (at time of bleed), ATM protein expression (as % of normal level), ATM activity (measured by western blot) and ATM mutations of A-T patients
included in the study. A-T patients with no ATM activity are shown in red; those with some ATM activity are shown in orange.
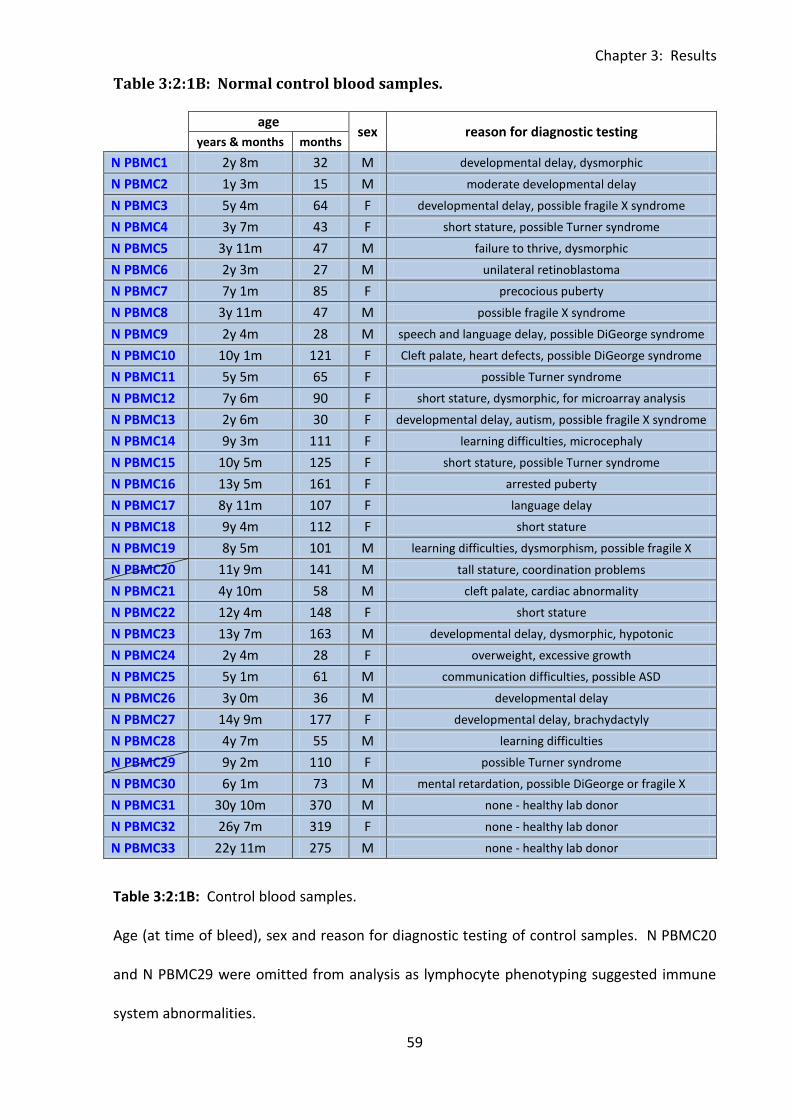
Chapter 3: Results
59
Table 3:2:1B: Normal control blood samples.
age sex reason for diagnostic testing
years & months months
N PBMC1 2y 8m 32 M developmental delay, dysmorphic
N PBMC2 1y 3m 15 M moderate developmental delay
N PBMC3 5y 4m 64 F developmental delay, possible fragile X syndrome
N PBMC4 3y 7m 43 F short stature, possible Turner syndrome
N PBMC5 3y 11m 47 M failure to thrive, dysmorphic
N PBMC6 2y 3m 27 M unilateral retinoblastoma
N PBMC7 7y 1m 85 F precocious puberty
N PBMC8 3y 11m 47 M possible fragile X syndrome
N PBMC9 2y 4m 28 M speech and language delay, possible DiGeorge syndrome
N PBMC10 10y 1m 121 F Cleft palate, heart defects, possible DiGeorge syndrome
N PBMC11 5y 5m 65 F possible Turner syndrome
N PBMC12 7y 6m 90 F short stature, dysmorphic, for microarray analysis
N PBMC13 2y 6m 30 F developmental delay, autism, possible fragile X syndrome
N PBMC14 9y 3m 111 F learning difficulties, microcephaly
N PBMC15 10y 5m 125 F short stature, possible Turner syndrome
N PBMC16 13y 5m 161 F arrested puberty
N PBMC17 8y 11m 107 F language delay
N PBMC18 9y 4m 112 F short stature
N PBMC19 8y 5m 101 M learning difficulties, dysmorphism, possible fragile X
N PBMC20 11y 9m 141 M tall stature, coordination problems
N PBMC21 4y 10m 58 M cleft palate, cardiac abnormality
N PBMC22 12y 4m 148 F short stature
N PBMC23 13y 7m 163 M developmental delay, dysmorphic, hypotonic
N PBMC24 2y 4m 28 F overweight, excessive growth
N PBMC25 5y 1m 61 M communication difficulties, possible ASD
N PBMC26 3y 0m 36 M developmental delay
N PBMC27 14y 9m 177 F developmental delay, brachydactyly
N PBMC28 4y 7m 55 M learning difficulties
N PBMC29 9y 2m 110 F possible Turner syndrome
N PBMC30 6y 1m 73 M mental retardation, possible DiGeorge or fragile X
N PBMC31 30y 10m 370 M none - healthy lab donor
N PBMC32 26y 7m 319 F none - healthy lab donor
N PBMC33 22y 11m 275 M none - healthy lab donor
Table 3:2:1B: Control blood samples.
Age (at time of bleed), sex and reason for diagnostic testing of control samples. N PBMC20
and N PBMC29 were omitted from analysis as lymphocyte phenotyping suggested immune
system abnormalities.
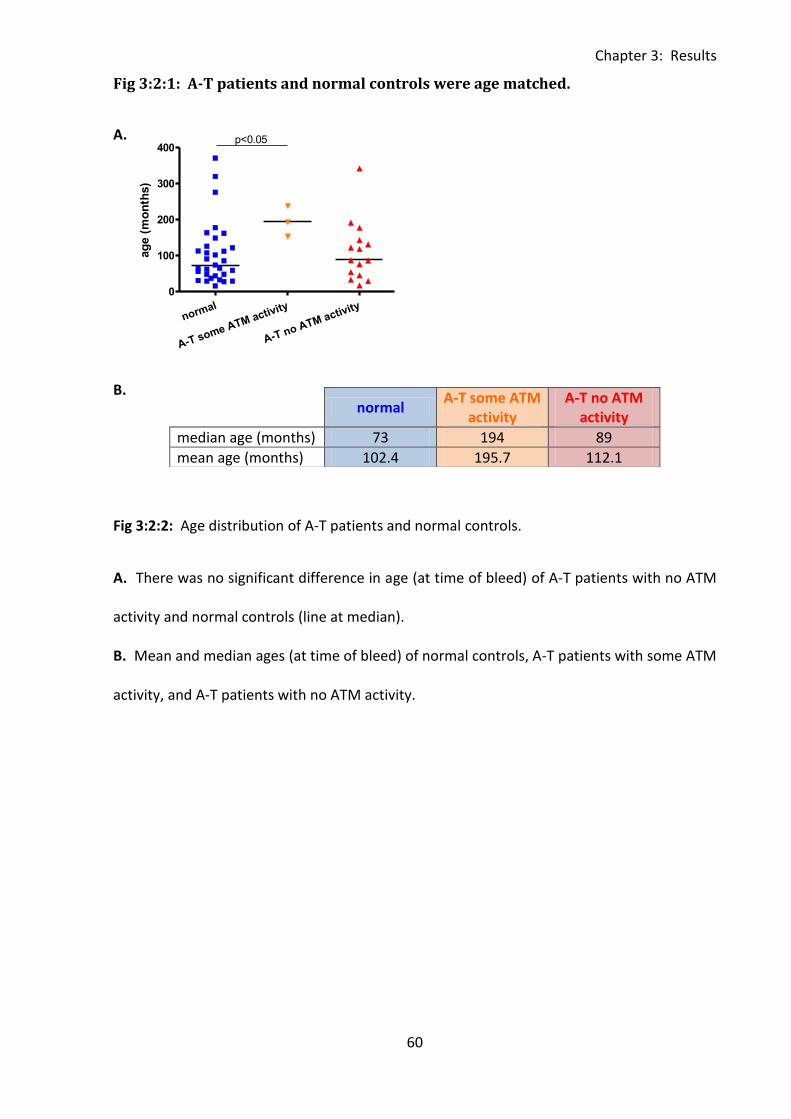
Chapter 3: Results
60
normal
A-T some ATM activity
A-T no ATM activity
0
100
200
300
400p<0.05
ag
e (
mo
nth
s)
Fig 3:2:1: A-T patients and normal controls were age matched.
A.
B.
Fig 3:2:2: Age distribution of A-T patients and normal controls.
A. There was no significant difference in age (at time of bleed) of A-T patients with no ATM
activity and normal controls (line at median).
B. Mean and median ages (at time of bleed) of normal controls, A-T patients with some ATM
activity, and A-T patients with no ATM activity.
normal
A-T some ATM activity
A-T no ATM activity
median age (months) 73 194 89
mean age (months) 102.4 195.7 112.1
Chapter 3: Results
61
3:2:2: PBMC cell counts and correlations with age.
Consistent with the reported lymphopenia of A-T patients, samples from individuals with no
ATM activity had a significantly lower cell count than the normal controls (p<0.001) (Fig
3:2:2A). The A-T patients with some ATM activity also had a lower cell count than normal
controls although this was not statistically significant, perhaps because of the small sample
size. There was no correlation between cell count and age in any of the groups (Fig 3:2:2B).
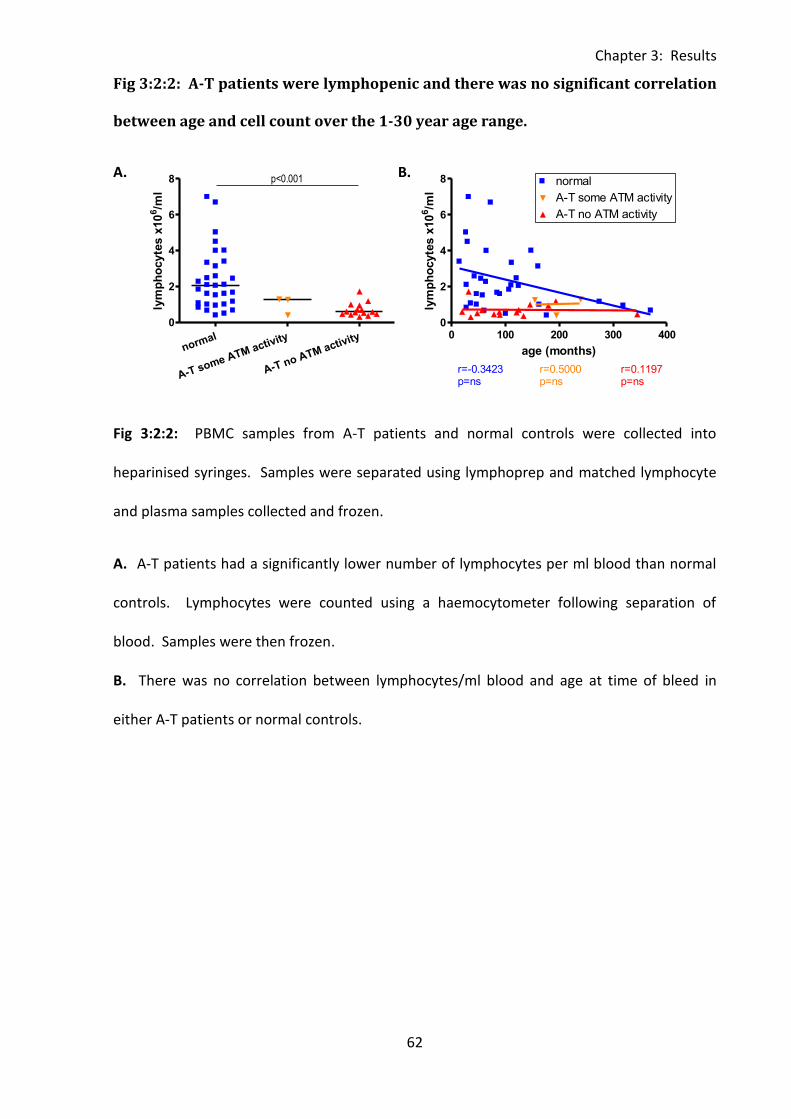
Chapter 3: Results
62
0 100 200 300 4000
2
4
6
8normal
A-T some ATM activity
A-T no ATM activity
r=-0.3423p=ns
r=0.2000p=ns
r=0.1197p=ns
age (months)
lym
ph
ocyte
s x
10
6/m
l
normal
A-T some ATM activity
A-T no ATM activity
0
2
4
6
8 p<0.001
lym
ph
ocyte
s x
10
6/m
l
0 100 200 300 4000
2
4
6
8normal
A-T some ATM activity
A-T no ATM activity
r=-0.3423p=ns
r=0.5000p=ns
r=0.1197p=ns
age (months)
lym
ph
ocyte
s x
10
6/m
l
Fig 3:2:2: A-T patients were lymphopenic and there was no significant correlation
between age and cell count over the 1-30 year age range.
A. B.
Fig 3:2:2: PBMC samples from A-T patients and normal controls were collected into
heparinised syringes. Samples were separated using lymphoprep and matched lymphocyte
and plasma samples collected and frozen.
A. A-T patients had a significantly lower number of lymphocytes per ml blood than normal
controls. Lymphocytes were counted using a haemocytometer following separation of
blood. Samples were then frozen.
B. There was no correlation between lymphocytes/ml blood and age at time of bleed in
either A-T patients or normal controls.
Chapter 3: Results
63
3:3: Analysis of lymphocyte subsets by flow cytometry.
3:3:1: Lymphocyte subsets can be defined using an eleven colour antibody panel.
An eleven colour antibody panel was developed to allow analysis of lymphocyte subsets and
CD95, FasL and CD127 levels in the PBMC samples. The chosen markers and fluorochromes
are shown in Table 3:3:1.
The first step in the gating strategy was exclusion of doublets using a forward scatter height
against forward scatter area plot. The lymphocyte population was then selected using
forward scatter against side scatter followed by exclusion of dead (PI+ve) cells (Fig 3:3:1A).
Gating on T cells (CD3+CD19-CD56-), B cells (CD19+CD3-CD56-), NK cells (CD56+CD19-CD3-),
NKT cells (CD56+CD19-CD3+) and various subsets were carried out as shown in Fig 3:3:1B-D.
The cell surface markers CD27 and CD45RA were used to divide CD4+ and CD8+ T cells into
naive (CD45RA+CD27+), central memory (CD45RA-CD27+), effector memory (CD45RA-CD27-)
and TEMRA (CD45RA+CD27-) subsets (Fig 3:3:1B). CD27 is a member of the TNF family of
receptors; it is expressed at high levels by central memory T cells but lost upon
differentiation into effector memory T cells (Hintzen et al., 1993). Conventionally the
chemokine receptor CCR7 and/or adhesion molecule CD62L are used along with CD45RA for
definition of T cell subsets. Central memory T cells are CD45RA-ve and express CCR7 and
high levels of CD62 which allows homing to lymph nodes, whereas effector memory T cells
are CD45RA-CCR7-CD62low and are found in peripheral non-lymphoid tissues. TEMRA cells
are CD45RA+CCR7-CD62low and naive cells are CD45RA+CCR7+.
However, as the panel was limited to a maximum of eleven colours CD27 was used as an
alternative to CCR7 and CD62 as it can also distinguish between naive and memory B cell
subsets (Fig 3:3:1C). This compromise means that my study’s definition of central and
Chapter 3: Results
64
effector memory T cell subsets may not be as reliable as that of studies using CCR7 and CD62
but it was necessary in order to maximise the amount of data that could be generated from
the panel.
NK cells were divided into two subsets. Although NK cells do not have distinct ‘naive’ and
‘memory’ subsets similar to T and B cells they can be subdivided according to the level of
expression of the NK cell marker CD56 (Fig 3:3:1D). The majority of circulating NK cells
belong to the CD56dim subset. These cells are cytotoxic and have been shown to arise from
differentiation of the less mature CD56bright NK cells which produce cytokines and have an
immunoregulatory function (Chan et al., 2007).
NKT cells (natural killer T cells) are a rare subset of T cells which express both CD3 and CD56
(Fig 3:3:1D). They have an unusual TCR which confers specificity to glycolipid antigens and
they produce a broad range of cytokines in response to antigenic stimulation. NKT cells have
roles in modulating the immune system in response to cancer, autoimmunity, infection,
allergies, allograft rejection and graft versus host disease (Godfrey et al., 2010). They have
not previously been investigated in Ataxia-telangiectasia patients.
Cell surface expression levels of CD95, FasL and CD127 on each cell subset were also
analysed. ‘All minus one plus isotype’ (all antibodies in the panel apart from the antibody of
interest which is replaced with appropriate isotype control) or ‘all minus one’ controls (when
appropriate isotype was not available) were used to determine negative and positive
populations (Fig 3:3:1E).
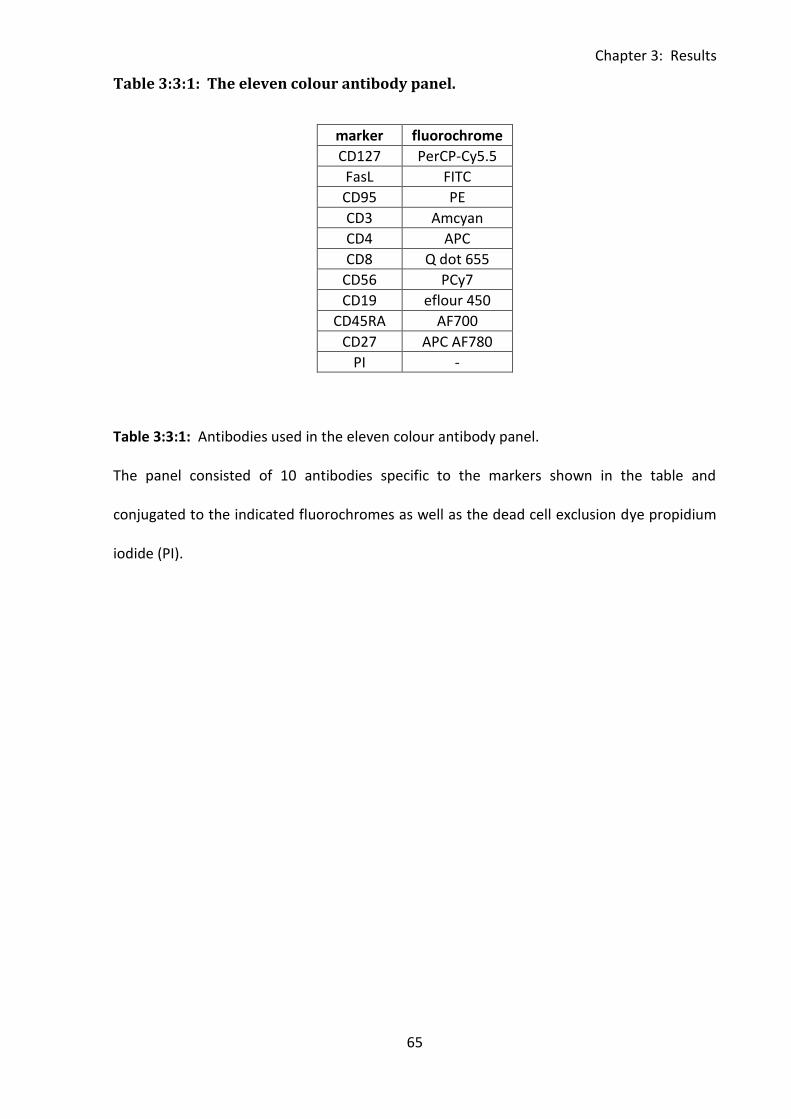
Chapter 3: Results
65
Table 3:3:1: The eleven colour antibody panel.
marker fluorochrome
CD127 PerCP-Cy5.5
FasL FITC
CD95 PE
CD3 Amcyan
CD4 APC
CD8 Q dot 655
CD56 PCy7
CD19 eflour 450
CD45RA AF700
CD27 APC AF780
PI -
Table 3:3:1: Antibodies used in the eleven colour antibody panel.
The panel consisted of 10 antibodies specific to the markers shown in the table and
conjugated to the indicated fluorochromes as well as the dead cell exclusion dye propidium
iodide (PI).
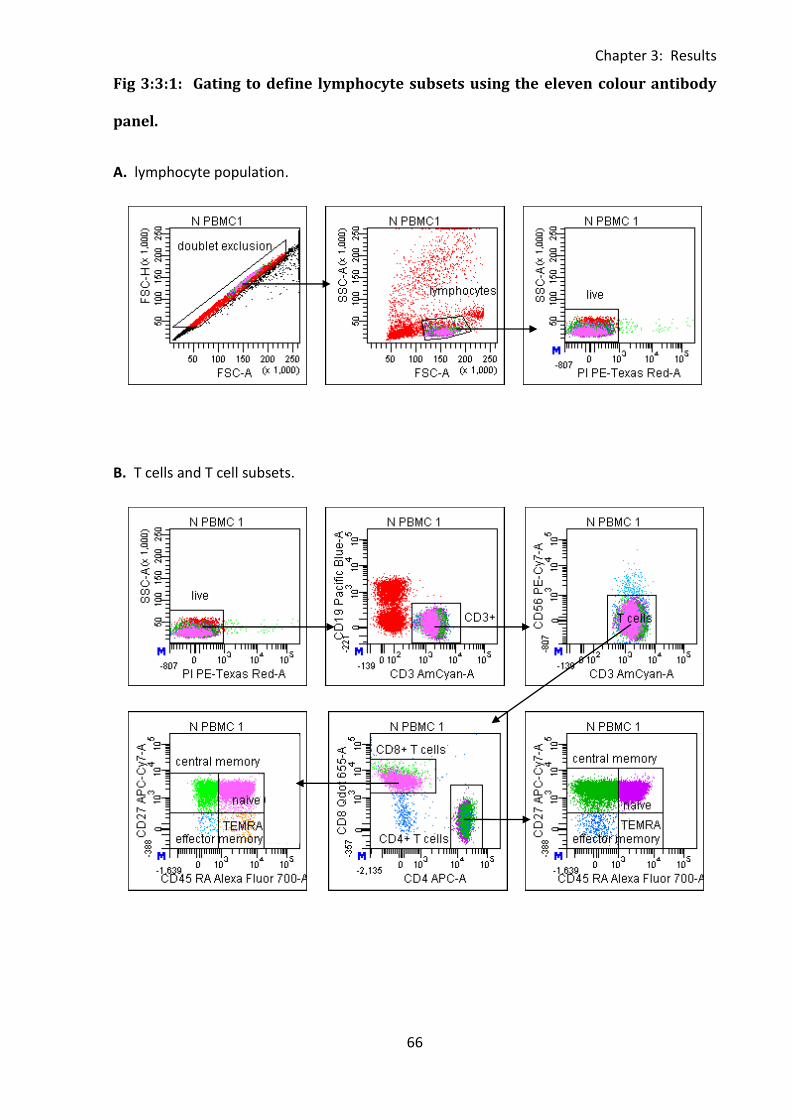
Chapter 3: Results
66
Fig 3:3:1: Gating to define lymphocyte subsets using the eleven colour antibody
panel.
A. lymphocyte population.
B. T cells and T cell subsets.
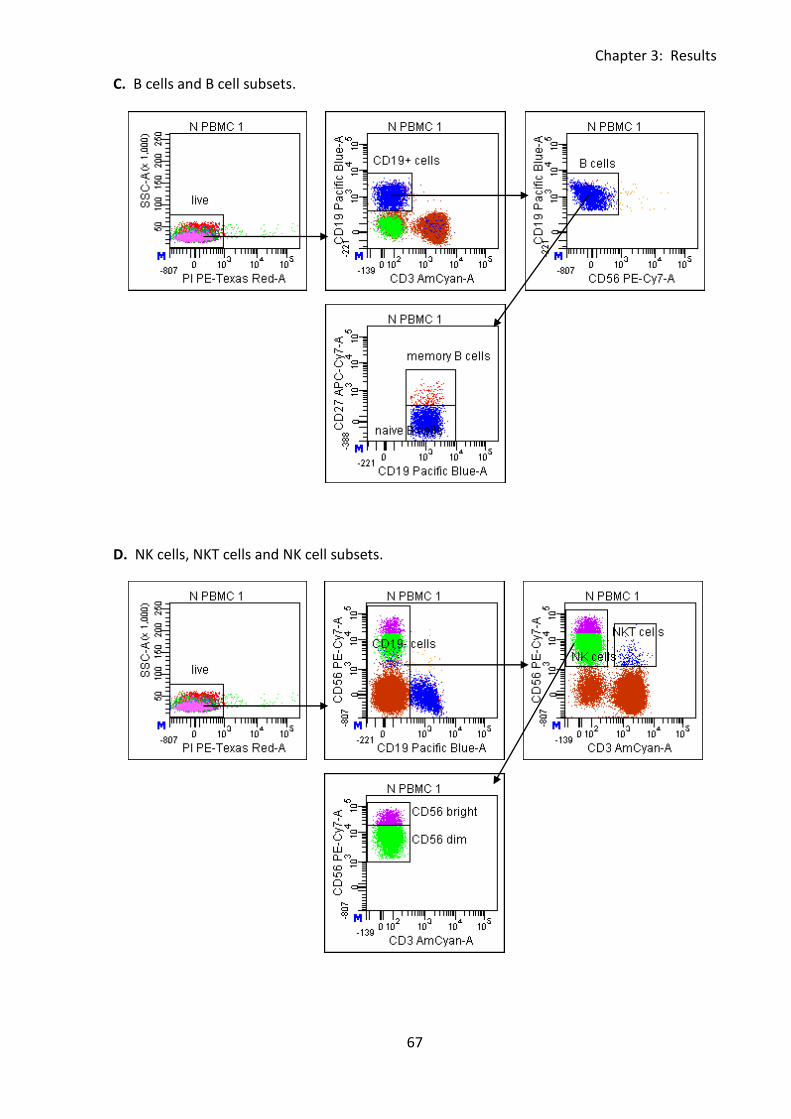
Chapter 3: Results
67
C. B cells and B cell subsets.
D. NK cells, NKT cells and NK cell subsets.
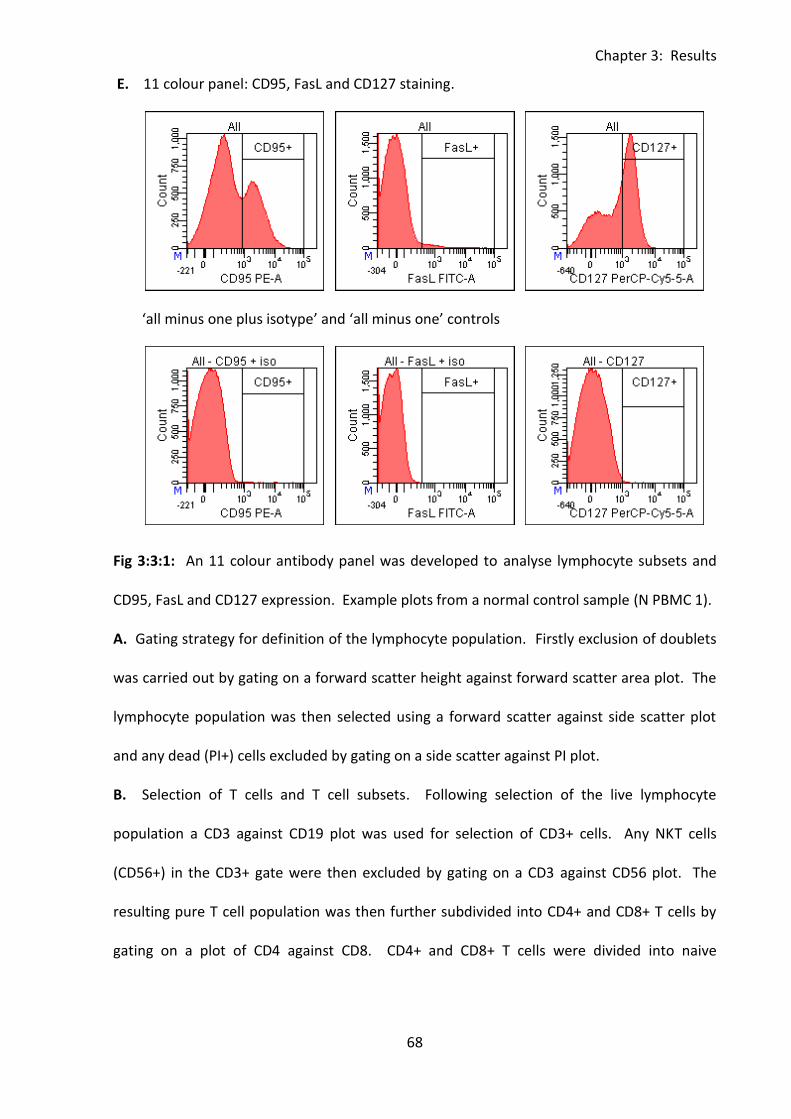
Chapter 3: Results
68
E. 11 colour panel: CD95, FasL and CD127 staining.
‘all minus one plus isotype’ and ‘all minus one’ controls
Fig 3:3:1: An 11 colour antibody panel was developed to analyse lymphocyte subsets and
CD95, FasL and CD127 expression. Example plots from a normal control sample (N PBMC 1).
A. Gating strategy for definition of the lymphocyte population. Firstly exclusion of doublets
was carried out by gating on a forward scatter height against forward scatter area plot. The
lymphocyte population was then selected using a forward scatter against side scatter plot
and any dead (PI+) cells excluded by gating on a side scatter against PI plot.
B. Selection of T cells and T cell subsets. Following selection of the live lymphocyte
population a CD3 against CD19 plot was used for selection of CD3+ cells. Any NKT cells
(CD56+) in the CD3+ gate were then excluded by gating on a CD3 against CD56 plot. The
resulting pure T cell population was then further subdivided into CD4+ and CD8+ T cells by
gating on a plot of CD4 against CD8. CD4+ and CD8+ T cells were divided into naive
Chapter 3: Results
69
(CD45RA+CD27+), central memory (CD45RA-CD27+), effector memory (CD45RA-CD27-) and
TEMRA (CD45RA+CD27-) subsets by plotting CD45RA against CD27.
C. Selection of B cells and B cell subsets. CD19+ cells were selected from the live
lymphocyte population by plotting CD19 against CD3. A plot of CD19 against CD56 was then
used to further purify the B cell population. Finally a CD19 against CD27 plot was used to
define naive (CD27-) and memory (CD27+) B cell subsets.
D. Selection of NKT cells, NK cells and subsets. CD19-ve cells were selected from the live
lymphocyte population by plotting CD19 against CD56. NK (CD3-CD56+) and NKT cells
(CD3+CD56-) were then defined using a CD3 against CD56 plot. Finally the NK cells were
further subdivided into CD56bright and CD56dim populations using another CD3 against
CD56 plot.
E. Example staining of CD95, FasL and CD127 on the live lymphocyte population. The top
row of histograms show the results of staining with the complete eleven colour antibody
panel and the bottom row shows the corresponding ‘all minus one plus isotype’ (CD95 and
FasL) or ‘all minus one’ controls (CD127).
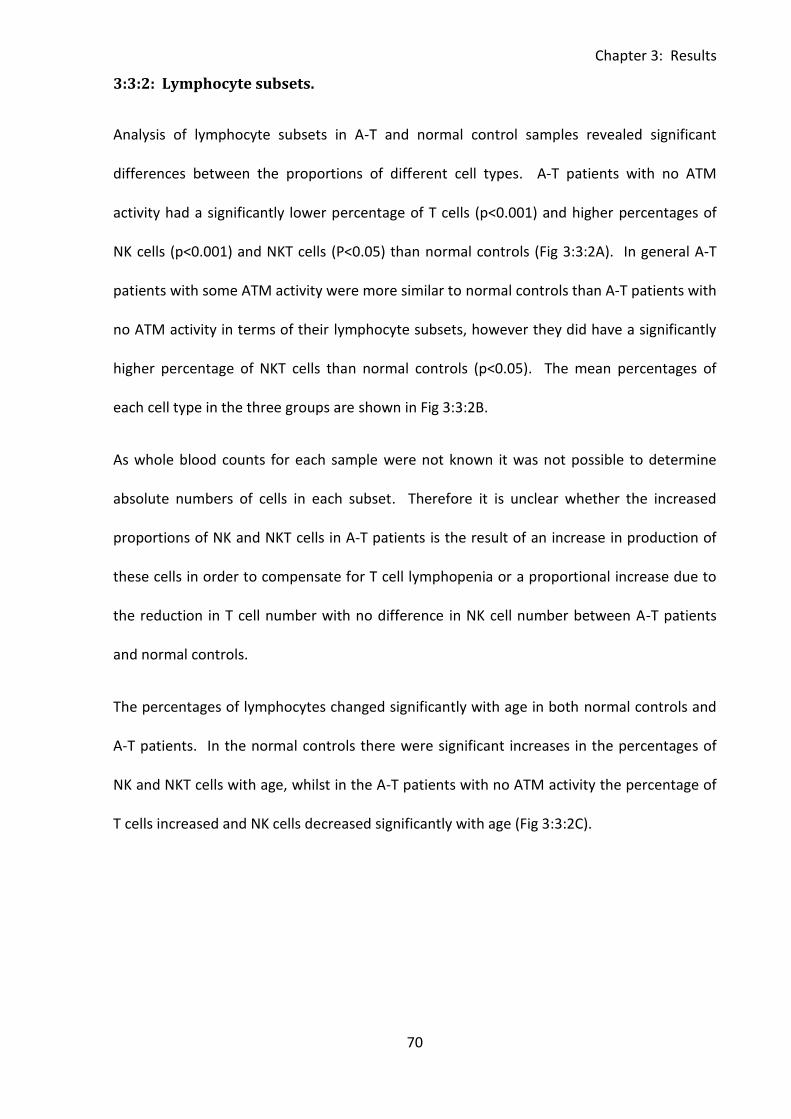
Chapter 3: Results
70
3:3:2: Lymphocyte subsets.
Analysis of lymphocyte subsets in A-T and normal control samples revealed significant
differences between the proportions of different cell types. A-T patients with no ATM
activity had a significantly lower percentage of T cells (p<0.001) and higher percentages of
NK cells (p<0.001) and NKT cells (P<0.05) than normal controls (Fig 3:3:2A). In general A-T
patients with some ATM activity were more similar to normal controls than A-T patients with
no ATM activity in terms of their lymphocyte subsets, however they did have a significantly
higher percentage of NKT cells than normal controls (p<0.05). The mean percentages of
each cell type in the three groups are shown in Fig 3:3:2B.
As whole blood counts for each sample were not known it was not possible to determine
absolute numbers of cells in each subset. Therefore it is unclear whether the increased
proportions of NK and NKT cells in A-T patients is the result of an increase in production of
these cells in order to compensate for T cell lymphopenia or a proportional increase due to
the reduction in T cell number with no difference in NK cell number between A-T patients
and normal controls.
The percentages of lymphocytes changed significantly with age in both normal controls and
A-T patients. In the normal controls there were significant increases in the percentages of
NK and NKT cells with age, whilst in the A-T patients with no ATM activity the percentage of
T cells increased and NK cells decreased significantly with age (Fig 3:3:2C).
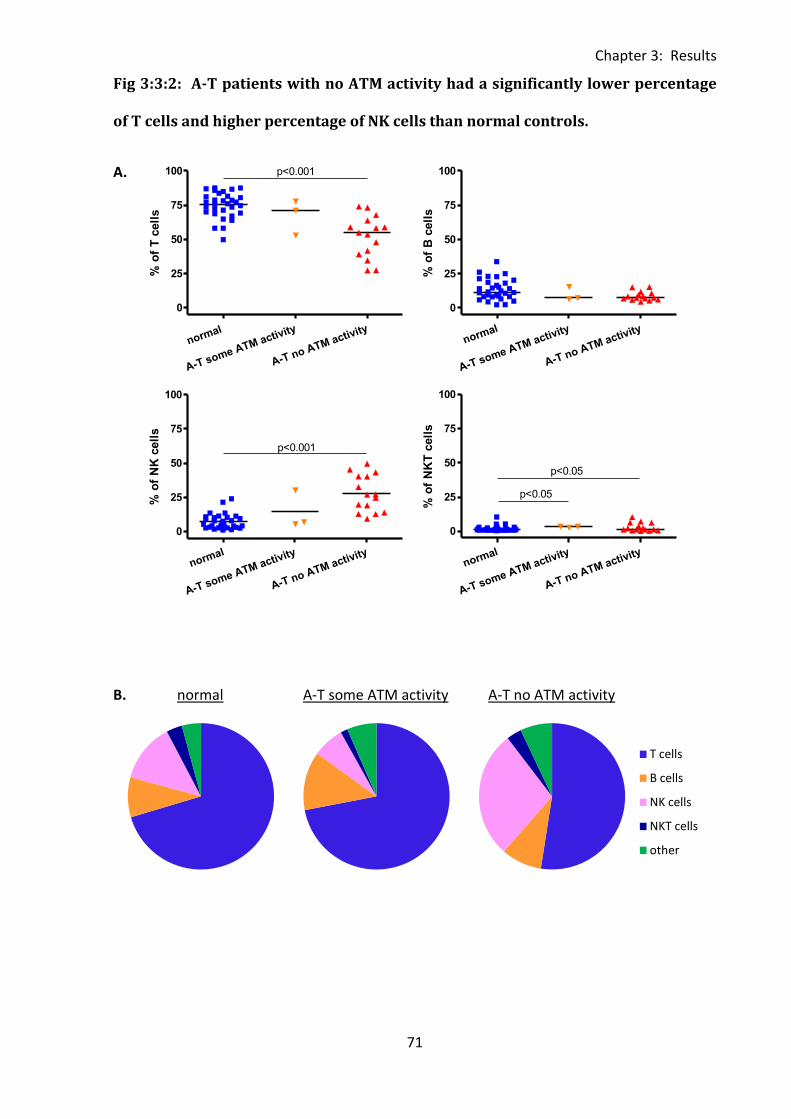
Chapter 3: Results
71
T cells
B cells
NK cells
NKT cells
other
normal
A-T some ATM activity
A-T no ATM activity
0
25
50
75
100 p<0.001
% o
f T
cell
s
normal
A-T some ATM activity
A-T no ATM activity
0
25
50
75
100
% o
f B
cell
s
normal
A-T some ATM activity
A-T no ATM activity
0
25
50
75
100
p<0.001
% o
f N
K c
ell
s
normal
A-T some ATM activity
A-T no ATM activity
0
25
50
75
100
p<0.05
p<0.05
% o
f N
KT
cell
s
Fig 3:3:2: A-T patients with no ATM activity had a significantly lower percentage
of T cells and higher percentage of NK cells than normal controls.
A.
B. normal A-T some ATM activity A-T no ATM activity
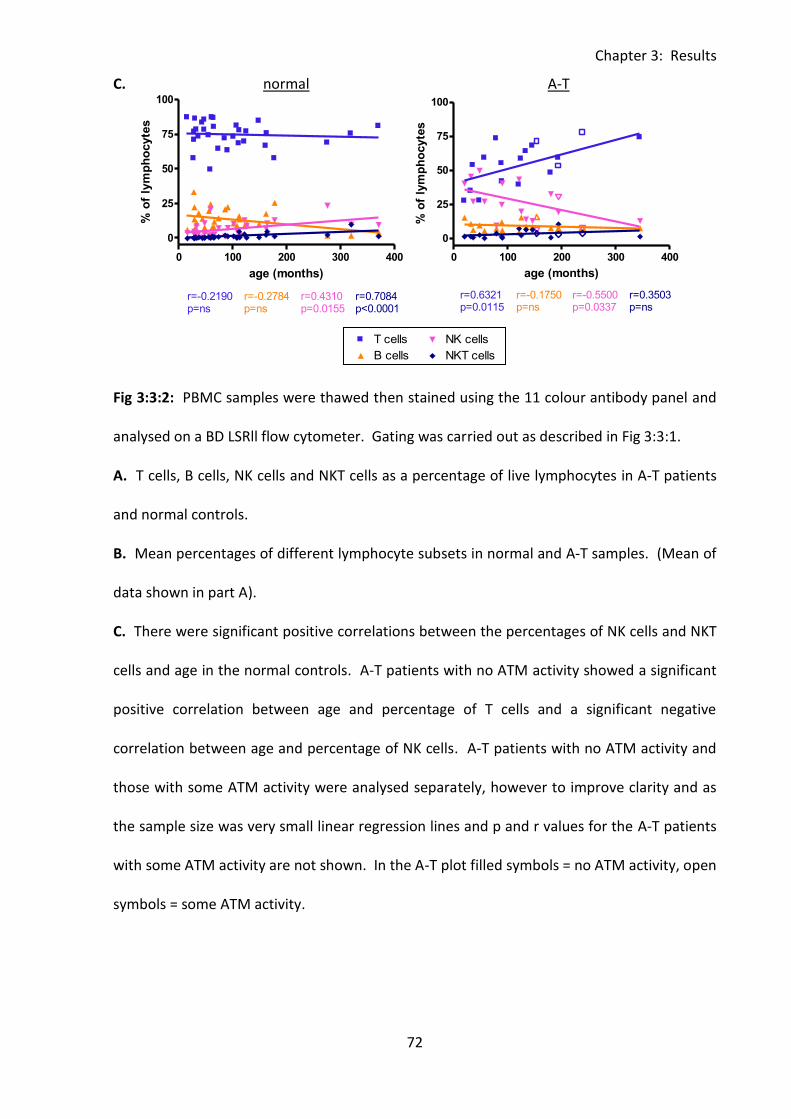
Chapter 3: Results
72
0 100 200 300 4000
25
50
75
100T cells
B cells
NK cells
NKT cells
r=0.5955p=0.0003
r=0.3191p=ns
r=-0.0972p=ns
r=0.4498p=0.0086
age (months)
% o
f C
D95+
cell
s
0 100 200 300 400
0
25
50
75
100T cells
B cells
NK cells
NKT cells
r=-0.2190p=ns
r=-0.2784p=ns
r=0.4310p=0.0155
r=0.7084p<0.0001
age (months)
% o
f ly
mp
ho
cyte
s
0 100 200 300 400
0
25
50
75
100T cells
B cells
NK cells
NKT cells
r=0.6321p=0.0115
r=-0.1750p=ns
r=-0.5500p=0.0337
r=0.3503p=ns
age (months)
% o
f ly
mp
ho
cyte
s
C. normal A-T
Fig 3:3:2: PBMC samples were thawed then stained using the 11 colour antibody panel and
analysed on a BD LSRll flow cytometer. Gating was carried out as described in Fig 3:3:1.
A. T cells, B cells, NK cells and NKT cells as a percentage of live lymphocytes in A-T patients
and normal controls.
B. Mean percentages of different lymphocyte subsets in normal and A-T samples. (Mean of
data shown in part A).
C. There were significant positive correlations between the percentages of NK cells and NKT
cells and age in the normal controls. A-T patients with no ATM activity showed a significant
positive correlation between age and percentage of T cells and a significant negative
correlation between age and percentage of NK cells. A-T patients with no ATM activity and
those with some ATM activity were analysed separately, however to improve clarity and as
the sample size was very small linear regression lines and p and r values for the A-T patients
with some ATM activity are not shown. In the A-T plot filled symbols = no ATM activity, open
symbols = some ATM activity.
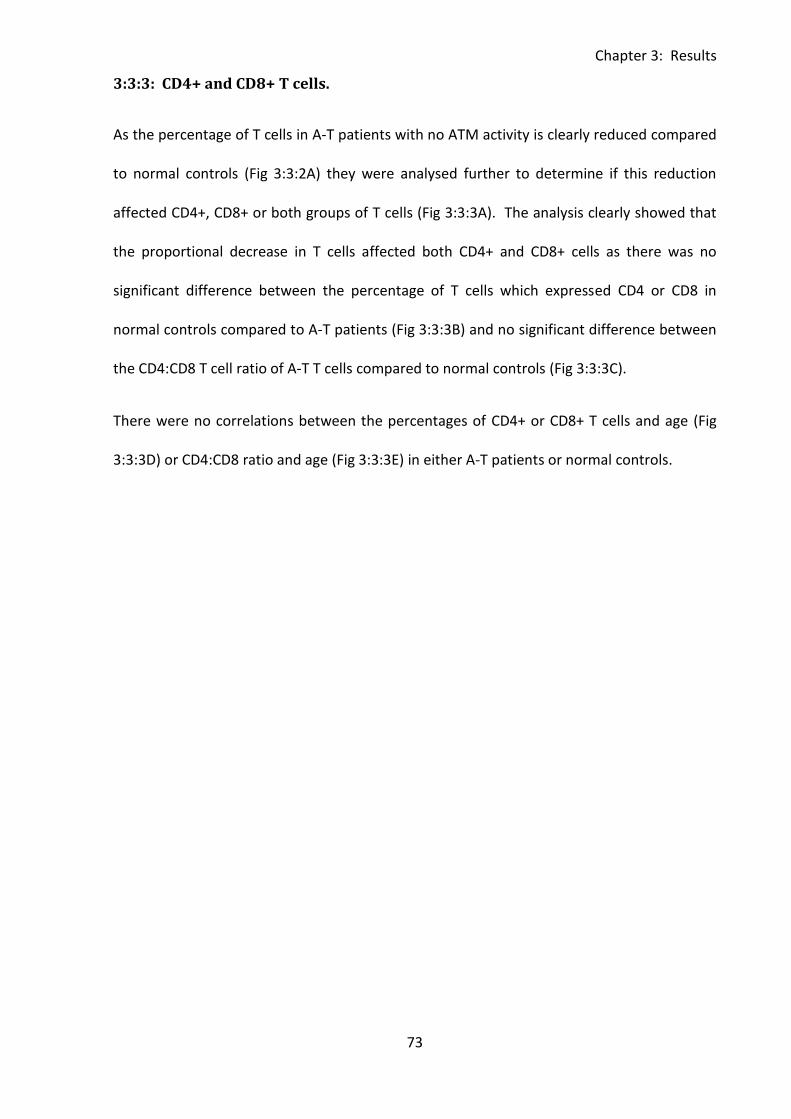
Chapter 3: Results
73
3:3:3: CD4+ and CD8+ T cells.
As the percentage of T cells in A-T patients with no ATM activity is clearly reduced compared
to normal controls (Fig 3:3:2A) they were analysed further to determine if this reduction
affected CD4+, CD8+ or both groups of T cells (Fig 3:3:3A). The analysis clearly showed that
the proportional decrease in T cells affected both CD4+ and CD8+ cells as there was no
significant difference between the percentage of T cells which expressed CD4 or CD8 in
normal controls compared to A-T patients (Fig 3:3:3B) and no significant difference between
the CD4:CD8 T cell ratio of A-T T cells compared to normal controls (Fig 3:3:3C).
There were no correlations between the percentages of CD4+ or CD8+ T cells and age (Fig
3:3:3D) or CD4:CD8 ratio and age (Fig 3:3:3E) in either A-T patients or normal controls.
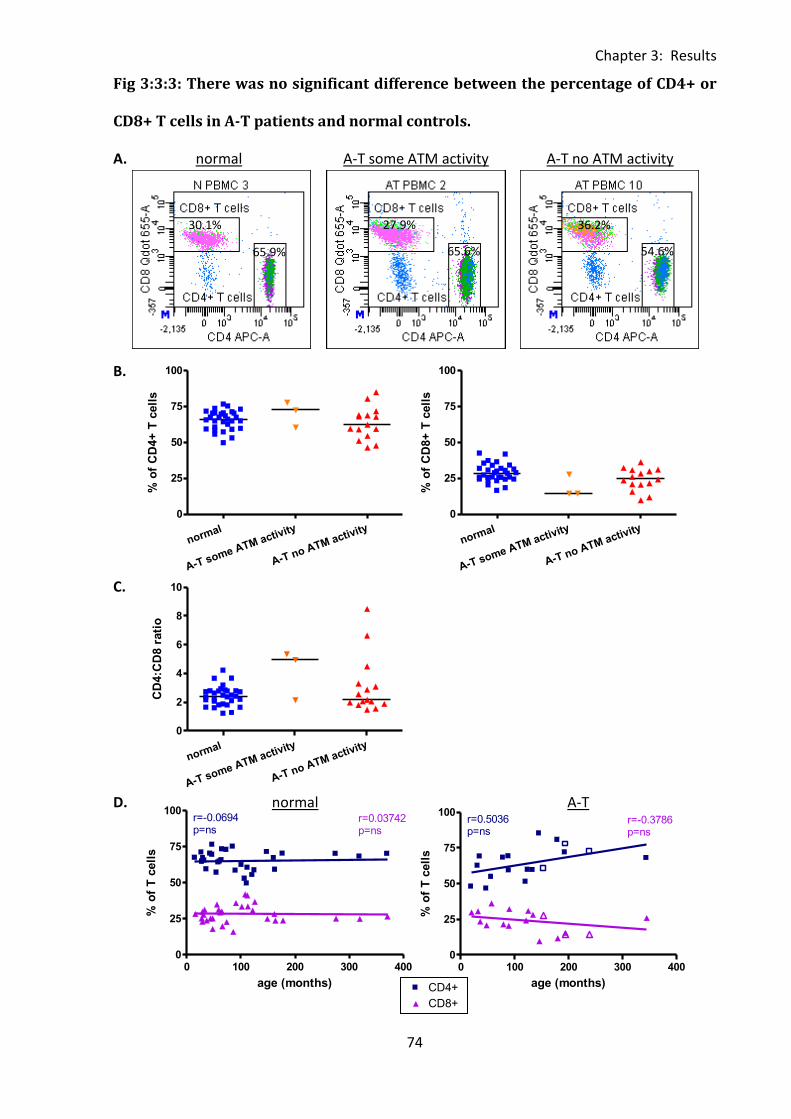
Chapter 3: Results
74
0 100 200 300 400300
500
700
900CD4+
CD8+
r=-0.0871p=ns
r=-0.0425p=ns
normal
FasL
MF
I o
f F
asL
+ T
cell
s
0 100 200 300 4000
25
50
75
100CD4+
CD8+
r=-0.0694p=ns
r=0.03742p=ns
age (months)
% o
f T
cell
s
normal
A-T some ATM activity
A-T no ATM activity
0
25
50
75
100
% o
f C
D4+
T c
ell
s
normal
A-T some ATM activity
A-T no ATM activity
0
25
50
75
100
% o
f C
D8+
T c
ell
s
normal
A-T some ATM activity
A-T no ATM activity
0
2
4
6
8
10
CD
4:C
D8 r
ati
o
0 100 200 300 4000
25
50
75
100CD4+
Legend
CD8+
Legend
r=0.5036p=ns
r=-0.3786p=ns
age (months)
% o
f T
cell
s
Fig 3:3:3: There was no significant difference between the percentage of CD4+ or
CD8+ T cells in A-T patients and normal controls.
A. normal A-T some ATM activity A-T no ATM activity
B.
C.
D. normal A-T
65.9%
30.1%
65.6%
27.9%
54.6%
36.2%
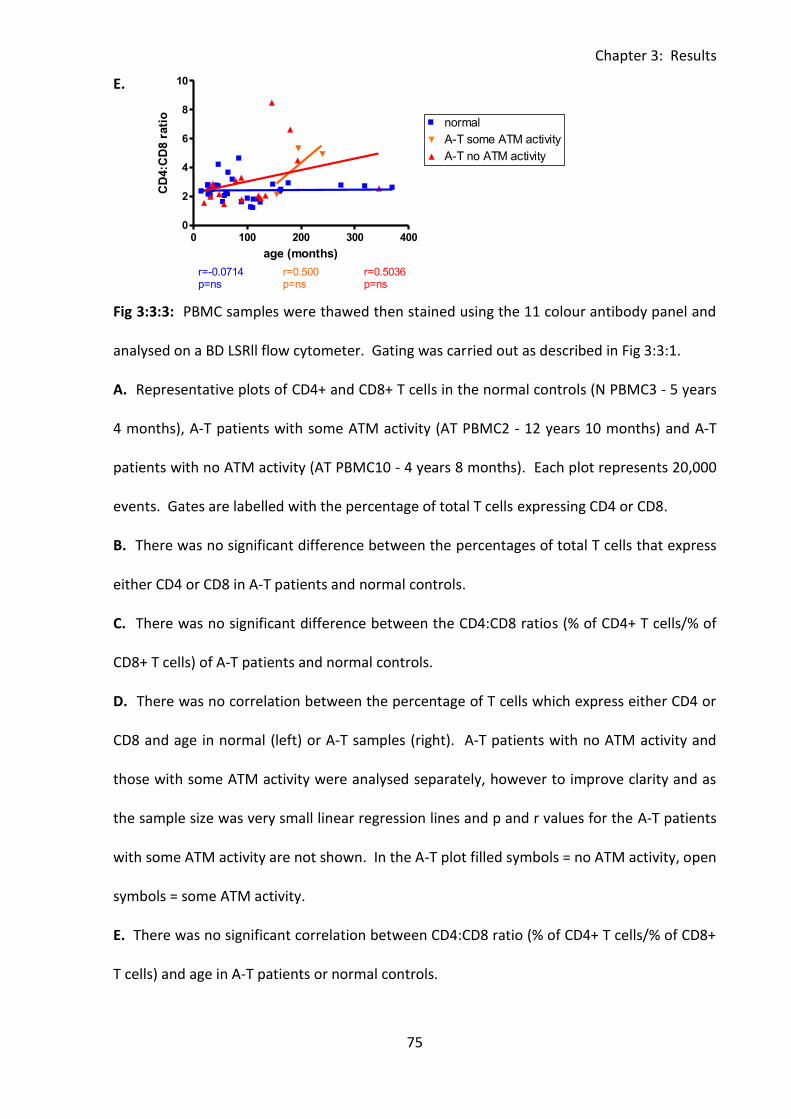
Chapter 3: Results
75
0 100 200 300 4000
2
4
6
8normal
A-T some ATM activity
A-T no ATM activity
r=-0.3423p=ns
r=0.2000p=ns
r=0.1197p=ns
age (months)
lym
ph
ocyte
s x
10
6/m
l
0 100 200 300 4000
2
4
6
8
10normal
A-T some ATM activity
A-T no ATM activity
r=-0.0714p=ns
r=0.5036p=ns
r=0.500p=ns
age (months)
CD
4:C
D8 r
ati
o
E.
Fig 3:3:3: PBMC samples were thawed then stained using the 11 colour antibody panel and
analysed on a BD LSRll flow cytometer. Gating was carried out as described in Fig 3:3:1.
A. Representative plots of CD4+ and CD8+ T cells in the normal controls (N PBMC3 - 5 years
4 months), A-T patients with some ATM activity (AT PBMC2 - 12 years 10 months) and A-T
patients with no ATM activity (AT PBMC10 - 4 years 8 months). Each plot represents 20,000
events. Gates are labelled with the percentage of total T cells expressing CD4 or CD8.
B. There was no significant difference between the percentages of total T cells that express
either CD4 or CD8 in A-T patients and normal controls.
C. There was no significant difference between the CD4:CD8 ratios (% of CD4+ T cells/% of
CD8+ T cells) of A-T patients and normal controls.
D. There was no correlation between the percentage of T cells which express either CD4 or
CD8 and age in normal (left) or A-T samples (right). A-T patients with no ATM activity and
those with some ATM activity were analysed separately, however to improve clarity and as
the sample size was very small linear regression lines and p and r values for the A-T patients
with some ATM activity are not shown. In the A-T plot filled symbols = no ATM activity, open
symbols = some ATM activity.
E. There was no significant correlation between CD4:CD8 ratio (% of CD4+ T cells/% of CD8+
T cells) and age in A-T patients or normal controls.
Chapter 3: Results
76
3:3:4: Naive and memory T cells.
CD4+ve and CD8+ve T cells were further subdivided into naive, central memory, effector
memory, and TEMRA subsets (Fig 3:3:4A). There were very obvious differences between the
proportions of T cells in each subset in A-T patients and normal controls. A-T patients with
no ATM activity had a significantly lower percentage of naive T cells (CD4+ - p<0.001, CD8+ -
p<0.001) and significantly higher percentages of central memory (CD4+ - p<0.001, CD8+ -
p<0.001) and effector memory (CD4+ - p<0.001, CD8+ - p<0.001) T cells than the normal
controls. This effect was seen in both CD4+ (Fig 3:3:4A, B&D) and CD8+ (Fig 3:3:4A, C&D) T
cells.
The immune system phenotype of the relatively young A-T patients with no ATM activity was
similar to that of elderly individuals who also have a reduced proportion of naive T cells and
increased memory T cells (Pawelec et al., 2010;Sansoni et al., 2008). Therefore the A-T
patients could be described as immunologically aged. Interestingly the patients who had
some ATM activity showed an intermediate phenotype between that of the normal controls
and A-T patients with no ATM activity. This was especially apparent when the mean
proportions of T cells in each subset were analysed (Fig 3:3:4D).
Further evidence for an ‘immunologically aged’ phenotype of A-T patients came from
analysis of correlations between the percentage of T cells in naive and memory subsets and
age of patients (Fig 3:3:4E). In the normal controls the percentages of CD4+ and CD8+ naive
T cells decreased significantly with age whilst the percentages of central memory, effector
memory and TEMRA cells significantly increased. This is unsurprising as thymic involution
begins during early childhood (Steinmann, 1986) leading to a reduction in the production of
naive T cells as an individual ages. However, the A-T patients showed no correlations
between percentage of T cells in each subset and age. This is similar to an elderly group of

Chapter 3: Results
77
normal patients with a low stable output of naive cells from the thymus and a high
proportion of memory cells resulting from oligoclonal expansions of T cells in response to
previously encountered antigens (Akbar and Fletcher, 2005).
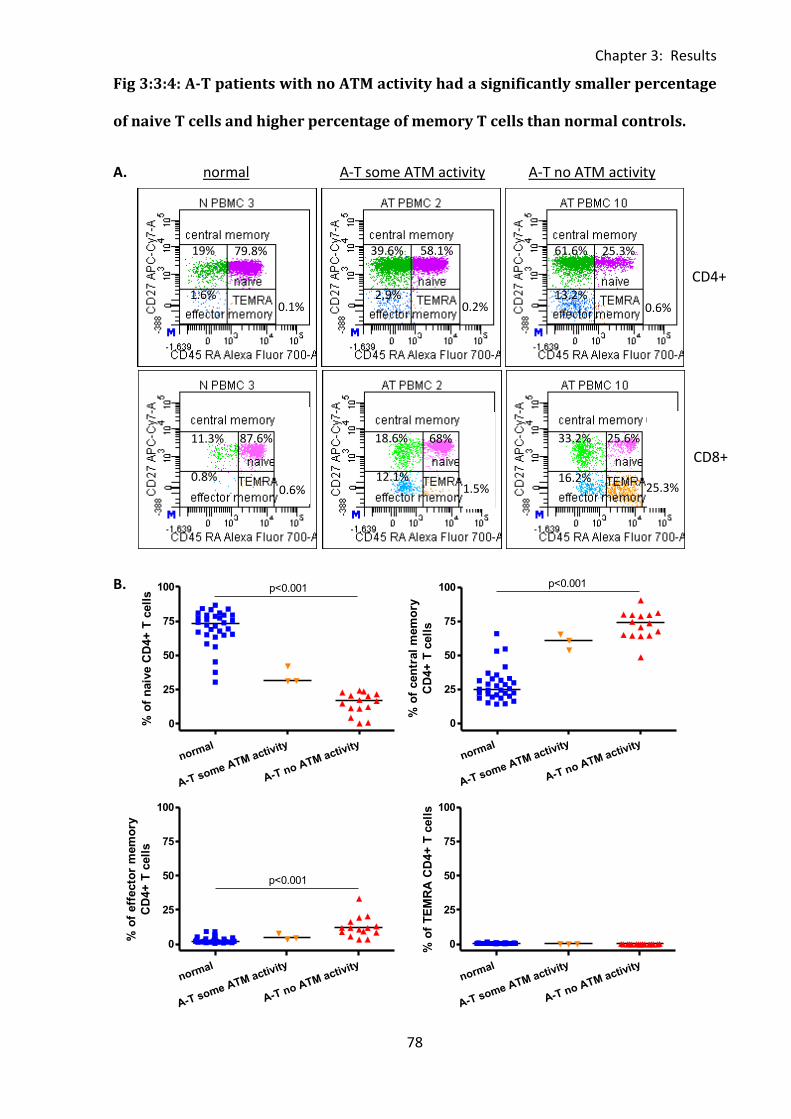
Chapter 3: Results
78
normal
A-T some ATM activity
A-T no ATM activity
0
25
50
75
100 p<0.001
% o
f n
aiv
e C
D4+
T c
ell
s
normal
A-T some ATM activity
A-T no ATM activity
0
25
50
75
100 p<0.001
% o
f cen
tral
mem
ory
CD
4+
T c
ell
s
normal
A-T some ATM activity
A-T no ATM activity
0
25
50
75
100
p<0.001
% o
f eff
ecto
r m
em
ory
CD
4+
T c
ell
s
normal
A-T some ATM activity
A-T no ATM activity
0
25
50
75
100
% o
f T
EM
RA
CD
4+
T c
ell
s
Fig 3:3:4: A-T patients with no ATM activity had a significantly smaller percentage
of naive T cells and higher percentage of memory T cells than normal controls.
A. normal A-T some ATM activity A-T no ATM activity
B.
CD4+
CD8+
25.3%
25.6%
61.6%
13.2% 0.6%
33.2%
16.2% 25.3%
58.1% 39.6%
2.9% 0.2%
68% 18.6%
12.1% 1.5%
79.8% 19%
1.6% 0.1%
87.6% 11.3%
0.8% 0.6%
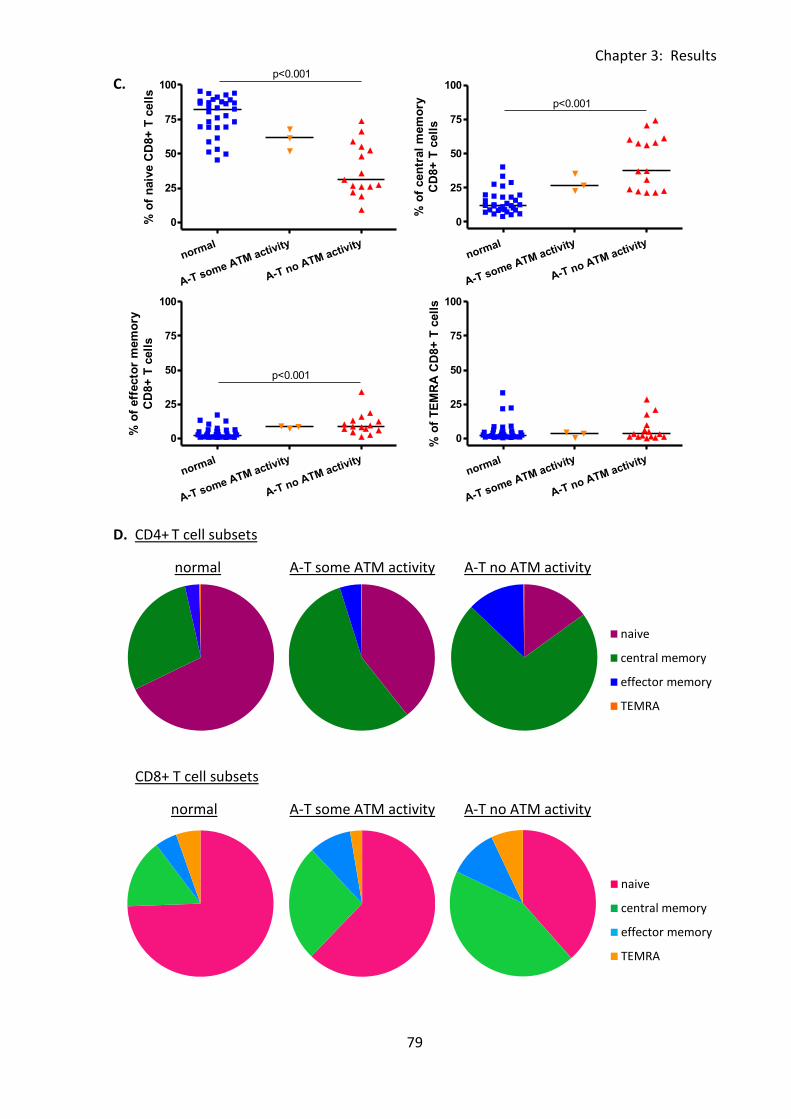
Chapter 3: Results
79
naive
central memory
effector memory
TEMRA
naive
central memory
effector memory
TEMRA
normal
A-T some ATM activity
A-T no ATM activity
0
25
50
75
100p<0.001
% o
f n
aiv
e C
D8+
T c
ell
s
normal
A-T some ATM activity
A-T no ATM activity
0
25
50
75
100
p<0.001
% o
f cen
tral
mem
ory
CD
8+
T c
ell
s
normal
A-T some ATM activity
A-T no ATM activity
0
25
50
75
100
p<0.001
% o
f eff
ecto
r m
em
ory
CD
8+
T c
ell
s
normal
A-T some ATM activity
A-T no ATM activity
0
25
50
75
100
% o
f T
EM
RA
CD
8+
T c
ell
s
C.
D. CD4+ T cell subsets
normal A-T some ATM activity A-T no ATM activity
CD8+ T cell subsets
normal A-T some ATM activity A-T no ATM activity
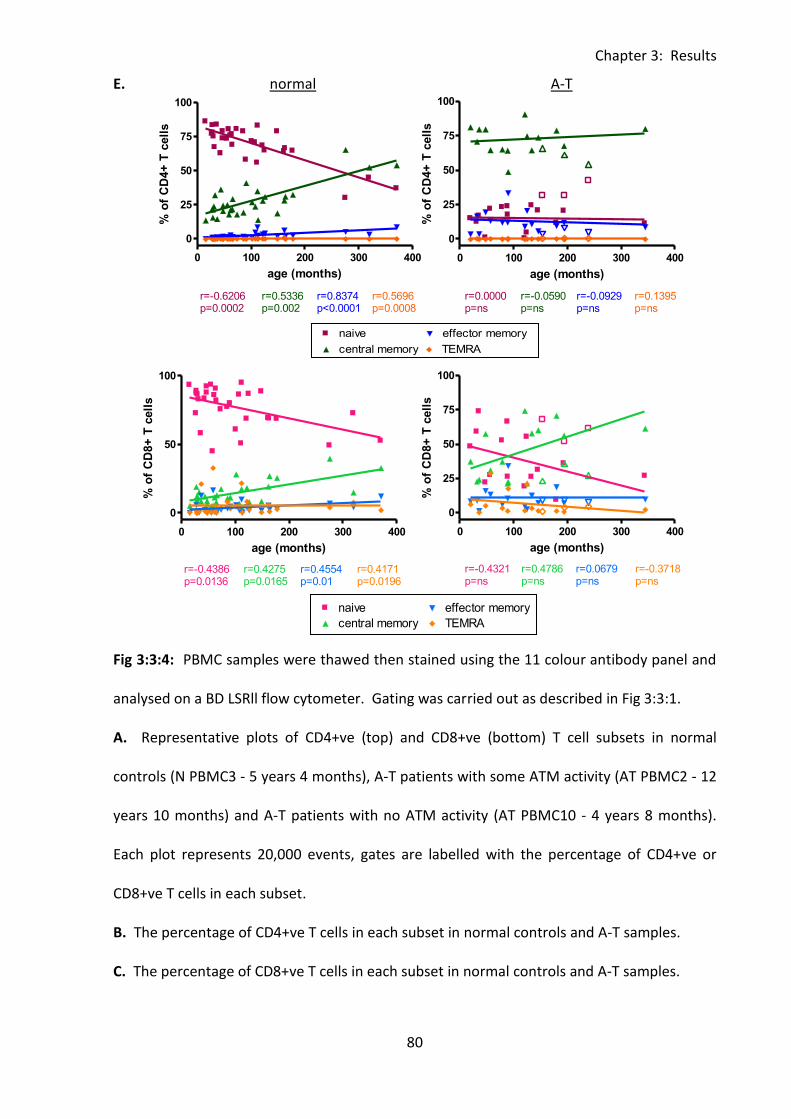
Chapter 3: Results
80
0 100 200 300 4000
2000
4000
6000naive
central memory
effector memory
TEMRA
r=0.3321p=ns
r=0.8000p=ns
r=0.3607p=ns
r=0.6000p=ns
age (months)
CD
95 M
FI
of
CD
8+
CD
95+
T c
ell
s
0 100 200 300 4000
2500
5000
7500
10000naive
central memory
effector memory
TEMRA
r=0.1250p=ns
r=0.0429p=ns
r=0.0179p=ns
r=0.2714p=ns
age (months)
CD
95 M
FI
of
CD
4+
CD
95+
T c
ell
s
0 100 200 300 400
0
50
100naive
central memory
effector memory
TEMRA
r=-0.4386p=0.0136
r=0.4275p=0.0165
r=0.4554p=0.01
r=0.4171p=0.0196
age (months)
% o
f C
D8+
T c
ell
s
0 100 200 300 400
0
25
50
75
100naive
central memory
effector memory
TEMRA
r=-0.6206p=0.0002
r=0.5336p=0.002
r=0.8374p<0.0001
r=0.5696p=0.0008
age (months)
% o
f C
D4+
T c
ell
s
0 100 200 300 400
0
25
50
75
100naive
central memory
effector memory
TEMRA
r=0.0000p=ns
r=-0.0590p=ns
r=-0.0929p=ns
r=0.1395p=ns
age (months)
% o
f C
D4+
T c
ell
s
0 100 200 300 400
0
25
50
75
100naive
central memory
effector memory
TEMRA
r=-0.4321p=ns
r=0.4786p=ns
r=0.0679p=ns
r=-0.3718p=ns
age (months)
% o
f C
D8+
T c
ell
s
E. normal A-T
Fig 3:3:4: PBMC samples were thawed then stained using the 11 colour antibody panel and
analysed on a BD LSRll flow cytometer. Gating was carried out as described in Fig 3:3:1.
A. Representative plots of CD4+ve (top) and CD8+ve (bottom) T cell subsets in normal
controls (N PBMC3 - 5 years 4 months), A-T patients with some ATM activity (AT PBMC2 - 12
years 10 months) and A-T patients with no ATM activity (AT PBMC10 - 4 years 8 months).
Each plot represents 20,000 events, gates are labelled with the percentage of CD4+ve or
CD8+ve T cells in each subset.
B. The percentage of CD4+ve T cells in each subset in normal controls and A-T samples.
C. The percentage of CD8+ve T cells in each subset in normal controls and A-T samples.
Chapter 3: Results
81
D. Summary of T cell subsets in normal controls and A-T samples (as percentage of either
CD4+ve or CD8+ve T cells). Mean values of data shown in part B (CD4+) and C (CD8+).
E. There were significant correlations between increasing memory and decreasing naive T
cells with age in the normal controls. A-T patients showed no change in the percentage of
different T cell subsets with age. A-T patients with no ATM activity and those with some
ATM activity were analysed separately, however to improve clarity and as the sample size
was very small linear regression lines and p and r values for the A-T patients with some ATM
activity are not shown. In the A-T plot filled symbols = no ATM activity, open symbols =
some ATM activity.
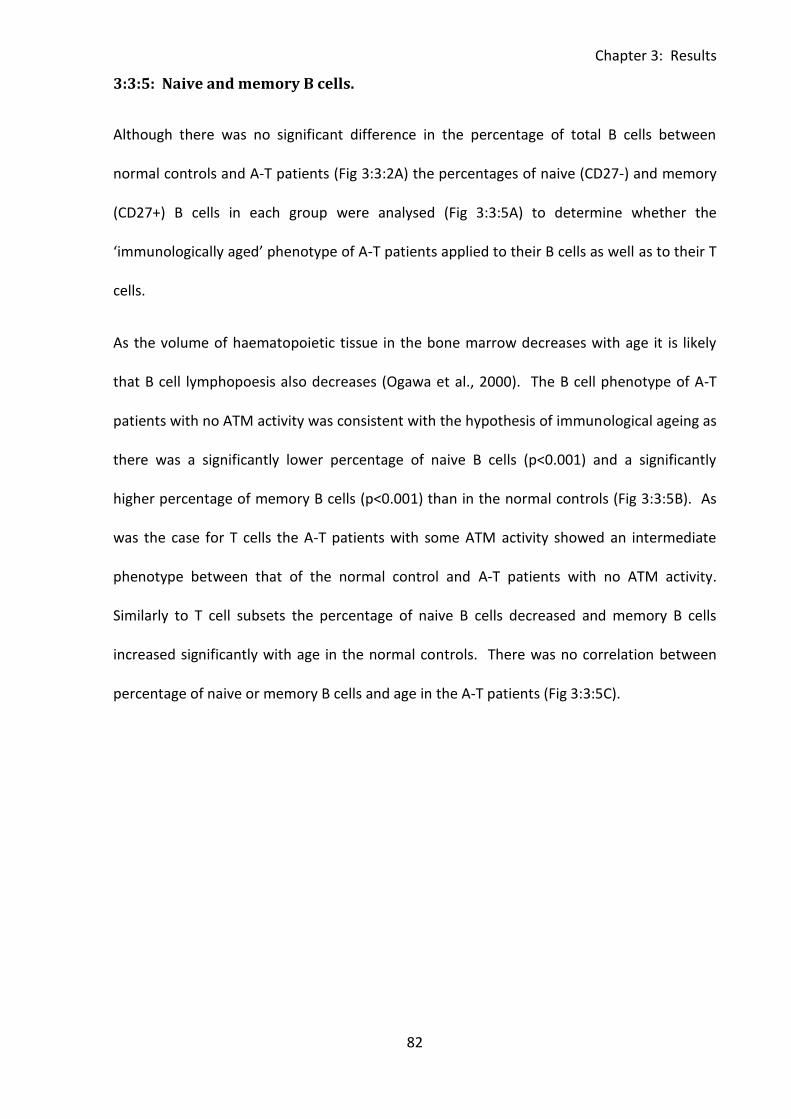
Chapter 3: Results
82
3:3:5: Naive and memory B cells.
Although there was no significant difference in the percentage of total B cells between
normal controls and A-T patients (Fig 3:3:2A) the percentages of naive (CD27-) and memory
(CD27+) B cells in each group were analysed (Fig 3:3:5A) to determine whether the
‘immunologically aged’ phenotype of A-T patients applied to their B cells as well as to their T
cells.
As the volume of haematopoietic tissue in the bone marrow decreases with age it is likely
that B cell lymphopoesis also decreases (Ogawa et al., 2000). The B cell phenotype of A-T
patients with no ATM activity was consistent with the hypothesis of immunological ageing as
there was a significantly lower percentage of naive B cells (p<0.001) and a significantly
higher percentage of memory B cells (p<0.001) than in the normal controls (Fig 3:3:5B). As
was the case for T cells the A-T patients with some ATM activity showed an intermediate
phenotype between that of the normal control and A-T patients with no ATM activity.
Similarly to T cell subsets the percentage of naive B cells decreased and memory B cells
increased significantly with age in the normal controls. There was no correlation between
percentage of naive or memory B cells and age in the A-T patients (Fig 3:3:5C).
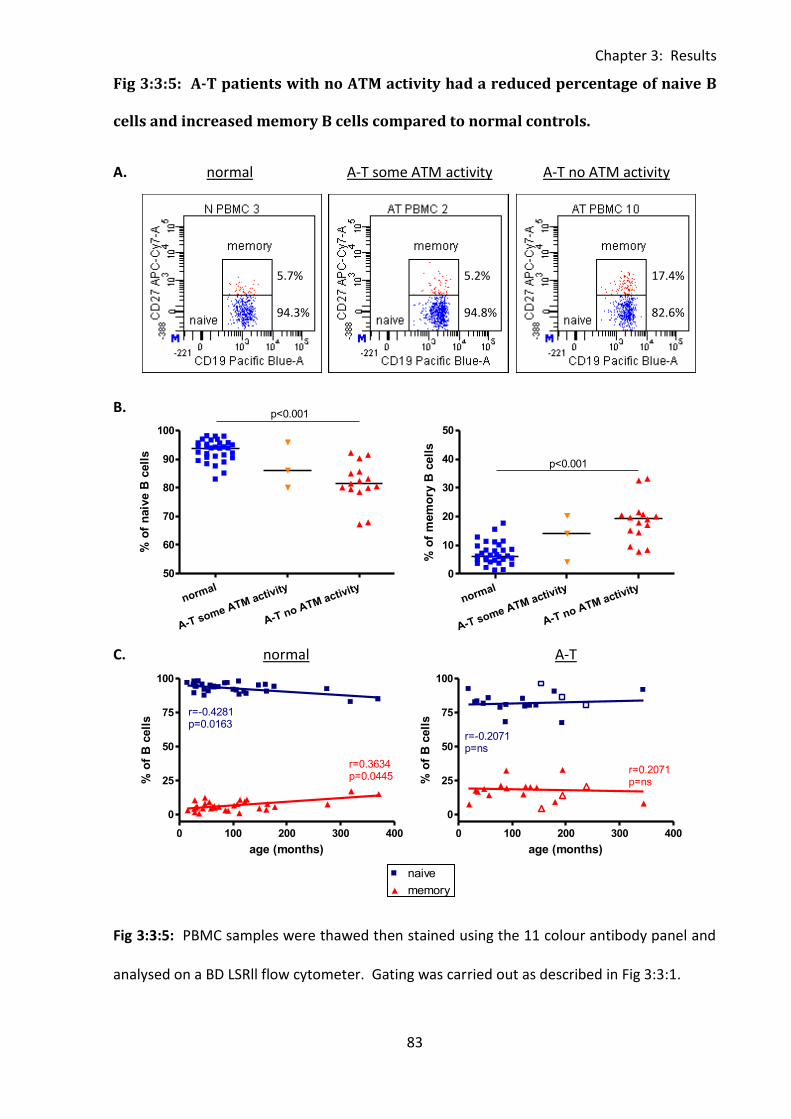
Chapter 3: Results
83
0 100 200 300 400
0
25
50
75
100naive
memory
r=-0.2071p=ns
r=0.2071p=ns
age (months)
% o
f B
cell
s
0 100 200 300 400
0
25
50
75
100naive
memoryr=-0.4281p=0.0163
r=0.3634p=0.0445
age (months)
% o
f B
cell
s
normal
A-T some ATM activity
A-T no ATM activity
50
60
70
80
90
100
p<0.001
% o
f n
aiv
e B
cell
s
normal
A-T some ATM activity
A-T no ATM activity
0
10
20
30
40
50
p<0.001
% o
f m
em
ory
B c
ell
s
0 100 200 300 400
0
25
50
75
100naive
memory
r=-0.2071p=ns
r=0.2071p=ns
age (months)
% o
f B
cell
s
Fig 3:3:5: A-T patients with no ATM activity had a reduced percentage of naive B
cells and increased memory B cells compared to normal controls.
A. normal A-T some ATM activity A-T no ATM activity
B.
C. normal A-T
Fig 3:3:5: PBMC samples were thawed then stained using the 11 colour antibody panel and
analysed on a BD LSRll flow cytometer. Gating was carried out as described in Fig 3:3:1.
5.7%
94.3% 94.8%
5.2%
82.6%
17.4%
Chapter 3: Results
84
A. Representative plots of naive and memory B cell subsets in the normal controls (N
PBMC3 - 5 years 4 months), A-T patients with some ATM activity (AT PBMC2 - 12 years 10
months) and A-T patients with no ATM activity (AT PBMC10 - 4 years 8 months). Each plot
represents 20,000 events and gates are labelled with the percentage of total B cells in each
subset.
B. Naive and memory B cells as a percentage of total B cells in normal control and A-T
patient samples.
C. In the normal controls the percentage of naive B cells decreased and memory B cells
increased significantly with age. There was no correlation between the percentage of
memory or naive B cells and age in A-T patients. A-T patients with no ATM activity and A-T
patients with some ATM activity were analysed separately, however to improve clarity and
as the sample size was very small linear regression lines and p and r values for the A-T
patients with some ATM activity are not shown. In the A-T plot filled symbols = no ATM
activity, open symbols = some ATM activity.
Chapter 3: Results
85
3:3:6: CD56bright and CD56dim NK cells.
Finally NK cell subsets in normal controls and A-T patients were analysed (Fig 3:3:6A).
Although A-T patients with no ATM activity had a significantly higher percentage of NK cells
than normal controls (Fig 3:3:2A) there was no significant difference in the percentages of
CD56bright and CD56dim NK cells (Fig 3:3:6B). There were also no correlations between the
percentages of CD56bright or CD56dim NK cells and age in A-T patients or normal controls
(Fig 3:3:6C).
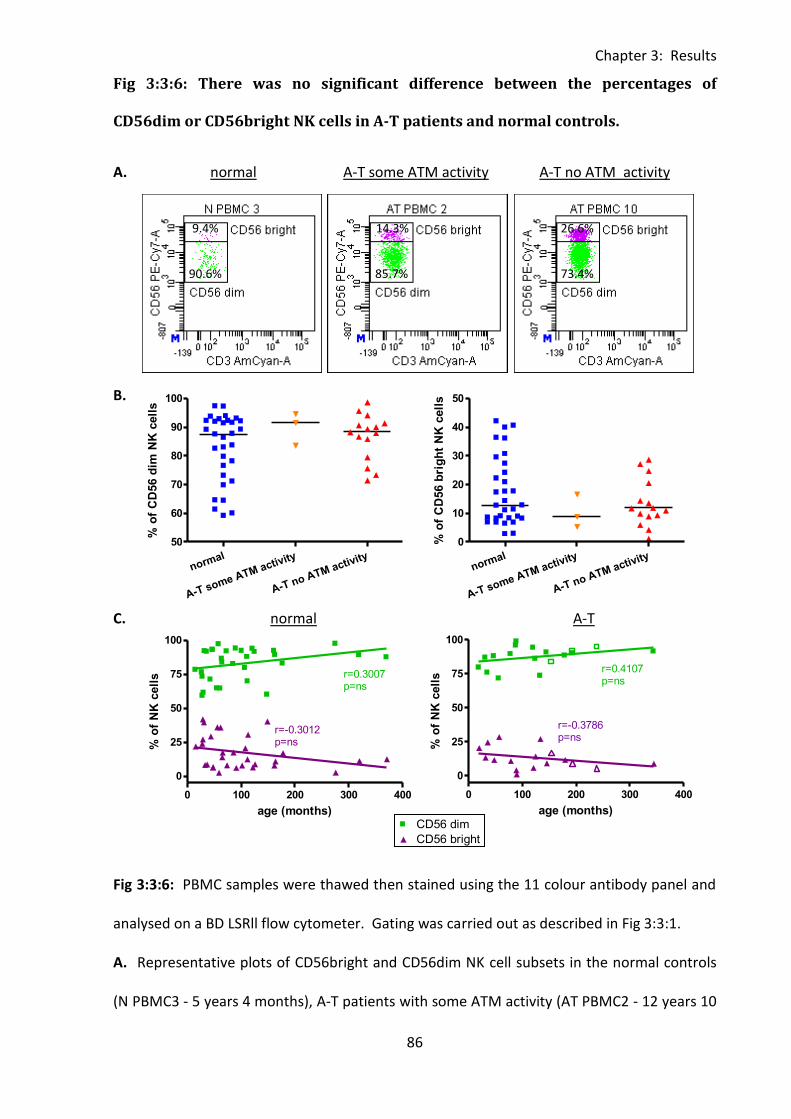
Chapter 3: Results
86
0 100 200 300 400
0
25
50
75
100CD56 dim
CD56 brightr=0.3007p=ns
r=-0.3012p=ns
age (months)
% o
f N
K c
ell
s
normal
A-T some ATM activity
A-T no ATM activity
50
60
70
80
90
100
% o
f C
D56 d
im N
K c
ell
s
normal
A-T some ATM activity
A-T no ATM activity
0
10
20
30
40
50
% o
f C
D56 b
rig
ht
NK
cell
s
0 100 200 300 400
0
25
50
75
100CD56 dim
CD56 brightr=0.4107p=ns
r=-0.3786p=ns
age (months)
% o
f N
K c
ell
s
Fig 3:3:6: There was no significant difference between the percentages of
CD56dim or CD56bright NK cells in A-T patients and normal controls.
A. normal A-T some ATM activity A-T no ATM activity
B.
C. normal A-T
Fig 3:3:6: PBMC samples were thawed then stained using the 11 colour antibody panel and
analysed on a BD LSRll flow cytometer. Gating was carried out as described in Fig 3:3:1.
A. Representative plots of CD56bright and CD56dim NK cell subsets in the normal controls
(N PBMC3 - 5 years 4 months), A-T patients with some ATM activity (AT PBMC2 - 12 years 10
0 100 200 300 400
0
25
50
75
100CD56 dim
CD56 brightr=0.4107p=ns
r=-0.3786p=ns
age (months)
% o
f N
K c
ell
s
9.4%
90.6%
14.3%
85.7%
26.6%
73.4%
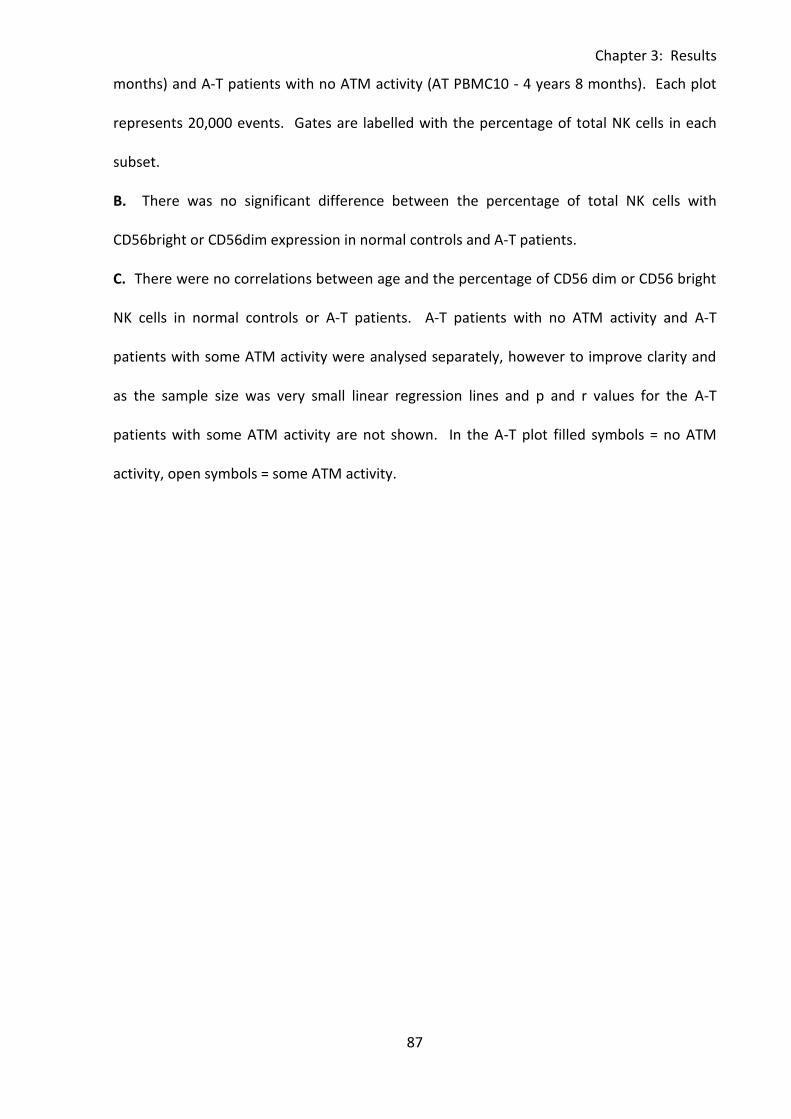
Chapter 3: Results
87
months) and A-T patients with no ATM activity (AT PBMC10 - 4 years 8 months). Each plot
represents 20,000 events. Gates are labelled with the percentage of total NK cells in each
subset.
B. There was no significant difference between the percentage of total NK cells with
CD56bright or CD56dim expression in normal controls and A-T patients.
C. There were no correlations between age and the percentage of CD56 dim or CD56 bright
NK cells in normal controls or A-T patients. A-T patients with no ATM activity and A-T
patients with some ATM activity were analysed separately, however to improve clarity and
as the sample size was very small linear regression lines and p and r values for the A-T
patients with some ATM activity are not shown. In the A-T plot filled symbols = no ATM
activity, open symbols = some ATM activity.
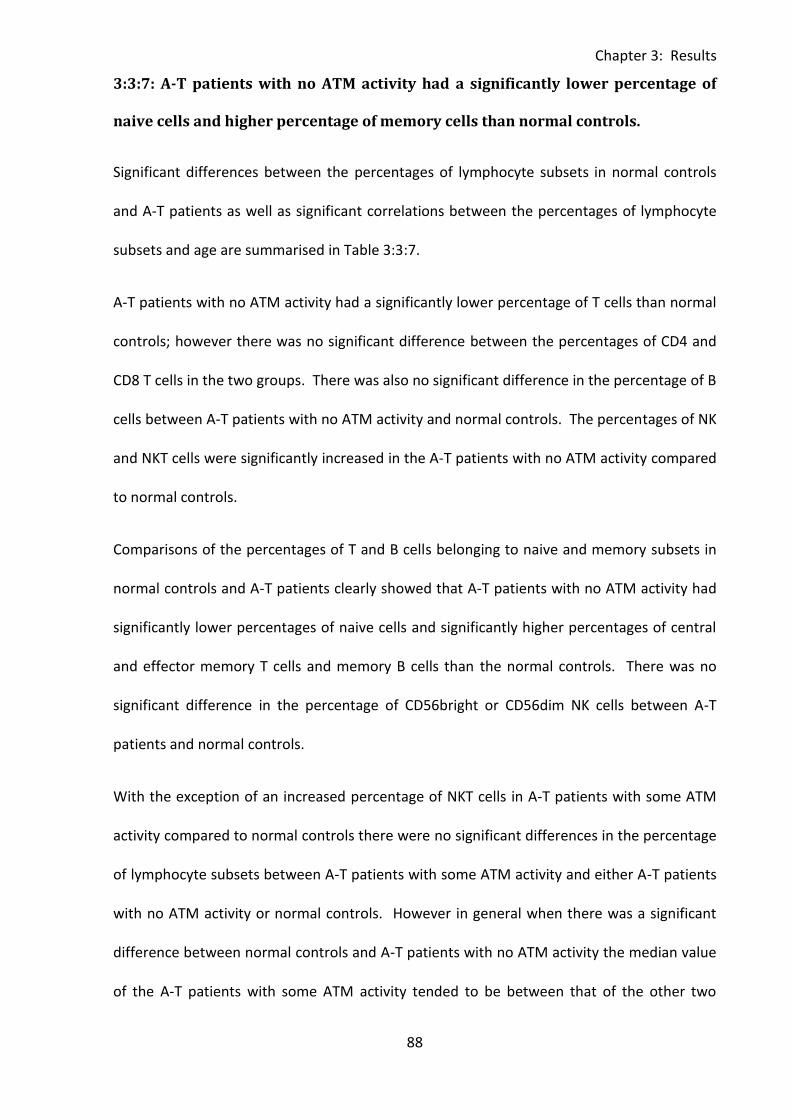
Chapter 3: Results
88
3:3:7: A-T patients with no ATM activity had a significantly lower percentage of
naive cells and higher percentage of memory cells than normal controls.
Significant differences between the percentages of lymphocyte subsets in normal controls
and A-T patients as well as significant correlations between the percentages of lymphocyte
subsets and age are summarised in Table 3:3:7.
A-T patients with no ATM activity had a significantly lower percentage of T cells than normal
controls; however there was no significant difference between the percentages of CD4 and
CD8 T cells in the two groups. There was also no significant difference in the percentage of B
cells between A-T patients with no ATM activity and normal controls. The percentages of NK
and NKT cells were significantly increased in the A-T patients with no ATM activity compared
to normal controls.
Comparisons of the percentages of T and B cells belonging to naive and memory subsets in
normal controls and A-T patients clearly showed that A-T patients with no ATM activity had
significantly lower percentages of naive cells and significantly higher percentages of central
and effector memory T cells and memory B cells than the normal controls. There was no
significant difference in the percentage of CD56bright or CD56dim NK cells between A-T
patients and normal controls.
With the exception of an increased percentage of NKT cells in A-T patients with some ATM
activity compared to normal controls there were no significant differences in the percentage
of lymphocyte subsets between A-T patients with some ATM activity and either A-T patients
with no ATM activity or normal controls. However in general when there was a significant
difference between normal controls and A-T patients with no ATM activity the median value
of the A-T patients with some ATM activity tended to be between that of the other two
Chapter 3: Results
89
groups, suggesting an intermediate phenotype. The sample size of the A-T patients with
some ATM activity was very small (3 patients) and it seems likely that if the sample had been
larger these differences may have been significant.
In the normal controls the percentages of memory T and B cells correlated positively with
age and the percentages of naive T and B cells correlated negatively with age. There were
no correlations between age and the percentages of total T cells, CD4+ T cells, CD8+ T cells, B
cells or CD56bright or CD56dim NK cells in the normal controls, however there were positive
correlations between the percentages of NK and NKT cells and age. These changes are
consistent with normal aging of the immune system.
Perhaps due to the consistently low thymic output of A-T patients, age did not have as much
effect on the percentages of lymphocyte subsets in A-T patients as in the normal controls.
There were no significant correlations between age and percentages of lymphocyte subsets
in the A-T patients with some ATM activity. However in A-T patients with no ATM activity
the percentage of T cells correlated positively and the percentage of NK cells correlated
negatively with age.
These results showed an immune system phenotype of A-T patients which was consistent
with the published literature (Nowak-Wegrzyn et al., 2004;Reichenbach et al., 2002) and
similar to that of elderly individuals (Pawelec et al., 2010;Sansoni et al., 2008).
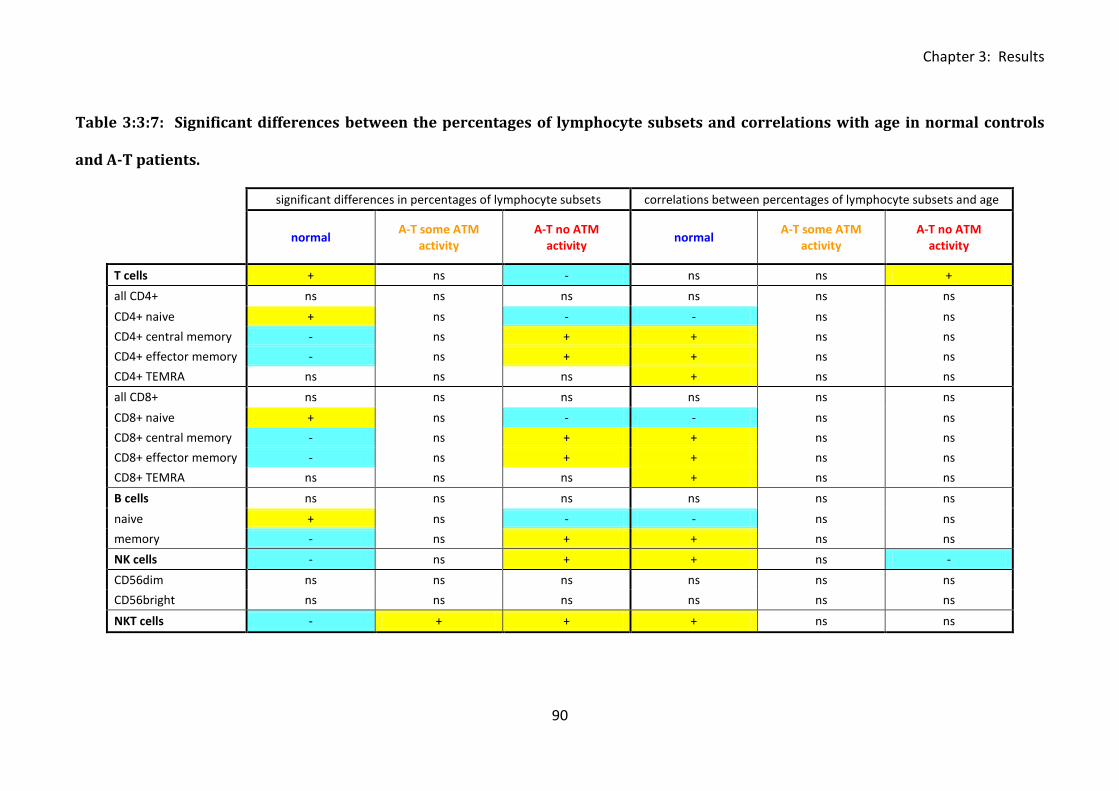
Chapter 3: Results
90
Table 3:3:7: Significant differences between the percentages of lymphocyte subsets and correlations with age in normal controls
and A-T patients.
significant differences in percentages of lymphocyte subsets correlations between percentages of lymphocyte subsets and age
normal
A-T some ATM activity
A-T no ATM activity
normal A-T some ATM
activity A-T no ATM
activity
T cells + ns - ns ns +
all CD4+ ns ns ns ns ns ns
CD4+ naive + ns - - ns ns
CD4+ central memory - ns + + ns ns
CD4+ effector memory - ns + + ns ns
CD4+ TEMRA ns ns ns + ns ns
all CD8+ ns ns ns ns ns ns
CD8+ naive + ns - - ns ns
CD8+ central memory - ns + + ns ns
CD8+ effector memory - ns + + ns ns
CD8+ TEMRA ns ns ns + ns ns
B cells ns ns ns ns ns ns
naive + ns - - ns ns
memory - ns + + ns ns
NK cells - ns + + ns -
CD56dim ns ns ns ns ns ns
CD56bright ns ns ns ns ns ns
NKT cells - + + + ns ns
Chapter 3: Results
91
Table 3:3:7: Summary of significant differences between the percentages of lymphocyte
subsets and correlations between percentages of lymphocyte subsets and age in A-T
patients and normal controls.
In the first part of the table (significant differences in percentages of lymphocyte subsets)
cells containing a positive symbol (+) and highlighted in yellow indicate a significantly higher
percentage of the lymphocyte subset in the corresponding group compared to the group
with a cell containing a negative symbol (-) and highlighted in blue, ‘ns’ refers to no
significant difference compared to any group. The second part of the table (correlations
between percentages of lymphocyte subsets and age) summarises significant correlations
between the percentage of each lymphocyte subset and age. The yellow positive (+) cells
indicate a positive correlation and blue negative (-) cells indicate a negative correlation, ‘ns’
indicates no significant correlation. .
Chapter 3: Results
92
3:4: CD95 expression.
3:4:1: CD95 expression on lymphocyte subsets.
In normal individuals both CD95 expression on T cells and their sensitivity to CD95-mediated
apoptosis increases with age, this may contribute to the age associated failing of adaptive
immunity known as immune senescence (Aggarwal & Gupta, 1998;Gupta & Gollapudi,
2008;Potestio et al., 1999). The immune system phenotypes of A-T patients and the elderly
are very similar and it is possible that increased CD95 expression and consequent sensitivity
to CD95-mediated apoptosis may also be involved in shaping the immune system phenotype
of A-T patients.
Expression of CD95 was compared on lymphocyte subsets from A-T patients and normal
controls. CD95 expression measured both as the percentage and the CD95 MFI of CD95+ve
cells was significantly higher on T cells (% - p<0.001, MFI - p<0.001), B cells (% - p<0.001, MFI
- p<0.05) and NKT cells (% - p<0.01, MFI - p<0.05) in A-T patients with no ATM activity than
normal controls (Fig 3:4:1A, B&D).
In general there were no significant differences between CD95 expression on lymphocytes
from A-T patients with some ATM activity compared to normal controls or A-T patients with
no ATM activity. The exception to this was the CD95 MFI of CD95+ T cells which was
significantly higher in A-T patients with some ATM activity than in normal controls (p<0.01)
(Fig 3:4:1A).
Perhaps because CD95 expression was already high there was no increase in expression with
age in the A-T patients. However, the normal controls showed significant positive
correlations between age and the percentages of CD95+ T cells, B cells and NKT cells and the
CD95 MFI of CD95+ T cells and NKT cells (Fig 3:4:1E). This increase in CD95 expression on

Chapter 3: Results
93
lymphocytes with age over the 1 to 30 year age range was consistent with the published
literature (Potestio et al., 1999).
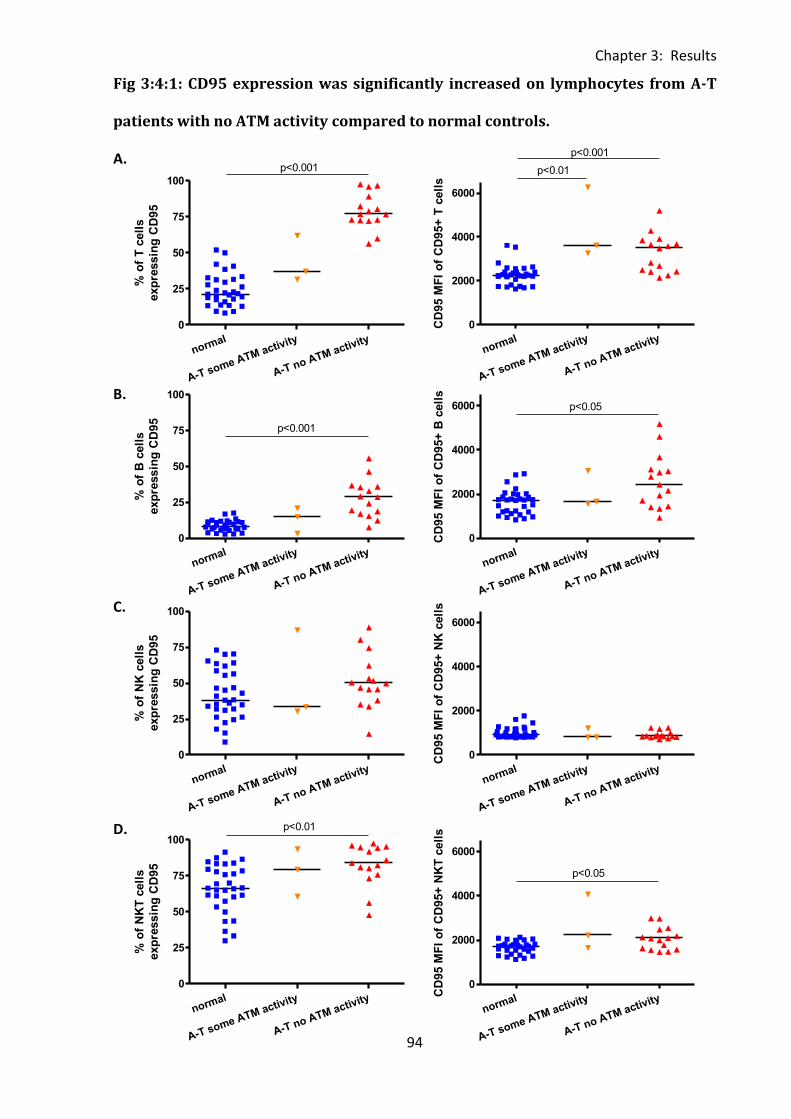
Chapter 3: Results
94
normal
A-T some ATM activity
A-T no ATM activity
0
25
50
75
100
p<0.001
% o
f T
cell
s
exp
ressin
g C
D95
normal
A-T some ATM activity
A-T no ATM activity
0
2000
4000
6000
p<0.001
p<0.01
CD
95 M
FI
of
CD
95+
T c
ell
s
normal
A-T some ATM activity
A-T no ATM activity
0
25
50
75
100
p<0.001
% o
f B
cell
s
exp
ressin
g C
D95
normal
A-T some ATM activity
A-T no ATM activity
0
2000
4000
6000 p<0.05
CD
95 M
FI
of
CD
95+
B c
ell
s
normal
A-T some ATM activity
A-T no ATM activity
0
25
50
75
100
% o
f N
K c
ell
s
exp
ressin
g C
D95
normal
A-T some ATM activity
A-T no ATM activity
0
2000
4000
6000
CD
95 M
FI
of
CD
95+
NK
cell
s
normal
A-T some ATM activity
A-T no ATM activity
0
25
50
75
100
p<0.01
% o
f N
KT
cell
s
exp
ressin
g C
D95
normal
A-T some ATM activity
A-T no ATM activity
0
2000
4000
6000
p<0.05
CD
95 M
FI
of
CD
95+
NK
T c
ell
s
Fig 3:4:1: CD95 expression was significantly increased on lymphocytes from A-T
patients with no ATM activity compared to normal controls.
A.
B.
C.
D.
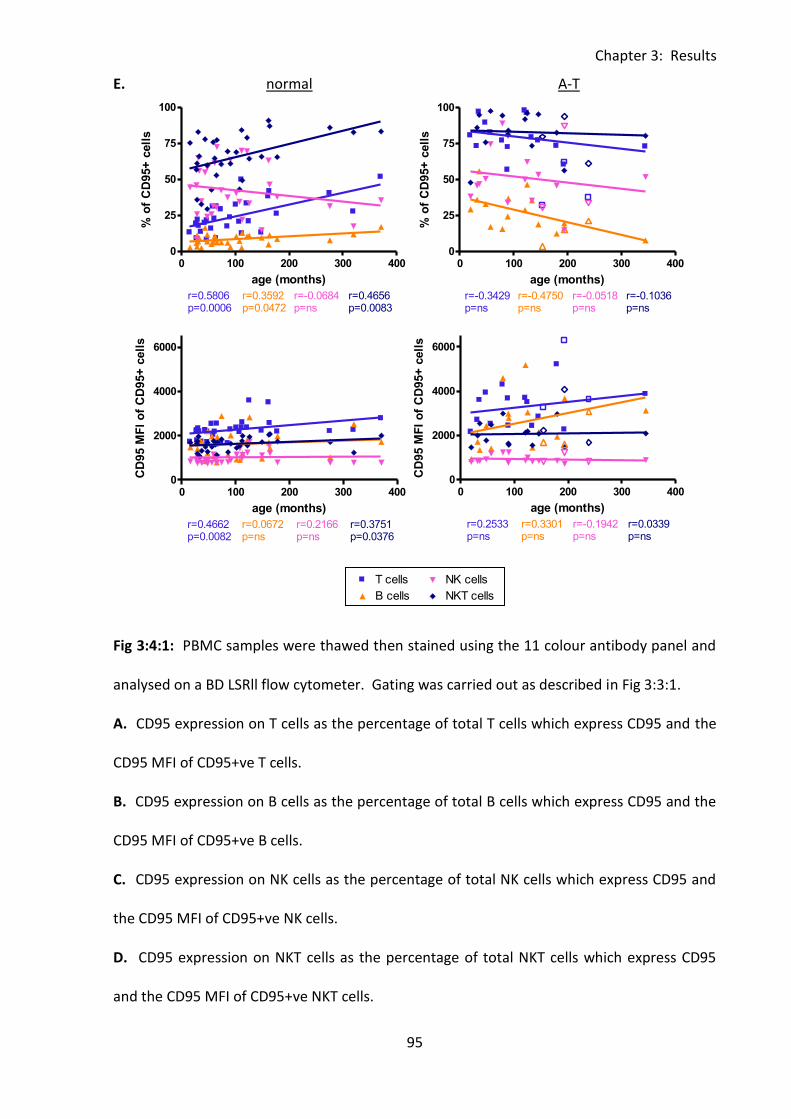
Chapter 3: Results
95
0 100 200 300 4000
25
50
75
100T cells
B cells
NK cells
NKT cells
r=0.5955p=0.0003
r=0.3191p=ns
r=-0.0972p=ns
r=0.4498p=0.0086
age (months)
% o
f C
D95+
cell
s
0 100 200 300 4000
25
50
75
100T cells
B cells
NK cells
NKT cells
r=0.5806p=0.0006
r=0.3592p=0.0472
r=-0.0684p=ns
r=0.4656p=0.0083
age (months)
% o
f C
D95+
cell
s
0 100 200 300 4000
2000
4000
6000 T cells
B cells
NK cells
NKT cells
r=0.4662p=0.0082
r=0.0672p=ns
r=0.2166p=ns
r=0.3751p=0.0376
age (months)
CD
95 M
FI
of
CD
95+
cell
s
0 100 200 300 4000
25
50
75
100T cells
Legend
B cells
Legend
NK cells
Legend
NKT cells
Legend
r=-0.3429p=ns
r=-0.4750p=ns
r=-0.0518p=ns
r=-0.1036p=ns
age (months)
% o
f C
D95+
cell
s
0 100 200 300 4000
2000
4000
6000 T cells
B cells
NK cells
NKT cells
Legend
Legend
Legend
Legend
r=0.2533p=ns
r=0.3301p=ns
r=-0.1942p=ns
r=0.0339p=ns
age (months)
CD
95 M
FI
of
CD
95+
cell
s
E. normal A-T
Fig 3:4:1: PBMC samples were thawed then stained using the 11 colour antibody panel and
analysed on a BD LSRll flow cytometer. Gating was carried out as described in Fig 3:3:1.
A. CD95 expression on T cells as the percentage of total T cells which express CD95 and the
CD95 MFI of CD95+ve T cells.
B. CD95 expression on B cells as the percentage of total B cells which express CD95 and the
CD95 MFI of CD95+ve B cells.
C. CD95 expression on NK cells as the percentage of total NK cells which express CD95 and
the CD95 MFI of CD95+ve NK cells.
D. CD95 expression on NKT cells as the percentage of total NKT cells which express CD95
and the CD95 MFI of CD95+ve NKT cells.
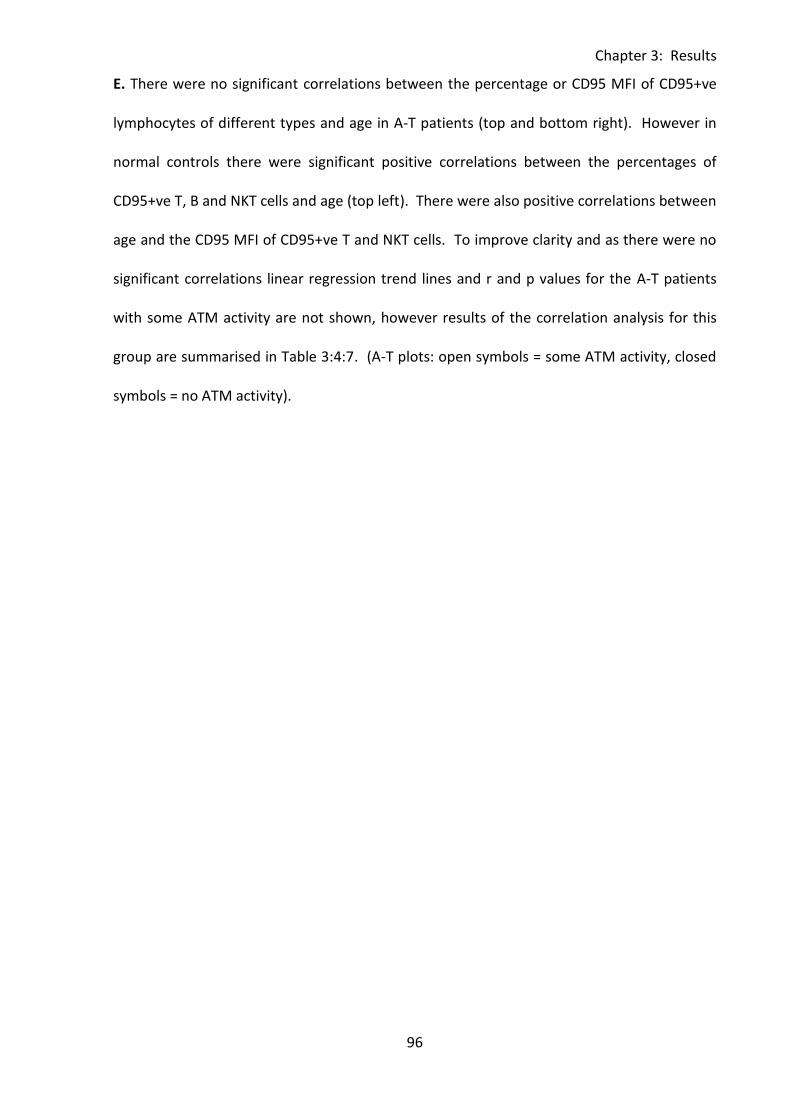
Chapter 3: Results
96
E. There were no significant correlations between the percentage or CD95 MFI of CD95+ve
lymphocytes of different types and age in A-T patients (top and bottom right). However in
normal controls there were significant positive correlations between the percentages of
CD95+ve T, B and NKT cells and age (top left). There were also positive correlations between
age and the CD95 MFI of CD95+ve T and NKT cells. To improve clarity and as there were no
significant correlations linear regression trend lines and r and p values for the A-T patients
with some ATM activity are not shown, however results of the correlation analysis for this
group are summarised in Table 3:4:7. (A-T plots: open symbols = some ATM activity, closed
symbols = no ATM activity).
Chapter 3: Results
97
3:4:2: CD95 expression on CD4+ and CD8+ T cells.
Analysis of CD95 expression on CD4+ and CD8+ T cells gave similar results to analysis of
expression on total T cells. CD95 expression measured as both the percentage and CD95
MFI of CD95+ve T cells was significantly higher on CD4+ve (% p<0.001, MFI p<0.001) (Fig
3:4:2A&B) and CD8+ve T cells (% p<0.001, MFI p<0.001) (Fig 3:4:2A&C) in A-T patients with
no ATM activity than the normal controls. There was no significant difference between the
percentages of CD4+CD95+ or CD8+CD95+ T cells from A-T patients with some ATM activity
compared to either normal controls or A-T patients with no ATM activity. However the CD95
MFI of CD4+CD95+ and CD8+CD95+ T cells was significantly higher in the A-T patients with
some ATM activity than the normal controls (CD4+ p<0.01, CD8+ p<0.01) (Fig 3:4:2B&C).
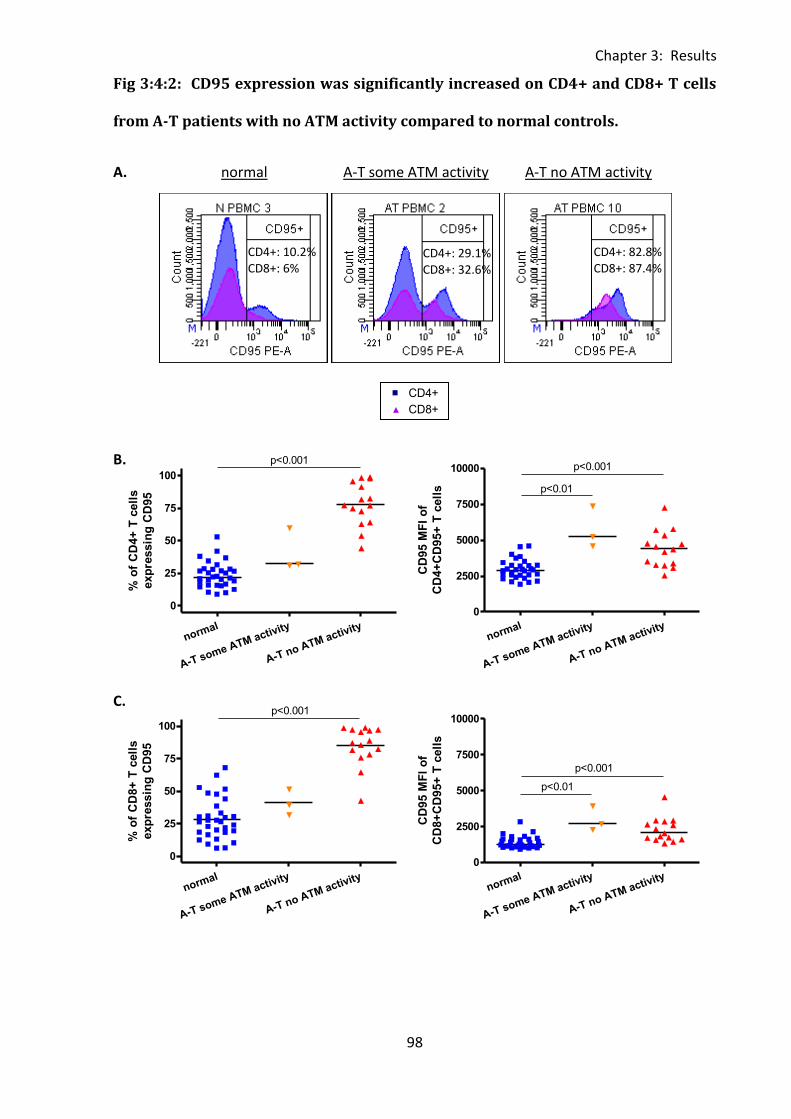
Chapter 3: Results
98
0 100 200 300 400300
500
700
900CD4+
CD8+
r=-0.0871p=ns
r=-0.0425p=ns
normal
FasL
MF
I o
f F
asL
+ T
cell
s
normal
A-T some ATM activity
A-T no ATM activity
0
25
50
75
100
p<0.001
% o
f C
D4+
T c
ell
s
exp
ressin
g C
D95
normal
A-T some ATM activity
A-T no ATM activity
0
2500
5000
7500
10000 p<0.001
p<0.01
CD
95 M
FI
of
CD
4+
CD
95+
T c
ell
s
normal
A-T some ATM activity
A-T no ATM activity
0
25
50
75
100
p<0.001
% o
f C
D8+
T c
ell
s
exp
ressin
g C
D95
normal
A-T some ATM activity
A-T no ATM activity
0
2500
5000
7500
10000
p<0.001
p<0.01
CD
95 M
FI
of
CD
8+
CD
95+
T c
ell
s
Fig 3:4:2: CD95 expression was significantly increased on CD4+ and CD8+ T cells
from A-T patients with no ATM activity compared to normal controls.
A. normal A-T some ATM activity A-T no ATM activity
B.
C.
CD4+: 10.2% CD8+: 6%
CD4+: 29.1% CD8+: 32.6%
CD4+: 82.8% CD8+: 87.4%
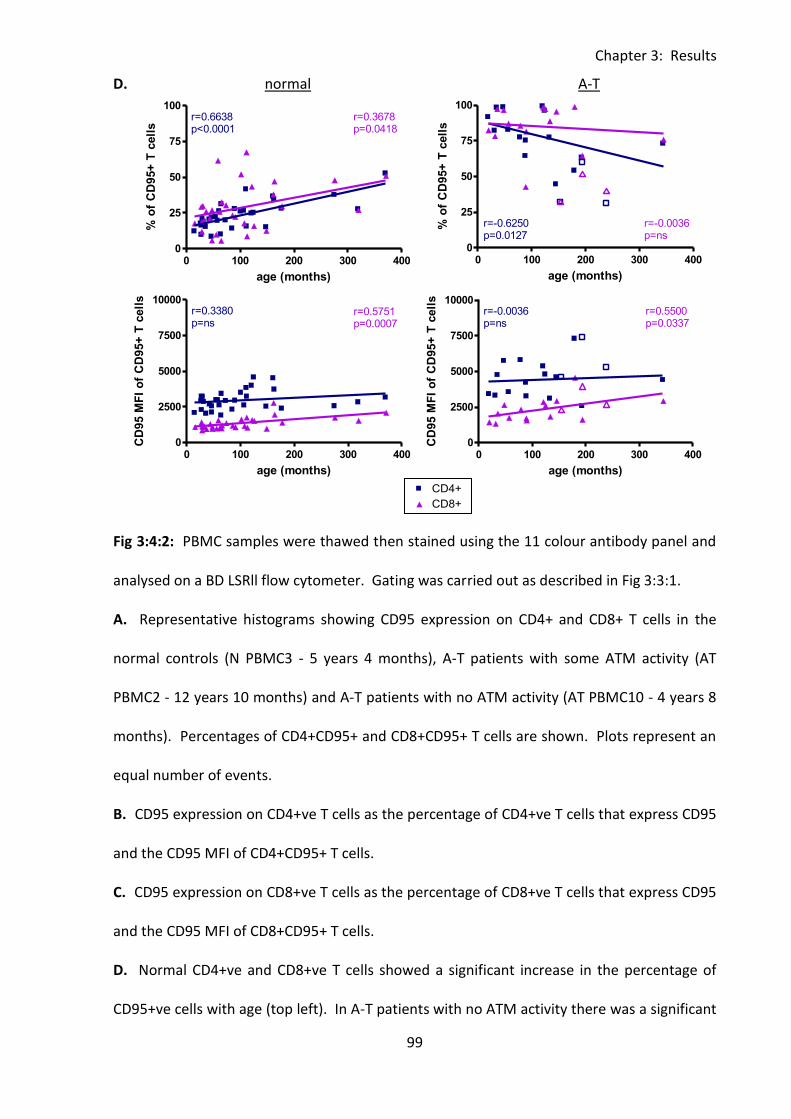
Chapter 3: Results
99
0 100 200 300 400300
500
700
900CD4+
CD8+
r=-0.0871p=ns
r=-0.0425p=ns
normal
FasL
MF
I o
f F
asL
+ T
cell
s
0 100 200 300 4000
25
50
75
100CD4+
CD8+
r=0.6638p<0.0001
r=0.3678p=0.0418
age (months)
% o
f C
D95+
T c
ell
s
0 100 200 300 4000
2500
5000
7500
10000CD4+
CD8+
r=0.3380p=ns
r=0.5751p=0.0007
age (months)
CD
95 M
FI
of
CD
95+
T c
ell
s
0 100 200 300 4000
25
50
75
100CD4+
CD8+
r=-0.6250p=0.0127
r=-0.0036p=ns
age (months)
% o
f C
D95+
T c
ell
s0 100 200 300 400
0
2500
5000
7500
10000CD4+
Legend
CD8+
Legend
r=-0.0036p=ns
r=0.5500p=0.0337
age (months)
CD
95 M
FI
of
CD
95+
T c
ell
s
D. normal A-T
Fig 3:4:2: PBMC samples were thawed then stained using the 11 colour antibody panel and
analysed on a BD LSRll flow cytometer. Gating was carried out as described in Fig 3:3:1.
A. Representative histograms showing CD95 expression on CD4+ and CD8+ T cells in the
normal controls (N PBMC3 - 5 years 4 months), A-T patients with some ATM activity (AT
PBMC2 - 12 years 10 months) and A-T patients with no ATM activity (AT PBMC10 - 4 years 8
months). Percentages of CD4+CD95+ and CD8+CD95+ T cells are shown. Plots represent an
equal number of events.
B. CD95 expression on CD4+ve T cells as the percentage of CD4+ve T cells that express CD95
and the CD95 MFI of CD4+CD95+ T cells.
C. CD95 expression on CD8+ve T cells as the percentage of CD8+ve T cells that express CD95
and the CD95 MFI of CD8+CD95+ T cells.
D. Normal CD4+ve and CD8+ve T cells showed a significant increase in the percentage of
CD95+ve cells with age (top left). In A-T patients with no ATM activity there was a significant
Chapter 3: Results
100
negative correlation between the percentage of CD4+CD95+ T cells and age (top right).
However in both normal controls and A-T patients with no ATM activity there were
significant positive correlations between the CD95 MFI of CD8+CD95+ T cells and age
(bottom left and right). To improve clarity and as there were no significant correlations
linear regression trend lines and r and p values for the A-T patients with some ATM activity
are not shown, however results of the correlation analysis for this group are summarised in
Table 3:4:6. (A-T plots: open symbols = some ATM activity, closed symbols = no ATM
activity).
Chapter 3: Results
101
3:4:3: CD95 expression on naive and memory T cells.
CD95 is expressed on memory T cells, however naive T cells do not upregulate the receptor
until they are activated (Klas et al., 1993). Therefore CD95 expression on T cell subsets was
analysed to investigate whether the high CD95 expression on T cells from A-T patients with
no ATM activity compared to normal controls was solely due to the reduced proportion of
naive T cells.
The normal controls had very low CD95 expression on naive CD4+ve and CD8+ve T cells and
high expression on CD4+ and CD8+ memory T cell subsets as expected (Fig 3:4:3A). However
the median percentages of naive CD4+CD95 and CD8+CD95+ T cells in the A-T patients with
no ATM activity were very high (CD4+CD95+ - 35.9%, CD8+CD95+ - 74.6%) compared to the
normal controls (CD4+CD95+ - 3.9%, CD8+CD95+ - 10.8%) and A-T patients with some ATM
activity (CD4+CD95+ - 2.5%, CD8+CD95+ - 7.4%) (Fig 3:4:3B). There were significant
differences in the percentages of naive CD95+ve T cells between the A-T patients with no
ATM activity and normal controls (CD4+ - p<0.001, CD8+ - p<0.001) and the two groups of A-
T patients (CD4+ - p<0.05, CD8+ - p<0.001).
Although there was no significant difference in the CD95 MFI of CD4+CD95+ naive T cells, the
CD95 MFI of CD8+CD95 naive T cells was significantly higher in A-T patients with no ATM
activity than normal controls (p<0.001). The CD95MFI of both CD4+CD95+ and CD8+CD95+
naive T cells were increased in A-T patients with some ATM activity compared to normal
controls (CD4+CD95+ - p<0.01, CD8+CD95+ - p<0.05) (Fig 3:4:3B).
CD95 expression on memory T cells was also increased in A-T patients. The percentages of
both CD95+CD4+ and CD95+CD8+ central memory, effector memory and TEMRA T cells were
significantly higher in A-T patients with no ATM activity than normal controls (central
Chapter 3: Results
102
memory: CD4+ - p<0.01, CD8+ - p<0.001, effector memory: CD4+ - p<0.01, CD8+ - p<0.05,
TEMRA: CD4+ - p<0.01, CD8+ - p<0.01). Similarly the CD95 MFI of CD8+CD95+ memory T
cells was increased in A-T patients with no ATM activity compared to normal controls
(central memory - p<0.001, effector memory - p<0.05, TEMRA - p<0.01) but this was not the
case for all CD4+ memory subsets. The CD95 MFI of CD4+CD95+ central memory T cells was
significantly higher in A-T patients with no ATM activity than normal controls (P<0.001) but
there was no significant difference in CD95 MFI of either effector memory or TEMRA T cells
between the two groups (Fig 3:4:3C-E).
Although the sample size was small there were also some significant differences in CD95
expression on memory T cells between A-T patients with some ATM activity and A-T patients
with no ATM activity or normal controls; the percentage of CD4+CD95+ central memory cells
was low in A-T patients with some ATM activity compared to A-T patients with no ATM
activity (p<0.05). The CD95 MFI of all subsets of memory CD4+CD95+ T cells and CD8+CD95+
T cells were significantly higher in A-T patients with some ATM activity than normal controls
(central memory: CD4 - p<0.01, CD8 – p<0.01, effector memory: CD4 - p<0.01, CD8 – p<0.05
TEMRA: CD4 - p<0.01, CD8+ - p<0.01) but there were no significant differences in CD95 MFI
of CD4+CD95+ or CD8+CD95+ memory T cells between A-T patients with some ATM activity
and A-T patients with no ATM activity (Fig 3:4:3C-E).
As CD95 expression was significantly increased on both naive and memory T cell subsets in
A-T patients compared to normal controls the overall increased CD95 expression on T cells
from A-T patients cannot be explained purely as a consequence of their naive T cell
deficiency.
Finally correlations between age and CD95 expression on naive and memory T cell subsets
were analysed to determine if the increase in CD95 expression on CD4+ and CD8+ T cells
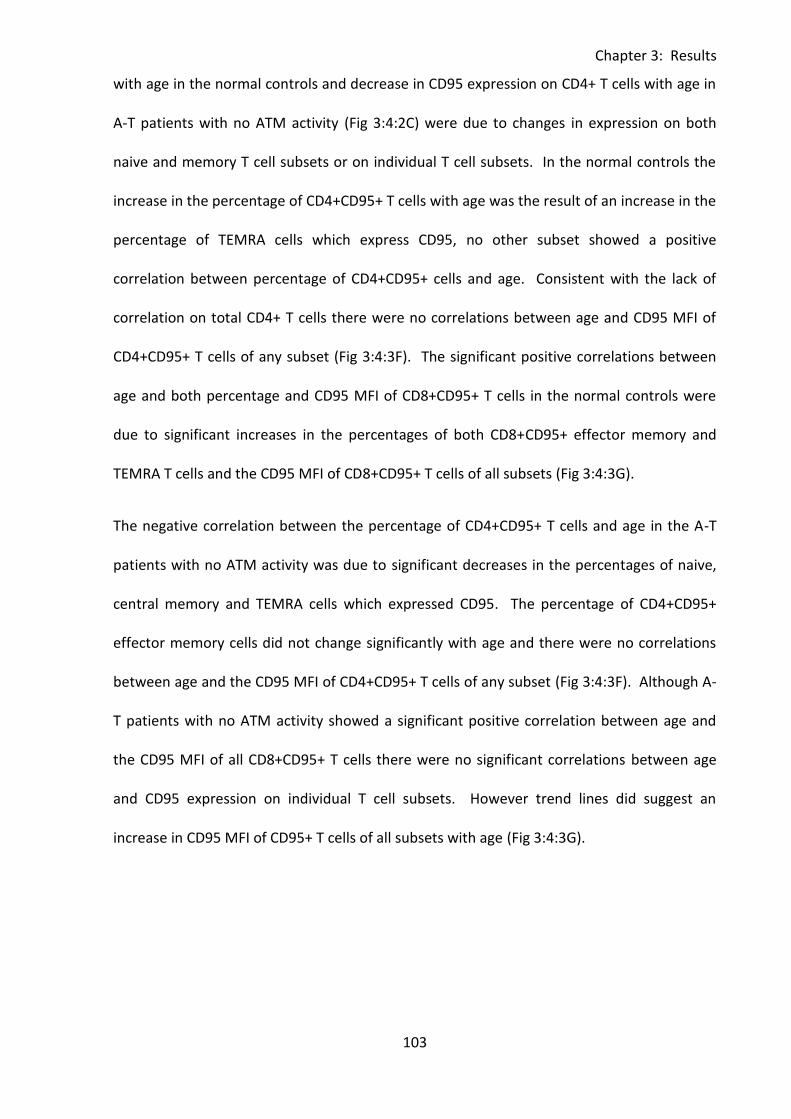
Chapter 3: Results
103
with age in the normal controls and decrease in CD95 expression on CD4+ T cells with age in
A-T patients with no ATM activity (Fig 3:4:2C) were due to changes in expression on both
naive and memory T cell subsets or on individual T cell subsets. In the normal controls the
increase in the percentage of CD4+CD95+ T cells with age was the result of an increase in the
percentage of TEMRA cells which express CD95, no other subset showed a positive
correlation between percentage of CD4+CD95+ cells and age. Consistent with the lack of
correlation on total CD4+ T cells there were no correlations between age and CD95 MFI of
CD4+CD95+ T cells of any subset (Fig 3:4:3F). The significant positive correlations between
age and both percentage and CD95 MFI of CD8+CD95+ T cells in the normal controls were
due to significant increases in the percentages of both CD8+CD95+ effector memory and
TEMRA T cells and the CD95 MFI of CD8+CD95+ T cells of all subsets (Fig 3:4:3G).
The negative correlation between the percentage of CD4+CD95+ T cells and age in the A-T
patients with no ATM activity was due to significant decreases in the percentages of naive,
central memory and TEMRA cells which expressed CD95. The percentage of CD4+CD95+
effector memory cells did not change significantly with age and there were no correlations
between age and the CD95 MFI of CD4+CD95+ T cells of any subset (Fig 3:4:3F). Although A-
T patients with no ATM activity showed a significant positive correlation between age and
the CD95 MFI of all CD8+CD95+ T cells there were no significant correlations between age
and CD95 expression on individual T cell subsets. However trend lines did suggest an
increase in CD95 MFI of CD95+ T cells of all subsets with age (Fig 3:4:3G).
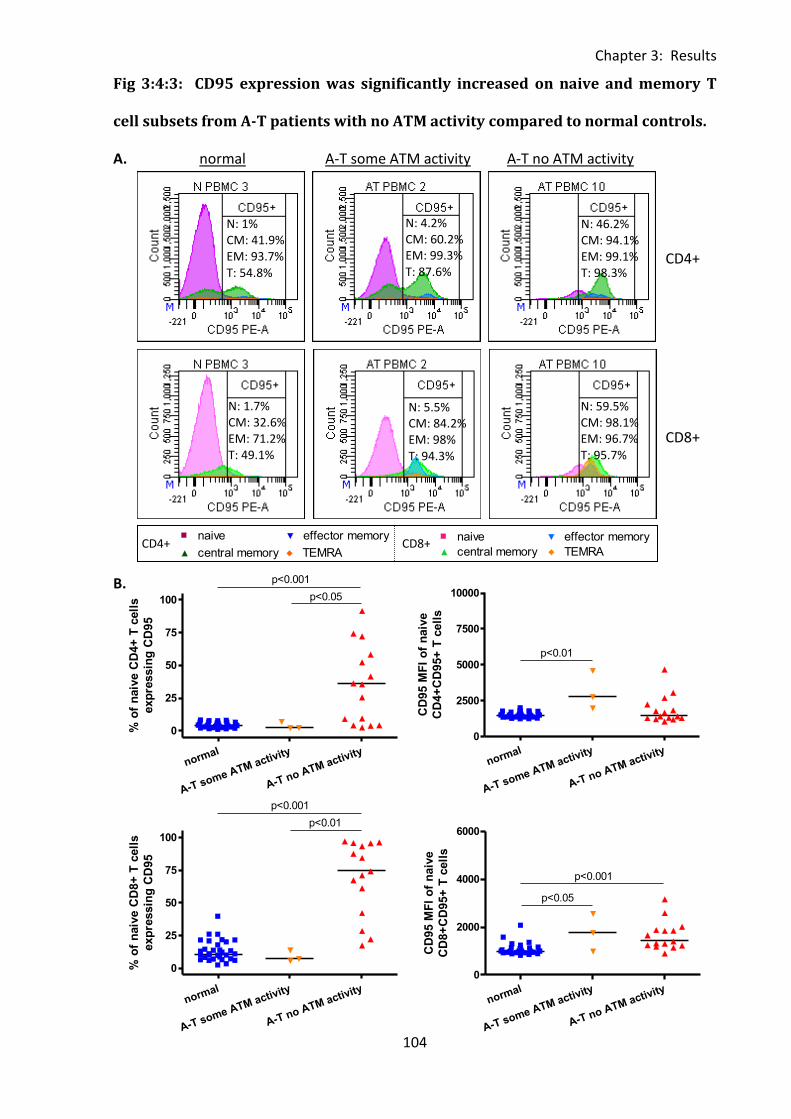
Chapter 3: Results
104
normal
A-T some ATM activity
A-T no ATM activity
0
25
50
75
100
p<0.001
p<0.05
% o
f n
aiv
e C
D4+
T c
ell
s
exp
ressin
g C
D95
normal
A-T some ATM activity
A-T no ATM activity
0
2500
5000
7500
10000
p<0.01
CD
95 M
FI
of
naiv
e
CD
4+
CD
95+
T c
ell
s
normal
A-T some ATM activity
A-T no ATM activity
0
25
50
75
100
p<0.001
p<0.01
% o
f n
aiv
e C
D8+
T c
ell
s
exp
ressin
g C
D95
normal
A-T some ATM activity
A-T no ATM activity
0
2000
4000
6000
p<0.001
p<0.05
CD
95 M
FI
of
naiv
e
CD
8+
CD
95+
T c
ell
s
Fig 3:4:3: CD95 expression was significantly increased on naive and memory T
cell subsets from A-T patients with no ATM activity compared to normal controls.
A. normal A-T some ATM activity A-T no ATM activity
B.
0 100 200 300 4000
2500
5000
7500
10000naive
central memory
effector memory
TEMRA
r=0.1250p=ns
r=0.0429p=ns
r=0.0179p=ns
r=0.2714p=ns
age (months)
CD
95 M
FI
of
CD
4+
CD
95+
T c
ell
s
0 100 200 300 4000
2000
4000
6000naive
central memory
effector memory
TEMRA
r=0.3321p=ns
r=0.8000p=ns
r=0.3607p=ns
r=0.6000p=ns
age (months)
CD
95 M
FI
of
CD
8+
CD
95+
T c
ell
sCD4+ CD8+
N: 1% CM: 41.9% EM: 93.7% T: 54.8%
N: 4.2% CM: 60.2% EM: 99.3% T: 87.6%
N: 46.2% CM: 94.1% EM: 99.1% T: 98.3%
N: 1.7% CM: 32.6% EM: 71.2% T: 49.1%
N: 5.5% CM: 84.2% EM: 98% T: 94.3%
N: 59.5% CM: 98.1% EM: 96.7% T: 95.7%
CD4+
CD8+
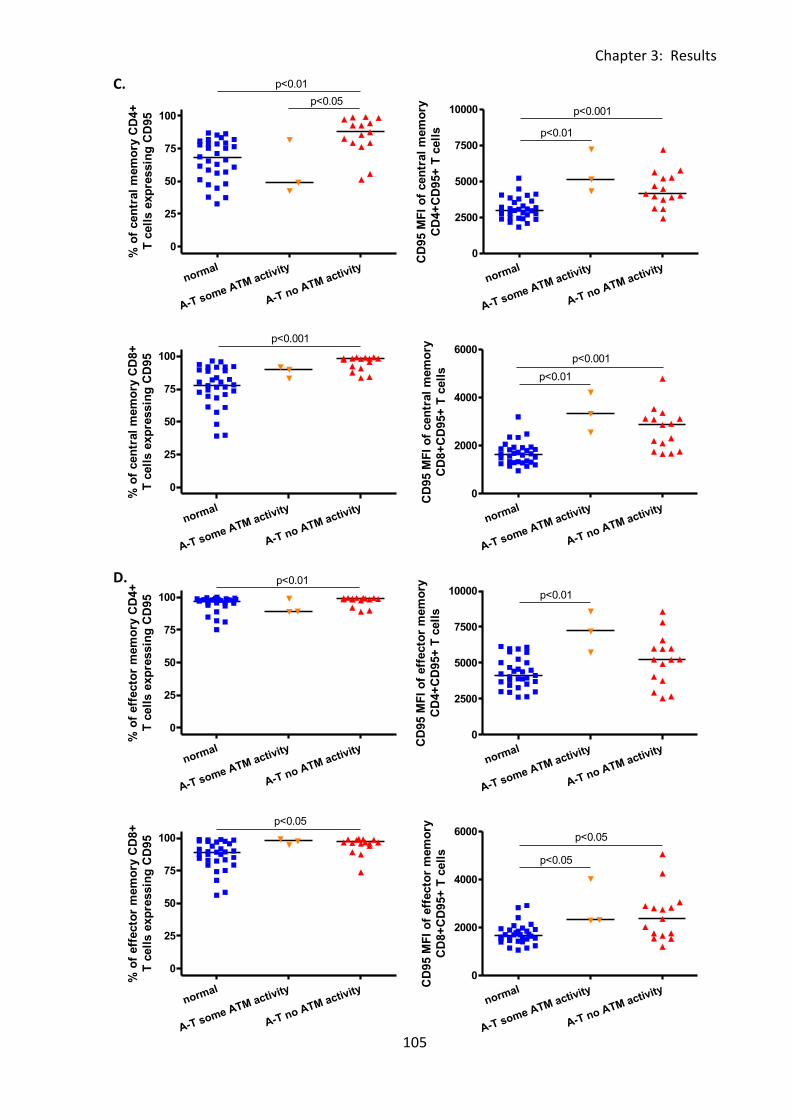
Chapter 3: Results
105
normal
A-T some ATM activity
A-T no ATM activity
0
25
50
75
100
p<0.01
p<0.05
% o
f cen
tral
mem
ory
CD
4+
T c
ell
s e
xp
ressin
g C
D95
normal
A-T some ATM activity
A-T no ATM activity
0
2500
5000
7500
10000 p<0.001
p<0.01
CD
95 M
FI
of
cen
tral
mem
ory
CD
4+
CD
95+
T c
ell
s
normal
A-T some ATM activity
A-T no ATM activity
0
25
50
75
100
p<0.001
% o
f cen
tral
mem
ory
CD
8+
T c
ell
s e
xp
ressin
g C
D95
normal
A-T some ATM activity
A-T no ATM activity
0
2000
4000
6000
p<0.01
p<0.001
CD
95 M
FI
of
cen
tral
mem
ory
CD
8+
CD
95+
T c
ell
s
normal
A-T some ATM activity
A-T no ATM activity
0
25
50
75
100
p<0.01
% o
f eff
ecto
r m
em
ory
CD
4+
T c
ell
s e
xp
ressin
g C
D95
normal
A-T some ATM activity
A-T no ATM activity
0
2500
5000
7500
10000 p<0.01
CD
95 M
FI
of
eff
ecto
r m
em
ory
CD
4+
CD
95+
T c
ell
s
normal
A-T some ATM activity
A-T no ATM activity
0
25
50
75
100
p<0.05
% o
f eff
ecto
r m
em
ory
CD
8+
T c
ell
s e
xp
ressin
g C
D95
normal
A-T some ATM activity
A-T no ATM activity
0
2000
4000
6000p<0.05
p<0.05
CD
95 M
FI
of
eff
ecto
r m
em
ory
CD
8+
CD
95+
T c
ell
s
C.
D.
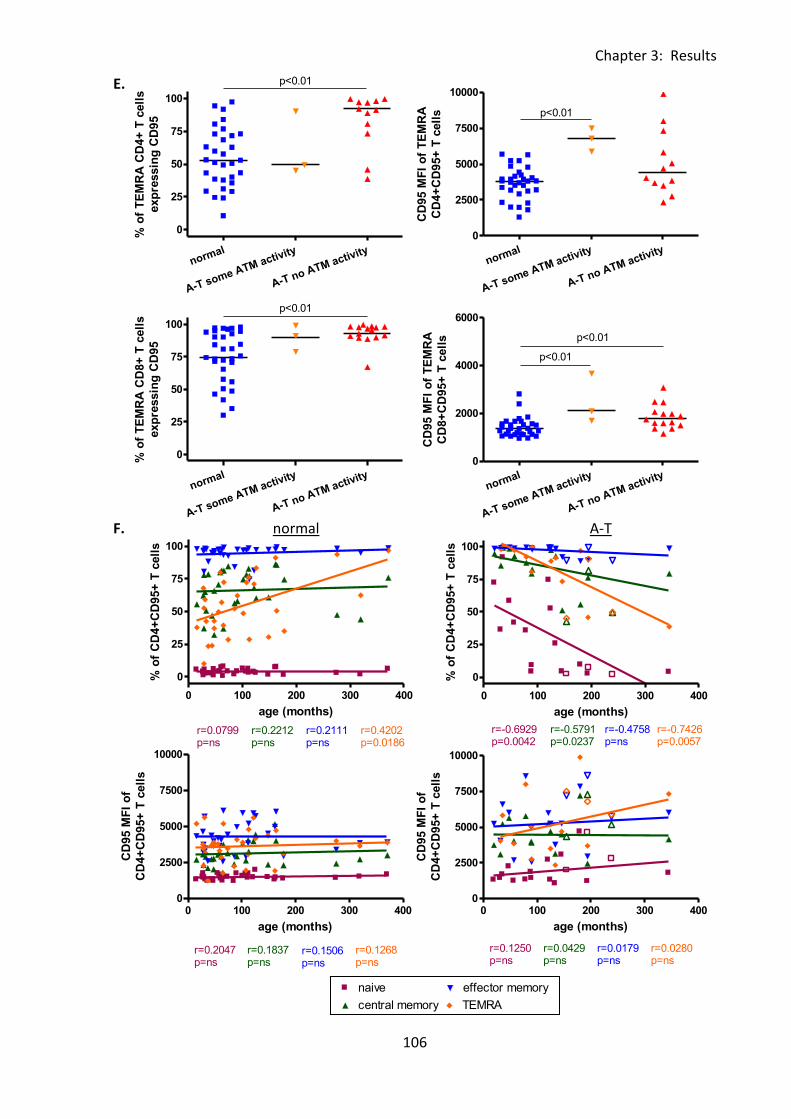
Chapter 3: Results
106
0 100 200 300 4000
2500
5000
7500
10000naive
central memory
effector memory
TEMRA
r=0.1250p=ns
r=0.0429p=ns
r=0.0179p=ns
r=0.2714p=ns
age (months)
CD
95 M
FI
of
CD
4+
CD
95+
T c
ell
s
0 100 200 300 400
0
25
50
75
100 naive
central memory
effector memory
TEMRA
r=0.0799p=ns
r=0.2212p=ns
r=0.2111p=ns
r=0.4202p=0.0186
age (months)
% o
f C
D4+
CD
95+
T c
ell
s
0 100 200 300 4000
2500
5000
7500
10000naive
central memory
effector memory
TEMRA
r=0.2047p=ns
r=0.1837p=ns
r=0.1506p=ns
r=0.1268p=ns
age (months)
CD
95 M
FI
of
CD
4+
CD
95+
T c
ell
s
normal
A-T some ATM activity
A-T no ATM activity
0
25
50
75
100
p<0.01
% o
f T
EM
RA
CD
4+
T c
ell
s
exp
ressin
g C
D95
normal
A-T some ATM activity
A-T no ATM activity
0
2500
5000
7500
10000
p<0.01
CD
95 M
FI
of
TE
MR
A
CD
4+
CD
95+
T c
ell
s
normal
A-T some ATM activity
A-T no ATM activity
0
25
50
75
100
p<0.01
% o
f T
EM
RA
CD
8+
T c
ell
s
exp
ressin
g C
D95
normal
A-T some ATM activity
A-T no ATM activity
0
2000
4000
6000
p<0.01
p<0.01
CD
95 M
FI
of
TE
MR
A
CD
8+
CD
95+
T c
ell
s
0 100 200 300 400
0
25
50
75
100 naivecentral memory
effector memory
TEMRA
r=-0.6929p=0.0042
r=-0.5791p=0.0237
r=-0.4758p=ns
r=-0.7426p=0.0057
age (months)
% o
f C
D4+
CD
95+
T c
ell
s
0 100 200 300 4000
2500
5000
7500
10000naive
central memory
effector memory
TEMRA
r=0.1250p=ns
r=0.0429p=ns
r=0.0179p=ns
r=0.0280p=ns
age (months)
CD
95 M
FI
of
CD
4+
CD
95+
T c
ell
s
E.
F. normal A-T
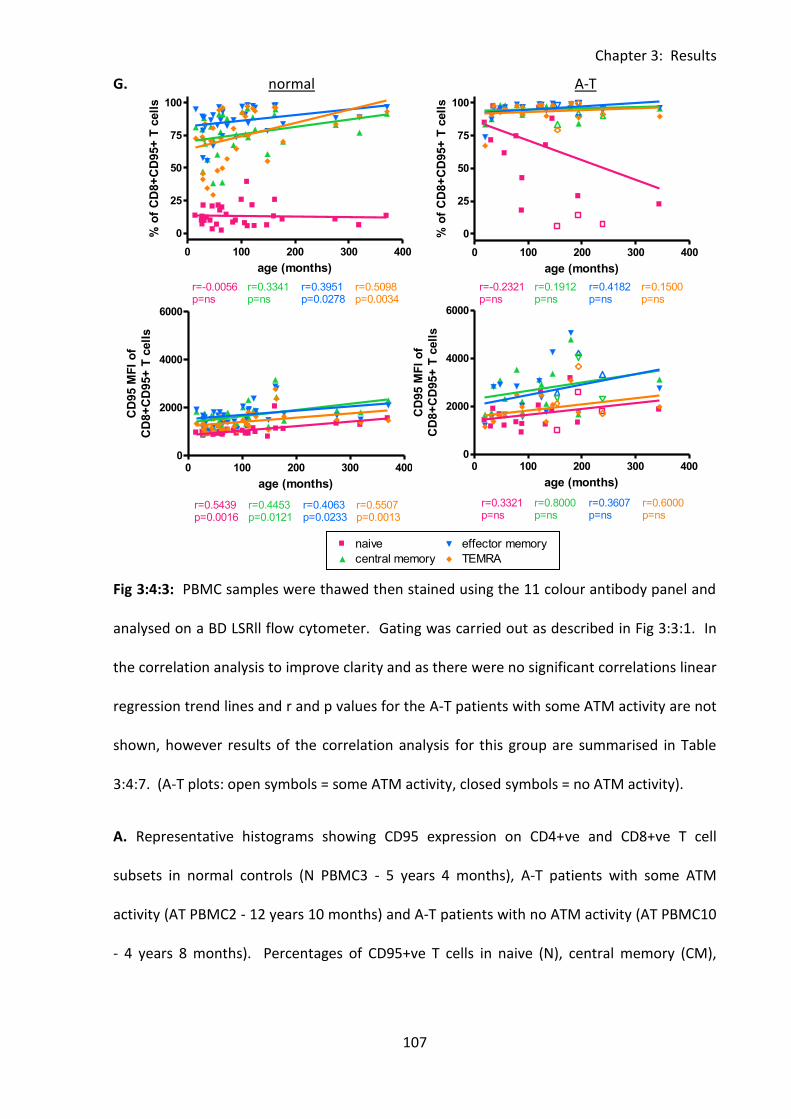
Chapter 3: Results
107
0 100 200 300 4000
2000
4000
6000naive
central memory
effector memory
TEMRA
r=0.3321p=ns
r=0.8000p=ns
r=0.3607p=ns
r=0.6000p=ns
age (months)
CD
95 M
FI
of
CD
8+
CD
95+
T c
ell
s
0 100 200 300 400
0
25
50
75
100 naive
central memory
effector memory
TEMRA
r=-0.0056p=ns
r=0.3341p=ns
r=0.5098p=0.0034
r=0.3951p=0.0278
age (months)
% o
f C
D8+
CD
95+
T c
ell
s
0 100 200 300 4000
2000
4000
6000naive
central memory
effector memory
TEMRA
r=0.5439p=0.0016
r=0.4453p=0.0121
r=0.4063p=0.0233
r=0.5507p=0.0013
age (months)
CD
95 M
FI
of
CD
8+
CD
95+
T c
ell
s
0 100 200 300 400
0
25
50
75
100 naive
central memory
effector memory
TEMRA
r=-0.2321p=ns
r=0.1912p=ns
r=0.4182p=ns
r=0.1500p=ns
age (months)
% o
f C
D8+
CD
95+
T c
ell
s
0 100 200 300 4000
2000
4000
6000naive
central memory
effector memory
TEMRA
r=0.3321p=ns
r=0.8000p=ns
r=0.3607p=ns
r=0.6000p=ns
age (months)
CD
95 M
FI
of
CD
8+
CD
95+
T c
ell
s
G. normal A-T
Fig 3:4:3: PBMC samples were thawed then stained using the 11 colour antibody panel and
analysed on a BD LSRll flow cytometer. Gating was carried out as described in Fig 3:3:1. In
the correlation analysis to improve clarity and as there were no significant correlations linear
regression trend lines and r and p values for the A-T patients with some ATM activity are not
shown, however results of the correlation analysis for this group are summarised in Table
3:4:7. (A-T plots: open symbols = some ATM activity, closed symbols = no ATM activity).
A. Representative histograms showing CD95 expression on CD4+ve and CD8+ve T cell
subsets in normal controls (N PBMC3 - 5 years 4 months), A-T patients with some ATM
activity (AT PBMC2 - 12 years 10 months) and A-T patients with no ATM activity (AT PBMC10
- 4 years 8 months). Percentages of CD95+ve T cells in naive (N), central memory (CM),
Chapter 3: Results
108
effector memory (EM) and TEMRA (T) subsets are shown. Plots represent an equal number
of events.
B. CD95 expression on naive CD4+ve and CD8+ve T cells as the percentage of naive CD4+ve
and CD8+ve T cells that express CD95 and the CD95 MFI of naive CD4+CD95+ and
CD8+CD95+ T cells.
C. CD95 expression on central memory CD4+ve and CD8+ve T cells as the percentage of
central memory CD4+ve and CD8+ve T cells that express CD95 and the CD95 MFI of central
memory CD4+CD95+ and CD8+CD95+ T cells.
D. CD95 expression on effector memory CD4+ and CD8+ T cells as the percentage of effector
memory CD4+ve and CD8+ve T cells that express CD95 and the CD95 MFI of effector
memory CD4+CD95+ and CD8+CD95+ T cells.
E. CD95 expression on TEMRA CD4+ T cells as the percentage of TEMRA CD4+ve and CD8+ve
T cells that express CD95 and the CD95 MFI of TEMRA CD4+CD95+ and CD8+CD95+ T cells.
As the number of CD4+ve TEMRA cells was very low samples with less than 20 TEMRA cell
events were excluded from the analysis.
F. There was a significant positive correlation between the percentage of CD4+CD95+
TEMRA cells and age in normal controls (top left). However in A-T patients with no ATM
activity there were significant negative correlations between percentages of CD4+CD95+
naive, central memory and TEMRA cells and age (top right). Neither normal nor A-T samples
showed any correlation between CD95 MFI of CD95+ cells in CD4+ T cell subsets and age
(bottom left and right).
G. There were significant correlations between the percentages of CD95+ve effector
memory and TEMRA T cells and age in normal controls (top left) but no correlations in A-T
patients (top right). In normal controls there were also significant correlations between
Chapter 3: Results
109
CD95 MFI and age on all CD8+ve T cell subsets (bottom left), but no correlations in A-T
patients (bottom right).
Chapter 3: Results
110
3:4:4: CD95 expression on naive and memory B cells.
CD95 expression on naive and memory B cells was also analysed (Fig 3:4:4A). Unsurprisingly
as CD95 upregulation is associated with activation (reviewed in (Mizuno et al., 2003))
expression on B cells in the normal controls was much higher on the memory (Fig 3:4:4C)
than the naive subset (Fig 3:4:4B); a median of 45% of memory B cells were CD95+ve
compared to a median of 5.2% of naive B cells.
The B cell results were similar to that of T cells in that there was significantly higher
expression of CD95 on both naive (Fig 3:4:4B) and memory B cells (Fig 3:4:4C) in the A-T
patients with no ATM activity compared to normal controls. This applied to both the
percentage (naive p<0.001, memory p<0.05) and CD95 MFI of CD95+ cells (naive p<0.05,
memory p<0.01). There were no significant differences in CD95 expression on naive and
memory B cells between A-T patients with some ATM activity and either normal controls or
A-T patients with no ATM activity.
Interestingly, analysis of correlations between CD95 expression on B cells and age showed a
positive correlation with the percentage of CD95+ memory B cells in the normal controls and
a negative correlation in the A-T patients with no ATM activity. There was no correlation
between the percentage of naive CD95+ve B cells and age or CD95 MFI of CD8+CD95+ naive
or memory B cells in either group (Fig 3:4:4D).
As the increased CD95 expression on B cells from A-T patients with no ATM activity applies
to both naive and memory B cells it cannot be simply a consequence of the increased
proportion of memory B cells in A-T patients with no ATM activity compared to normal
controls (Fig 3:3:5B).
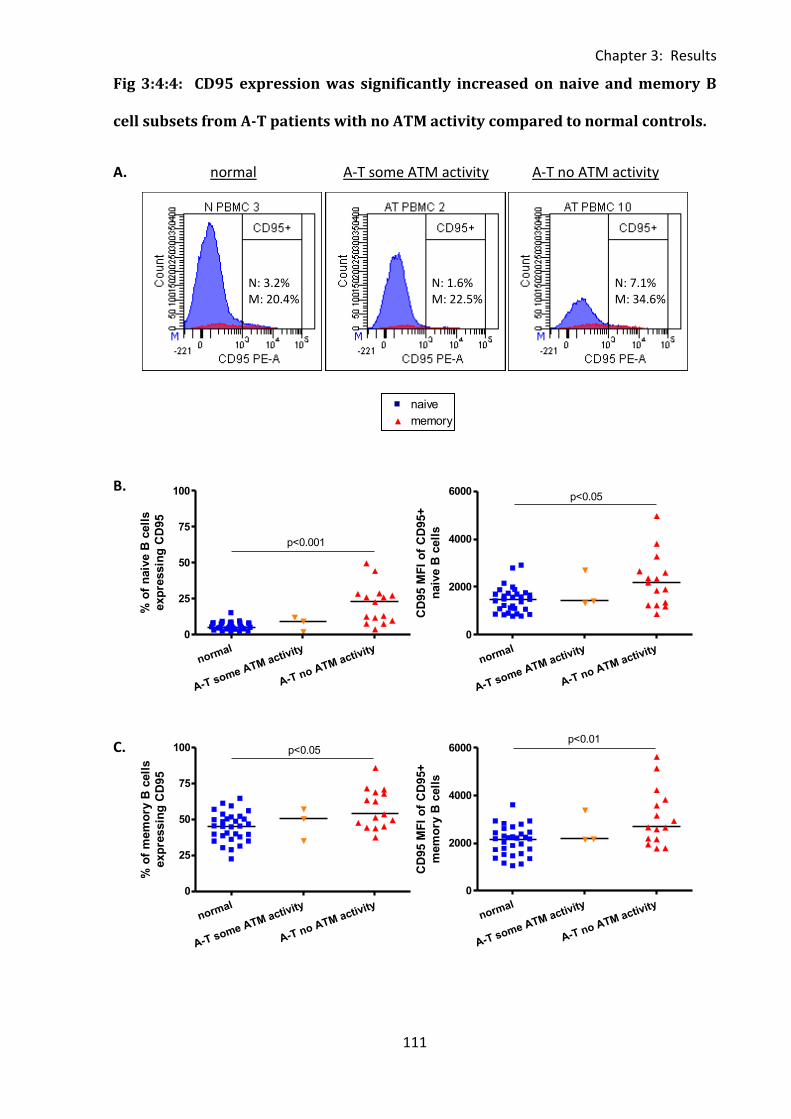
Chapter 3: Results
111
0 100 200 300 4000
25
50
75
100naive
memory
r=0.1957p=ns
r=0.4143p=0.0165
age (months)
% o
f C
D95+
B c
ell
s
normal
A-T some ATM activity
A-T no ATM activity
0
25
50
75
100
p<0.001
% o
f n
aiv
e B
cell
s
exp
ressin
g C
D95
normal
A-T some ATM activity
A-T no ATM activity
0
2000
4000
6000p<0.05
CD
95 M
FI
of
CD
95+
naiv
e B
cell
s
normal
A-T some ATM activity
A-T no ATM activity
0
25
50
75
100 p<0.05
% o
f m
em
ory
B c
ell
s
exp
ressin
g C
D95
normal
A-T some ATM activity
A-T no ATM activity
0
2000
4000
6000p<0.01
CD
95 M
FI
of
CD
95+
mem
ory
B c
ell
s
Fig 3:4:4: CD95 expression was significantly increased on naive and memory B
cell subsets from A-T patients with no ATM activity compared to normal controls.
A. normal A-T some ATM activity A-T no ATM activity
B.
C.
N: 3.2% M: 20.4%
N: 1.6% M: 22.5%
N: 7.1% M: 34.6%
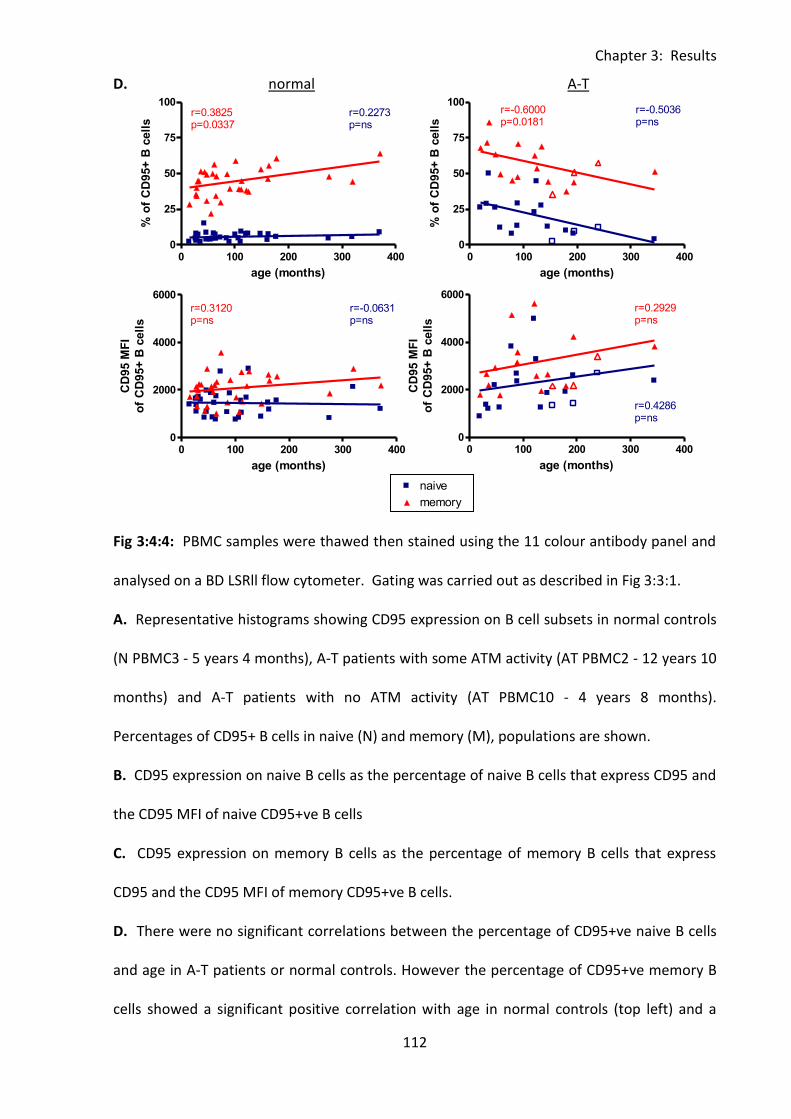
Chapter 3: Results
112
0 100 200 300 4000
25
50
75
100naive
memory
r=0.1957p=ns
r=0.4143p=0.0165
age (months)
% o
f C
D95+
B c
ell
s
0 100 200 300 4000
25
50
75
100naive
memory
r=0.2273p=ns
r=0.3825p=0.0337
age (months)
% o
f C
D95+
B c
ell
s
0 100 200 300 4000
2000
4000
6000naive
memoryr=-0.0631p=ns
r=0.3120p=ns
age (months)
CD
95 M
FI
of
CD
95+
B c
ell
s
0 100 200 300 4000
25
50
75
100naive
memory
r=-0.5036p=ns
r=-0.6000p=0.0181
age (months)
% o
f C
D95+
B c
ell
s
0 100 200 300 4000
2000
4000
6000naive
memory
r=0.4286p=ns
r=0.2929p=ns
age (months)
CD
95 M
FI
of
CD
95+
B c
ell
s
D. normal A-T
Fig 3:4:4: PBMC samples were thawed then stained using the 11 colour antibody panel and
analysed on a BD LSRll flow cytometer. Gating was carried out as described in Fig 3:3:1.
A. Representative histograms showing CD95 expression on B cell subsets in normal controls
(N PBMC3 - 5 years 4 months), A-T patients with some ATM activity (AT PBMC2 - 12 years 10
months) and A-T patients with no ATM activity (AT PBMC10 - 4 years 8 months).
Percentages of CD95+ B cells in naive (N) and memory (M), populations are shown.
B. CD95 expression on naive B cells as the percentage of naive B cells that express CD95 and
the CD95 MFI of naive CD95+ve B cells
C. CD95 expression on memory B cells as the percentage of memory B cells that express
CD95 and the CD95 MFI of memory CD95+ve B cells.
D. There were no significant correlations between the percentage of CD95+ve naive B cells
and age in A-T patients or normal controls. However the percentage of CD95+ve memory B
cells showed a significant positive correlation with age in normal controls (top left) and a
Chapter 3: Results
113
significant negative correlation with age in A-T patient with no ATM activity (top right).
There were no significant correlations between CD95 MFI and age on CD95+ve naive or
memory B cells in either group (bottom left and right). To improve clarity and as there were
no significant correlations linear regression trend lines and r and p values for the A-T
patients with some ATM activity are not shown, however results of the correlation analysis
for this group are summarised in Table 3:4:6. (A-T plots: open symbols = some ATM activity,
closed symbols = no ATM activity).
Chapter 3: Results
114
3:4:5: CD95 expression on CD56dim and CD56bright NK cells.
Finally CD95 expression on CD56bright and CD56dim NK cells was analysed (Fig 3:4:5A).
Consistent with the findings on T and B cells, the more highly differentiated cytotoxic
CD56dim NK cells expressed higher levels of CD95 than the less differentiated cytokine
producing CD56bright NK cells (Fig 3:4:5B&C). In the normal controls a median percentage
of 42.2% of CD56dim NK cells expressed CD95 compared to 20.2% of CD56bright NK cells.
There was no significant difference in either the percentage or CD95 MFI of CD95+ve
CD56bright or CD56dim NK cells between A-T patients and normal controls (Fig 3:4:5B&C).
There was also no correlation between CD95 expression and age in any of the groups (Fig
3:4:5D).
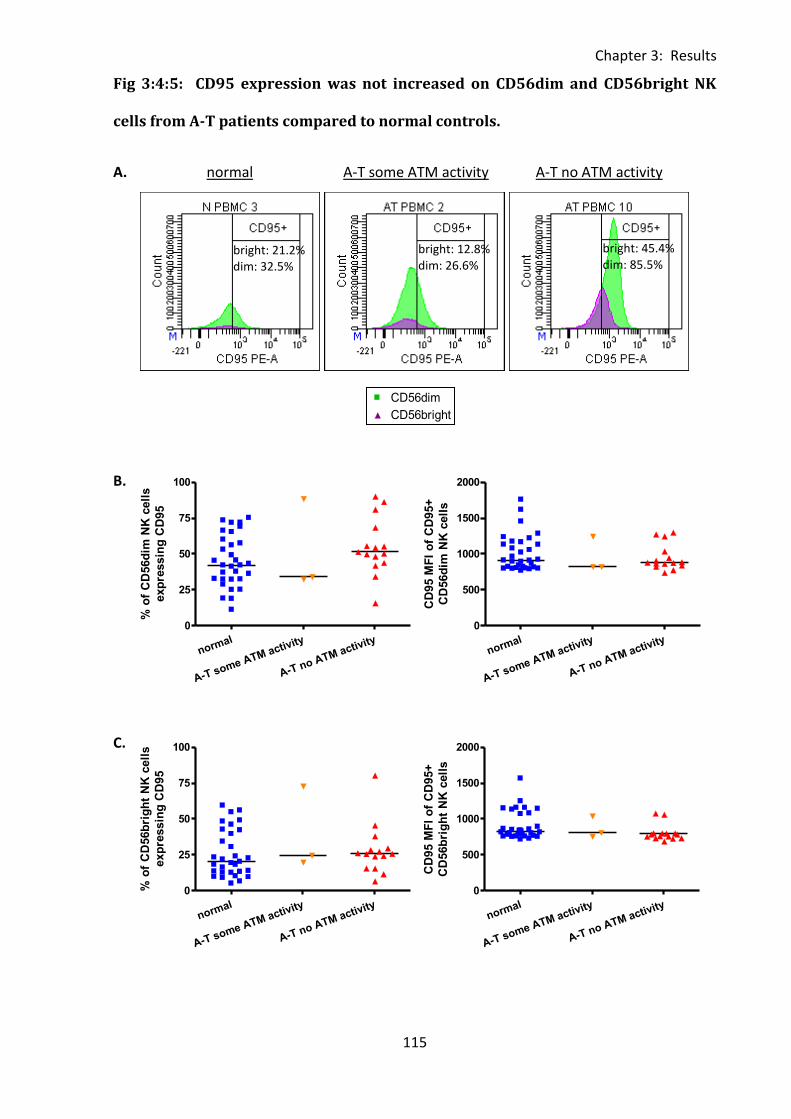
Chapter 3: Results
115
0 100 200 300 4000
500
1000
1500
2000CD56dim
CD56bright
r=0.1262p=ns
r=0.1790p=ns
age (months)
CD
95 M
FI
of
CD
95+
NK
cell
s
normal
A-T some ATM activity
A-T no ATM activity
0
25
50
75
100
% o
f C
D56d
im N
K c
ell
s
exp
ressin
g C
D95
normal
A-T some ATM activity
A-T no ATM activity
0
500
1000
1500
2000
CD
95 M
FI
of
CD
95+
CD
56d
im N
K c
ell
s
normal
A-T some ATM activity
A-T no ATM activity
0
25
50
75
100
% o
f C
D56b
rig
ht
NK
cell
s
exp
ressin
g C
D95
normal
A-T some ATM activity
A-T no ATM activity
0
500
1000
1500
2000
CD
95 M
FI
of
CD
95+
CD
56b
rig
ht
NK
cell
s
Fig 3:4:5: CD95 expression was not increased on CD56dim and CD56bright NK
cells from A-T patients compared to normal controls.
A. normal A-T some ATM activity A-T no ATM activity
B.
C.
bright: 21.2% dim: 32.5%
bright: 12.8% dim: 26.6%
bright: 45.4% dim: 85.5%
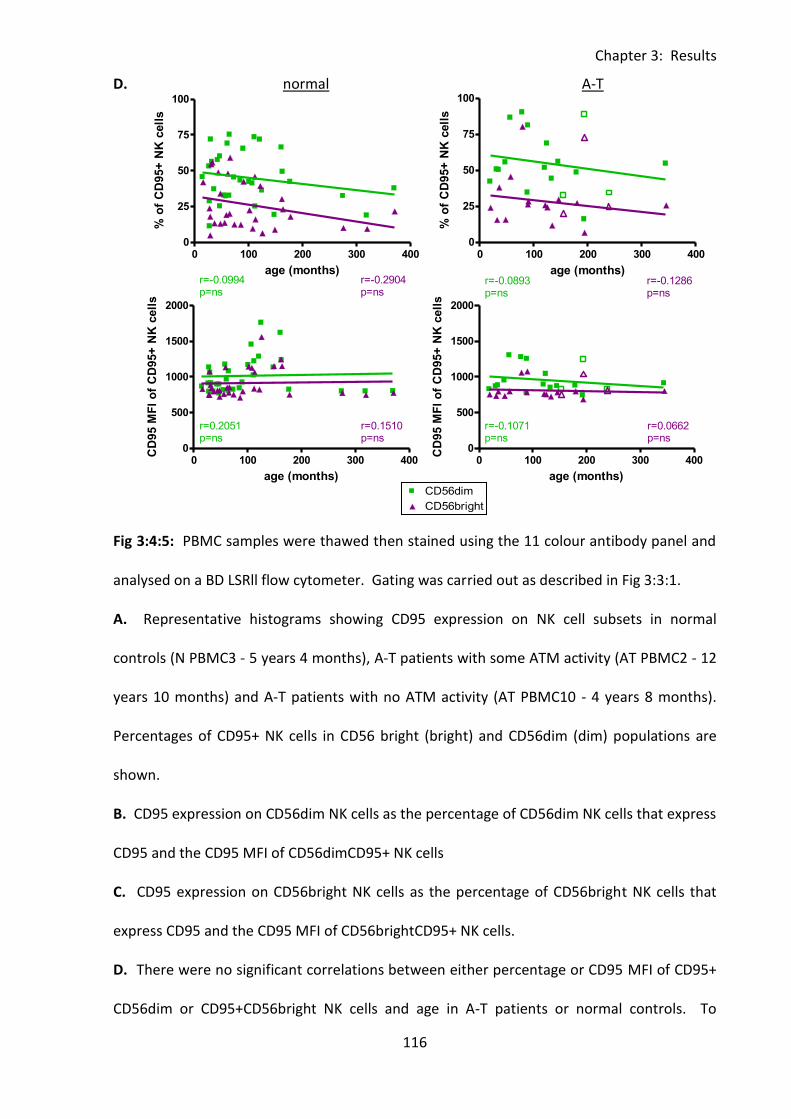
Chapter 3: Results
116
0 100 200 300 4000
500
1000
1500
2000CD56dim
CD56bright
r=0.1262p=ns
r=0.1790p=ns
age (months)
CD
95 M
FI
of
CD
95+
NK
cell
s
0 100 200 300 4000
25
50
75
100CD56dim
CD56bright
r=-0.0994p=ns
r=-0.2904p=ns
age (months)
% o
f C
D95+
NK
cell
s
0 100 200 300 4000
500
1000
1500
2000CD56dim
CD56bright
r=0.2051p=ns
r=0.1510p=ns
age (months)
CD
95 M
FI
of
CD
95+
NK
cell
s
0 100 200 300 4000
25
50
75
100CD56dim
Legend
CD56bright
Legend
r=-0.0893p=ns
r=-0.1286p=ns
age (months)
% o
f C
D95+
NK
cell
s
0 100 200 300 4000
500
1000
1500
2000CD56dim
Legend
CD56bright
Legend
r=-0.1071p=ns
r=0.0662p=ns
age (months)
CD
95 M
FI
of
CD
95+
NK
cell
s
D. normal A-T
Fig 3:4:5: PBMC samples were thawed then stained using the 11 colour antibody panel and
analysed on a BD LSRll flow cytometer. Gating was carried out as described in Fig 3:3:1.
A. Representative histograms showing CD95 expression on NK cell subsets in normal
controls (N PBMC3 - 5 years 4 months), A-T patients with some ATM activity (AT PBMC2 - 12
years 10 months) and A-T patients with no ATM activity (AT PBMC10 - 4 years 8 months).
Percentages of CD95+ NK cells in CD56 bright (bright) and CD56dim (dim) populations are
shown.
B. CD95 expression on CD56dim NK cells as the percentage of CD56dim NK cells that express
CD95 and the CD95 MFI of CD56dimCD95+ NK cells
C. CD95 expression on CD56bright NK cells as the percentage of CD56bright NK cells that
express CD95 and the CD95 MFI of CD56brightCD95+ NK cells.
D. There were no significant correlations between either percentage or CD95 MFI of CD95+
CD56dim or CD95+CD56bright NK cells and age in A-T patients or normal controls. To
Chapter 3: Results
117
improve clarity and as there were no significant correlations linear regression trend lines and
r and p values for the A-T patients with some ATM are not shown, however results of the
correlation analysis for this group are summarised in Table 3:4:6. (A-T plots: open symbols =
some ATM activity, closed symbols = no ATM activity).
Chapter 3: Results
118
3:4:6: CD95 expression was significantly increased on A-T lymphocytes compared
to normal controls.
The results described in section 3:4 including significant differences between the expression
of CD95 (percentage and CD95 MFI of CD95+ve cells) and significant correlations between
CD95 expression and age in A-T patients with and without ATM activity and normal controls
are summarised in Table 3:4:6.
The percentage of CD95+ve cells of every subset with the exception of total NK cells and NK
cell subsets was significantly increased in A-T patients with no ATM activity compared to
normal controls. On most lymphocyte subsets there was no significant difference between
the percentage of CD95+ve cells in A-T patients with some ATM activity compared to normal
controls or A-T patients with no ATM activity. However the A-T patients with some ATM
activity did have significantly lower percentages of CD95+ naive CD4+ and CD8+ T cells and
CD4+ central memory T cells than A-T patients with no ATM activity.
The CD95 MFI of CD95+ve cells in every subset with the exception of total NK cells and NK
cell subsets was significantly lower in the normal controls than in either one or both of the
groups of A-T patients.
In general CD95 expression in the normal controls increased with age, there were positive
correlations between the percentages of CD95+ T cells, CD4+ T cells, CD8+ T cells, CD8+
effector memory T cells, CD4+ and CD8+ TEMRA T cells, total and memory B cells and NKT
cells and age. The CD95 MFI of CD95+ T cells, CD8+ T cells and subsets and NKT cells also
correlated positively with age. In the A-T patients with no ATM activity the percentages of
CD95+CD4+ total, naive, central memory and TEMRA T cells and memory B cells correlated
negatively with age and the CD95 MFI of CD95+CD8+ T cells correlated positively with age.
Chapter 3: Results
119
The A-T patients with some ATM activity showed no correlations between percentage or
CD95 MFI of CD95+ cells and age.
It was interesting that NK cells were the only lymphocyte subset on which CD95 expression
was not increased in A-T patients with no ATM activity compared to normal controls. The
percentage of NK cells was increased in A-T patients with no ATM activity (Fig 3:3:2A) but
there were deficiencies in T and B cells, particularly naive cells, and CD95 expression was
increased on all T cell and B cell subsets, with the greatest increase on the naive cells. These
findings are consistent with the hypothesis that increased CD95 expression on A-T patient’s
lymphocytes increases their sensitivity to CD95-mediated and spontaneous apoptosis and
contributes to their lymphopenia.
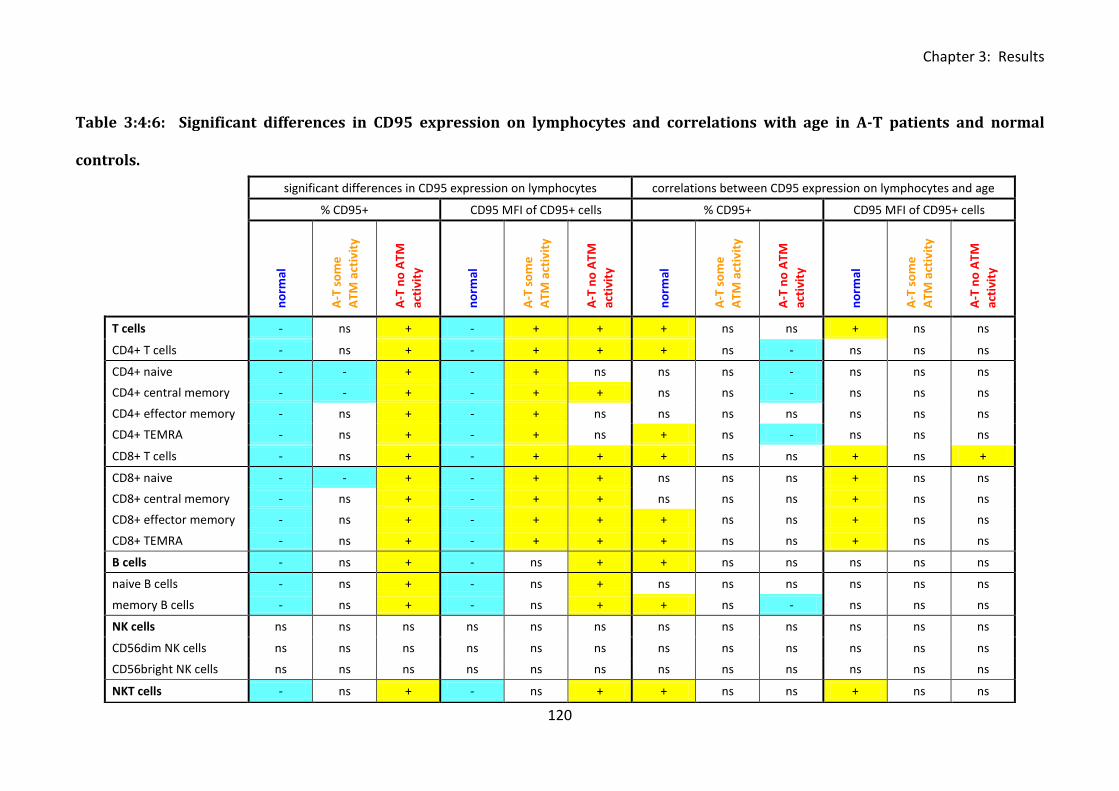
Chapter 3: Results
120
Table 3:4:6: Significant differences in CD95 expression on lymphocytes and correlations with age in A-T patients and normal
con
trol
s.
significant differences in CD95 expression on lymphocytes correlations between CD95 expression on lymphocytes and age
% CD95+ CD95 MFI of CD95+ cells % CD95+ CD95 MFI of CD95+ cells
n
orm
al
A-T
so
me
ATM
act
ivit
y
A-T
no
ATM
acti
vity
no
rmal
A-T
so
me
ATM
act
ivit
y
A-T
no
ATM
acti
vity
no
rmal
A-T
so
me
ATM
act
ivit
y
A-T
no
ATM
acti
vity
no
rmal
A-T
so
me
ATM
act
ivit
y
A-T
no
ATM
acti
vity
T cells - ns + - + + + ns ns + ns ns
CD4+ T cells - ns + - + + + ns - ns ns ns
CD4+ naive - - + - + ns ns ns - ns ns ns
CD4+ central memory - - + - + + ns ns - ns ns ns
CD4+ effector memory - ns + - + ns ns ns ns ns ns ns
CD4+ TEMRA - ns + - + ns + ns - ns ns ns
CD8+ T cells - ns + - + + + ns ns + ns +
CD8+ naive - - + - + + ns ns ns + ns ns
CD8+ central memory - ns + - + + ns ns ns + ns ns
CD8+ effector memory - ns + - + + + ns ns + ns ns
CD8+ TEMRA - ns + - + + + ns ns + ns ns
B cells - ns + - ns + + ns ns ns ns ns
naive B cells - ns + - ns + ns ns ns ns ns ns
memory B cells - ns + - ns + + ns - ns ns ns
NK cells ns ns ns ns ns ns ns ns ns ns ns ns
CD56dim NK cells ns ns ns ns ns ns ns ns ns ns ns ns
CD56bright NK cells ns ns ns ns ns ns ns ns ns ns ns ns
NKT cells - ns + - ns + + ns ns + ns ns
controls.
Chapter 3: Results
121
Table 3:4:6: Summary of significant differences between the expression of CD95 on
lymphocytes (percentage and CD95 MFI of CD95+ve cells) and significant correlations
between CD95 expression and age in A-T patients and normal controls.
In the first part of the table (significant differences in CD95 expression on lymphocytes) cells
containing a positive symbol (+) and highlighted in yellow indicate a significantly higher
percentage or CD95 MFI of CD95+ve cells of the particular cell type in the corresponding
group than in the group with a cell containing a negative symbol (-) and highlighted in blue,
‘ns’ refers to no significant difference with any group. The second part of the table
summarises significant correlations between CD95 expression and age. Yellow (+) cells
indicate a positive correlation and blue (-) cells indicate a negative correlation, ‘ns’ indicates
no significant correlation.
Chapter 3: Results
122
3:5: FasL expression.
3:5:1: FasL expression on lymphocyte subsets.
CD95-mediated apoptosis can occur spontaneously due to overexpression of the receptor (in
the absence of ligand) (Le Clorennec et al., 2008), or can be activated by binding of Fas
ligand to CD95 on the surface of the target cell. Therefore the expression of Fas ligand on
lymphocytes from A-T patients and normal controls was also analysed.
FasL is upregulated on T cells in response to activation (Latinis et al., 1997). According to the
majority of the published literature FasL expression is restricted to activated T cells,
activated NK cells (Wallin et al., 2003), certain tumour cells (Hahne et al., 1996b;O'Connell et
al., 1996;Wallin et al., 2003;Xerri et al., 1997) and non-immune cells in immune privileged
sites such as the eye and testis (Griffith et al., 1995). However, I also found expression of
FasL on B cells and NKT cells from A-T patients and normal controls. As there was no
background staining when FasL was replaced in the panel with the appropriate isotype
control (all minus FasL plus isotype), this staining appeared to be genuine (Fig 3:5:1A).
There was no significant difference between the percentages of FasL+ve T cells, B cells, NK
cells or NKT cells in the normal controls and A-T patients with no ATM activity (Fig 3:5:1B-E).
However the percentage of FasL+ T cells was significantly higher in the A-T patients with
some ATM activity than the normal controls (p<0.05) (Fig 3:5:1B) and the percentage of
FasL+ NK cells was significantly higher in A-T patients with some ATM activity than the other
two groups (normal controls - p<0.05, A-T patients with some ATM activity - p<0.05) (Fig
3:5:1D).
The FasL MFI of FasL+ve T cells was significantly higher in A-T patients with some ATM
activity than A-T patients with no ATM activity (p<0.05) or normal controls (p<0.05) (Fig
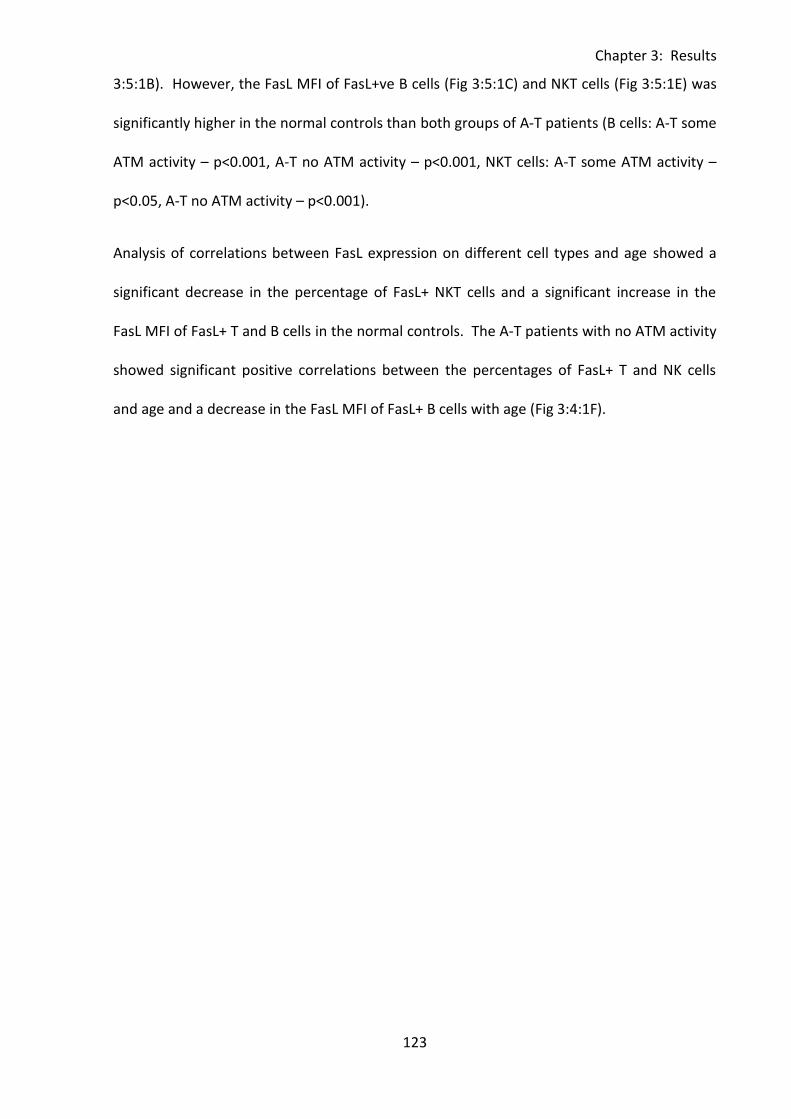
Chapter 3: Results
123
3:5:1B). However, the FasL MFI of FasL+ve B cells (Fig 3:5:1C) and NKT cells (Fig 3:5:1E) was
significantly higher in the normal controls than both groups of A-T patients (B cells: A-T some
ATM activity – p<0.001, A-T no ATM activity – p<0.001, NKT cells: A-T some ATM activity –
p<0.05, A-T no ATM activity – p<0.001).
Analysis of correlations between FasL expression on different cell types and age showed a
significant decrease in the percentage of FasL+ NKT cells and a significant increase in the
FasL MFI of FasL+ T and B cells in the normal controls. The A-T patients with no ATM activity
showed significant positive correlations between the percentages of FasL+ T and NK cells
and age and a decrease in the FasL MFI of FasL+ B cells with age (Fig 3:4:1F).
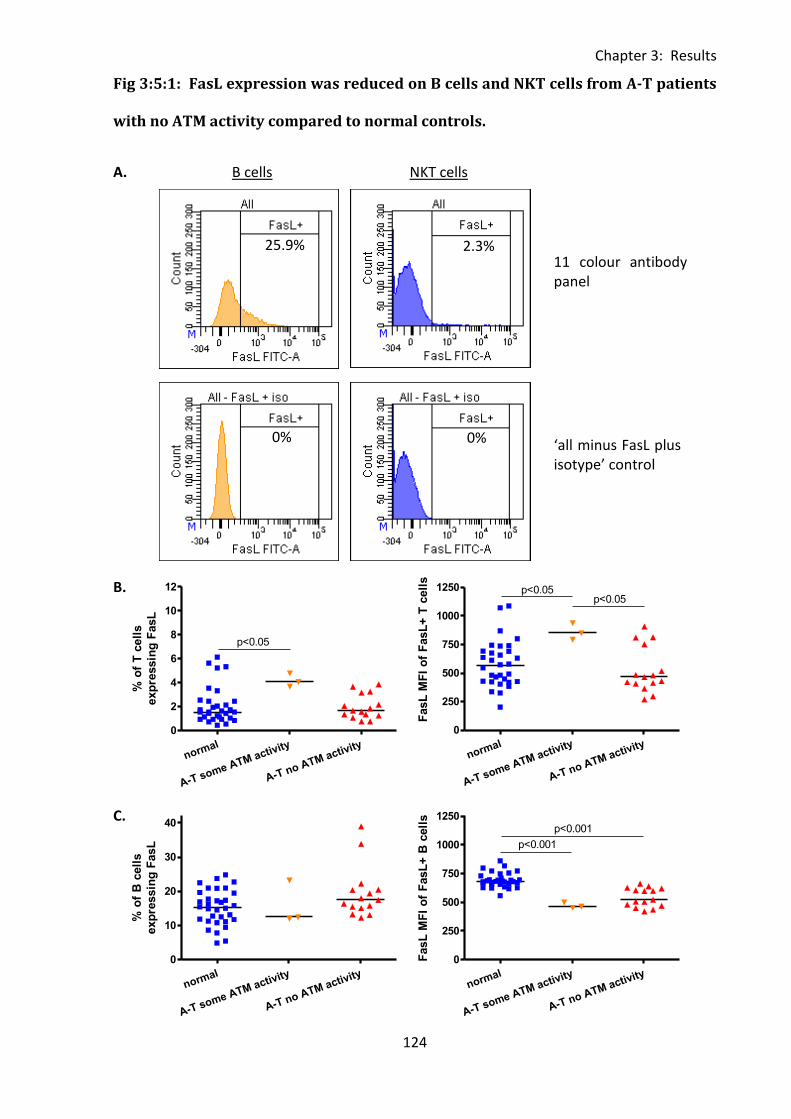
Chapter 3: Results
124
normal
A-T some ATM activity
A-T no ATM activity
0
2
4
6
8
10
12
p<0.05
% o
f T
cell
s
exp
ressin
g F
asL
normal
A-T some ATM activity
A-T no ATM activity
0
250
500
750
1000
1250p<0.05
p<0.05
FasL
MF
I o
f F
asL
+ T
cell
s
normal
A-T some ATM activity
A-T no ATM activity
0
10
20
30
40
% o
f B
cell
s
exp
ressin
g F
asL
normal
A-T some ATM activity
A-T no ATM activity
0
250
500
750
1000
1250p<0.001
p<0.001
FasL
MF
I o
f F
asL
+ B
cell
s
Fig 3:5:1: FasL expression was reduced on B cells and NKT cells from A-T patients
with no ATM activity compared to normal controls.
A. B cells NKT cells
B.
C.
25.9%
0%
11 colour antibody panel
‘all minus FasL plus isotype’ control
0%
2.3%
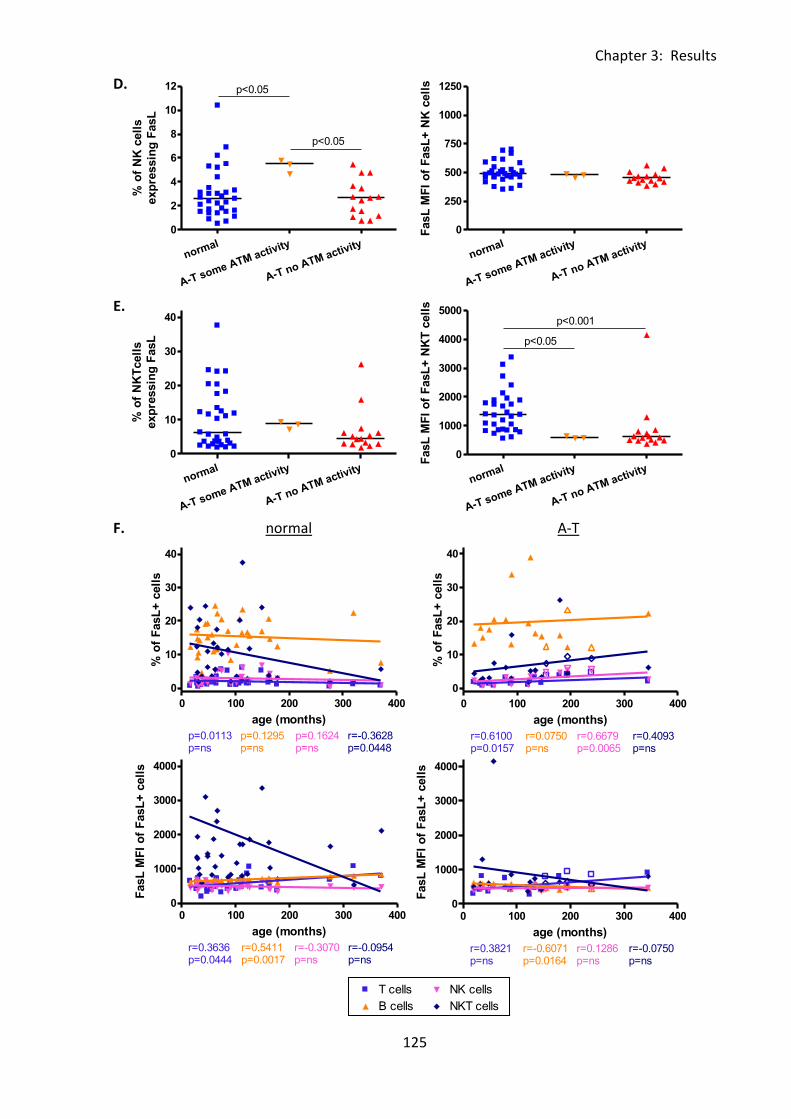
Chapter 3: Results
125
0 100 200 300 4000
25
50
75
100T cells
B cells
NK cells
NKT cells
r=0.5955p=0.0003
r=0.3191p=ns
r=-0.0972p=ns
r=0.4498p=0.0086
age (months)
% o
f C
D95+
cell
s
0 100 200 300 400
0
10
20
30
40 T cells
B cells
NK cells
NKT cells
p=0.0113p=ns
p=0.1295p=ns
p=0.1624p=ns
r=-0.3628p=0.0448
age (months)
% o
f F
asL
+ c
ell
s
0 100 200 300 4000
1000
2000
3000
4000 T cells
B cells
NK cells
NKT cells
r=0.3636p=0.0444
r=0.5411p=0.0017
r=-0.3070p=ns
r=-0.0954p=ns
age (months)
FasL
MF
I o
f F
asL
+ c
ell
s
normal
A-T some ATM activity
A-T no ATM activity
0
2
4
6
8
10
12 p<0.05
p<0.05%
of
NK
cell
s
exp
ressin
g F
asL
normal
A-T some ATM activity
A-T no ATM activity
0
250
500
750
1000
1250
FasL
MF
I o
f F
asL
+ N
K c
ell
s
normal
A-T some ATM activity
A-T no ATM activity
0
10
20
30
40
% o
f N
KT
cell
s
exp
ressin
g F
asL
normal
A-T some ATM activity
A-T no ATM activity
0
1000
2000
3000
4000
5000p<0.001
p<0.05
FasL
MF
I o
f F
asL
+ N
KT
cell
s
0 100 200 300 400
0
10
20
30
40 T cells
Legend
B cells
Legend
NK cells
Legend
NKT cells
Legend
r=0.6100p=0.0157
r=0.0750p=ns
r=0.6679p=0.0065
r=0.4093p=ns
age (months)
% o
f F
asL
+ c
ell
s
0 100 200 300 4000
1000
2000
3000
4000 T cells
Legend
B cells
Legend
NK cells
Legend
NKT cells
Legend
r=0.3821p=ns
r=-0.6071p=0.0164
r=0.1286p=ns
r=-0.0750p=ns
age (months)
FasL
MF
I o
f F
asL
+ c
ell
s
D.
E.
F. normal A-T
Chapter 3: Results
126
Fig 3:5:1: PBMC samples were thawed then stained using the 11 colour antibody panel and
analysed on a BD LSRll flow cytometer. Gating was carried out as described in Fig 3:3:1.
A. Example plots showing FasL+ve B cells and NKT cells in a normal control sample (N
PBMC31). The top row shows the result obtained from staining with the complete 11 colour
antibody panel and the bottom row shows the ‘all minus FasL plus isotype’ control.
B. FasL expression on T cells as the percentage of T cells that express FasL and the FasL MFI
of FasL+ve T cells.
C. FasL expression on B cells as the percentage of B cells that express FasL and the FasL MFI
of FasL+ve B cells.
D. FasL expression on NK cells as the percentage of NK cells that express FasL and the FasL
MFI of FasL+ve NK cells.
E. FasL expression on NKT cells as the percentage of NKT cells that express FasL and the FasL
MFI of FasL+ve NKT cells.
F. There was a significant negative correlation between age and the percentage of FasL+ve
NKT cells in normal controls (top left) and positive correlations with the percentages of
FasL+ve T cells and NK cells in the A-T patients with no ATM activity (top right). There were
also positive correlations between age and the FasL MFI of FasL+ve B and T cells in normal
controls (bottom left) and a negative correlation with FasL MFI of FasL+ve B cells in A-T
patients with no ATM activity (bottom right). To improve clarity and as there were no
significant correlations linear regression trend lines and r and p values for the A-T patients
with some ATM activity are not shown, however results for this group are summarised in
Table 3:5:6. (A-T plots: open symbols = some ATM activity, closed symbols = no ATM
activity).
Chapter 3: Results
127
3:5:2: Fas Ligand expression on CD4+ and CD8+ T cells.
Unsurprisingly, as FasL is expressed only on activated T cells the percentages of FasL+CD4+
and FasL+CD8+ T cells in the normal controls were very low (median of 1.5% of CD4+ve and
1.8% of CD8+ve T cells) (Fig 3:5:2A-C). There was no significant difference between the
percentages of CD4+FasL+ (Fig 3:5:2B) or CD8+FasL+ T cells (Fig 3:5:2C) in the normal
controls and A-T patients with no ATM activity. However the FasL MFI of both CD4+FasL+
and CD8+FasL+ T cells in the normal controls was significantly higher than in A-T patients
with no ATM activity (CD4+ p<0.001, CD8+ p<0.01). There was a significantly higher
percentage of both CD4+FasL+ (p<0.05) and CD8+FasL+ T cells (p<0.05) in A-T patients with
some ATM activity compared to normal controls but no difference in FasL expression
between the two groups of A-T patients.
Interestingly, although there was no correlation between FasL expression on CD4+ or CD8+ T
cells and age in the normal controls, the percentages of both CD4+FasL+ and CD8+FasL+ T
cells increased significantly with age in the A-T patients with no ATM activity (Fig 3:5:2D).
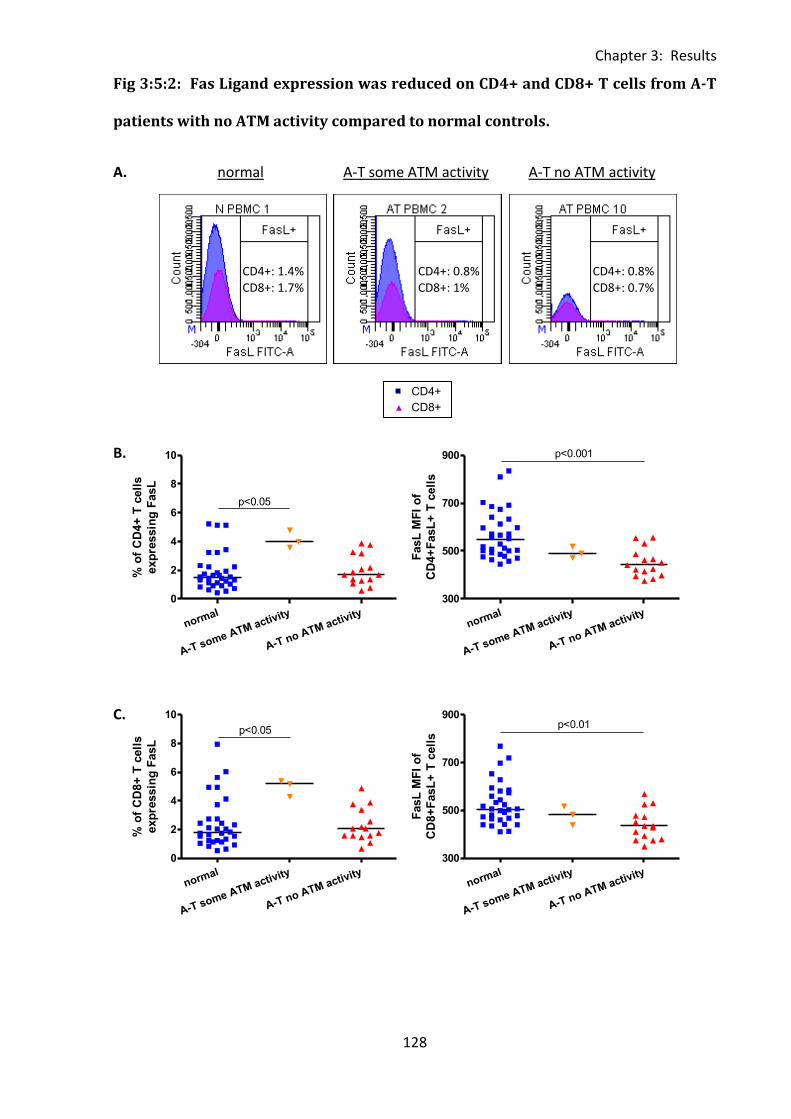
Chapter 3: Results
128
0 100 200 300 400300
500
700
900CD4+
CD8+
r=-0.0871p=ns
r=-0.0425p=ns
normal
FasL
MF
I o
f F
asL
+ T
cell
s
normal
A-T some ATM activity
A-T no ATM activity
0
2
4
6
8
10
p<0.05
% o
f C
D4+
T c
ell
s
exp
ressin
g F
asL
normal
A-T some ATM activity
A-T no ATM activity
300
500
700
900 p<0.001
FasL
MF
I o
f
CD
4+
FasL
+ T
cell
s
normal
A-T some ATM activity
A-T no ATM activity
0
2
4
6
8
10
p<0.05
% o
f C
D8+
T c
ell
s
exp
ressin
g F
asL
normal
A-T some ATM activity
A-T no ATM activity
300
500
700
900p<0.01
FasL
MF
I o
f
CD
8+
FasL
+ T
cell
s
Fig 3:5:2: Fas Ligand expression was reduced on CD4+ and CD8+ T cells from A-T
patients with no ATM activity compared to normal controls.
A. normal A-T some ATM activity A-T no ATM activity
B.
C.
CD4+: 1.4% CD8+: 1.7%
CD4+: 0.8% CD8+: 1%
CD4+: 0.8% CD8+: 0.7%
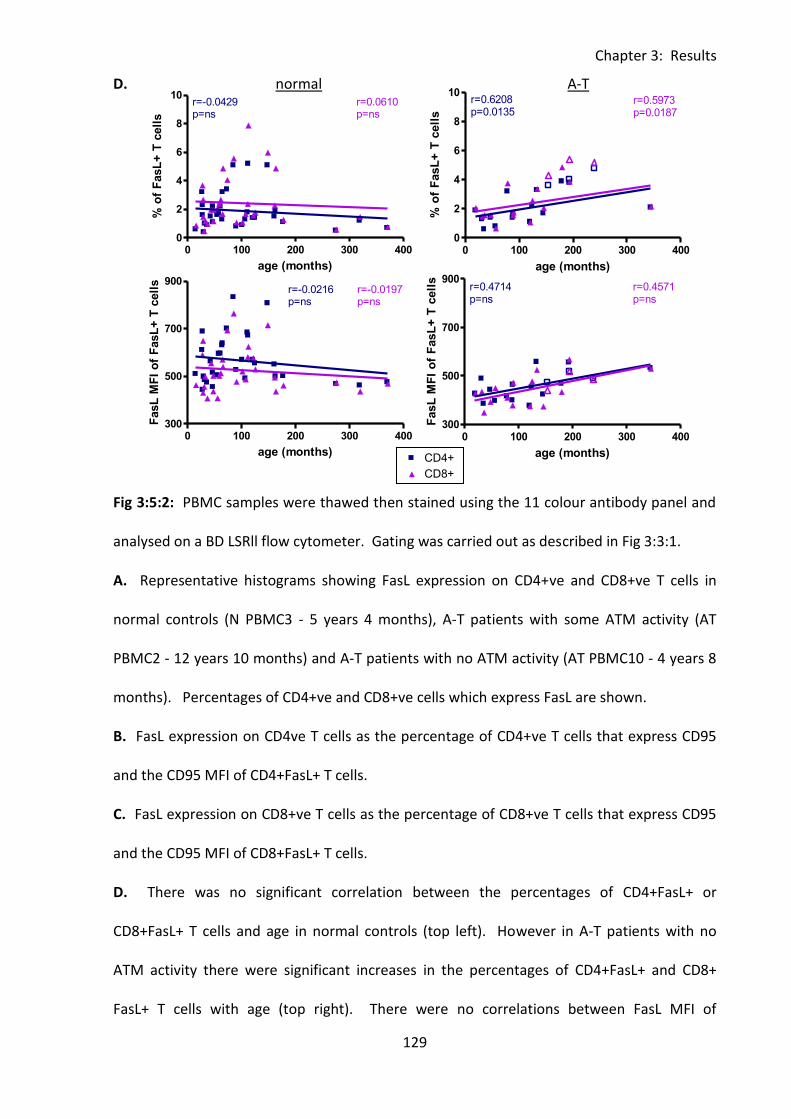
Chapter 3: Results
129
0 100 200 300 400300
500
700
900CD4+
CD8+
r=-0.0871p=ns
r=-0.0425p=ns
normal
FasL
MF
I o
f F
asL
+ T
cell
s
0 100 200 300 4000
2
4
6
8
10CD4+
CD8+
r=-0.0429p=ns
r=0.0610p=ns
age (months)
% o
f F
asL
+ T
cell
s
0 100 200 300 400300
500
700
900CD4+
CD8+
r=-0.0216p=ns
r=-0.0197p=ns
age (months)
FasL
MF
I o
f F
asL
+ T
cell
s
0 100 200 300 4000
2
4
6
8
10CD4+
Legend
CD8+
Legend
r=0.6208p=0.0135
r=0.5973p=0.0187
age (months)
% o
f F
asL
+ T
cell
s0 100 200 300 400
300
500
700
900CD4+
Legend
CD8+
Legend
r=0.4714p=ns
r=0.4571p=ns
age (months)
FasL
MF
I o
f F
asL
+ T
cell
s
D. normal A-T
Fig 3:5:2: PBMC samples were thawed then stained using the 11 colour antibody panel and
analysed on a BD LSRll flow cytometer. Gating was carried out as described in Fig 3:3:1.
A. Representative histograms showing FasL expression on CD4+ve and CD8+ve T cells in
normal controls (N PBMC3 - 5 years 4 months), A-T patients with some ATM activity (AT
PBMC2 - 12 years 10 months) and A-T patients with no ATM activity (AT PBMC10 - 4 years 8
months). Percentages of CD4+ve and CD8+ve cells which express FasL are shown.
B. FasL expression on CD4ve T cells as the percentage of CD4+ve T cells that express CD95
and the CD95 MFI of CD4+FasL+ T cells.
C. FasL expression on CD8+ve T cells as the percentage of CD8+ve T cells that express CD95
and the CD95 MFI of CD8+FasL+ T cells.
D. There was no significant correlation between the percentages of CD4+FasL+ or
CD8+FasL+ T cells and age in normal controls (top left). However in A-T patients with no
ATM activity there were significant increases in the percentages of CD4+FasL+ and CD8+
FasL+ T cells with age (top right). There were no correlations between FasL MFI of
Chapter 3: Results
130
CD4+FasL+ or CD8+FasL+ T cells and age in either A-T patients or normal controls (bottom).
To improve clarity and as there were no significant correlations linear regression trend lines
and r and p values for the A-T patients with some ATM activity are not shown, however
results of the correlation analysis for this group are summarised in Table 3:5:6. (A-T plots:
open symbols = some ATM activity, closed symbols = no ATM activity).
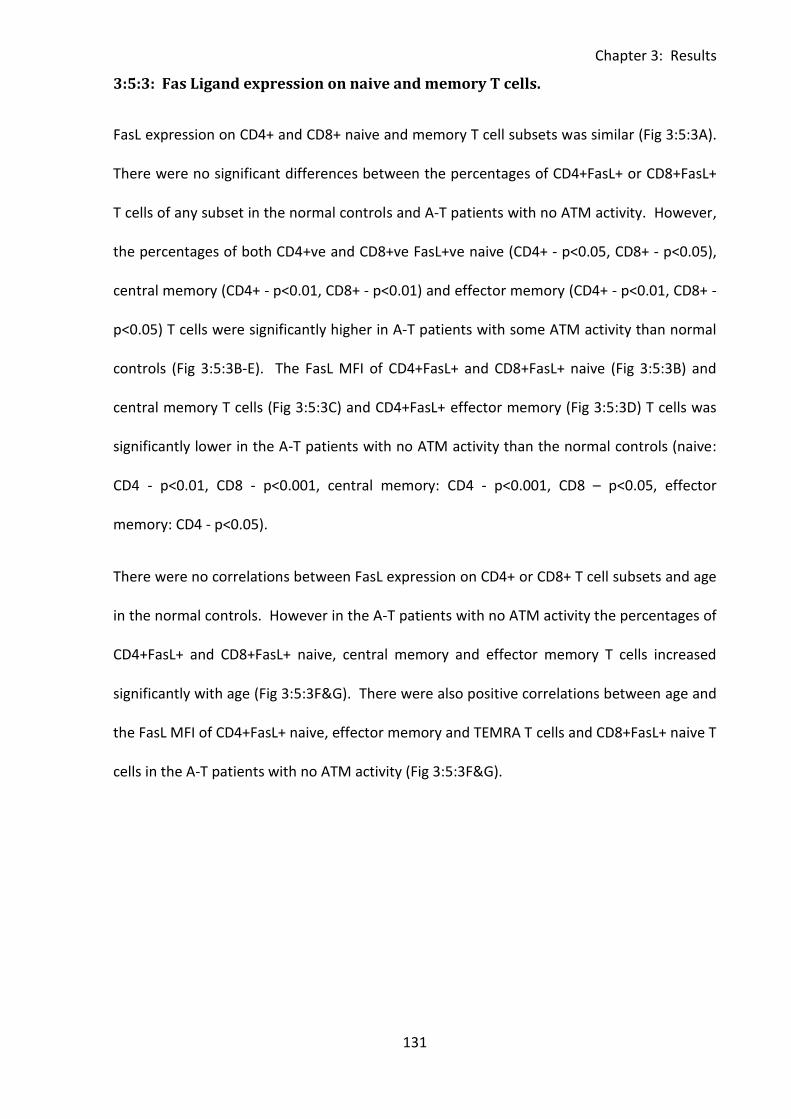
Chapter 3: Results
131
3:5:3: Fas Ligand expression on naive and memory T cells.
FasL expression on CD4+ and CD8+ naive and memory T cell subsets was similar (Fig 3:5:3A).
There were no significant differences between the percentages of CD4+FasL+ or CD8+FasL+
T cells of any subset in the normal controls and A-T patients with no ATM activity. However,
the percentages of both CD4+ve and CD8+ve FasL+ve naive (CD4+ - p<0.05, CD8+ - p<0.05),
central memory (CD4+ - p<0.01, CD8+ - p<0.01) and effector memory (CD4+ - p<0.01, CD8+ -
p<0.05) T cells were significantly higher in A-T patients with some ATM activity than normal
controls (Fig 3:5:3B-E). The FasL MFI of CD4+FasL+ and CD8+FasL+ naive (Fig 3:5:3B) and
central memory T cells (Fig 3:5:3C) and CD4+FasL+ effector memory (Fig 3:5:3D) T cells was
significantly lower in the A-T patients with no ATM activity than the normal controls (naive:
CD4 - p<0.01, CD8 - p<0.001, central memory: CD4 - p<0.001, CD8 – p<0.05, effector
memory: CD4 - p<0.05).
There were no correlations between FasL expression on CD4+ or CD8+ T cell subsets and age
in the normal controls. However in the A-T patients with no ATM activity the percentages of
CD4+FasL+ and CD8+FasL+ naive, central memory and effector memory T cells increased
significantly with age (Fig 3:5:3F&G). There were also positive correlations between age and
the FasL MFI of CD4+FasL+ naive, effector memory and TEMRA T cells and CD8+FasL+ naive T
cells in the A-T patients with no ATM activity (Fig 3:5:3F&G).
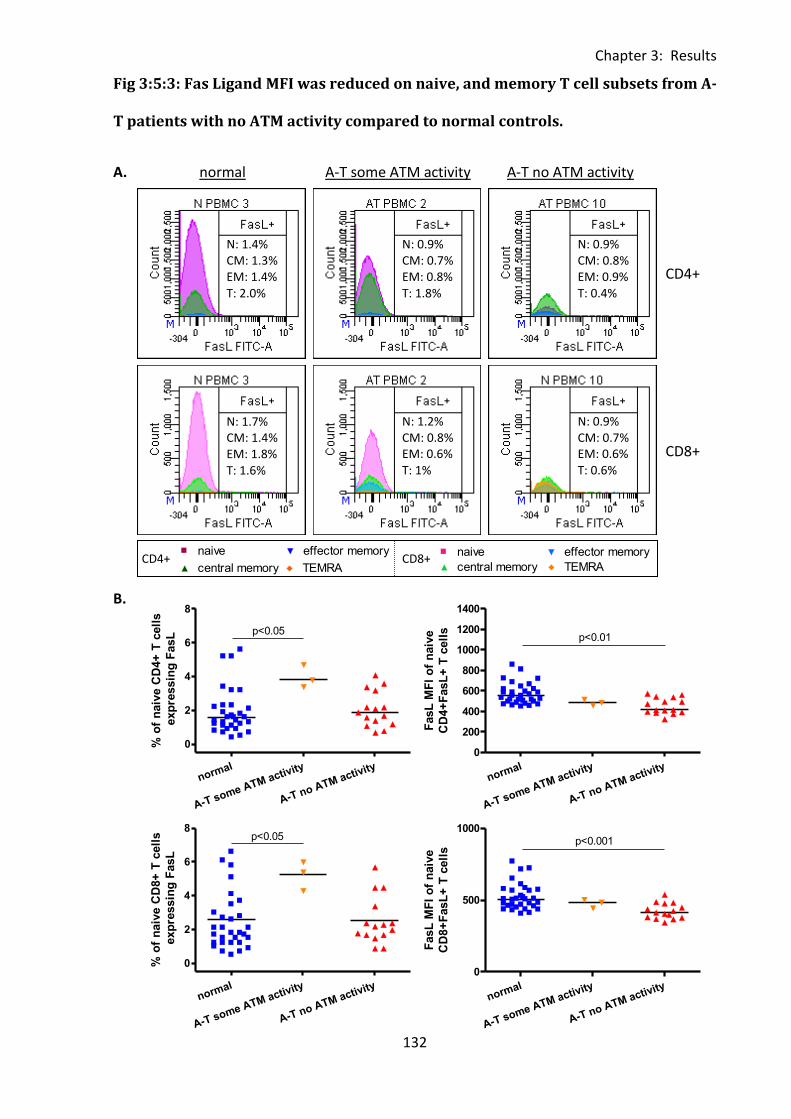
Chapter 3: Results
132
normal
A-T some ATM activity
A-T no ATM activity
0
2
4
6
8
p<0.05
% o
f n
aiv
e C
D4+
T c
ell
s
exp
ressin
g F
asL
normal
A-T some ATM activity
A-T no ATM activity
0
200
400
600
800
1000
1200
1400
p<0.01
FasL
MF
I o
f n
aiv
e
CD
4+
FasL
+ T
cell
s
normal
A-T some ATM activity
A-T no ATM activity
0
2
4
6
8p<0.05
% o
f n
aiv
e C
D8+
T c
ell
s
exp
ressin
g F
asL
normal
A-T some ATM activity
A-T no ATM activity
0
500
1000p<0.001
FasL
MF
I o
f n
aiv
e
CD
8+
FasL
+ T
cell
s
Fig 3:5:3: Fas Ligand MFI was reduced on naive, and memory T cell subsets from A-
T patients with no ATM activity compared to normal controls.
A. normal A-T some ATM activity A-T no ATM activity
B.
0 100 200 300 4000
2500
5000
7500
10000naive
central memory
effector memory
TEMRA
r=0.1250p=ns
r=0.0429p=ns
r=0.0179p=ns
r=0.2714p=ns
age (months)
CD
95 M
FI
of
CD
4+
CD
95+
T c
ell
s
0 100 200 300 4000
2000
4000
6000naive
central memory
effector memory
TEMRA
r=0.3321p=ns
r=0.8000p=ns
r=0.3607p=ns
r=0.6000p=ns
age (months)
CD
95 M
FI
of
CD
8+
CD
95+
T c
ell
s
N: 1.4% CM: 1.3% EM: 1.4% T: 2.0%
N: 0.9% CM: 0.7% EM: 0.8% T: 1.8%
N: 0.9% CM: 0.8% EM: 0.9% T: 0.4%
N: 1.7% CM: 1.4% EM: 1.8% T: 1.6%
N: 1.2% CM: 0.8% EM: 0.6% T: 1%
N: 0.9% CM: 0.7% EM: 0.6% T: 0.6%
CD4+ CD8+
CD4+
CD8+
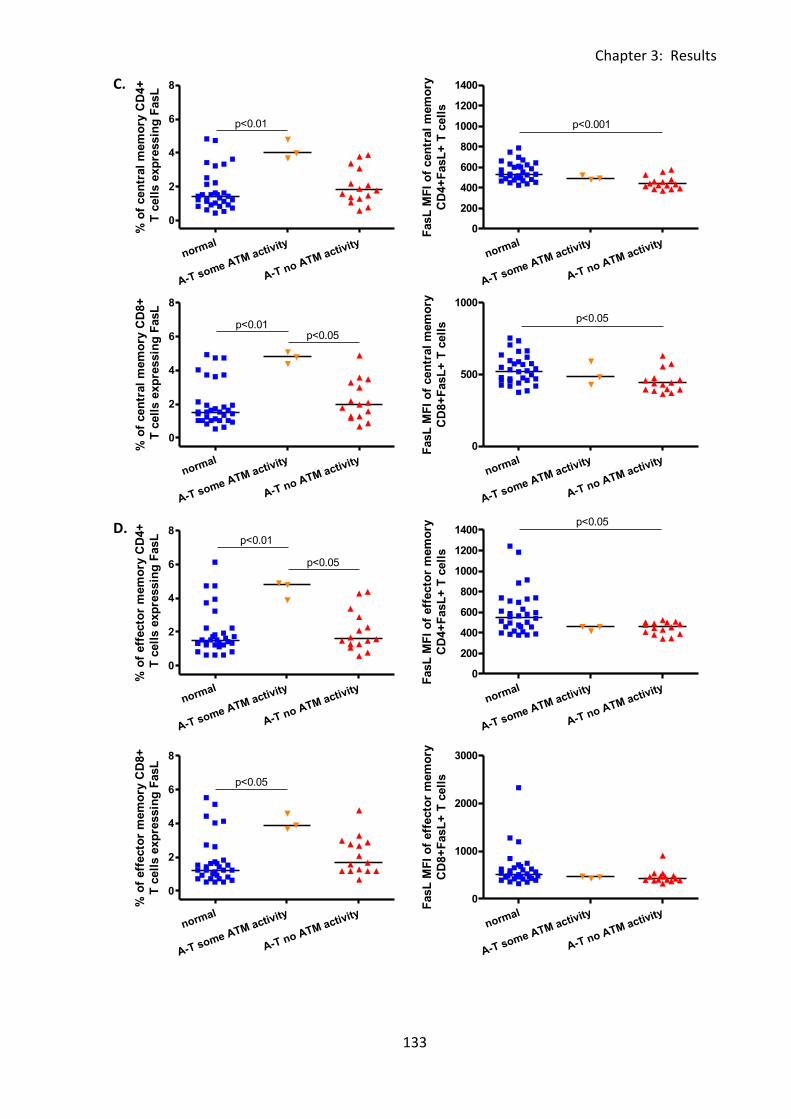
Chapter 3: Results
133
normal
A-T some ATM activity
A-T no ATM activity
0
2
4
6
8
p<0.01
% o
f cen
tral
mem
ory
CD
4+
T c
ell
s e
xp
ressin
g F
asL
normal
A-T some ATM activity
A-T no ATM activity
0
200
400
600
800
1000
1200
1400
p<0.001
FasL
MF
I o
f cen
tral
mem
ory
CD
4+
FasL
+ T
cell
s
normal
A-T some ATM activity
A-T no ATM activity
0
500
1000
p<0.05
FasL
MF
I o
f cen
tral
mem
ory
CD
8+
FasL
+ T
cell
s
normal
A-T some ATM activity
A-T no ATM activity
0
2
4
6
8
p<0.05p<0.01
% o
f cen
tral
mem
ory
CD
8+
T c
ell
s e
xp
ressin
g F
asL
normal
A-T some ATM activity
A-T no ATM activity
0
2
4
6
8p<0.01
p<0.05
% o
f eff
ecto
r m
em
ory
CD
4+
T c
ell
s e
xp
ressin
g F
asL
normal
A-T some ATM activity
A-T no ATM activity
0
200
400
600
800
1000
1200
1400p<0.05
FasL
MF
I o
f eff
ecto
r m
em
ory
CD
4+
FasL
+ T
cell
s
normal
A-T some ATM activity
A-T no ATM activity
0
2
4
6
8
p<0.05
% o
f eff
ecto
r m
em
ory
CD
8+
T c
ell
s e
xp
ressin
g F
asL
normal
A-T some ATM activity
A-T no ATM activity
0
1000
2000
3000
FasL
MF
I o
f eff
ecto
r m
em
ory
CD
8+
FasL
+ T
cell
s
C.
D.
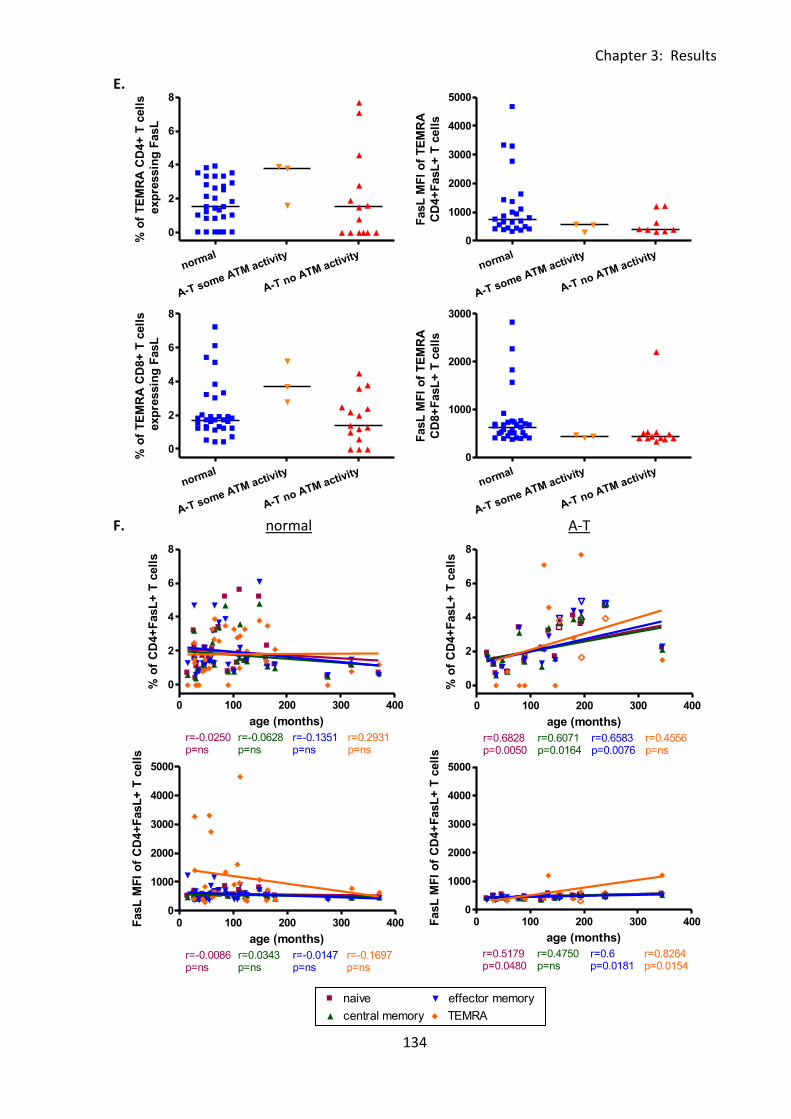
Chapter 3: Results
134
0 100 200 300 4000
2500
5000
7500
10000naive
central memory
effector memory
TEMRA
r=0.1250p=ns
r=0.0429p=ns
r=0.0179p=ns
r=0.2714p=ns
age (months)
CD
95 M
FI
of
CD
4+
CD
95+
T c
ell
s
0 100 200 300 400
0
2
4
6
8naive
central memory
effector memory
TEMRA
r=-0.0250p=ns
r=-0.0628p=ns
r=-0.1351p=ns
r=0.2931p=ns
age (months)
% o
f C
D4+
FasL
+ T
cell
s
0 100 200 300 4000
1000
2000
3000
4000
5000naive
central memory
effector memory
TEMRA
r=-0.0086p=ns
r=0.0343p=ns
r=-0.0147p=ns
r=-0.1697p=ns
age (months)
FasL
MF
I o
f C
D4+
FasL
+ T
cell
s
normal
A-T some ATM activity
A-T no ATM activity
0
2
4
6
8
% o
f T
EM
RA
CD
4+
T c
ell
s
exp
ressin
g F
asL
normal
A-T some ATM activity
A-T no ATM activity
0
1000
2000
3000
4000
5000
FasL
MF
I o
f T
EM
RA
CD
4+
FasL
+ T
cell
s
normal
A-T some ATM activity
A-T no ATM activity
0
2
4
6
8
% o
f T
EM
RA
CD
8+
T c
ell
s
exp
ressin
g F
asL
normal
A-T some ATM activity
A-T no ATM activity
0
1000
2000
3000
FasL
MF
I o
f T
EM
RA
CD
8+
FasL
+ T
cell
s
0 100 200 300 400
0
2
4
6
8naive
Legend
central memory
Legend
effector memory
Legend
TEMRA
Legend
r=0.6828p=0.0050
r=0.6071p=0.0164
r=0.6583p=0.0076
r=0.4556p=ns
age (months)
% o
f C
D4+
FasL
+ T
cell
s
0 100 200 300 4000
1000
2000
3000
4000
5000naive
Legend
central memory
Legend
effector memory
Legend
TEMRA
Legend
r=0.5179p=0.0480
r=0.4750p=ns
r=0.6p=0.0181
r=0.8264p=0.0154
age (months)
FasL
MF
I o
f C
D4+
FasL
+ T
cell
s
E.
F. normal A-T
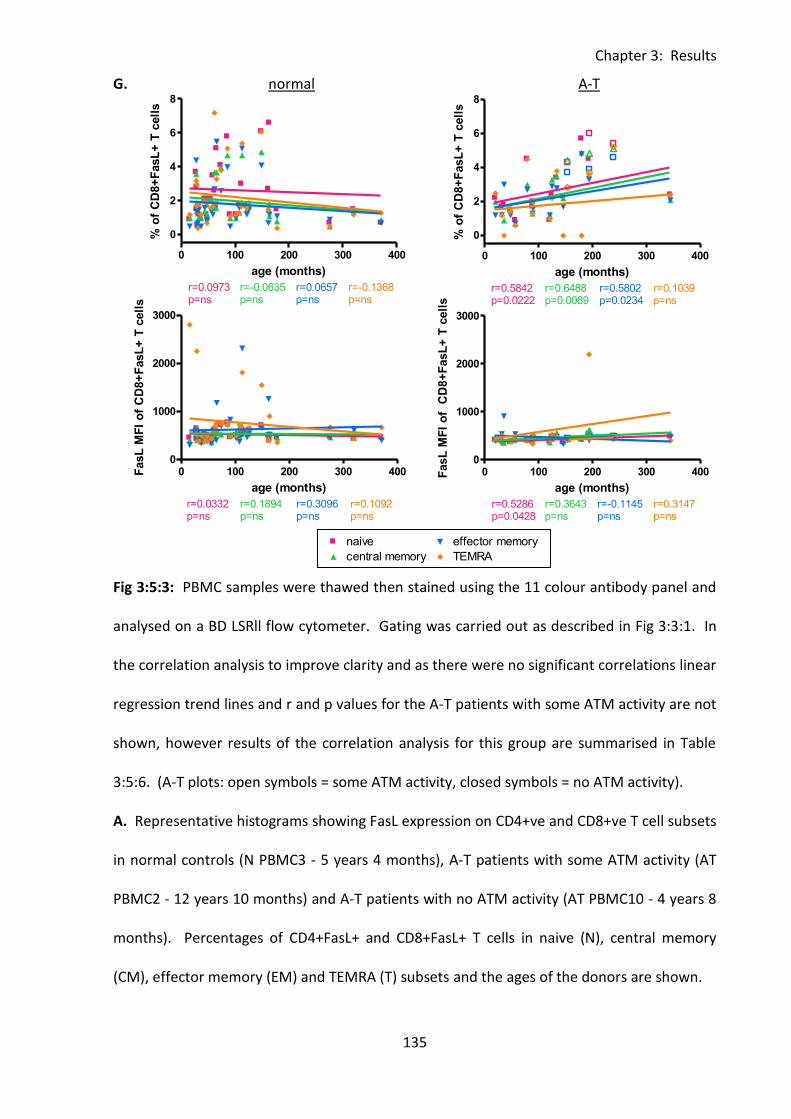
Chapter 3: Results
135
0 100 200 300 4000
2000
4000
6000naive
central memory
effector memory
TEMRA
r=0.3321p=ns
r=0.8000p=ns
r=0.3607p=ns
r=0.6000p=ns
age (months)
CD
95 M
FI
of
CD
8+
CD
95+
T c
ell
s
0 100 200 300 400
0
2
4
6
8naive
central memory
effector memory
TEMRA
r=0.0973p=ns
r=-0.0635p=ns
r=0.0657p=ns
r=-0.1368p=ns
age (months)
% o
f C
D8+
FasL
+ T
cell
s
0 100 200 300 4000
1000
2000
3000naive
central memory
effector memory
TEMRA
r=0.0332p=ns
r=0.1894p=ns
r=0.3096p=ns
r=0.1092p=ns
age (months)
FasL
MF
I o
f C
D8+
FasL
+ T
cell
s
0 100 200 300 400
0
2
4
6
8naive
Legend
central memory
Legend
effector memory
Legend
TEMRA
Legend
r=0.5842p=0.0222
r=0.6488p=0.0089
r=0.5802p=0.0234
r=0.1039p=ns
age (months)
% o
f C
D8+
FasL
+ T
cell
s
0 100 200 300 4000
1000
2000
3000naive
Legend
central memory
Legend
effector memory
Legend
TEMRA
Legend
r=0.5286p=0.0428
r=0.3643p=ns
r=-0.1145p=ns
r=0.3147p=ns
age (months)
FasL
MF
I o
f C
D8+
FasL
+ T
cell
s
G. normal A-T
Fig 3:5:3: PBMC samples were thawed then stained using the 11 colour antibody panel and
analysed on a BD LSRll flow cytometer. Gating was carried out as described in Fig 3:3:1. In
the correlation analysis to improve clarity and as there were no significant correlations linear
regression trend lines and r and p values for the A-T patients with some ATM activity are not
shown, however results of the correlation analysis for this group are summarised in Table
3:5:6. (A-T plots: open symbols = some ATM activity, closed symbols = no ATM activity).
A. Representative histograms showing FasL expression on CD4+ve and CD8+ve T cell subsets
in normal controls (N PBMC3 - 5 years 4 months), A-T patients with some ATM activity (AT
PBMC2 - 12 years 10 months) and A-T patients with no ATM activity (AT PBMC10 - 4 years 8
months). Percentages of CD4+FasL+ and CD8+FasL+ T cells in naive (N), central memory
(CM), effector memory (EM) and TEMRA (T) subsets and the ages of the donors are shown.
Chapter 3: Results
136
B. FasL expression on naive CD4+ve and CD8+ve T cells as the percentage of naive CD4+ve
and CD8+ve T cells that express CD95 and the CD95 MFI of naive CD4+FasL+ and CD8+FasL+
T cells.
C. FasL expression on central memory CD4+ve and CD8+ve T cells as the percentage of
central memory CD4+ve and CD8+ve T cells that express CD95 and the CD95 MFI of central
memory CD4+FasL+ and CD8+FasL+ T cells.
D. FasL expression on effector memory CD4+ve and CD8+ve T cells as the percentage of
effector memory CD4+ve and CD8+ve T cells that express CD95 and the CD95 MFI of effector
memory CD4+FasL+ and CD8+ FasL+ T cells.
E. FasL expression on TEMRA CD4+ve and CD8+ve T cells as the percentage of TEMRA
CD4+ve and CD8+ve T cells that express CD95 and the CD95 MFI of TEMRA CD4+FasL+ and
CD8+FasL+ T cells. Samples with less than 20 CD4+ve or CD8+ve TEMRA events were
excluded.
F. Normal controls showed no correlation between age and the percentage of CD4+FasL+ T
cells in any subset (top left), however in A-T patient with no ATM activity the percentage
increased with age in naive, central memory and effector memory subsets (top right). There
were no significant correlations between age and FasL MFI on CD4+FasL+ T cells of any
subset in the normal controls (bottom left), however in A-T patients with no ATM activity
there were significant increases in FasL MFI with age in naive, effector memory and TEMRA
subsets.
G. In the normal controls there were no correlations between age and the percentage of
CD8+FasL+ T cells in any subset (top left), however in A-T patients with no ATM activity the
percentage increased with age in naive, central memory and effector memory subsets (top
right). There were no significant correlations between age and FasL MFI on normal
Chapter 3: Results
137
CD8+FasL+ T cells of any subset, however in A-T patients with no ATM activity there was a
significant increase in FasL MFI of naive CD8+FasL+ T cells with age.
Chapter 3: Results
138
3:5:4: Fas ligand expression on naive and memory B cells.
Both naive and memory B cells from A-T patients and normal controls expressed FasL (Fig
3:5:4A). There was little difference in FasL expression between naive and memory B cells; in
the normal controls a median of 15.8% of naive and 16.7% of memory B cells expressed FasL
and the median FasL MFI of FasL+ cells was 673 on the naive and 691 on the memory cells
(Fig 3:4:5B&C).
There was no significant difference in the percentage of FasL+ naive and memory B cells in
normal controls and A-T patients. However, the FasL MFI of FasL+ naive and memory B cells
was significantly higher in the normal controls than the A-T patients with no ATM activity
(naive - p<0.001, memory - p<0.001) and A-T patients with some ATM activity (naive p<0.01,
memory – p<0.001) (Fig 3:5:4B&C).
There were no correlations between the percentages of FasL+ naive or memory B cells and
age in A-T patients or normal controls. However the FasL MFI of FasL+ naive B cells showed
a positive correlation with age in the normal controls. The A-T patients with no ATM activity
showed the opposite trend, the FasL MFI of both FasL+ naive and memory B cells decreased
significantly with age (Fig 3:5:4D).
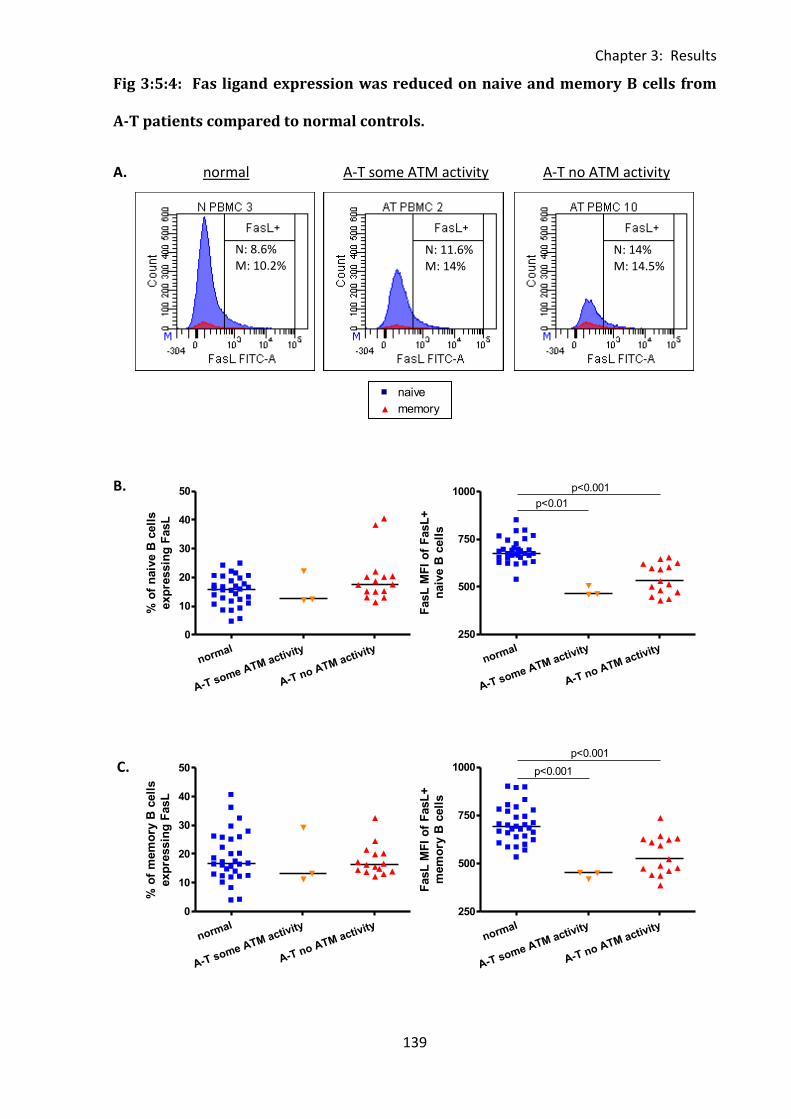
Chapter 3: Results
139
0 100 200 300 4000
25
50
75
100naive
memory
r=0.1957p=ns
r=0.4143p=0.0165
age (months)
% o
f C
D95+
B c
ell
s
normal
A-T some ATM activity
A-T no ATM activity
0
10
20
30
40
50
% o
f n
aiv
e B
cell
s
exp
ressin
g F
asL
normal
A-T some ATM activity
A-T no ATM activity
250
500
750
1000 p<0.001
p<0.01
FasL
MF
I o
f F
asL
+
naiv
e B
cell
s
normal
A-T some ATM activity
A-T no ATM activity
0
10
20
30
40
50
% o
f m
em
ory
B c
ell
s
exp
ressin
g F
asL
normal
A-T some ATM activity
A-T no ATM activity
250
500
750
1000
p<0.001
p<0.001
FasL
MF
I o
f F
asL
+
mem
ory
B c
ell
s
Fig 3:5:4: Fas ligand expression was reduced on naive and memory B cells from
A-T patients compared to normal controls.
A. normal A-T some ATM activity A-T no ATM activity
B.
C.
N: 8.6% M: 10.2%
N: 11.6% M: 14%
N: 14% M: 14.5%
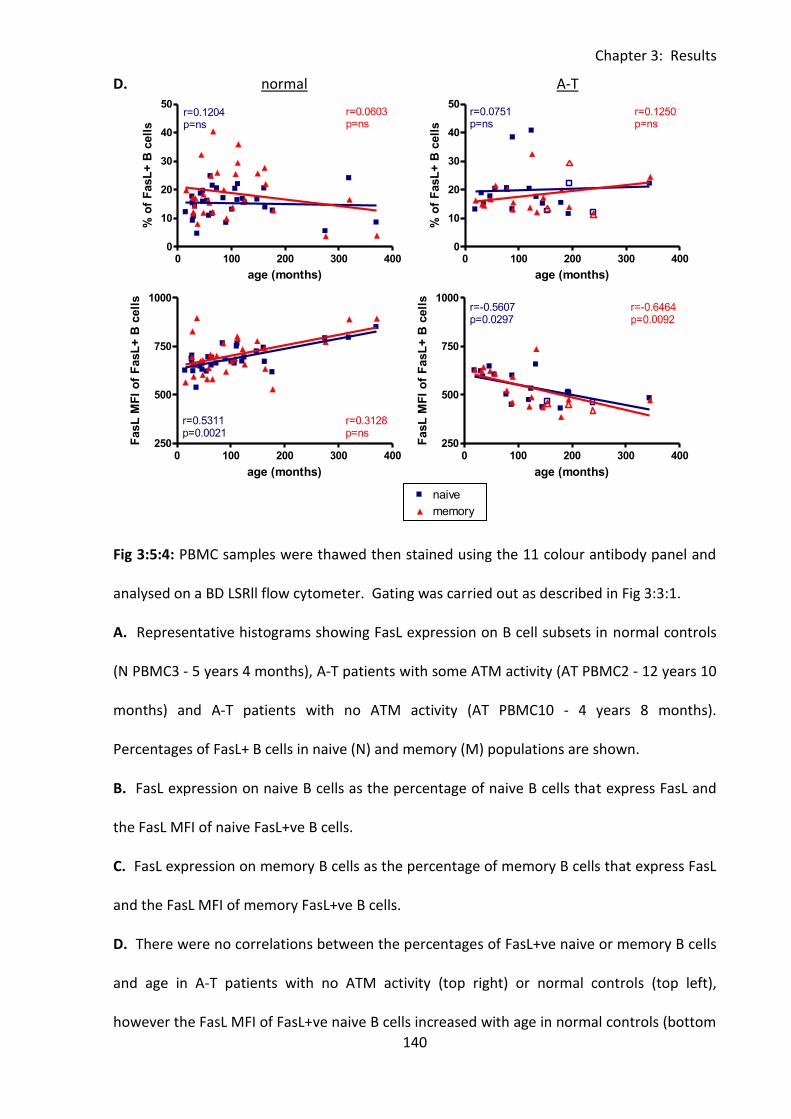
Chapter 3: Results
140
0 100 200 300 4000
25
50
75
100naive
memory
r=0.1957p=ns
r=0.4143p=0.0165
age (months)
% o
f C
D95+
B c
ell
s
0 100 200 300 4000
10
20
30
40
50naive
memory
r=0.1204p=ns
r=0.0603p=ns
age (months)
% o
f F
asL
+ B
cell
s
0 100 200 300 400250
500
750
1000naive
memory
r=0.5311p=0.0021
r=0.3128p=ns
age (months)
FasL
MF
I o
f F
asL
+ B
cell
s
0 100 200 300 4000
10
20
30
40
50naive
Legend
memory
Legend
r=0.0751p=ns
r=0.1250p=ns
age (months)
% o
f F
asL
+ B
cell
s
0 100 200 300 400250
500
750
1000naive
Legend
memory
Legend
r=-0.5607p=0.0297
r=-0.6464p=0.0092
age (months)
FasL
MF
I o
f F
asL
+ B
cell
s
D. normal A-T
Fig 3:5:4: PBMC samples were thawed then stained using the 11 colour antibody panel and
analysed on a BD LSRll flow cytometer. Gating was carried out as described in Fig 3:3:1.
A. Representative histograms showing FasL expression on B cell subsets in normal controls
(N PBMC3 - 5 years 4 months), A-T patients with some ATM activity (AT PBMC2 - 12 years 10
months) and A-T patients with no ATM activity (AT PBMC10 - 4 years 8 months).
Percentages of FasL+ B cells in naive (N) and memory (M) populations are shown.
B. FasL expression on naive B cells as the percentage of naive B cells that express FasL and
the FasL MFI of naive FasL+ve B cells.
C. FasL expression on memory B cells as the percentage of memory B cells that express FasL
and the FasL MFI of memory FasL+ve B cells.
D. There were no correlations between the percentages of FasL+ve naive or memory B cells
and age in A-T patients with no ATM activity (top right) or normal controls (top left),
however the FasL MFI of FasL+ve naive B cells increased with age in normal controls (bottom
Chapter 3: Results
141
left). In A-T patients with no ATM activity there were significant negative correlations
between age and the FasL MFI of both FasL+ve naive and memory B cells (bottom right). To
improve clarity and as there were no significant correlations linear regression trend lines and
r and p values for the A-T patients with some ATM activity are not shown, however results of
the correlation analysis for this group are summarised in Table 3:5:6. (A-T plots: open
symbols = some ATM activity, closed symbols = no ATM activity).
Chapter 3: Results
142
3:5:5: FasL expression on CD56bright and CD56dim NK cells.
FasL expression on CD56bright and CD56dim NK cells was very low; in the normal controls a
median of 2.4% of CD56bright and 2.6% of CD56dim NK cells expressed FasL (Fig 3:5:5A).
There was no significant difference between the FasL MFI of FasL+ cells in A-T patients and
normal controls (Fig 3:5:5B&C). However, a significantly higher percentage of CD56dim NK
cells in the A-T patients with some ATM activity expressed FasL than in the normal controls
(p<0.05) or A-T patients with no ATM activity (p<0.05). The percentage of CD56brightFasL+
NK cells was also significantly higher in the A-T patients with some ATM activity than the
normal controls (p<0.05).
The results were similar to those for T cells in that whilst there were no correlations
between age and percentage of FasL+ cells in the normal controls, the percentages of both
CD56dimFasL+ and CD56brightFasL+ NK cells increased with age in the A-T patients with no
ATM activity. (Fig 3:5:5D). There was also a significant negative correlation between the
FasL MFI of CD56brightFasL+ NK cells and age in the normal controls.
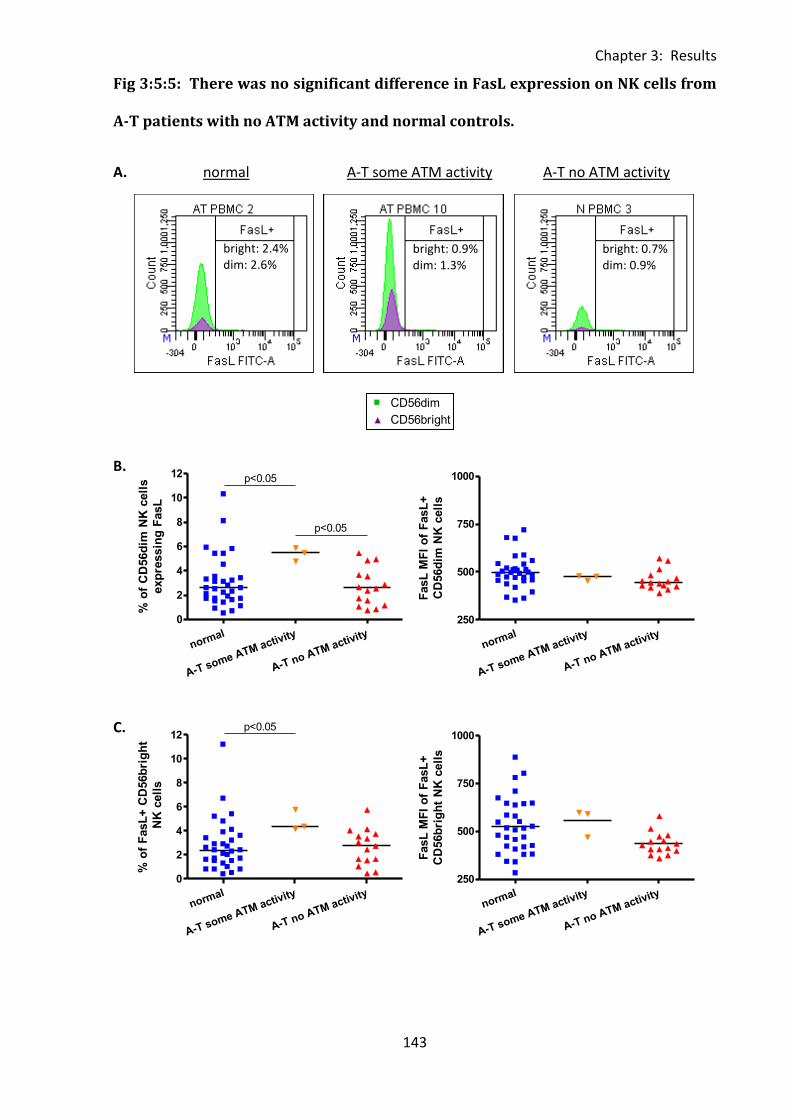
Chapter 3: Results
143
0 100 200 300 4000
500
1000
1500
2000CD56dim
CD56bright
r=0.1262p=ns
r=0.1790p=ns
age (months)
CD
95 M
FI
of
CD
95+
NK
cell
s
normal
A-T some ATM activity
A-T no ATM activity
0
2
4
6
8
10
12 p<0.05
p<0.05
% o
f C
D56d
im N
K c
ell
s
exp
ressin
g F
asL
normal
A-T some ATM activity
A-T no ATM activity
250
500
750
1000
FasL
MF
I o
f F
asL
+
CD
56d
im N
K c
ell
s
normal
A-T some ATM activity
A-T no ATM activity
0
2
4
6
8
10
12p<0.05
% o
f F
asL
+ C
D56b
rig
ht
NK
cell
s
normal
A-T some ATM activity
A-T no ATM activity
250
500
750
1000
FasL
MF
I o
f F
asL
+
CD
56b
rig
ht
NK
cell
s
Fig 3:5:5: There was no significant difference in FasL expression on NK cells from
A-T patients with no ATM activity and normal controls.
A. normal A-T some ATM activity A-T no ATM activity
B.
C.
bright: 2.4% dim: 2.6%
bright: 0.9% dim: 1.3%
bright: 0.7% dim: 0.9%
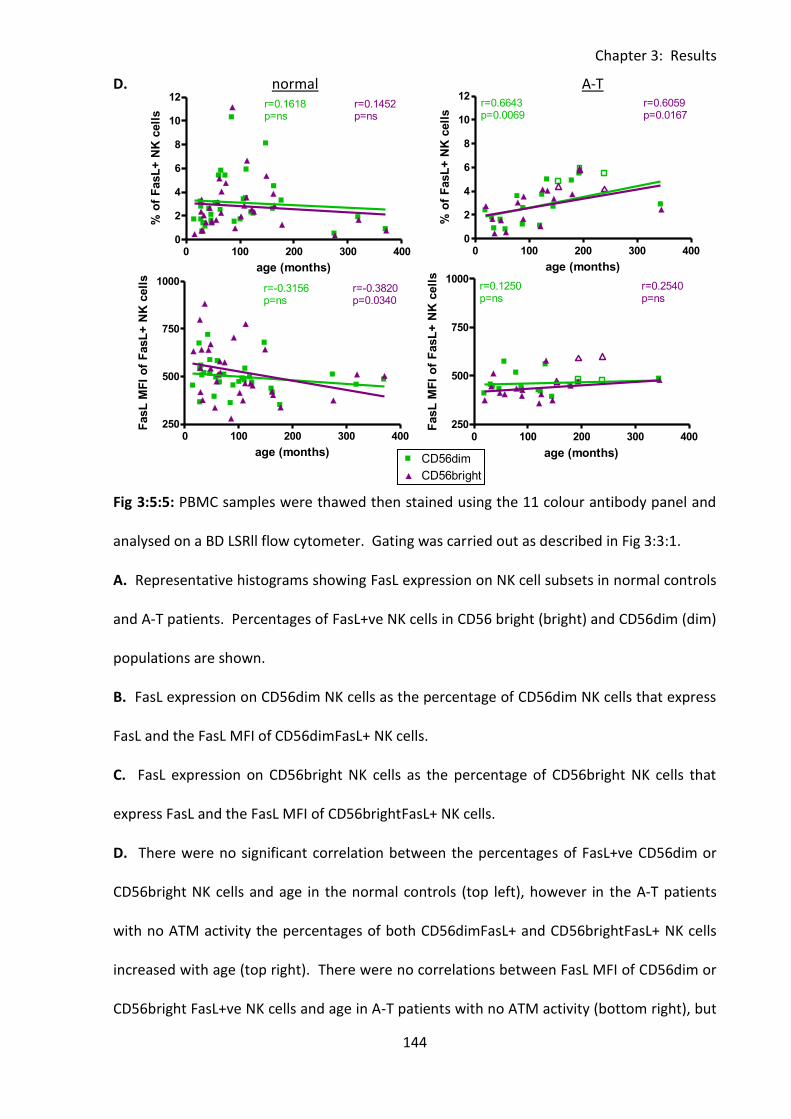
Chapter 3: Results
144
0 100 200 300 4000
500
1000
1500
2000CD56dim
CD56bright
r=0.1262p=ns
r=0.1790p=ns
age (months)
CD
95 M
FI
of
CD
95+
NK
cell
s
0 100 200 300 4000
2
4
6
8
10
12CD56dim
CD56bright
r=0.1618p=ns
r=0.1452p=ns
age (months)
% o
f F
asL
+ N
K c
ell
s
0 100 200 300 400250
500
750
1000CD56dim
CD56bright
r=-0.3156p=ns
r=-0.3820p=0.0340
age (months)
FasL
MF
I o
f F
asL
+ N
K c
ell
s
0 100 200 300 4000
2
4
6
8
10
12CD56dim
Legend
CD56bright
Legend
r=0.6643p=0.0069
r=0.6059p=0.0167
age (months)
% o
f F
asL
+ N
K c
ell
s0 100 200 300 400
250
500
750
1000CD56dim
Legend
CD56bright
Legend
r=0.1250p=ns
r=0.2540p=ns
age (months)
FasL
MF
I o
f F
asL
+ N
K c
ell
s
D. normal A-T
Fig 3:5:5: PBMC samples were thawed then stained using the 11 colour antibody panel and
analysed on a BD LSRll flow cytometer. Gating was carried out as described in Fig 3:3:1.
A. Representative histograms showing FasL expression on NK cell subsets in normal controls
and A-T patients. Percentages of FasL+ve NK cells in CD56 bright (bright) and CD56dim (dim)
populations are shown.
B. FasL expression on CD56dim NK cells as the percentage of CD56dim NK cells that express
FasL and the FasL MFI of CD56dimFasL+ NK cells.
C. FasL expression on CD56bright NK cells as the percentage of CD56bright NK cells that
express FasL and the FasL MFI of CD56brightFasL+ NK cells.
D. There were no significant correlation between the percentages of FasL+ve CD56dim or
CD56bright NK cells and age in the normal controls (top left), however in the A-T patients
with no ATM activity the percentages of both CD56dimFasL+ and CD56brightFasL+ NK cells
increased with age (top right). There were no correlations between FasL MFI of CD56dim or
CD56bright FasL+ve NK cells and age in A-T patients with no ATM activity (bottom right), but
Chapter 3: Results
145
the FasL MFI of CD56brightFasL+ cells decreased with age in the normal controls. To
improve clarity and as there were no significant correlations linear regression trend lines and
r and p values for the A-T patients with some ATM activity are not shown, however results of
the correlation analysis for this group are summarised in Table 3:5:6. (A-T plots: open
symbols = some ATM activity, closed symbols = no ATM activity).
Chapter 3: Results
146
3:5:6: FasL MFI was reduced on lymphocytes from A-T patients with no ATM
activity compared to normal controls.
The results described in section 3:5 including significant differences between the expression
of FasL on lymphocytes (percentage and FasL MFI of FasL+ cells) and significant correlations
between FasL expression and age in A-T patients and normal controls are summarised in
Table 3:5:6.
There was no significant difference in the percentage of FasL+ve cells of any type between
normal controls and A-T patients with no ATM activity. However, the percentages of
CD4+FasL+ effector memory T cells, CD8+FasL+ central memory T cells, FasL+NK cells and
CD56dimFasL+ NK cells were significantly higher in A-T patients with some ATM activity than
normal controls or A-T patients with no ATM activity. In addition the percentages of FasL+ve
T cells, CD4+FasL+ T cells, CD4+FasL+ naive and central memory T cells, CD8+FasL+ naive and
effector memory T cells and CD56brightFasL+ NK cells were significantly higher in A-T
patients with some ATM activity than in the normal controls.
With the exception of NK cells and NK cell subsets, total T cells, CD4+ and CD8+ TEMRA T
cells, and CD8+ effector memory T cells, the FasL MFI of FasL+ cells was increased in the
normal controls compared to A-T patients with no ATM activity. The FasL MFI of FasL+ve
NKT cells, B cells and B cell subsets were also significantly higher in normal controls than A-T
patients. However, the FasL MFI of FasL+ total T cells was increased in A-T patients with
some ATM activity compared to A-T patients with no ATM activity and normal controls.
A-T patients with no ATM activity showed positive correlations between age and the
percentage of FasL+ cells in all NK and T cell subsets with the exception of CD4+ and CD8+
TEMRA T cells. A-T patients with some ATM activity showed no significant effect of age on
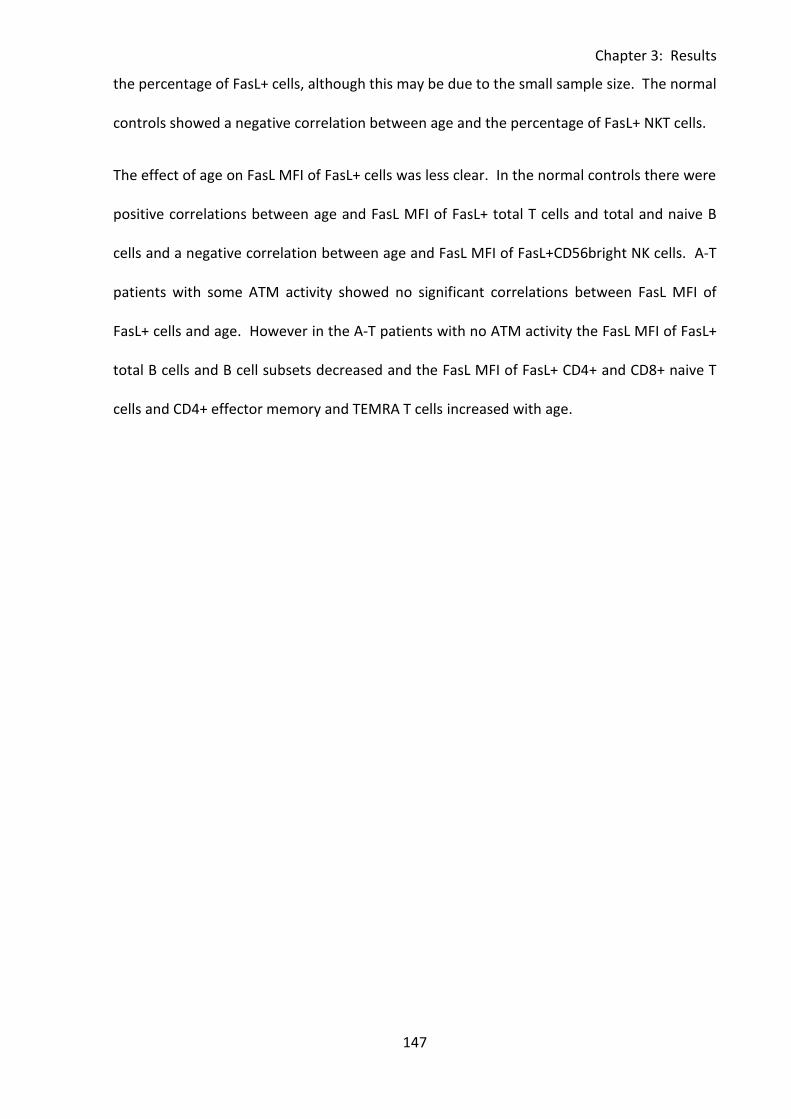
Chapter 3: Results
147
the percentage of FasL+ cells, although this may be due to the small sample size. The normal
controls showed a negative correlation between age and the percentage of FasL+ NKT cells.
The effect of age on FasL MFI of FasL+ cells was less clear. In the normal controls there were
positive correlations between age and FasL MFI of FasL+ total T cells and total and naive B
cells and a negative correlation between age and FasL MFI of FasL+CD56bright NK cells. A-T
patients with some ATM activity showed no significant correlations between FasL MFI of
FasL+ cells and age. However in the A-T patients with no ATM activity the FasL MFI of FasL+
total B cells and B cell subsets decreased and the FasL MFI of FasL+ CD4+ and CD8+ naive T
cells and CD4+ effector memory and TEMRA T cells increased with age.
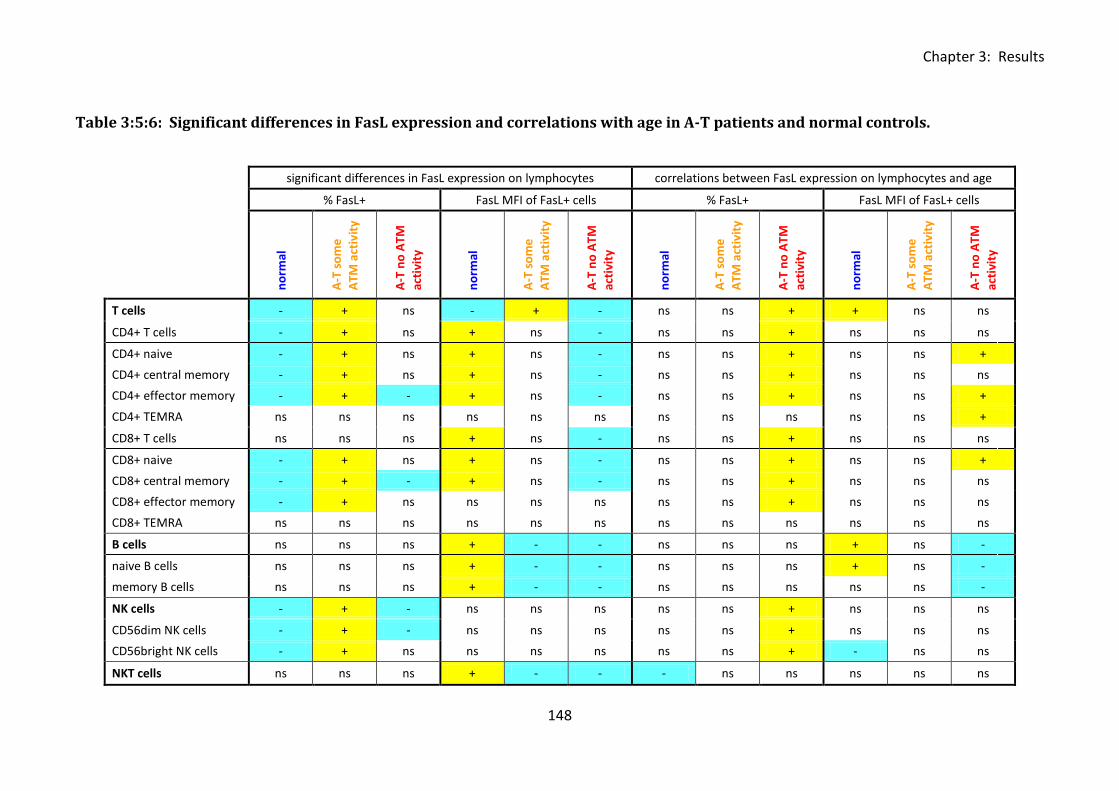
Chapter 3: Results
148
Table 3:5:6: Significant differences in FasL expression and correlations with age in A-T patients and normal controls.
significant differences in FasL expression on lymphocytes correlations between FasL expression on lymphocytes and age
% FasL+ FasL MFI of FasL+ cells % FasL+ FasL MFI of FasL+ cells
no
rmal
A-T
so
me
ATM
act
ivit
y
A-T
no
ATM
acti
vity
no
rmal
A-T
so
me
ATM
act
ivit
y
A-T
no
ATM
acti
vity
no
rmal
A-T
so
me
ATM
act
ivit
y
A-T
no
ATM
acti
vity
no
rmal
A-T
so
me
ATM
act
ivit
y
A-T
no
ATM
acti
vity
T cells - + ns - + - ns ns + + ns ns
CD4+ T cells - + ns + ns - ns ns + ns ns ns
CD4+ naive - + ns + ns - ns ns + ns ns +
CD4+ central memory - + ns + ns - ns ns + ns ns ns
CD4+ effector memory - + - + ns - ns ns + ns ns +
CD4+ TEMRA ns ns ns ns ns ns ns ns ns ns ns +
CD8+ T cells ns ns ns + ns - ns ns + ns ns ns
CD8+ naive - + ns + ns - ns ns + ns ns +
CD8+ central memory - + - + ns - ns ns + ns ns ns
CD8+ effector memory - + ns ns ns ns ns ns + ns ns ns
CD8+ TEMRA ns ns ns ns ns ns ns ns ns ns ns ns
B cells ns ns ns + - - ns ns ns + ns -
naive B cells ns ns ns + - - ns ns ns + ns -
memory B cells ns ns ns + - - ns ns ns ns ns -
NK cells - + - ns ns ns ns ns + ns ns ns
CD56dim NK cells - + - ns ns ns ns ns + ns ns ns
CD56bright NK cells - + ns ns ns ns ns ns + - ns ns
NKT cells ns ns ns + - - - ns ns ns ns ns
Chapter 3: Results
149
Table 3:5:6: Summary of significant differences between the expression of FasL (percentage
and FasL MFI of FasL+ cells) and significant correlations between FasL expression and age in
A-T patients and normal controls.
In the first part of the table (significant differences in FasL expression on lymphocytes) cells
containing a positive symbol (+) and highlighted in yellow indicate a significantly higher
percentage or FasL MFI of FasL+ cells of the particular cell type in the corresponding group
than in the group with a cell containing a negative symbol (-) and highlighted in blue, ‘ns’
refers to no significant difference with any group. The second part of the table summarises
significant correlations between FasL expression and age. Yellow (+) cells indicate a positive
correlation and blue (-) cells indicate a negative correlation, ‘ns’ indicates no significant
correlation.
Chapter 3: Results
150
3:6: CD127 expression.
3:6:1: CD127 expression on lymphocyte subsets.
The final antibody included in the 11 colour panel was CD127 which binds to an important
component of the IL-7 receptor (IL-7Rα). Cells which lack CD127 expression cannot bind IL-7;
therefore expression of CD127 regulates the proliferative response of cells to the cytokine.
As A-T patients are lymphopenic they are likely to show increased availability of IL-7,
however a deficiency in CD127 expression on A-T lymphocytes could prevent the cells from
responding to the cytokine and potentially contribute to lymphopenia.
Abnormal CD127 expression on T cells from A-T patients could potentially influence
sensitivity to CD95-mediated apoptosis as IL-7 may be involved in upregulation of CD95 on T
cells (Brugnoni et al., 1999;Rethi et al., 2008). A high level of CD127 expression could
therefore lead to increased binding of IL-7 causing upregulation of CD95, increased
sensitivity to CD95-mediated apoptosis and potentially lymphopenia. Conversely CD127
deficiency could potentially prevent CD95 upregulation in response to IL-7 and so increase
the resistance of T cells to CD95-mediated apoptosis.
CD127 expression was analysed on lymphocyte subsets from normal controls and A-T
patients. As expression was low and it was difficult to clearly distinguish positive and
negative populations, the CD127 MFI of all cells was compared rather than the CD127 MFI of
CD127+ve cells.
A median of 15.5% of T cells in the normal controls expressed CD127. There was no
significant difference in CD127 expression on T cells between the normal controls and A-T
patients with no ATM activity. However, a significantly higher percentage of T cells in A-T
patients with some ATM activity expressed CD127 than normal controls (p<0.05) and A-T
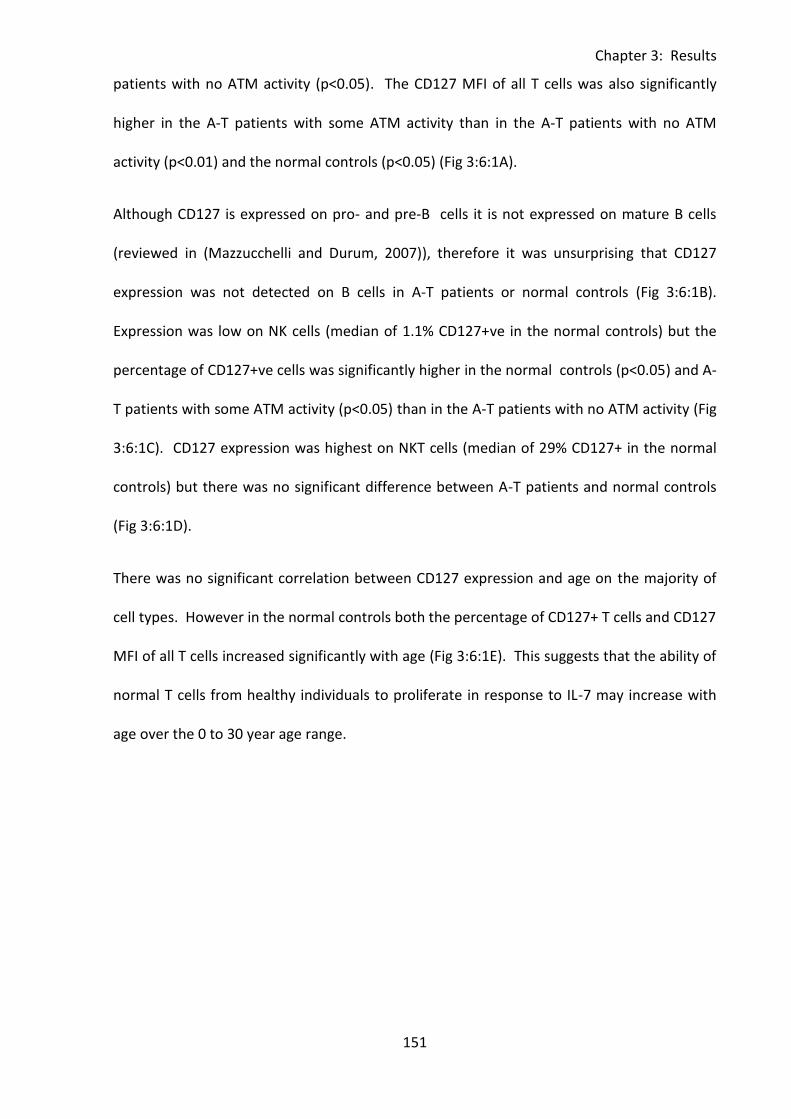
Chapter 3: Results
151
patients with no ATM activity (p<0.05). The CD127 MFI of all T cells was also significantly
higher in the A-T patients with some ATM activity than in the A-T patients with no ATM
activity (p<0.01) and the normal controls (p<0.05) (Fig 3:6:1A).
Although CD127 is expressed on pro- and pre-B cells it is not expressed on mature B cells
(reviewed in (Mazzucchelli and Durum, 2007)), therefore it was unsurprising that CD127
expression was not detected on B cells in A-T patients or normal controls (Fig 3:6:1B).
Expression was low on NK cells (median of 1.1% CD127+ve in the normal controls) but the
percentage of CD127+ve cells was significantly higher in the normal controls (p<0.05) and A-
T patients with some ATM activity (p<0.05) than in the A-T patients with no ATM activity (Fig
3:6:1C). CD127 expression was highest on NKT cells (median of 29% CD127+ in the normal
controls) but there was no significant difference between A-T patients and normal controls
(Fig 3:6:1D).
There was no significant correlation between CD127 expression and age on the majority of
cell types. However in the normal controls both the percentage of CD127+ T cells and CD127
MFI of all T cells increased significantly with age (Fig 3:6:1E). This suggests that the ability of
normal T cells from healthy individuals to proliferate in response to IL-7 may increase with
age over the 0 to 30 year age range.
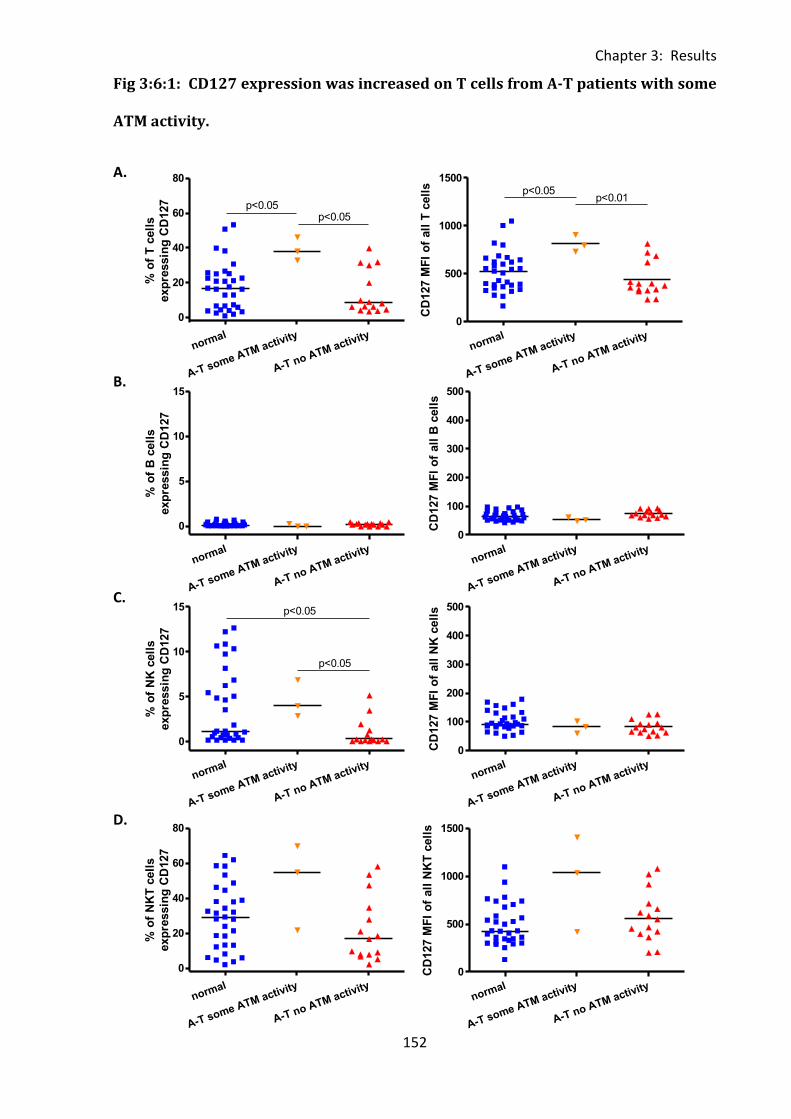
Chapter 3: Results
152
normal
A-T some ATM activity
A-T no ATM activity
0
20
40
60
80
p<0.05p<0.05
% o
f T
cell
s
exp
ressin
g C
D127
normal
A-T some ATM activity
A-T no ATM activity
0
500
1000
1500p<0.05
p<0.01
CD
127 M
FI
of
all
T c
ell
s
normal
A-T some ATM activity
A-T no ATM activity
0
5
10
15
% o
f B
cell
s
exp
ressin
g C
D127
normal
A-T some ATM activity
A-T no ATM activity
0
100
200
300
400
500
CD
127 M
FI
of
all
B c
ell
s
normal
A-T some ATM activity
A-T no ATM activity
0
5
10
15 p<0.05
p<0.05
% o
f N
K c
ell
s
exp
ressin
g C
D127
normal
A-T some ATM activity
A-T no ATM activity
0
100
200
300
400
500
CD
127 M
FI
of
all
NK
cell
s
normal
A-T some ATM activity
A-T no ATM activity
0
20
40
60
80
% o
f N
KT
cell
s
exp
ressin
g C
D127
normal
A-T some ATM activity
A-T no ATM activity
0
500
1000
1500
CD
127 M
FI
of
all
NK
T c
ell
s
Fig 3:6:1: CD127 expression was increased on T cells from A-T patients with some
ATM activity.
A.
B.
C.
D.
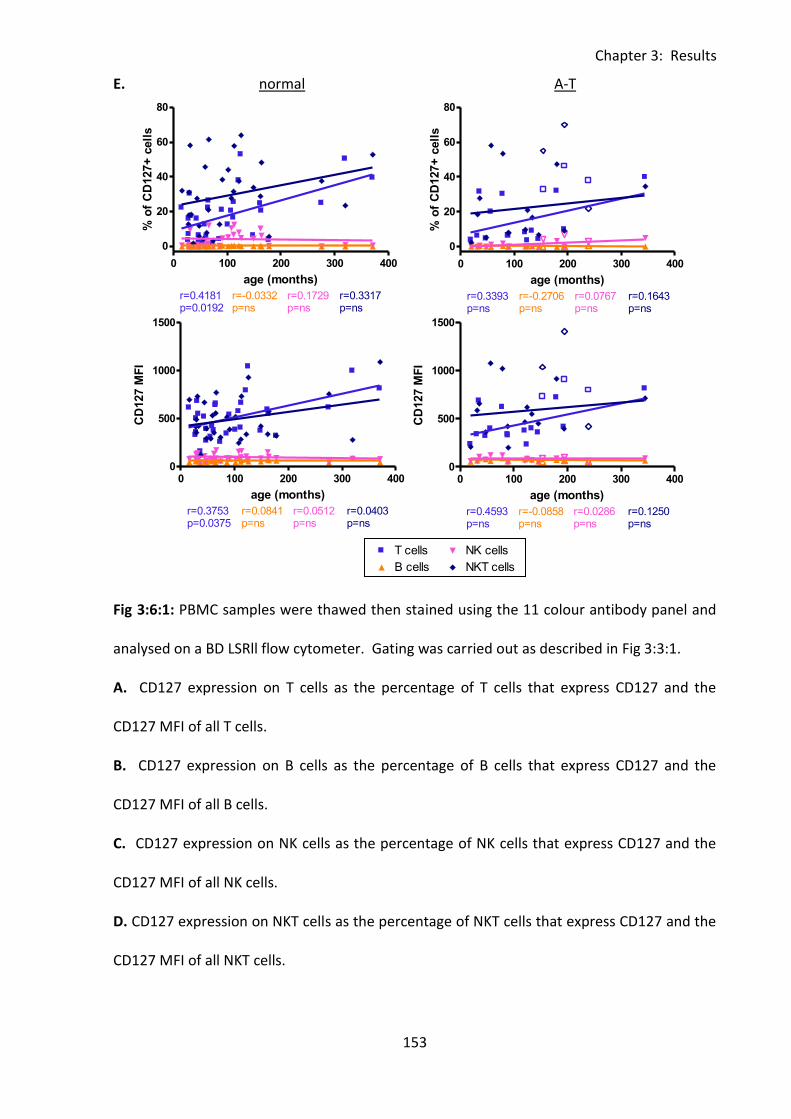
Chapter 3: Results
153
0 100 200 300 4000
25
50
75
100T cells
B cells
NK cells
NKT cells
r=0.5955p=0.0003
r=0.3191p=ns
r=-0.0972p=ns
r=0.4498p=0.0086
age (months)
% o
f C
D95+
cell
s
0 100 200 300 400
0
20
40
60
80T cells
B cells
NK cells
NKT cells
r=0.4181p=0.0192
r=-0.0332p=ns
r=0.1729p=ns
r=0.3317p=ns
age (months)
% o
f C
D127+
cell
s
0 100 200 300 4000
500
1000
1500T cells
B cells
NK cells
NKT cells
r=0.3753p=0.0375
r=0.0841p=ns
r=0.0512p=ns
r=0.0403p=ns
age (months)
CD
127 M
FI
0 100 200 300 400
0
20
40
60
80T cells
Legend
B cells
Legend
NK cells
Legend
NKT cells
Legend
r=0.3393p=ns
r=-0.2706p=ns
r=0.0767p=ns
r=0.1643p=ns
age (months)
% o
f C
D127+
cell
s
0 100 200 300 4000
500
1000
1500T cells
Legend
B cells
Legend
NK cells
Legend
NKT cells
Legend
r=0.4593p=ns
r=-0.0858p=ns
r=0.0286p=ns
r=0.1250p=ns
age (months)
CD
127 M
FI
E. normal A-T
Fig 3:6:1: PBMC samples were thawed then stained using the 11 colour antibody panel and
analysed on a BD LSRll flow cytometer. Gating was carried out as described in Fig 3:3:1.
A. CD127 expression on T cells as the percentage of T cells that express CD127 and the
CD127 MFI of all T cells.
B. CD127 expression on B cells as the percentage of B cells that express CD127 and the
CD127 MFI of all B cells.
C. CD127 expression on NK cells as the percentage of NK cells that express CD127 and the
CD127 MFI of all NK cells.
D. CD127 expression on NKT cells as the percentage of NKT cells that express CD127 and the
CD127 MFI of all NKT cells.
Chapter 3: Results
154
E. In the normal controls both the percentage of CD127+ve T cells (top left) and the CD127
MFI of all T cells (bottom left) increased significantly with age. There were no other
correlations between percentage of CD127+ve cells or CD127 MFI of cells of any cell type
and age in A-T patients or normal controls. To improve clarity and as there were no
significant correlations linear regression trend lines and r and p values for the A-T patients
with some ATM activity are not shown, however results of the correlation analysis for this
group are summarised in Table 3:6:5. (A-T plots: open symbols = some ATM activity, closed
symbols = no ATM activity).
Chapter 3: Results
155
3:6:2: CD127 expression on CD4+ and CD8+ T cells.
CD127 expression on CD4+ and CD8+ T cells was very similar (Fig 3:6:2A-C). There was no
significant difference in CD127 expression on CD4+ve or CD8+ve T cells from A-T patients
with no ATM activity compared to normal controls (Fig 3:6:2B&C). However, both the
percentages and CD127MFI of CD4+CD127+ and CD8+CD127+ T cells were significantly
higher in A-T patients with some ATM activity than A-T patients with no ATM activity or
normal controls (all p<0.05).
The A-T patients with no ATM activity showed no correlations between CD127 expression on
CD4+ or CD8+ T cells and age, however in the normal controls both the percentage and
CD127 MFI of CD4+CD127+ T cells and the CD127 MFI of CD8+CD127+ T cells increased with
age (Fig 3:6:2D).
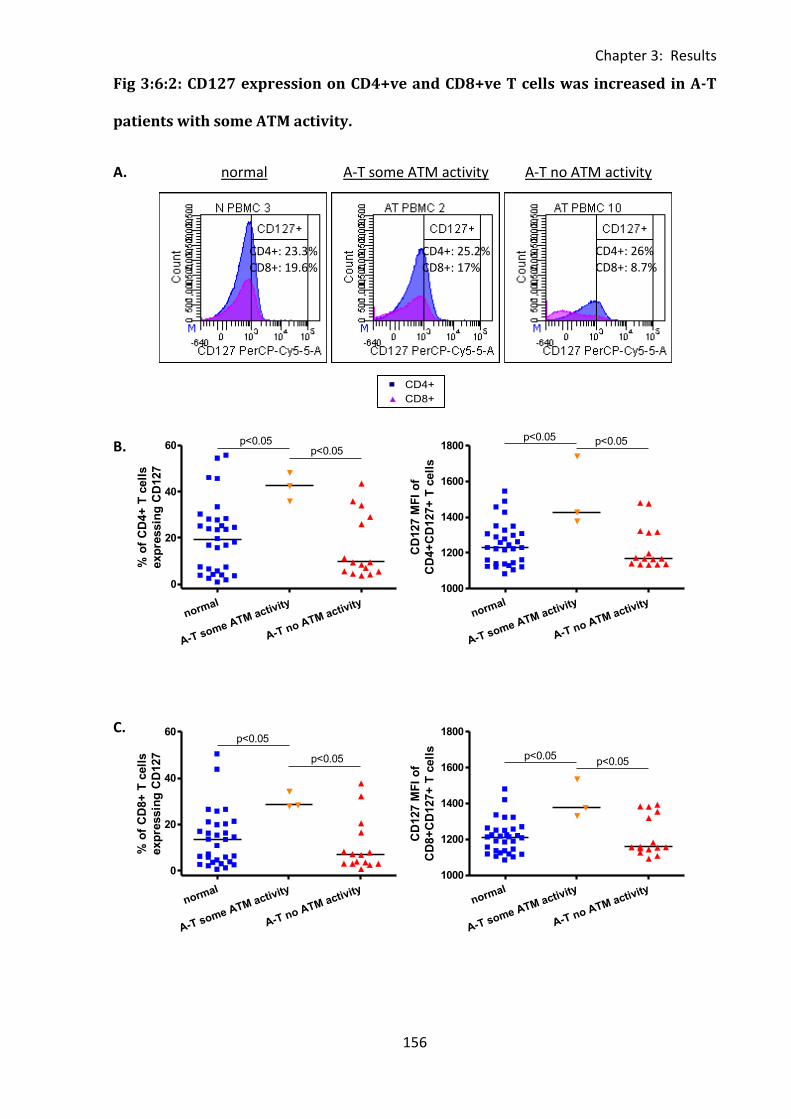
Chapter 3: Results
156
0 100 200 300 400300
500
700
900CD4+
CD8+
r=-0.0871p=ns
r=-0.0425p=ns
normal
FasL
MF
I o
f F
asL
+ T
cell
s
normal
A-T some ATM activity
A-T no ATM activity
0
20
40
60 p<0.05p<0.05
% o
f C
D4+
T c
ell
s
exp
ressin
g C
D127
normal
A-T some ATM activity
A-T no ATM activity
1000
1200
1400
1600
1800p<0.05 p<0.05
CD
127 M
FI
of
CD
4+
CD
127+
T c
ell
s
normal
A-T some ATM activity
A-T no ATM activity
0
20
40
60
p<0.05
p<0.05
% o
f C
D8+
T c
ell
s
exp
ressin
g C
D127
normal
A-T some ATM activity
A-T no ATM activity
1000
1200
1400
1600
1800
p<0.05p<0.05
CD
127 M
FI
of
CD
8+
CD
127+
T c
ell
s
Fig 3:6:2: CD127 expression on CD4+ve and CD8+ve T cells was increased in A-T
patients with some ATM activity.
A. normal A-T some ATM activity A-T no ATM activity
B.
C.
CD4+: 26% CD8+: 8.7%
CD4+: 25.2% CD8+: 17%
CD4+: 23.3% CD8+: 19.6%
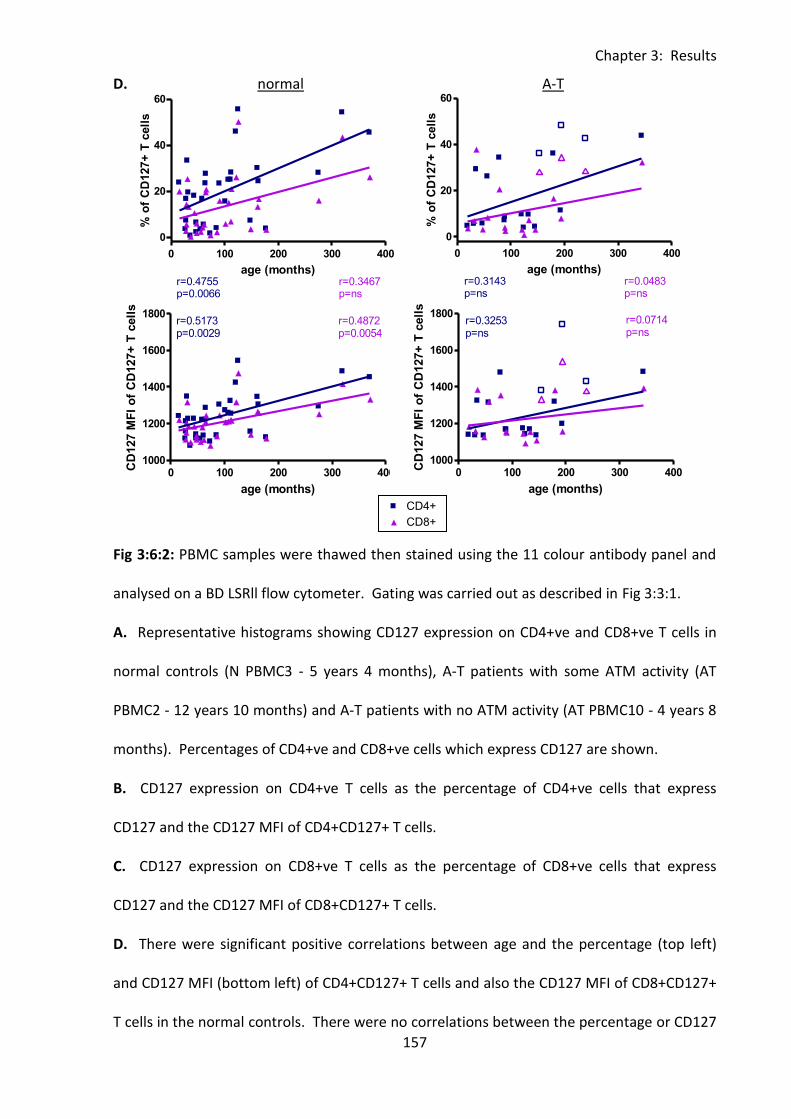
Chapter 3: Results
157
0 100 200 300 400300
500
700
900CD4+
CD8+
r=-0.0871p=ns
r=-0.0425p=ns
normal
FasL
MF
I o
f F
asL
+ T
cell
s
0 100 200 300 400
0
20
40
60CD4+
CD8+
r=0.4755p=0.0066
r=0.3467p=ns
age (months)
% o
f C
D127+
T c
ell
s
0 100 200 300 4001000
1200
1400
1600
1800CD4+
CD8+
r=0.5173p=0.0029
r=0.4872p=0.0054
age (months)
CD
127 M
FI
of
CD
127+
T c
ell
s
0 100 200 300 400
0
20
40
60CD4+
Legend
CD8+
Legend
r=0.3143p=ns
r=0.0483p=ns
age (months)
% o
f C
D127+
T c
ell
s
0 100 200 300 4001000
1200
1400
1600
1800CD4+
Legend
CD8+
Legend
r=0.3253p=ns
r=0.0714p=ns
age (months)
CD
127 M
FI
of
CD
127+
T c
ell
s
D. normal A-T
Fig 3:6:2: PBMC samples were thawed then stained using the 11 colour antibody panel and
analysed on a BD LSRll flow cytometer. Gating was carried out as described in Fig 3:3:1.
A. Representative histograms showing CD127 expression on CD4+ve and CD8+ve T cells in
normal controls (N PBMC3 - 5 years 4 months), A-T patients with some ATM activity (AT
PBMC2 - 12 years 10 months) and A-T patients with no ATM activity (AT PBMC10 - 4 years 8
months). Percentages of CD4+ve and CD8+ve cells which express CD127 are shown.
B. CD127 expression on CD4+ve T cells as the percentage of CD4+ve cells that express
CD127 and the CD127 MFI of CD4+CD127+ T cells.
C. CD127 expression on CD8+ve T cells as the percentage of CD8+ve cells that express
CD127 and the CD127 MFI of CD8+CD127+ T cells.
D. There were significant positive correlations between age and the percentage (top left)
and CD127 MFI (bottom left) of CD4+CD127+ T cells and also the CD127 MFI of CD8+CD127+
T cells in the normal controls. There were no correlations between the percentage or CD127
Chapter 3: Results
158
MFI of CD4+CD127+ or CD8+CD127+ T cells and age in A-T patient (top and bottom right).
To improve clarity, and as there were no significant correlations, linear regression trend lines
and r and p values for the A-T patients with some ATM activity are not shown, however
results of the correlation analysis for this group are summarised in Table 3:6:5. (A-T plots:
open symbols = some ATM activity, closed symbols = no ATM activity).
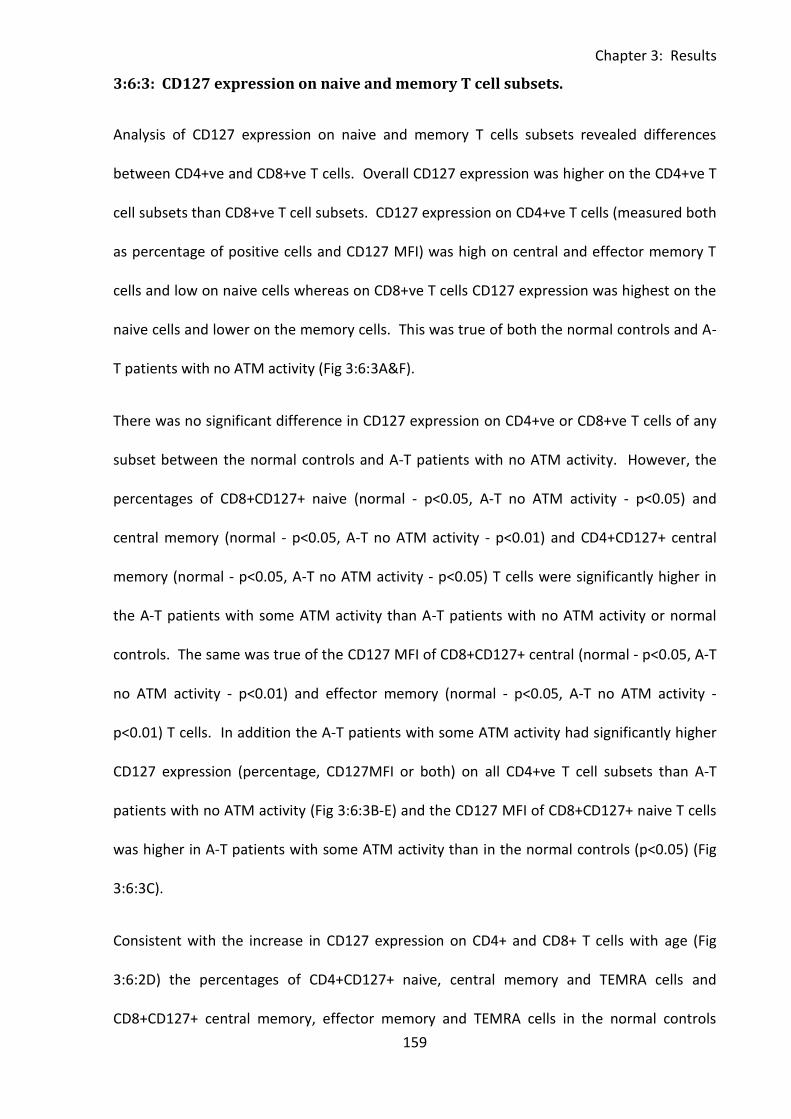
Chapter 3: Results
159
3:6:3: CD127 expression on naive and memory T cell subsets.
Analysis of CD127 expression on naive and memory T cells subsets revealed differences
between CD4+ve and CD8+ve T cells. Overall CD127 expression was higher on the CD4+ve T
cell subsets than CD8+ve T cell subsets. CD127 expression on CD4+ve T cells (measured both
as percentage of positive cells and CD127 MFI) was high on central and effector memory T
cells and low on naive cells whereas on CD8+ve T cells CD127 expression was highest on the
naive cells and lower on the memory cells. This was true of both the normal controls and A-
T patients with no ATM activity (Fig 3:6:3A&F).
There was no significant difference in CD127 expression on CD4+ve or CD8+ve T cells of any
subset between the normal controls and A-T patients with no ATM activity. However, the
percentages of CD8+CD127+ naive (normal - p<0.05, A-T no ATM activity - p<0.05) and
central memory (normal - p<0.05, A-T no ATM activity - p<0.01) and CD4+CD127+ central
memory (normal - p<0.05, A-T no ATM activity - p<0.05) T cells were significantly higher in
the A-T patients with some ATM activity than A-T patients with no ATM activity or normal
controls. The same was true of the CD127 MFI of CD8+CD127+ central (normal - p<0.05, A-T
no ATM activity - p<0.01) and effector memory (normal - p<0.05, A-T no ATM activity -
p<0.01) T cells. In addition the A-T patients with some ATM activity had significantly higher
CD127 expression (percentage, CD127MFI or both) on all CD4+ve T cell subsets than A-T
patients with no ATM activity (Fig 3:6:3B-E) and the CD127 MFI of CD8+CD127+ naive T cells
was higher in A-T patients with some ATM activity than in the normal controls (p<0.05) (Fig
3:6:3C).
Consistent with the increase in CD127 expression on CD4+ and CD8+ T cells with age (Fig
3:6:2D) the percentages of CD4+CD127+ naive, central memory and TEMRA cells and
CD8+CD127+ central memory, effector memory and TEMRA cells in the normal controls
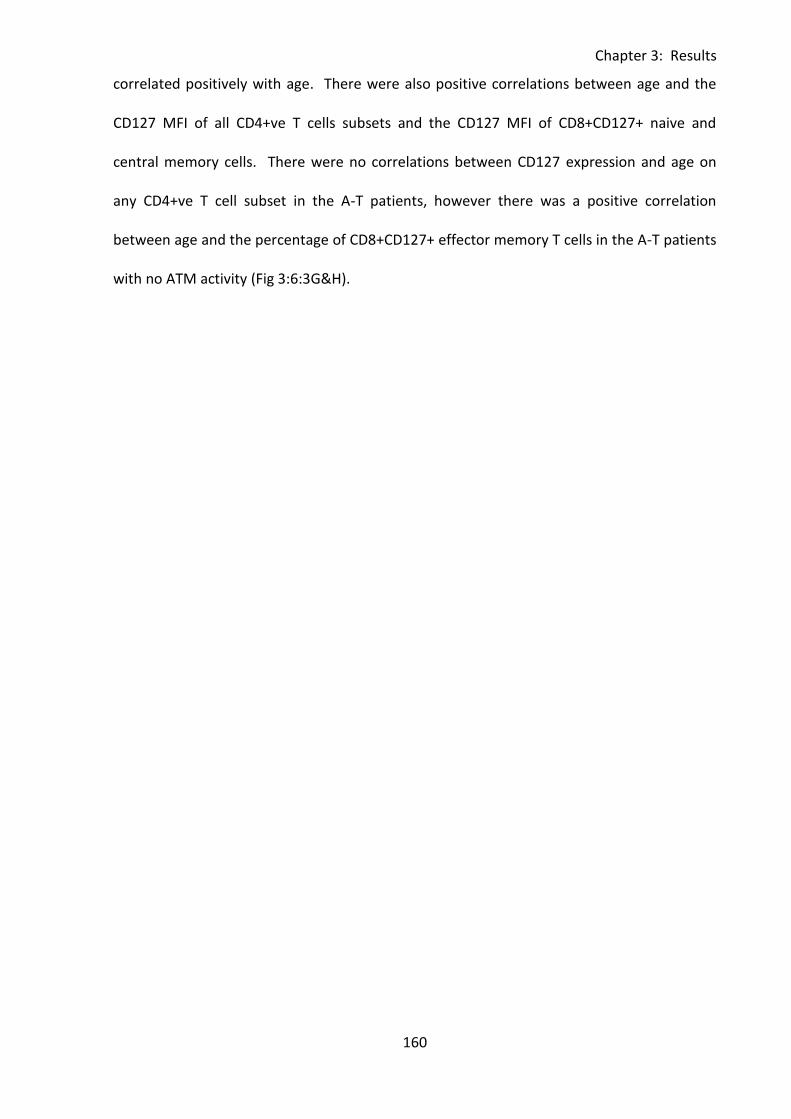
Chapter 3: Results
160
correlated positively with age. There were also positive correlations between age and the
CD127 MFI of all CD4+ve T cells subsets and the CD127 MFI of CD8+CD127+ naive and
central memory cells. There were no correlations between CD127 expression and age on
any CD4+ve T cell subset in the A-T patients, however there was a positive correlation
between age and the percentage of CD8+CD127+ effector memory T cells in the A-T patients
with no ATM activity (Fig 3:6:3G&H).
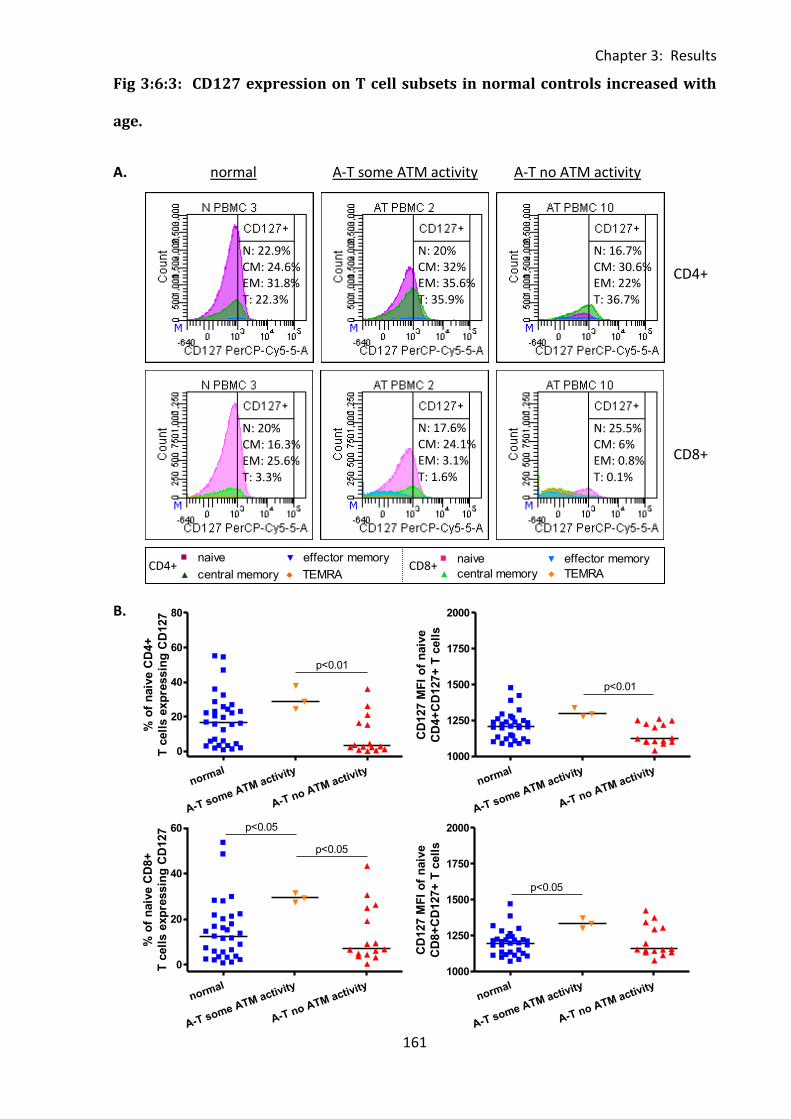
Chapter 3: Results
161
normal
A-T some ATM activity
A-T no ATM activity
0
20
40
60
80
p<0.01
% o
f n
aiv
e C
D4+
T c
ell
s e
xp
ressin
g C
D127
normal
A-T some ATM activity
A-T no ATM activity
1000
1250
1500
1750
2000
p<0.01
CD
127 M
FI
of
naiv
e
CD
4+
CD
127+
T c
ell
s
normal
A-T some ATM activity
A-T no ATM activity
0
20
40
60 p<0.05
p<0.05
% o
f n
aiv
e C
D8+
T c
ell
s e
xp
ressin
g C
D127
normal
A-T some ATM activity
A-T no ATM activity
1000
1250
1500
1750
2000
p<0.05
CD
127 M
FI
of
naiv
e
CD
8+
CD
127+
T c
ell
s
Fig 3:6:3: CD127 expression on T cell subsets in normal controls increased with
age.
A. normal A-T some ATM activity A-T no ATM activity
B.
0 100 200 300 4000
2500
5000
7500
10000naive
central memory
effector memory
TEMRA
r=0.1250p=ns
r=0.0429p=ns
r=0.0179p=ns
r=0.2714p=ns
age (months)
CD
95 M
FI
of
CD
4+
CD
95+
T c
ell
s
0 100 200 300 4000
2000
4000
6000naive
central memory
effector memory
TEMRA
r=0.3321p=ns
r=0.8000p=ns
r=0.3607p=ns
r=0.6000p=ns
age (months)
CD
95 M
FI
of
CD
8+
CD
95+
T c
ell
s
CD4+
N: 16.7% CM: 30.6% EM: 22% T: 36.7%
N: 20% CM: 32% EM: 35.6% T: 35.9%
N: 22.9% CM: 24.6% EM: 31.8% T: 22.3%
CD8+
N: 25.5% CM: 6% EM: 0.8% T: 0.1%
N: 17.6% CM: 24.1% EM: 3.1% T: 1.6%
N: 20% CM: 16.3% EM: 25.6% T: 3.3%
CD4+ CD8+
Chapter 3: Results
162
normal
A-T some ATM activity
A-T no ATM activity
0
20
40
60
80
p<0.05p<0.05
% o
f cen
tral
mem
ory
CD
4+
T c
ell
s e
xp
ressin
g C
D127
normal
A-T some ATM activity
A-T no ATM activity
1000
1250
1500
1750
2000 p<0.05
CD
127 M
FI
of
cen
tral
mem
ory
CD
4+
CD
127+
T c
ell
s
normal
A-T some ATM activity
A-T no ATM activity
0
20
40
60 p<0.05p<0.01
% o
f cen
tral
mem
ory
CD
8+
T c
ell
s e
xp
ressin
g C
D127
normal
A-T some ATM activity
A-T no ATM activity
1000
1250
1500
1750
2000
p<0.05p<0.01
CD
127 M
FI
of
cen
tral
mem
ory
CD
8+
CD
127+
T c
ell
s
normal
A-T some ATM activity
A-T no ATM activity
0
20
40
60
80 p<0.01
% o
f eff
ecto
r m
em
ory
CD
4+
T c
ell
s e
xp
ressin
g C
D127
normal
A-T some ATM activity
A-T no ATM activity
1000
1250
1500
1750
2000 p<0.01p<0.05
CD
127 M
FI
of
eff
ecto
r m
em
ory
CD
4+
CD
127+
T c
ell
s
normal
A-T some ATM activity
A-T no ATM activity
0
20
40
60
% o
f eff
ecto
r m
em
ory
CD
8+
T c
ell
s e
xp
ressin
g C
D127
normal
A-T some ATM activity
A-T no ATM activity
1000
1250
1500
1750
2000
CD
127 M
FI
of
eff
ecto
r m
em
ory
CD
8+
CD
127+
T c
ell
s
C.
D.
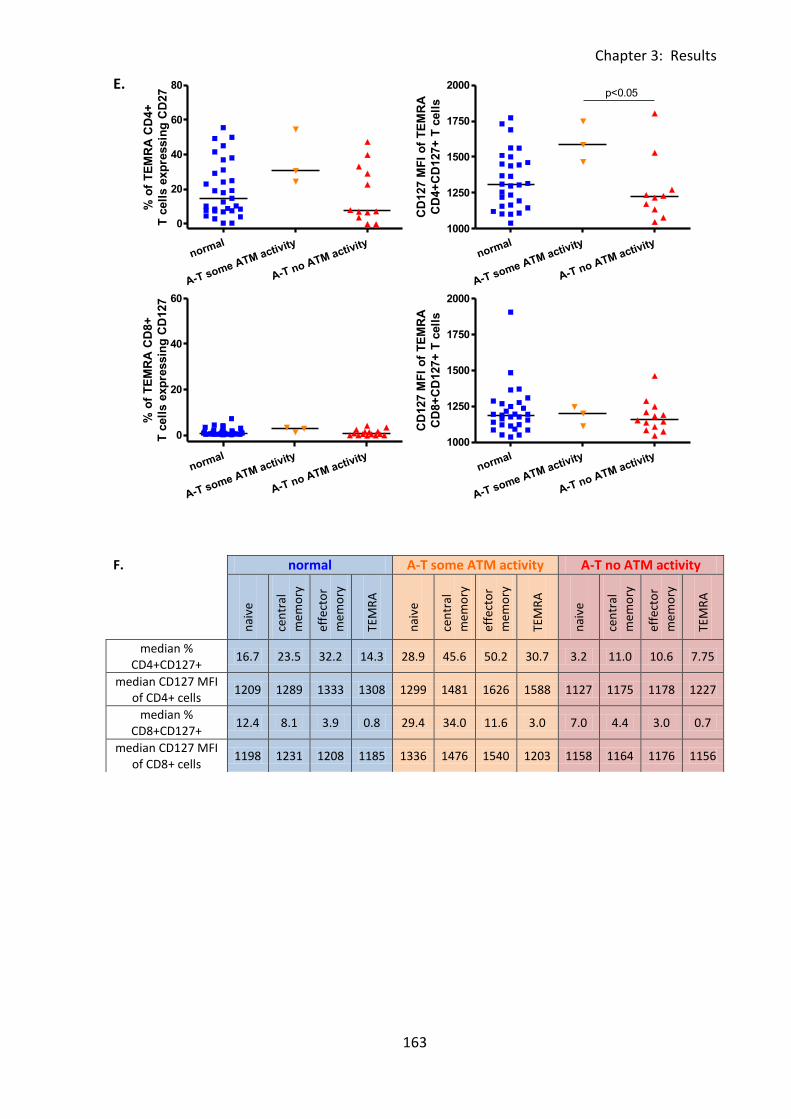
Chapter 3: Results
163
normal
A-T some ATM activity
A-T no ATM activity
0
20
40
60
80
% o
f T
EM
RA
CD
4+
T c
ell
s e
xp
ressin
g C
D27
normal
A-T some ATM activity
A-T no ATM activity
1000
1250
1500
1750
2000p<0.05
CD
127 M
FI
of
TE
MR
A
CD
4+
CD
127+
T c
ell
s
normal
A-T some ATM activity
A-T no ATM activity
0
20
40
60
% o
f T
EM
RA
CD
8+
T c
ell
s e
xp
ressin
g C
D127
normal
A-T some ATM activity
A-T no ATM activity
1000
1250
1500
1750
2000
CD
127 M
FI
of
TE
MR
A
CD
8+
CD
127+
T c
ell
s
E.
F. normal A-T some ATM activity A-T no ATM activity
nai
ve
cen
tral
me
mo
ry
effe
cto
r
me
mo
ry
TEM
RA
nai
ve
cen
tral
me
mo
ry
effe
cto
r
me
mo
ry
TEM
RA
nai
ve
cen
tral
me
mo
ry
effe
cto
r
me
mo
ry
TEM
RA
median % CD4+CD127+
16.7 23.5 32.2 14.3 28.9 45.6 50.2 30.7 3.2 11.0 10.6 7.75
median CD127 MFI of CD4+ cells
1209 1289 1333 1308 1299 1481 1626 1588 1127 1175 1178 1227
median % CD8+CD127+
12.4 8.1 3.9 0.8 29.4 34.0 11.6 3.0 7.0 4.4 3.0 0.7
median CD127 MFI of CD8+ cells
1198 1231 1208 1185 1336 1476 1540 1203 1158 1164 1176 1156
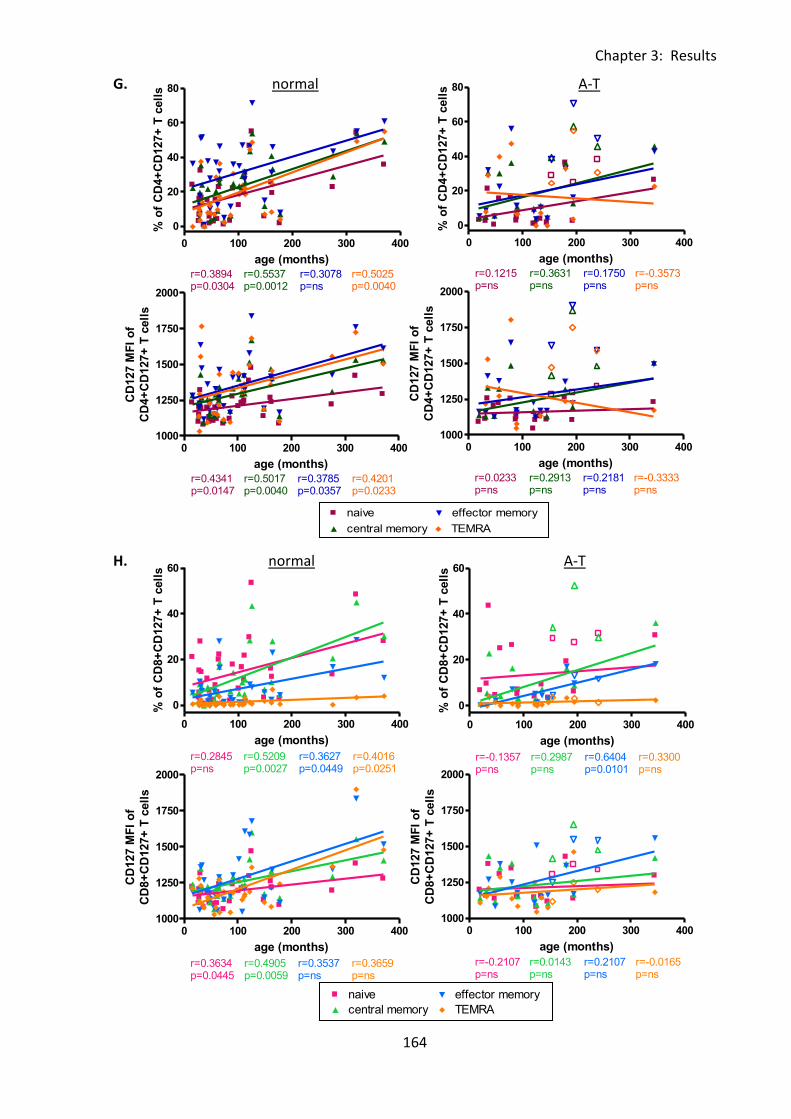
Chapter 3: Results
164
0 100 200 300 4000
2500
5000
7500
10000naive
central memory
effector memory
TEMRA
r=0.1250p=ns
r=0.0429p=ns
r=0.0179p=ns
r=0.2714p=ns
age (months)
CD
95 M
FI
of
CD
4+
CD
95+
T c
ell
s
0 100 200 300 400
0
20
40
60
80naive
central memory
effector memory
TEMRA
r=0.3894p=0.0304
r=0.5537p=0.0012
r=0.3078p=ns
r=0.5025p=0.0040
age (months)
% o
f C
D4+
CD
127+
T c
ell
s
0 100 200 300 4001000
1250
1500
1750
2000naive
central memory
effector memory
TEMRA
r=0.4341p=0.0147
r=0.5017p=0.0040
r=0.3785p=0.0357
r=0.4201p=0.0233
age (months)
CD
127 M
FI
of
CD
4+
CD
127+
T c
ell
s
0 100 200 300 4000
2000
4000
6000naive
central memory
effector memory
TEMRA
r=0.3321p=ns
r=0.8000p=ns
r=0.3607p=ns
r=0.6000p=ns
age (months)
CD
95 M
FI
of
CD
8+
CD
95+
T c
ell
s
0 100 200 300 400
0
20
40
60naive
central memory
effector memory
TEMRA
r=0.2845p=ns
r=0.5209p=0.0027
r=0.3627p=0.0449
r=0.4016p=0.0251
age (months)
% o
f C
D8+
CD
127+
T c
ell
s
0 100 200 300 4001000
1250
1500
1750
2000naive
central memory
effector memory
TEMRA
r=0.3634p=0.0445
r=0.4905p=0.0059
r=0.3537p=ns
r=0.3659p=ns
age (months)
CD
127 M
FI
of
CD
8+
CD
127+
T c
ell
s
0 100 200 300 400
0
20
40
60
80naive
Legend
central memory
Legend
effector memory
Legend
TEMRA
Legend
r=0.1215p=ns
r=0.3631p=ns
r=0.1750p=ns
r=-0.3573p=ns
age (months)
% o
f C
D4+
CD
127+
T c
ell
s0 100 200 300 400
1000
1250
1500
1750
2000naive
Legend
central memory
Legend
effector memory
Legend
TEMRA
Legend
r=0.0233p=ns
r=0.2913p=ns
r=0.2181p=ns
r=-0.3333p=ns
age (months)
CD
127 M
FI
of
CD
4+
CD
127+
T c
ell
s
0 100 200 300 400
0
20
40
60naive
Legend
central memory
Legend
effector memory
Legend
TEMRA
Legend
r=-0.1357p=ns
r=0.2987p=ns
r=0.6404p=0.0101
r=0.3300p=ns
age (months)
% o
f C
D8+
CD
127+
T c
ell
s
0 100 200 300 4001000
1250
1500
1750
2000naive
Legend
central memory
Legend
effector memory
Legend
TEMRA
Legend
r=-0.2107p=ns
r=0.0143p=ns
r=0.2107p=ns
r=-0.0165p=ns
age (months)
CD
127 M
FI
of
CD
8+
CD
127+
T c
ell
s
G. normal A-T
H. normal A-T
Chapter 3: Results
165
Fig 3:6:3: PBMC samples were thawed then stained using the 11 colour antibody panel and
analysed on a BD LSRll flow cytometer. Gating was carried out as described in Fig 3:3:1. For
correlation analysis, to improve clarity and as there were no significant correlations, linear
regression trend lines and r and p values for the A-T patients with some ATM activity are not
shown, however results of the correlation analysis for this group are summarised in Table
3:6:5. (A-T plots: open symbols = some ATM activity, closed symbols = no ATM activity).
A. Representative histograms showing CD127 expression on CD4+ve and CD8+ve T cell
subsets in normal controls (N PBMC3 - 5 years 4 months), A-T patients with some ATM
activity (AT PBMC2 - 12 years 10 months) and A-T patients with no ATM activity (AT PBMC10
- 4 years 8 months). Percentages of CD127+ve T cells in naive (N), central memory (CM),
effector memory (EM) and TEMRA (T) subsets are shown.
B. CD127 expression on naive CD4+ve and CD8+ve T cells as the percentage of naive CD4+ve
and CD8+ve T cells that express CD127 and the CD127 MFI of naive CD4+CD127+and
CD8+CD127+ T cells.
C. CD127 expression on central memory CD4+ve and CD8+ve T cells as the percentage of
central memory CD4+ve and CD8+ve cells that express CD127 and the CD127 MFI of central
memory CD4+CD127+ and CD8+CD127+ T cells.
D. CD127 expression on effector memory CD4+ve and CD8+ve T cells as the percentage of
effector memory CD4+ve and CD8+ve T cells that express CD127 and the CD127 MFI of
effector memory CD4+CD127+ and CD8+CD127+ T cells.
E. CD127 expression on TEMRA CD4+ve and CD8+ve T cells as the percentage of TEMRA
CD4+ve and CD8+ve T cells that express CD127 and the CD127 MFI of TEMRA CD4+CD127+
and CD8+CD127+ T cells.
Chapter 3: Results
166
F. Median percentages of naive and memory CD4+ve and CD8+ve T cells expressing CD127
and median CD127 MFI of naive and memory CD4+ve and CD8+ve T cells in normal controls
and A-T patients.
G. There were significant positive correlations between age and the percentages of
CD4+CD127+ naive, central memory and TEMRA cells (top left) and the CD127 MFI of
CD4+CD127+ cells of all subsets (bottom left) in the normal controls. The A-T patients
showed no correlations between CD127 expression and age (top and bottom right).
H. There were significant positive correlations between age and the percentages of
CD8+CD127+ central memory, effector memory and TEMRA T cells and also the CD127 MFI
of CD8+CD127+ naive and central memory T cells in the normal controls. In the A-T patients
with no ATM activity there was a significant correlation between age and the percentage of
CD8+CD127+ effector memory T cells but no correlations with CD127 MFI of CD8+CD127+ T
cells of any subset.
Chapter 3: Results
167
3:6:4: CD127 expression on CD56dim and CD56bright NK cells.
Finally CD127 expression on CD56dim and CD56bright NK cells was analysed. CD127
expression was higher on the CD56bright cells (Fig 3:6:4A&C), however there were no
significant differences between CD127 expression on either CD56dim (Fig 3:6:4B) or
CD56bright (Fig 3:6:4C) NK cells between the A-T patients and normal controls. There were
positive correlation between age and both the percentage of CD56brightCD127+ NK cells
and CD127 MFI of all CD56bright NK cells in the normal controls but no significant
correlations in the A-T patients (Fig 3:6:5D).
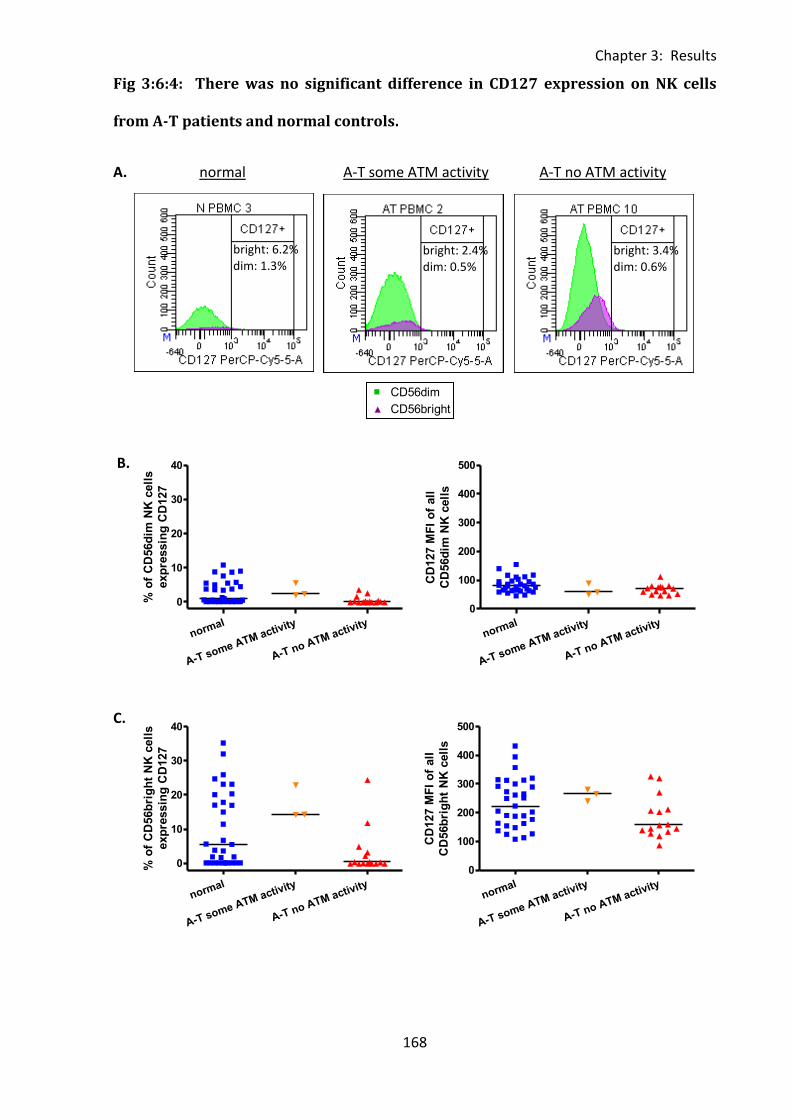
Chapter 3: Results
168
0 100 200 300 4000
500
1000
1500
2000CD56dim
CD56bright
r=0.1262p=ns
r=0.1790p=ns
age (months)
CD
95 M
FI
of
CD
95+
NK
cell
s
normal
A-T some ATM activity
A-T no ATM activity
0
10
20
30
40
% o
f C
D56d
im N
K c
ell
s
exp
ressin
g C
D127
normal
A-T some ATM activity
A-T no ATM activity
0
100
200
300
400
500
CD
127 M
FI
of
all
CD
56d
im N
K c
ell
s
normal
A-T some ATM activity
A-T no ATM activity
0
100
200
300
400
500
CD
127 M
FI
of
all
CD
56b
rig
ht
NK
cell
s
normal
A-T some ATM activity
A-T no ATM activity
0
10
20
30
40
% o
f C
D56b
rig
ht
NK
cell
s
exp
ressin
g C
D127
Fig 3:6:4: There was no significant difference in CD127 expression on NK cells
from A-T patients and normal controls.
A. normal A-T some ATM activity A-T no ATM activity
B.
C.
bright: 2.4% dim: 0.5%
bright: 3.4% dim: 0.6%
bright: 6.2% dim: 1.3%
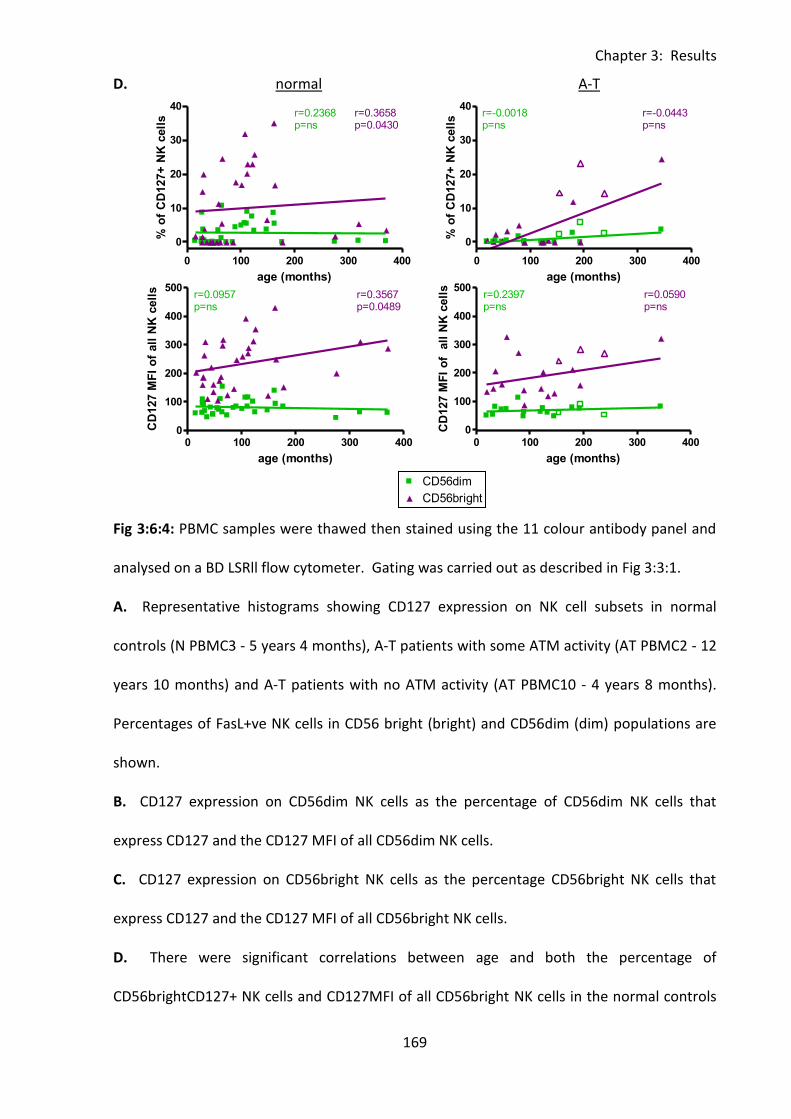
Chapter 3: Results
169
0 100 200 300 4000
500
1000
1500
2000CD56dim
CD56bright
r=0.1262p=ns
r=0.1790p=ns
age (months)
CD
95 M
FI
of
CD
95+
NK
cell
s
0 100 200 300 400
0
10
20
30
40CD56dim
CD56bright
r=0.2368p=ns
r=0.3658p=0.0430
age (months)
% o
f C
D127+
NK
cell
s
0 100 200 300 4000
100
200
300
400
500CD56dim
CD56bright
r=0.0957p=ns
r=0.3567p=0.0489
age (months)
CD
127 M
FI
of
all
NK
cell
s
0 100 200 300 400
0
10
20
30
40CD56dim
Legend
CD56bright
Legend
r=-0.0018p=ns
r=-0.0443p=ns
age (months)
% o
f C
D127+
NK
cell
s0 100 200 300 400
0
100
200
300
400
500CD56dim
Legend
CD56bright
Legend
r=0.2397p=ns
r=0.0590p=ns
age (months)
CD
127 M
FI
of
all
NK
cell
s
D. normal A-T
Fig 3:6:4: PBMC samples were thawed then stained using the 11 colour antibody panel and
analysed on a BD LSRll flow cytometer. Gating was carried out as described in Fig 3:3:1.
A. Representative histograms showing CD127 expression on NK cell subsets in normal
controls (N PBMC3 - 5 years 4 months), A-T patients with some ATM activity (AT PBMC2 - 12
years 10 months) and A-T patients with no ATM activity (AT PBMC10 - 4 years 8 months).
Percentages of FasL+ve NK cells in CD56 bright (bright) and CD56dim (dim) populations are
shown.
B. CD127 expression on CD56dim NK cells as the percentage of CD56dim NK cells that
express CD127 and the CD127 MFI of all CD56dim NK cells.
C. CD127 expression on CD56bright NK cells as the percentage CD56bright NK cells that
express CD127 and the CD127 MFI of all CD56bright NK cells.
D. There were significant correlations between age and both the percentage of
CD56brightCD127+ NK cells and CD127MFI of all CD56bright NK cells in the normal controls

Chapter 3: Results
170
(top and bottom left) but no correlations in A-T patients (top and bottom right). To improve
clarity, and as there were no significant correlations, linear regression trend lines and r and p
values for the A-T patients with some ATM activity are not shown, however results of the
correlation analysis for this group are summarised in Table 3:6:5. (A-T plots: open symbols =
some ATM activity, closed symbols = no ATM activity).
Chapter 3: Results
171
3:6:5: Lymphocytes from A-T patients with no ATM activity express normal levels
of CD127.
The results of section 3:6 including significant differences between the expression of CD127
on lymphocyte subsets (percentage of CD127+ve cells and CD127 MFI) and significant
correlations between CD127 expression and age in A-T patients and normal controls are
summarised in Table 3:6:5.
The percentage of CD127+ve NK cells was increased in normal controls compared to A-T
patients with no ATM activity, however in all other lymphocyte subsets there was no
significant difference between these two groups in terms of CD127 MFI and percentage of
CD127+ cells.
CD127 expression was increased on lymphocytes of several subsets in A-T patients with
some ATM activity. The percentages of CD127+ve T cells, CD4+CD127+ T cells, CD4+CD127+
central memory T cells, CD8+CD127+ T cells and CD8+CD127+ naive and central memory T
cells were all significantly increased in A-T patients with some ATM activity compared to
both A-T patients with no ATM activity and normal controls. The percentages of
CD4+CD127+ naive and effector memory T cells were also significantly higher in A-T patients
with some ATM activity than A-T patients with no ATM activity and the percentage of
CD127+ NK cells was significantly higher in both normal controls and A-T patients with some
ATM activity than A-T patients with no ATM activity.
Analysis of the CD127 MFI of CD127+ lymphocytes gave similar results. The CD127 MFI of
total T cells, CD4+ T cells, CD4+ effector memory T cells, CD8+ T cells and CD8+ central
memory T cells were significantly higher in A-T patients with some ATM activity than both A-
T patients with no ATM activity and normal controls. The CD127 MFI of CD4+CD127+ naive,
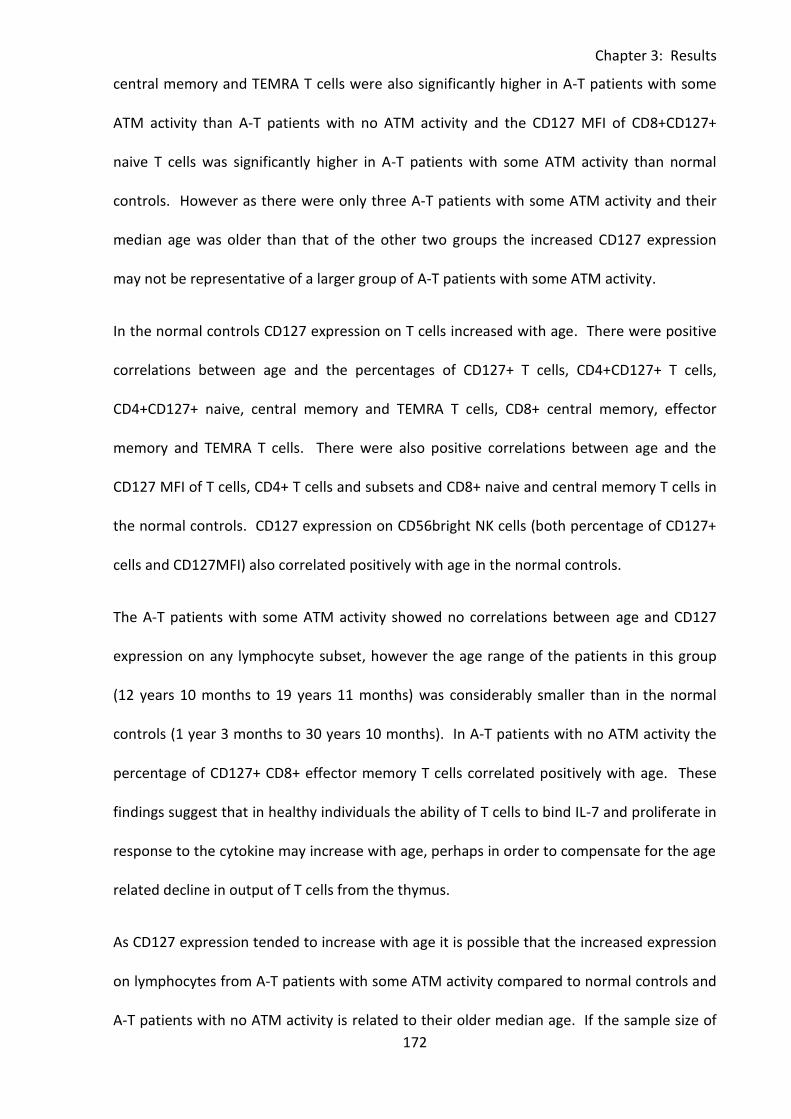
Chapter 3: Results
172
central memory and TEMRA T cells were also significantly higher in A-T patients with some
ATM activity than A-T patients with no ATM activity and the CD127 MFI of CD8+CD127+
naive T cells was significantly higher in A-T patients with some ATM activity than normal
controls. However as there were only three A-T patients with some ATM activity and their
median age was older than that of the other two groups the increased CD127 expression
may not be representative of a larger group of A-T patients with some ATM activity.
In the normal controls CD127 expression on T cells increased with age. There were positive
correlations between age and the percentages of CD127+ T cells, CD4+CD127+ T cells,
CD4+CD127+ naive, central memory and TEMRA T cells, CD8+ central memory, effector
memory and TEMRA T cells. There were also positive correlations between age and the
CD127 MFI of T cells, CD4+ T cells and subsets and CD8+ naive and central memory T cells in
the normal controls. CD127 expression on CD56bright NK cells (both percentage of CD127+
cells and CD127MFI) also correlated positively with age in the normal controls.
The A-T patients with some ATM activity showed no correlations between age and CD127
expression on any lymphocyte subset, however the age range of the patients in this group
(12 years 10 months to 19 years 11 months) was considerably smaller than in the normal
controls (1 year 3 months to 30 years 10 months). In A-T patients with no ATM activity the
percentage of CD127+ CD8+ effector memory T cells correlated positively with age. These
findings suggest that in healthy individuals the ability of T cells to bind IL-7 and proliferate in
response to the cytokine may increase with age, perhaps in order to compensate for the age
related decline in output of T cells from the thymus.
As CD127 expression tended to increase with age it is possible that the increased expression
on lymphocytes from A-T patients with some ATM activity compared to normal controls and
A-T patients with no ATM activity is related to their older median age. If the sample size of
Chapter 3: Results
173
the A-T patients with some ATM activity was increased significant correlations between
CD127 expression and age may be seen.
There was no evidence that either the high CD95 expression or lymphopenia of A-T patients
was related to abnormal expression of CD127 resulting in increased or decreased ability to
respond to IL-7.
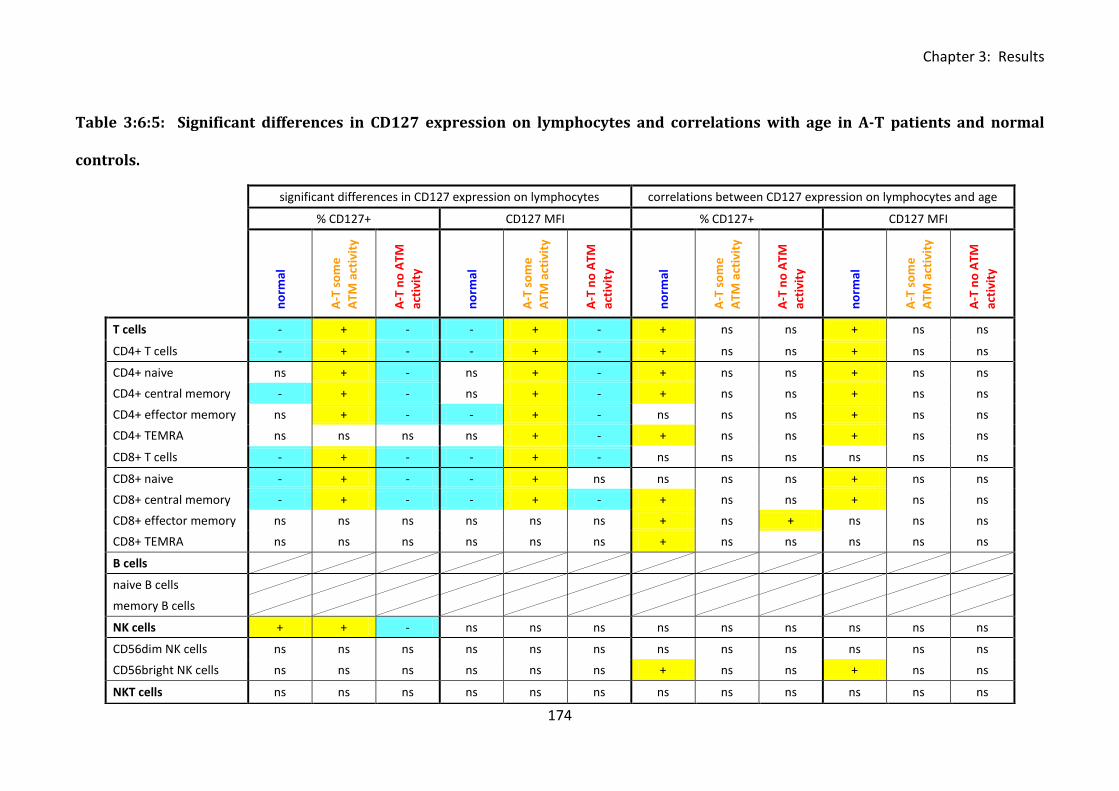
Chapter 3: Results
174
Table 3:6:5: Significant differences in CD127 expression on lymphocytes and correlations with age in A-T patients and normal
con
trol
s.
significant differences in CD127 expression on lymphocytes correlations between CD127 expression on lymphocytes and age
% CD127+ CD127 MFI % CD127+ CD127 MFI
n
orm
al
A-T
so
me
ATM
act
ivit
y
A-T
no
ATM
acti
vity
no
rmal
A-T
so
me
ATM
act
ivit
y
A-T
no
ATM
acti
vity
no
rmal
A-T
so
me
ATM
act
ivit
y
A-T
no
ATM
acti
vity
no
rmal
A-T
so
me
ATM
act
ivit
y
A-T
no
ATM
acti
vity
T cells - + - - + - + ns ns + ns ns
CD4+ T cells - + - - + - + ns ns + ns ns
CD4+ naive ns + - ns + - + ns ns + ns ns
CD4+ central memory - + - ns + - + ns ns + ns ns
CD4+ effector memory ns + - - + - ns ns ns + ns ns
CD4+ TEMRA ns ns ns ns + - + ns ns + ns ns
CD8+ T cells - + - - + - ns ns ns ns ns ns
CD8+ naive - + - - + ns ns ns ns + ns ns
CD8+ central memory - + - - + - + ns ns + ns ns
CD8+ effector memory ns ns ns ns ns ns + ns + ns ns ns
CD8+ TEMRA ns ns ns ns ns ns + ns ns ns ns ns
B cells
naive B cells
memory B cells
NK cells + + - ns ns ns ns ns ns ns ns ns
CD56dim NK cells ns ns ns ns ns ns ns ns ns ns ns ns
CD56bright NK cells ns ns ns ns ns ns + ns ns + ns ns
NKT cells ns ns ns ns ns ns ns ns ns ns ns ns
controls.
Chapter 3: Results
175
Table 3:6:5: Summary of significant differences between the expression of CD127
(percentage of CD127+ve cells and CD127 MFI of all cells) and significant correlations
between CD127 expression and age in A-T patients and normal controls.
In the first part of the table (significant differences in CD127 expression on lymphocytes)
cells containing a positive symbol (+) and highlighted in yellow indicate a significantly higher
percentage of CD127+ve cells or CD127 MFI of all cells in the corresponding group than in
the group with a cell containing a negative symbol (-) and highlighted in blue, ‘ns’ refers to
no significant difference with any group. The second part of the table summarises significant
correlations between CD127 expression and age. Yellow (+) cells indicate a positive
correlation and blue (-) cells indicate a negative correlation, ‘ns’ indicates no significant
correlation.
Chapter 3: Results
176
3:7: Measurement of plasma cytokine concentrations by ELISA.
3:7:1: Plasma cytokine concentrations of IL-7, IL-15 and IL-21.
The cytokines IL-7, IL-15 and IL-21 have important roles in proliferation and lymphocyte
homeostasis, therefore a deficiency in one of these cytokines could contribute to the
lymphopenia of A-T patients. The concentrations of the cytokines IL-7, IL-15 and IL-21 in the
plasma samples collected during blood preparation were measured by ELISA, however the
concentration of IL-21 was too low to allow detection.
Despite the lymphopenia of the A-T patients there was no increase in plasma IL-7 or IL-15
concentration compared to normal controls (Fig 3:7:1A&C). The IL-7 plasma concentration
was significantly lower in A-T patients with some ATM activity than normal controls (p<0.05)
although it was not abnormally low compared to the control samples with the lowest IL-7
concentrations. However, as the total cell number was significantly reduced in A-T patients
with no ATM activity (p<0.001) (Fig 3:2:2A) the amount of IL-7 available per cell was
significantly higher than in normal controls (p<0.05) (Fig 3:7:1B). There was no significant
difference in the amount of IL-15 available per cell in A-T patients and normal controls (Fig
3:7:1D).
Interestingly there was a significant negative correlation between IL-7 concentration and age
in A-T patients with no ATM activity (r=-0.7464, p=0.0014) but no correlation in the normal
controls or A-T patients with some ATM activity (Fig 3:7:1E). It is unlikely that the decrease
in IL-7 concentration with age in A-T patients with no ATM activity is the result of increased
usage of the cytokine by lymphocytes as with the exception of CD8+ effector memory T cells
the expression of CD127 on lymphocytes from these patients did not increase with age
Chapter 3: Results
177
(Table 3:6:5). Therefore it seems more likely that production of IL-7 by the stromal cells of
the thymus and bone marrow may decrease with age in A-T patients.
There were no correlations between plasma IL-15 concentration and age (Fig 3:7:1F) or IL-7
or IL-15 concentration and cell count (Fig 3:7:1G&H) in either A-T patients or normal
controls.
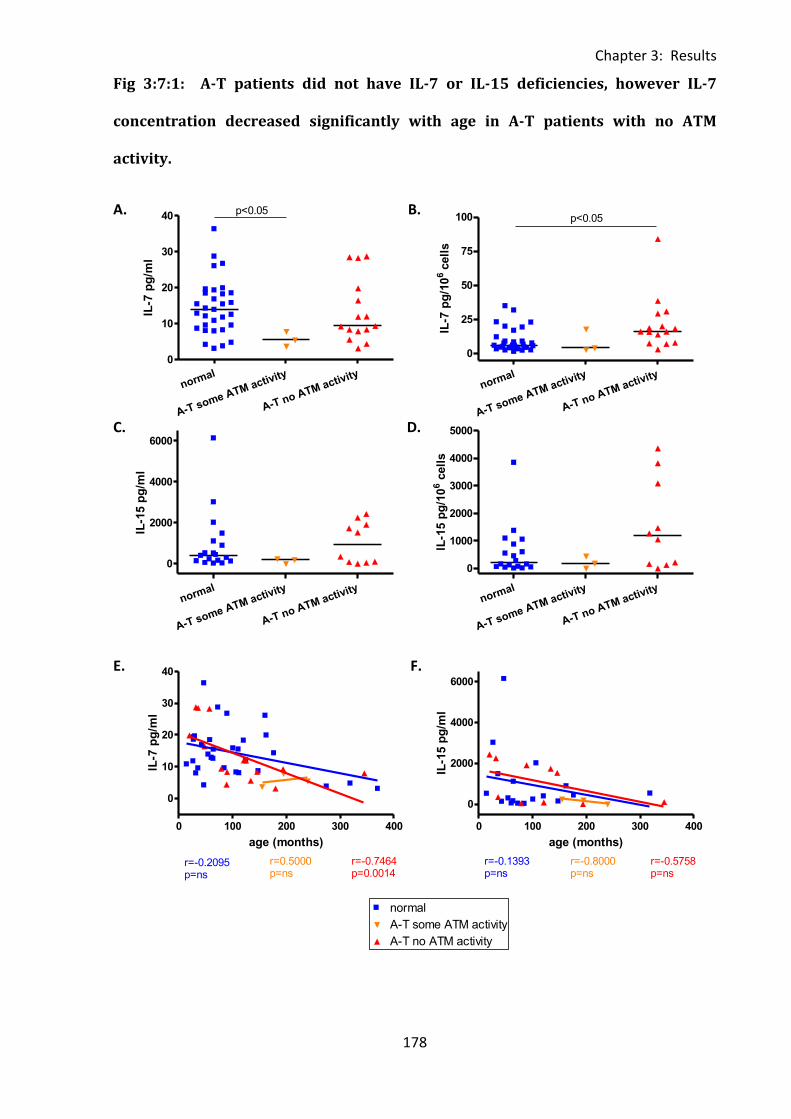
Chapter 3: Results
178
normal
A-T some ATM activity
A-T no ATM activity
0
10
20
30
40p<0.05
IL-7
pg
/ml
normal
A-T some ATM activity
A-T no ATM activity
0
25
50
75
100 p<0.05
IL-7
pg
/10
6cell
s
normal
A-T some ATM activity
A-T no ATM activity
0
2000
4000
6000
IL-1
5 p
g/m
l
normal
A-T some ATM activity
A-T no ATM activity
0
1000
2000
3000
4000
5000IL
-15 p
g/1
06 c
ell
s
0 100 200 300 400
0
2000
4000
6000 normal
A-T some ATM activity
A-T no ATM activity
r=-0.1393p=ns
r=-0.8000p=ns
r=-0.5758p=ns
age (months)
IL-1
5 p
g/m
l
0 100 200 300 400
0
10
20
30
40normal
A-T some ATM activity
A-T no ATM activity
r=-0.7464p=0.0014
r=-0.2095p=ns
r=0.5000p=ns
age (months)
IL-7
pg
/ml
Fig 3:7:1: A-T patients did not have IL-7 or IL-15 deficiencies, however IL-7
concentration decreased significantly with age in A-T patients with no ATM
activity.
A. B.
C. D.
E. F.
0 100 200 300 400
0
10
20
30
40normal
A-T some ATM activity
A-T no ATM activity
r=-0.7464p=0.0014
r=-0.2231p=ns
r=0.2000p=ns
age (months)
IL-7
pg
/ml
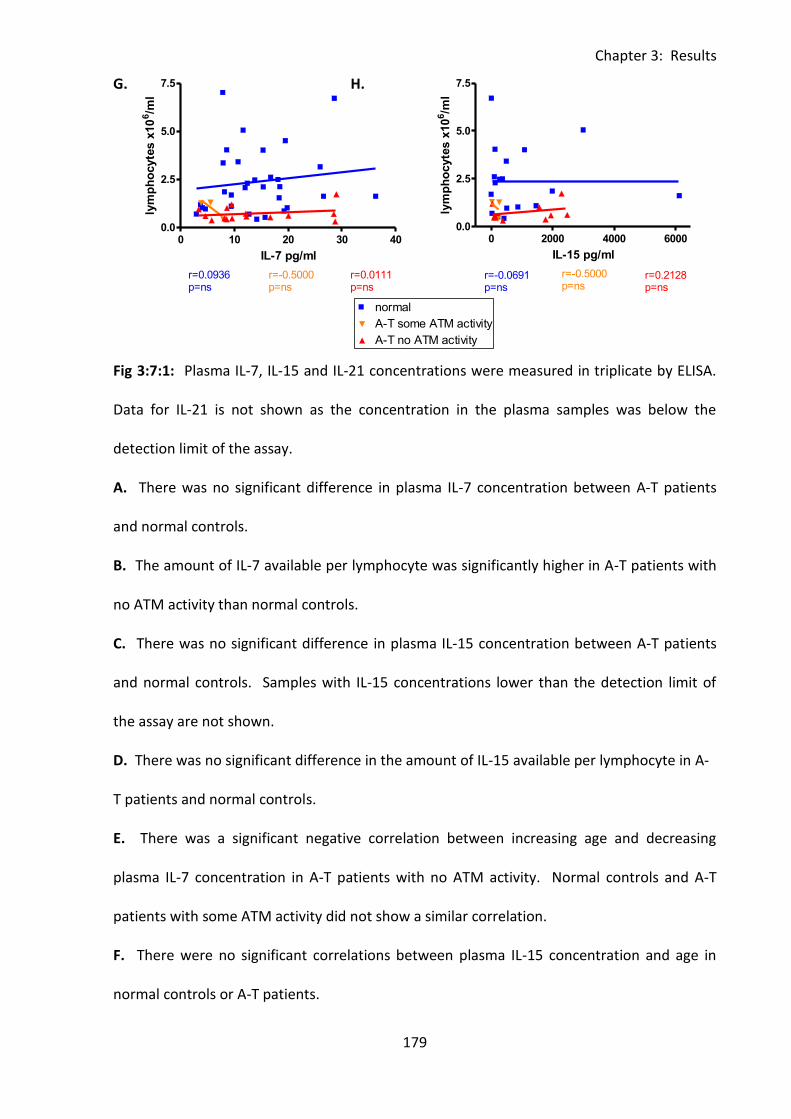
Chapter 3: Results
179
0 2000 4000 60000.0
2.5
5.0
7.5normal
A-T some ATM activity
A-T no ATM activity
r=-0.0691p=ns
r=-0.5000p=ns
r=0.2128p=ns
IL-15 pg/ml
lym
ph
ocyte
s x
10
6/m
l
0 10 20 30 400.0
2.5
5.0
7.5normal
A-T some ATM activity
A-T no ATM activity
r=0.0936p=ns
r=-0.5000p=ns
r=0.0111p=ns
IL-7 pg/ml
lym
ph
ocyte
s x
10
6/m
l
G. H.
Fig 3:7:1: Plasma IL-7, IL-15 and IL-21 concentrations were measured in triplicate by ELISA.
Data for IL-21 is not shown as the concentration in the plasma samples was below the
detection limit of the assay.
A. There was no significant difference in plasma IL-7 concentration between A-T patients
and normal controls. B. The amount of IL-7 available per lymphocyte was significantly higher in A-T patients with
no ATM activity than normal controls.
C. There was no significant difference in plasma IL-15 concentration between A-T patients
and normal controls. Samples with IL-15 concentrations lower than the detection limit of
the assay are not shown.
D. There was no significant difference in the amount of IL-15 available per lymphocyte in A-
T patients and normal controls.
E. There was a significant negative correlation between increasing age and decreasing
plasma IL-7 concentration in A-T patients with no ATM activity. Normal controls and A-T
patients with some ATM activity did not show a similar correlation.
F. There were no significant correlations between plasma IL-15 concentration and age in
normal controls or A-T patients.
0 100 200 300 400
0
10
20
30
40normal
A-T some ATM activity
A-T no ATM activity
r=-0.7464p=0.0014
r=-0.2231p=ns
r=0.2000p=ns
age (months)
IL-7
pg
/ml

Chapter 3: Results
180
G. There was no correlation between plasma IL-7 concentration and cell count in any group.
H. There was no correlation between plasma IL-15 concentration and cell count in any
group.
Chapter 3: Results
181
3:8: Correlations between IL-7 concentrations, percentages of
lymphocyte subsets and expression of CD95, FasL and CD127.
3:8:1: IL-7 concentration and lymphocyte subsets.
As IL-7 is able to induce proliferation of lymphocytes, particularly naive T cells, correlations
between IL-7 concentration in the plasma samples and the percentages of T cells, B cells, NK
cells, NKT cells and subsets in matched PBMC samples from A-T patients and normal controls
were analysed. However, there were no significant correlations between IL-7 concentration
and percentage of any lymphocyte subset in either A-T patients or normal controls (Fig
3:8:1A-F).
Under normal conditions IL-7 acts to maintain a homeostatic balance in T cell number,
therefore the lack of correlation was unsurprising in the non-lymphopenic normal controls.
However, as A-T patients are lymphopenic and consequently the amount of IL-7 available
per lymphocyte is relatively high (Fig 3:7:1B) it would be expected that increasing IL-7
concentration would induce increasing proliferation of naive T cells. This would result in a
positive correlation between IL-7 concentration and the percentages of both naive and total
T cells. The lack of correlation (Fig 3:8:1C&D) despite normal CD127 expression on naive T
cells (Fig 3:6:3B) suggests that either the IL-7 concentration was not sufficient to induce
proliferation, which seems unlikely, or that the IL-7 did not have a proliferative effect on
naive T cells from A-T patients.
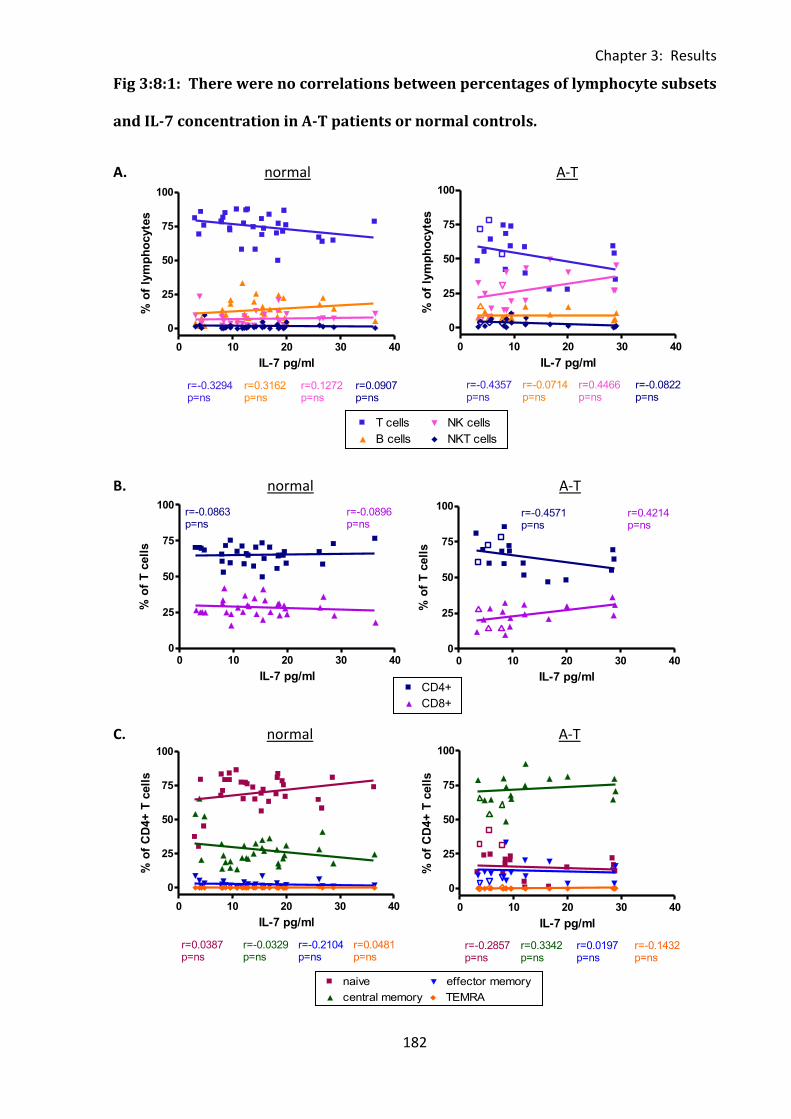
Chapter 3: Results
182
0 100 200 300 4000
25
50
75
100T cells
B cells
NK cells
NKT cells
r=0.5955p=0.0003
r=0.3191p=ns
r=-0.0972p=ns
r=0.4498p=0.0086
age (months)
% o
f C
D95+
cell
s
0 100 200 300 400300
500
700
900CD4+
CD8+
r=-0.0871p=ns
r=-0.0425p=ns
normal
FasL
MF
I o
f F
asL
+ T
cell
s
0 100 200 300 4000
2500
5000
7500
10000naive
central memory
effector memory
TEMRA
r=0.1250p=ns
r=0.0429p=ns
r=0.0179p=ns
r=0.2714p=ns
age (months)
CD
95 M
FI
of
CD
4+
CD
95+
T c
ell
s
0 10 20 30 40
0
25
50
75
100T cells
B cells
NK cells
NKT cells
r=-0.3294p=ns
r=0.3162p=ns
r=0.1272p=ns
r=0.0907p=ns
IL-7 pg/ml
% o
f ly
mp
ho
cyte
s
0 10 20 30 400
25
50
75
100CD4+
CD8+
r=-0.0863p=ns
r=-0.0896p=ns
IL-7 pg/ml
% o
f T
cell
s
0 10 20 30 40
0
25
50
75
100naive
central memory
effector memory
TEMRA
r=0.0387p=ns
r=-0.0329p=ns
r=-0.2104p=ns
r=0.0481p=ns
IL-7 pg/ml
% o
f C
D4+
T c
ell
s
0 10 20 30 40
0
25
50
75
100T cells
B cells
NK cells
NKT cells
r=-0.4357p=ns
r=-0.0714p=ns
r=0.4466p=ns
r=-0.0822p=ns
IL-7 pg/ml
% o
f ly
mp
ho
cyte
s
0 10 20 30 400
25
50
75
100CD4+
Legend
CD8+
Legend
r=-0.4571p=ns
r=0.4214p=ns
IL-7 pg/ml
% o
f T
cell
s
0 10 20 30 40
0
25
50
75
100naive
central memory
effector memory
TEMRA
r=-0.2857p=ns
r=0.3342p=ns
r=0.0197p=ns
r=-0.1432p=ns
IL-7 pg/ml
% o
f C
D4+
T c
ell
s
Fig 3:8:1: There were no correlations between percentages of lymphocyte subsets
and IL-7 concentration in A-T patients or normal controls.
A. normal A-T
B. normal A-T
C. normal A-T
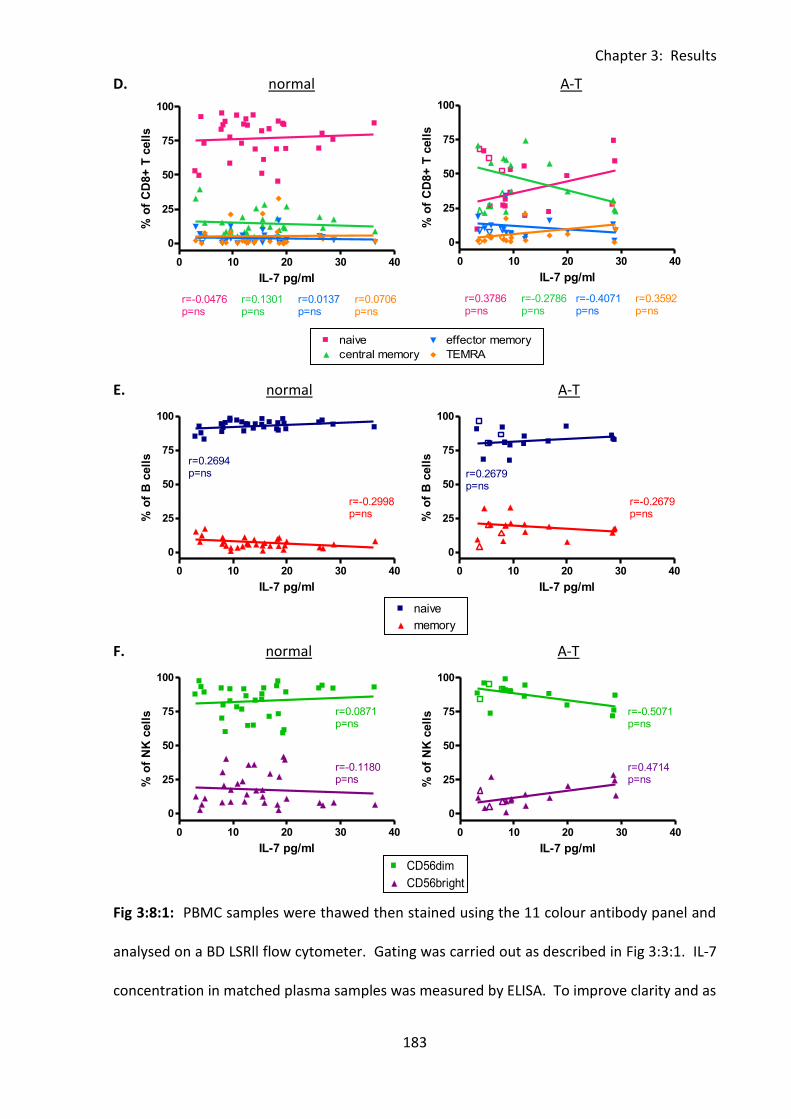
Chapter 3: Results
183
0 100 200 300 4000
2000
4000
6000naive
central memory
effector memory
TEMRA
r=0.3321p=ns
r=0.8000p=ns
r=0.3607p=ns
r=0.6000p=ns
age (months)
CD
95 M
FI
of
CD
8+
CD
95+
T c
ell
s
0 100 200 300 4000
25
50
75
100naive
memory
r=0.1957p=ns
r=0.4143p=0.0165
age (months)
% o
f C
D95+
B c
ell
s
0 100 200 300 4000
500
1000
1500
2000CD56dim
CD56bright
r=0.1262p=ns
r=0.1790p=ns
age (months)
CD
95 M
FI
of
CD
95+
NK
cell
s
0 10 20 30 40
0
25
50
75
100naive
central memory
effector memory
TEMRA
r=-0.0476p=ns
r=0.1301p=ns
r=0.0137p=ns
r=0.0706p=ns
IL-7 pg/ml
% o
f C
D8+
T c
ell
s
0 10 20 30 40
0
25
50
75
100naive
memory
r=0.2694p=ns
r=-0.2998p=ns
IL-7 pg/ml
% o
f B
cell
s
0 10 20 30 40
0
25
50
75
100CD56 dim
CD56 brightr=0.0871p=ns
r=-0.1180p=ns
IL-7 pg/ml
% o
f N
K c
ell
s
0 10 20 30 40
0
25
50
75
100naive
central memory
effector memory
TEMRA
r=0.3786p=ns
r=-0.2786p=ns
r=-0.4071p=ns
r=0.3592p=ns
IL-7 pg/ml
% o
f C
D8+
T c
ell
s
0 10 20 30 40
0
25
50
75
100naive
memory
r=0.2679p=ns
r=-0.2679p=ns
IL-7 pg/ml
% o
f B
cell
s
0 10 20 30 40
0
25
50
75
100CD56 dim
CD56 brightr=-0.5071p=ns
r=0.4714p=ns
IL-7 pg/ml
% o
f N
K c
ell
s
D. normal A-T
E. normal A-T
F. normal A-T
Fig 3:8:1: PBMC samples were thawed then stained using the 11 colour antibody panel and
analysed on a BD LSRll flow cytometer. Gating was carried out as described in Fig 3:3:1. IL-7
concentration in matched plasma samples was measured by ELISA. To improve clarity and as
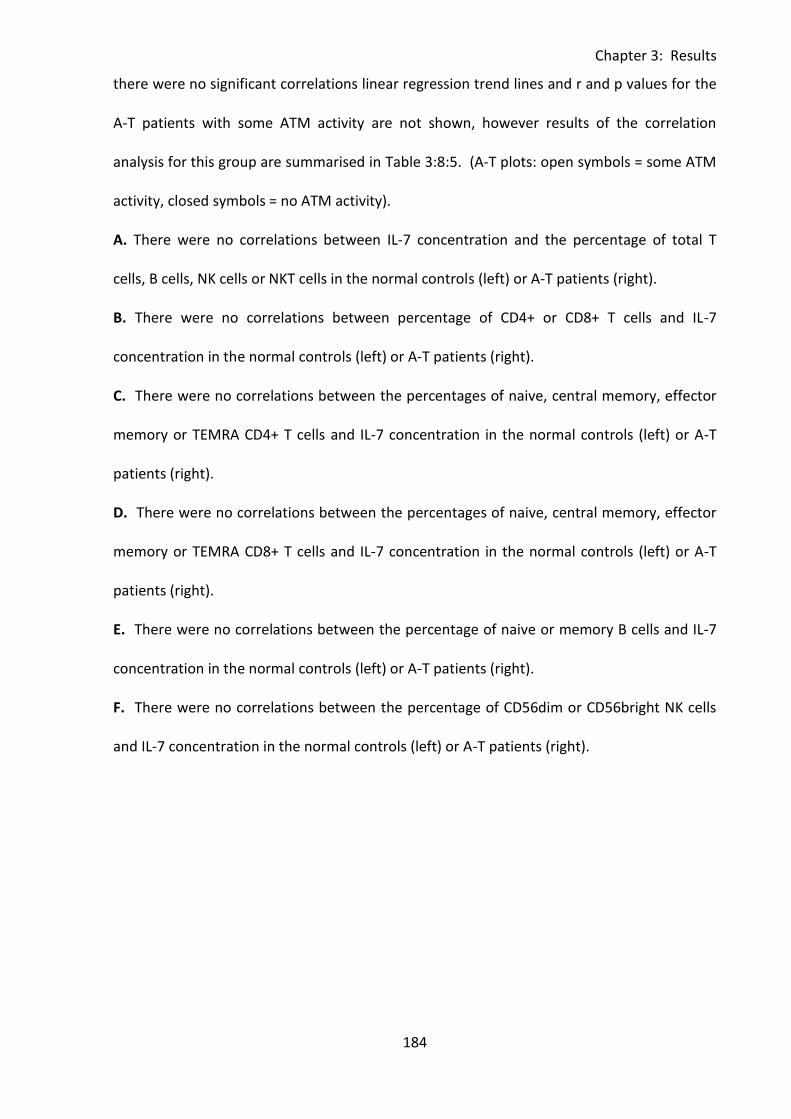
Chapter 3: Results
184
there were no significant correlations linear regression trend lines and r and p values for the
A-T patients with some ATM activity are not shown, however results of the correlation
analysis for this group are summarised in Table 3:8:5. (A-T plots: open symbols = some ATM
activity, closed symbols = no ATM activity).
A. There were no correlations between IL-7 concentration and the percentage of total T
cells, B cells, NK cells or NKT cells in the normal controls (left) or A-T patients (right).
B. There were no correlations between percentage of CD4+ or CD8+ T cells and IL-7
concentration in the normal controls (left) or A-T patients (right).
C. There were no correlations between the percentages of naive, central memory, effector
memory or TEMRA CD4+ T cells and IL-7 concentration in the normal controls (left) or A-T
patients (right).
D. There were no correlations between the percentages of naive, central memory, effector
memory or TEMRA CD8+ T cells and IL-7 concentration in the normal controls (left) or A-T
patients (right).
E. There were no correlations between the percentage of naive or memory B cells and IL-7
concentration in the normal controls (left) or A-T patients (right).
F. There were no correlations between the percentage of CD56dim or CD56bright NK cells
and IL-7 concentration in the normal controls (left) or A-T patients (right).
Chapter 3: Results
185
3:8:2: IL-7 concentration and CD95 expression on lymphocyte subsets.
Although IL-7 is able to induce proliferation of naive T cells, increased availability of the
cytokine as a result of lymphopenia may induce upregulation of CD95 leading to sensitivity
to CD95-mediated apoptosis and contributing to the lymphopenia (Brugnoni et al.,
1999;Rethi et al., 2008). This could explain the lack of correlation between IL-7
concentration and the percentage of naive T cells in A-T patients. To test this hypothesis
correlations between plasma concentrations of IL-7 and CD95 expression on lymphocyte
subsets in A-T patients and normal controls were analysed.
Firstly correlations between IL-7 concentration and CD95 expression on T cells, B cells, NK
cells and NKT cells were analysed. In the normal controls there were positive correlations
between IL-7 concentration and the percentages of CD95+ve NK cells and CD56dimCD95+
NK cells (Fig 3:8:2A&F) whereas the A-T patients with no ATM activity showed a positive
correlation between the percentage of CD95+ve T cells and IL-7 concentration (Fig 3:8:2A).
When CD4+ve and CD8+ve T cells were analysed separately there were no correlations
between CD95 expression and IL-7 concentration in the normal controls. However, there
was a significant positive correlation between the percentage of CD4+CD95+ T cells and IL-7
concentration in the A-T patients with no ATM activity (Fig 3:8:2B).
Further analysis of CD4+ve T cells according to subset revealed further correlations between
IL-7 plasma concentration and CD95 expression. In the normal controls there were positive
correlations between IL-7 concentration and the percentages of CD4+CD95+ naive and
central memory T cells and the CD95 MFI of CD4+CD95+ central and effector memory T cells.
The A-T patients with no ATM activity showed positive correlations between IL-7
concentration and the percentages of CD4+CD95+ naive, central memory and effector
Chapter 3: Results
186
memory T cells. These correlations were more significant (higher r values and lower p
values) than those seen in the normal controls. There were no correlations between the
CD95 MFI of CD4+CD95+ T cells and IL-7 concentration on any T cell subset in the A-T
patients with no ATM activity (Fig 3:8:2C).
The effect of increasing IL-7 concentration on CD95 expression on CD8+ve T cell subsets was
not as clear as for CD4+ve T cell subsets. There was a significant positive correlation
between the percentage of CD8+CD95+ naive T cells and IL-7 concentration in the normal
controls. In the A-T patients with no ATM activity there was a negative correlation between
CD95 MFI of CD8+CD95+ TEMRA cells and IL-7 concentration (Fig3:8:2D).
In the normal controls increasing IL-7 concentration had no effect on CD95 expression on
naive or memory B cells. However A-T patients with no ATM activity showed a significant
positive correlation between IL-7 concentration and the percentage of CD95+ve memory B
cells (Fig 3:8:2E). As the B cells did not express CD127 (Fig 3:6:1B) so could not bind IL-7 it is
unlikely that this correlation is genuine.
The most significant effect of increasing IL-7 concentration on CD95 expression was the
increase in CD95 expression on CD4+ve T cell subsets; this was more dramatic in the A-T
patients with no ATM activity than the normal controls (Fig 3:8:2C) and suggests that the
increased availability of IL-7 in A-T patients with no ATM activity may induce upregulation of
CD95 on CD4+ T cells. This could contribute to the CD4+ T cell deficiency of A-T patients by
increasing their sensitivity to CD95-mediated apoptosis and spontaneous apoptosis.
It is interesting that there were no correlations between IL-7 concentration and the
percentage of CD8+CD95+ T cells of any subset. As CD95 expression is increased on both
CD4+ and CD8+ T cells from A-T patients with no ATM activity (Fig 3:4:2) this suggests that
Chapter 3: Results
187
increased IL-7 availability is not the only factor responsible for increased CD95 expression on
A-T T cells.
CD95 upregulation in response to IL-7 also does not explain the increased CD95 expression
on B cells (which do not express CD127) or NKT cells from A-T patients with no ATM activity
compared to normal controls (Fig 3:4:1).
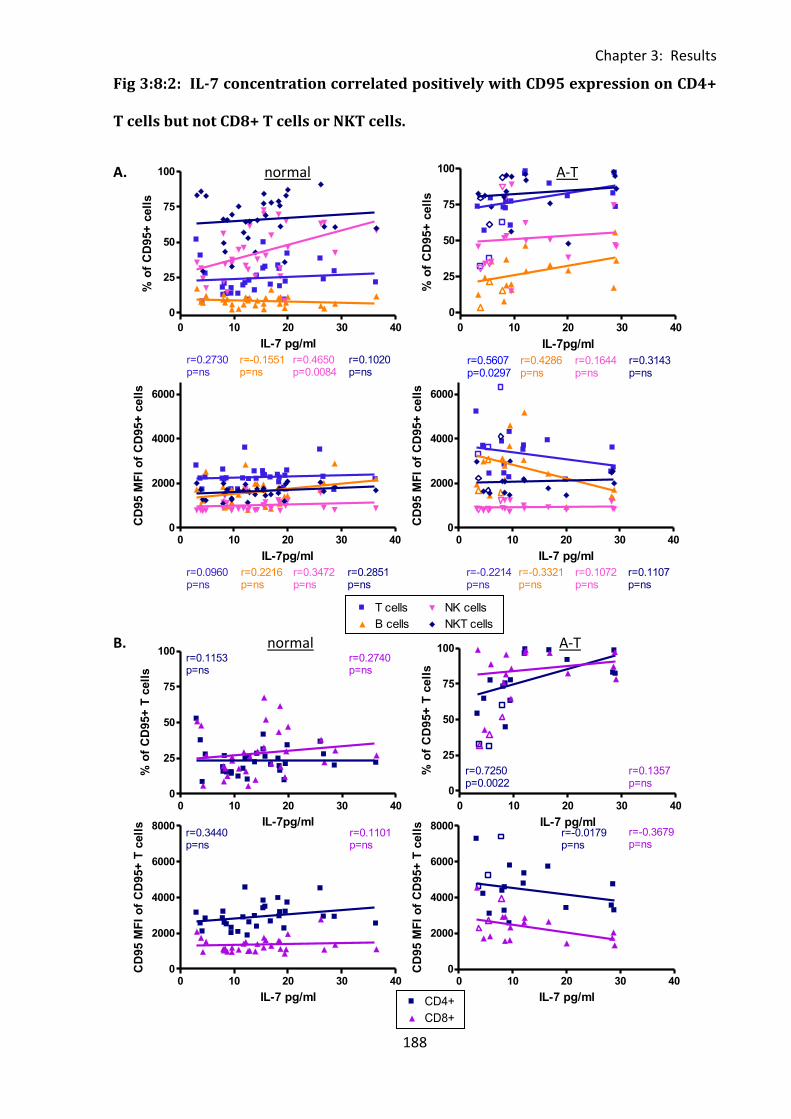
Chapter 3: Results
188
0 100 200 300 4000
25
50
75
100T cells
B cells
NK cells
NKT cells
r=0.5955p=0.0003
r=0.3191p=ns
r=-0.0972p=ns
r=0.4498p=0.0086
age (months)
% o
f C
D95+
cell
s
0 100 200 300 400300
500
700
900CD4+
CD8+
r=-0.0871p=ns
r=-0.0425p=ns
normal
FasL
MF
I o
f F
asL
+ T
cell
s
0 10 20 30 40
0
25
50
75
100T cells
B cells
NK cells
NKT cells
r=0.2730p=ns
r=0.4650p=0.0084
r=-0.1551p=ns
r=0.1020p=ns
IL-7 pg/ml
% o
f C
D95+
cell
s
0 10 20 30 400
25
50
75
100CD4+
CD8+
r=0.1153p=ns
r=0.2740p=ns
IL-7pg/ml
% o
f C
D95+
T c
ell
s
0 10 20 30 400
2000
4000
6000
8000CD4+
CD8+
r=0.3440p=ns
r=0.1101p=ns
IL-7 pg/ml
CD
95 M
FI
of
CD
95+
T c
ell
s
0 10 20 30 400
2000
4000
6000 T cells
B cells
NK cells
NKT cells
r=0.0960p=ns
r=0.2216p=ns
r=0.3472p=ns
r=0.2851p=ns
IL-7pg/ml
CD
95 M
FI
of
CD
95+
cell
s
0 10 20 30 40
0
25
50
75
100T cells
Legend
B cells
Legend
NK cells
Legend
NKT cells
Legend
r=0.5607p=0.0297
r=0.4286p=ns
r=0.1644p=ns
r=0.3143p=ns
IL-7pg/ml
% o
f C
D95+
cell
s
0 10 20 30 400
2000
4000
6000 T cells
Legend
B cells
Legend
NK cells
Legend
NKT cells
Legend
r=-0.2214p=ns
r=-0.3321p=ns
r=0.1072p=ns
r=0.1107p=ns
IL-7 pg/ml
CD
95 M
FI
of
CD
95+
cell
s
0 10 20 30 40
0
25
50
75
100CD4+
CD8+
r=0.7250p=0.0022
r=0.1357p=ns
CD8+
Legend
IL-7 pg/ml
% o
f C
D95+
T c
ell
s
0 10 20 30 400
2000
4000
6000
8000CD4+
Legend
CD8+
Legend
r=-0.0179p=ns
r=-0.3679p=ns
IL-7 pg/ml
CD
95 M
FI
of
CD
95+
T c
ell
s
Fig 3:8:2: IL-7 concentration correlated positively with CD95 expression on CD4+
T cells but not CD8+ T cells or NKT cells.
A. normal A-T
B. normal A-T
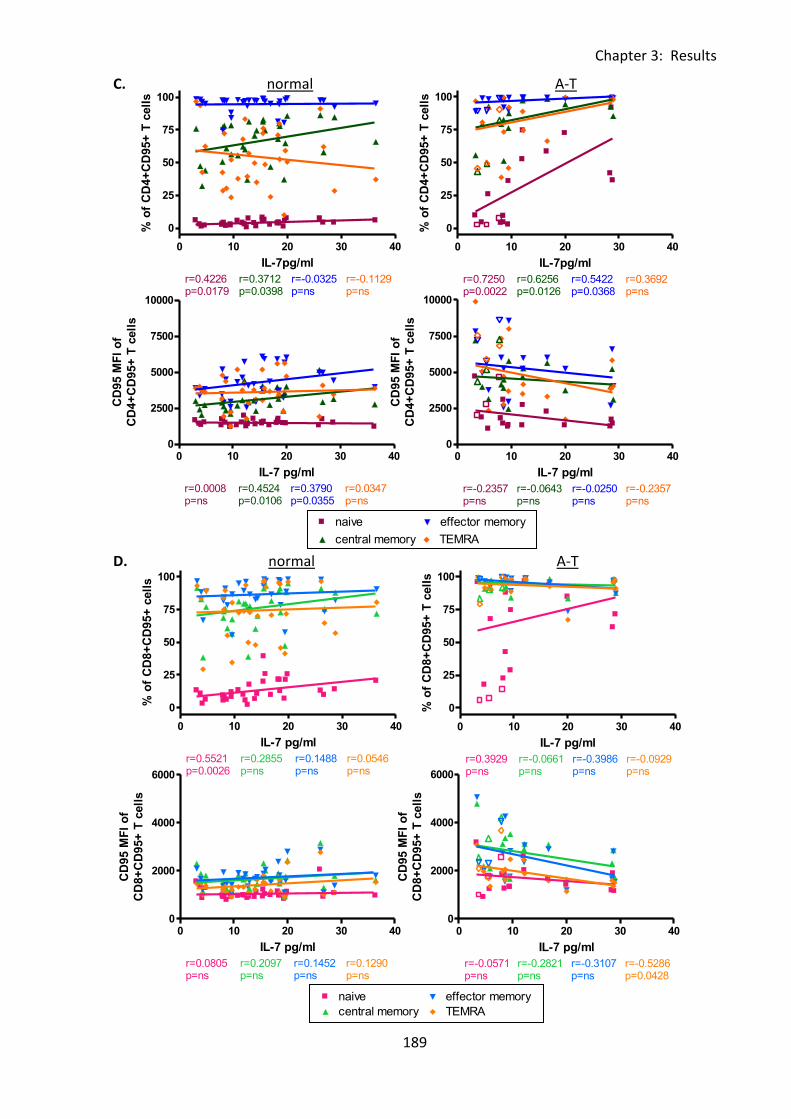
Chapter 3: Results
189
0 100 200 300 4000
2500
5000
7500
10000naive
central memory
effector memory
TEMRA
r=0.1250p=ns
r=0.0429p=ns
r=0.0179p=ns
r=0.2714p=ns
age (months)
CD
95 M
FI
of
CD
4+
CD
95+
T c
ell
s
0 100 200 300 4000
2000
4000
6000naive
central memory
effector memory
TEMRA
r=0.3321p=ns
r=0.8000p=ns
r=0.3607p=ns
r=0.6000p=ns
age (months)
CD
95 M
FI
of
CD
8+
CD
95+
T c
ell
s
0 10 20 30 40
0
25
50
75
100 naive
central memory
effector memory
TEMRA
r=0.4226p=0.0179
r=0.3712p=0.0398
r=-0.0325p=ns
r=-0.1129p=ns
IL-7pg/ml
% o
f C
D4+
CD
95+
T c
ell
s
0 10 20 30 400
2500
5000
7500
10000naive
central memory
effector memory
TEMRA
r=0.0008p=ns
r=0.4524p=0.0106
r=0.3790p=0.0355
r=0.0347p=ns
IL-7 pg/ml
CD
95 M
FI
of
CD
4+
CD
95+
T c
ell
s
0 10 20 30 40
0
25
50
75
100 naive
central memory
effector memory
TEMRA
r=0.5521p=0.0026
r=0.2855p=ns
r=0.1488p=ns
r=0.0546p=ns
IL-7 pg/ml
% o
f C
D8+
CD
95+
cell
s
0 10 20 30 400
2000
4000
6000naive
central memory
effector memory
TEMRA
r=0.0805p=ns
r=0.2097p=ns
r=0.1452p=ns
r=0.1290p=ns
IL-7 pg/ml
CD
95 M
FI
of
CD
8+
CD
95+
T c
ell
s
0 10 20 30 40
0
25
50
75
100 naive
central memory
effector memory
TEMRA
Legend
Legend
Legend
Legend
r=0.7250p=0.0022
r=0.6256p=0.0126
r=0.5422p=0.0368
r=0.3692p=ns
IL-7pg/ml
% o
f C
D4+
CD
95+
T c
ell
s
0 10 20 30 400
2500
5000
7500
10000naive
central memory
effector memory
TEMRA
Legend
Legend
Legend
Legend
r=-0.2357p=ns
r=-0.0643p=ns
r=-0.0250p=ns
r=-0.2357p=ns
IL-7 pg/ml
CD
95 M
FI
of
CD
4+
CD
95+
T c
ell
s
0 10 20 30 40
0
25
50
75
100 naive
central memory
effector memory
TEMRA
Legend
Legend
Legend
Legend
r=0.3929p=ns
r=-0.0661p=ns
r=-0.3986p=ns
r=-0.0929p=ns
IL-7 pg/ml
% o
f C
D8+
CD
95+
T c
ell
s
0 10 20 30 400
2000
4000
6000naive
central memory
effector memory
TEMRA
Legend
Legend
Legend
Legend
r=-0.0571p=ns
r=-0.2821p=ns
r=-0.3107p=ns
r=-0.5286p=0.0428
IL-7 pg/ml
CD
95 M
FI
of
CD
8+
CD
95+
T c
ell
s
C. normal A-T
D. normal A-T
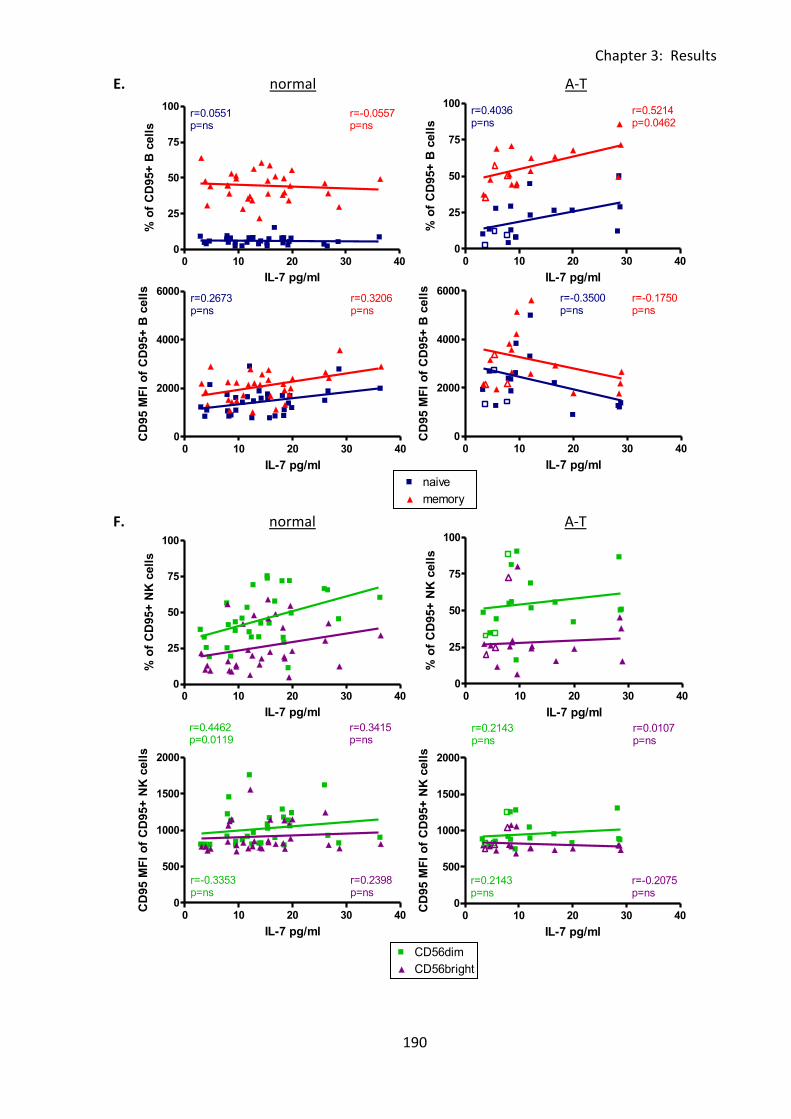
Chapter 3: Results
190
0 100 200 300 4000
25
50
75
100naive
memory
r=0.1957p=ns
r=0.4143p=0.0165
age (months)
% o
f C
D95+
B c
ell
s
0 100 200 300 4000
500
1000
1500
2000CD56dim
CD56bright
r=0.1262p=ns
r=0.1790p=ns
age (months)
CD
95 M
FI
of
CD
95+
NK
cell
s
0 10 20 30 400
25
50
75
100naive
memory
r=0.0551p=ns
r=-0.0557p=ns
IL-7 pg/ml
% o
f C
D95+
B c
ell
s
0 10 20 30 400
2000
4000
6000naive
memory
r=0.2673p=ns
r=0.3206p=ns
IL-7 pg/ml
CD
95 M
FI
of
CD
95+
B c
ell
s
0 10 20 30 400
25
50
75
100CD56dim
CD56bright
r=0.4462p=0.0119
r=0.3415p=ns
IL-7 pg/ml
% o
f C
D95+
NK
cell
s
0 10 20 30 400
500
1000
1500
2000CD56dim
CD56bright
r=-0.3353p=ns
r=0.2398p=ns
IL-7 pg/ml
CD
95 M
FI
of
CD
95+
NK
cell
s
0 10 20 30 400
25
50
75
100naive
memory
Legend
Legend
r=0.4036p=ns
r=0.5214p=0.0462
IL-7 pg/ml
% o
f C
D95+
B c
ell
s
0 10 20 30 400
2000
4000
6000naive
memory
Legend
Legend
r=-0.3500p=ns
r=-0.1750p=ns
IL-7 pg/ml
CD
95 M
FI
of
CD
95+
B c
ell
s
0 10 20 30 400
25
50
75
100CD56dim
CD56bright
Legend
Legend
r=0.2143p=ns
r=0.0107p=ns
IL-7 pg/ml
% o
f C
D95+
NK
cell
s
0 10 20 30 400
500
1000
1500
2000CD56dim
CD56bright
Legend
Legend
r=0.2143p=ns
r=-0.2075p=ns
IL-7 pg/ml
CD
95 M
FI
of
CD
95+
NK
cell
s
E. normal A-T
F. normal A-T
Chapter 3: Results
191
Fig 3:8:2: PBMC samples were thawed then stained using the 11 colour antibody panel and
analysed on a BD LSRll flow cytometer. Gating was carried out as described in Fig 3:3:1. To
improve clarity, and as there were no significant correlations, linear regression trend lines
and r and p values for the A-T patients with some ATM activity are not shown, however the
results of the correlation analysis for this group are summarised in Table 3:8:5. (A-T plots:
open symbols = some ATM activity, closed symbols = no ATM activity).
A. Analysis of correlations between IL-7 concentration and CD95 expression on T cells, B
cells, NK cells and NKT cells. The normal controls showed a positive correlation between the
percentage of CD95+ve NK cells and IL-7 concentration (top left). The A-T patients with no
ATM activity showed a positive correlation between the percentage of CD95+ve T cells and
IL-7 concentration (top right). There were no correlations between CD95 MFI of CD95+ve
cells of any type in either A-T patients or normal controls (bottom left and right).
B. There were no correlations between either percentage of CD4+CD95+ or CD8+CD95+ T
cells (top left) or CD95 MFI of CD4+CD95+ or CD8+CD95+ T cells (bottom left) and IL-7
concentration in the normal controls. The A-T patients with no ATM activity showed a
significant positive correlation between the percentage of CD4+CD95+ T cells and IL-7
concentration (top right).
C. CD4+ve T cells in the normal controls showed positive correlations between IL-7
concentration and the percentages of CD4+CD95+ naive and central memory T cells (top left)
and CD95 MFI of CD4+CD95+ central and effector memory T cells (bottom left). The A-T
patients with no ATM activity showed positive correlations between the percentages of
CD4+CD95+ naive, central memory and effector memory T cells and IL-7 concentration.
There were no correlations between CD95 MFI of CD4+CD95+ T cells and IL-7 concentration
on any T cell subset in the A-T patients with no ATM activity (bottom right).
Chapter 3: Results
192
D. There was a significant positive correlation between IL-7 concentration and the
percentage of CD8+CD95+ naive T cells in the normal controls (top left) and a significant
negative correlation between the CD95 MFI of CD8+CD95+ TEMRA cells and IL-7
concentration in the A-T patients with no ATM activity (bottom right).
E. Increasing IL-7 concentration had no effect on CD95 expression on naive or memory B
cells in the normal controls (top and bottom left). There was a significant positive
correlation between IL-7 concentration and the percentage of CD95+ve memory B cells in
the A-T patients with no ATM activity (top right) but no correlations with CD95 MFI of
CD95+ve naive or memory B cells (bottom right).
F. There was a significant positive correlation between the percentage of CD56dimCD95+
NK cells and IL-7 concentration in the normal controls (top left) but no correlations in the A-T
patients with no ATM activity (top right). There were also no correlations between CD95
MFI of CD56brightCD95+ or CD56dimCD95+ NK cells and IL-7 concentration in either normal
controls or A-T patients (bottom left and right).
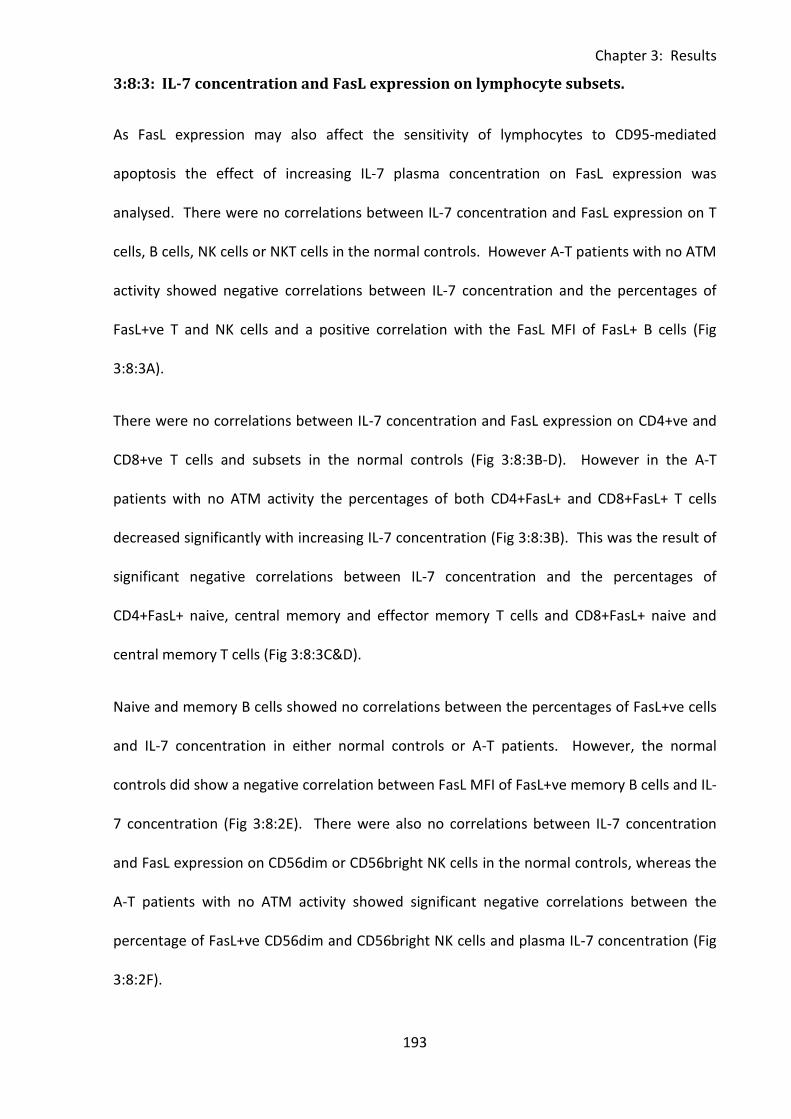
Chapter 3: Results
193
3:8:3: IL-7 concentration and FasL expression on lymphocyte subsets.
As FasL expression may also affect the sensitivity of lymphocytes to CD95-mediated
apoptosis the effect of increasing IL-7 plasma concentration on FasL expression was
analysed. There were no correlations between IL-7 concentration and FasL expression on T
cells, B cells, NK cells or NKT cells in the normal controls. However A-T patients with no ATM
activity showed negative correlations between IL-7 concentration and the percentages of
FasL+ve T and NK cells and a positive correlation with the FasL MFI of FasL+ B cells (Fig
3:8:3A).
There were no correlations between IL-7 concentration and FasL expression on CD4+ve and
CD8+ve T cells and subsets in the normal controls (Fig 3:8:3B-D). However in the A-T
patients with no ATM activity the percentages of both CD4+FasL+ and CD8+FasL+ T cells
decreased significantly with increasing IL-7 concentration (Fig 3:8:3B). This was the result of
significant negative correlations between IL-7 concentration and the percentages of
CD4+FasL+ naive, central memory and effector memory T cells and CD8+FasL+ naive and
central memory T cells (Fig 3:8:3C&D).
Naive and memory B cells showed no correlations between the percentages of FasL+ve cells
and IL-7 concentration in either normal controls or A-T patients. However, the normal
controls did show a negative correlation between FasL MFI of FasL+ve memory B cells and IL-
7 concentration (Fig 3:8:2E). There were also no correlations between IL-7 concentration
and FasL expression on CD56dim or CD56bright NK cells in the normal controls, whereas the
A-T patients with no ATM activity showed significant negative correlations between the
percentage of FasL+ve CD56dim and CD56bright NK cells and plasma IL-7 concentration (Fig
3:8:2F).
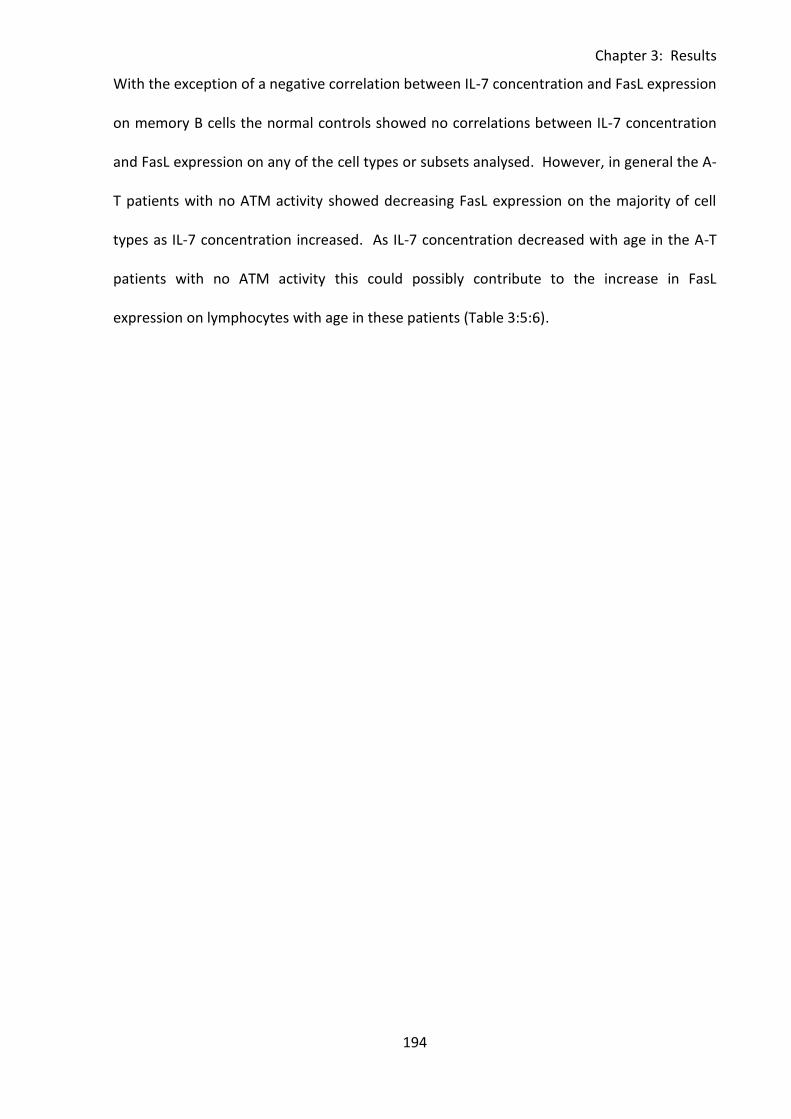
Chapter 3: Results
194
With the exception of a negative correlation between IL-7 concentration and FasL expression
on memory B cells the normal controls showed no correlations between IL-7 concentration
and FasL expression on any of the cell types or subsets analysed. However, in general the A-
T patients with no ATM activity showed decreasing FasL expression on the majority of cell
types as IL-7 concentration increased. As IL-7 concentration decreased with age in the A-T
patients with no ATM activity this could possibly contribute to the increase in FasL
expression on lymphocytes with age in these patients (Table 3:5:6).
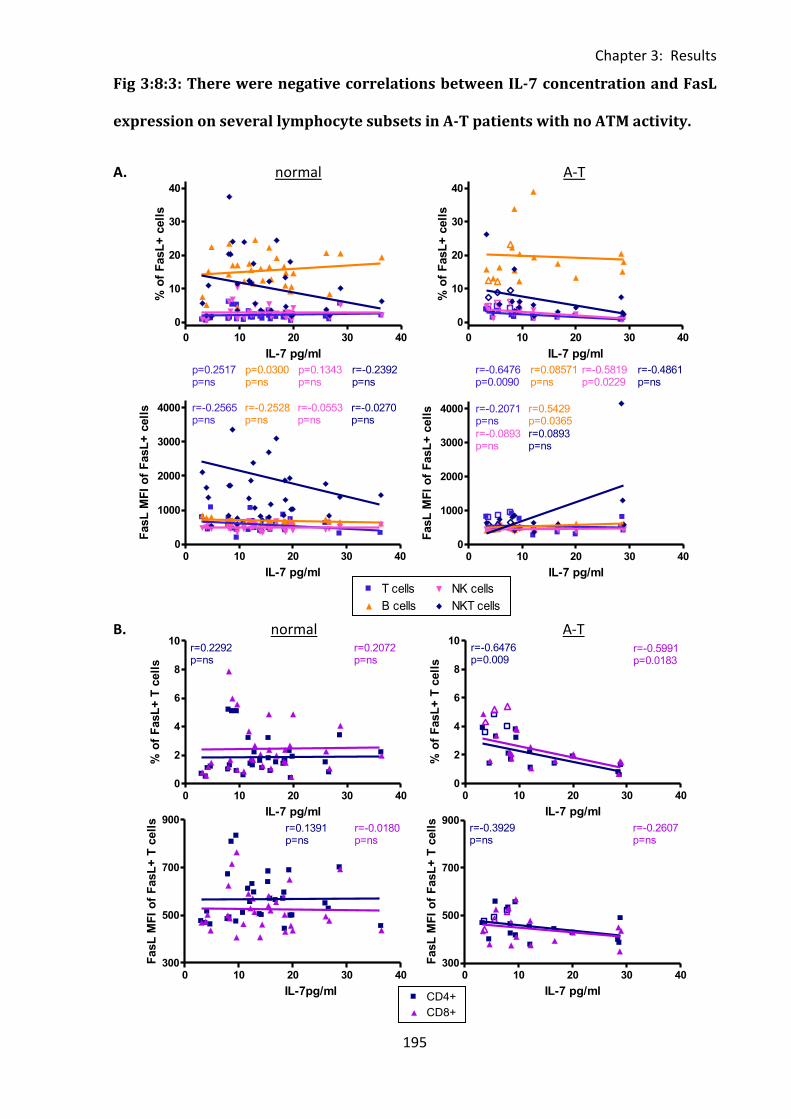
Chapter 3: Results
195
0 100 200 300 4000
25
50
75
100T cells
B cells
NK cells
NKT cells
r=0.5955p=0.0003
r=0.3191p=ns
r=-0.0972p=ns
r=0.4498p=0.0086
age (months)
% o
f C
D95+
cell
s
0 100 200 300 400300
500
700
900CD4+
CD8+
r=-0.0871p=ns
r=-0.0425p=ns
normal
FasL
MF
I o
f F
asL
+ T
cell
s
0 10 20 30 400
1000
2000
3000
4000 T cells
B cells
NK cells
NKT cells
r=-0.2565p=ns
r=-0.2528p=ns
r=-0.0553p=ns
r=-0.0270p=ns
IL-7 pg/ml
FasL
MF
I o
f F
asL
+ c
ell
s
0 10 20 30 40
0
10
20
30
40 T cells
B cells
NK cells
NKT cells
p=0.2517p=ns
p=0.0300p=ns
p=0.1343p=ns
r=-0.2392p=ns
IL-7 pg/ml
% o
f F
asL
+ c
ell
s
0 10 20 30 400
2
4
6
8
10CD4+
CD8+
r=0.2292p=ns
r=0.2072p=ns
IL-7 pg/ml
% o
f F
asL
+ T
cell
s
0 10 20 30 40300
500
700
900CD4+
CD8+
r=0.1391p=ns
r=-0.0180p=ns
IL-7pg/ml
FasL
MF
I o
f F
asL
+ T
cell
s
0 10 20 30 40
0
10
20
30
40 T cells
Legend
B cells
Legend
NK cells
Legend
NKT cells
Legend
r=-0.6476p=0.0090
r=0.08571p=ns
r=-0.5819p=0.0229
r=-0.4861p=ns
IL-7 pg/ml
% o
f F
asL
+ c
ell
s
0 10 20 30 400
1000
2000
3000
4000 T cells
Legend
B cells
Legend
NK cells
Legend
NKT cells
Legend
r=-0.2071p=ns
r=0.5429p=0.0365
r=-0.0893p=ns
r=0.0893p=ns
IL-7 pg/ml
FasL
MF
I o
f F
asL
+ c
ell
s
0 10 20 30 400
2
4
6
8
10CD4+
Legend
CD8+
Legend
r=-0.6476p=0.009
r=-0.5991p=0.0183
IL-7 pg/ml
% o
f F
asL
+ T
cell
s
0 10 20 30 40300
500
700
900CD4+
Legend
CD8+
Legend
r=-0.3929p=ns
r=-0.2607p=ns
IL-7 pg/ml
FasL
MF
I o
f F
asL
+ T
cell
s
Fig 3:8:3: There were negative correlations between IL-7 concentration and FasL
expression on several lymphocyte subsets in A-T patients with no ATM activity.
A. normal A-T
B. normal A-T
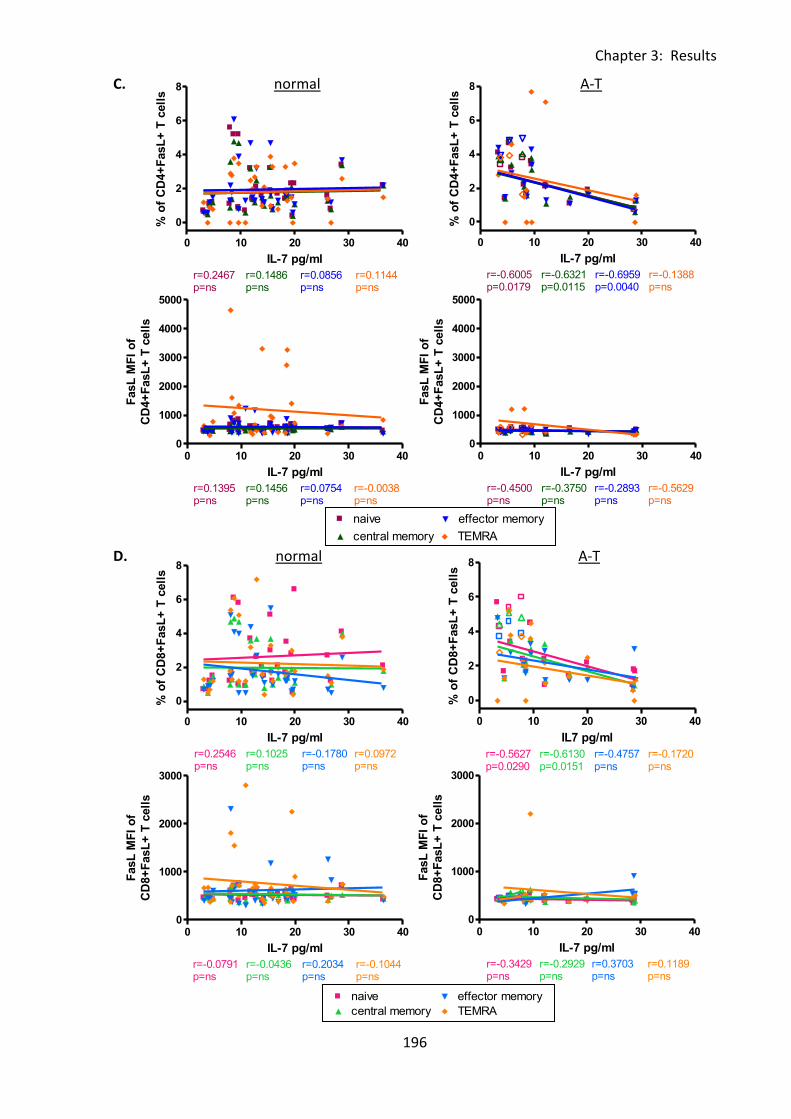
Chapter 3: Results
196
0 100 200 300 4000
2500
5000
7500
10000naive
central memory
effector memory
TEMRA
r=0.1250p=ns
r=0.0429p=ns
r=0.0179p=ns
r=0.2714p=ns
age (months)
CD
95 M
FI
of
CD
4+
CD
95+
T c
ell
s
0 100 200 300 4000
2000
4000
6000naive
central memory
effector memory
TEMRA
r=0.3321p=ns
r=0.8000p=ns
r=0.3607p=ns
r=0.6000p=ns
age (months)
CD
95 M
FI
of
CD
8+
CD
95+
T c
ell
s
0 10 20 30 40
0
2
4
6
8naive
central memory
effector memory
TEMRA
r=0.2467p=ns
r=0.1486p=ns
r=0.0856p=ns
r=0.1144p=ns
IL-7 pg/ml
% o
f C
D4+
FasL
+ T
cell
s
0 10 20 30 400
1000
2000
3000
4000
5000naive
central memory
effector memory
TEMRA
r=0.1395p=ns
r=0.1456p=ns
r=0.0754p=ns
r=-0.0038p=ns
IL-7 pg/ml
FasL
MF
I o
f
CD
4+
FasL
+ T
cell
s
0 10 20 30 40
0
2
4
6
8naive
central memory
effector memory
TEMRA
r=0.2546p=ns
r=0.1025p=ns
r=-0.1780p=ns
r=0.0972p=ns
IL-7 pg/ml
% o
f C
D8+
FasL
+ T
cell
s
0 10 20 30 400
1000
2000
3000naive
central memory
effector memory
TEMRA
r=-0.0791p=ns
r=-0.0436p=ns
r=0.2034p=ns
r=-0.1044p=ns
IL-7 pg/ml
FasL
MF
I o
f
CD
8+
FasL
+ T
cell
s
0 10 20 30 40
0
2
4
6
8naive
Legend
central memory
Legend
effector memory
Legend
TEMRA
Legend
r=-0.6005p=0.0179
r=-0.6321p=0.0115
r=-0.6959p=0.0040
r=-0.1388p=ns
IL-7 pg/ml
% o
f C
D4+
FasL
+ T
cell
s0 10 20 30 40
0
1000
2000
3000
4000
5000naive
Legend
central memory
Legend
effector memory
Legend
TEMRA
Legend
r=-0.4500p=ns
r=-0.3750p=ns
r=-0.2893p=ns
r=-0.5629p=ns
IL-7 pg/ml
FasL
MF
I o
f
CD
4+
FasL
+ T
cell
s
0 10 20 30 40
0
2
4
6
8naive
Legend
central memory
Legend
effector memory
Legend
TEMRA
Legend
r=-0.5627p=0.0290
r=-0.6130p=0.0151
r=-0.4757p=ns
r=-0.1720p=ns
IL7 pg/ml
% o
f C
D8+
FasL
+ T
cell
s
0 10 20 30 400
1000
2000
3000naive
Legend
central memory
Legend
effector memory
Legend
TEMRA
Legend
r=-0.3429p=ns
r=-0.2929p=ns
r=0.3703p=ns
r=0.1189p=ns
IL-7 pg/ml
FasL
MF
I o
f
CD
8+
FasL
+ T
cell
s
C. normal A-T
D. normal A-T
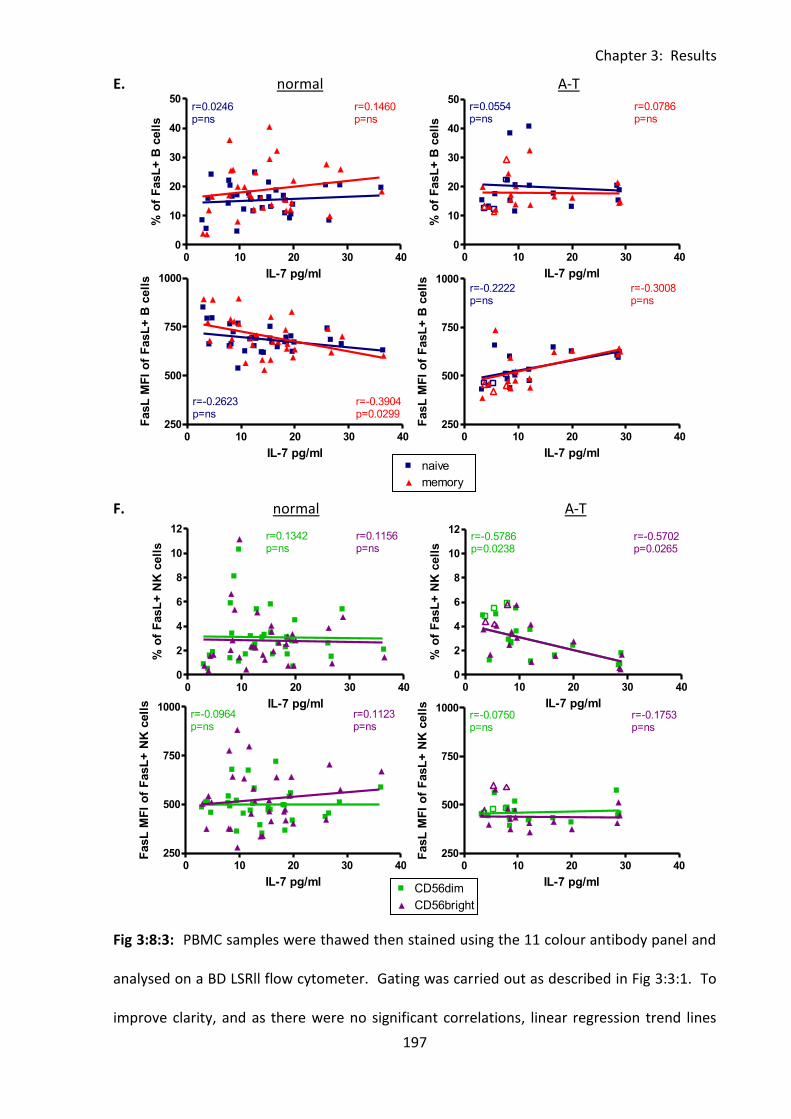
Chapter 3: Results
197
0 100 200 300 4000
25
50
75
100naive
memory
r=0.1957p=ns
r=0.4143p=0.0165
age (months)
% o
f C
D95+
B c
ell
s
0 100 200 300 4000
500
1000
1500
2000CD56dim
CD56bright
r=0.1262p=ns
r=0.1790p=ns
age (months)
CD
95 M
FI
of
CD
95+
NK
cell
s
0 10 20 30 400
10
20
30
40
50naive
memory
r=0.0246p=ns
r=0.1460p=ns
IL-7 pg/ml
% o
f F
asL
+ B
cell
s
0 10 20 30 40250
500
750
1000naive
memory
r=-0.2623p=ns
r=-0.3904p=0.0299
IL-7 pg/ml
FasL
MF
I o
f F
asL
+ B
cell
s
0 10 20 30 400
2
4
6
8
10
12CD56dim
CD56bright
r=0.1342p=ns
r=0.1156p=ns
IL-7 pg/ml
% o
f F
asL
+ N
K c
ell
s
0 10 20 30 40250
500
750
1000CD56dim
CD56bright
r=-0.0964p=ns
r=0.1123p=ns
IL-7 pg/ml
FasL
MF
I o
f F
asL
+ N
K c
ell
s
0 10 20 30 400
10
20
30
40
50naive
Legend
memory
Legend
r=0.0554p=ns
r=0.0786p=ns
IL-7 pg/ml
% o
f F
asL
+ B
cell
s0 10 20 30 40
250
500
750
1000naive
Legend
memory
Legend
r=-0.2222p=ns
r=-0.3008p=ns
IL-7 pg/ml
FasL
MF
I o
f F
asL
+ B
cell
s
0 10 20 30 400
2
4
6
8
10
12CD56dim
Legend
CD56bright
Legend
r=-0.5786p=0.0238
r=-0.5702p=0.0265
IL-7 pg/ml
% o
f F
asL
+ N
K c
ell
s
0 10 20 30 40250
500
750
1000CD56dim
Legend
CD56bright
Legend
r=-0.0750p=ns
r=-0.1753p=ns
IL-7 pg/ml
FasL
MF
I o
f F
asL
+ N
K c
ell
s
E. normal A-T
F. normal A-T
Fig 3:8:3: PBMC samples were thawed then stained using the 11 colour antibody panel and
analysed on a BD LSRll flow cytometer. Gating was carried out as described in Fig 3:3:1. To
improve clarity, and as there were no significant correlations, linear regression trend lines
Chapter 3: Results
198
and r and p values for the A-T patients with some ATM activity are not shown, however
results of the correlation analysis for this group are summarised in Table 3:8:5 (A-T plots:
open symbols = some ATM activity, closed symbols = no ATM activity).
A. There were no significant correlations between IL-7 concentration and the percentage or
FasL MFI of FasL+ve T cells, B cells, NK cells or NKT cells in normal controls (top & bottom
left), however in A-T patients with no ATM activity the percentages of both FasL+ve T cells
and NK cells decreased with increasing IL-7 concentration (top right) and the FasL MFI of
FasL+ve B cells increased with increasing IL-7 (bottom right).
B. There were no correlations between IL-7 concentration and FasL expression on CD4+ve
and CD8+ve T cells in the normal controls (top and bottom left). In the A-T patients with no
ATM activity the percentages of CD4+FasL+ and CD8+FasL+ T cells showed a negative
correlation with IL-7 concentration (top right).
C. There were no correlations between FasL expression on CD4+ve T cell subsets and IL-7
concentration in the normal controls (top & bottom left). In the A-T patients with no ATM
activity there were significant negative correlations between the percentages of CD4+FasL+
T cells and IL-7 concentration in naive, central memory and effector memory subsets (top
right).
D. There were no correlations between FasL expression on CD8+ve T cell subsets and IL-7
concentration in the normal controls (top & bottom left). In the A-T patients with no ATM
activity there were significant negative correlations between the percentages of CD8+FasL+
naive and central memory T cells and IL-7 concentration (top right).
E. There were no correlations between the percentages of FasL+ve naive or memory B cells
and IL-7 concentration in the normal controls (top left), however the FasL MFI of FasL+ve
memory B cells decreased with increasing IL-7 concentration (bottom left). In the A-T
Chapter 3: Results
199
patients with no ATM activity there were no correlations between FasL expression on naive
or memory B cells and IL-7 concentration (top and bottom right).
F. There were no correlations between FasL expression on CD56dim or CD56bright NK cells
and IL-7 plasma concentration in the normal controls (top and bottom left). However in the
A-T patients with no ATM activity there were significant negative correlations between the
percentages of CD56dimFasL+ and CD56brightFasL+ NK cells and plasma IL-7 concentration
(top right).
Chapter 3: Results
200
3:8:4: IL-7 concentration and CD127 expression on lymphocyte subsets.
Finally, as CD127 expression regulates consumption of IL-7 (reviewed in (Mazzucchelli &
Durum, 2007)) correlations between CD127 expression on lymphocyte subsets and IL-7
plasma concentration were analysed. There were no correlations between IL-7
concentration and CD127 expression on total T cells, B cells, NK cells or NKT cells (Fig
3:8:4A), CD4+ or CD8+ T cells (Fig 3:8:4B), naive and memory CD4+ or CD8+ T cell subsets (Fig
3:8:4C&D), or CD56dim and CD56bright NK cells (Fig 3:8:4E) in either A-T patients or normal
controls. This finding together with the absence of an increase in CD127 expression on
lymphocytes (excluding CD8+ve effector memory T cells) with age in A-T patients with no
ATM activity (Table 3:6:5) suggests that the decrease in IL-7 concentration with age in these
patients (Fig 3:7:1E) is not due to increased consumption of the cytokine by CD127+ve
lymphocytes.
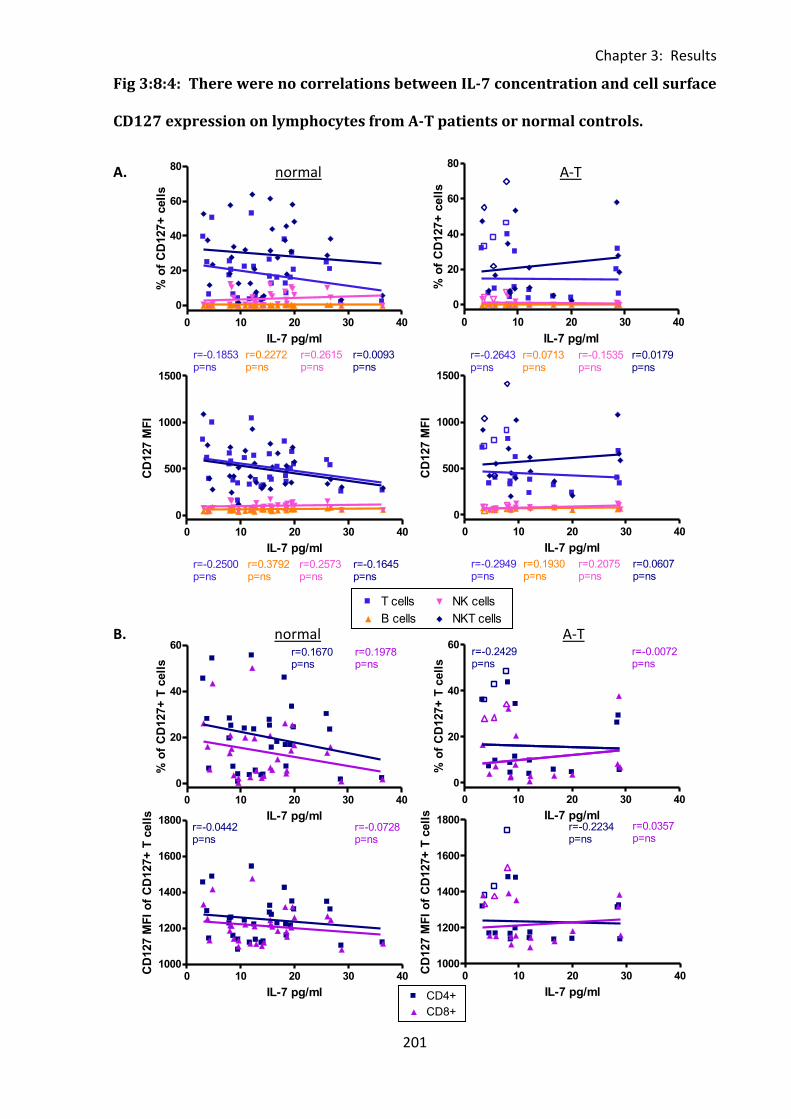
Chapter 3: Results
201
0 100 200 300 400300
500
700
900CD4+
CD8+
r=-0.0871p=ns
r=-0.0425p=ns
normal
FasL
MF
I o
f F
asL
+ T
cell
s
0 100 200 300 4000
25
50
75
100T cells
B cells
NK cells
NKT cells
r=0.5955p=0.0003
r=0.3191p=ns
r=-0.0972p=ns
r=0.4498p=0.0086
age (months)
% o
f C
D95+
cell
s
0 10 20 30 40
0
20
40
60
80T cells
B cells
NK cells
NKT cells
r=-0.1853p=ns
r=0.2272p=ns
r=0.2615p=ns
r=0.0093p=ns
IL-7 pg/ml
% o
f C
D127+
cell
s
0 10 20 30 40
0
20
40
60CD4+
CD8+
r=0.1670p=ns
r=0.1978p=ns
IL-7 pg/ml
% o
f C
D127+
T c
ell
s
0 10 20 30 401000
1200
1400
1600
1800CD4+
CD8+
r=-0.0442p=ns
r=-0.0728p=ns
IL-7 pg/ml
CD
127 M
FI
of
CD
127+
T c
ell
s
0 10 20 30 40
0
500
1000
1500T cells
B cells
NK cells
NKT cells
r=-0.2500p=ns
r=0.3792p=ns
r=0.2573p=ns
r=-0.1645p=ns
IL-7 pg/ml
CD
127 M
FI
0 10 20 30 40
0
20
40
60
80T cells
Legend
B cells
Legend
NK cells
Legend
NKT cells
Legend
r=-0.2643p=ns
r=0.0713p=ns
r=-0.1535p=ns
r=0.0179p=ns
IL-7 pg/ml
% o
f C
D127+
cell
s
0 10 20 30 40
0
500
1000
1500T cells
Legend
B cells
Legend
NK cells
Legend
NKT cells
Legend
r=-0.2949p=ns
r=0.1930p=ns
r=0.2075p=ns
r=0.0607p=ns
IL-7 pg/ml
CD
127 M
FI
0 10 20 30 40
0
20
40
60CD4+
Legend
CD8+
Legend
r=-0.2429p=ns
r=-0.0072p=ns
IL-7 pg/ml
% o
f C
D127+
T c
ell
s
0 10 20 30 401000
1200
1400
1600
1800CD4+
Legend
CD8+
Legend
r=-0.2234p=ns
r=0.0357p=ns
IL-7 pg/ml
CD
127 M
FI
of
CD
127+
T c
ell
s
Fig 3:8:4: There were no correlations between IL-7 concentration and cell surface
CD127 expression on lymphocytes from A-T patients or normal controls.
A. normal A-T
B. normal A-T
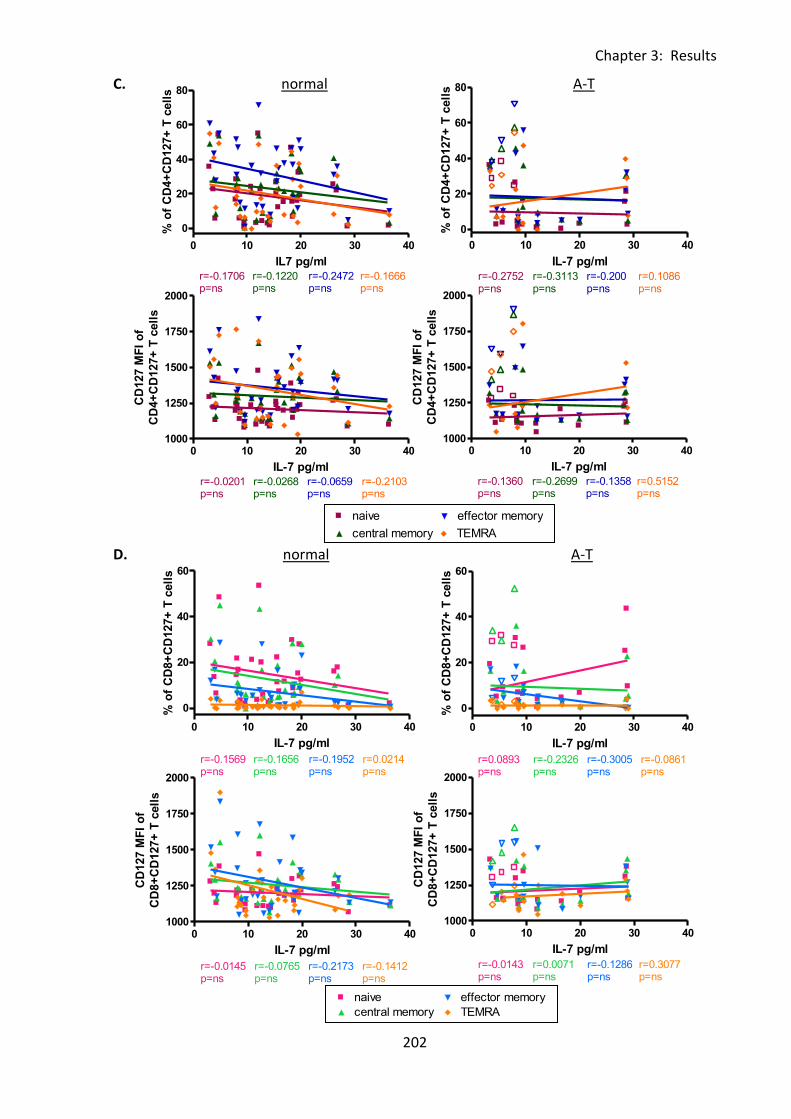
Chapter 3: Results
202
0 100 200 300 4000
2500
5000
7500
10000naive
central memory
effector memory
TEMRA
r=0.1250p=ns
r=0.0429p=ns
r=0.0179p=ns
r=0.2714p=ns
age (months)
CD
95 M
FI
of
CD
4+
CD
95+
T c
ell
s
0 100 200 300 4000
2000
4000
6000naive
central memory
effector memory
TEMRA
r=0.3321p=ns
r=0.8000p=ns
r=0.3607p=ns
r=0.6000p=ns
age (months)
CD
95 M
FI
of
CD
8+
CD
95+
T c
ell
s
0 10 20 30 40
0
20
40
60
80naive
central memory
effector memory
TEMRA
r=-0.1706p=ns
r=-0.1220p=ns
r=-0.2472p=ns
r=-0.1666p=ns
IL7 pg/ml
% o
f C
D4+
CD
127+
T c
ell
s
0 10 20 30 401000
1250
1500
1750
2000naive
central memory
effector memory
TEMRA
r=-0.0201p=ns
r=-0.0268p=ns
r=-0.0659p=ns
r=-0.2103p=ns
IL-7 pg/ml
CD
127 M
FI
of
CD
4+
CD
127+
T c
ell
s
0 10 20 30 40
0
20
40
60naive
central memory
effector memory
TEMRA
r=-0.1569p=ns
r=-0.1656p=ns
r=-0.1952p=ns
r=0.0214p=ns
IL-7 pg/ml
% o
f C
D8+
CD
127+
T c
ell
s
0 10 20 30 401000
1250
1500
1750
2000naive
central memory
effector memory
TEMRA
r=-0.0145p=ns
r=-0.0765p=ns
r=-0.2173p=ns
r=-0.1412p=ns
IL-7 pg/ml
CD
127 M
FI
of
CD
8+
CD
127+
T c
ell
s
0 10 20 30 40
0
20
40
60
80naive
Legend
central memory
Legend
effector memory
Legend
TEMRA
Legend
r=-0.2752p=ns
r=-0.3113p=ns
r=-0.200p=ns
r=0.1086p=ns
IL-7 pg/ml
% o
f C
D4+
CD
127+
T c
ell
s0 10 20 30 40
1000
1250
1500
1750
2000naive
Legend
central memory
Legend
effector memory
Legend
TEMRA
Legend
r=-0.1360p=ns
r=-0.2699p=ns
r=-0.1358p=ns
r=0.5152p=ns
IL-7 pg/ml
CD
127 M
FI
of
CD
4+
CD
127+
T c
ell
s
0 10 20 30 40
0
20
40
60naive
Legend
central memory
Legend
effector memory
Legend
TEMRA
Legend
r=0.0893p=ns
r=-0.2326p=ns
r=-0.3005p=ns
r=-0.0861p=ns
IL-7 pg/ml
% o
f C
D8+
CD
127+
T c
ell
s
0 10 20 30 401000
1250
1500
1750
2000naive
Legend
central memory
Legend
effector memory
Legend
TEMRA
Legend
r=-0.0143p=ns
r=0.0071p=ns
r=-0.1286p=ns
r=0.3077p=ns
IL-7 pg/ml
CD
127 M
FI
of
CD
8+
CD
127+
T c
ell
s
C. normal A-T
D. normal A-T
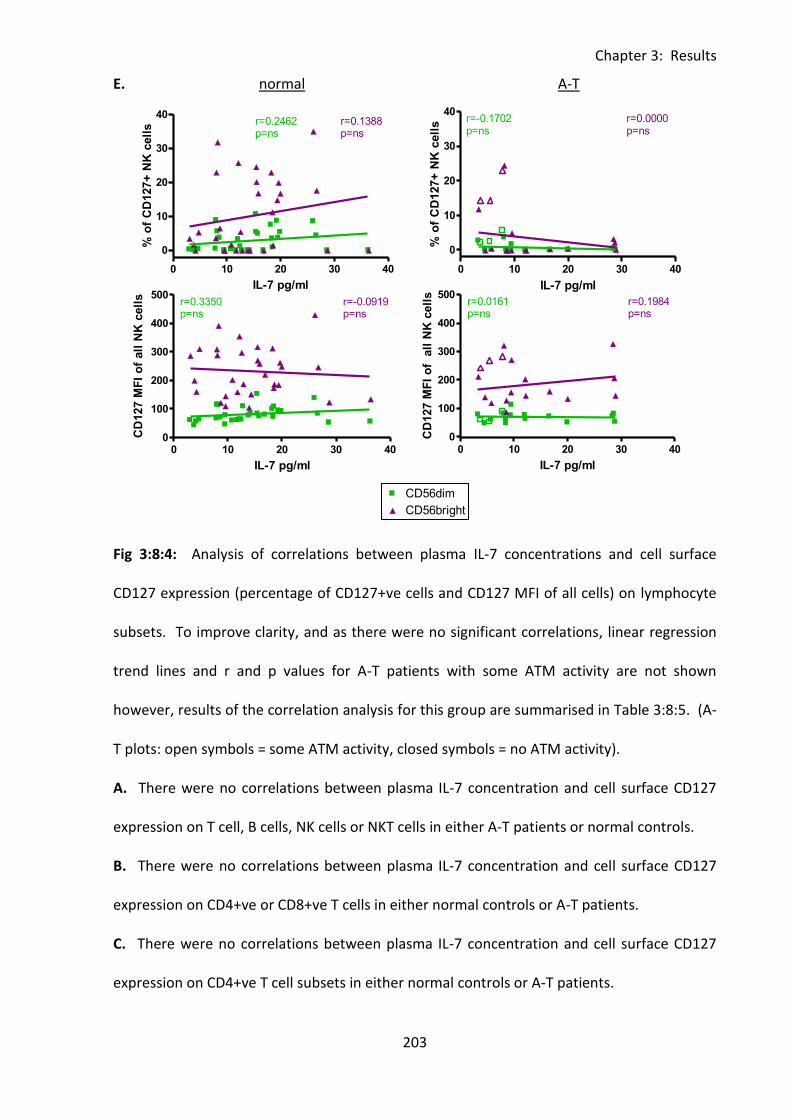
Chapter 3: Results
203
0 100 200 300 4000
500
1000
1500
2000CD56dim
CD56bright
r=0.1262p=ns
r=0.1790p=ns
age (months)
CD
95 M
FI
of
CD
95+
NK
cell
s
0 10 20 30 40
0
10
20
30
40CD56dim
CD56bright
r=0.2462p=ns
r=0.1388p=ns
IL-7 pg/ml
% o
f C
D127+
NK
cell
s
0 10 20 30 400
100
200
300
400
500CD56dim
CD56bright
r=0.3350p=ns
r=-0.0919p=ns
IL-7 pg/ml
CD
127 M
FI
of
all
NK
cell
s
0 10 20 30 40
0
10
20
30
40CD56dim
Legend
CD56bright
Legend
r=-0.1702p=ns
r=0.0000p=ns
IL-7 pg/ml
% o
f C
D127+
NK
cell
s
0 10 20 30 400
100
200
300
400
500CD56dim
Legend
CD56bright
Legend
r=0.0161p=ns
r=0.1984p=ns
IL-7 pg/ml
CD
127 M
FI
of
all
NK
cell
s
E. normal A-T
Fig 3:8:4: Analysis of correlations between plasma IL-7 concentrations and cell surface
CD127 expression (percentage of CD127+ve cells and CD127 MFI of all cells) on lymphocyte
subsets. To improve clarity, and as there were no significant correlations, linear regression
trend lines and r and p values for A-T patients with some ATM activity are not shown
however, results of the correlation analysis for this group are summarised in Table 3:8:5. (A-
T plots: open symbols = some ATM activity, closed symbols = no ATM activity).
A. There were no correlations between plasma IL-7 concentration and cell surface CD127
expression on T cell, B cells, NK cells or NKT cells in either A-T patients or normal controls.
B. There were no correlations between plasma IL-7 concentration and cell surface CD127
expression on CD4+ve or CD8+ve T cells in either normal controls or A-T patients.
C. There were no correlations between plasma IL-7 concentration and cell surface CD127
expression on CD4+ve T cell subsets in either normal controls or A-T patients.
Chapter 3: Results
204
D. There were no correlations between plasma IL-7 concentration and cell surface CD127
expression on naive, effector memory or TEMRA CD8+ve T cell subsets in either normal
controls or A-T patients.
E. There were no correlations between plasma IL-7 concentration and cell surface CD127
expression on CD56dim or CD56bright NK cells in either normal controls or A-T patients.
Chapter 3: Results
205
3:8:5: IL-7 concentration correlated positively with CD95 expression on CD4+ve T
cells and negatively with FasL expression on CD4+ve and CD8+ve T cells in A-T
patients with no ATM activity.
The results of the analysis of correlations between plasma IL-7 concentration and
percentages of lymphocyte subsets, CD95, FasL and CD127 expression are summarised in
Table 3:8:5.
Although IL-7 has an important role in inducing proliferation of naive T cells there were no
correlations between IL-7 concentration and the percentages of different cell types or
subsets in either A-T patients or normal controls.
It has been suggested that IL-7 may be involved in regulation of CD95 expression (Brugnoni
et al., 1999;Rethi et al., 2008) and there were a number of positive correlations between IL-7
concentration and the percentages of CD95+ve lymphocytes of various subsets. In the
normal controls the percentages of CD4+CD95+ naive and central memory and CD8+CD95+
naive T cells as well as CD95+ve NK cells and CD56dimCD95+ NK cells correlated positively
with IL-7 concentration. The A-T patients with no ATM activity showed positive correlations
between IL-7 concentration and the percentages of CD95+ve T cells, CD4+CD95+ T cells and
CD4+CD95+ naive, central memory and effector memory T cells. This suggests that the age
related decrease in the percentage of CD4+CD95+ T cells and subsets in A-T patients with no
ATM activity (Table 3:4:7) may be due to the decrease in IL-7 plasma concentration with age
in these patients.
There were also some correlations between the CD95 MFI of CD95+ve lymphocytes and IL-7
concentration. In the normal controls the CD95 MFI of CD4+CD95+ central and effector
memory T cells correlated positively with IL-7 concentration and in the A-T patients with no
Chapter 3: Results
206
ATM activity the CD95 MFI of CD8+CD95+ TEMRA T cells correlated negatively and the CD95
MFI of CD95+ve naive B cells correlated positively with IL-7 concentration.
IL-7 concentration had no effect on the percentages of FasL+ve lymphocytes of any subset in
the normal controls or A-T patients with some ATM activity. However in the A-T patients
with no ATM activity the percentage of FasL+ve cells tended to decrease as IL-7
concentration increased. There were significant negative correlations between IL-7
concentration and FasL expression on NK cells and NK cell subsets, total T cells and all T cell
subsets with the exception of CD4+ve and CD8+ve TEMRA T cells and CD8+ve effector
memory T cells. IL-7 concentration had little effect on the FasL MFI of FasL+ve cells although
there was a significant negative correlation between the FasL MFI of FasL+ve memory B cells
and IL-7 concentration in the normal controls and a significant positive correlation between
the FasL MFI of FasL+ B cells and IL-7 concentration in the A-T patients with no ATM activity.
There was no evidence of any effect of IL-7 concentration on expression of its receptor
CD127.
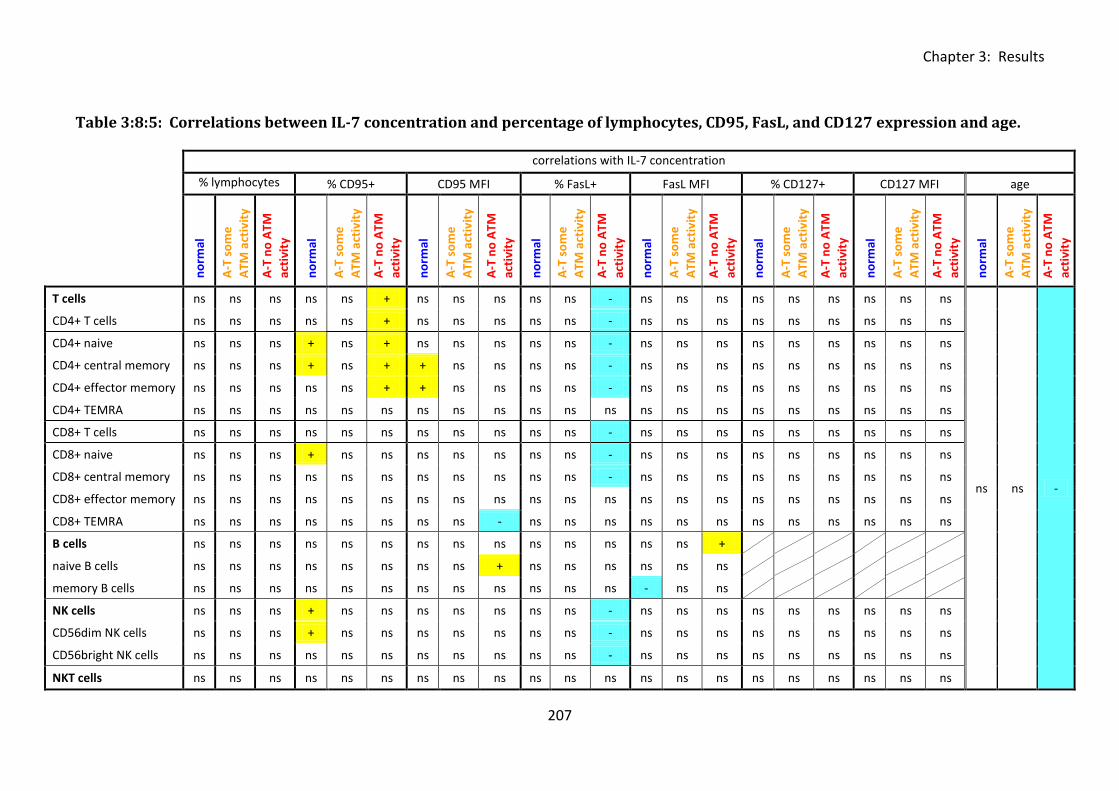
Chapter 3: Results
207
Table 3:8:5: Correlations between IL-7 concentration and percentage of lymphocytes, CD95, FasL, and CD127 expression and age.
correlations with IL-7 concentration
% lymphocytes % CD95+ CD95 MFI % FasL+ FasL MFI % CD127+ CD127 MFI age
no
rmal
A-T
so
me
ATM
act
ivit
y
A-T
no
ATM
acti
vity
no
rmal
A-T
so
me
ATM
act
ivit
y
A-T
no
ATM
acti
vity
no
rmal
A-T
so
me
ATM
act
ivit
y
A-T
no
ATM
acti
vity
no
rmal
A-T
so
me
ATM
act
ivit
y
A-T
no
ATM
acti
vity
no
rmal
A-T
so
me
ATM
act
ivit
y
A-T
no
ATM
acti
vity
no
rmal
A-T
so
me
ATM
act
ivit
y
A-T
no
ATM
acti
vity
no
rmal
A-T
so
me
ATM
act
ivit
y
A-T
no
ATM
acti
vity
no
rmal
A-T
so
me
ATM
act
ivit
y
A-T
no
ATM
acti
vity
T cells ns ns ns ns ns + ns ns ns ns ns - ns ns ns ns ns ns ns ns ns
ns ns -
CD4+ T cells ns ns ns ns ns + ns ns ns ns ns - ns ns ns ns ns ns ns ns ns
CD4+ naive ns ns ns + ns + ns ns ns ns ns - ns ns ns ns ns ns ns ns ns
CD4+ central memory ns ns ns + ns + + ns ns ns ns - ns ns ns ns ns ns ns ns ns
CD4+ effector memory ns ns ns ns ns + + ns ns ns ns - ns ns ns ns ns ns ns ns ns
CD4+ TEMRA ns ns ns ns ns ns ns ns ns ns ns ns ns ns ns ns ns ns ns ns ns
CD8+ T cells ns ns ns ns ns ns ns ns ns ns ns - ns ns ns ns ns ns ns ns ns
CD8+ naive ns ns ns + ns ns ns ns ns ns ns - ns ns ns ns ns ns ns ns ns
CD8+ central memory ns ns ns ns ns ns ns ns ns ns ns - ns ns ns ns ns ns ns ns ns
CD8+ effector memory ns ns ns ns ns ns ns ns ns ns ns ns ns ns ns ns ns ns ns ns ns
CD8+ TEMRA ns ns ns ns ns ns ns ns - ns ns ns ns ns ns ns ns ns ns ns ns
B cells ns ns ns ns ns ns ns ns ns ns ns ns ns ns +
naive B cells ns ns ns ns ns ns ns ns + ns ns ns ns ns ns
memory B cells ns ns ns ns ns ns ns ns ns ns ns ns - ns ns
NK cells ns ns ns + ns ns ns ns ns ns ns - ns ns ns ns ns ns ns ns ns
CD56dim NK cells ns ns ns + ns ns ns ns ns ns ns - ns ns ns ns ns ns ns ns ns
CD56bright NK cells ns ns ns ns ns ns ns ns ns ns ns - ns ns ns ns ns ns ns ns ns
NKT cells ns ns ns ns ns ns ns ns ns ns ns ns ns ns ns ns ns ns ns ns ns
Chapter 3: Results
208
Table 3:8:5: Summary of significant correlations between plasma IL-7 concentration and
age, percentages of lymphocyte subsets and expression of CD95, FasL and CD127 in blood
samples from A-T patients and normal controls.
The table summarises significant correlations between IL-7 plasma concentration and
percentages of lymphocyte subsets, IL-7 plasma concentration and expression of CD95, FasL
and CD127 (both percentage of positive cells and MFI) and plasma IL-7 concentration and
age in normal controls and A-T patients. Yellow (+) cells indicate a positive correlation and
blue (-) cells indicate a negative correlation in the corresponding group, ‘ns’ indicates no
significant correlation.
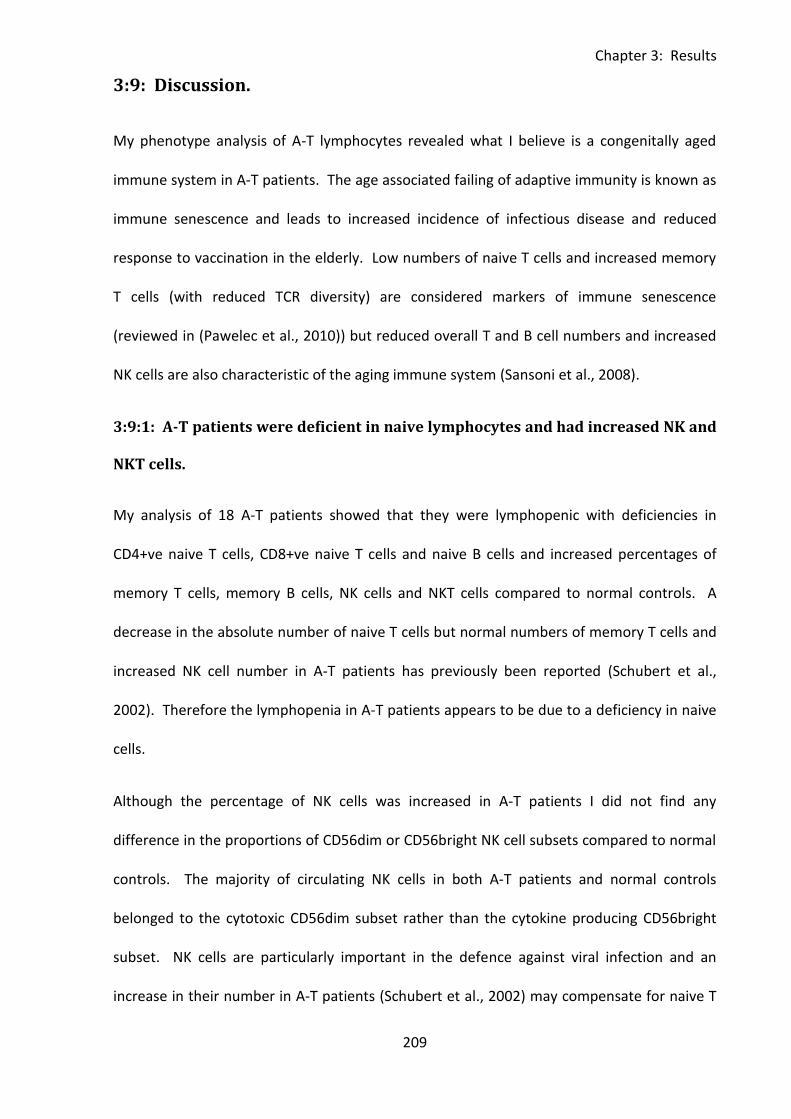
Chapter 3: Results
209
3:9: Discussion.
My phenotype analysis of A-T lymphocytes revealed what I believe is a congenitally aged
immune system in A-T patients. The age associated failing of adaptive immunity is known as
immune senescence and leads to increased incidence of infectious disease and reduced
response to vaccination in the elderly. Low numbers of naive T cells and increased memory
T cells (with reduced TCR diversity) are considered markers of immune senescence
(reviewed in (Pawelec et al., 2010)) but reduced overall T and B cell numbers and increased
NK cells are also characteristic of the aging immune system (Sansoni et al., 2008).
3:9:1: A-T patients were deficient in naive lymphocytes and had increased NK and
NKT cells.
My analysis of 18 A-T patients showed that they were lymphopenic with deficiencies in
CD4+ve naive T cells, CD8+ve naive T cells and naive B cells and increased percentages of
memory T cells, memory B cells, NK cells and NKT cells compared to normal controls. A
decrease in the absolute number of naive T cells but normal numbers of memory T cells and
increased NK cell number in A-T patients has previously been reported (Schubert et al.,
2002). Therefore the lymphopenia in A-T patients appears to be due to a deficiency in naive
cells.
Although the percentage of NK cells was increased in A-T patients I did not find any
difference in the proportions of CD56dim or CD56bright NK cell subsets compared to normal
controls. The majority of circulating NK cells in both A-T patients and normal controls
belonged to the cytotoxic CD56dim subset rather than the cytokine producing CD56bright
subset. NK cells are particularly important in the defence against viral infection and an
increase in their number in A-T patients (Schubert et al., 2002) may compensate for naive T
Chapter 3: Results
210
cell deficiency and reduced antigen receptor repertoire. This could explain why A-T patients
do not more commonly suffer from severe viral or opportunistic infections despite their T
cell deficiency (Nowak-Wegrzyn et al., 2004).
NKT cells were also increased in A-T patients compared to normal controls. These are a rare
subset of highly cytotoxic T cells which have an unusual γδ TCR which confers specificity to
glycolipid antigens (Godfrey et al., 2010). They are involved in the response to bacterial,
viral and parasitic infections and also have an immunoregulatory function (reviewed in (Yu
and Porcelli, 2005)). Like conventional T cells NKT cells develop in the thymus and undergo
V(D)J recombination. Although NKT cells have not been investigated previously in A-T
patients an increased proportion of γδ TCR bearing T cells has been reported (Carbonari et
al., 1990). Increased NKT cells may explain or at least contribute to the increased proportion
of γδ TCR bearing T cells in A-T patients. However, this does not invalidate the hypothesis
that the defect in V(D)J recombination caused by the absence of functional ATM is more
detrimental to the rearrangement of conventional αβ TCRs than γδ TCRs (Carbonari et al.,
1990). Glycolipid vaccine adjuvants which activate NKT cells are soon to enter clinical trials
(Li et al., 2010). My finding of increased NKT cells in A-T patients suggests that such
adjuvants could be beneficial in improving their response to vaccination.
In general I found that A-T patients with some ATM activity had an intermediate phenotype
between that of the normal controls and A-T patients with no ATM activity, this suggests
that residual ATM kinase activity may reduce the severity of the immunological deficiency in
A-T. A similar finding was reported by Staples et al. (2008) who compared lymphopenia,
immunoglobulin deficiency and frequency of recurrent sinopulmonary infections in A-T
patients with and without residual ATM activity and found that patients with residual ATM
activity had a less severe immune deficiency (Staples et al., 2008).
Chapter 3: Results
211
My results showed clear differences in the way the lymphocyte phenotypes of normal
controls and A-T patients changed with age over the 1 to 30 year age range. In the normal
controls the proportions of T cells and B cells did not change but the proportions of memory
T cells, memory B cells, NK cells and NKT cells increased and naive T cells and naive B cells
decreased with age. In contrast there was an increase in the proportion of T cells and a
decrease in NK cells in A-T patients of different ages but no change in the proportions of B or
T cell subsets. Therefore the lymphocyte phenotypes of even the youngest A-T patients
were more similar to that of the oldest normal controls than to normal controls of
comparable age. This suggested differential aging of the immune system in A-T patients and
normal controls.
The age related decrease in the proportion of naive T cells and increase in the proportions of
memory T cells subsets in the normal controls was unsurprising as thymic involution begins
in early childhood, leading to a decrease in production of naive T cells, whilst increasing
numbers of antigen encounters over time leads to oligoclonal expansion of memory T cells
(Giovannetti et al., 2002). These changes will result in a proportional decrease in naive T
cells and increase in memory T cells during normal aging. The increase in the percentage of
NK cells with age may compensate for a reported decrease in the absolute number of total T
cells with age (Sansoni et al., 1993).
In contrast to normal individuals, thymic output in A-T patients is low even in infants
(Micheli et al., 2003). Therefore it is possible that the effect of thymic involution on T cell
repertoire in A-T patients is small as it starts from a low baseline. Although I did not find a
significant increase in the percentage of any individual T cell subset with age in A-T patients
it is likely that the increase in total T cells was due to oligoclonal expansions of memory cells.
It would be interesting to look at how absolute cell numbers change with age as it is possible
Chapter 3: Results
212
that the decrease in the percentage of NK cells with age is a proportional change due to the
increase in percentage of T cells rather than an actual change in absolute number of NK cells.
My finding of no significant change in the proportions of B and T cell subsets in A-T patients
of different ages suggested a congenitally aged rather than prematurely aged immune
system.
3:9:2: A-T patients had increased CD95 expression.
I showed that CD95 expression on all lymphocyte subsets except NK cells was increased in A-
T patients compared to normal controls. This was true of the proportion and in many cases
also the median fluorescence intensity of positive cells. The difference in CD95 expression
was especially dramatic on naive CD4+ve and CD8+ve T cells and naive B cells; CD95
expression was low on these cells in the normal controls (medians of 3.9%, 10.8% and 5.2%
CD95+ve cells respectively) but high in the A-T patients with no ATM activity (medians of
35.9%, 74.6% and 23% CD95+ve cells).
CD95 is upregulated on T and B cells in response to activation (Klas, 1993; Mizuno, 2003).
Therefore CD95-ve T cells have never encountered antigen and decrease as a direct result of
ageing (Sansoni et al., 2008). Naive CD95-ve T cells are important for defense against new
pathogens so their age-related decline weakens the immune system. They have been
described as a ‘hallmark of senescence’ (Sansoni et al., 2008) as their number can be used to
predict mortality in the very old (Luciani et al., 2001). Naive T cells are CD95-ve on exit from
the thymus and upregulate CD95 on activation, therefore the low percentage of CD95-ve
naive T cells and high percentage of CD95+ve naive T cells that I have shown in A-T patients
is consistent with low thymic output. Similarly to the elderly, A-T patients with a CD95-ve
naive T cell deficiency will have an impaired ability to respond to new antigens compared to
Chapter 3: Results
213
young healthy individuals, this may contribute to their increased susceptibility to
sinopulmonary infections.
My non-longitudinal analysis showed that CD95 expression on T cells, B cells and NKT cells
increased with age in the normal controls whilst there was a decrease in expression on
CD4+ve T cells and memory B cells in A-T patients with no ATM activity. The increase in
CD95 expression on lymphocytes during normal ageing was unsurprising as increased
activation of the immune system (due to unknown stimuli) (Fagnoni et al., 1996;Sansoni et
al., 1993;Sansoni et al., 2008) and increased CD95 expression on CD4+ve and CD8+ve T cells
with age have previously been reported (Aggarwal & Gupta, 1998;Potestio et al., 1999).
Interestingly Potestio et al (1999) found a differential effect of aging on CD95 expression on
CD4+ve and CD8+ve T cells. Whilst CD95 expression on CD8+ve T cells in healthy individuals
increased with age from 0 (cord blood) to 102 years, CD95 expression on CD4+ve T cells
increased from 0 to 74 years but then decreased with age in individuals over the age of 75.
This is consistent with my finding of a significant positive correlation between both
proportion and CD95 MFI of CD8+CD95+ T cells and age and the proportion of CD4+CD95+ T
cells and age over the 0 to 30 year age range in the normal controls. However the A-T
patients with no ATM activity showed a significant positive correlation between age and the
CD95 MFI of CD8+CD95+ T cells and a significant negative correlation between age and the
percentage of CD4+CD95+ cells over the same age range.
It has been reported that CD4+ve T cell subsets preferentially undergo CD95-mediated
apoptosis in response to anti-CD95 (CH11) treatment compared to CD8+ve T cell subsets in
both young and elderly individuals (Aggarwal & Gupta, 1998). Potestio et al (1999)
suggested that the increase in CD4+CD95+ T cells during normal aging is a marker of immune
senescence as a slightly decreased percentage of these cells in very old people (85-102)
Chapter 3: Results
214
compared to younger elderly people (75-84) in their non-longitudinal study indicated
successful aging. In contrast, the increase in CD8+CD95+ T cells is a marker of aging as it
continued to increase across all the age groups analysed including the very old. The
apparent reduction in CD95 expression on CD4+ve T cells in the oldest elderly patients (85 to
102 years) could be due to selection of long lived healthy individuals with a slow rate of
immune senescence as those with a faster rate and therefore a higher percentage of
CD4+CD95+ T cells may have increased morbidity and mortality (Potestio et al., 1999). It is
possible that a similar selection pressure could explain the negative correlation between
CD95 expression on CD4+ve T cells and age that I have reported in A-T patients with no ATM
activity, as those with the highest CD95 expression on their CD4+ve T cells may also have
increased morbidity and mortality. Alternatively the decreasing CD95 expression on CD4+ve
T cells with age in different A-T patients may be related to increasing FasL expression or
decreasing plasma IL-7 concentration as discussed in sections 3:9:3 and 3:9:5 respectively.
3:9:3: A-T patients had reduced FasL expression.
My results showed expression of FasL on T cells, B cells, NK cells and NKT cells in all A-T
patients and all normal controls. FasL expression on B cells was unexpected as studies
investigating FasL expression on normal lymphocytes have generally concentrated on T cells
and NK cells, perhaps due to the size limitations of antibody panels. However FasL can be
expressed on immature B lymphocytes, CD19+ve cells in normal human bone marrow and
on some human B cell lines (Nilsson et al., 2000) and functional FasL expression on activated
B cells has been shown in the mouse (Hahne et al., 1996a). In addition upregulation of FasL
on human B cells has been reported in response to bacterial and viral infections including
HIV and EBV and constitutive expression has been described on B cells from systemic lupus
erythematosus patients (reviewed in (Lundy, 2009)).
Chapter 3: Results
215
My finding of FasL expression on B cells in both A-T patients and normal controls was
convincing due to the significant percentage and FasL MFI of the positive cells. It is unlikely
that the result was a false positive as the antibody panel was carefully selected and
optimized to avoid compensation problems and there was no background when the FasL
antibody was replaced with its isotype control in the eleven colour panel. It is possible that
the FasL expression may be due to infection of the B cells with EBV or other viruses, however
further work would be required to confirm if this is the case.
I did not find a significant difference in the percentage of FasL+ve cells of any type between
normal controls and A-T patients with no ATM activity, however on the majority of cell types
the FasL MFI of FasL+ve cells was significantly higher in the normal controls. The difference
was especially dramatic on naive and memory B cells.
I also found differences in the effect of aging on FasL expression on lymphocytes from A-T
patients and normal controls. The percentages of FasL+ve NK cells and T cells of all subsets
excluding TEMRA and the FasL MFI of CD4+FasL+ T cell subsets and CD8+FasL+ naive T cells
increased, and the FasL MFI of FasL+ B cells decreased significantly with age in A-T patients
with no ATM activity. In the normal controls there was no change in FasL expression with
age on the majority of subsets. However there was a decrease in the percentage of FasL+ve
NKT cells, an increase in the FasL MFI of FasL+ve total T cells and FasL+ve total and naive B
cells and a decrease in the FasL MFI of FasL+ve CD56bright NK cells with age.
It is unclear if reduced FasL MFI has a significant effect on the immune system of A-T
patients. It could be argued that the reduction in FasL expression will result in reduced
CD95-mediated apoptosis, however a low FasL MFI does not prevent a FasL expressing cell
from binding to CD95 and initiating apoptosis. The lymphopenic phenotype of A-T patients
suggests that CD95-mediated apoptosis is not impaired as this would lead to an
Chapter 3: Results
216
accumulation of lymphocytes similar to that seen in autoimmune lymphoproliferative
syndrome (ALPS) patients whose cells are resistant to CD95-mediated apoptosis due to Fas
mutation. It may be interesting to investigate soluble FasL concentration in plasma or serum
samples from A-T patients and normal controls as a decrease in membrane bound FasL may
correlate with an increase in its soluble form. As soluble FasL is able to bind to CD95 and
initiate apoptosis this could negate any potential effect of reduced apoptosis due to reduced
membrane bound FasL.
The increase in the percentage of FasL+ve T cells and NK cells with age that I have shown in
A-T patients with no ATM activity may contribute to the age-related decrease in the
percentage of CD4+CD95+ naive, central memory and TEMRA T cells and CD95+ve memory B
cells by increasing CD95-mediated apoptosis of these cells.
3:9:4: A-T patients had normal CD127 expression.
My results showed that A-T patients with no ATM activity were not deficient in CD127 (IL-
7Rα) expression compared to normal controls. However whilst CD127 expression on all T
cell subsets increased with age in normal controls the only increase in expression with age
on A-T patients was on CD8+ve effector memory T cells. This suggests that in healthy
individuals the ability of T cells to bind IL-7 and proliferate in response to the cytokine may
increase with age, perhaps in order to compensate for the age related decline in output of T
cells from the thymus. If CD127 expression is related to thymic output this could explain
why a similar age related increase in CD127 expression on T cells is not seen in A-T patients
as their thymic output is very low even in infancy.
Interestingly CD127 expression on the majority of T cell subsets was significantly higher in A-
T patients with some ATM activity than A-T patients with no ATM activity and normal
Chapter 3: Results
217
controls. However, as only three A-T patients with some ATM activity were analysed this
finding may not be representative of a larger group of patients with residual ATM activity.
The increased CD127 expression may be related to the older mean age of the A-T patients
with some ATM activity (16 years 3.7 months) compared to normal controls (8 years 6.4
months) and A-T patients with no ATM activity (9 years 4 months) as I found that CD127
expression increased with age in the normal controls.
As A-T T cells are not deficient in CD127 expression it is unlikely that their ability to bind and
respond to IL-7 is impaired.
3:9:5: A-T patients had normal plasma concentrations of IL-7.
Despite their lymphopenia I did not find elevated concentrations of IL-7 or IL-15 in A-T
patients’ plasma compared to normal controls. However, there was a negative correlation
between plasma IL-7 concentration and age in A-T patients with no ATM activity. This
finding was surprising, even in the context of premature aging, as a study of IL-7 expression
in healthy individuals including centenarians showed no decline with age (Nasi et al., 2006).
The decrease in IL-7 concentration with age that I have shown in A-T patients is more likely
to be the result of a decrease in production of the cytokine than an increase in its
consumption as the number of lymphocytes did not increase with age. The reduction in
available IL-7 appeared to have no effect on A-T T cell repertoire as the proportions of T cell
subsets did not change and the total percentage of T cells increased with age.
Increased IL-7 concentration has been implicated in CD95 upregulation on T cells (Brugnoni
et al., 1999;Rethi et al., 2008) and I have shown increased CD95 expression on A-T
lymphocytes. Although A-T patients did not have elevated plasma IL-7 concentrations they
were lymphopenic so the amount of IL-7 available per T cell was considerably greater than in
Chapter 3: Results
218
the normal controls. Therefore a role for the cytokine in CD95 upregulation on A-T
lymphocytes cannot be ruled out.
Interestingly I found that in A-T patients with no ATM activity both plasma IL-7 concentration
and CD95 expression on CD4+ve T cells and memory B cells decreased with age and IL-7
concentration correlated positively with expression of CD95 on total T cells, CD4+ve T cells
(excluding TEMRA cells) and naive B cells. This suggests that the decrease in plasma IL-7
concentration could be a contributing factor in the decrease in CD95 expression with age. In
the normal controls positive correlations between IL-7 plasma concentration and CD95
expression on CD4+ve naive, central and effector memory T cells, CD8+ve naive T cells and
both total and CD56dim NK cells also suggested a role for IL-7 in regulation of CD95
expression.
The normal level of CD127 expression in A-T patients along with the normal plasma
concentration of IL-7 suggests that the lymphopenic phenotype of A-T patients is not due to
a deficiency in expression of the cytokine or its receptor.
3:9:6: The immune system of A-T patients is congenitally aged.
The immune system phenotype of A-T patients has striking similarities to that of healthy
elderly individuals. Both groups have a naive T and B cell deficiency and increased NK cells
compared to healthy young individuals (Giovannetti et al., 2002;Gupta & Gollapudi,
2008;Sansoni et al., 2008). CD95 expression on lymphocytes in vivo is increased in A-T
patients and increases with normal aging (Aggarwal & Gupta, 1998;Potestio et al., 1999) and
both the elderly (Chen et al., 2009;Frasca et al., 2008) and some A-T patients show
decreased production of specific antibodies and decreased antibody responses to
vaccination (Nowak-Wegrzyn et al., 2004;Sadighi Akha et al., 1999). In addition both A-T
Chapter 3: Results
219
patients (Reichenbach et al., 2002) and the elderly normal population (reviewed in (Oliveira
et al., 2010)) have low thymic output and elevated levels of oxidative stress. These
similarities suggest a congenitally aged immune system in A-T.
Despite the similarities there may also be differences between the immune system
phenotypes of A-T patients and the elderly. Gupta (2005) analysed the effect of normal
aging on T cell subsets and found no change in the percentage but a decrease in the absolute
number of central memory T cells in the elderly (≤65 years) (Gupta, 2005). Another study by
the same group showed similar CD95 expression on naive and memory T cells from young
and elderly individuals (Gupta & Gollapudi, 2008) and an increase in the percentage of
FasL+ve CD4+ve and CD8+ve T cells in the elderly has also been reported (Aggarwal & Gupta,
1998).
In contrast, I found that in A-T patients (1 to 28 years) the percentage of central memory T
cells was significantly increased compared to normal controls (1 to 30 years), CD95
expression was lower on naive T cells than on memory T cell subsets and there was no
significant difference in the percentage of FasL+ve CD4+ve and CD8+ve T cells but the FasL
MFI of FasL+ve CD4+ve and CD8+ve T cells was decreased compared to normal controls.
Interestingly CD95 expression on T cells in A-T patients with no ATM activity was higher than
on both the young adult and elderly cohorts in the Gupta & Gollapudi (2008) study.
However these differences may be the result of variations in experimental design rather
than indicitative of real differences in the immune system phenotypes of A-T patients and
the elderly. In my study central memory T cells were defined as CD45RA-CD27+ and in the
Gupta study (2005) they were defined as CD45RA-CCR7+. Although CD27 and CCR7 are
coexpressed on naive T cells (Ferrando-Martinez et al., 2010), the populations of memory T
cells defined by these sets of markers are not identical (Fritsch et al., 2005;Tomiyama et al.,
Chapter 3: Results
220
2002). Therefore the apparent difference in the proportion of central memory T cells in A-T
patients and the elderly may be due to the difference in markers. If the antibody panels had
been the same it is likely that the analysis would have shown similar proportions of central
memory T cells in A-T patients and the elderly.
Gupta & Gollapudi (2008) found comparable levels of CD95 expression on all T cell subsets
whereas I found that in A-T patients and normal controls CD95 expression was lower on
naive than memory T cells. However, Gupta & Gollapudi (2008) analysed CD95 expression
following activation with anti-CD3 and I analysed CD95 expression on unstimulated
lymphocytes. As CD95 is upregulated on naive T cells in response to activation it is
unsurprising that there was no difference in CD95 expression on naive and memory T cell
subsets in the Gupta & Gollapudi (2008) study. Therefore I do not believe that the
difference in results represents a real difference in CD95 expression on T cell subsets in A-T
patients and the elderly. The artificial activation in Gupta & Gollapudi (2008) explains why in
contrast to previous studies (Aggarwal & Gupta, 1998;Potestio et al., 1999) they did not
report an increase in CD95 expression on T cells with age. However, despite the activation-
induced CD95 upregulation, expression on T cell subsets in the young adult and elderly
cohorts of Gupta & Gollapudi (2008) was not as high as the expression I found on T cell
subsets in A-T patients with no ATM activity.
My finding of reduced FasL expression on T cells in A-T patients with no ATM activity
compared to normal controls also appears to be inconsistent with an ‘immunologically aged’
immune system phenotype as an increased percentage of FasL+ve CD4+ve and CD8+ve T
cells in the elderly has been reported (Aggarwal & Gupta, 1998). However, in the latter
study PBMCs were activated with PHA and IL-2 followed by PMA and ionomycin to
upregulate FasL prior to analysis whereas I analysed FasL expression on unstimulated
Chapter 3: Results
221
lymphocytes from normal controls and A-T patients. It would be informative to analyse FasL
expression on unstimulated lymphocytes from the elderly in order to directly compare with
A-T patients.
As all of the differences I have discussed may be explained by differences in experimental
protocol I do not believe that they represent real differences in phenotype between the
immune systems of A-T patients and the elderly.
It is clear that lymphocytes in A-T patients and the elderly are similar in terms of CD95
expression. Interestingly Gupta & Gollapudi (2008) showed that naive and central memory T
cells were significantly more sensitive to CD95-mediated apoptosis in elderly individuals than
in the young. They concluded that deficiencies in naive and central memory T cell subsets in
aged humans were partly due to this increased sensitivity. Effector memory and TEMRA T
cells from both young and elderly groups were resistant to CD95-mediated apoptosis.
It would be interesting to compare the sensitivity of A-T T cells of different subsets to CD95-
mediated apoptosis. It is probable that similarly to healthy elderly individuals, effector
memory and TEMRA T cells from A-T patients would be resistant, but naive and central
memory T cells would show increased sensitivity to CD95-mediated apoptosis. As well as its
role in apoptosis CD95 can provide co-stimulatory signals, which in combination with TCR
signalling can induce proliferation of T cells recognising low-affinity antigens. This raises the
possibility that increased CD95 expression could contribute to both the naive T cell
deficiency of A-T patients (by increasing apoptosis) and the predominance of activated
memory T cells (by increasing proliferation).
The immune system phenotype of A-T patients with no ATM activity illustrates the effect of
complete loss of ATM protein kinase activity on the immune system. The primary cause of
Chapter 3: Results
222
immune deficiency in A-T and immune senescence during normal aging is probably the naive
cell deficiency. In A-T this is undoubtedly the result of a failure in the DNA damage response
due to ATM deficiency. Interestingly mouse studies have suggested that a decline in ATM
expression and function occurs during normal aging (Fang 2007, Panda 2007) and a
reduction in DNA double strand break repair capacity has been reported in PBMCs from
elderly people (Frasca et al., 1999). A defect in DNA repair would help to explain the many
similarities between the aged immune system and the immune system of A-T patients, it
may also help to explain why the ATM mutant tumour T-PLL is associated with aging.
The result of my phenotyping experiment in combination with the published literature
suggests that defective DNA damage response due to loss of ATM function results in some or
all of the following features which contribute to the congenitally aged immune system
phenotype of A-T patients, and possibly also to normal immune senescence in the context of
declining DNA damage repair function with age:
1. A deficiency of both T and B cell progenitors. ATM has a role in telomere maintenance
and its deficiency has been implicated in telomere dysfunction in humans (Metcalfe et al.,
1996) and mice (Wong et al., 2003). Wong et al. (2003) showed increased apoptosis of
haematopoietic progenitor cells in the bone marrow of ATM-/- mice. They suggested that
defective telomere maintenance due to ATM deficiency caused increased apoptosis and
limited proliferation of the cells leading to a deficiency of both T and B cell progenitors. This
may explain the finding of Xu et al. (1996) who reported a pre-B cell deficiency in ATM-/-
mice (Xu et al., 1996). It could also contribute to the naive B and T cell deficiency that I and
others (Giovannetti et al., 2002;Schubert et al., 2002) have shown in A-T patients.
Interestingly the proliferative and regenerative capacity of haematopoietic stem cells
Chapter 3: Results
223
decreases with age (reviewed in (Rossi et al., 2008)), this may result in a similar deficiency in
T and B cell progenitors in the elderly.
2. Defective V(D)J recombination. T cells in the thymus undergo a process of V(D)J
recombination which creates functional antigen receptor genes. In normal individuals this
process relies on ATM-dependent NHEJ to repair the double strand breaks in DNA created
during the process (Bredemeyer et al., 2006;Bredemeyer et al., 2008). In the absence of
ATM activity relatively few cells achieve functional TCR rearrangements (Giovannetti et al.,
2002); therefore the recombination defect may explain the low thymic output of A-T
patients (Giovannetti et al., 2002;Micheli et al., 2003). Failure of conventional V(D)J
recombination may also explain the relative increase in T cells with γδ rather than αβ T cell
receptors in A-T patients (Carbonari et al., 1990;Micheli et al., 2003). However, I have shown
an increased percentage of NKT cells in A-T patients. As these cells also express γδ TCRs they
may contribute to or explain the increase in the proportion of T cells with γδ TCRs in A-T
patients.
3. Low thymic output. This may be related to defective V(D)J recombination. Low thymic
output contributes to both the overall naive T cell deficiency and the deficiency in CD95-ve
naive T cells that I have shown in A-T patients. The cause of thymic involution during normal
aging and consequent low thymic output in the elderly is not yet clear (Lynch et al., 2009).
4. CD95 upregulation on lymphocytes. It is not possible to determine from my lymphocyte
phenotyping experiment whether or not increased CD95 expression on A-T lymphocytes is a
direct consequence of lack of ATM activity. However it is likely to be the result of a
combination of increased activation, oxidative stress (McKallip et al., 2010) resulting from
the inability to repair DNA damage caused by ROS and increased IL-7 availability as a result
of naive T cell deficiency and lymphopenia. Increased CD95 expression on lymphocytes in
Chapter 3: Results
224
the elderly may be related to prolonged in vivo activation (Aggarwal & Gupta, 1998).
However oxidative stress is also increased in the elderly (reviewed in (Oliveira et al., 2010))
and this could contribute to CD95 upregulation.
5. Naive T and B cell deficiency. In A-T patients this may be the result of a combination of T
and B cell progenitor deficiency (Wong et al., 2003), low thymic output of naive T cells
(Giovannetti et al., 2002;Micheli et al., 2003), pre-B cell deficiency (Xu et al., 1996) and
increased spontaneous and FasL induced CD95-mediated apoptosis of CD95+ve naive T and
CD95+ve naive B cells, as suggested by the high level of CD95 expression that I have shown
on these cells. Similar factors may account for naive B cell (Veneri et al., 2009) and naive T
cell deficiency (Giovannetti et al., 2002;Gupta & Gollapudi, 2008;Sansoni et al., 2008) in the
elderly.
6. Oligoclonal expansions of memory T cells. Dramatic expansions of memory cell
populations may be detrimental as they reduce the ability of the immune system to fight
heterologous infection (Khan et al., 2002). In A-T patients peripheral T cell oligoclones occur
due to the limited antigen receptor repertoire which results from a reduction in the number
of thymocytes which achieve functional TCR rearrangements in the absence of ATM
(Giovannetti et al., 2002). Although I have shown that memory T cells in A-T patients
express high levels of CD95 it is likely that similar to effector memory and TEMRA T cells in
the elderly (Gupta & Gollapudi, 2008) they are resistant to CD95-mediated apoptosis and
may proliferate in response to TCR signalling in combination with co-stimulation through
CD95. Oligoclonal expansions of memory T cells in the elderly result from chronic viral
infection, CMV infection in particular results in very large expansions (Khan et al., 2002).
7. Immunoglobulin deficiencies. Class switch recombination is required to produce
antibodies of different isotypes and effector function but the same specificities as the
Chapter 3: Results
225
original IgD and IgM antibodies. The process involves the generation and repair of DNA
double strand breaks and requires ATM (Lumsden et al., 2004). Therefore failure of the
ATM-dependent joining process may account for the low serum antibody levels of A-T
patients (Reina-San-Martin et al., 2004). Interestingly a defect in class switch recombination
resulting in immunoglobulin deficiency has also been reported in the elderly (Frasca et al.,
2008).
In conclusion the striking similarities between the immune system phenotypes of A-T
patients and the elderly suggest a congenitally aged immune system in A-T. This is
supported by my observation that there is little difference in the proportions of lymphocyte
subsets in A-T patients of different age; they show the characteristics of an aged immune
system from birth rather than a premature or accelerated rate of immune senescence
starting from a normal baseline.
I have confirmed that A-T patients have a deficiency in naive T cells and naive B cells,
increased proportions of memory T and B cells and increased NK cells. In addition I have
shown for the first time that the proportions of CD56bright and CD56dim NK cells are normal
and the proportion of NKT cells are increased A-T patients. It is likely that the increase in
both NK and NKT cells in A-T patients compensates for the naive T cell deficiency and so
reduces the frequency of severe viral and opportunistic infections in A-T patients.
I have also shown that the lymphopenia and naive T cell deficiency of A-T patients is not due
to an IL-7 or CD127 deficiency because their levels of expression were normal in A-T
patients. Interestingly I found a correlation between IL-7 plasma concentration and CD95
expression on CD4+ve T cells in A-T patients. This suggests that IL-7 may be involved in
upregulation of CD95 on these cells. Therefore attempting to increase naive T cell
proliferation in A-T patients using IL-7 therapy could be detrimental as it may result in
Chapter 3: Results
226
upregulation of CD95 on T cells leading to increased spontaneous and CD95-mediated
apoptosis and worsening of the lymphopenia.
Low thymic output undoubtedly has an important role in shaping the immune system of A-T
patients, however my finding of increased CD95 expression on all lymphocyte subsets
excluding NK cells and the striking similarities to elderly patients who show both increased
CD95 expression on lymphocytes and increased sensitivity to apoptosis of naive T cells
suggests that increased CD95-mediated apoptosis may also contribute to the immune
deficiency in A-T.
Chapter 4: Results
227
Chapter 4: Investigating the sensitivity of A-T cells to
CD95-mediated apoptosis.
Chapter 4: Results
228
4:1: Introduction
A-T lymphocytes express very high levels of the death receptor CD95. This suggests a
possible contribution of increased CD95-mediated apoptosis to the lymphopenia seen in A-T
patients. Little is known about the function of ATM in extrinsic apoptotic pathways, such as
CD95-mediated apoptosis. It is possible that abnormalities in these processes could
contribute to the development of the lymphopenia and/or the lymphoid tumours that are
common in A-T patients.
CD95-mediated apoptosis is initiated by the binding of Fas ligand to CD95 (Fas receptor).
CD95 belongs to a subgroup of the tumour necrosis factor family of receptors (TNF-R) which
also includes TRAIL. It contains an intracellular ‘death domain’ and binding of the ligand
initiates a cell death pathway that activates caspases resulting in apoptosis of the CD95-
expressing cell. The process can also be initiated by overexpression of CD95 on the cell
surface leading to autoactivation and apoptosis (Le Clorennec et al., 2008). In certain
situations, signalling through CD95 can also initiate non-apoptotic pathways leading to
cellular activation, proliferation and differentiation (reviewed in (Strasser et al., 2009)).
CD95-mediated apoptosis has important roles in both the killing of pathogen-infected cells
and in the regulation of the immune system. It is central to the maintenance of immune
system homeostasis, especially in the termination of an immune response. The removal of
surplus B cells by activated T cells towards the end of an immune response is CD95
dependent (Hao et al., 2008), and CD95 also has an important role in activation-induced cell
death (AICD) of mature peripheral T cells. This reduces the number of reactive T cells during
the down phase of an immune response and could help to prevent autoimmunity by deleting
autoreactive T cells. CD95-mediated apoptosis may also be involved in the negative
Chapter 4: Results
229
selection of B cells in the germinal centres and of T cells in the thymus (Siegel et al.,
2000;Takahashi et al., 2001).
Recent work has suggested a role for ATM in determining sensitivity to CD95-mediated
apoptosis, although results in different cell types are conflicting. A recent study by Stagni et
al. reported that although ATM inhibition did not alter the expression of CD95 in
lymphoblastoid cell lines (LCLs), ATM deficiency caused resistance to CD95-mediated
apoptosis (Stagni et al., 2008). This was reported to occur through upregulation of the anti-
apoptotic protein cFLIP by the LCLs in the absence of ATM. Reconstitution of cells with ATM
kinase decreased the cFLIP level and restored sensitivity to CD95-mediated apoptosis. In
contrast, Ivanov et al. showed that inhibition of ATM kinase activity in melanoma cells prior
to irradiation downregulated cFLIP. Inhibition had no effect on expression of CD95 but
upregulated the TRAIL receptor DR5. This, together with cFLIP downregulation, enhanced
TRAIL-mediated apoptosis (Ivanov et al., 2009). CD95-mediated apoptosis was not
investigated in the study but cFLIP downregulation in melanoma cells has also been
associated with increased sensitivity to CD95-mediated apoptosis (Geserick et al., 2008).
In order to clarify the effect of loss of ATM activity on sensitivity to apoptosis, CD95 and
cFLIP protein expression, as well as sensitivity to CD95-mediated apoptosis, was investigated
in LCLs derived from normal healthy donors and A-T patients. The A-T LCLs were significantly
more sensitive to CD95-mediated apoptosis than normal LCLs but there was no evidence for
a role of ATM in regulating either CD95 or cFLIP protein expression. The sensitivity to CD95-
mediated apoptosis of several B-CLL and two T-PLL tumours was also analysed. The
increased sensitivity to CD95-mediated apoptosis of A-T LCLs and the sensitivity of T-PLL
tumours with ATM mutations, suggests that ATM mutations increase the sensitivity to CD95-
Chapter 4: Results
230
mediated apoptosis of lymphoid cells; this could contribute to the lymphopenic phenotype
of A-T patients.
Chapter 4: Results
231
4:2: Development of assays for testing the sensitivity of LCLs to CD95-
mediated apoptosis.
4:2:1: Lymphoblastoid cell lines
The sensitivity to apoptosis of lymphocytes from A-T patients and normal controls was
analysed using a bank of lymphoblastoid cell lines (LCLs). A total of 24 A-T patient (AT1 -
AT24) and 19 normal LCLs (N1 – N19) were used in the study. The A-T LCLs were generated
by colleagues from blood samples collected from patients attending A-T clinics. Normal
control LCLs were generated from lab donor PBMCs. Four of the A-T LCLs (AT4, AT7, AT10
and AT21) were from patients with residual ATM kinase activity; the remainder had no ATM
activity. There were two sets of siblings in the A-T patient group (AT19 & AT20 and AT23 &
AT24) in each set both siblings had the same ATM mutations.
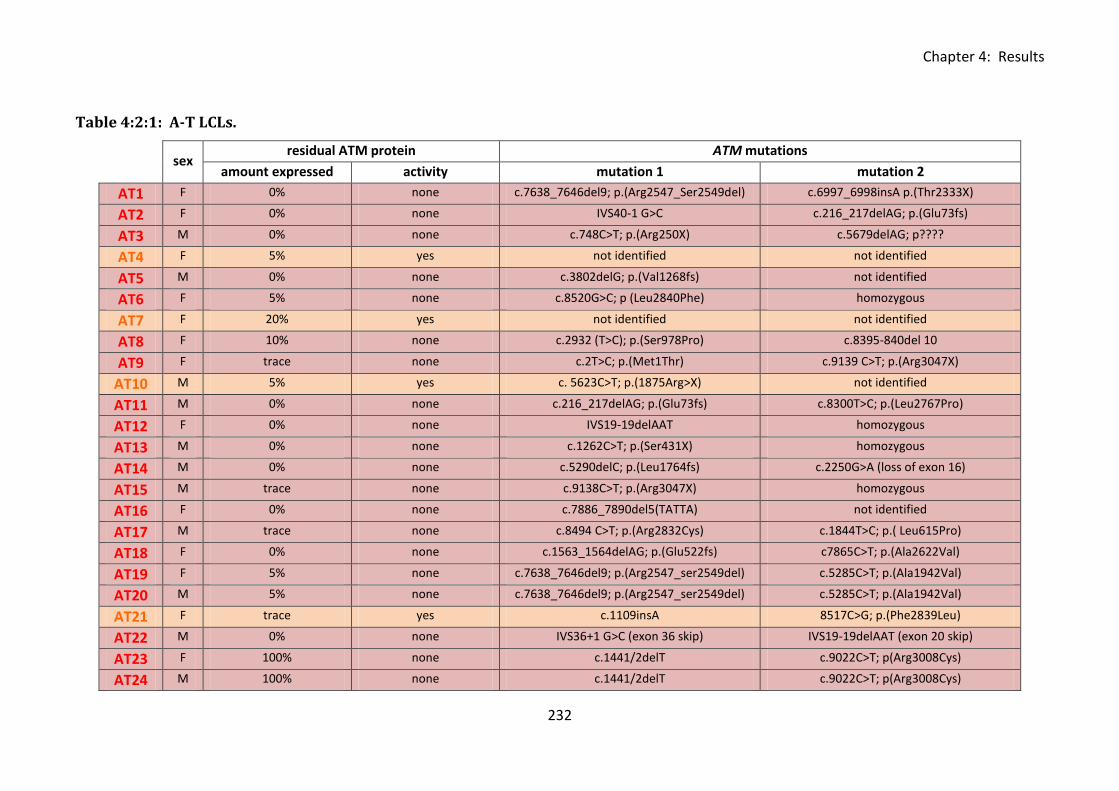
Chapter 4: Results
232
Table 4:2:1: A-T LCLs.
sex
residual ATM protein ATM mutations
amount expressed activity mutation 1 mutation 2
AT1 F 0% none c.7638_7646del9; p.(Arg2547_Ser2549del) c.6997_6998insA p.(Thr2333X)
AT2 F 0% none IVS40-1 G>C c.216_217delAG; p.(Glu73fs)
AT3 M 0% none c.748C>T; p.(Arg250X) c.5679delAG; p????
AT4 F 5% yes not identified not identified
AT5 M 0% none c.3802delG; p.(Val1268fs) not identified
AT6 F 5% none c.8520G>C; p (Leu2840Phe) homozygous
AT7 F 20% yes not identified not identified
AT8 F 10% none c.2932 (T>C); p.(Ser978Pro) c.8395-840del 10
AT9 F trace none c.2T>C; p.(Met1Thr) c.9139 C>T; p.(Arg3047X)
AT10 M 5% yes c. 5623C>T; p.(1875Arg>X) not identified
AT11 M 0% none c.216_217delAG; p.(Glu73fs) c.8300T>C; p.(Leu2767Pro)
AT12 F 0% none IVS19-19delAAT homozygous
AT13 M 0% none c.1262C>T; p.(Ser431X) homozygous
AT14 M 0% none c.5290delC; p.(Leu1764fs) c.2250G>A (loss of exon 16)
AT15 M trace none c.9138C>T; p.(Arg3047X) homozygous
AT16 F 0% none c.7886_7890del5(TATTA) not identified
AT17 M trace none c.8494 C>T; p.(Arg2832Cys) c.1844T>C; p.( Leu615Pro)
AT18 F 0% none c.1563_1564delAG; p.(Glu522fs) c7865C>T; p.(Ala2622Val)
AT19 F 5% none c.7638_7646del9; p.(Arg2547_ser2549del) c.5285C>T; p.(Ala1942Val)
AT20 M 5% none c.7638_7646del9; p.(Arg2547_ser2549del) c.5285C>T; p.(Ala1942Val)
AT21 F trace yes c.1109insA 8517C>G; p.(Phe2839Leu)
AT22 M 0% none IVS36+1 G>C (exon 36 skip) IVS19-19delAAT (exon 20 skip)
AT23 F 100% none c.1441/2delT c.9022C>T; p(Arg3008Cys)
AT24 M 100% none c.1441/2delT c.9022C>T; p(Arg3008Cys)
Chapter 4: Results
233
Table 4:2:1: A-T LCLs.
Amount of residual ATM protein (as percentage of normal protein expression), presence of
ATM activity (measured by western blot) and ATM mutations in A-T LCLs. A-T patients with
no ATM activity are highlighted in red and those with some ATM activity are highlighted in
orange. AT19 & AT20 and AT23 & AT24 were sets of siblings.
Chapter 4: Results
234
4:2:2: Induction of cell death by CH11.
CH11 is a CD95-activating antibody which has been reported to mimic Fas ligand and
activate the characteristic CD95-mediated caspase cascade leading to cleavage of caspase 3
and apoptosis (Tran, 2008). The use of CH11 rather than T cell clones in assays testing
sensitivity to CD95-mediated apoptosis has the major advantage that any LCL can be used as
a target in the assay regardless of HLA type.
In order to test whether CH11 would be effective in inducing cell death of normal and A-T
LCLs and to determine the optimum concentration for further experiments, a CH11 titration
was carried out on four normal and four A-T LCLs. Three of the A-T LCLs (AT1, AT2, AT6) had
no ATM activity and one (AT7) retained some ATM activity. Cell death was measured using a
chromium release assay in order to minimise the number of cells of each LCL and the volume
of CH11 required for the experiment. LCLs were loaded with chromium and incubated for 15
hours in complete media containing varying concentrations of CH11. This is comparable to
the incubation period used in CD95-mediated apoptosis assays with T cell clones.
As the chromium release assay measures the release of radiation by cells as they lyse it does
not discriminate between necrotic cell death and apoptosis. In order to account for any non
CH11-induced cell death a no-CH11 control for each LCL was analysed to measure
spontaneous lysis. The radiation count of the control was then subtracted from the
radiation count of the CH11-treated cells and of the maximum lysis control (LCL + 1% SDS)
and the percentage of CH11-induced lysis calculated using the equation: 100 x (CH11 release
- spontaneous release)/(maximum release - spontaneous release).
The assay results were reproducible (Fig 4:2:2A) and showed a broadly linear relationship
between increasing CH11 concentration and increasing lysis over the concentration range
Chapter 4: Results
235
(Fig 4:2:2B). Interestingly three of the four 4 A-T LCLs underwent higher levels of lysis than
the normal LCLs at the higher CH11 concentrations (Fig 4:2:2B). A CH11 concentration of
500ng/ml was chosen for further assays as it was estimated to induce lysis of approximately
50% of the cells of the most sensitive LCLs used in the assay (AT1 and AT7). Apoptosis of
100% of cells was undesirable for further assays as it would prevent comparisons being
made between the sensitivity of different LCLs to CH11-induced apoptosis.
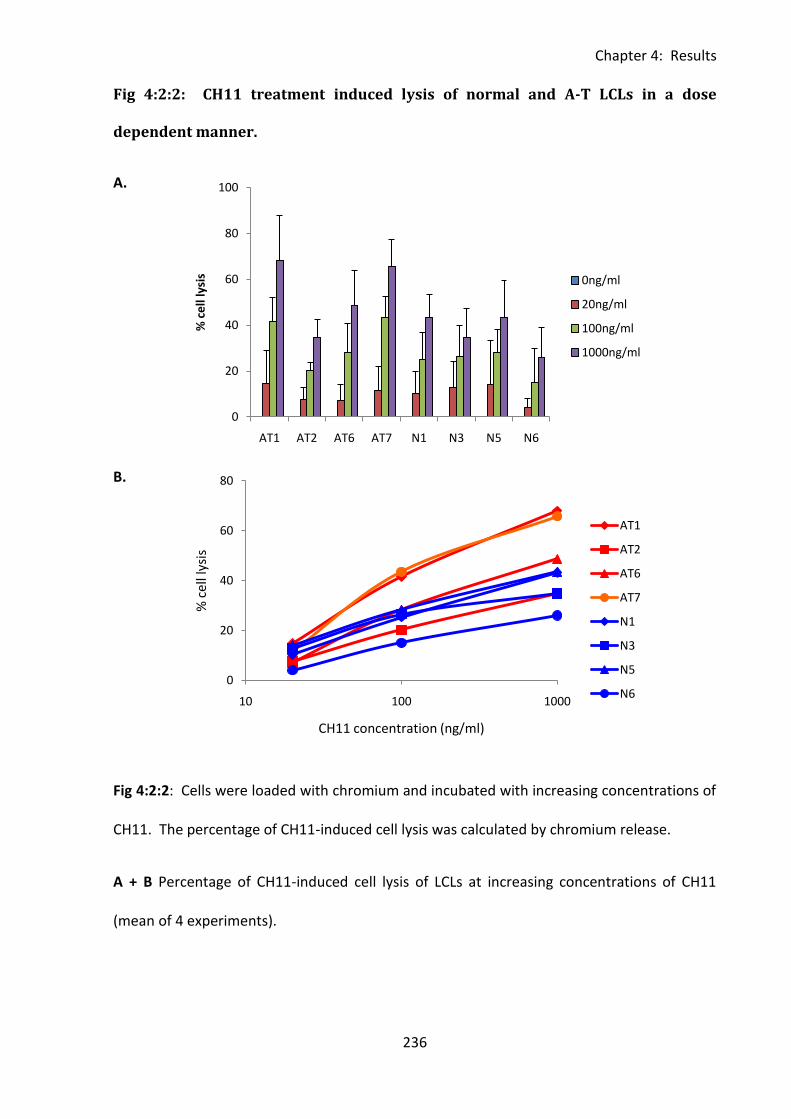
Chapter 4: Results
236
0
20
40
60
80
100
AT1 AT2 AT6 AT7 N1 N3 N5 N6
% c
ell
lysi
s 0ng/ml
20ng/ml
100ng/ml
1000ng/ml
0
20
40
60
80
10 100 1000
% c
ell l
ysis
CH11 concentration (ng/ml)
AT1
AT2
AT6
AT7
N1
N3
N5
N6
Fig 4:2:2: CH11 treatment induced lysis of normal and A-T LCLs in a dose
dependent manner.
A.
B.
Fig 4:2:2: Cells were loaded with chromium and incubated with increasing concentrations of
CH11. The percentage of CH11-induced cell lysis was calculated by chromium release.
A + B Percentage of CH11-induced cell lysis of LCLs at increasing concentrations of CH11
(mean of 4 experiments).
Chapter 4: Results
237
4:2:3: Confirmation of the mechanism of cytotoxicity of CH11.
To test the ability of CH11 to initiate a characteristic death-receptor dependent caspase
cascade and initiate apoptosis, a western blot and Annexin V/PI apoptosis assay were carried
out together on a normal LCL over a 24h timecourse. Cells were incubated with 500ng/ml
CH11 and a sample of cells from each timepoint was stained with Annexin V and PI for
analysis of apoptosis with the remaining cells being used to make protein lysates for western
blotting.
The results of the Annexin V/PI apoptosis assay were analysed using the gating strategy
shown in Fig 4:2:3C. FS/SS gates were drawn to include the lower right ‘viable’ population
and the ‘apoptotic’ population on the far left. Cells in the extreme lower left corner were
excluded as this population largely consists of cell debris. Dead cells which have fragmented
during the final stages of apoptosis will form part of this population so the proportion of
dead cells may be underestimated. However, as Annexin V and PI staining allows
comparisons to be made between changes in viable (Annexin V-PI-) early apoptotic (Annexin
V+PI-) and late apoptotic (Annexin V+PI+) cells this is not a major problem. In fact
comparisons of the proportion of dead cells (Annexin V-PI-) may not be as robust as
comparisons of the proportion of cells still undergoing apoptosis as once cells are dead the
assay cannot distinguish between those that have undergone apoptosis and those that have
died through necrosis.
The western blot membranes were probed for caspases 7 and 3 to detect activation of the
caspase cascade. In order to analyse whether activation of CD95-mediated apoptosis
resulted in activation of ATM the levels of total and phosphorylated ATM and its
downstream targets SMC1 and Nbs1 were also analysed. Cells not treated with CH11 but
Chapter 4: Results
238
irradiated were used as a positive control for phosphorylation of ATM on Ser1981, SMC1 on
Ser966 and Nbs1 on Ser343 and negative control for caspase cascade activation (Fig 4:2:3A).
The presence of a small amount of the cleavage products of caspase 7 and caspase 3 was
observed after 2 hours of CH11 treatment. After 4 hours of treatment the majority of these
caspases appeared to be in the cleaved state. Following 24 hours of treatment no further
apoptosis was evident (Fig 4:2:3A). This result correlates well with the result of the Annexin
V/PI assay (Fig 4:2:3B). Very little apoptosis was observed after 2 hours of treatment but by
4 hours apoptosis was well under way with a 20% increase in the percentage of cells in the
early stages of apoptosis, this increased to 30% after 8 hours. Cells began to enter the late
stages of apoptosis between 4 and 6 hours of treatment and an increase in dead cell number
was seen between 8 and 15 hours. No further decrease in cell viability was observed after 8
hours of treatment indicating that a maximum level of apoptosis had been reached. This
was in agreement with the western blot (Fig 4:2:3A) which showed a reduction in the
amount of cleaved caspase 7 and 3 present after 15h of CH11 treatment. Together these
results confirm that CH11 treatment initiates apoptosis by a caspase cascade involving
caspase 7 and 3. This is characteristic of death receptor induced apoptosis. As maximum
apoptosis appeared to be occurring between 8 and 15 hours of CH11 treatment 15h was
chosen as the incubation period for further experiments.
Analysis of ATM expression showed the presence of two bands of ATM, the expected band
of full length ATM (370 kDa) and a second smaller band of around 250kDa (Fig 4:2:3A).
Cleavage of ATM in response to apoptotic stimuli including CD95 (Stagni et al., 2008), and
inducers of DNA damage (Smith et al., 1999;Wang et al., 2006) has been described
previously and is likely to be the result of caspase 3 activity (Smith et al., 1999;Stagni et al.,
2008). This produces 2 fragments of ATM of approximately 240kDa and 100kDa (Smith et
Chapter 4: Results
239
al., 1999). Only the larger of these fragments could be detected on the western blot as the
membrane was cut into sections and probed with individual antibodies (the section
containing 100kDa proteins was incubated with the NBS1 antibody so the 100kDa ATM
fragment was not detected).
The strong correlation between the presence of cleaved activated caspase 3 and cleaved
ATM over the timecourse supports the hypothesis that activity of this caspase is responsible
for ATM cleavage. The cleavage of ATM in response to apoptotic stimuli has been shown to
reduce its ability to phosphorylate p53 on ser15 but does not affect its DNA binding ability
(Smith et al., 1999;Wang et al., 2006). This may prevent the initiation of DNA damage repair
processes in response to the DNA double strand breaks generated during apoptosis (Smith
et al., 1999). Interestingly Wang et al. (2006) showed that ATM deficient cells were more
sensitive to apoptosis induced by the DNA damaging agent cisplatin than normal cells. They
suggested that in their experimental model ATM was cytoprotective and that its cleavage by
caspases may diminish its cytoprotective effects by reducing its ability to phosphorylate p53
on ser15 and thus facilitating the progression of apoptosis. ATM is also able to
phosphorylate p53 at Ser46 in response to severe DNA damage leading to preferential
transactivation of proapoptotic genes (Kodama et al., 2010). However to my knowledge the
effect of ATM cleavage on phosphorylation of p53 at Ser46 has not yet been investigated.
There was evidence of phosphorylation of ATM, and its downstream substrate SMC1, after
2 hours of CH11 treatment. The maximum level of ATM and SMC1 phosphorylation as well
as phosphorylation of Nbs1 was observed after 4 hours of CH11 treatment. However as
apoptosis was well underway by 4 hours this suggests that ATM activation may not be a
direct result of the CH11 treatment and may be a consequence of the cleavage of DNA
during apoptosis.
Chapter 4: Results
240
Taken together these results clearly show that CH11 activates a CD95-mediated caspase-
dependent apoptotic pathway of cell death in LCLs rather than necrosis. Therefore it can be
used in assays to assess the sensitivity of LCLs to CD95-mediated apoptosis. It is unlikely
that ATM has a direct role in the CD95-mediated apoptotic pathway.
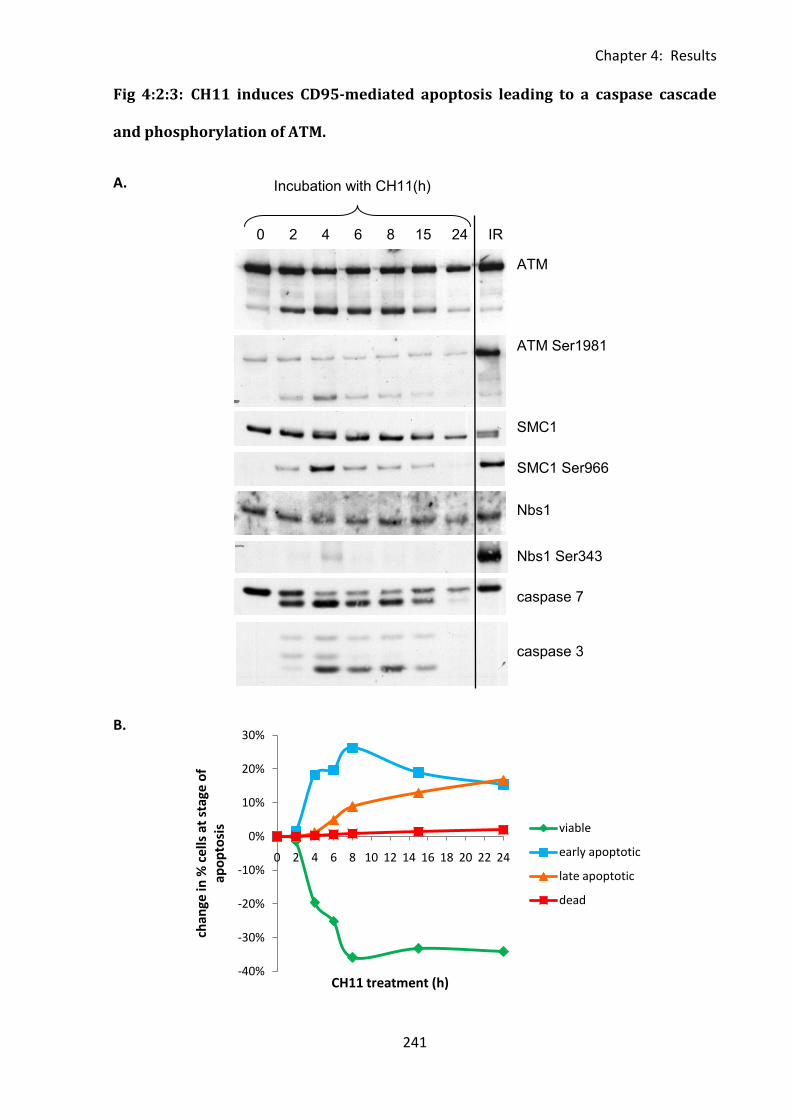
Chapter 4: Results
241
ATM
SMC1
Nbs1
caspase 7
caspase 3
ATM Ser1981
SMC1 Ser966
Nbs1 Ser343
0 2 4 6 8 15 24 IR
Incubation with CH11(h)
-40%
-30%
-20%
-10%
0%
10%
20%
30%
0 2 4 6 8 10 12 14 16 18 20 22 24
chan
ge in
% c
ells
at
stag
e o
f ap
op
tosi
s
CH11 treatment (h)
viable
early apoptotic
late apoptotic
dead
Fig 4:2:3: CH11 induces CD95-mediated apoptosis leading to a caspase cascade
and phosphorylation of ATM.
A.
B.
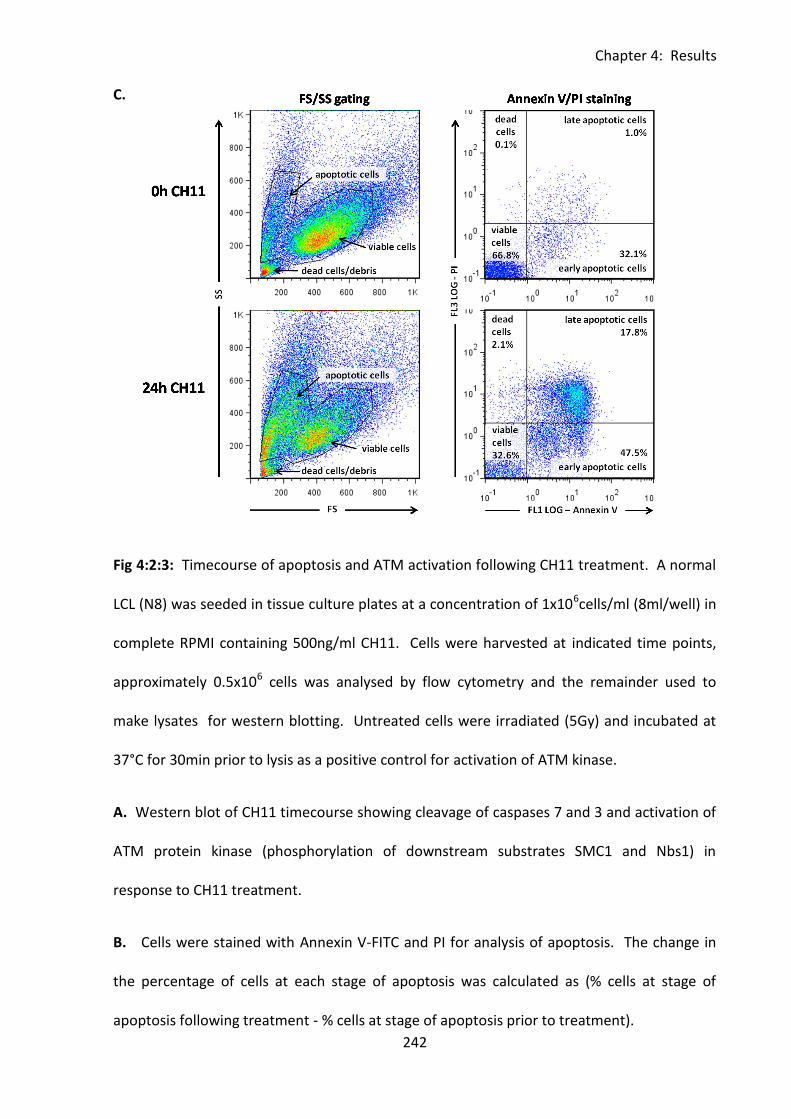
Chapter 4: Results
242
C.
Fig 4:2:3: Timecourse of apoptosis and ATM activation following CH11 treatment. A normal
LCL (N8) was seeded in tissue culture plates at a concentration of 1x10⁶cells/ml (8ml/well) in
complete RPMI containing 500ng/ml CH11. Cells were harvested at indicated time points,
approximately 0.5x10⁶ cells was analysed by flow cytometry and the remainder used to
make lysates for western blotting. Untreated cells were irradiated (5Gy) and incubated at
37°C for 30min prior to lysis as a positive control for activation of ATM kinase.
A. Western blot of CH11 timecourse showing cleavage of caspases 7 and 3 and activation of
ATM protein kinase (phosphorylation of downstream substrates SMC1 and Nbs1) in
response to CH11 treatment.
B. Cells were stained with Annexin V-FITC and PI for analysis of apoptosis. The change in
the percentage of cells at each stage of apoptosis was calculated as (% cells at stage of
apoptosis following treatment - % cells at stage of apoptosis prior to treatment).
Chapter 4: Results
243
C. Example FACs plots and gating strategy for Annexin V/PI apoptosis assay. FS/SS gates
(left) were drawn to include viable and apoptotic cell populations but exclude debris.
Annexin V-FITC and PI staining (right) was used to differentiate between viable
(Annexin V-PI-), early apoptotic (Annexin V+PI-), late apoptotic (Annexin V+PI-) and dead
cells (Annexin V-PI+). Example plots of untreated (0h of CH11, top) and CH11-treated cells
(24h of CH11, bottom) are shown.
Chapter 4: Results
244
4:2:4: Analysing the sensitivity of LCLs to CH11-induced apoptosis using flow
cytometry.
Analysis of apoptosis using an Annexin V/PI assay is more informative than a chromium
release assay as it allows the proportion of cells in different stages of apoptosis to be
determined. The CH11 sensitivity of 5 normal LCLs, 4 A-T LCLs with no ATM activity and 3
A-T LCLs with some ATM activity were compared using the Annexin V/PI assay. The assay
was repeated 3 times and was reproducible (Fig 4:2:4A).
This preliminary result suggested that the A-T LCLs which have no ATM activity were more
sensitive to CH11-induced apoptosis than normal LCLs (Fig 4:2:4B) as there was a larger
increase in cells in early and late apoptosis in these A-T LCLs than in the normal LCLs. The
difference is not statistically significant but the small sample size is very small. An increased
sensitivity of A-T compared to normal LCLs is consistent with the result of the CH11 titration
chromium release assay (Fig 4:2:2).
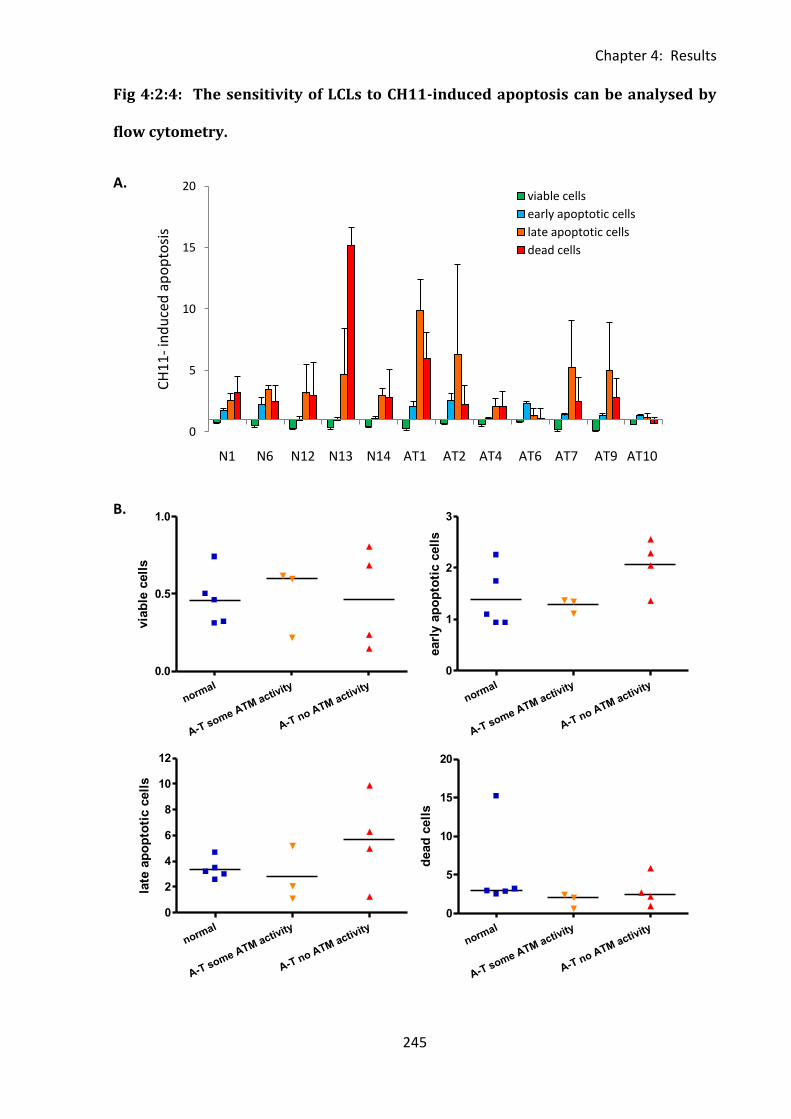
Chapter 4: Results
245
normal
A-T some ATM activity
A-T no ATM activity
0.0
0.5
1.0
via
ble
cell
s
normal
A-T some ATM activity
A-T no ATM activity
0
1
2
3
earl
y a
po
pto
tic c
ell
s
normal
A-T some ATM activity
A-T no ATM activity
0
2
4
6
8
10
12
late
ap
op
toti
c c
ell
s
normal
A-T some ATM activity
A-T no ATM activity
0
5
10
15
20
dead
cell
s0
5
10
15
20
N1 N6 N12 N13 N14 AT1 AT2 AT4 AT6 AT7 AT9 AT10
CH
11
-in
du
ced
ap
op
tosi
s
viable cells
early apoptotic cells
late apoptotic cells
dead cells
Fig 4:2:4: The sensitivity of LCLs to CH11-induced apoptosis can be analysed by
flow cytometry.
A.
B.
Chapter 4: Results
246
Fig 4:2:4: LCLs were treated with 500ng/ml CH11 for 15h then harvested and analysed by
Annexin V/PI staining. Untreated cells of each LCL were used as a control. Gating was
carried out as in Fig 4:2:3C.
A. Apoptosis of LCLs in response to CH11 treatment (mean of 3 experiments). CH11-
induced apoptosis was quantified as the % of CH11-treated cells at each stage of apoptosis
divided by the % of untreated cells at each stage of apoptosis.
B. Comparison of level of apoptosis of normal and A-T LCLs in response to CH11 treatment.
Chapter 4: Results
247
4:2:5: Apoptosis assays using T cell clones.
CH11 treatment is a very convenient and effective method of activating the CD95-mediated
pathway of apoptosis, however it is not as physiologically relevant as using T cell clones for
killing. Therefore an assay was developed to allow the sensitivity of different LCLs to T cell
cytotoxicity to be compared. CMV peptide (VLE and DYSN) specific T cells were cloned from
HLA A2 lab donor PBMCs using IFNγ capture selection and limiting dilution. DYSN is a CD4
restricted peptide and VLE is restricted through CD8. Clones were selected and tested for
peptide specificity using an IFNγ ELISA. This assay measures the amount of IFNγ produced by
the T cell clone in response to antigen. An autologous LCL was loaded with either VLE or
DYSN peptide and used as antigen presenting cells. The ten clones which showed the
greatest peptide specificity (high IFNγ production in response to peptide loaded LCL and low
background in the absence of peptide) were selected for use in further experiments. The
IFNγ production of the selected clones is shown in Fig 4:2:5A.
The next step was to determine the mechanism of cytotoxicity of the T cell clones. The
effect of specifically blocking either the CD95-mediated or perforin/granzme pathway of
apoptosis on T cell clone cytotoxicity against peptide loaded autologous LCL was analysed by
chromium release. Blocking of the CD95-mediated apoptotic pathway using the blocking
antibody ZB4 had no significant effect on the cytotoxicity of either VLE or DYSN clones (Fig
4:2:5B). However the cytotoxicity of both VLE and DYSN clones was effectively blocked by
the perforin/granzyme inhibitor concanamycin A (Fig 4:2:5C). This indicated that both the
CD4+ (DYSN) and CD8+ (VLE) T cell clones killed their targets primarily through perforin and
granzyme rather than CD95-mediated apoptosis. Therefore they could not be used in assays
aimed at analysing the sensitivity of LCLs to CD95-mediated apoptosis.
Chapter 4: Results
248
However, the sensitivity of A-T and normal LCLs to perforin and granzyme-mediated
apoptosis was analysed using the T cell clones. As the CD8+ VLE T cell clones showed the
greastest cytotoxicity they were used in the assay. A-T and normal LCL targets with the
appropriate HLA restriction (A2) were peptide loaded and labelled with the fluorescent dye
CFSE. They were then incubated with unlabelled, VLE-specific T cell clones for 6 hours,
harvested and analysed using flow cytometry. As CFSE is a cytoplasmic dye apoptotic cells
lose their fluorescence and the percentage of surviving CFSE+ve cells of each LCL can be
calculated (Fig 4:2:5D). As the HLA types of the LCL targets could not be perfectly matched,
each LCL was tested against 3 different VLE-specific T cell clones, the results for each clone
were comparable. There was no evidence of a difference in sensitivity of A-T and normal
LCLs to perforin/granzyme-mediated apoptosis, however analysis of a larger panel of LCLs
would be required to confirm this result (Fig 4:2:5D&E).
The CFSE cytotoxicity assay has several advantages. The use of T cell clones rather than
CH11 to activate CD95-mediated apoptosis is undoubtedly more physiologically relevant
than using artificial activators of apoptotic pathways such as CH11, and the labelling of A-T
and normal LCLs with CFSE rather than chromium avoids the use of radiation. As A-T cells
are radiation sensitive the use of chromium could potentially affect assay results. However,
the requirement for HLA matching of T cell clones and LCL targets severely restricts the
number of LCLs that can be used in the assay. Therefore assays using artificial activators
such as CH11 to induce apoptosis are more appropriate for comparing the sensitivity to
apoptosis of a large number of different LCLs.
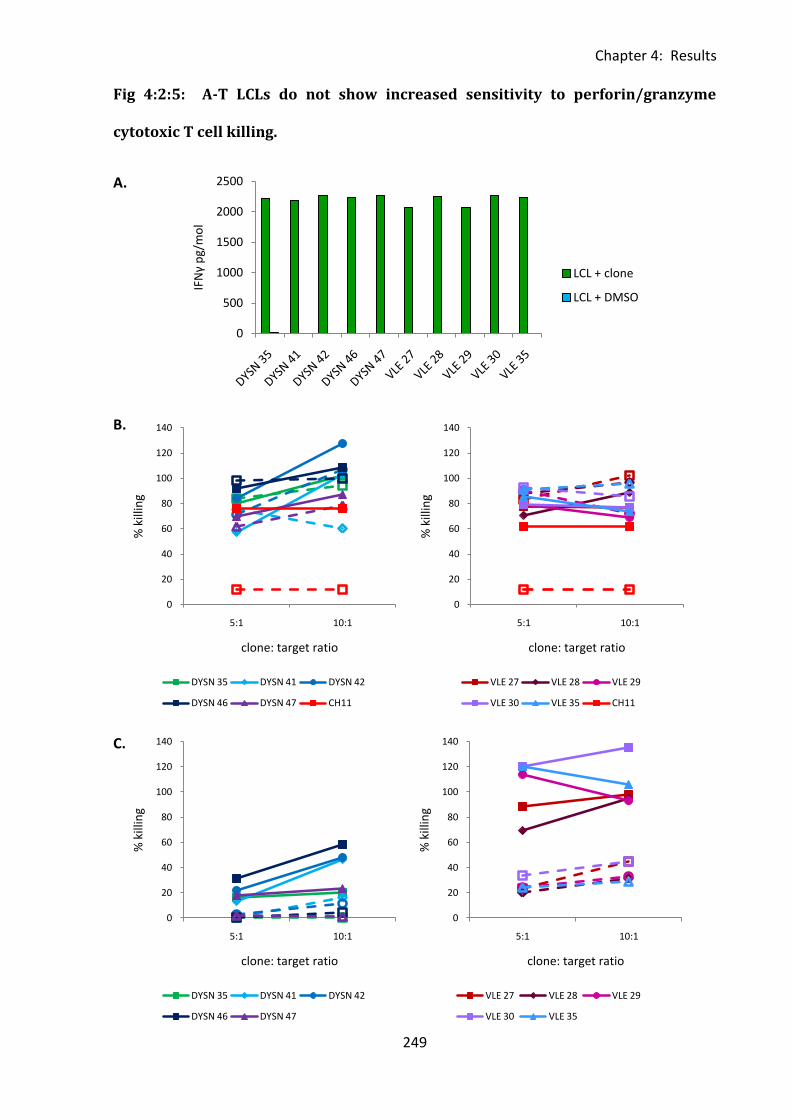
Chapter 4: Results
249
0
500
1000
1500
2000
2500IF
Nγ
pg/
mo
l
LCL + clone
LCL + DMSO
Fig 4:2:5: A-T LCLs do not show increased sensitivity to perforin/granzyme
cytotoxic T cell killing.
A.
B.
C.
0
20
40
60
80
100
120
140
5:1 10:1
% k
illin
g
clone: target ratio
DYSN 35 DYSN 41 DYSN 42
DYSN 46 DYSN 47 CH11
0
20
40
60
80
100
120
140
5:1 10:1
% k
illin
g
clone: target ratio
VLE 27 VLE 28 VLE 29
VLE 30 VLE 35 CH11
0
20
40
60
80
100
120
140
5:1 10:1
% k
illin
g
clone: target ratio
VLE 27 VLE 28 VLE 29
VLE 30 VLE 35
0
20
40
60
80
100
120
140
5:1 10:1
% k
illin
g
clone: target ratio
DYSN 35 DYSN 41 DYSN 42
DYSN 46 DYSN 47
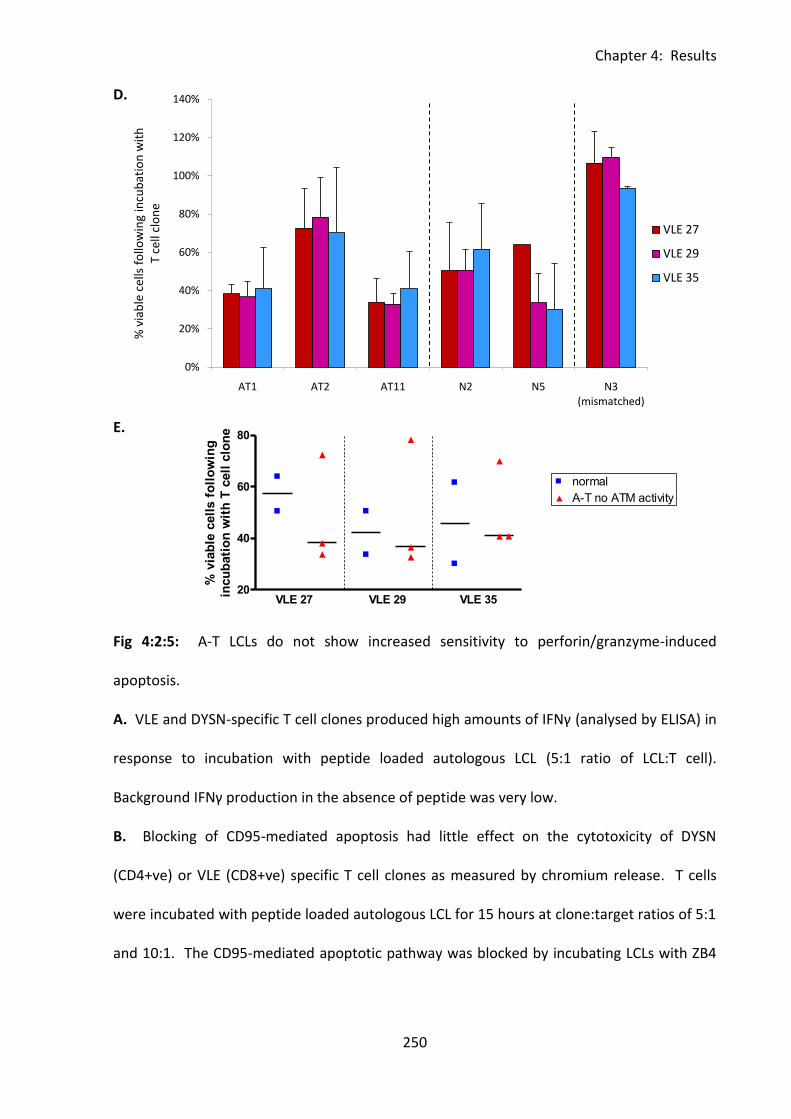
Chapter 4: Results
250
0%
20%
40%
60%
80%
100%
120%
140%
AT1 AT2 AT11 N2 N5 N3 (mismatched)
% v
iab
le c
ells
fo
llow
ing
incu
bat
ion
wit
h
T ce
ll cl
on
e
VLE 27
VLE 29
VLE 35
20
40
60
80
VLE 27 VLE 29 VLE 35
% v
iab
le c
ell
s f
oll
ow
ing
incu
bati
on
wit
h T
cell
clo
ne
D.
E.
Fig 4:2:5: A-T LCLs do not show increased sensitivity to perforin/granzyme-induced
apoptosis.
A. VLE and DYSN-specific T cell clones produced high amounts of IFNγ (analysed by ELISA) in
response to incubation with peptide loaded autologous LCL (5:1 ratio of LCL:T cell).
Background IFNγ production in the absence of peptide was very low.
B. Blocking of CD95-mediated apoptosis had little effect on the cytotoxicity of DYSN
(CD4+ve) or VLE (CD8+ve) specific T cell clones as measured by chromium release. T cells
were incubated with peptide loaded autologous LCL for 15 hours at clone:target ratios of 5:1
and 10:1. The CD95-mediated apoptotic pathway was blocked by incubating LCLs with ZB4
to make fig ledgend - nonsense data
3 4 5 6 71.75
2.00
2.25
2.50
2.75
3.00
3.25normal
A-T no ATM activity
Chapter 4: Results
251
for one hour prior to addition of T cell clones. Incubation of LCL with CH11 was used as a
control. Dashed lines = ZB4 blocked LCLs, solid lines = unblocked controls.
C. VLE and DYSN-specific T cells killed LCL targets through a perforin/granzyme-dependent
mechanism. Incubation of T cell clones with the perforin/granzyme inhibitor concanamycin
A for 2 hours prior to addition of LCL target cells significantly reduced their cytotoxicity as
measured by chromium release. Dashed lines = perforin/granzyme-blocked T cell clones,
solid lines = unblocked controls.
D. The sensitivity of normal and A-T LCLs to perforin/granzyme-mediated apoptosis induced
by cytotoxic VLE-specific T cell clones. CFSE loaded A-T and normal LCLs were incubated
with T cell clones at a ratio of 5:1 for 6 hours then harvested and analysed by flow
cytometry. The percentage of viable cells following incubation with T cell clones was
calculated using the formula (absolute number of CFSE+ve cells following incubation with T
cell clone/absolute number of CFSE+ve cells in the no clone control) x 100/1. A HLA
mismatched (A1) normal LCL (N3) was included as a negative control. (Mean of 3
experiments).
E. There was no significant difference in the sensitivity of normal and A-T LCLs with no ATM
activity to perforin/granzyme-induced apoptosis initiated by 3 different VLE-specific
(CD8+ve) T cell clones. (Mean of 3 different experiments).
Chapter 4: Results
252
4:3: Investigation of the effect of ATM mutations on CD95 expression.
4:3:1: CD95 expression on normal and A-T LCLs.
Preliminary results suggested an increased sensitivity to CH11-induced apoptosis of A-T LCLs
with no ATM activity compared to normal LCLs. Therefore the level of expression of CD95
was compared on normal and A-T LCLs. As CH11 mimics Fas ligand by binding to CD95 it was
hypothesised that the more sensitive A-T LCLs would express higher levels of CD95.
Normal and A-T LCLs were stained with an antibody to CD95, and analysed by flow
cytometry. FS/SS gating was used to select viable cells and PI was used for dead cell
exclusion. The gating strategy is shown in Fig 4:3:1A. In both normal and A-T LCLs almost
100% of live cells in the FS/SS gate expressed CD95 (median of 95.08% in the normal LCLs
and 94.1% in the AT LCLs with no ATM activity). However the percentage of CD95+ve cells in
the A-T LCL with some ATM activity was reduced (73.05%) (Fig 4:3:1B).
Median fluorescence intensity (MFI) was used to compare the level of CD95 expression on
CD95+PI- cells. Surprisingly given the findings reported in Chapter 3 which showed
significantly higher expression of CD95 on A-T compared to normal B cells, the CD95 MFI of
the normal LCLs (median MFI 9.09) were significantly higher than that of A-T LCLs with no
ATM activity (median MFI 4.11) (p<0.001) (Fig 4:3:1C). The A-T LCL with some ATM kinase
activity (AT21) had an intermediate level of CD95 expression (MFI 6.99) between that of the
normal LCLs and the A-T LCLs with no ATM activity. If ATM has a role in regulating CD95
expression it is possible that this intermediate level of expression on AT21 could be due to
its intermediate level of ATM activity.
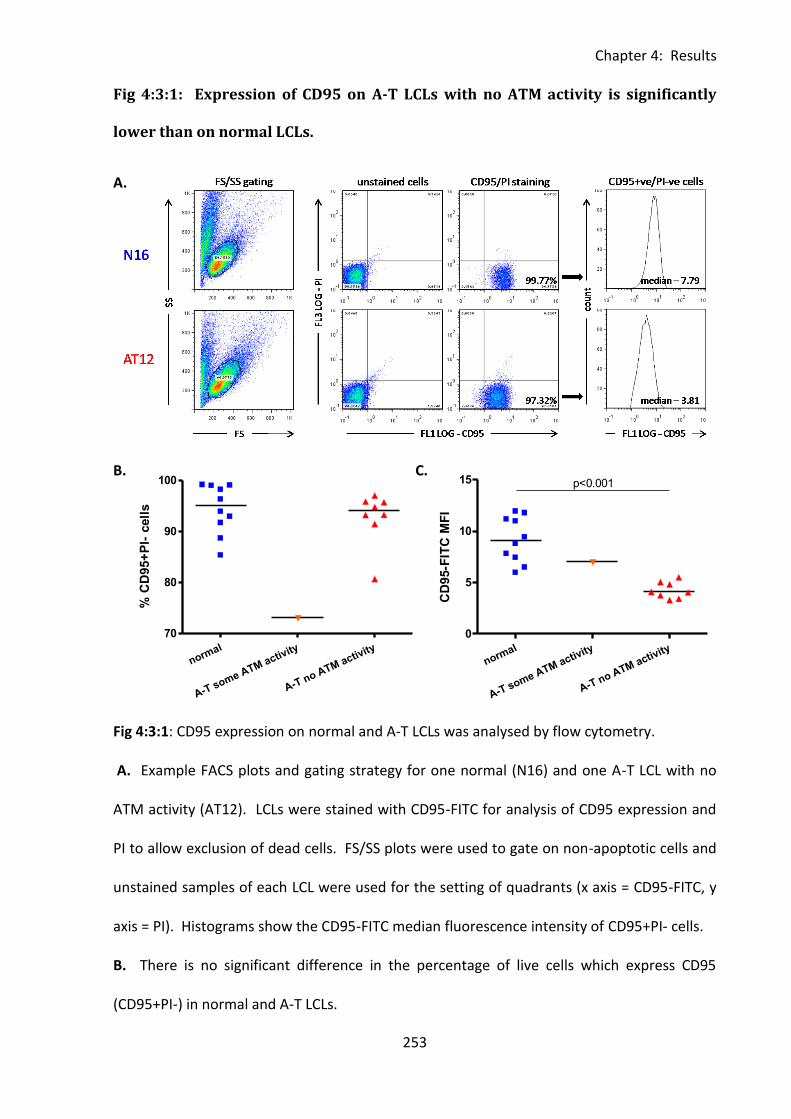
Chapter 4: Results
253
normal
A-T some ATM activity
A-T no ATM activity
70
80
90
100
% C
D95+
PI-
cell
s
normal
A-T some ATM activity
A-T no ATM activity
0
5
10
15 p<0.001
CD
95-F
ITC
MF
I
Fig 4:3:1: Expression of CD95 on A-T LCLs with no ATM activity is significantly
lower than on normal LCLs.
A.
B. C.
Fig 4:3:1: CD95 expression on normal and A-T LCLs was analysed by flow cytometry.
A. Example FACS plots and gating strategy for one normal (N16) and one A-T LCL with no
ATM activity (AT12). LCLs were stained with CD95-FITC for analysis of CD95 expression and
PI to allow exclusion of dead cells. FS/SS plots were used to gate on non-apoptotic cells and
unstained samples of each LCL were used for the setting of quadrants (x axis = CD95-FITC, y
axis = PI). Histograms show the CD95-FITC median fluorescence intensity of CD95+PI- cells.
B. There is no significant difference in the percentage of live cells which express CD95
(CD95+PI-) in normal and A-T LCLs.
Chapter 4: Results
254
C. A-T LCLs which have no ATM activity express significantly lower levels of CD95 than
normal LCLs (p<0.001). (Median fluorescence intensity of CD95+PI- cells).
Chapter 4: Results
255
4:3:2: The effect of inhibition of ATM activity on constitutive CD95 expression.
A-T LCLs with no ATM activity had significantly lower expression of CD95 than normal LCLs
(Fig 4:3:1C). In order to investigate a possible role for ATM kinase activity in determining the
level of expression of CD95 on LCLs, the effect of the ATM inhibitor KU-55933 on CD95
expression was analysed.
Firstly, the ability of KU-55933 to inhibit irradiation-induced activation of ATM protein kinase
in a normal LCL was analysed by western blotting (Fig 4:3:2A). Incubation with 10µM KU-
55933 for 90min prior to 10Gy of irradiation completely prevented irradiation-induced
activation of ATM as measured by phosphorylation of ATM on Ser1981 and its downstream
substrates Nbs1 on Ser343 and SMC1 on Ser966. No cleavage of caspases 7 or 3 in response
to KU-55933 treatment occurred. This indicated that treatment with the ATM inhibitor did
not induce apoptosis of the LCL. A CH11-treated LCL was used as a positive control for
caspase cleavage.
To analyse the effect of KU-55933 induced inhibition of ATM activity on CD95 expression on
LCLs normal and A-T LCLs were incubated with the inhibitor over a 24 hour timecourse and
CD95 expression analysed by flow cytometry. Inhibition of ATM activity had no effect on the
CD95 expression of the LCLs (Fig 4:3:2B&C). As there was no significant downregulation of
CD95 on the cell surface of the normal LCLs in response to inhibition of ATM activity it seems
unlikely that lack of ATM activity is directly responsible for the low levels of CD95 expression
on the cell surface of A-T LCLs.
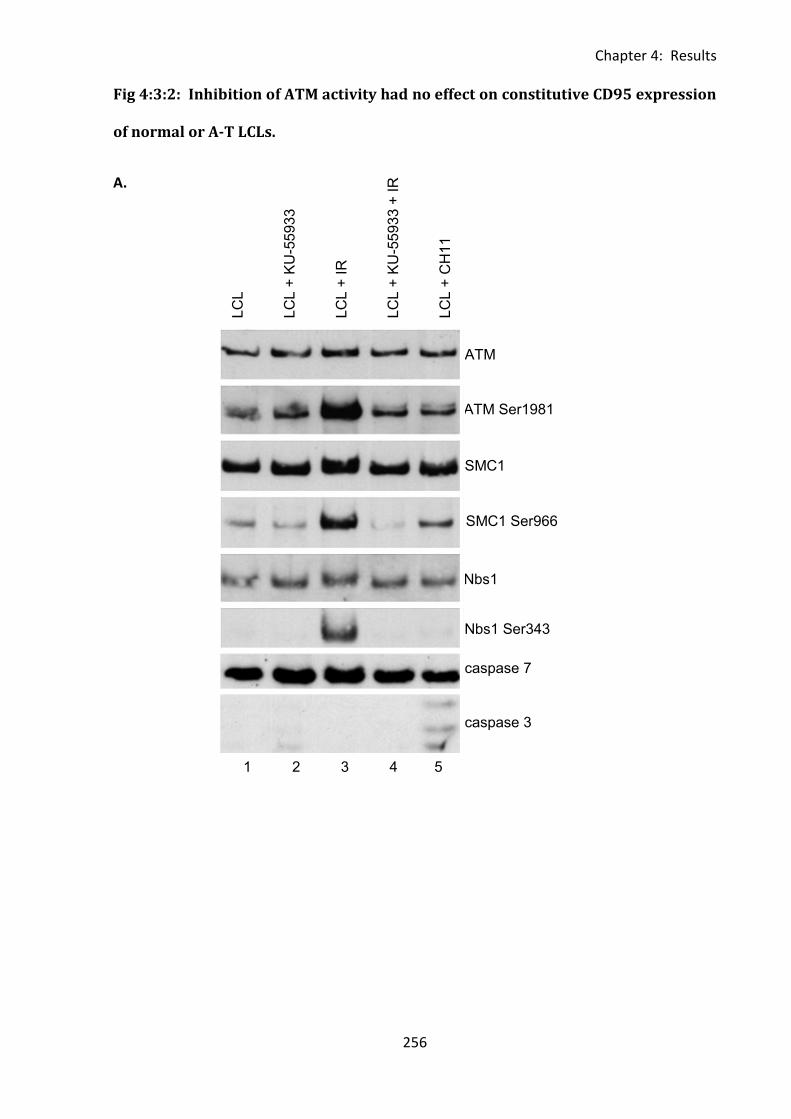
Chapter 4: Results
256
1 2 3 4 5
ATM Ser1981
ser1981
Nbs1 Ser343
SMC1 Ser966
caspase 7
caspase 3
LC
L
LC
L +
KU
-55
93
3
LC
L +
IR
LC
L +
KU
-55
93
3 +
IR
LC
L +
CH
11
ATM
SMC1
Nbs1
Fig 4:3:2: Inhibition of ATM activity had no effect on constitutive CD95 expression
of normal or A-T LCLs.
A.
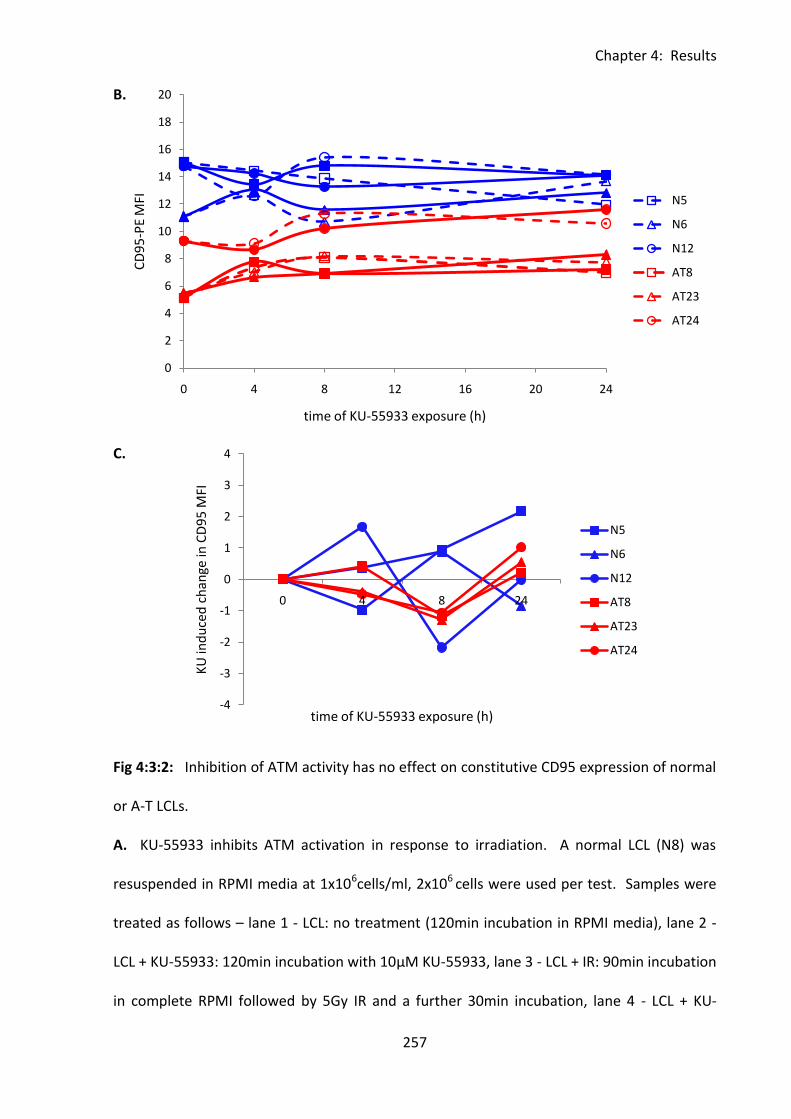
Chapter 4: Results
257
-4
-3
-2
-1
0
1
2
3
4
0 4 8 24
KU
ind
uce
d c
han
ge in
CD
95
MFI
time of KU-55933 exposure (h)
N5
N6
N12
AT8
AT23
AT24
0
2
4
6
8
10
12
14
16
18
20
0 4 8 12 16 20 24
CD
95
-PE
MFI
time of KU-55933 exposure (h)
N5
N6
N12
AT8
AT23
AT24
B.
C.
Fig 4:3:2: Inhibition of ATM activity has no effect on constitutive CD95 expression of normal
or A-T LCLs.
A. KU-55933 inhibits ATM activation in response to irradiation. A normal LCL (N8) was
resuspended in RPMI media at 1x10⁶cells/ml, 2x10⁶ cells were used per test. Samples were
treated as follows – lane 1 - LCL: no treatment (120min incubation in RPMI media), lane 2 -
LCL + KU-55933: 120min incubation with 10µM KU-55933, lane 3 - LCL + IR: 90min incubation
in complete RPMI followed by 5Gy IR and a further 30min incubation, lane 4 - LCL + KU-
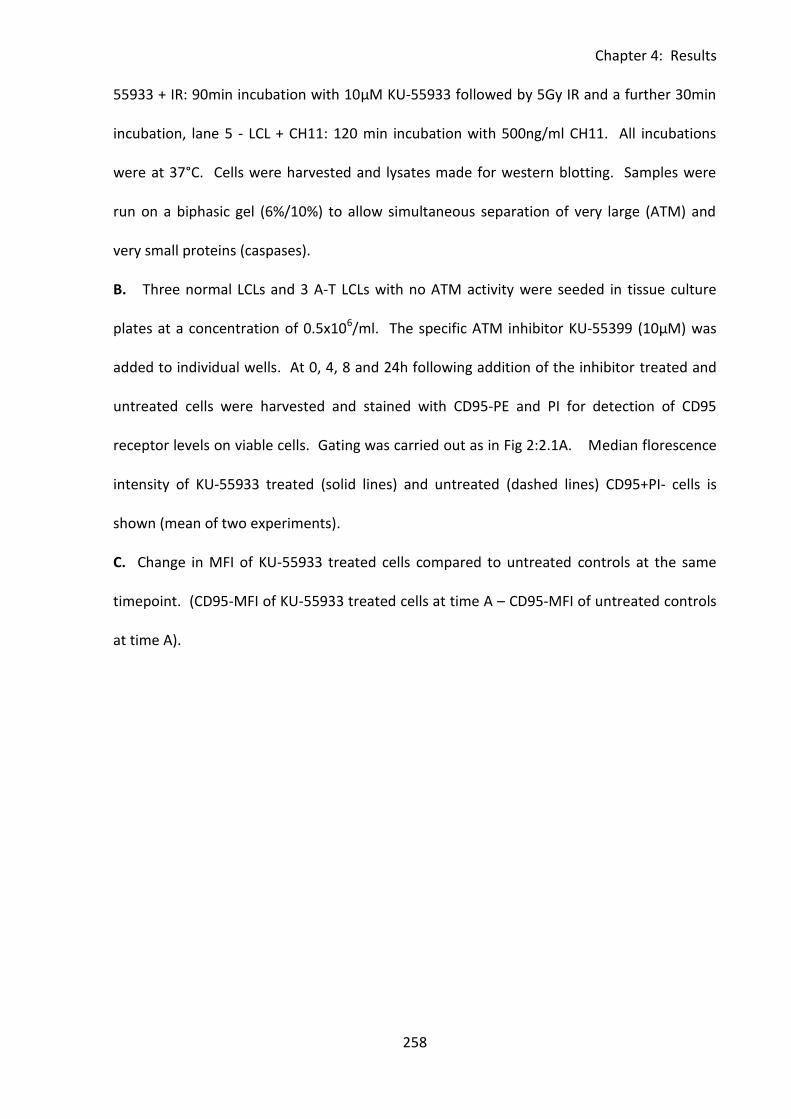
Chapter 4: Results
258
55933 + IR: 90min incubation with 10µM KU-55933 followed by 5Gy IR and a further 30min
incubation, lane 5 - LCL + CH11: 120 min incubation with 500ng/ml CH11. All incubations
were at 37°C. Cells were harvested and lysates made for western blotting. Samples were
run on a biphasic gel (6%/10%) to allow simultaneous separation of very large (ATM) and
very small proteins (caspases).
B. Three normal LCLs and 3 A-T LCLs with no ATM activity were seeded in tissue culture
plates at a concentration of 0.5x10⁶/ml. The specific ATM inhibitor KU-55399 (10μM) was
added to individual wells. At 0, 4, 8 and 24h following addition of the inhibitor treated and
untreated cells were harvested and stained with CD95-PE and PI for detection of CD95
receptor levels on viable cells. Gating was carried out as in Fig 2:2.1A. Median florescence
intensity of KU-55933 treated (solid lines) and untreated (dashed lines) CD95+PI- cells is
shown (mean of two experiments).
C. Change in MFI of KU-55933 treated cells compared to untreated controls at the same
timepoint. (CD95-MFI of KU-55933 treated cells at time A – CD95-MFI of untreated controls
at time A).
Chapter 4: Results
259
4:3:3: The effect of ATM activation on cell surface expression of CD95.
The effect of ATM activation on CD95 expression on LCLs was also analysed. Normal and A-T
LCLs were irradiated with a dose of 10Gy to create DNA double strand breaks and activate
ATM, and expression of CD95 was then analysed by flow cytometry over a 24h timecourse
following IR. Non-irradiated LCLs were used as a control for each timepoint (Fig 4:3:3A).
Irradiation led to a statistically significant increase in CD95 expression on the LCLs (Fig
4:3:3B). However, as this increase occurred in both normal and A-T LCLs, including AT9
which has no ATM activity, it cannot be ATM-dependent.
Although constitutive expression of CD95 is significantly lower on A-T LCLs with no ATM
activity than normal LCLs, this result, and the result of the ATM inhibitor assay suggest that
ATM does not have a direct role in determining its expression. ATM activity could have an
indirect effect on CD95 expression by influencing other factors such as sensitivity to CD95-
mediated apoptosis and cell viability.
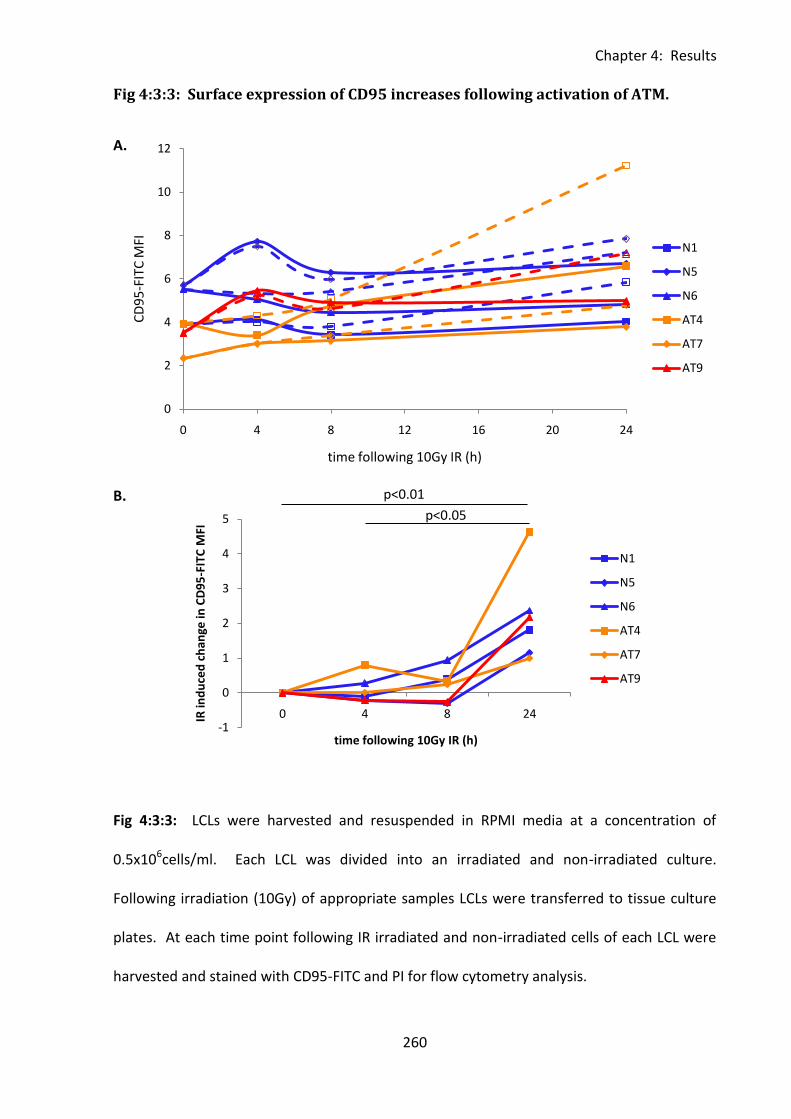
Chapter 4: Results
260
0
2
4
6
8
10
12
0 4 8 12 16 20 24
CD
95
-FIT
C M
FI
time following 10Gy IR (h)
N1
N5
N6
AT4
AT7
AT9
-1
0
1
2
3
4
5
0 4 8 24IR in
du
ced
ch
ange
in C
D9
5-F
ITC
MFI
time following 10Gy IR (h)
N1
N5
N6
AT4
AT7
AT9
p<0.01
p<0.05
Fig 4:3:3: Surface expression of CD95 increases following activation of ATM.
A.
B.
Fig 4:3:3: LCLs were harvested and resuspended in RPMI media at a concentration of
0.5x10⁶cells/ml. Each LCL was divided into an irradiated and non-irradiated culture.
Following irradiation (10Gy) of appropriate samples LCLs were transferred to tissue culture
plates. At each time point following IR irradiated and non-irradiated cells of each LCL were
harvested and stained with CD95-FITC and PI for flow cytometry analysis.
Chapter 4: Results
261
A. CD95 MFI of irradiated (dashed lines) and non-irradiated control samples (solid lines) of
each LCL following irradiation.
B. There was a significant increase in CD95 expression between 0 and 24 hours (p<0.01) and
4 and 24 hours (p<0.05) following irradiation. (Irradiation-induced change in CD95 MFI =
CD95 MFI of irradiated sample - CD95 MFI of corresponding non-irradiated control).
Chapter 4: Results
262
4:4: The effect of ATM mutation on the sensitivity of A-T LCLs to CH11-
induced apoptosis.
4:4:1: Comparing the sensitivity of A-T and normal LCLs to CH11-induced
apoptosis.
In order to investigate the effect of CD95 expression on CH11 sensitivity of normal and A-T
LCLs the Annexin V/PI apoptosis assay was modified to include the CD95 antibody. CD95
staining was carried out prior to Annexin V staining during the assay. This allowed the effect
of CH11 treatment on CD95 expression on LCLs to be investigated and the effect of CD95
expression on CH11 sensitivity to be analysed. The assay was carried out using a large panel
of 16 normal LCLs, 13 A-T LCLs with no ATM activity and 3 A-T LCLs with some ATM activity.
The percentage of viable cells which expressed CD95 was slightly higher in normal LCLs
(median 99.1%) than in A-T LCLs with no ATM activity (median 95.4%) and the A-T LCLs with
some ATM activity were very similar to the normal LCLs (median 99.4%) (Fig 4:4:1A). The
median fluorescence intensity of CD95 expression was significantly lower on A-T LCLs with
no ATM activity than normal LCLs (Fig 4:4:1B). There was no significant difference in MFI
between A-T LCLs with some ATM activity and normal LCLs.
CH11-induced apoptosis of CD95+ cells led to a reduction in the level of CD95 expression
(MFI) on viable cells of both normal and A-T LCLs (Fig 4:4:1B). However, even after 15 hours
of CH11 treatment the CD95 MFI of normal LCLs (median MFI of 2.2) was still significantly
higher (p<0.001) than that of A-T LCLs with no ATM activity median MFI of 0.66I).
The A-T LCLs with no ATM activity were significantly more sensitive to CH11 treatment than
both normal LCLs and A-T LCLs with some ATM activity (Fig 4:4:1C). The apoptotic sensitivity
Chapter 4: Results
263
of normal and A-T LCLs were analysed in terms of the change in the proportion of cells at
each stage of apoptosis following CH11 treatment (% of cells in stage of apoptosis following
CH11 treatment/% of untreated cells at same stage of apoptosis). Values greater than 1
represent an increase and less than 1 a decrease in the proportion of cells at an individual
stage of apoptosis.
Unsurprisingly the proportions of viable cells in both A-T and normal LCLs decreased and the
proportions of apoptotic and dead cells increased in response to CH11 treatment (Fig
4:4:1C). There was a significantly larger change (decrease) in the proportion of viable cells
after CH11 treatment in A-T LCLs with no ATM activity than in normal LCLs (p<0.05). There
was also a significantly larger change (increase) in the proportion of cells in the early stage of
apoptosis in response to CH11 treatment in A-T LCLs with no ATM activity compared to both
normal LCLs (p<0.01) and A-T LCLs with some ATM activity (p<0.05). There were no
significant differences in the change in proportions (increase) of cells in the late stage of
apoptosis or dead cells between A-T LCLs with no ATM activity and normal LCLs. However,
there was a significant difference in both cases between A-T LCLs with no ATM activity and
A-T LCLs with some ATM activity (late apoptosis p<0.05, dead cells p<0.05). These results
indicate an increased sensitivity of A-T LCLs with no ATM activity to CD95-mediated
apoptosis compared to normal LCLs. The A-T LCLs with some ATM activity were more similar
to normal LCLs than A-T LCLs with no ATM activity in terms of their apoptotic sensitivity.
The modified apoptosis assay allowed the relationship between the sensitivity of LCLs to
CH11 and their CD95 expression to be analysed (Fig 4:4:1D). There were significant
correlations between increasing CD95 expression (MFI) on A-T LCLs with no ATM activity and
decreasing viability/increasing apoptosis in response to CH11 (viable cells – r=-0.6364,
p=0.0299; late apoptotic cells - r=0.6455, p=0.0368). AT15 was classed as an outlier as it
Chapter 4: Results
264
expressed unusually high levels of CD95 for an A-T LCL with no ATM activity (more than two
standard deviations above the mean) so it was excluded from the correlation analysis.
Interestingly AT15 did express a trace of ATM protein and in terms of apoptotic sensitivity
and CD95 expression it appeared to belong to the group of A-T LCLs with some ATM activity;
however its ATM mutations (Table 4:2:1) and western blot analysis indicate that this is not
the case.
Normal LCLs, which expressed significantly higher levels of CD95 than A-T LCLs with no ATM
activity, did not show a statistically significant correlation between CD95 expression and
apoptosis (Fig 4:4:1D). This suggests that above a certain threshold concentration of CD95
receptor expression increasing CD95 expression does not increase sensitivity to apoptosis.
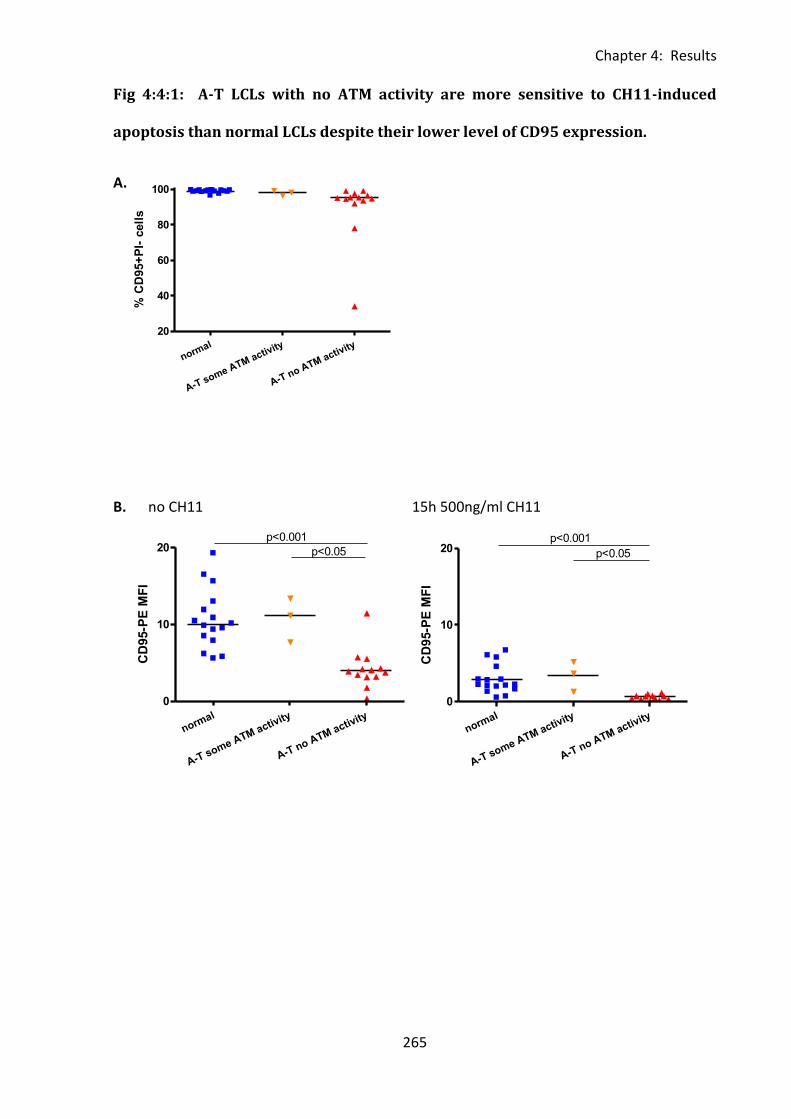
Chapter 4: Results
265
normal
A-T some ATM activity
A-T no ATM activity
0
10
20p<0.001
p<0.05
CD
95-P
E M
FI
normal
A-T some ATM activity
A-T no ATM activity
20
40
60
80
100
% C
D95+
PI-
cell
s
Fig 4:4:1: A-T LCLs with no ATM activity are more sensitive to CH11-induced
apoptosis than normal LCLs despite their lower level of CD95 expression.
A.
B. no CH11 15h 500ng/ml CH11
normal
A-T some ATM activity
A-T no ATM activity
0
10
20p<0.001
p<0.05
CD
95-P
E M
FI
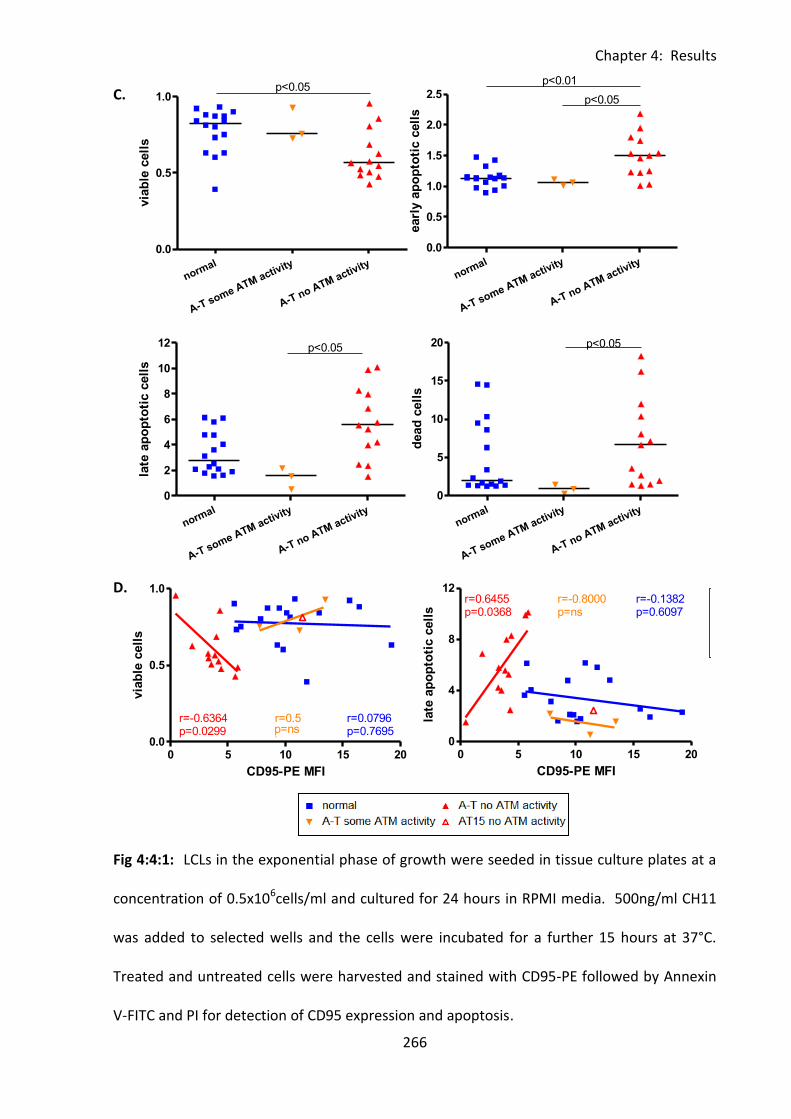
Chapter 4: Results
266
0 5 10 15 200.0
0.5
1.0normal
A-T activity
A-T no ATM activity
r=-0.6364p=0.0299
r=0.5p=1.0
r=0.0796p=0.7695
AT15 no ATM activity
CD95-PE MFI
via
ble
cell
s
normal
A-T some ATM activity
A-T no ATM activity
0.0
0.5
1.0p<0.05
via
ble
cell
s
normal
A-T some ATM activity
A-T no ATM activity
0.0
0.5
1.0
1.5
2.0
2.5
p<0.01
p<0.05
earl
y a
po
pto
tic c
ell
s
normal
A-T some ATM activity
A-T no ATM activity
0
2
4
6
8
10
12 p<0.05
late
ap
op
toti
c c
ell
s
normal
A-T some ATM activity
A-T no ATM activity
0
5
10
15
20 p<0.05
dead
cell
s
C.
D.
Fig 4:4:1: LCLs in the exponential phase of growth were seeded in tissue culture plates at a
concentration of 0.5x10⁶cells/ml and cultured for 24 hours in RPMI media. 500ng/ml CH11
was added to selected wells and the cells were incubated for a further 15 hours at 37°C.
Treated and untreated cells were harvested and stained with CD95-PE followed by Annexin
V-FITC and PI for detection of CD95 expression and apoptosis.
0 5 10 15 200
4
8
12normal
A-T activity
A-T no ATM activity
r=0.6455p=0.0368
r=-0.1382p=0.6097
r=-0.8000p=ns
AT15 no ATM activity
CD95-PE MFI
late
ap
op
toti
c c
ell
s
0 5 10 15 200
4
8
12normal
A-T activity
A-T no ATM activity
r=0.6455p=0.0368
r=-0.1382p=0.6097
r=-0.8000p=ns
AT15 no ATM activity
CD95-PE MFI
late
ap
op
toti
c c
ell
s
Chapter 4: Results
267
A. The percentage of live cells which express CD95 (CD95+PI-) is slightly higher in normal
LCLs than in A-T LCLs with no ATM activity, this difference is significant (p<0.001). Gating
was carried out as in Fig 4:3:1A.
B. CD95-PE MFI of viable (Annexin V-PI-) cells of LCLs with (right) and without (left) 15h of
CH11 treatment. Gating was carried out as in Fig 4:3:1A.
C. Apoptosis of normal and A-T LCLs in response to CH11 treatment. Cells were gated as in
Fig 4:2:3C. Apoptosis was quantified as the % of CH11-treated cells at each stage of
apoptosis divided by the % of untreated cells at each stage of apoptosis.
D. Correlation between CD95 MFI of untreated viable cells and sensitivity to CH11-induced
apoptosis (left - % viable cells following CH11 treatment/% viable cells without treatment
against CD95 expression, right - % cells in late apoptosis following CH11 treatment/%cells in
late apoptosis without treatment against CD95 expression).
Chapter 4: Results
268
4:4:2: The effect of CD95 expression on the viability in culture of A-T and normal
LCLs.
The level of CD95 at the cell surface is a potent regulator of cell viability. Overexpression of
CD95 can cause spontaneous apoptosis whereas decreasing its expression has been shown
to reduce levels of spontaneous apoptosis in LCLs (Le Clorennec et al., 2008). The data from
untreated LCLs shown in Fig 4:4:1B was used to analyse the effect of constitutive CD95
expression on the viability of normal and A-T LCLs under normal culture conditions.
Consistent with the finding that CD95 expression on A-T LCLs with no ATM activity was low
compared to normal LCLs we found that the A-T LCLs had a significantly higher percentage of
viable cells (Annexin V-, PI-) in culture (Fig 4:4:2A). This suggests that they underwent lower
levels of spontaneous apoptosis than the normal LCLs. The CD95 expression of A-T LCLs with
some ATM activity was similar to that of normal LCLs and significantly higher than A-T LCLs
with no ATM activity (p<0.05) (Fig 4:4:1B). Taking both normal and A-T LCLs into
consideration there was a significant negative correlation between increasing CD95
expression on LCLs and decreasing viability in culture (r=-0.4274, p=0.0185) (Fig 4:4:2B).
The low level of CD95 expression on the CH11 sensitive A-T LCLs with no ATM activity may
be the result of downregulation of the receptor in order to reduce spontaneous apoptosis of
the CD95-sensitive cells rather than a direct result of lack of ATM activity.
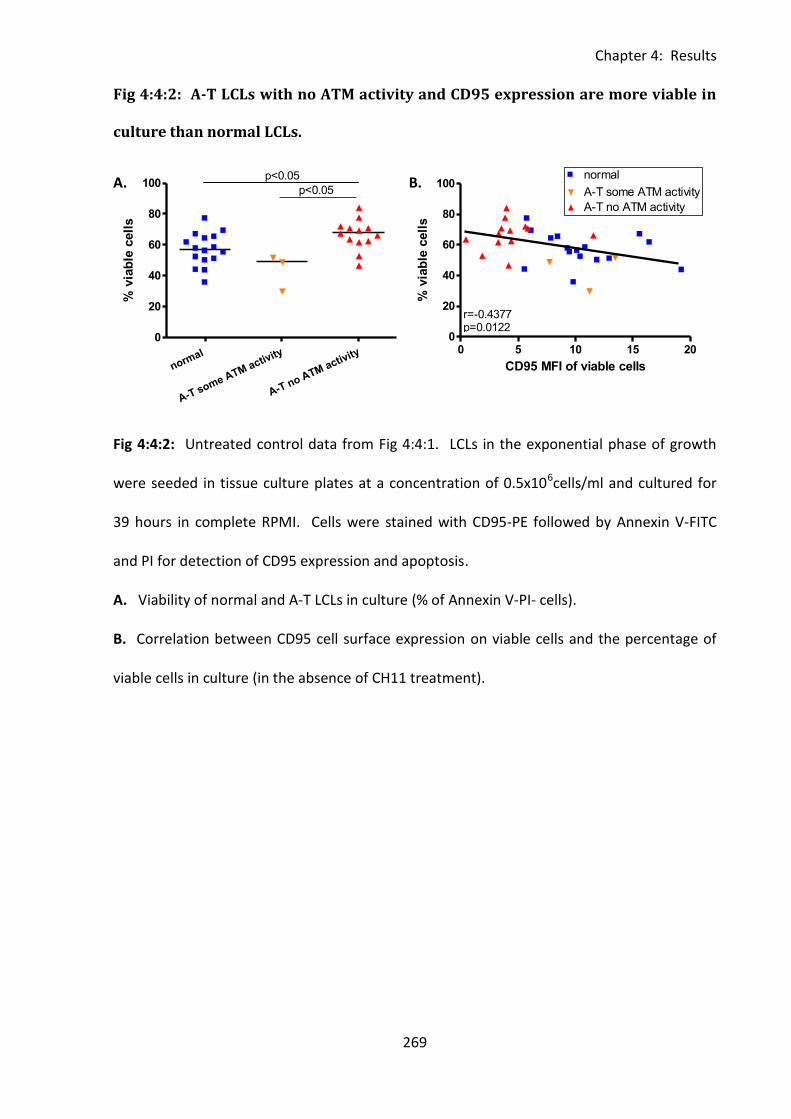
Chapter 4: Results
269
0 5 10 15 200
20
40
60
80
100normal
A-T some ATM activity
A-T no ATM activity
CD95 MFI of viable cells
% v
iab
le c
ell
s
normal
A-T some ATM activity
A-T no ATM activity
0
20
40
60
80
100p<0.05
% v
iab
le c
ell
s
normal
A-T some ATM activity
A-T no ATM activity
0
20
40
60
80
100p<0.05
% v
iab
le c
ell
sFig 4:4:2: A-T LCLs with no ATM activity and CD95 expression are more viable in
culture than normal LCLs.
A. B.
Fig 4:4:2: Untreated control data from Fig 4:4:1. LCLs in the exponential phase of growth
were seeded in tissue culture plates at a concentration of 0.5x10⁶cells/ml and cultured for
39 hours in complete RPMI. Cells were stained with CD95-PE followed by Annexin V-FITC
and PI for detection of CD95 expression and apoptosis.
A. Viability of normal and A-T LCLs in culture (% of Annexin V-PI- cells).
B. Correlation between CD95 cell surface expression on viable cells and the percentage of
viable cells in culture (in the absence of CH11 treatment).
0 5 10 15 200
20
40
60
80
100
r=-0.4377p=0.0122
CD95 MFI of viable cells
% v
iab
le c
ell
s
0 5 10 150.0
0.5
1.0
normal
A-T no ATM activity
A-T some ATM activity
caspase 8/cFLIP
via
ble
cell
s
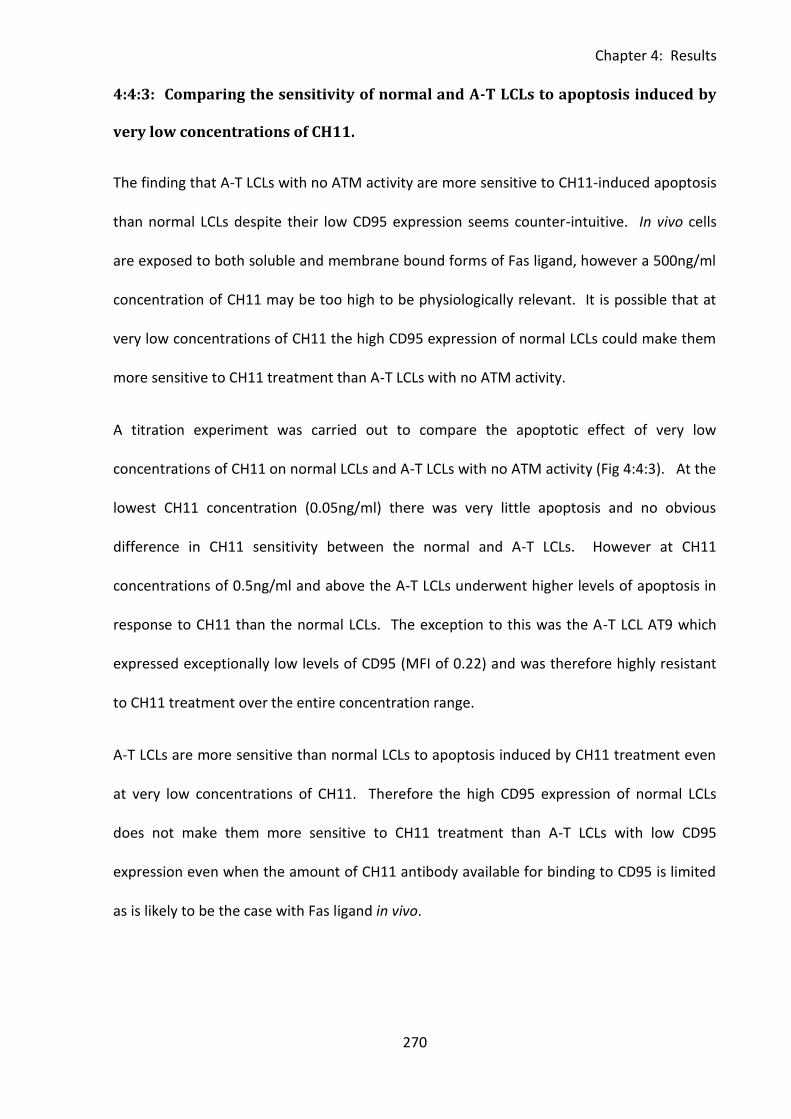
Chapter 4: Results
270
4:4:3: Comparing the sensitivity of normal and A-T LCLs to apoptosis induced by
very low concentrations of CH11.
The finding that A-T LCLs with no ATM activity are more sensitive to CH11-induced apoptosis
than normal LCLs despite their low CD95 expression seems counter-intuitive. In vivo cells
are exposed to both soluble and membrane bound forms of Fas ligand, however a 500ng/ml
concentration of CH11 may be too high to be physiologically relevant. It is possible that at
very low concentrations of CH11 the high CD95 expression of normal LCLs could make them
more sensitive to CH11 treatment than A-T LCLs with no ATM activity.
A titration experiment was carried out to compare the apoptotic effect of very low
concentrations of CH11 on normal LCLs and A-T LCLs with no ATM activity (Fig 4:4:3). At the
lowest CH11 concentration (0.05ng/ml) there was very little apoptosis and no obvious
difference in CH11 sensitivity between the normal and A-T LCLs. However at CH11
concentrations of 0.5ng/ml and above the A-T LCLs underwent higher levels of apoptosis in
response to CH11 than the normal LCLs. The exception to this was the A-T LCL AT9 which
expressed exceptionally low levels of CD95 (MFI of 0.22) and was therefore highly resistant
to CH11 treatment over the entire concentration range.
A-T LCLs are more sensitive than normal LCLs to apoptosis induced by CH11 treatment even
at very low concentrations of CH11. Therefore the high CD95 expression of normal LCLs
does not make them more sensitive to CH11 treatment than A-T LCLs with low CD95
expression even when the amount of CH11 antibody available for binding to CD95 is limited
as is likely to be the case with Fas ligand in vivo.
Chapter 4: Results
271
Fig 4:4:3: A-T LCLs with no ATM activity are more sensitive to CH11-induced
apoptosis than normal LCLs over a range of CH11 concentrations.
Fig 4:4:3: A-T and normal LCLs were incubated with increasing concentrations of CH11 (0-
500ng/mL) and apoptosis measured using Annexin V/PI staining. Apoptosis was calculated
as the % of all Annexin V+ cells following treatment divided by the % of all Annexin V+ cells
without treatment. CD95 MFI of individual LCLs (viable cells prior to treatment) is indicated
in the figure key.
0.8
1.2
1.6
2.0
2.4
0.00 0.05 0.50 5.00 50.00 500.00
all a
po
pto
tic
cells
CH11 concentration ng/ml
N8 CD95 MFI - 10.57
N18 CD95 MFI - 15.80
N12 CD95 MFI - 15.23
N7 CD95 MFI - 5.50
AT6 CD95 MFI - 3.70
AT9 CD95 MFI - 0.22
AT22 CD95 MFI - 3.45
AT23 CD95 MFI - 4.01
Chapter 4: Results
272
4:4:4: Comparing the rate of CH11-induced apoptosis in normal and A-T LCLs.
The results shown in Fig 4:4:1 strongly suggest an increased sensitivity of A-T LCLs to CH11-
induced apoptosis compared to normal LCLs despite their comparatively low CD95
expression. However, this finding is surprising as normal LCLs express significantly higher
levels of CD95 than A-T LCLs with no ATM activity so would be expected to be the more
sensitive group.
It is probable that the Annexin V/PI apoptosis assay underestimates the amount of cell death
that occurs over the 15h assay period as dead cells which have fragmented will appear as
debris and are excluded from the flow cytometry analysis. If normal LCLs undergo apoptosis
at a faster rate than A-T LCLs with no ATM activity they will have a lower proportion of cells
in early and late apoptosis and a higher proportion of dead cells than A-T LCLs at the end of
the assay. Therefore they will appear to be less sensitive to CH11-induced apoptosis than
the A-T LCLs. However, the finding that CH11 induces a significantly greater reduction in the
proportion of viable cells in A-T LCLs with no ATM activity than in normal LCLs suggests that
this is not the case (Fig 4:4:1C&D).
To investigate the possibility of an increased rate of apoptosis in normal LCLs compared to A-
T LCLs affecting the reliability of the Annexin V/PI apoptosis assay a CH11 timecourse
experiment was carried out on 2 normal LCLs and 2 A-T LCLs with no ATM activity. Cells
were incubated with CH11 and apoptosis analysed every 2 hours over a 12 hour period to
allow comparisons to be made between the rates at which cells entered different stages of
apoptosis (Fig 4:4:4).
The A-T LCLs underwent a continuous decrease in the proportion of viable cells over the 12
hour incubation period, however the normal LCLs reached a minimum level of viability by 6
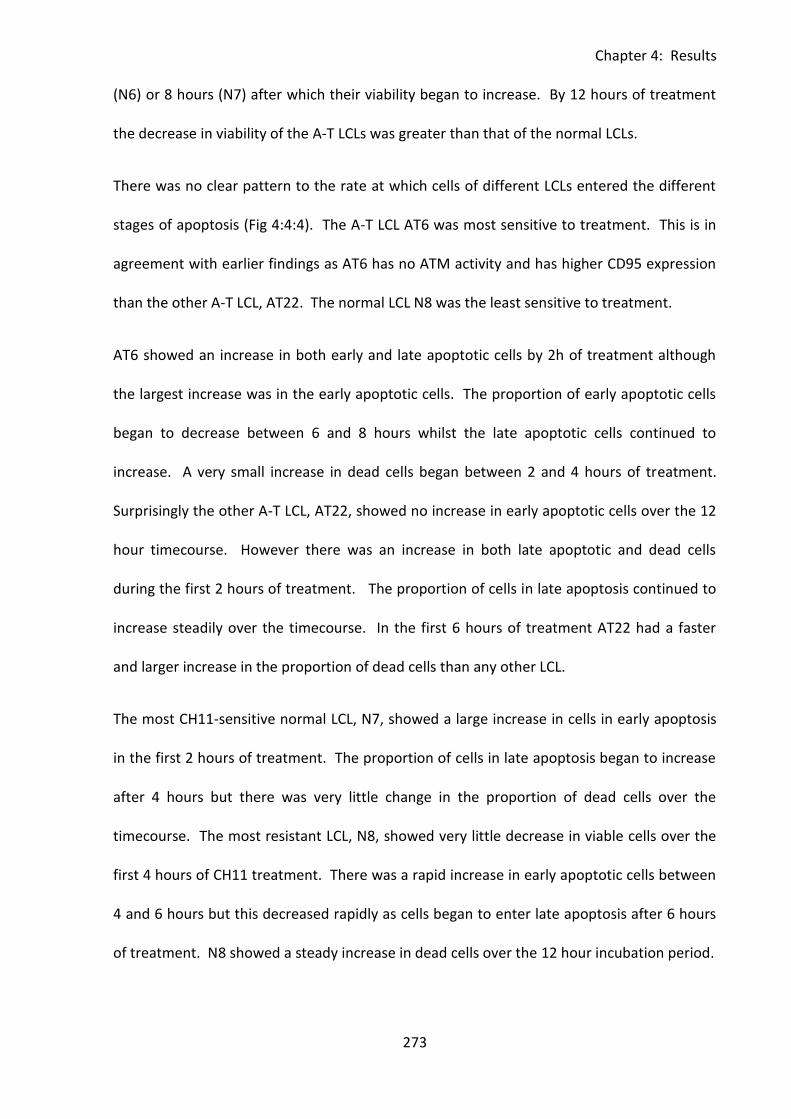
Chapter 4: Results
273
(N6) or 8 hours (N7) after which their viability began to increase. By 12 hours of treatment
the decrease in viability of the A-T LCLs was greater than that of the normal LCLs.
There was no clear pattern to the rate at which cells of different LCLs entered the different
stages of apoptosis (Fig 4:4:4). The A-T LCL AT6 was most sensitive to treatment. This is in
agreement with earlier findings as AT6 has no ATM activity and has higher CD95 expression
than the other A-T LCL, AT22. The normal LCL N8 was the least sensitive to treatment.
AT6 showed an increase in both early and late apoptotic cells by 2h of treatment although
the largest increase was in the early apoptotic cells. The proportion of early apoptotic cells
began to decrease between 6 and 8 hours whilst the late apoptotic cells continued to
increase. A very small increase in dead cells began between 2 and 4 hours of treatment.
Surprisingly the other A-T LCL, AT22, showed no increase in early apoptotic cells over the 12
hour timecourse. However there was an increase in both late apoptotic and dead cells
during the first 2 hours of treatment. The proportion of cells in late apoptosis continued to
increase steadily over the timecourse. In the first 6 hours of treatment AT22 had a faster
and larger increase in the proportion of dead cells than any other LCL.
The most CH11-sensitive normal LCL, N7, showed a large increase in cells in early apoptosis
in the first 2 hours of treatment. The proportion of cells in late apoptosis began to increase
after 4 hours but there was very little change in the proportion of dead cells over the
timecourse. The most resistant LCL, N8, showed very little decrease in viable cells over the
first 4 hours of CH11 treatment. There was a rapid increase in early apoptotic cells between
4 and 6 hours but this decreased rapidly as cells began to enter late apoptosis after 6 hours
of treatment. N8 showed a steady increase in dead cells over the 12 hour incubation period.
Chapter 4: Results
274
With the exception of the faster recovery of viability of normal LCLs, the most obvious
difference between the two groups was seen in the rate at which cells entered the late stage
of apoptosis. Both A-T LCLs showed a steady increase in late apoptotic cells over the 12
hours of CH11 treatment. However, the normal LCLs, N7 and N8, did not show any
significant increase in the percentage of late apoptotic cells for the first 4 or 6 hours of
treatment respectively. This delay may indicate that apoptosis is proceeding at a faster rate
in A-T LCLs with no ATM activity than in normal LCLs.
Although the Annexin V/PI assay does have its limitations the result of the CH11 timecourse
assay indicates that the increased sensitivity to CH11-induced apoptosis of A-T LCLs with no
ATM activity compared to normal LCLs is not an artefact due to underestimation of the
percentage of dead cells in the assay.
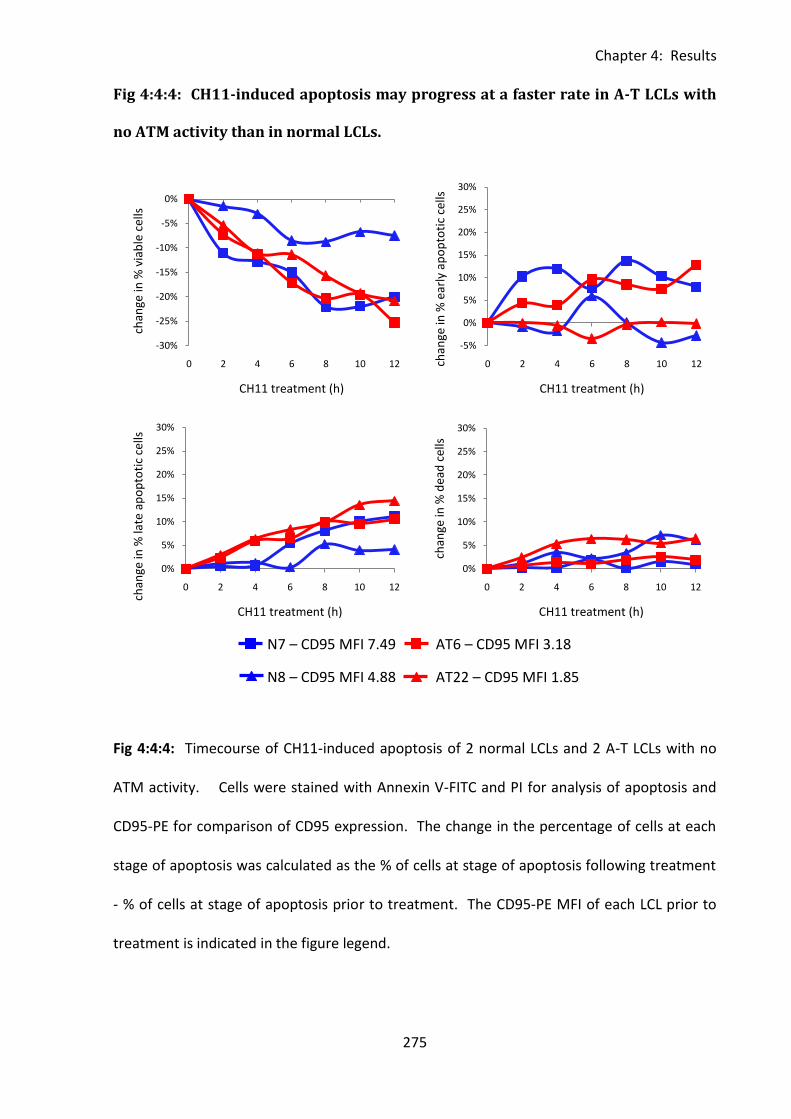
Chapter 4: Results
275
Fig 4:4:4: CH11-induced apoptosis may progress at a faster rate in A-T LCLs with
no ATM activity than in normal LCLs.
Fig 4:4:4: Timecourse of CH11-induced apoptosis of 2 normal LCLs and 2 A-T LCLs with no
ATM activity. Cells were stained with Annexin V-FITC and PI for analysis of apoptosis and
CD95-PE for comparison of CD95 expression. The change in the percentage of cells at each
stage of apoptosis was calculated as the % of cells at stage of apoptosis following treatment
- % of cells at stage of apoptosis prior to treatment. The CD95-PE MFI of each LCL prior to
treatment is indicated in the figure legend.
-30%
-25%
-20%
-15%
-10%
-5%
0%
0 2 4 6 8 10 12
chan
ge in
% v
iab
le c
ells
CH11 treatment (h)
-5%
0%
5%
10%
15%
20%
25%
30%
0 2 4 6 8 10 12chan
ge in
% e
arly
ap
op
toti
c ce
lls
CH11 treatment (h)
0%
5%
10%
15%
20%
25%
30%
0 2 4 6 8 10 12
chan
ge in
% la
te a
po
pto
tic
cells
CH11 treatment (h)
0%
5%
10%
15%
20%
25%
30%
0 2 4 6 8 10 12
chan
ge in
% d
ead
cel
ls
CH11 treatment (h)
N7 – CD95 MFI 7.49
N8 – CD95 MFI 4.88
AT6 – CD95 MFI 3.18
AT22 – CD95 MFI 1.85
Chapter 4: Results
276
4:4:5: Analysis of the effect of ATM inhibition on the sensitivity of LCLs to
CH11-induced apoptosis.
A-T LCLs with no ATM activity are more sensitive to CH11-induced apoptosis than normal
LCLs. Therefore inhibition of ATM activity may sensitise normal LCLs to CH11-induced
apoptosis. However, as activation of ATM is not required for initiation of CH11-induced
apoptosis (Fig 4:2:3) it seems unlikely that ATM kinase activity has a direct role in sensitivity
to CH11. The ATM inhibitor KU-55933 was used to prevent activation of ATM activity and
the effect on the sensitivity of LCLs to CH11-induced apoptosis was analysed.
LCLs were incubated with KU-55933 for 1.5 or 8 hours to inhibit ATM activation prior to
incubation with CH11 (15h). To minimise the risk of any cytotoxic effects of the ATM
inhibitor influencing the result cells incubated with KU-55933 for 1.5+15 or 8+15 hours
without CH11 were used as controls for each individual LCL. Treatment of LCLs with KU-
55933 alone had very little effect on the percentage of viable or early apoptotic cells,
however there was a small increase in PI+ve cells compared to untreated controls suggesting
that some necrotic cell death may have occurred (result not shown).
Fig 4:4:5A shows the effect of ATM inhibition on the CH11 sensitivity of one normal LCL (N8),
one A-T LCL with some ATM activity (AT21) and one A-T LCL with no ATM activity (AT18). In
all three LCLs the loss of viability in response to CH11 treatment and the increase in
apoptotic cells were slightly increased in KU-55933 treated cells compared to those treated
with CH11 alone. However this effect was most pronounced in AT18 which expresses no
ATM (Table 4:2:1) so cannot be affected by inhibition of ATM activity. This suggests that the
apparent slight sensitisation to CH11 in the presence of KU-55933 may be due to its
cytotoxicity rather than its inhibitory effect on ATM activation. The relatively large increase

Chapter 4: Results
277
in dead cells in the presence of KU-55933 treated cells supports this idea as these cells may
have died through necrosis.
Finally the effect of ATM inhibition and CH11 treatment on 3 normal LCLs was analysed (Fig
4:4:5B). The sensitivity of N8 appeared to be slightly decreased in response to ATM
inhibition, whereas the sensitivity of N9 was slightly increased and there was no real effect
on N11. These results indicate that short term inhibition of ATM activity does not have any
significant effect on the CH11 sensitivity of LCLs.
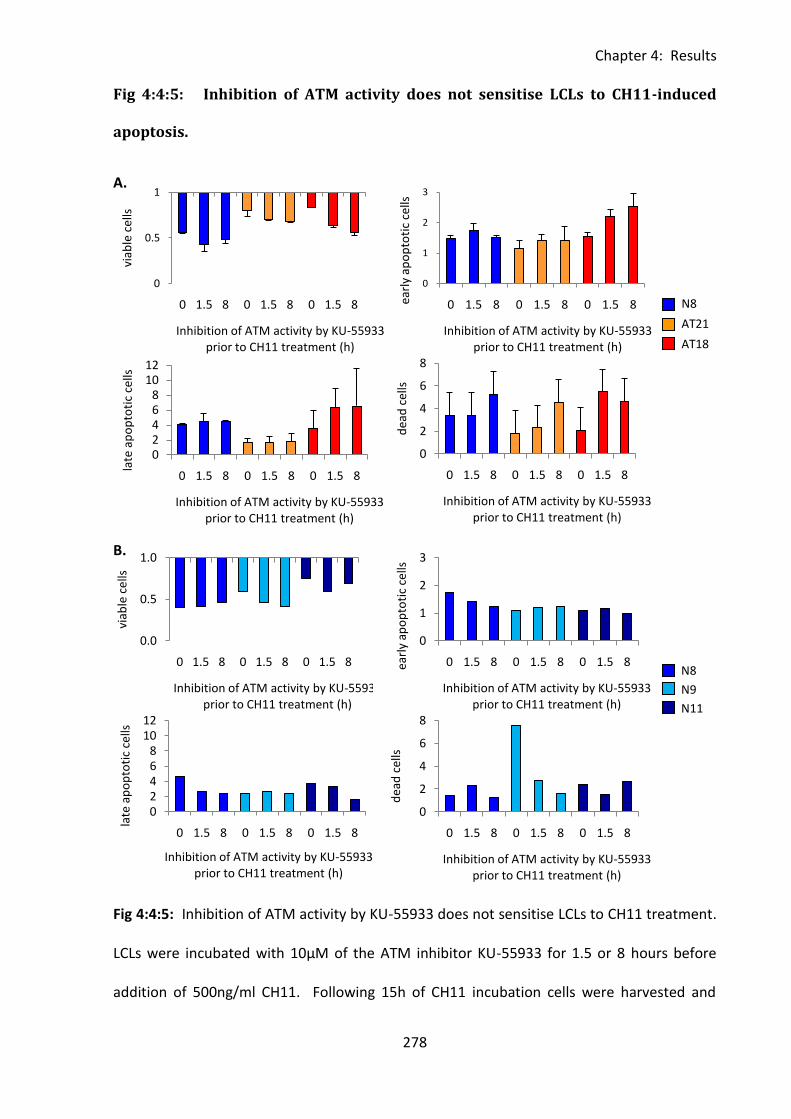
Chapter 4: Results
278
0
0.5
1
0 1.5 8 0 1.5 8 0 1.5 8
viab
le c
ells
Inhibition of ATM activity by KU-55933 prior to CH11 treatment (h)
0
1
2
3
0 1.5 8 0 1.5 8 0 1.5 8earl
y ap
op
toti
c ce
lls
Inhibition of ATM activity by KU-55933 prior to CH11 treatment (h)
02468
1012
0 1.5 8 0 1.5 8 0 1.5 8
late
ap
op
toti
c ce
lls
Inhibition of ATM activity by KU-55933 prior to CH11 treatment (h)
0
2
4
6
8
0 1.5 8 0 1.5 8 0 1.5 8
dea
d c
ells
Inhibition of ATM activity by KU-55933 prior to CH11 treatment (h)
0.0
0.5
1.0
0 1.5 8 0 1.5 8 0 1.5 8
viab
le c
ells
Inhibition of ATM activity by KU-55933 prior to CH11 treatment (h)
0
1
2
3
0 1.5 8 0 1.5 8 0 1.5 8earl
y ap
op
toti
c ce
lls
Inhibition of ATM activity by KU-55933 prior to CH11 treatment (h)
0
2
4
6
8
0 1.5 8 0 1.5 8 0 1.5 8
dea
d c
ells
Inhibition of ATM activity by KU-55933 prior to CH11 treatment (h)
02468
1012
0 1.5 8 0 1.5 8 0 1.5 8
late
ap
op
toti
c ce
lls
Inhibition of ATM activity by KU-55933 prior to CH11 treatment (h)
Fig 4:4:5: Inhibition of ATM activity does not sensitise LCLs to CH11-induced
apoptosis.
A.
B.
Fig 4:4:5: Inhibition of ATM activity by KU-55933 does not sensitise LCLs to CH11 treatment.
LCLs were incubated with 10µM of the ATM inhibitor KU-55933 for 1.5 or 8 hours before
addition of 500ng/ml CH11. Following 15h of CH11 incubation cells were harvested and
N8
N9
N11
N8
AT21
AT18
Chapter 4: Results
279
analysed using the Annexin V/PI apoptosis assay. Untreated cells and cells treated with KU-
55933 without CH11 were used as controls for each LCL. Apoptosis was quantified as the %
of KU-55933 treated or untreated cells at each stage of apoptosis following CH11 treatment
divided by the % of KU-55933 treated or untreated cells at each stage of apoptosis without
CH11 treatment.
A. KU-55933 and CH11-induced apoptosis of 1 normal LCL (N8), one A-T LCL with some ATM
activity (AT21) and one A-T LCL with no ATM activity. (Mean of 3 experiments).
B. KU-55933 and CH11-induced apoptosis of 3 normal LCLs. Inhibition of ATM activity by
KU-55933 had no significant effect on the sensitivity of normal LCLs to CH11-induced
apoptosis.
Chapter 4: Results
280
4:5: cFLIP expression in normal and A-T LCLs.
4:5:1: Analysis of cFLIPL and cFLIPS expression by western blot.
The increased sensitivity of A-T LCLs to CH11 treatment, despite their reduced CD95
expression, suggests that there must be another factor influencing their sensitivity to CD95-
mediated apoptosis. The caspase 8 inhibitor cFLIP (cellular FLICE-like inhibitory protein) has
an important role in regulation of CD95-mediated apoptosis as it competes with pro-caspase
8 for binding to the DISC (death inducing signalling complex). DISC formation occurs in
response to the binding of FasL ligand (or CH11) to CD95. Pro-caspase 8 is then recruited to
the DISC and cleaved to generate active caspase 8. This in turn cleaves caspase 3 to initiate
the caspase cascade leading to apoptosis. Binding of cFLIP to the DISC prevents the binding
of caspase 8 and activation of the caspase cascade so inhibits apoptosis (Krueger et al.,
2001).
In humans there are two main isoforms of cFLIP which arise from alternative splicing, a
28kDa short form (cFLIPS) and a 55kDa long form (cFLIPL). The protein is structurally similar
to procaspase-8 and can compete with it for binding to the DISC, preventing caspase 8
activation and apoptosis.
Western blot was chosen as the method of measuring cFLIP protein levels in LCLs. As I had
difficulty finding a reliable antibody for detecting cFLIP a total of four antibodies were
tested; H202 (Santa Cruz) (Stagni et al., 2008), #3210 (Cell Signalling Technology) (Dutton et
al., 2004), ab8421 (Abcam) and NF6 (Alexis Biochemicals) (Ivanov et al., 2009). All antibodies
were described as recognising both the long and short forms of cFLIP.
Initially 3 antibodies were tested; H202, #3210 and ab8421. These are all rabbit polyclonal
antibodies and should recognise both human and mouse cFLIP. Lysates of one normal (N8)
Chapter 4: Results
281
and one A-T LCL with no ATM activity (AT18) were run on a gel along with lysates from HeLa
cells (human cervical cancer cell line which expresses cFLIPL) and NIH3T3 cells (mouse
fibroblasts which express both isoforms) as positive controls. Blotting with all three
antibodies using the manufacturer’s recommended dilution conditions produced multiple
bands suggesting a high degree of non-specific binding (Fig 4:5:1A). However none of the
antibodies showed clear bands of the appropriate size for cFLIPL (55-58kDa) or cFLIPS (28-
30kDa). A second blot of HeLa and NIH3T3 lysates was carried out and the membranes
incubated under different dilution conditions in an attempt to increase sensitivity and
minimise non-specific binding of #3210 and H202 (Fig 4:5:1B). However changing the
diluents and antibody concentrations did not significantly improve the blots.
As the antibodies were clearly binding multiple proteins I attempted to determine which
bands (if any) were cFLIP and which were the result of non-specific binding. An siRNA
knockdown of cFLIP was carried out in HeLa cells in order to produce a negative control
which would express no or very little cFLIPL. Lysate from the knockdown was run on a gel
alongside HeLa and NIH3T3 lysates and the membrane probed with #3210 and H202
antibodies (Fig 4:5:1C). The membrane stained with #3210 did show a slight reduction in a
band of approximately the correct size to be cFLIPL in the cFLIP siRNA transfected lysate.
However, the effect was so slight that it could have been a loading effect. The cFLIP siRNA
transfection had no effect on the band pattern of the membrane stained with H202.
Therefore I was unable to conclusively determine which bands were cFLIPL or if the
knockdown had been successful.
A further blot was carried out to try and identify bands of cFLIP using the opposite strategy –
by selectively blocking specific binding to cFLIP protein so that only bands produced by non-
specific antibody binding would be visible. As the FLIP peptide to which the ab8421 antibody
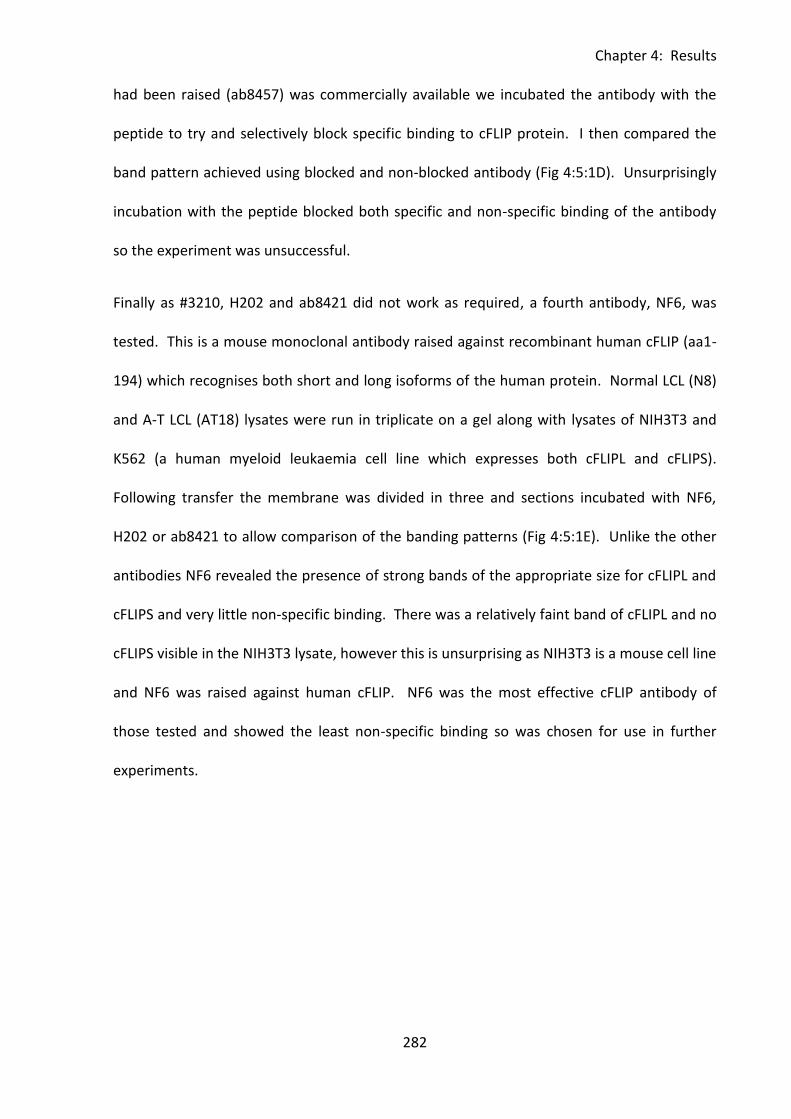
Chapter 4: Results
282
had been raised (ab8457) was commercially available we incubated the antibody with the
peptide to try and selectively block specific binding to cFLIP protein. I then compared the
band pattern achieved using blocked and non-blocked antibody (Fig 4:5:1D). Unsurprisingly
incubation with the peptide blocked both specific and non-specific binding of the antibody
so the experiment was unsuccessful.
Finally as #3210, H202 and ab8421 did not work as required, a fourth antibody, NF6, was
tested. This is a mouse monoclonal antibody raised against recombinant human cFLIP (aa1-
194) which recognises both short and long isoforms of the human protein. Normal LCL (N8)
and A-T LCL (AT18) lysates were run in triplicate on a gel along with lysates of NIH3T3 and
K562 (a human myeloid leukaemia cell line which expresses both cFLIPL and cFLIPS).
Following transfer the membrane was divided in three and sections incubated with NF6,
H202 or ab8421 to allow comparison of the banding patterns (Fig 4:5:1E). Unlike the other
antibodies NF6 revealed the presence of strong bands of the appropriate size for cFLIPL and
cFLIPS and very little non-specific binding. There was a relatively faint band of cFLIPL and no
cFLIPS visible in the NIH3T3 lysate, however this is unsurprising as NIH3T3 is a mouse cell line
and NF6 was raised against human cFLIP. NF6 was the most effective cFLIP antibody of
those tested and showed the least non-specific binding so was chosen for use in further
experiments.
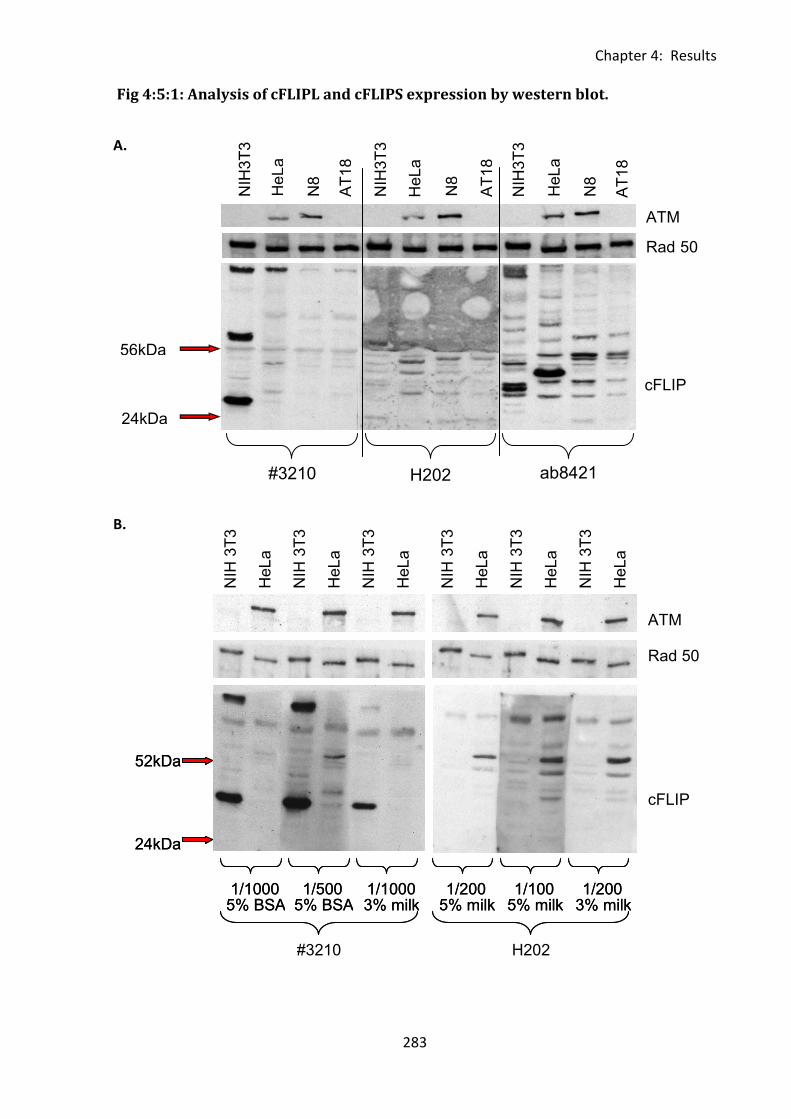
Chapter 4: Results
283
52kDa
24kDa
1/1000 5% BSA
1/500 5% BSA
1/1000 3% milk
1/200 5% milk
1/100 5% milk
1/200 3% milk
#3210 H202
52kDa
24kDa
1/1000 5% BSA
1/500 5% BSA
1/1000 3% milk
1/200 5% milk
1/100 5% milk
1/200 3% milk
NIH
3T
3
HeL
a
NIH
3T
3
HeL
a
NIH
3T
3
HeL
a
NIH
3T
3
HeL
a
NIH
3T
3
HeL
a
NIH
3T
3
HeL
a
ATM
Rad 50
cFLIP
ATM
Rad 50
cFLIP
ab8421 H202
#3210
N8
N8
N8
AT
18
AT
18
AT
18
NIH
3T
3
NIH
3T
3
NIH
3T
3
HeL
a
HeL
a
HeL
a
Fig 4:5:1: Analysis of cFLIPL and cFLIPS expression by western blot.
A.
B.
56kDa
24kDa
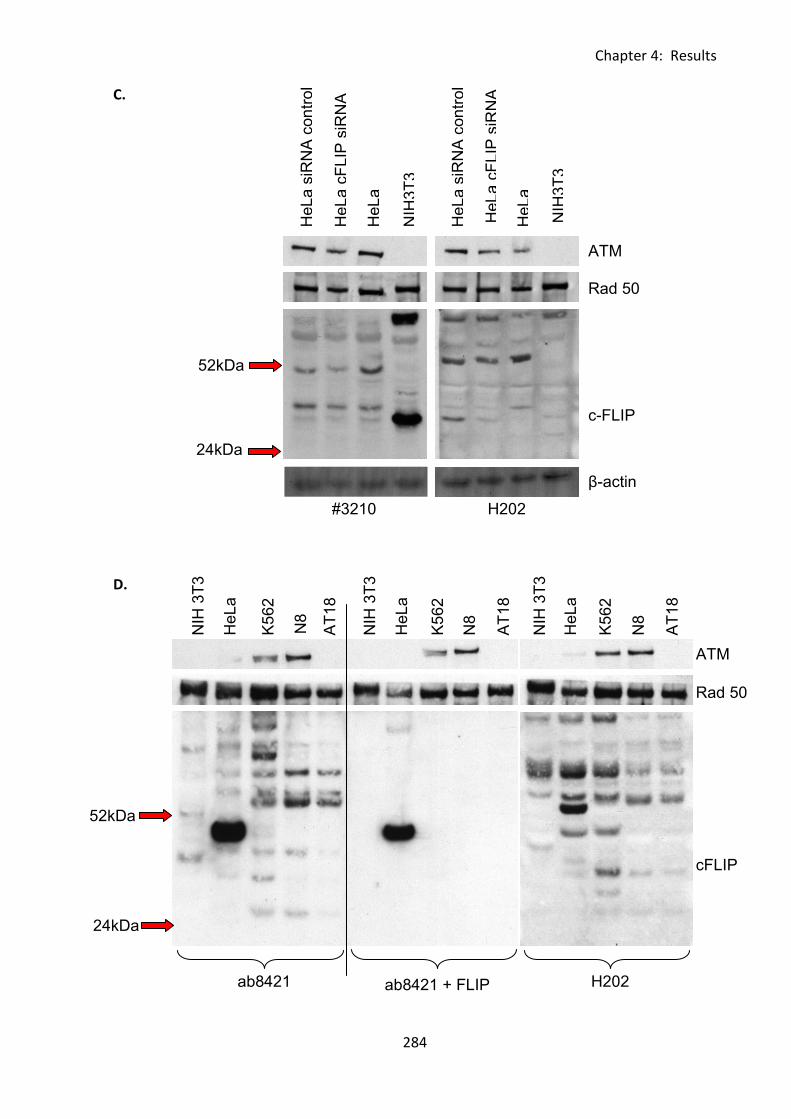
Chapter 4: Results
284
β - actin
Rad 50
c - FLIP
ATM
52kDa
24kDa
#3210 H202
HeL
a s
iRN
A c
on
trol
HeL
a s
iRN
A c
on
trol
HeL
a c
FLIP
siR
NA
HeL
a c
FLIP
siR
NA
HeL
a
HeL
a
NIH
3T
3
NIH
3T
3
ATM
Rad 50
cFLIP
H202 ab8421 ab8421 + FLIP
peptide (ab8457)
52kDa
24kDa
NIH
3T
3
NIH
3T
3
NIH
3T
3
HeL
a
HeL
a
HeL
a
N8
N8
N8
AT
18
AT
18
AT
18
K5
62
K5
62
K5
62
C.
D.
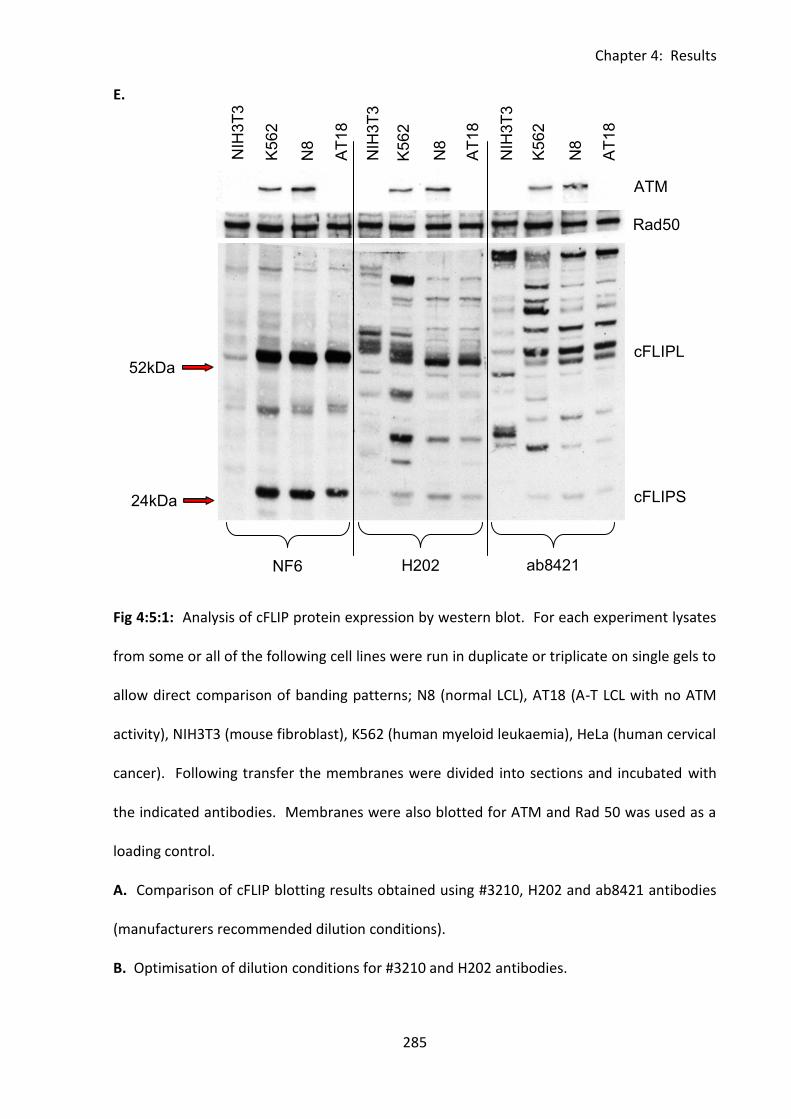
Chapter 4: Results
285
NF6 H202 ab8421
52kDa
24kDa
cFLIPL
cFLIPS
Rad50
ATM
NIH
3T
3
K5
62
K5
62
K5
62
N8
N8
N8
AT
18
AT
18
NIH
3T
3
AT
18
NIH
3T
3 E.
Fig 4:5:1: Analysis of cFLIP protein expression by western blot. For each experiment lysates
from some or all of the following cell lines were run in duplicate or triplicate on single gels to
allow direct comparison of banding patterns; N8 (normal LCL), AT18 (A-T LCL with no ATM
activity), NIH3T3 (mouse fibroblast), K562 (human myeloid leukaemia), HeLa (human cervical
cancer). Following transfer the membranes were divided into sections and incubated with
the indicated antibodies. Membranes were also blotted for ATM and Rad 50 was used as a
loading control.
A. Comparison of cFLIP blotting results obtained using #3210, H202 and ab8421 antibodies
(manufacturers recommended dilution conditions).
B. Optimisation of dilution conditions for #3210 and H202 antibodies.
Chapter 4: Results
286
C. Comparison of cFLIP banding patterns obtained using #3210 and H202 antibodies on
lysates from untransfected, cFLIP siRNA transfected and control siRNA transfected HeLa cells
and NIH3T3 cells.
D. Blocking of ab8421 with cFLIP peptide (ab8457). To block ab8421 binding the undiluted
antibody was incubated with an equal volume of peptide for 30min at 37°C prior to dilution
in 5% TBST milk and membrane incubation.
E. Comparison of cFLIP blotting results achieved using N6, H202, and ab8421 cFLIP
antibodies.
Chapter 4: Results
287
4:5:2: cFLIP protein expression in normal and A-T LCLs
cFLIP expression in normal and A-T LCLs was analysed by western blot and protein levels
determined by densitometry. To confirm the ATM expression and ATM activity status of
each LCL irradiated and non-irradiated lysates were made. These were run on 8% Tris-Bicine
gels and activity assayed by blotting for total and phosphorylated forms of ATM, SMC1 and
Nbs1. As cFLIP functions by competing with caspase 8 the expression of caspase 8 in each
LCL was also analysed. Total SMC1 was used as a loading control for densitometry. The ATM
activity analysis confirmed the known ATM status of each LCL (Fig 4:5:2A).
As A-T LCLs with no ATM activity were more sensitive to CH11-induced apoptosis than
normal LCLs, I hypothesised that they would either express lower levels of cFLIP or would
have a higher caspase 8:cFLIP ratio than the normal LCLs. LCLs with a higher caspase 8:cFLIP
ratio will have proportionally less cFLIP available to compete with caspase 8 for binding to
the DISC complex. Therefore the efficiency of inhibition of apoptosis by cFLIP may be less
than in a LCL with a low caspase 8:cFLIP ratio, leading to increased sensitivity to CH11-
induced apoptosis.
Although there was some variation in cFLIP expression between different LCLs there was no
significant difference in expression of either cFLIPL, cFLIPS or total cFLIP between normal
and A-T LCLs (Fig 4:5:2A&B). There was also no significant difference in caspase 8 expression
or the caspase 8:cFLIP ratio of normal and A-T LCLs (Fig 4:5:2C). However, in normal LCLs
there was a significant negative correlation between total cFLIP expression and caspase 8
expression (r=-0.7866, p=0.0172) (Fig 4:5:2D). This is counterintuitive as I expected that an
LCL with high caspase 8 expression would also have high cFLIP expression in order to
regulate its apoptosis. A-T LCLs with no ATM activity showed no correlation between total
Chapter 4: Results
288
cFLIP and caspase 8 expression which may indicate a lack of regulation of cFLIP or caspase 8
expression in A-T LCLs.
An Annexin V/PI apoptosis assay was carried out on the LCLs to test their sensitivity to CH11-
induced apoptosis (Fig 4:5:2E). The group of normal LCLs showed a significant correlation
between increasing cFLIPL expression and decreasing loss of viability in response to CH11
treatment (r=0.7950, p=0.0138), however the A-T LCLs with no ATM activity did not show a
similar correlation (Fig 4:5:2F). There was also no correlation between caspase8:cFLIP ratio
and change in viability in either group (Fig 4:5:2F), this suggests that the caspase 8:cFLIP
ratio of LCLs is not important in regulation of their apoptotic sensitivity.
.
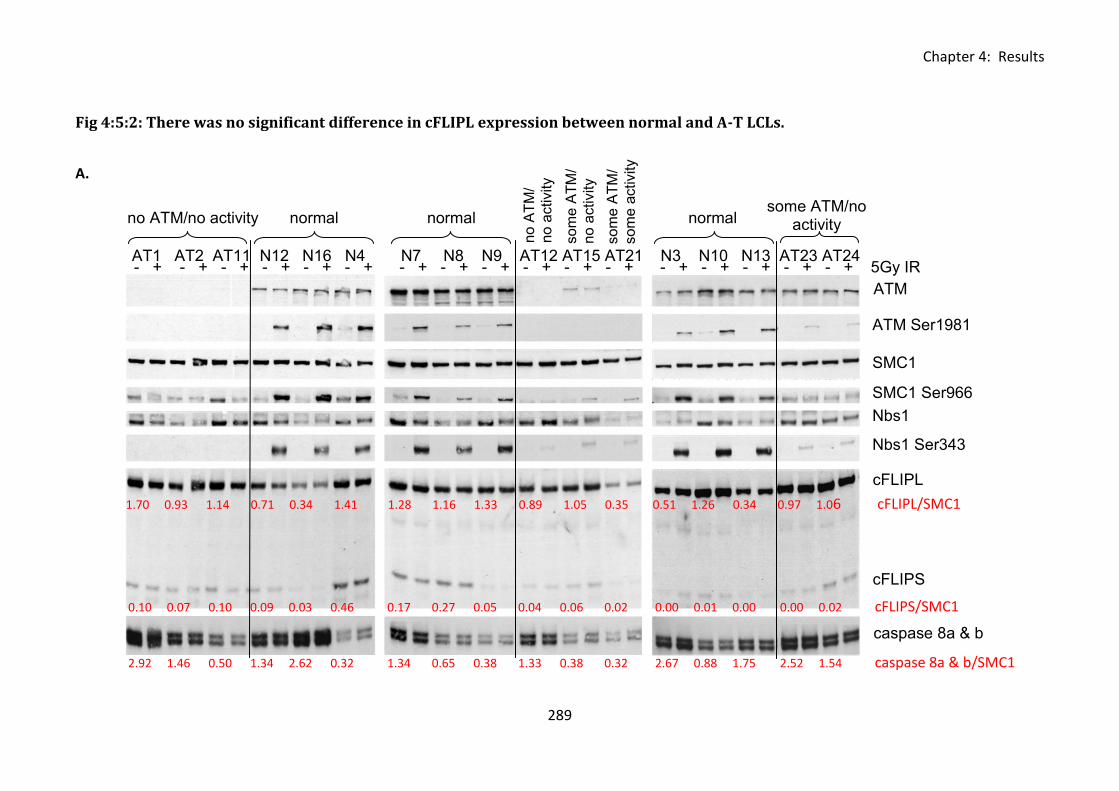
Chapter 4: Results
289
Fig 4:5:2: There was no significant difference in cFLIPL expression between normal and A-T LCLs.
A.
- + - + - + - + - + - + - + - + - + - + - + - + - + - + - + - + - + 5Gy IR
ATM
SMC1
ATM Ser1981
SMC1 Ser966
Nbs1
Nbs1 Ser343
cFLIPL
cFLIPS
caspase 8a & b
AT1 AT2 AT11 N12 N16 N4 N7 N8 N9 AT12 AT15 AT21 N3 N10 N13 AT23 AT24
no ATM/no activity normal normal normal
no A
TM
/
no a
ctivity
so
me
AT
M/
no a
ctivity
so
me
AT
M/
so
me
activity
some ATM/no activity
1.70 0.93 1.14 0.71 0.34 1.41 1.28 1.16 1.33 0.89 1.05 0.35 0.51 1.26 0.34 0.97 1.06 cFLIPL/SMC1
0.10 0.07 0.10 0.09 0.03 0.46 0.17 0.27 0.05 0.04 0.06 0.02 0.00 0.01 0.00 0.00 0.02 cFLIPS/SMC1
2.92 1.46 0.50 1.34 2.62 0.32 1.34 0.65 0.38 1.33 0.38 0.32 2.67 0.88 1.75 2.52 1.54 caspase 8a & b/SMC1
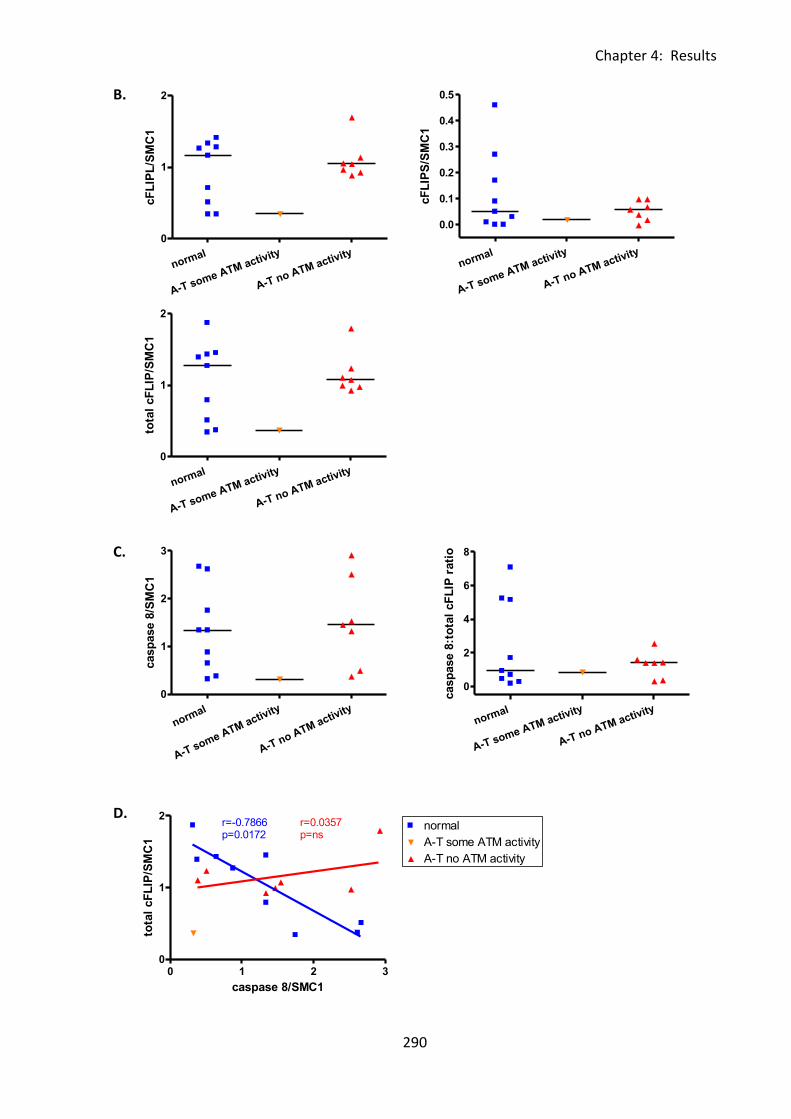
Chapter 4: Results
290
0 1 2 30
1
2normal
A-T some ATM activity
A-T no ATM activity
r=-0.7866p=0.0172
r=0.0357p=ns
caspase 8/SMC1
tota
l cF
LIP
/SM
C1
normal
A-T some ATM activity
A-T no ATM activity
0
1
2
3
casp
ase 8
/SM
C1
normal
A-T some ATM activity
A-T no ATM activity
0
1
2
tota
l cF
LIP
/SM
C1
normal
A-T some ATM activity
A-T no ATM activity
0
1
2
cF
LIP
L/S
MC
1
normal
A-T some ATM activity
A-T no ATM activity
0.0
0.1
0.2
0.3
0.4
0.5
cF
LIP
S/S
MC
1
normal
A-T some ATM activity
A-T no ATM activity
0
2
4
6
8
casp
ase 8
:to
tal
cF
LIP
rati
o
B.
C.
D.
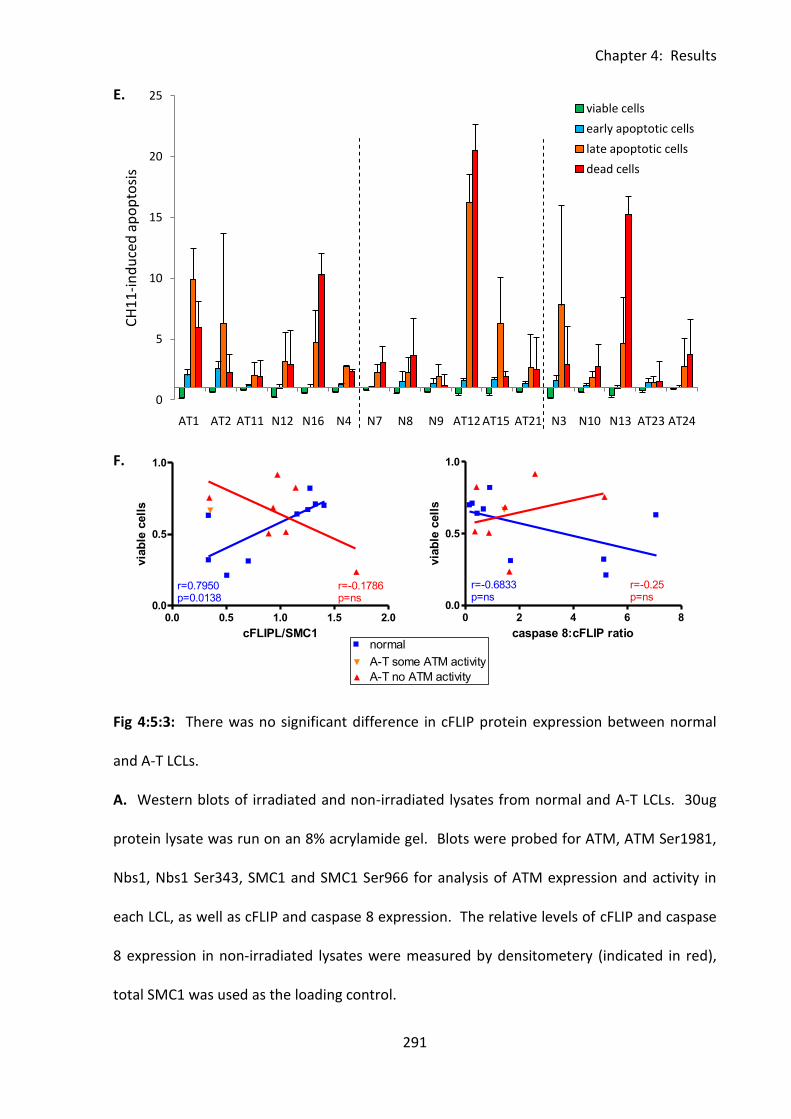
Chapter 4: Results
291
0
5
10
15
20
25
AT1 AT2 AT11 N12 N16 N4 N7 N8 N9 AT12 AT15 AT21 N3 N10 N13 AT23 AT24
CH
11
-in
du
ced
ap
op
tosi
s
viable cells
early apoptotic cells
late apoptotic cells
dead cells
0.0 0.5 1.0 1.5 2.00.0
0.5
1.0normal
A-T some ATM activity
A-T no ATM activity
r=0.7950p=0.0138
r=-0.1786p=ns
cFLIPL/SMC1
via
ble
cell
s
0 2 4 6 80.0
0.5
1.0normal
A-T some ATM activity
A-T no ATM activity
r=-0.6833p=ns
r=-0.25p=ns
caspase 8:cFLIP ratio
via
ble
cell
s
E.
F.
Fig 4:5:3: There was no significant difference in cFLIP protein expression between normal
and A-T LCLs.
A. Western blots of irradiated and non-irradiated lysates from normal and A-T LCLs. 30ug
protein lysate was run on an 8% acrylamide gel. Blots were probed for ATM, ATM Ser1981,
Nbs1, Nbs1 Ser343, SMC1 and SMC1 Ser966 for analysis of ATM expression and activity in
each LCL, as well as cFLIP and caspase 8 expression. The relative levels of cFLIP and caspase
8 expression in non-irradiated lysates were measured by densitometery (indicated in red),
total SMC1 was used as the loading control.
0 5 10 150.0
0.5
1.0
normal
A-T no ATM activity
A-T some ATM activity
caspase 8/cFLIP
via
ble
cell
s
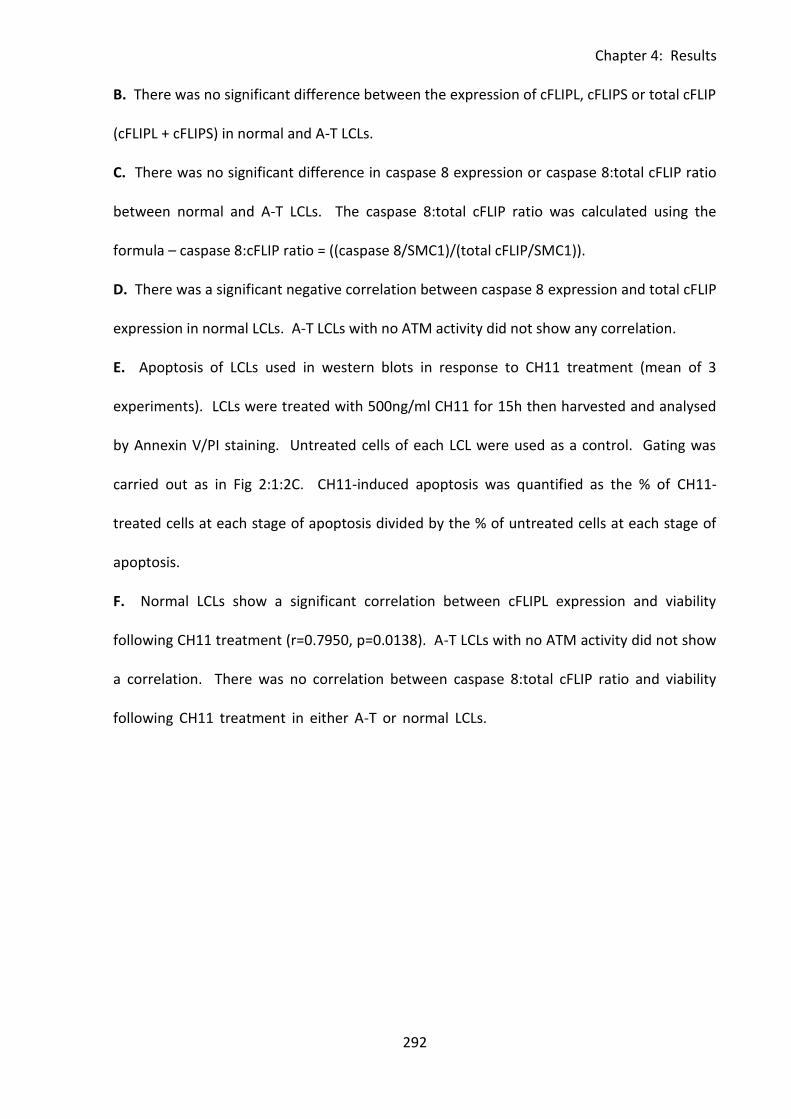
Chapter 4: Results
292
B. There was no significant difference between the expression of cFLIPL, cFLIPS or total cFLIP
(cFLIPL + cFLIPS) in normal and A-T LCLs.
C. There was no significant difference in caspase 8 expression or caspase 8:total cFLIP ratio
between normal and A-T LCLs. The caspase 8:total cFLIP ratio was calculated using the
formula – caspase 8:cFLIP ratio = ((caspase 8/SMC1)/(total cFLIP/SMC1)).
D. There was a significant negative correlation between caspase 8 expression and total cFLIP
expression in normal LCLs. A-T LCLs with no ATM activity did not show any correlation.
E. Apoptosis of LCLs used in western blots in response to CH11 treatment (mean of 3
experiments). LCLs were treated with 500ng/ml CH11 for 15h then harvested and analysed
by Annexin V/PI staining. Untreated cells of each LCL were used as a control. Gating was
carried out as in Fig 2:1:2C. CH11-induced apoptosis was quantified as the % of CH11-
treated cells at each stage of apoptosis divided by the % of untreated cells at each stage of
apoptosis.
F. Normal LCLs show a significant correlation between cFLIPL expression and viability
following CH11 treatment (r=0.7950, p=0.0138). A-T LCLs with no ATM activity did not show
a correlation. There was no correlation between caspase 8:total cFLIP ratio and viability
following CH11 treatment in either A-T or normal LCLs. .
Chapter 4: Results
293
4:5:3: Caspase 8 activation and cFLIP degradation in response to CH11 treatment.
Although there was no significant difference in cFLIP expression between normal and A-T
LCLs it is possible that they may react differently to CH11 treatment in terms of the rate and
efficiency of cFLIP degradation and caspase 8 activation.
A western blot was carried out to analyse the effect of CH11 treatment on cFLIP expression
and caspase 8 activation in normal and A-T LCLs. Lysates of one normal LCL (N8), one A-T
LCL with some ATM activity (AT21) and one A-T LCL with no ATM activity (AT18) were made
over a timecourse of CH11 treatment. All three LCLs showed degradation of cFLIP in
response to CH11 treatment (Fig 4:5:3). This is necessary to allow caspase 8 activation and
induction of apoptosis. There was no indication of abnormality in cFLIP degradation in the
A-T LCLs.
Interestingly, comparisons of caspase 8 activation measured by the accumulation of the
intermediate processing products p43 and p26 and the active form of caspase 8, p18, clearly
showed that caspase 8 activation following 8 or 24 hours of incubation with CH11 was
greatest in AT18, the LCL with no ATM activity. The lowest level of caspase 8 activation was
in the normal LCL, whilst AT21, the A-T LCL with some ATM activity, showed an intermediate
level of caspase 8 processing. However, these findings cannot be taken as an indication of a
faster rate of apoptosis in the A-T LCLs as the lack of active caspase 8 in the normal LCL
following 8 or 24 hours of incubation with CH11 was consistent with the result of the CH11
timecourse experiment (Fig 4:4:4) in which no further decrease in the viability of normal
LCLs occurred after 8 hours of CH11 incubation. In contrast the viability of A-T LCLs
continued to decrease after 8 hours of incubation with CH11 which is consistent with the
Chapter 4: Results
294
finding of active caspase 8 and intermediate processing products in the A-T LCLs after 8 and
24 hours of CH11 incubation.
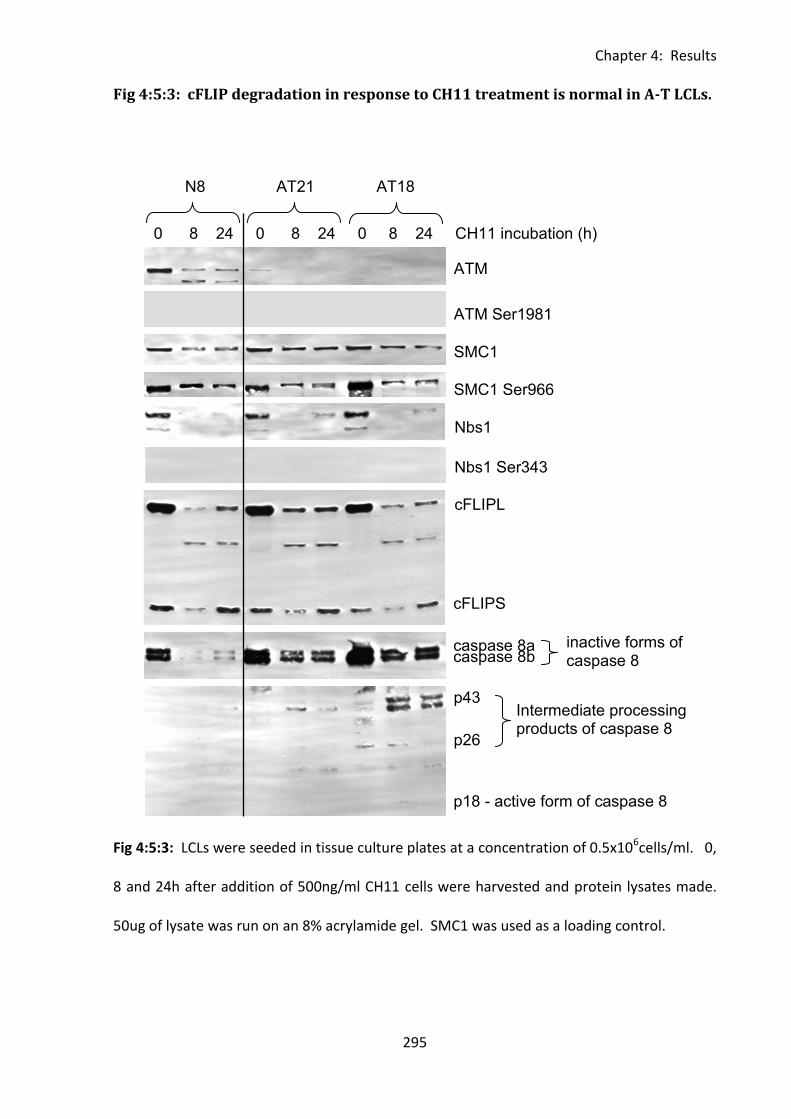
Chapter 4: Results
295
0 8 24 0 8 24 0 8 24 CH11 incubation (h)
N8 AT21 AT18
ATM
ATM Ser1981
SMC1
SMC1 Ser966
Nbs1
Nbs1 Ser343
cFLIPL
cFLIPS
caspase 8a caspase 8b
p18 - active form of caspase 8
p43
p26
Intermediate processing products of caspase 8
inactive forms of caspase 8
Fig 4:5:3: cFLIP degradation in response to CH11 treatment is normal in A-T LCLs.
Fig 4:5:3: LCLs were seeded in tissue culture plates at a concentration of 0.5x10⁶cells/ml. 0,
8 and 24h after addition of 500ng/ml CH11 cells were harvested and protein lysates made.
50ug of lysate was run on an 8% acrylamide gel. SMC1 was used as a loading control.
Chapter 4: Results
296
4:5:4: The effect of ATM activation on cFLIP protein expression.
There was no evidence of an ATM-dependent difference in constitutive cFLIP expression
between normal and A-T LCLs, however it has been suggested that cFLIP expression may be
regulated by ATM activation (Ivanov et al., 2009). Therefore the effect of DNA damage (IR)
induced activation of ATM on the cFLIP expression of two normal LCLs was analysed by
western blot. Two A-T LCLs with no ATM activity were used as negative controls.
There was very little change in cFLIPL or cFLIPS expression in any of the LCLs 8h after
irradiation, however after 24h the expression of cFLIPL and to a lesser extent cFLIPS
increased in both normal and A-T LCLs (Fig 4:5:4A&B). This suggests that although cFLIP
expression increases after IR this effect is not ATM-dependent as it can occur independently
of ATM activity.
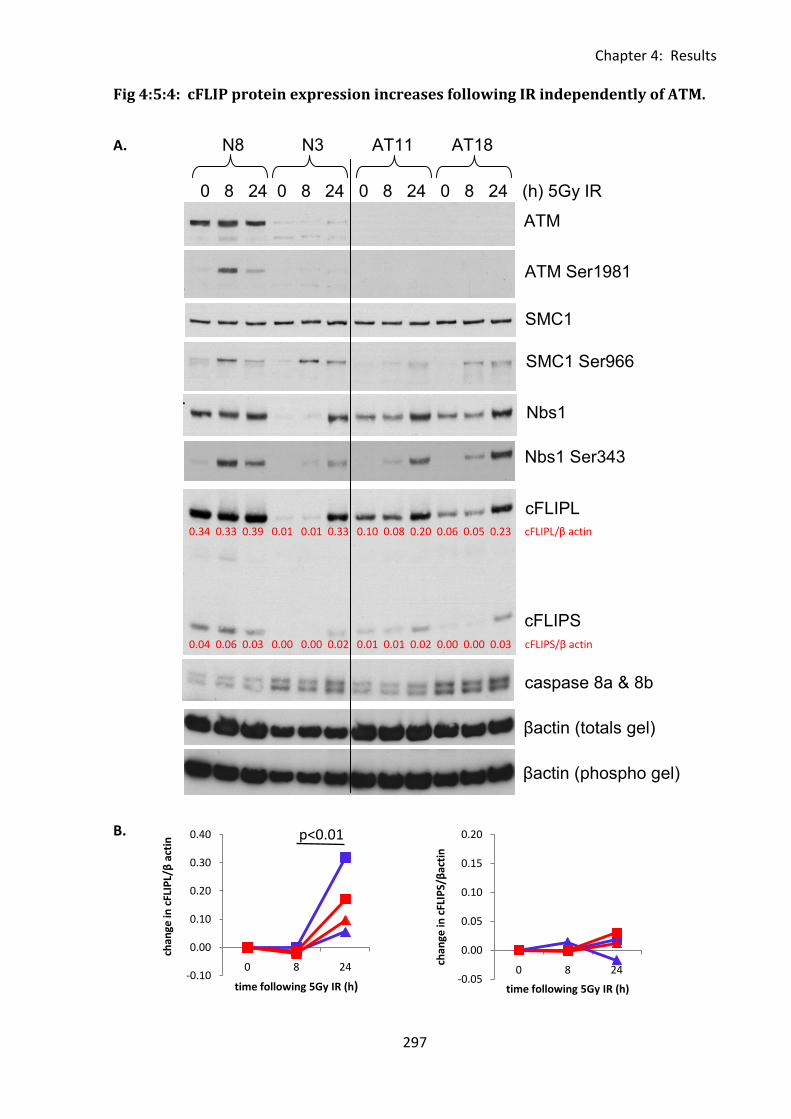
Chapter 4: Results
297
0 8 24 0 8 24 0 8 24 0 8 24 (h) 5Gy IR
N8 N3 AT11 AT18
Nbs1
ATM
ATM Ser1981
SMC1
SMC1 Ser966
Nbs1 Ser343
cFLIPL
cFLIPS
caspase 8a & 8b
βactin (totals gel)
βactin (phospho gel)
0.34 0.33 0.39 0.01 0.01 0.33 0.10 0.08 0.20 0.06 0.05 0.23 cFLIPL/β actin
0.04 0.06 0.03 0.00 0.00 0.02 0.01 0.01 0.02 0.00 0.00 0.03 cFLIPS/β actin
-0.10
0.00
0.10
0.20
0.30
0.40
0 8 24
chan
ge in
cFL
IPL/
β a
ctin
time following 5Gy IR (h)-0.05
0.00
0.05
0.10
0.15
0.20
0 8 24
chan
ge in
cFL
IPS/
βac
tin
time following 5Gy IR (h)
Fig 4:5:4: cFLIP protein expression increases following IR independently of ATM.
A.
B.
p<0.01
Chapter 4: Results
298
Fig 4:5:4: cFLIP protein expression increases following IR independently of ATM.
A. cFLIP protein expression in 2 normal (N8, N3) and 2 A-T LCLs with no ATM activity (AT11,
AT18) following 5Gy IR. LCLs were irradiated, transferred to tissue culture plates (2x10⁶
cells/well) and incubated at 37°C for the indicated time prior to harvest (0h = no IR). β actin
was used as a loading control for densitometery (shown in red).
B. Change in cFLIPL and cFLIPS expression following IR.
Chapter 4: Results
299
4:5:5: The effect of ATM inhibition on cFLIP expression.
The effect of inhibition of ATM protein kinase activity on constitutive expression of cFLIP was
also investigated. Normal LCLs (N3 and N12) and A-T LCLs with no ATM activity (AT18 and
AT22) were treated with the specific ATM inhibitor KU-55933 and their lysates analysed by
western blotting. Incubation with KU-55933 for 8 or 24h completely inhibited IR-induced
ATM activation in the normal LCLs (Fig 4:5:5B) and significantly increased expression of
cFLIPL and cFLIPS in both normal and A-T LCLs with the biggest increase occurring in the A-T
LCL AT18 (Fig 4:5:5A&C). Therefore the increase in cFLIP in the presence of KU-55933 could
not be attributed to the inhibition of ATM activity as it occurred even in the LCLs which did
not express ATM.
There was no difference in cFLIP expression between normal and A-T LCLs and inhibition of
ATM activity by KU-55933 did not have a differential effect on cFLIP expression in normal
compared to A-T LCLs. Therefore ATM mutations do not affect cFLIP expression in LCLs.
However, the inhibitory effect of cFLIP on CD95-mediated apoptosis may be more important
for normal LCLs than A-T LCLs as CD95 expression seemed to have little effect on the
sensitivity of normal LCLs to CH11-induced apoptosis. .
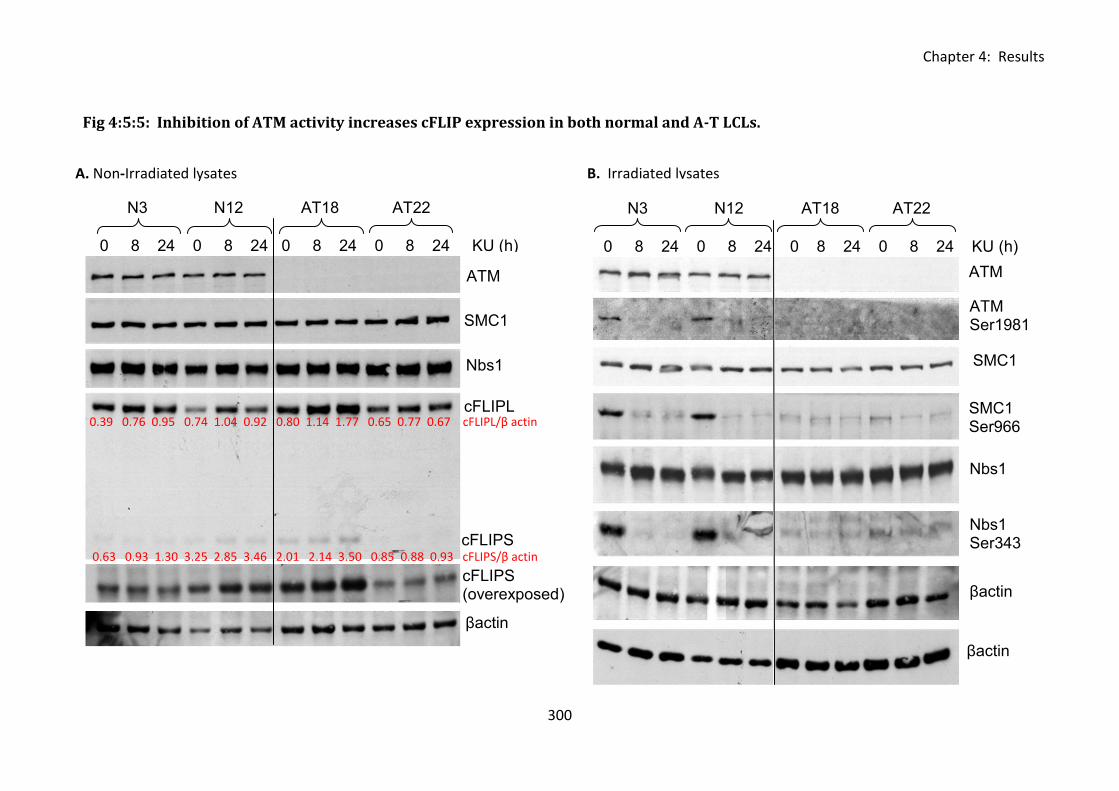
Chapter 4: Results
300
Fig 4:5:5: Inhibition of ATM activity increases cFLIP expression in both normal and A-T LCLs.
A. Non-Irradiated lysates B. Irradiated lysates
N3 N12 AT18 AT22
0 8 24 0 8 24 0 8 24 0 8 24 KU (h)
ATM
SMC1
Nbs1
cFLIPL
cFLIPS
cFLIPS (overexposed)
βactin
0.39 0.76 0.95 0.74 1.04 0.92 0.80 1.14 1.77 0.65 0.77 0.67 cFLIPL/β actin
0.63 0.93 1.30 3.25 2.85 3.46 2.01 2.14 3.50 0.85 0.88 0.93 cFLIPS/β actin
N3 N12 AT18 AT22
0 8 24 0 8 24 0 8 24 0 8 24 KU (h)
ATM
SMC1
ATM Ser1981
SMC1 Ser966
Nbs1 Ser343
Nbs1
βactin
(totals
) βactin
(phospho)
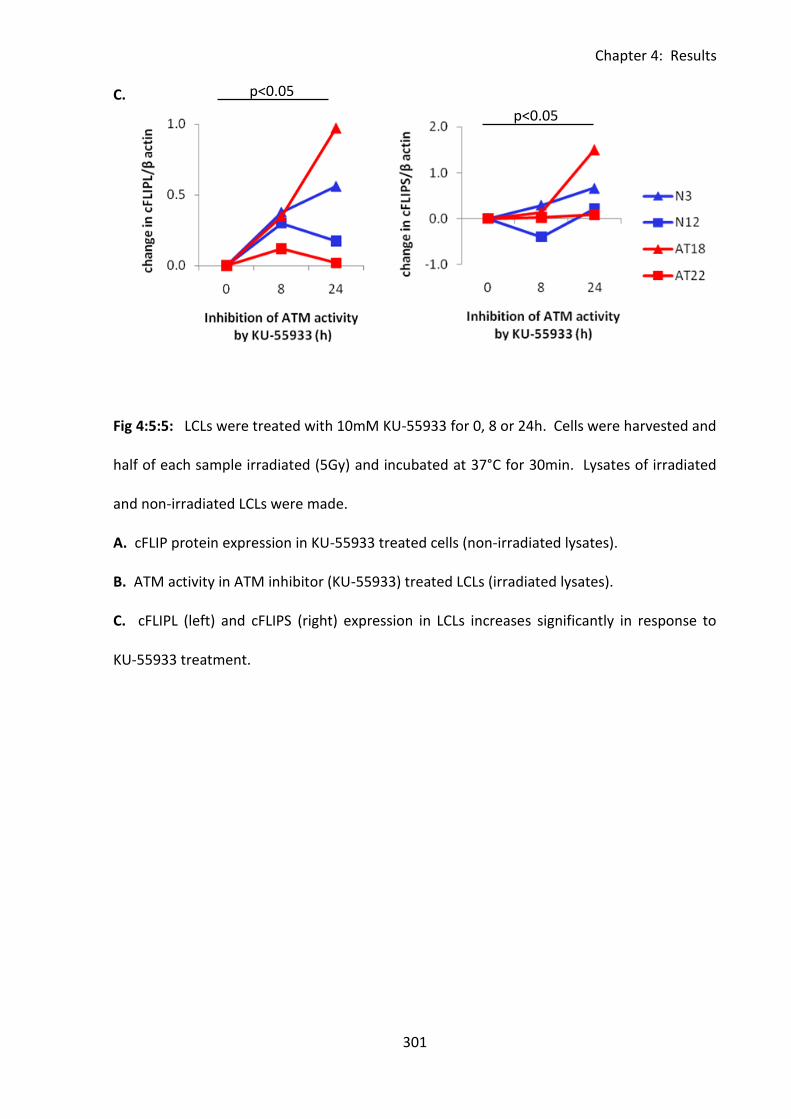
Chapter 4: Results
301
C.
Fig 4:5:5: LCLs were treated with 10mM KU-55933 for 0, 8 or 24h. Cells were harvested and
half of each sample irradiated (5Gy) and incubated at 37°C for 30min. Lysates of irradiated
and non-irradiated LCLs were made.
A. cFLIP protein expression in KU-55933 treated cells (non-irradiated lysates).
B. ATM activity in ATM inhibitor (KU-55933) treated LCLs (irradiated lysates).
C. cFLIPL (left) and cFLIPS (right) expression in LCLs increases significantly in response to
KU-55933 treatment.
p<0.05
p<0.05
Chapter 4: Results
302
4:6: Analysis of the role of EBV in regulation of apoptotic sensitivity.
4:6:1: LMP1 expression in A-T and normal LCLs.
Although A-T LCLs have lower CD95 expression than normal LCLs there was no evidence of a
role of ATM in regulating CD95 expression. LCLs are transformed by infection with EBV, a
virus which is able to regulate both pro- and anti-apoptotic genes. Interestingly CD95
upregulation on B cells in response to EBV infection involves the EBV latent membrane
protein-1 gene (LMP-1) which is also able to regulate cFLIP protein expression (Cahir-
McFarland et al., 2004). It is thought that LMP1 has an important role in maintaining a
balance between virally infected cells and the host immune system. Therefore the
difference in CD95 expression between normal and A-T LCLs may be due to a difference in
LMP1 protein expression by EBV in the presence or absence of ATM activity.
LMP1, cFLIP and CD95 expression in A-T and normal LCLs was analysed by western blot (Fig
4:6:1A) and flow cytometry (Fig 4:6:1E). Consistent with earlier findings (Fig 4:5:2) there was
no significant difference in cFLIP expression between the normal and A-T LCLs (Fig 4:6:1B).
LMP1 expression was slightly higher in normal than A-T LCLs (Fig 4:6:1A&C) but this was also
not statistically significant. However, there was a significant correlation between LMP1
expression and cFLIPS expression in both normal and A-T LCLs. cFLIPL showed a similar trend
but this was not significant (Fig 4:6:1D). These findings suggest that the presence of ATM
mutations does not influence the regulation of cFLIP expression by LMP1. There was no
correlation between LMP1 expression and CD95 expression on normal or A-T LCLs (Fig
4:6:1E)
Chapter 4: Results
303
As there was no difference in LMP1 protein expression between normal and A-T LCLs and no
correlation between LMP1 and CD95 expression it seems unlikely that the difference in CD95
expression between normal and A-T LCLs is due to a difference in regulation by EBV.
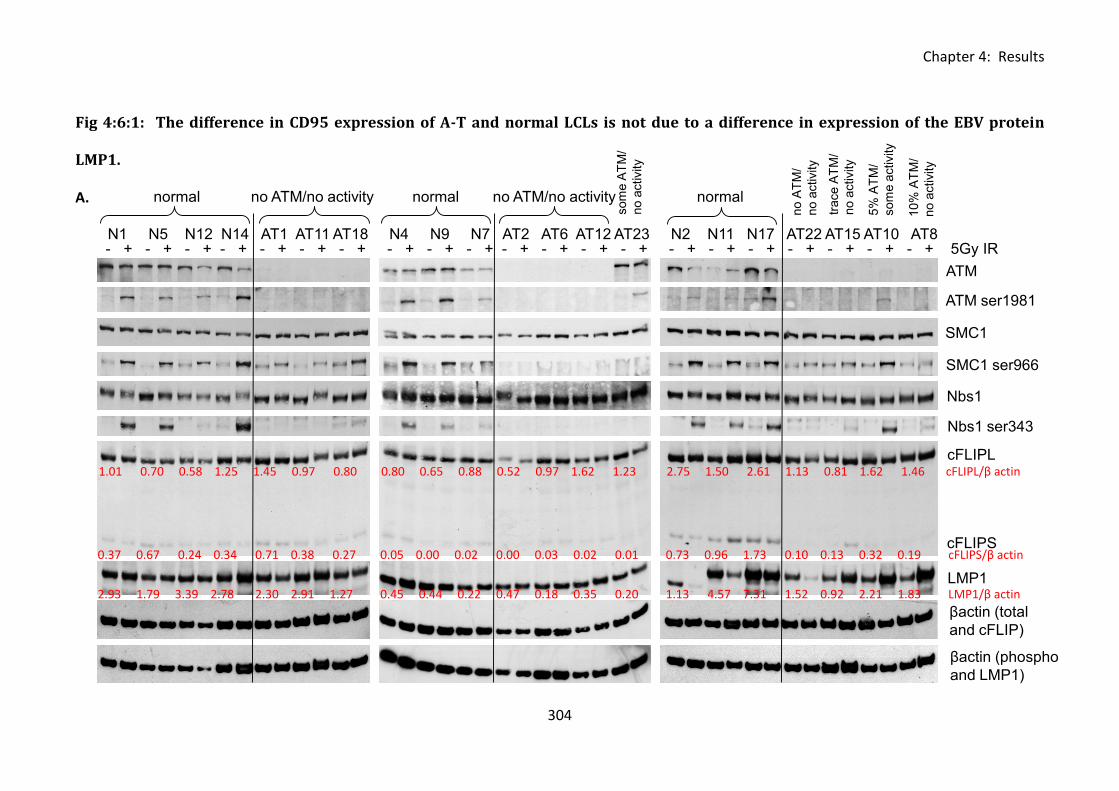
Chapter 4: Results
304
- + - + - + - + - + - + - + - + - + - + - + - + - + - + - + - + - + - + - + - + - + 5Gy IRN1 N5 N12 N14 AT1 AT11 AT18 N4 N9 N7 AT2 AT6 AT12 AT23 N2 N11 N17 AT22 AT15 AT10 AT8
ATM
ATM ser1981
SMC1
SMC1 ser966
Nbs1
Nbs1 ser343
cFLIPL
cFLIPS
LMP1
trace A
TM
/
no a
ctivity
5%
AT
M/
som
e a
ctivity
10%
AT
M/
no a
ctivity
βactin (total
and cFLIP)
βactin (phospho
and LMP1)
normal no ATM/no activity normal no ATM/no activity normal
som
e A
TM
/
no a
ctivity
no A
TM
/
no a
ctivity
Fig 4:6:1: The difference in CD95 expression of A-T and normal LCLs is not due to a difference in expression of the EBV protein
LMP1.
A.
1.01 0.70 0.58 1.25 1.45 0.97 0.80 0.80 0.65 0.88 0.52 0.97 1.62 1.23 2.75 1.50 2.61 1.13 0.81 1.62 1.46 cFLIPL/β actin
0.37 0.67 0.24 0.34 0.71 0.38 0.27 0.05 0.00 0.02 0.00 0.03 0.02 0.01 0.73 0.96 1.73 0.10 0.13 0.32 0.19 cFLIPS/β actin
2.93 1.79 3.39 2.78 2.30 2.91 1.27 0.45 0.44 0.22 0.47 0.18 0.35 0.20 1.13 4.57 7.31 1.52 0.92 2.21 1.83 LMP1/β actin
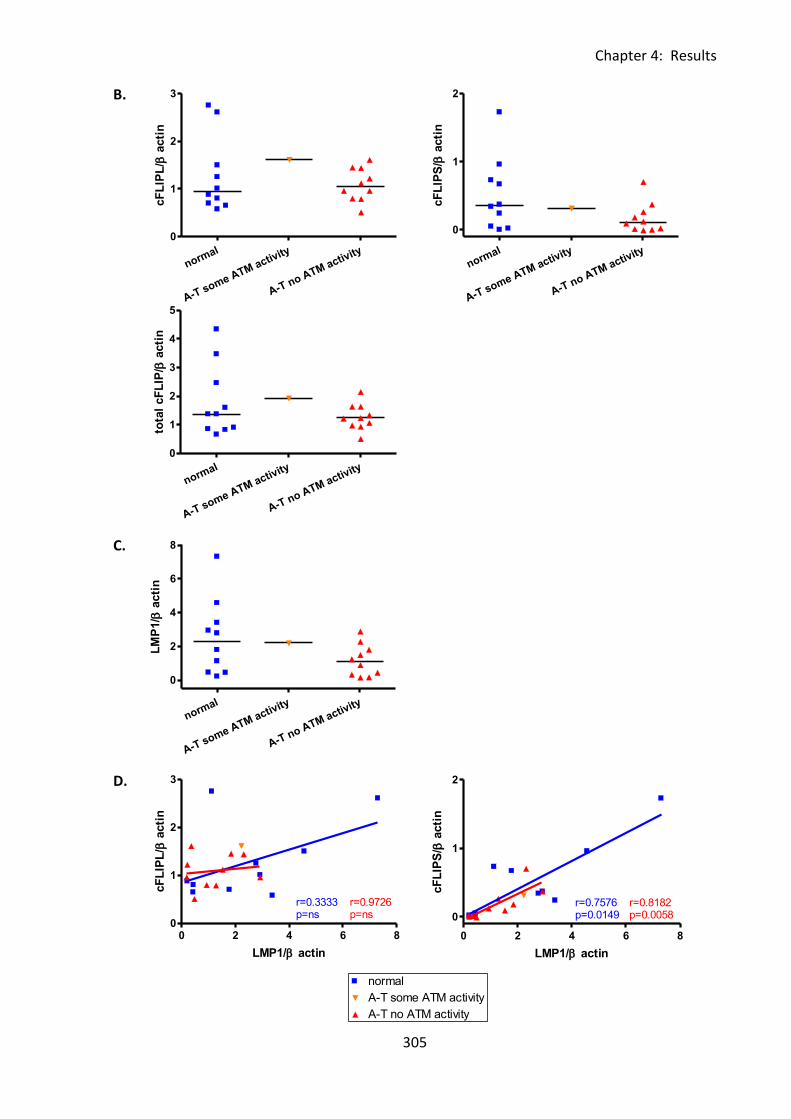
Chapter 4: Results
305
normal
A-T some ATM activity
A-T no ATM activity
0
1
2
3
cF
LIP
L/
acti
n
normal
A-T some ATM activity
A-T no ATM activity
0
1
2
3
4
5
tota
l cF
LIP
/ a
cti
n
0 2 4 6 80
1
2normal
A-T some ATM activity
A-T no ATM activity
r=0.7576p=0.0149
r=0.8182p=0.0058
LMP1/ actin
cF
LIP
S/
acti
n
normal
A-T some ATM activity
A-T no ATM activity
0
1
2
cF
LIP
S/
acti
n
normal
A-T some ATM activity
A-T no ATM activity
0
2
4
6
8
LM
P1/
acti
n
0 2 4 6 8
0
1
2normal
A-T some ATM activity
A-T no ATM activity
r=0.7576p=0.0149
r=0.8182p=0.0058
LMP1/ actin
cF
LIP
S/
acti
n
0 2 4 6 80
1
2
3normal
A-T some ATM activity
A-T no ATM activity
r=0.3333p=ns
r=0.9726p=ns
LMP1/ actin
cF
LIP
L/
acti
n
B.
C.
D.
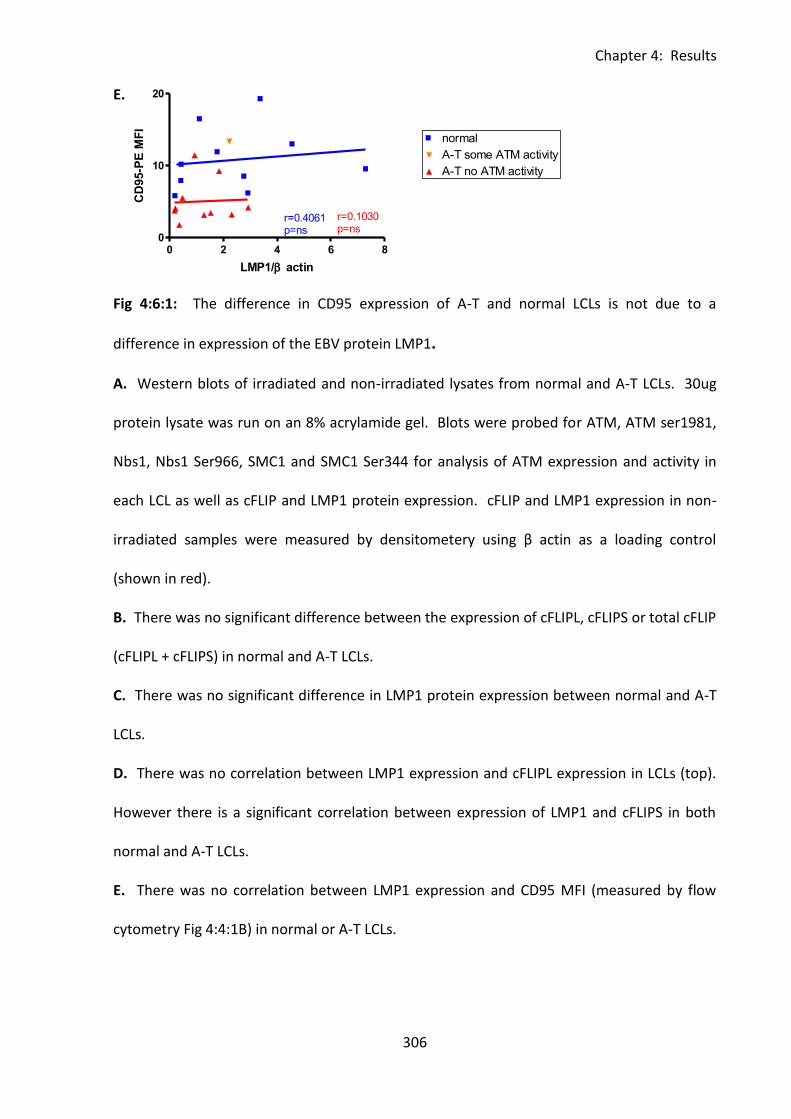
Chapter 4: Results
306
0 2 4 6 80
10
20normal
A-T some ATM activity
A-T no ATM activity
r=0.4061p=ns
r=0.1030p=ns
LMP1/ actin
CD
95-P
E M
FI
0 2 4 6 80
1
2normal
A-T some ATM activity
A-T no ATM activity
r=0.7576p=0.0149
r=0.8182p=0.0058
LMP1/ actin
cF
LIP
S/
acti
n
E.
Fig 4:6:1: The difference in CD95 expression of A-T and normal LCLs is not due to a
difference in expression of the EBV protein LMP1.
A. Western blots of irradiated and non-irradiated lysates from normal and A-T LCLs. 30ug
protein lysate was run on an 8% acrylamide gel. Blots were probed for ATM, ATM ser1981,
Nbs1, Nbs1 Ser966, SMC1 and SMC1 Ser344 for analysis of ATM expression and activity in
each LCL as well as cFLIP and LMP1 protein expression. cFLIP and LMP1 expression in non-
irradiated samples were measured by densitometery using β actin as a loading control
(shown in red).
B. There was no significant difference between the expression of cFLIPL, cFLIPS or total cFLIP
(cFLIPL + cFLIPS) in normal and A-T LCLs.
C. There was no significant difference in LMP1 protein expression between normal and A-T
LCLs.
D. There was no correlation between LMP1 expression and cFLIPL expression in LCLs (top).
However there is a significant correlation between expression of LMP1 and cFLIPS in both
normal and A-T LCLs.
E. There was no correlation between LMP1 expression and CD95 MFI (measured by flow
cytometry Fig 4:4:1B) in normal or A-T LCLs.
Chapter 4: Results
307
4:7: Investigating the effect of ATM mutation on sensitivity to CD95-
mediated apoptosis using isogenic LCLs.
4:7:1: Analysis of cFLIP and CD95 expression and sensitivity to CH11-induced
apoptosis of isogenic LCLs.
All experiments so far were carried out using LCLs derived from either healthy lab donors
(normal LCLs) or A-T patients (A-T LCLs). The genetic background of each LCL was different
and this may explain the great variation in CD95 expression, cFLIP expression and CH11
sensitivity even within the group of normal LCLs. Comparisons made using a panel of
isogenic LCLs may be more informative as the LCLs will differ only in their ATM gene.
A panel of 6 isogenic LCLs was made by transfecting wildtype and mutant ATM constructs
into an A-T LCL which expressed no ATM protein (ATM mutations: c.796_797insGATT,
c.2921+1G>A). The panel consisted of a ‘wildtype’ LCL (ATMwt) produced by transfection of
a wildtype ATM construct, an ‘ATM –ve’ LCL (MEP4) transfected with a control construct
(empty vector) and four ATM mutant LCLs transfected with ATM constructs containing
different mutations which had been found in A-T patients; 8189 A>C (8189), 8293 G>A
(8293), 8672 G>A (8672) and 9022 C>T (9022).
ATM expression and kinase activity in the transfected LCLs was validated by western blot (Fig
4:7:1A). The ATMwt LCL expressed active ATM protein which autophosphorylated on
Ser1981 (trace) and phosphorylated the downstream substrates SMC1 on Ser966 and Nbs1
on Ser343 in response to DNA damage induced by ionising radiation. In contrast no ATM
expression or activity was seen in the ATM-ve LCL MEP4. The ATM LCLs (8189, 8293, 8672
and 9022) expressed varying levels of mutant ATM protein but lacked any ATM kinase
activity. ATM protein expression was particularly low in the 8672 LCL, this is characteristic of
Chapter 4: Results
308
the mutation. The apparent loss of ATM expression in 8189 in response to IR appears to be
a loading effect.
The result of the cFLIP expression analysis was similar to that obtained using the panel of
non-isogenic LCLs in that there was some individual variation between the LCLs in terms of
expression of cFLIPL, cFLIPS and total cFLIP but no difference between the median
expression levels of the ATMwt LCL which had ATM activity and the ATM mutant LCLs which
had no ATM activity (Fig 4:7:1B). Restoring ATM activity to produce the ATMwt LCL did lead
to an increase in the expression of cFLIP compared to the ATM-ve MEP4 LCL which
expressed no ATM protein. However increased cFLIP expression compared to MEP4 was
also seen in the 8189, 8293, 8672 and to a lesser extent 9022 LCLs all of which had no ATM
activity. This suggests that the increase in cFLIP expression in ATMwt compared to MEP4
was not due to the restoration of ATM activity as the effect was also seen in the LCLs which
expressed mutant ATM protein but did not have ATM activity. There was no real difference
in caspase 8 expression or caspase 8:cFLIP ratio between the ATMwt and ATMmut LCLs (Fig
4.7.1C).
CD95 expression on the ATMmut LCLs was high (median MFI of 7.8) compared to the
untransfected A-T LCLs used in previous panels (median MFI of 4 in Fig 4:4:1B). In contrast
to previous findings there was no difference in CD95 expression between the ATMwt and
ATMmut LCLs (Fig 4:7:1D). This confirms that ATM kinase activity per se does not increase
constitutive CD95 expression on LCLs.
Transfection with the wildtype ATM construct greatly decreased the sensitivity of the LCL to
CH11 treatment compared to MEP4 (Fig 4:7:1E). The ATMwt LCL showed a smaller decrease
in viability in response to CH11 treatment than the ATMmut LCLs and a smaller increase in
Chapter 4: Results
309
late apoptotic and dead cells in response to CH11 treatment than MEP4, 8189 and 8293 (Fig
4:7:1F). Interestingly, the median increase in cells in early apoptosis in response to CH11
was greater in the ATMwt LCL than the ATMmut LCLs. This could indicate a slower rate of
apoptosis in the presence of active ATM protein kinase consistent with earlier findings.
These results support the previous findings in that there is no evidence of a direct role for
ATM in regulating expression of either cFLIP or CD95 but there is an indication that the
presence of functional ATM kinase may reduce the sensitivity to CH11-induced apoptosis of
LCLs.
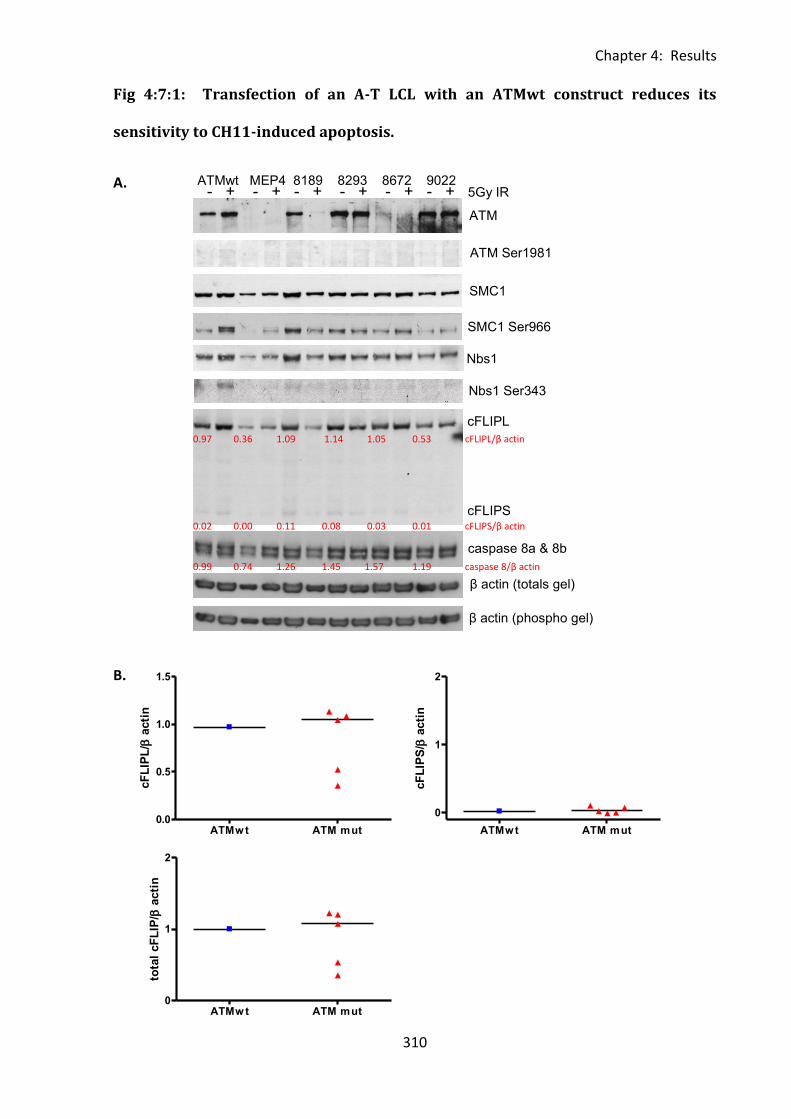
Chapter 4: Results
310
ATMwt ATM mut0.0
0.5
1.0
1.5
cF
LIP
L/
acti
n
ATMwt ATM mut
0
1
2
cF
LIP
S/
acti
n
Fig 4:7:1: Transfection of an A-T LCL with an ATMwt construct reduces its
sensitivity to CH11-induced apoptosis.
A.
B.
ATM
ATM Ser1981
SMC1
SMC1 Ser966
Nbs1
Nbs1 Ser343
cFLIPL
cFLIPS
caspase 8a & 8b
β actin (totals gel)
β actin (phospho gel)
ATMwt MEP4 8189 8293 8672 9022 - + - + - + - + - + - + 5Gy IR
0.97 0.36 1.09 1.14 1.05 0.53 cFLIPL/β actin
0.02 0.00 0.11 0.08 0.03 0.01 cFLIPS/β actin
0.99 0.74 1.26 1.45 1.57 1.19 caspase 8/β actin
ATMw t ATM mut0
1
2
tota
l cF
LIP
/ a
cti
n
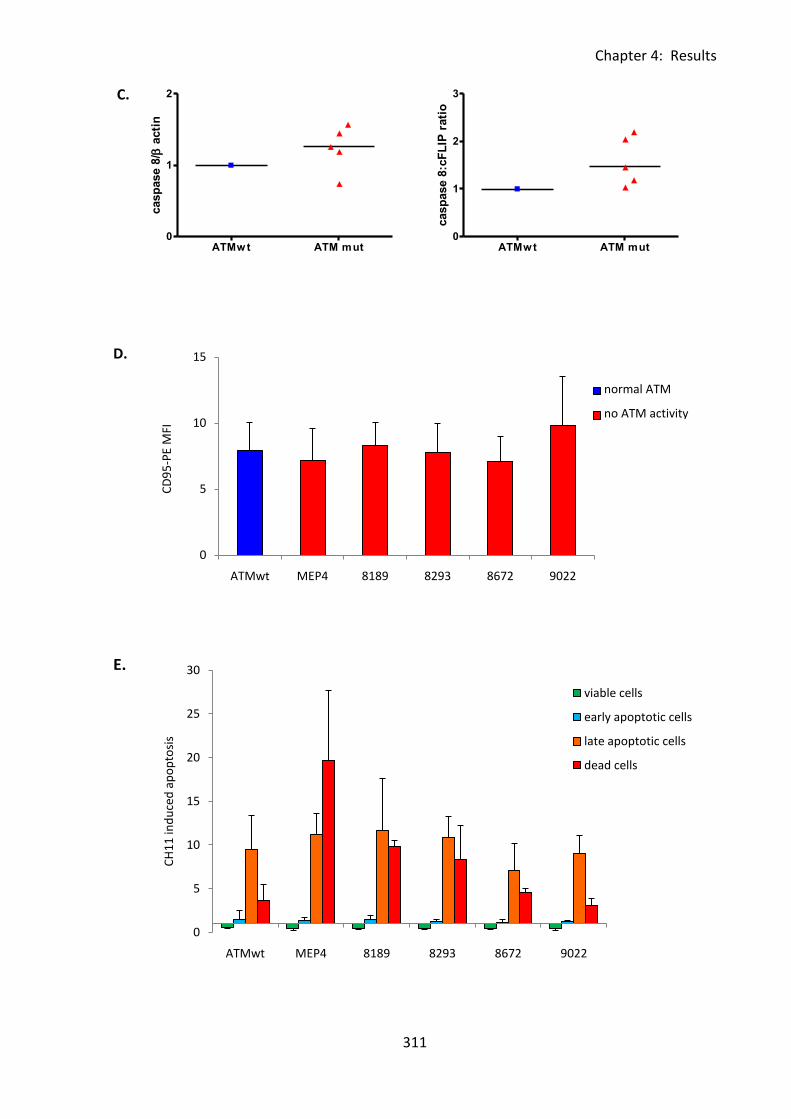
Chapter 4: Results
311
0
5
10
15
ATMwt MEP4 8189 8293 8672 9022
CD
95
-PE
MFI
ATMwt
MEP4
0
5
10
15
20
25
30
ATMwt MEP4 8189 8293 8672 9022
CH
11
ind
uce
d a
po
pto
sis
viable cells
early apoptotic cells
late apoptotic cells
dead cells
C.
D.
E.
normal ATM
no ATM activity
ATMw t ATM mut0
1
2
casp
ase 8
/ a
cti
n
ATMwt ATM mut0
1
2
3
casp
ase 8
:cF
LIP
rati
o
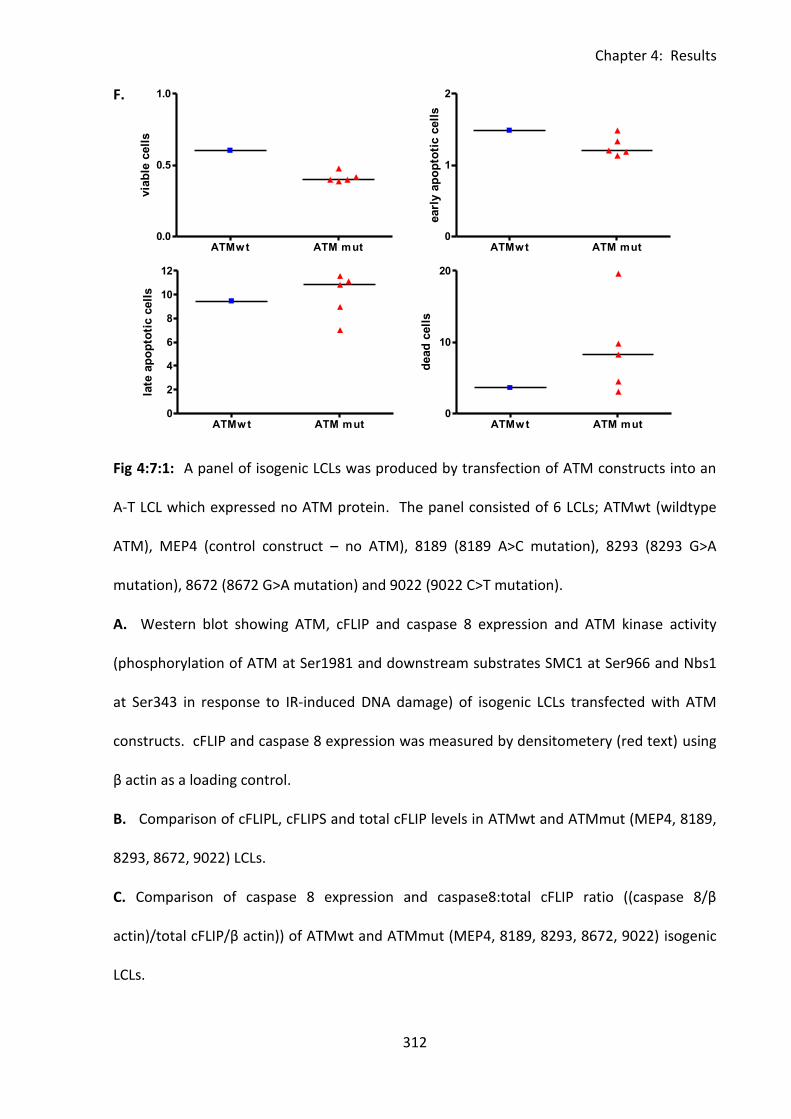
Chapter 4: Results
312
F.
Fig 4:7:1: A panel of isogenic LCLs was produced by transfection of ATM constructs into an
A-T LCL which expressed no ATM protein. The panel consisted of 6 LCLs; ATMwt (wildtype
ATM), MEP4 (control construct – no ATM), 8189 (8189 A>C mutation), 8293 (8293 G>A
mutation), 8672 (8672 G>A mutation) and 9022 (9022 C>T mutation).
A. Western blot showing ATM, cFLIP and caspase 8 expression and ATM kinase activity
(phosphorylation of ATM at Ser1981 and downstream substrates SMC1 at Ser966 and Nbs1
at Ser343 in response to IR-induced DNA damage) of isogenic LCLs transfected with ATM
constructs. cFLIP and caspase 8 expression was measured by densitometery (red text) using
β actin as a loading control.
B. Comparison of cFLIPL, cFLIPS and total cFLIP levels in ATMwt and ATMmut (MEP4, 8189,
8293, 8672, 9022) LCLs.
C. Comparison of caspase 8 expression and caspase8:total cFLIP ratio ((caspase 8/β
actin)/total cFLIP/β actin)) of ATMwt and ATMmut (MEP4, 8189, 8293, 8672, 9022) isogenic
LCLs.
ATMwt ATM mut0.0
0.5
1.0
via
ble
cell
s
ATMw t ATM mut0
2
4
6
8
10
12
late
ap
op
toti
c c
ell
s
ATMwt ATM mut0
1
2
earl
y a
po
pto
tic c
ell
sATMw t ATM mut
0
10
20
dead
cell
s
Chapter 4: Results
313
D. CD95 MFI of isogenic panel of LCLs. Cells were stained with CD95-PE and PI and gated as
in Fig 2:2:1. (Mean of 3 experiments).
E. CH11-induced apoptosis of isogenic panel of LCLs. Cells were treated with 500ng/ml
CH11 for 15h prior to staining with Annexin V-FITC and PI. CH11-induced apoptosis was
quantified as the % of CH11-treated cells at each stage of apoptosis divided by the % of
untreated cells at each stage of apoptosis (mean of 3 experiments).
F. Comparison of the sensitivity to CH11-induced apoptosis of ATMwt and ATMmut (MEP4,
8189, 8293, 8672, 9022) LCLs. CH11-induced apoptosis was quantified as the % of CH11-
treated cells at each stage of apoptosis divided by the % of untreated cells at each stage of
apoptosis (mean of 3 experiments).
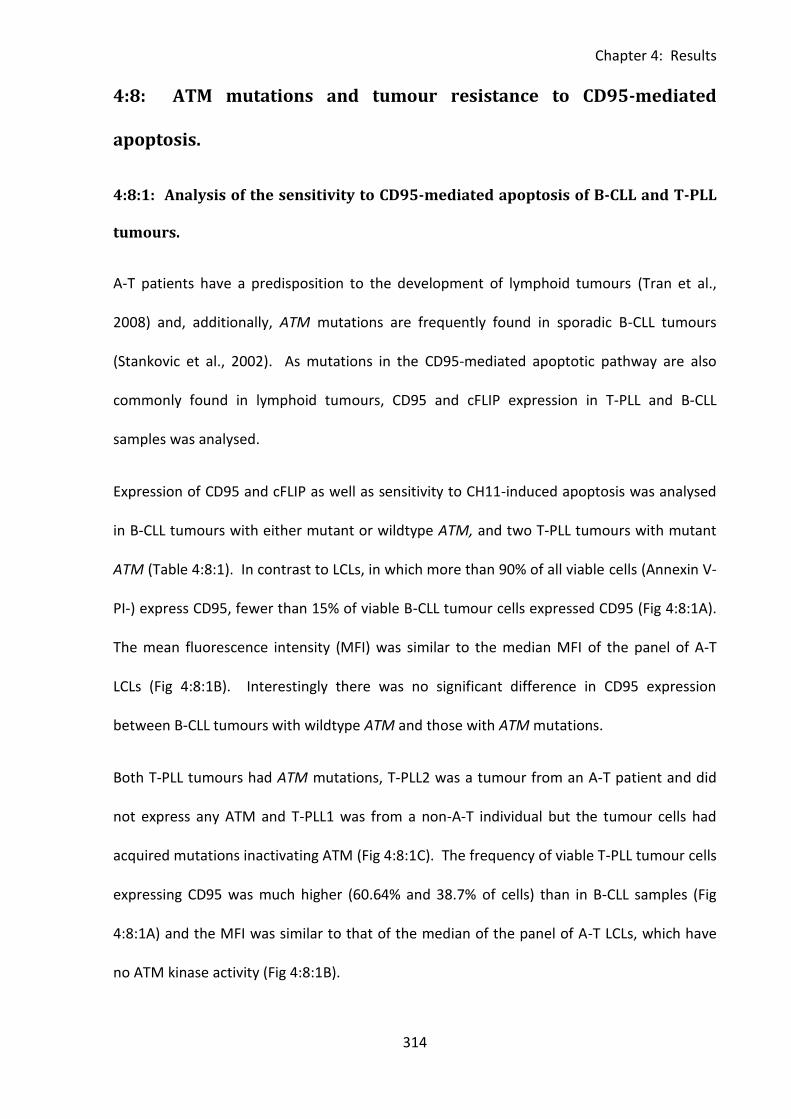
Chapter 4: Results
314
4:8: ATM mutations and tumour resistance to CD95-mediated
apoptosis.
4:8:1: Analysis of the sensitivity to CD95-mediated apoptosis of B-CLL and T-PLL
tumours.
A-T patients have a predisposition to the development of lymphoid tumours (Tran et al.,
2008) and, additionally, ATM mutations are frequently found in sporadic B-CLL tumours
(Stankovic et al., 2002). As mutations in the CD95-mediated apoptotic pathway are also
commonly found in lymphoid tumours, CD95 and cFLIP expression in T-PLL and B-CLL
samples was analysed.
Expression of CD95 and cFLIP as well as sensitivity to CH11-induced apoptosis was analysed
in B-CLL tumours with either mutant or wildtype ATM, and two T-PLL tumours with mutant
ATM (Table 4:8:1). In contrast to LCLs, in which more than 90% of all viable cells (Annexin V-
PI-) express CD95, fewer than 15% of viable B-CLL tumour cells expressed CD95 (Fig 4:8:1A).
The mean fluorescence intensity (MFI) was similar to the median MFI of the panel of A-T
LCLs (Fig 4:8:1B). Interestingly there was no significant difference in CD95 expression
between B-CLL tumours with wildtype ATM and those with ATM mutations.
Both T-PLL tumours had ATM mutations, T-PLL2 was a tumour from an A-T patient and did
not express any ATM and T-PLL1 was from a non-A-T individual but the tumour cells had
acquired mutations inactivating ATM (Fig 4:8:1C). The frequency of viable T-PLL tumour cells
expressing CD95 was much higher (60.64% and 38.7% of cells) than in B-CLL samples (Fig
4:8:1A) and the MFI was similar to that of the median of the panel of A-T LCLs, which have
no ATM kinase activity (Fig 4:8:1B).
Chapter 4: Results
315
cFLIPL and cFLIPS levels were comparable between B-CLL and LCLs (Fig 4:8:1D). However, B-
CLL cells also expressed several intermediate bands of cFLIP which may contribute to Fas
resistance (Fig 4:8:1C). 43kDa and 41kDa intermediate bands of cleaved cFLIPL which bind
stably to the DISC and inhibit apoptosis have previously been reported in B-CLL (MacFarlane
et al., 2001). T-PLL cells did not express cFLIPS or intermediate bands of the protein and
expression of cFLIPL was low compared to B-CLL and LCLs (Fig 4:8:1C & D).
As could be predicted from their low CD95 expression and the presence of cFLIP
intermediates, B-CLL tumours were highly resistant to CH11-induced apoptosis (Fig 4:8:1E).
T-PLL tumours were sensitive to CH11 although they were more resistant to treatment than
both the normal and A-T LCLs (Fig 4:8:1E) perhaps due to the lower percentage of cells
expressing CD95. CH11-induced apoptosis appeared to occur more slowly in the T-PLL
tumours than in the LCLs as after 15h of CH11 treatment the majority of T-PLL cells were in
the early stages of apoptosis (Annexin V+PI-) whereas the majority of LCL cells were in late
apoptosis (Annexin V+PI+) or already dead (Annexin V-PI+). Interestingly the tumour from
the A-T patient (T-PLL2) which expressed no ATM protein was more sensitive to CH11-
induced apoptosis than the non-A-T patient tumour (T-PLL1) which did express some ATM
but lacked ATM kinase activity.
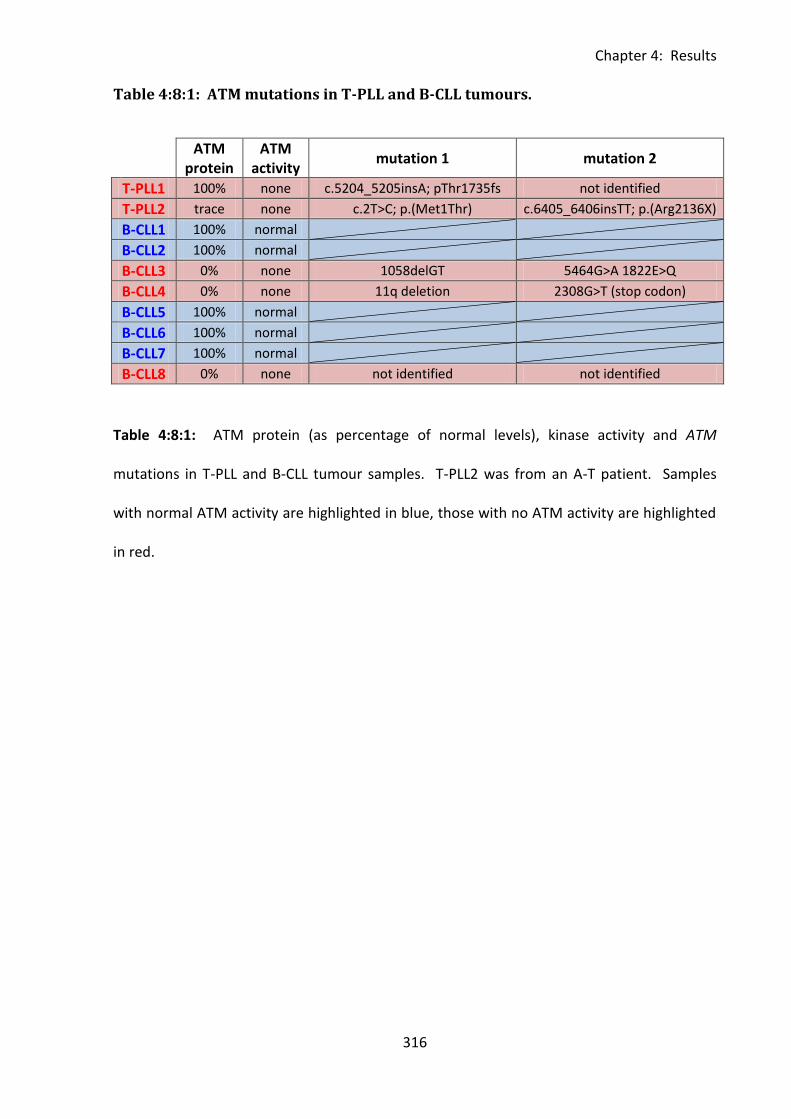
Chapter 4: Results
316
Table 4:8:1: ATM mutations in T-PLL and B-CLL tumours.
ATM
protein ATM
activity mutation 1 mutation 2
T-PLL1 100% none c.5204_5205insA; pThr1735fs not identified
T-PLL2 trace none c.2T>C; p.(Met1Thr) c.6405_6406insTT; p.(Arg2136X)
B-CLL1 100% normal
B-CLL2 100% normal
B-CLL3 0% none 1058delGT 5464G>A 1822E>Q
B-CLL4 0% none 11q deletion 2308G>T (stop codon)
B-CLL5 100% normal
B-CLL6 100% normal
B-CLL7 100% normal
B-CLL8 0% none not identified not identified
Table 4:8:1: ATM protein (as percentage of normal levels), kinase activity and ATM
mutations in T-PLL and B-CLL tumour samples. T-PLL2 was from an A-T patient. Samples
with normal ATM activity are highlighted in blue, those with no ATM activity are highlighted
in red.
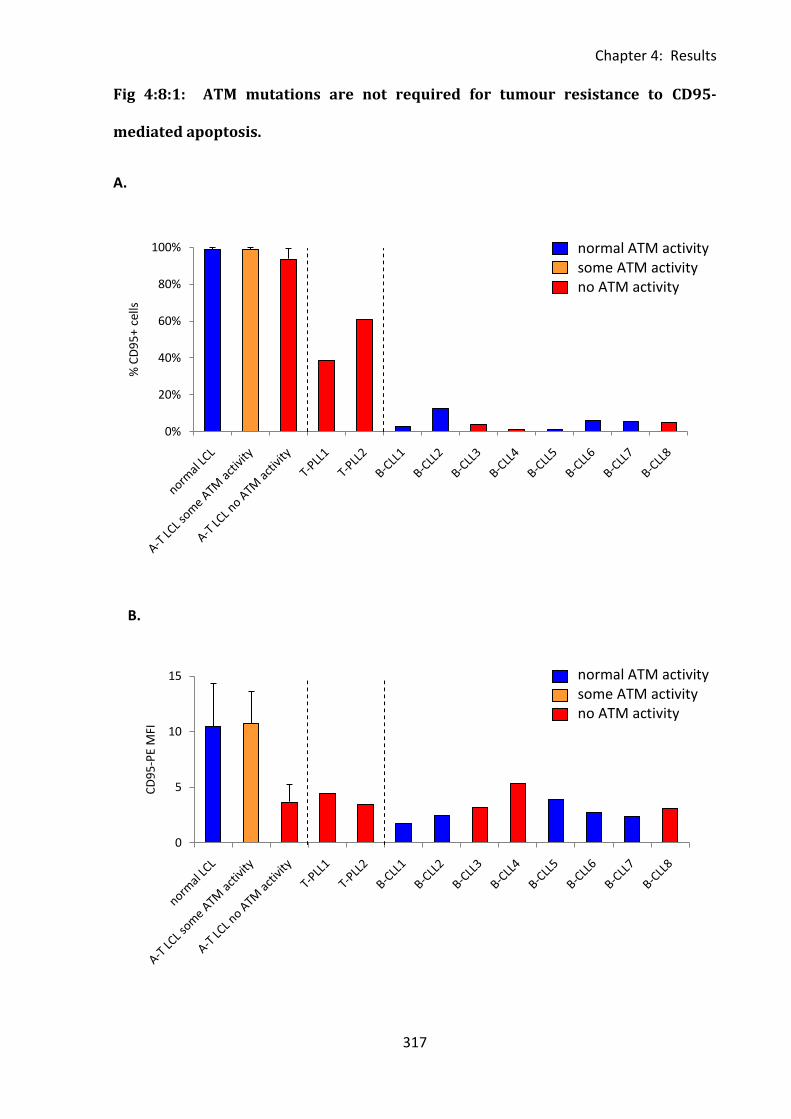
Chapter 4: Results
317
0
5
10
15
CD
95
-PE
MFI
Fig 4:8:1: ATM mutations are not required for tumour resistance to CD95-
mediated apoptosis.
A.
B.
0%
20%
40%
60%
80%
100%
% C
D9
5+
cells
normal ATM activity some ATM activity no ATM activity
normal ATM activity some ATM activity no ATM activity
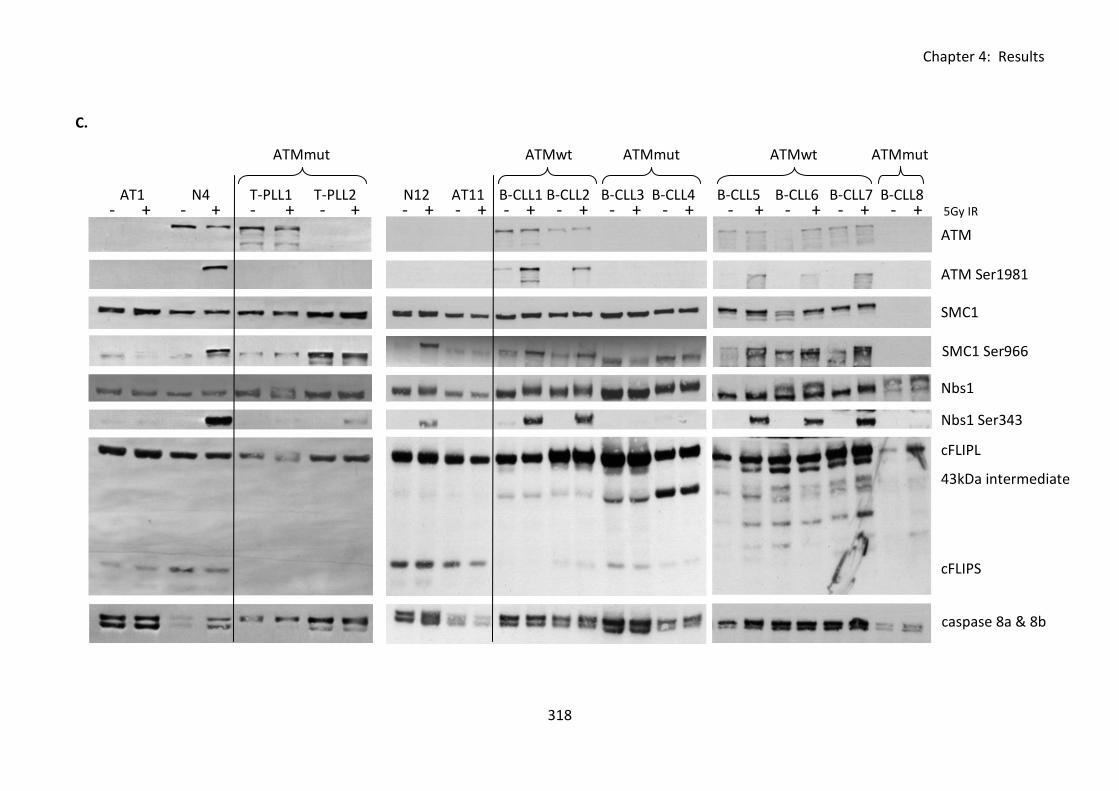
Chapter 4: Results
318
C.
- + - + - + - + - + - + - + - + - + - + - + - + - + - + 5Gy IR AT1 N4 T-PLL1 T-PLL2 N12 AT11 B-CLL1 B-CLL2 B-CLL3 B-CLL4 B-CLL5 B-CLL6 B-CLL7 B-CLL8
ATMmut ATMwt ATMmut ATMwt ATMmut
ATM
SMC1
ATM Ser1981
SMC1 Ser966
Nbs1
Nbs1 Ser343
cFLIPL
cFLIPS
caspase 8a & 8b
43kDa intermediate
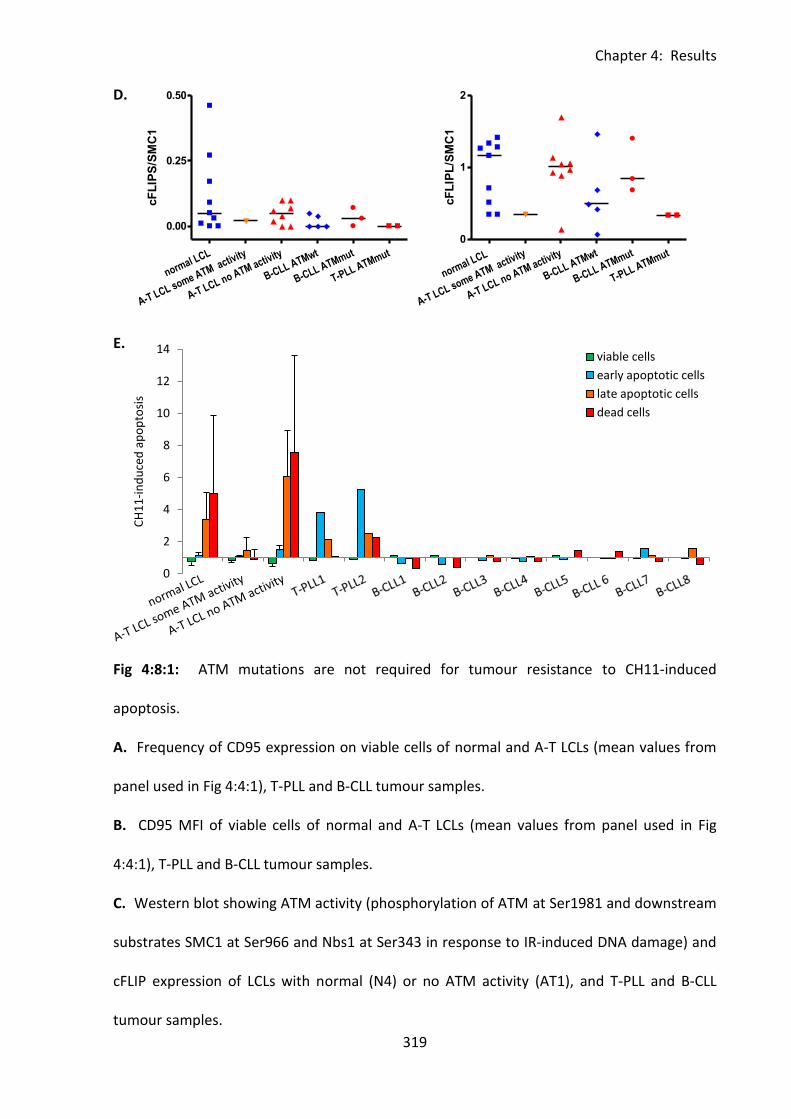
Chapter 4: Results
319
0
2
4
6
8
10
12
14
CH
11
-in
du
ced
ap
op
tosi
s
viable cells
early apoptotic cells
late apoptotic cells
dead cells
normal LCL
A-T LCL some ATM activity
A-T LCL no ATM activity
B-CLL ATMwt
B-CLL ATMmut
T-PLL ATMmut
0
1
2
cF
LIP
L/S
MC
1
normal LCL
A-T LCL some ATM activity
A-T LCL no ATM activity
B-CLL ATMwt
B-CLL ATMmut
T-PLL ATMmut
0.00
0.25
0.50
cF
LIP
S/S
MC
1
D.
E.
Fig 4:8:1: ATM mutations are not required for tumour resistance to CH11-induced
apoptosis.
A. Frequency of CD95 expression on viable cells of normal and A-T LCLs (mean values from
panel used in Fig 4:4:1), T-PLL and B-CLL tumour samples.
B. CD95 MFI of viable cells of normal and A-T LCLs (mean values from panel used in Fig
4:4:1), T-PLL and B-CLL tumour samples.
C. Western blot showing ATM activity (phosphorylation of ATM at Ser1981 and downstream
substrates SMC1 at Ser966 and Nbs1 at Ser343 in response to IR-induced DNA damage) and
cFLIP expression of LCLs with normal (N4) or no ATM activity (AT1), and T-PLL and B-CLL
tumour samples.
Chapter 4: Results
320
D. cFLIPL and cFLIPS expression (analysed by densitometry, using SMC1 as a loading control)
in B-CLL with wildtype and mutant ATM and in T-PLL. cFLIP levels of normal and A-T LCLs
reproduced from Fig 4:5:2 for comparison.
E. CH11 (500ng/mL) induced apoptosis and viability of individual T-PLL and B-CLL tumour
samples (analysis of cells at each individual stage of apoptosis) and mean values for the
panel of normal and A-T LCLs used in Fig 4:4:1.
Chapter 4: Results
321
4:9: Discussion.
4:9:1: A-T LCLs showed increased sensitivity to CD95-mediated apoptosis.
An increased level of CD95-mediated apoptosis in A-T lymphocytes in vivo is important as it
may contribute to the immune deficiency of A-T patients. Different studies have shown
either increased (Ivanov et al., 2009) or decreased (Stagni et al., 2008) sensitivity to death
receptor-induced apoptosis as a result of ATM inhibition in cultured cells. However, a major
immunological feature of A-T patients is lymphopenia and increased sensitivity to CD95-
mediated apoptosis, rather than resistance to CD95-mediated apoptosis, could contribute to
this lymphopenia. I showed that EBV-immortalised B cell lymphoblastoid cell lines (LCLs)
derived from A-T patients with no ATM kinase activity were more sensitive to CD95-
mediated apoptosis activated by CH11 treatment than LCLs derived from normal individuals.
This was despite a significantly reduced cell surface expression of CD95 on A-T compared
with normal LCLs.
Several reports have suggested that high cell surface expression of CD95 results in a level of
spontaneous apoptosis of cells (Le Clorennec et al., 2008;Roger et al., 1999). Supporting this
hypothesis I found a significant negative correlation between CD95 expression and viability
of LCLs in culture. My results showed that A-T LCLs with no ATM activity were significantly
more viable in culture than normal LCLs. In addition specific inhibition of ATM protein kinase
did not reduce CD95 expression on the cell surface of normal LCLs and conversely,
expression of functional ATM protein kinase in an A-T LCL did not increase expression. This
suggested that lack of ATM activity may not be directly responsible for the downregulation
of CD95 on A-T compared to normal LCLs. As LCLs are infected with EBV which is able to
regulate the expression of CD95 (Le Clorennec et al., 2006), the reduced expression on A-T
Chapter 4: Results
322
LCLs with no ATM activity may be virally induced in order to reduce spontaneous apoptosis
of the apoptotic sensitive cells. If this is the case it could explain my finding that transfection
of an ATMwt construct into an A-T LCL with no ATM activity had no effect on its CD95
expression, because the EBV infection in the LCL was already well established.
My results showed no significant difference in expression of cFLIP between normal and A-T
LCLs. In addition, specific inhibition of ATM protein kinase activity did not have a differential
effect on the cFLIP levels of normal and A-T LCLs. However, normal LCLs, which express
much higher levels of CD95 than A-T LCLs, showed a strong negative correlation between
increasing cFLIPL expression and decreasing apoptosis. This suggested that above a certain
threshold concentration of CD95 receptor expression, cFLIP protein mediated inhibition of
apoptosis is a more important determinant of apoptotic sensitivity than surface CD95
expression. Therefore, since normal LCLs express high levels of CD95 and their apoptotic
sensitivity does not increase with increasing CD95 expression, cFLIP may have a greater
inhibitory effect on their apoptosis than it does in A-T LCLs.
There was evidence of a faster rate of CH11-induced CD95-mediated apoptosis in A-T LCLs
with no ATM activity than in normal LCLs as they showed faster progression through to the
late stage of apoptosis. The slower rate of apoptosis in normal LCLs may be related to a
requirement for inactivation of ATM by caspase-dependent cleavage in order to facilitate the
progression of apoptosis (Smith et al., 1999;Wang et al., 2006).
My results suggest that ATM mutations lead to increased sensitivity to CD95-mediated
apoptosis. A recent study (Ivanov et al., 2009) reported that inhibition of ATM activity in
melanoma cells prior to irradiation enhanced TRAIL-mediated apoptosis post-irradiation by
upregulation of the TRAIL receptor DR5 and downregulation of the anti-apoptotic protein
Chapter 4: Results
323
cFLIP, an important inhibitor of both TRAIL and CD95-mediated apoptosis. The findings of
Ivanov et al. support the hypothesis that loss of functional ATM kinase increases sensitivity
to death receptor-induced apoptosis. They differ from another report by Stagni et al. that
found that inhibition of ATM activity upregulated cFLIP expression in LCLs leading to
resistance to CD95-mediated apoptosis (Stagni et al., 2008).
Although both were carried out using LCLs, the findings of my study and the Stagni study
differ significantly. Whereas Stagni et al. (2008) used isogenic transfected LCLs, my study
mainly relied on a larger panel of non-isogenic LCLs. However, when I analysed isogenic LCLs
transfected with different ATM constructs the ATM-ve and ATMmut LCLs showed increased
sensitivity to CD95-mediated apoptosis compared to the ATMwt LCL. In contrast to Stagni et
al. (2008) I found no difference in cFLIP expression between ATMwt and ATM-ve or ATMmut
isogenic LCLs. These findings were in agreement with the results of my analysis of the non-
isogenic LCL panel which also showed increased sensitivity of A-T LCLs to CD95-mediated
apoptosis and no significant difference in cFLIP expression between normal and A-T LCLs.
4:9:2: The immune system phenotype of A-T is similar to that of other
lymphopenic conditions associated with increased sensitivity to CD95-mediated
apoptosis.
A comparison of the immune system phenotype of A-T patients with that of other conditions
associated with resistance or sensitivity to CD95-mediated apoptosis supports my finding of
increased sensitivity of A-T patients’ cells. However, there are some similarities between the
immune system abnormalities and predisposition to cancer of A-T patients and patients with
autoimmune lymphoproliferative syndrome (ALPS), a disorder most commonly caused by
mutations in the Fas gene which encodes CD95 (Straus et al., 2001). Fas mutations result in
Chapter 4: Results
324
resistance to CD95-mediated apoptosis, therefore ALPS predisposes to autoimmune
disorders and lymphoma development (Straus et al., 2001). Similarly mice lacking functional
CD95 expression also suffer from autoimmune conditions (Adachi et al., 1995) and increased
incidence of B cell lymphoma (Davidson et al., 1998). Like ALPS patients and mice with Fas
mutations, A-T patients show an increased incidence of lymphoid tumours, autoimmune
disorders and possible defects in immunoregulatory processes.
However, there is a major difference between the immune systems of patients with A-T and
those with ALPS: A-T patients are lymphopenic whereas Fas mutations resulting in resistance
to CD95-mediated apoptosis cause an accumulation of lymphocytes in both humans and
mice leading to enlargement of liver, spleen and lymph nodes (Bleesing et al., 2001;Lim et
al., 1998;Poppema et al., 2004;Takahashi et al., 1994;Watanabe-Fukunaga et al., 1992). As
shown in Chapter 3, A-T patients have deficiencies in naive B and T cells and increased
proportions of memory T cells and NK cells. Absolute numbers of T cells and B cells are also
reduced (Nowak-Wegrzyn et al., 2004).
In contrast to the lymphopenia of A-T patients, the resistance to CD95-mediated apoptosis
seen in ALPS patients causes an accumulation of both T and B cells, especially
CD3+CD4+CD8-T cells thought to derive from previously activated cells that have failed to
die by activation-induced cell death (AICD) after restimulation through their TCR (Sneller et
al., 1997). The proportion of naive T cells is also increased in ALPS (Lim et al., 1998), whereas
the opposite is true of A-T (Reichenbach et al., 2002). ALPS patients have increased numbers
of both total B cells and CD5+ B cells (Bleesing et al., 2001;Lim et al., 1998;Poppema et al.,
2004) and CD95-resistant mice develop progressive lymphadenopathy and accumulate
several-fold increases in conventional CD4+ and CD8+ T lymphocytes and B cells (Takahashi
et al., 1994;Watanabe-Fukunaga et al., 1992).
Chapter 4: Results
325
In terms of lymphocyte number the immune system phenotype of A-T patients is similar to
that of lymphopenic patients such as HIV patients and stem cell transplant recipients.
Peripheral T cell depletion associated with increased levels of CD95-mediated apoptosis has
been reported in both these groups of patients (Brugnoni et al., 1999;Rethi et al., 2008) and
increased sensitivity to CD95-mediated apoptosis has also been described in several cases of
idiopathic CD4+ T cell lymphocytopenia (Laurence et al., 1996;Roger et al., 1999). In terms
of lymphocyte subsets A-T patients are similar to the elderly who have a naive cell deficiency
which may also be partly due to increased sensitivity to CD95-mediated apoptosis (Gupta &
Gollapudi, 2008).
The major differences between the immune system phenotype of A-T patients and patients
with ALPS, together with the similarities to lymphopenic conditions with increased CD95-
mediated apoptosis and the findings of Ivanov et al. (2009), support the hypothesis of
increased sensitivity of A-T lymphocytes to CD95-mediated apoptosis compared to cells with
normal ATM.
4:9:3: T-PLL tumours were sensitive and B-CLL tumours resistant to CD95-
mediated apoptosis.
As A-T predisposes to B and T cell lymphomas my study was concluded by investigating
tumour sensitivity to CD95-mediated apoptosis. ATM mutations are found in approximately
40% of sporadic B-CLL (Stankovic et al., 1999) and the majority of T-PLL tumours (Matutes et
al., 1991;Nowak et al., 2009;Yamaguchi et al., 2003;Yuille et al., 1998). However, whilst T-
PLL is relatively frequent in A-T patients, perhaps because loss of ATM function is important
in initiation of the tumour (Stankovic et al., 2002;Stoppa-Lyonnet et al., 1998), the incidence
of B-CLL is low, possibly because ATM mutation is important for progression but not
Chapter 4: Results
326
initiation of B-CLL tumours. Neither tumour type is common in the Fas mutation associated
disorder ALPS.
I analysed the sensitivity to CH11-induced CD95-mediated apoptosis of B-CLL and T-PLL
tumours with ATM mutations. It was significant that B-CLL was highly resistant to CH11-
induced apoptosis regardless of ATM status. In B-CLL the most important factor in resistance
to CH11-induced apoptosis appeared to be the complete loss of CD95 expression on the
majority of the cells. I found no significant difference in CD95 expression, cFLIP expression or
apoptotic resistance of ATMwt and ATMmut B-CLL tumour cells. This suggests that ATM
mutations are not necessary for resistance to CD95-mediated apoptosis. My results showed
upregulation of intermediate isoforms of cFLIP in B-CLL which may be important for
apoptotic resistance, but there was no significant upregulation of expression of cFLIPL or
cFLIPS compared to LCLs. In contrast, T-PLL tumours with ATM mutations did not express
cFLIPS or intermediates and were more like A-T LCLs in showing similar CD95 expression and
sensitivity to CH11-induced apoptosis.
4:9:4: Loss of ATM function increases sensitivity to CD95-mediated apoptosis.
I have shown that increased sensitivity to CH11-induced CD95-mediated apoptosis in vitro,
seen both in lymphoid cells derived from A-T patients and probably in sporadic T-PLL, is
associated with total loss of ATM function in each case. However, I have found no evidence
for a direct role of ATM in regulation of CD95 or cFLIP expression. It is possible that ATM
may mediate sensitivity to CD95-mediated apoptosis through regulation of other pro- or
anti-apoptotic proteins such as the pro-apoptotic adaptor FADD (Fas-associated via death
domain) which binds to the death domain of CD95 and recruits pro-caspase 8 to the DISC
complex (reviewed in (Krammer, 2000)). Interestingly increased FADD expression in T cells
Chapter 4: Results
327
in the elderly has been suggested as a cause of the increased sensitivity of aged lymphocytes
to CD95-mediated apoptosis (Gupta et al., 2004;Gupta & Gollapudi, 2008). As I believe that
A-T patients have a congenitally aged immune system (Chapter 3) it would be interesting to
investigate if a similar upregulation of FADD in A-T lymphocytes may contribute to their
sensitivity to CD95-mediated apoptosis. The X-linked inhibitor of apoptosis (XIAP) which
binds to and inhibits activation of caspases 9, 3 and 7 (Deveraux et al., 1997) would also be
an interesting candidate for further investigation as it is reportedly upregulated in response
to DNA damage-induced ATM activation (Bruno et al., 2008). Downregulation of XIAP in A-T
lymphocytes could potentially explain their increased sensitivity to CD95-mediated
apoptosis.
The increased sensitivity to CD95-mediated apoptosis of A-T patients’ cells could contribute
to lymphopenia, the principal feature of their immunodeficiency. In contrast, while T-PLL
tumour cells retain the same characteristics in vitro, presumably because of early loss of
ATM function in this clone, any killing of the tumour cells, due to increased sensitivity to
CD95-mediated apoptosis, is outweighed by far by the considerable growth advantage of the
tumour cells.
Chapter 5: Results
328
Chapter 5: Investigating the role of ATM in DNA
damage-induced upregulation of NKG2D Ligands.
Chapter 5: Results
329
5:1: Introduction
Patients with Ataxia-telangiectasia have a predisposition to cancer. The cancer
immunosurveillance hypothesis (Burnet, 1967) suggests that in healthy individuals cells with
the potential to develop into malignant tumours are recognised and destroyed by the
immune system. It is possible that a failure of this process of immunosurveillance in A-T
patients could contribute to the high incidence of cancer in these patients.
Cancer cells acquire mutations due to damaged DNA. In healthy individuals ATM activation
in response to DNA damage initiates DNA repair or apoptosis of the damaged cell. This
prevents damaged DNA from persisting in the body and potentially leading to cancer. As A-T
patients’ cells have reduced or absent ATM protein kinase activity they are unable to
respond effectively to DNA damage and so have an increased risk of cancer.
As well as initiation of DNA repair and apoptosis, ATM activation may also have a role in
signalling the presence of potentially dangerous cells containing damaged DNA to the
immune system through inducing upregulation of natural killer group 2, member D (NKG2D)
ligands (Gasser et al., 2005). These ligands are frequently expressed on primary tumour
cells, tumour cell lines and on cells infected with some viruses including HCMV, EBV and
influenza A (reviewed in (Eagle and Trowsdale, 2007)). They are also expressed on activated
T cells, mature dendritic cells, B cells, granulocytes and monocytes (Cerboni et al., 2007).
Two different types of NKG2D ligands have been discovered in humans, the MHC class 1
chain-related molecules (MICA and MICB) and members of the UL-16 binding protein family
(ULBP). These ligands are all recognised by cytotoxic cells expressing the NKG2D receptor
(NK cells, NKT cells, γδ T cells and some αβ T cells). Binding of the receptor to the ligand
leads to activation of the perforin/granzyme mechanism of apoptosis and death of the
Chapter 5: Results
330
damaged cell. In this way ATM-dependent upregulation of NKG2D ligands in response to
DNA damage may have an important role in cancer immunosurveillance, by providing a
means by which potentially dangerous cells are recognised and destroyed by the immune
system. Many tumours shed soluble NKG2D ligands from their surface as a mechanism of
immune evasion. The presence of soluble NKG2D ligands downregulates the NKG2D
receptor on the surface of cytotoxic cells and therefore allows the tumour cells to evade NK
cell killing (Groh et al., 2002).
ATM-dependent NKG2D ligand upregulation may also have a role in regulation of T cell
responses. Cerboni et al (2007) showed phosporylation of ATM on Serine 1981 and
upregulation of MICA in response to T cell activation (Cerboni et al., 2007). Upregulation of
the ligand could be prevented using inhibitors of ATM activity. As NKG2D ligand
upregulation increases the sensitivity of activated T cells to NK cell mediated killing it could
have a role in limiting T cell responses.
The effect of irradiation-induced DNA damage on NKG2D ligand surface expression on
normal and A-T LCLs, normal B cells and normal fibroblasts was investigated using flow
cytometry. However there was no evidence of NKG2D ligand upregulation in response to
DNA damage and no difference in NKG2D ligand expression between normal and A-T LCLs.
Chapter 5: Results
331
5:2: NKG2D ligand expression on LCLs.
5:2:1: Detection of NKG2D ligand expression by flow cytometry.
Surface expression of NKG2D ligands is required for NKG2D receptor binding and initiation of
apoptosis. Therefore surface antibody staining and flow cytometry was chosen as the
method of NKG2D ligand detection. The antibodies chosen were the same as those used by
Gasser et al (2005). As the ligands are frequently expressed on primary tumour cells and
tumour cell lines the sarcoma cell line LB23 SARC was used as a positive control for NKG2D
ligand expression. The flow cytometry method showed that this cell line expressed MICA,
MICB, ULBP-1 and ULBP-3. ULBP-2 was not expressed (Fig 5:2:1).
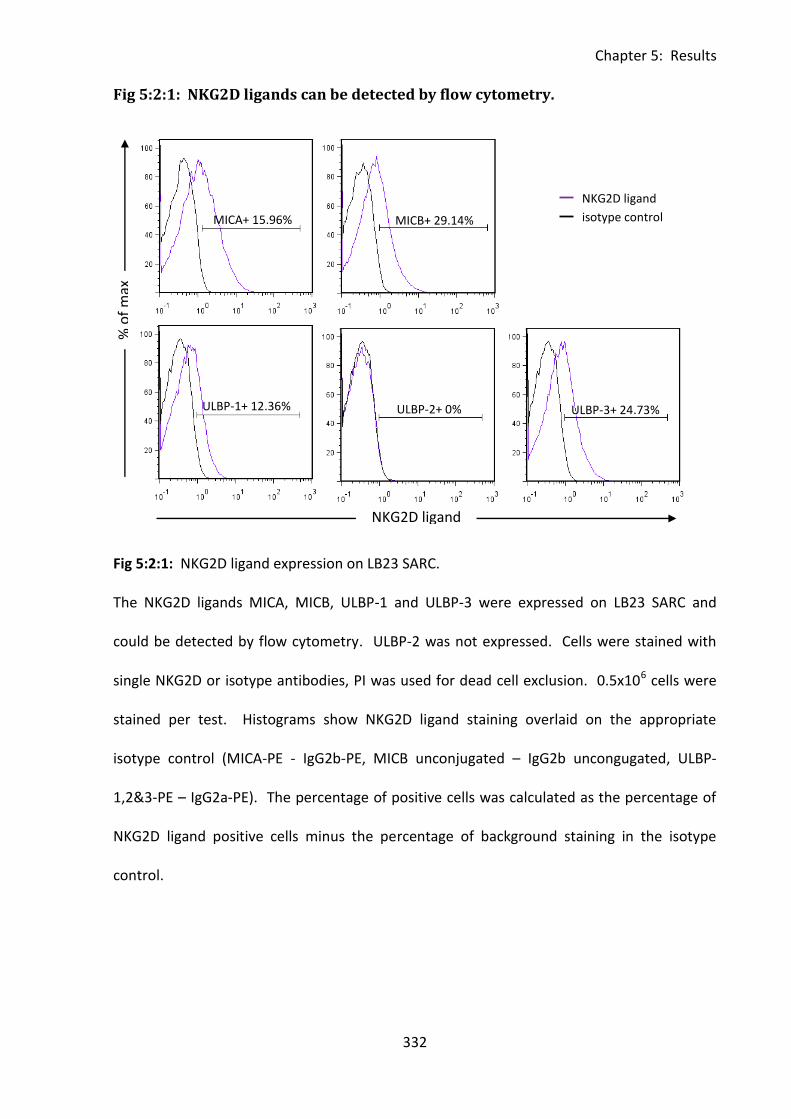
Chapter 5: Results
332
Fig 5:2:1: NKG2D ligands can be detected by flow cytometry.
Fig 5:2:1: NKG2D ligand expression on LB23 SARC.
The NKG2D ligands MICA, MICB, ULBP-1 and ULBP-3 were expressed on LB23 SARC and
could be detected by flow cytometry. ULBP-2 was not expressed. Cells were stained with
single NKG2D or isotype antibodies, PI was used for dead cell exclusion. 0.5x10⁶ cells were
stained per test. Histograms show NKG2D ligand staining overlaid on the appropriate
isotype control (MICA-PE - IgG2b-PE, MICB unconjugated – IgG2b uncongugated, ULBP-
1,2&3-PE – IgG2a-PE). The percentage of positive cells was calculated as the percentage of
NKG2D ligand positive cells minus the percentage of background staining in the isotype
control.
MICA+ 15.96% MICB+ 29.14%
% o
f m
ax
NKG2D ligand
ULBP-1+ 12.36% ULBP-2+ 0% ULBP-3+ 24.73%
NKG2D ligand
isotype control
Chapter 5: Results
333
5:2:2: NKG2D ligand expression on LCLs.
Next the antibodies were tested on a normal LCL (Fig 5:2:2A). This cell line expressed all five
of the NKG2D ligands, the most highly expressed being MICB (17%) followed by ULBP-3
(12.83%), ULBP-1 (8.07%), ULBP-2 (2.98%) and the lowest level of expression was of MICA
(1.31%).
As ATM may be involved in the upregulation of NKG2D ligands I compared the basal
expression levels of NKG2D ligands on five normal and five A-T LCLs, three with no ATM
activity and two with some residual ATM activity (Table 5:2:2). Although there was quite a
lot of variation in NKG2D ligand expression between the different LCLs there was no
significant difference in either the MFI or percentage of positive cells expressing MICA (Fig
5:2:2B), MICB (Fig 5:2:2C), ULBP-1 (Fig 5:2:2D), ULBP-2 (Fig 5:2:2E) or ULBP-3 (Fig 5:2:2F).
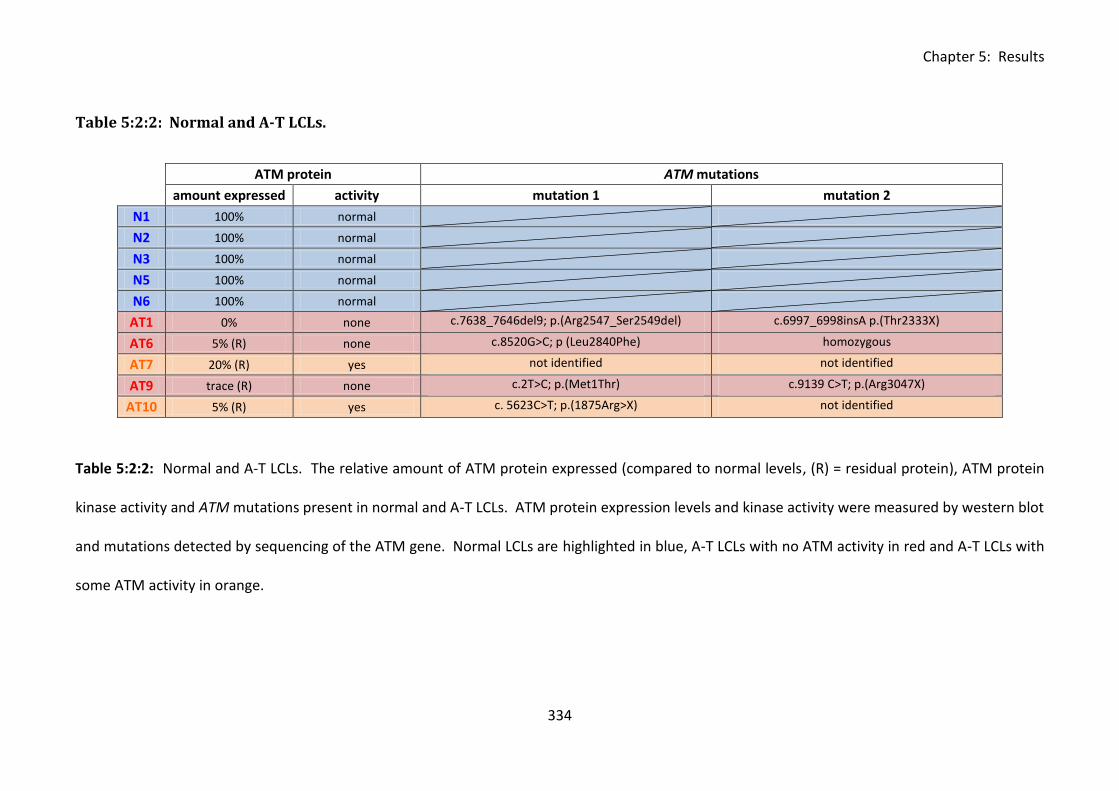
Chapter 5: Results
334
Table 5:2:2: Normal and A-T LCLs.
ATM protein ATM mutations
amount expressed activity mutation 1 mutation 2
N1 100% normal
N2 100% normal
N3 100% normal
N5 100% normal
N6 100% normal
AT1 0% none c.7638_7646del9; p.(Arg2547_Ser2549del) c.6997_6998insA p.(Thr2333X)
AT6 5% (R) none c.8520G>C; p (Leu2840Phe) homozygous
AT7 20% (R) yes not identified not identified
AT9 trace (R) none c.2T>C; p.(Met1Thr) c.9139 C>T; p.(Arg3047X)
AT10 5% (R) yes c. 5623C>T; p.(1875Arg>X) not identified
Table 5:2:2: Normal and A-T LCLs. The relative amount of ATM protein expressed (compared to normal levels, (R) = residual protein), ATM protein
kinase activity and ATM mutations present in normal and A-T LCLs. ATM protein expression levels and kinase activity were measured by western blot
and mutations detected by sequencing of the ATM gene. Normal LCLs are highlighted in blue, A-T LCLs with no ATM activity in red and A-T LCLs with
some ATM activity in orange.
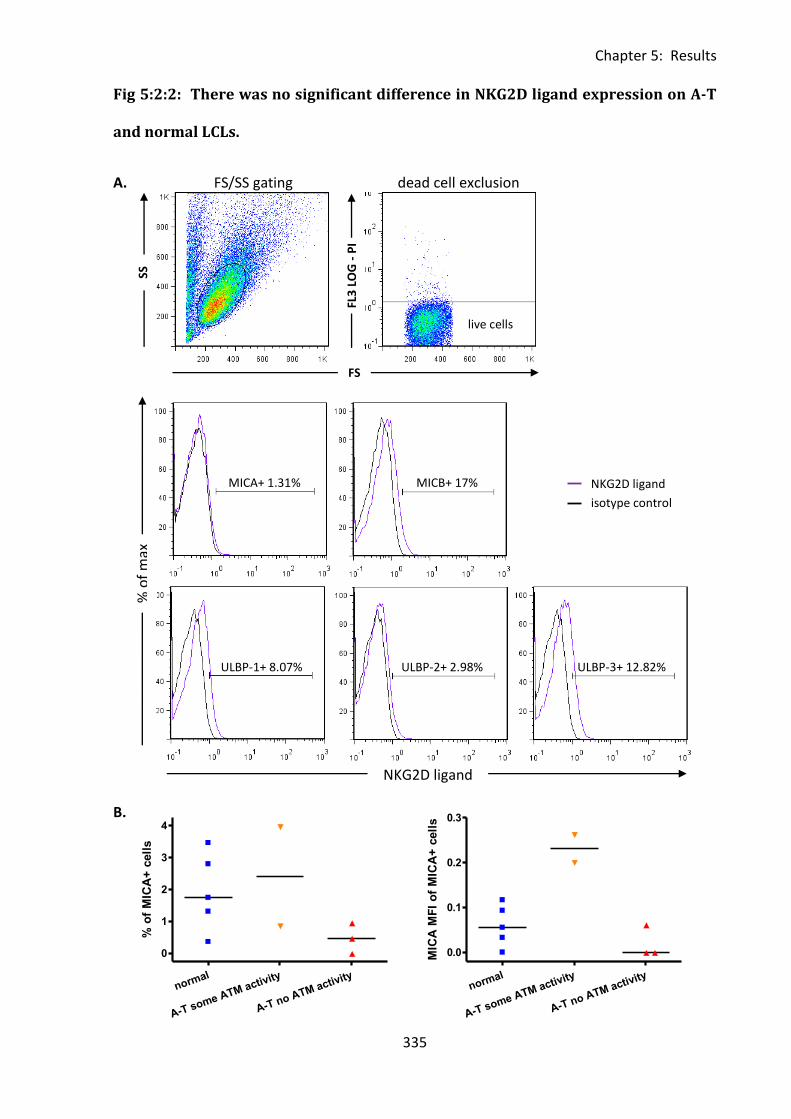
Chapter 5: Results
335
normal
A-T some ATM activity
A-T no ATM activity
0
1
2
3
4
% o
f M
ICA
+ c
ell
s
normal
A-T some ATM activity
A-T no ATM activity
0.0
0.1
0.2
0.3
MIC
A M
FI
of
MIC
A+
cell
s
Fig 5:2:2: There was no significant difference in NKG2D ligand expression on A-T
and normal LCLs.
A. FS/SS gating dead cell exclusion
B.
% o
f m
ax
NKG2D ligand
NKG2D ligand
isotype control
MICA+ 1.31% MICB+ 17%
ULBP-1+ 8.07% ULBP-2+ 2.98% ULBP-3+ 12.82%
FS
FL3
LO
G -
PI
SS
cells live cells
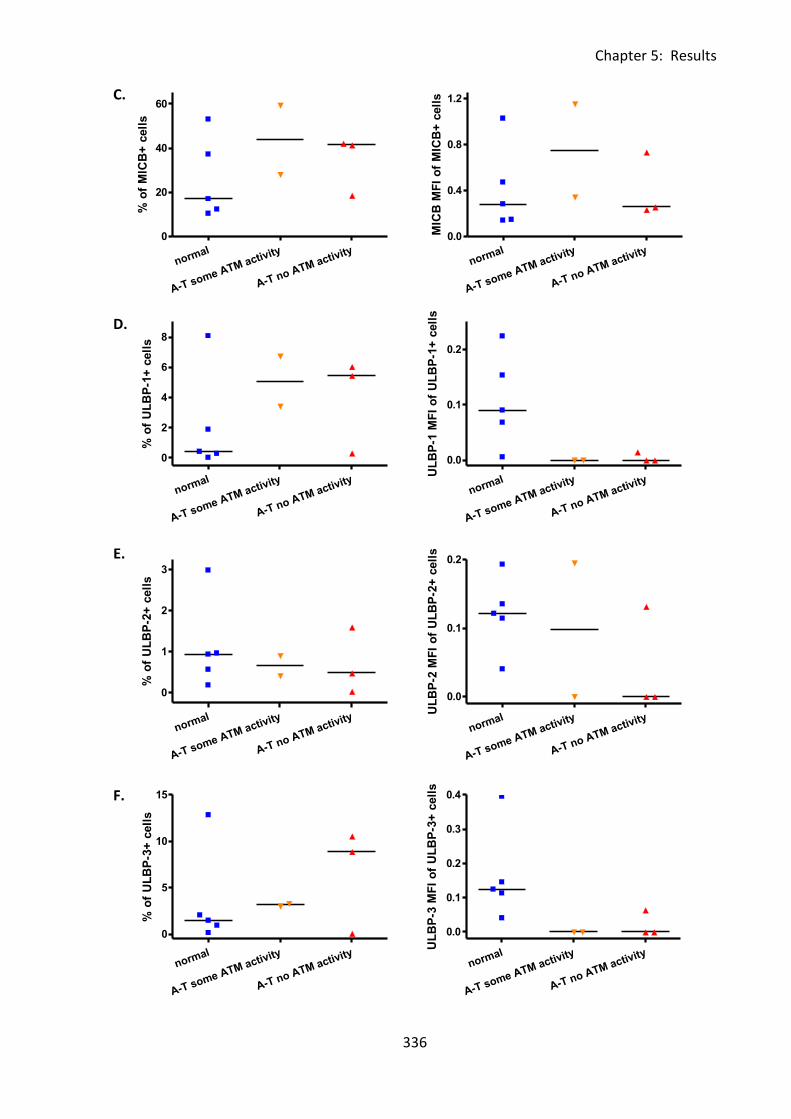
Chapter 5: Results
336
normal
A-T some ATM activity
A-T no ATM activity
0
20
40
60
% o
f M
ICB
+ c
ell
s
normal
A-T some ATM activity
A-T no ATM activity
0
1
2
3
% o
f U
LB
P-2
+ c
ell
s
normal
A-T some ATM activity
A-T no ATM activity
0
2
4
6
8
% o
f U
LB
P-1
+ c
ell
s
normal
A-T some ATM activity
A-T no ATM activity
0
5
10
15
% o
f U
LB
P-3
+ c
ell
s
normal
A-T some ATM activity
A-T no ATM activity
0.0
0.4
0.8
1.2
MIC
B M
FI
of
MIC
B+
cell
s
normal
A-T some ATM activity
A-T no ATM activity
0.0
0.1
0.2
UL
BP
-1 M
FI
of
UL
BP
-1+
cell
s
normal
A-T some ATM activity
A-T no ATM activity
0.0
0.1
0.2
UL
BP
-2 M
FI
of
UL
BP
-2+
cell
s
normal
A-T some ATM activity
A-T no ATM activity
0.0
0.1
0.2
0.3
0.4
UL
BP
-3 M
FI
of
UL
BP
-3+
cell
s
C.
D.
E.
F.
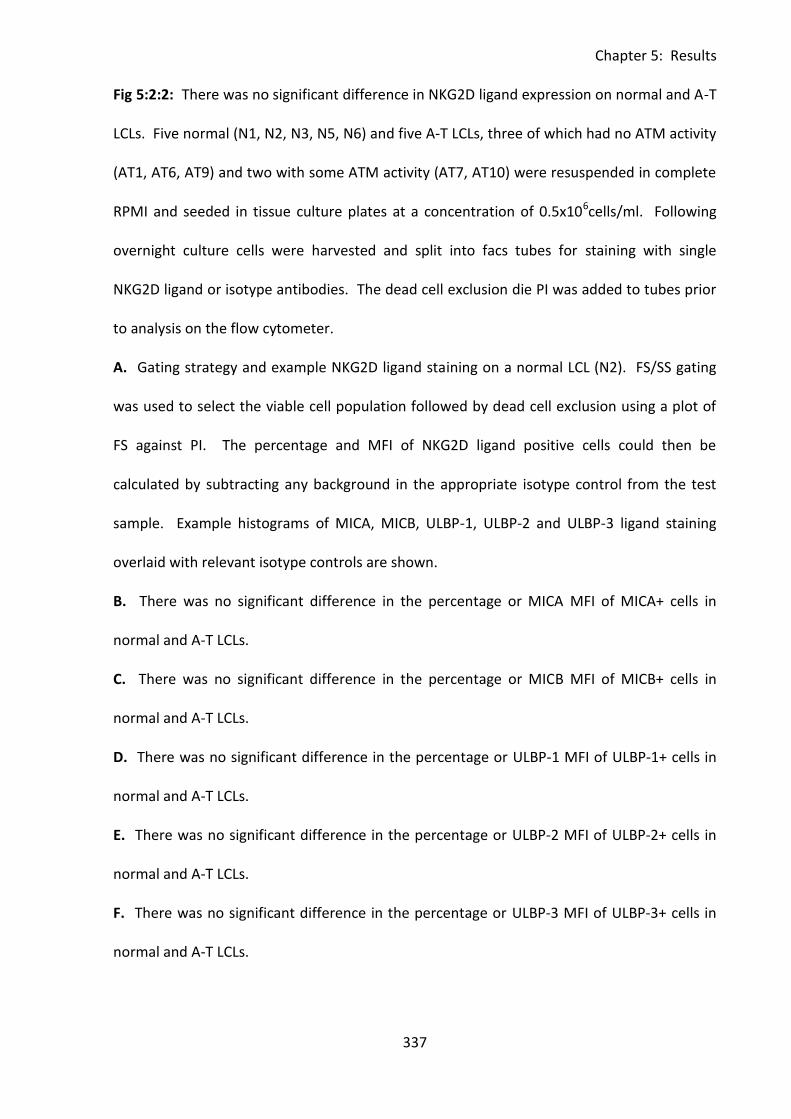
Chapter 5: Results
337
Fig 5:2:2: There was no significant difference in NKG2D ligand expression on normal and A-T
LCLs. Five normal (N1, N2, N3, N5, N6) and five A-T LCLs, three of which had no ATM activity
(AT1, AT6, AT9) and two with some ATM activity (AT7, AT10) were resuspended in complete
RPMI and seeded in tissue culture plates at a concentration of 0.5x10⁶cells/ml. Following
overnight culture cells were harvested and split into facs tubes for staining with single
NKG2D ligand or isotype antibodies. The dead cell exclusion die PI was added to tubes prior
to analysis on the flow cytometer.
A. Gating strategy and example NKG2D ligand staining on a normal LCL (N2). FS/SS gating
was used to select the viable cell population followed by dead cell exclusion using a plot of
FS against PI. The percentage and MFI of NKG2D ligand positive cells could then be
calculated by subtracting any background in the appropriate isotype control from the test
sample. Example histograms of MICA, MICB, ULBP-1, ULBP-2 and ULBP-3 ligand staining
overlaid with relevant isotype controls are shown.
B. There was no significant difference in the percentage or MICA MFI of MICA+ cells in
normal and A-T LCLs.
C. There was no significant difference in the percentage or MICB MFI of MICB+ cells in
normal and A-T LCLs.
D. There was no significant difference in the percentage or ULBP-1 MFI of ULBP-1+ cells in
normal and A-T LCLs.
E. There was no significant difference in the percentage or ULBP-2 MFI of ULBP-2+ cells in
normal and A-T LCLs.
F. There was no significant difference in the percentage or ULBP-3 MFI of ULBP-3+ cells in
normal and A-T LCLs.
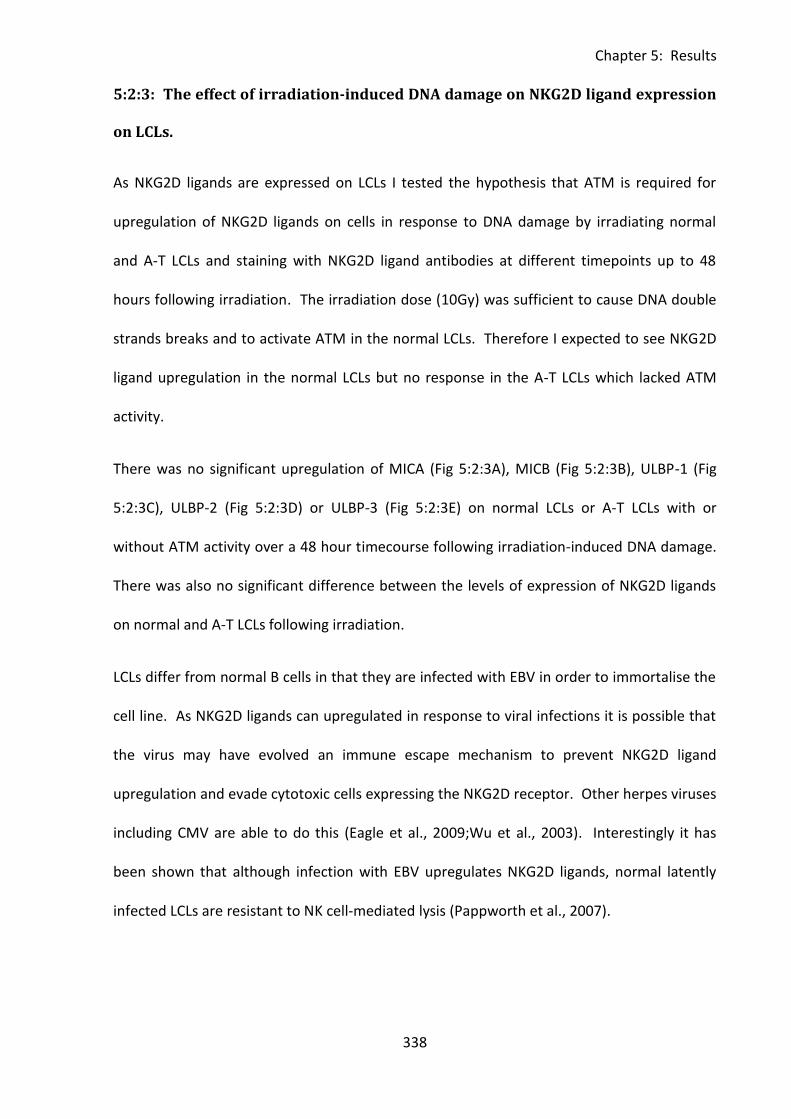
Chapter 5: Results
338
5:2:3: The effect of irradiation-induced DNA damage on NKG2D ligand expression
on LCLs.
As NKG2D ligands are expressed on LCLs I tested the hypothesis that ATM is required for
upregulation of NKG2D ligands on cells in response to DNA damage by irradiating normal
and A-T LCLs and staining with NKG2D ligand antibodies at different timepoints up to 48
hours following irradiation. The irradiation dose (10Gy) was sufficient to cause DNA double
strands breaks and to activate ATM in the normal LCLs. Therefore I expected to see NKG2D
ligand upregulation in the normal LCLs but no response in the A-T LCLs which lacked ATM
activity.
There was no significant upregulation of MICA (Fig 5:2:3A), MICB (Fig 5:2:3B), ULBP-1 (Fig
5:2:3C), ULBP-2 (Fig 5:2:3D) or ULBP-3 (Fig 5:2:3E) on normal LCLs or A-T LCLs with or
without ATM activity over a 48 hour timecourse following irradiation-induced DNA damage.
There was also no significant difference between the levels of expression of NKG2D ligands
on normal and A-T LCLs following irradiation.
LCLs differ from normal B cells in that they are infected with EBV in order to immortalise the
cell line. As NKG2D ligands can upregulated in response to viral infections it is possible that
the virus may have evolved an immune escape mechanism to prevent NKG2D ligand
upregulation and evade cytotoxic cells expressing the NKG2D receptor. Other herpes viruses
including CMV are able to do this (Eagle et al., 2009;Wu et al., 2003). Interestingly it has
been shown that although infection with EBV upregulates NKG2D ligands, normal latently
infected LCLs are resistant to NK cell-mediated lysis (Pappworth et al., 2007).
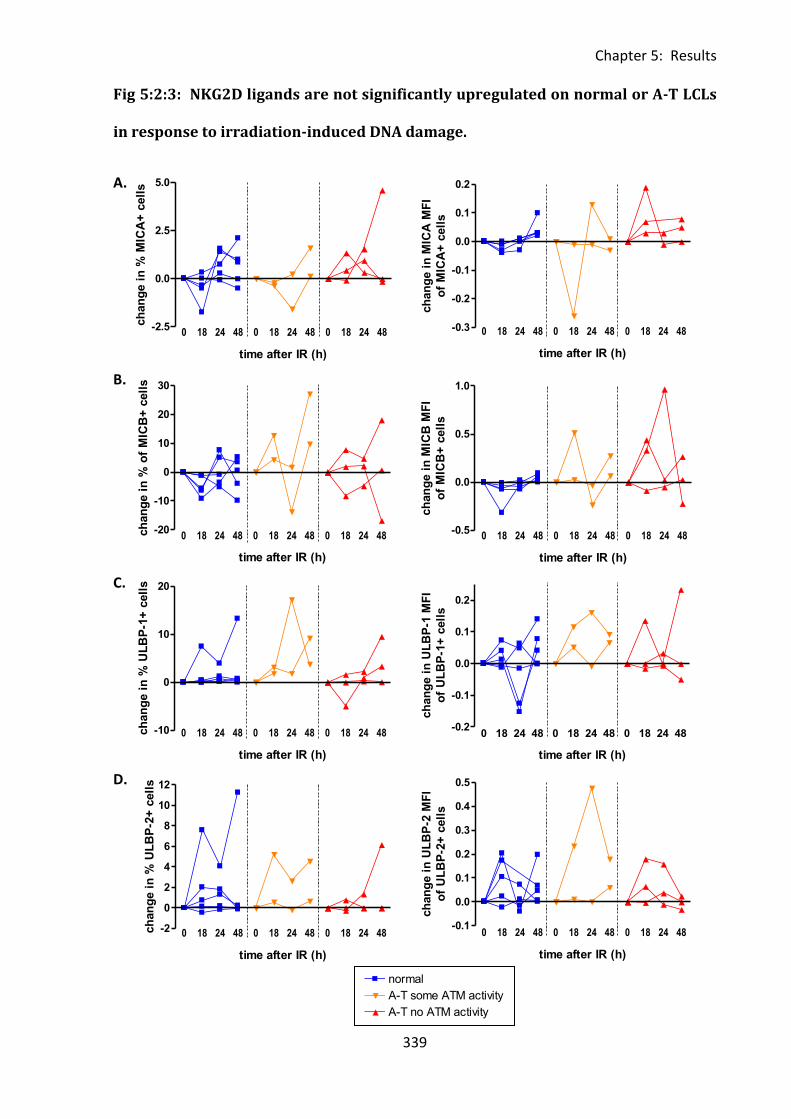
Chapter 5: Results
339
Data 16
normal A-T some ATM activityA-T no ATM activity3
4
5
6
7
8normal
A-T some ATM activity
A-T no ATM activity
0 18 24 48 0 18 24 48 0 18 24 48-2.5
0.0
2.5
5.0
time after IR (h)
ch
an
ge i
n %
MIC
A+
cell
s
0 18 24 48 0 18 24 48 0 18 24 48-10
0
10
20
time after IR (h)
ch
an
ge i
n %
UL
BP
-1+
cell
s
0 18 24 48 0 18 24 48 0 18 24 48-20
-10
0
10
20
30
time after IR (h)
ch
an
ge i
n %
of
MIC
B+
cell
s
0 18 24 48 0 18 24 48 0 18 24 48-2
0
2
4
6
8
10
12
time after IR (h)
ch
an
ge i
n %
UL
BP
-2+
cell
s
0 18 24 48 0 18 24 48 0 18 24 48-0.3
-0.2
-0.1
0.0
0.1
0.2
time after IR (h)
ch
an
ge i
n M
ICA
MF
I
of
MIC
A+
cell
s
0 18 24 48 0 18 24 48 0 18 24 48-0.5
0.0
0.5
1.0
time after IR (h)
ch
an
ge i
n M
ICB
MF
I
of
MIC
B+
cell
s
0 18 24 48 0 18 24 48 0 18 24 48-0.2
-0.1
0.0
0.1
0.2
time after IR (h)
ch
an
ge i
n U
LB
P-1
MF
I
of
UL
BP
-1+
cell
s
0 18 24 48 0 18 24 48 0 18 24 48-0.1
0.0
0.1
0.2
0.3
0.4
0.5
time after IR (h)
ch
an
ge i
n U
LB
P-2
MF
I
of
UL
BP
-2+
cell
s
Fig 5:2:3: NKG2D ligands are not significantly upregulated on normal or A-T LCLs
in response to irradiation-induced DNA damage.
A.
B.
C.
D.
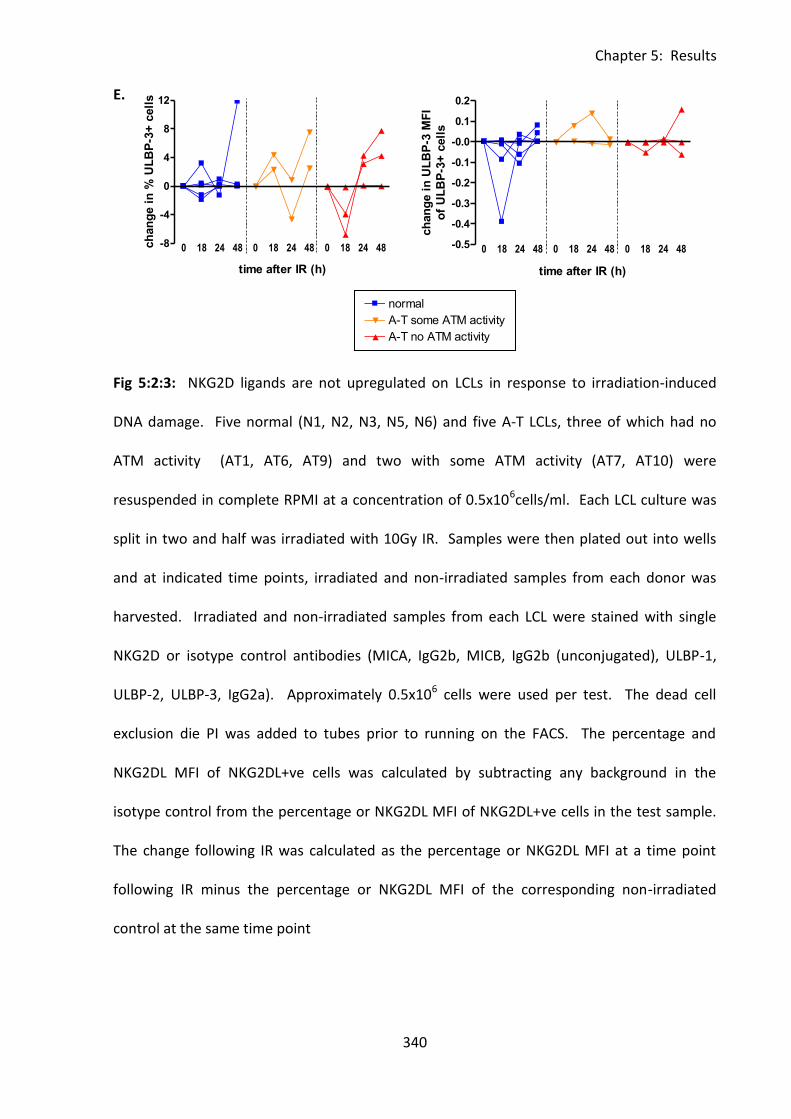
Chapter 5: Results
340
0 18 24 48 0 18 24 48 0 18 24 48-8
-4
0
4
8
12
time after IR (h)
ch
an
ge i
n %
UL
BP
-3+
cell
s
Data 16
normal A-T some ATM activityA-T no ATM activity3
4
5
6
7
8normal
A-T some ATM activity
A-T no ATM activity
0 18 24 48 0 18 24 48 0 18 24 48-0.5
-0.4
-0.3
-0.2
-0.1
-0.0
0.1
0.2
time after IR (h)
ch
an
ge i
n U
LB
P-3
MF
I
of
UL
BP
-3+
cell
s
E.
Fig 5:2:3: NKG2D ligands are not upregulated on LCLs in response to irradiation-induced
DNA damage. Five normal (N1, N2, N3, N5, N6) and five A-T LCLs, three of which had no
ATM activity (AT1, AT6, AT9) and two with some ATM activity (AT7, AT10) were
resuspended in complete RPMI at a concentration of 0.5x10⁶cells/ml. Each LCL culture was
split in two and half was irradiated with 10Gy IR. Samples were then plated out into wells
and at indicated time points, irradiated and non-irradiated samples from each donor was
harvested. Irradiated and non-irradiated samples from each LCL were stained with single
NKG2D or isotype control antibodies (MICA, IgG2b, MICB, IgG2b (unconjugated), ULBP-1,
ULBP-2, ULBP-3, IgG2a). Approximately 0.5x10⁶ cells were used per test. The dead cell
exclusion die PI was added to tubes prior to running on the FACS. The percentage and
NKG2DL MFI of NKG2DL+ve cells was calculated by subtracting any background in the
isotype control from the percentage or NKG2DL MFI of NKG2DL+ve cells in the test sample.
The change following IR was calculated as the percentage or NKG2DL MFI at a time point
following IR minus the percentage or NKG2DL MFI of the corresponding non-irradiated
control at the same time point
Chapter 5: Results
341
A. Irradiation-induced DNA damage had no significant effect on either the percentage or
MICA MFI of MICA+ve cells in normal or A-T LCLs. There was also no significant difference in
the effect of DNA damage on MICA expression of normal and A-T LCLs.
B. Irradiation-induced DNA damage had no significant effect on either the percentage or
MICB MFI of MICB+ve cells in normal or A-T LCLs.
C. Irradiation-induced DNA damage had no significant effect on either the percentage or
ULBP-1 MFI of ULBP-1+ve cells in normal or A-T LCLs.
D. Irradiation-induced DNA damage had no significant effect on either the percentage or
ULBP-2 MFI of ULBP-2+ve cells in normal or A-T LCLs.
E. Irradiation-induced DNA damage had no significant effect on either the percentage or
ULBP-3 MFI of ULBP-3+ve cells in normal or A-T LCLs.
Chapter 5: Results
342
5:3: MICA expression on B cells.
5:3:1: The effect of irradiation-induced DNA damage on MICA expression on
normal B cells.
To investigate the possibility that EBV infection in the LCLs was preventing NKG2D ligand
upregulation in response to DNA damage, the effect of irradiation-induced DNA damage on
MICA expression on B cells from seven healthy lab donors was tested. Blood samples were
collected, separated using lymphoprep and irradiated with a dose of 10Gy to produce DNA
double strand breaks and activate ATM. Cells were stained with either MICA or the isotype
control IgG2B as well as the B cell marker CD20.
The lymphocyte population was selected using a FS/SS plot and dead cells excluded with PI.
The percentage of B cells expressing MICA was calculated using a plot of CD20 against MICA
and any background staining in the isotype control sample was deducted (Fig 5:3:1A).
Similar to the LCLs, there was considerable variation in the basal level of expression of MICA
in non-irradiated B cells at time 0 (Fig 5:3:1B). The highest level of expression was in
samples N PBMC5 and N PBMC6 in which 2.98% of B cells expressed MICA. N PBMC1 and N
PBMC2 did not express any MICA at time 0 and in the remaining three samples less than
0.2% of B cells expressed the ligand.
There was no significant increase in MICA expression on normal B cells in response to
irradiation. The levels of expression did vary over the timecourse but this occurred in both
the irradiated and non-irradiated controls. Therefore the apparent increase in the
percentage of MICA+ve B cells in response to irradiation in four of the samples (N PBMC1, N
PBMC2, N PBMC3 and N PBMC4, Fig 5:3:1C) may be simply due to normal fluctuations rather
than a result of the DNA damage. A comparison of the MICA MFI of MICA+ve B cells before
Chapter 5: Results
343
and after irradiation also showed no significant upregulation of the ligand in response to
DNA damage (Fig 5:3:1D). There was also no upregulation of MICA on the CD20-ve cells
(data not shown).
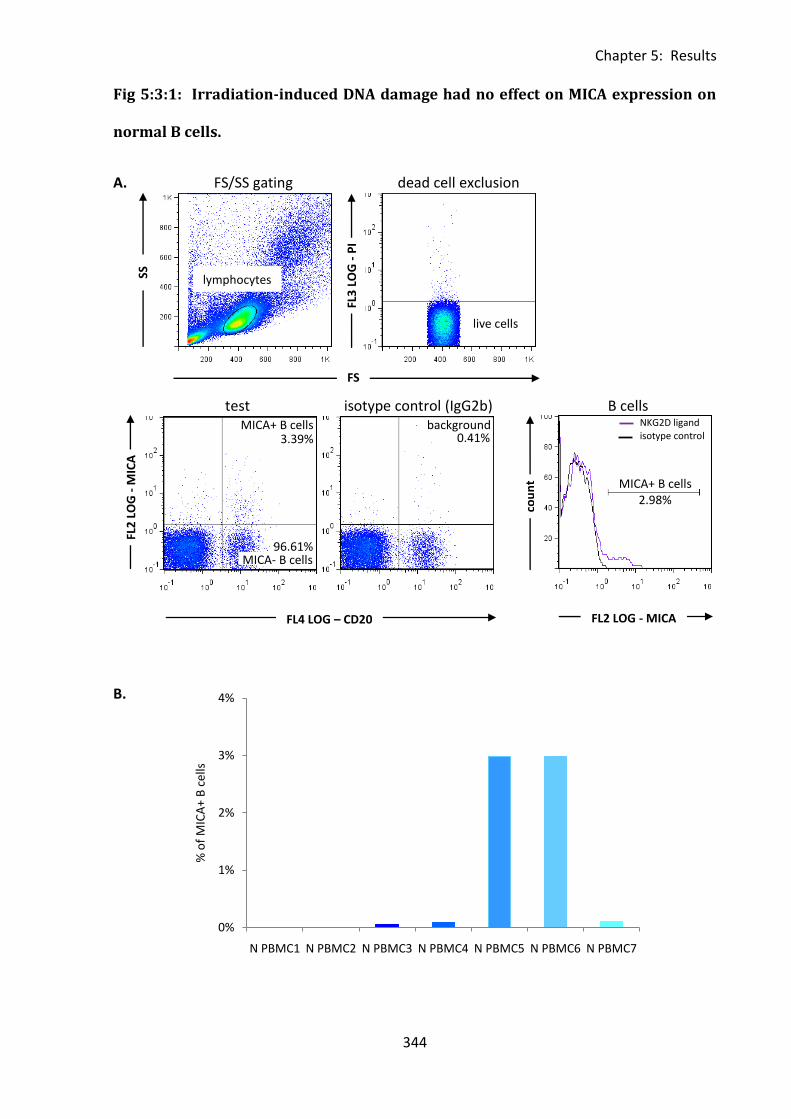
Chapter 5: Results
344
0%
1%
2%
3%
4%
N PBMC1 N PBMC2 N PBMC3 N PBMC4 N PBMC5 N PBMC6 N PBMC7
% o
f M
ICA
+ B
cel
ls
Fig 5:3:1: Irradiation-induced DNA damage had no effect on MICA expression on
normal B cells.
A. FS/SS gating dead cell exclusion
test isotype control (IgG2b) B cells
B.
FL2
LO
G -
MIC
A
FL4 LOG – CD20
FS
FL3
LO
G -
PI
cou
nt
FL2 LOG - MICA
SS
lymphocytes
live cells
MICA+ B cells
MICA- B cells
NKG2D ligand isotype control
MICA+ B cells 2.98%
3.39% background
0.41%
96.61%
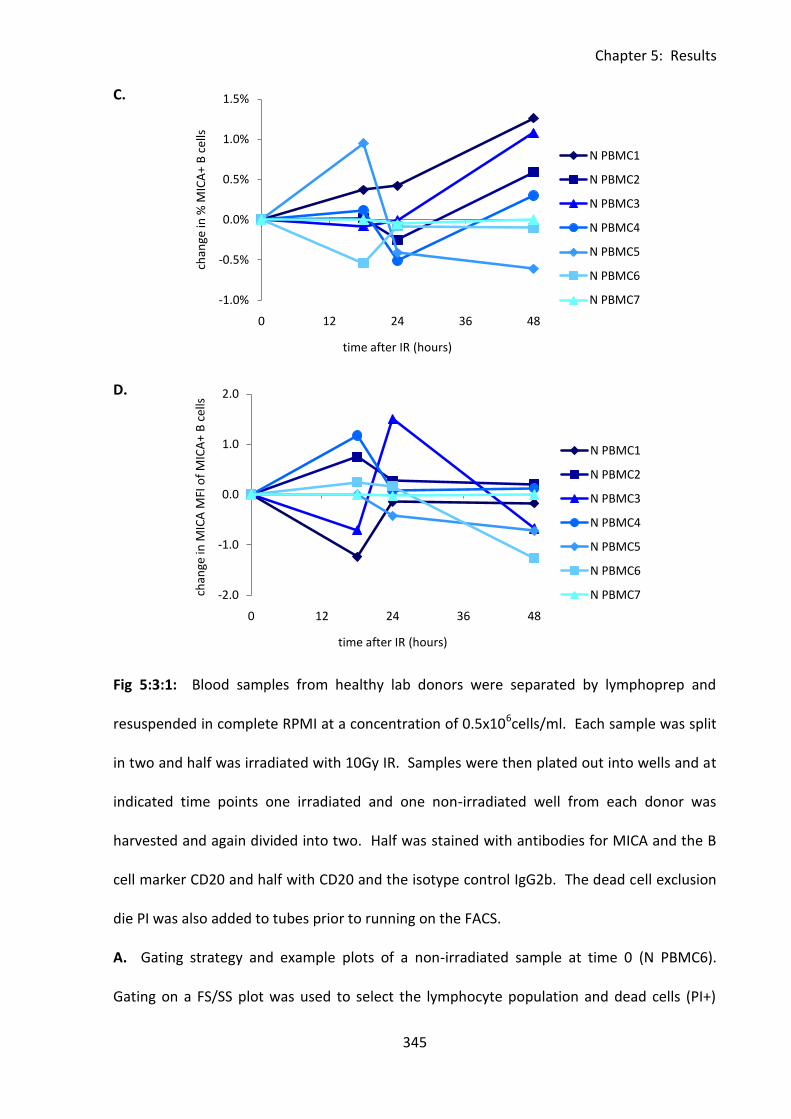
Chapter 5: Results
345
-1.0%
-0.5%
0.0%
0.5%
1.0%
1.5%
0 12 24 36 48
chan
ge in
% M
ICA
+ B
cel
ls
time after IR (hours)
N PBMC1
N PBMC2
N PBMC3
N PBMC4
N PBMC5
N PBMC6
N PBMC7
C.
D.
Fig 5:3:1: Blood samples from healthy lab donors were separated by lymphoprep and
resuspended in complete RPMI at a concentration of 0.5x10⁶cells/ml. Each sample was split
in two and half was irradiated with 10Gy IR. Samples were then plated out into wells and at
indicated time points one irradiated and one non-irradiated well from each donor was
harvested and again divided into two. Half was stained with antibodies for MICA and the B
cell marker CD20 and half with CD20 and the isotype control IgG2b. The dead cell exclusion
die PI was also added to tubes prior to running on the FACS.
A. Gating strategy and example plots of a non-irradiated sample at time 0 (N PBMC6).
Gating on a FS/SS plot was used to select the lymphocyte population and dead cells (PI+)
-2.0
-1.0
0.0
1.0
2.0
0 12 24 36 48
chan
ge in
MIC
A M
FI o
f M
ICA
+ B
cel
ls
time after IR (hours)
N PBMC1
N PBMC2
N PBMC3
N PBMC4
N PBMC5
N PBMC6
N PBMC7
Chapter 5: Results
346
were excluded using a plot of FS against PI. A plot of CD20 against MICA was then used to
distinguish MICA+ve and MICA-ve B cells (CD20+). The percentage and MICA MFI of
MICA+ve cells was calculated by subtracting any background in the isotype control from the
percentage or MICA MFI of MICA+ve cells in the test sample. A histogram overlay of
MICA+ve B cells and isotype control staining is shown.
B. The percentage of MICA+ve B cells in normal non-irradiated PBMCs at time 0h was very
low. Two of the samples, N PBMC1 and N PBMC2, did not express any MICA at this time
point. The median percentage of MICA+ve B cells at time 0h was 0.08% and the mean
0.89%.
C. Irradiation-induced DNA damage had no significant effect on the percentage of MICA+ B
cells over a 48 hour timecourse following IR. The change in percentage of MICA+ B cells
following IR was calculated as the percentage of MICA+ve B cells at a time point following IR
minus the percentage of MICA+ve B cells in the corresponding non-irradiated control sample
at the same time point.
D. Irradiation-induced DNA damage had no significant effect on the MICA MFI of MICA+ve B
cells over a 48 hour timecourse following IR. The change in MICA MFI of MICA+ve B cells
following IR was calculated as the MICA MFI of MICA+ve B cells at a time point following IR
minus the MICA MFI of MICA+ve B cells in the corresponding non-irradiated control sample
at the same time point.
Chapter 5: Results
347
5:4: NKG2D ligands expression on fibroblasts.
5:4:1: The effect of irradiation-induced DNA damage on NKG2D ligand expression
on fibroblasts.
Gasser et al. (2005) showed upregulation of NKG2D ligands on normal fibroblasts in
response to irradiation-induced DNA damage. As experiments using LCLs and B cells failed
to show any DNA damage-induced NKG2D ligand upregulation I attempted to repeat the
fibroblast experiment of Gasser et al. Gasser et al. used secondary neonatal human dermal
foreskin fibroblasts, whereas I used dermal fibroblasts derived from skin biopsies taken from
healthy lab donors. The experiment was designed to repeat that of Gasser et al. as closely as
possible using the same dose of radiation (40Gy), incubation period (16 hours) and NKG2D
ligand antibodies.
The experiment was carried out on two fibroblast cell lines. The fibroblasts expressed ULBP-
3 but there was no expression of the other NKG2D ligands (Fig 5:4:1A&B). The fibroblasts
used by Gasser et al. expressed ULBP-1, ULBP-2, ULBP-3 and MICA (MICB was not
investigated), this difference may be due to the difference in origin of the fibroblasts or
could be the result of genetic variation.
Neither fibroblast cell line showed any upregulation of NKG2D ligands in response to
irradiation-induced DNA damage. In fibroblast cell line 2 (Fig 5:4:1B) the percentage of cells
expressing ULBP-3 after 16 hours of incubation was higher on the non-irradiated sample
than the irradiated sample (1.59% compared to 0.1%).
As I was unable to show DNA damage-induced upregulation of NKG2D ligands on LCLs, B
cells or fibroblasts the project was discontinued.
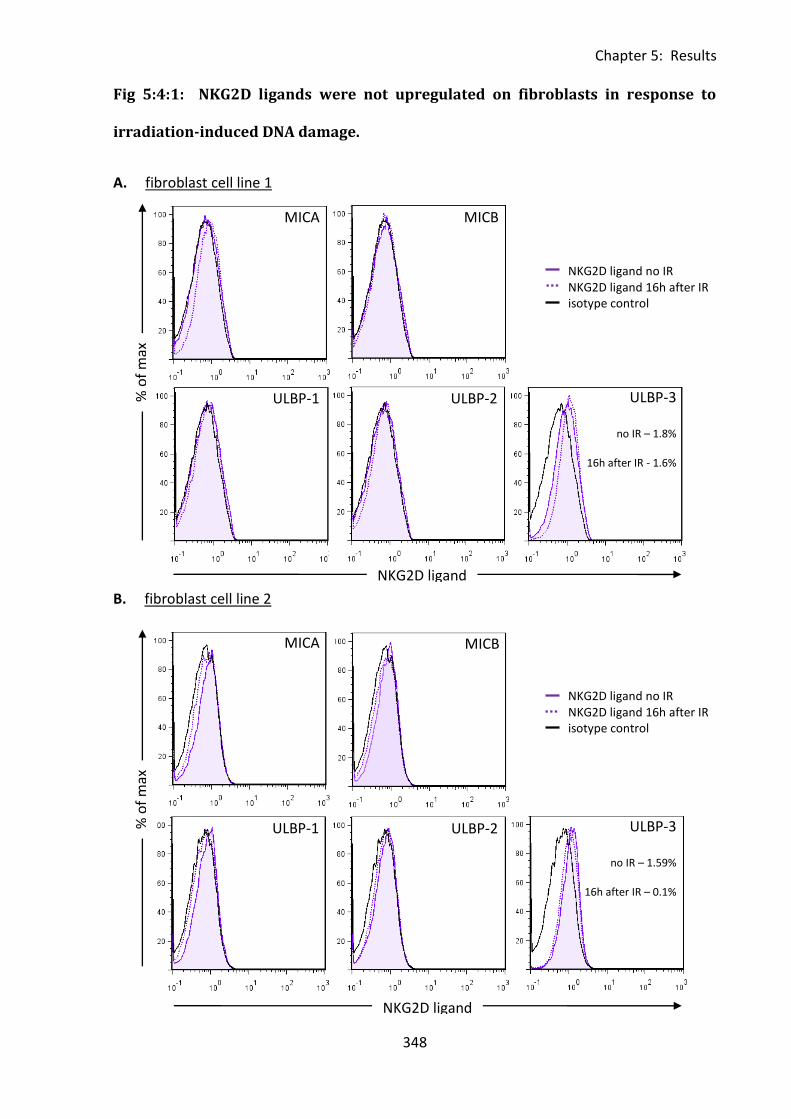
Chapter 5: Results
348
Fig 5:4:1: NKG2D ligands were not upregulated on fibroblasts in response to
irradiation-induced DNA damage.
A. fibroblast cell line 1
B. fibroblast cell line 2
MICA
0%
MICB
ULBP-1
% o
f m
ax
NKG2D ligand
MICA MICB
ULBP-1 ULBP-3
no IR – 1.8%
16h after IR - 1.6%
% o
f m
ax
ULBP-2
NKG2D ligand
ULBP-2
NKG2D ligand no IR NKG2D ligand 16h after IR isotype control
NKG2D ligand no IR NKG2D ligand 16h after IR isotype control
ULBP-3
no IR – 1.59%
16h after IR – 0.1%
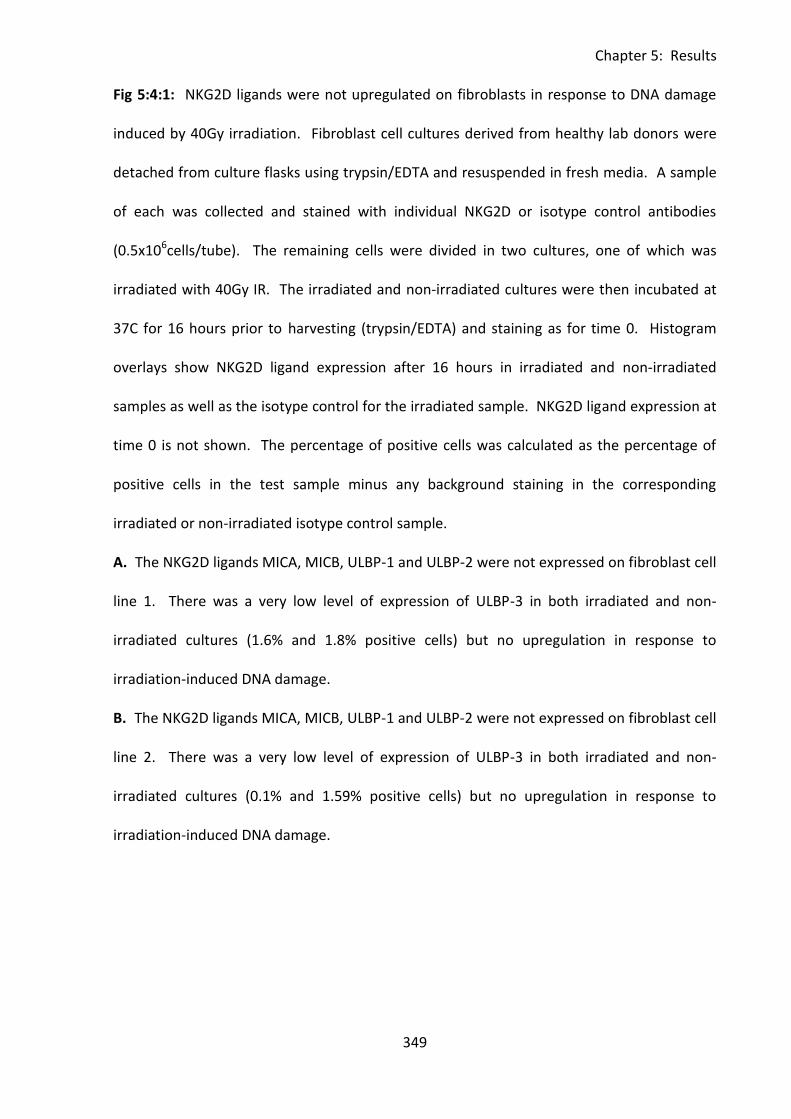
Chapter 5: Results
349
Fig 5:4:1: NKG2D ligands were not upregulated on fibroblasts in response to DNA damage
induced by 40Gy irradiation. Fibroblast cell cultures derived from healthy lab donors were
detached from culture flasks using trypsin/EDTA and resuspended in fresh media. A sample
of each was collected and stained with individual NKG2D or isotype control antibodies
(0.5x10⁶cells/tube). The remaining cells were divided in two cultures, one of which was
irradiated with 40Gy IR. The irradiated and non-irradiated cultures were then incubated at
37C for 16 hours prior to harvesting (trypsin/EDTA) and staining as for time 0. Histogram
overlays show NKG2D ligand expression after 16 hours in irradiated and non-irradiated
samples as well as the isotype control for the irradiated sample. NKG2D ligand expression at
time 0 is not shown. The percentage of positive cells was calculated as the percentage of
positive cells in the test sample minus any background staining in the corresponding
irradiated or non-irradiated isotype control sample.
A. The NKG2D ligands MICA, MICB, ULBP-1 and ULBP-2 were not expressed on fibroblast cell
line 1. There was a very low level of expression of ULBP-3 in both irradiated and non-
irradiated cultures (1.6% and 1.8% positive cells) but no upregulation in response to
irradiation-induced DNA damage.
B. The NKG2D ligands MICA, MICB, ULBP-1 and ULBP-2 were not expressed on fibroblast cell
line 2. There was a very low level of expression of ULBP-3 in both irradiated and non-
irradiated cultures (0.1% and 1.59% positive cells) but no upregulation in response to
irradiation-induced DNA damage.
Chapter 5: Results
350
5:5: Discussion.
A role for ATM in immune surveillance through the DNA damage induced upregulation of
NKG2D ligands has been reported (Gasser et al., 2005). As A-T patients have a high
incidence of leukaemia and lymphoma I attempted to investigate the potential contributory
role of a defect in immune surveillance through NKG2D ligand upregulation on lymphocytes,
to the development of these tumours.
There was no evidence of NKG2D ligand upregulation on LCLs, normal B cells or dermal
fibroblasts in response to DNA damage. Therefore it was not possible to investigate the role
of ATM in NKG2D ligand upregulation.
LCLs were chosen as a model for investigating NKG2D ligand upregulation in response to
DNA damage primarily because of the large number of different normal and A-T LCLs
available. An alternative approach would have been to concentrate on fibroblasts and use
ATM inhibitors to investigate the effect of ATM activation on NKG2D ligand upregulation in
response to DNA damage. However, inhibitors may have nonspecific effects and inhibition
may not be complete whereas an A-T LCL which does not express ATM protein definitely has
no ATM kinase activity. The ease of culture of LCLs was also a factor. As it was not possible
to obtain NKG2D ligand antibodies conjugated to a large range of different flourochromes
staining with all of the antibodies in the same tube was not possible. Therefore a large
number of cells of each LCL were required for each experiment so the quick doubling time of
LCLs in culture was a major advantage.
It is possible that the lack of NKG2D ligand upregulation in response to DNA damage in LCLs
may be due to EBV infection. However the lack of MICA upregulation on normal B cells or of
any of the NKG2D ligands tested on normal fibroblasts in response to irradiation suggests
Chapter 5: Results
351
that this is not the case. It is possible that although MICA was not upregulated on B cells
some or all of the other NKG2D ligands may have been upregulated. However, due to the
large numbers of cells (and therefore volumes of blood) required it was not possible to
investigate expression of all five ligands on PBMCs as for the LCLs. It would also not have
been possible to obtain sufficient volumes of blood from A-T patients for comparison with
normal donors. Therefore PBMCs were not an appropriate cell type for further experiments.
Gasser et al. (2005) showed upregulation of NKG2D ligands on fibroblasts in response to
irradiation-induced DNA damage; however I was unable to reproduce this result despite
using the same antibodies, dose of radiation and incubation time. I was concerned that the
trypsin/EDTA method of cell detachment may be too harsh and could be stripping NKG2D
ligands off the cell surface. I contacted the authors for method clarification and they
suggested using 4mM EDTA instead of trypsin/EDTA for cell detachment. This method was
attempted; however it killed the fibroblasts so the experiments were not continued. The
difference in detachment method could explain the difference in findings between my study
and that of Gasser et al.
It is possible that further experiments using fibroblasts and the 4mM EDTA detachment
method may have shown upregulation of NKG2D ligands in response to radiation induced
DNA damage. However, as the primary aim of the project was to investigate the role of ATM
activation in NKG2D ligand upregulation and fibroblasts from A-T patients were not
available, the scope of this experimental approach was limited. As no upregulation of
NKG2D ligands in response to DNA damage could be detected on normal B cells, normal
fibroblasts or either normal or A-T LCLs the project was discontinued.

Chapter 6: General Discussion
352
Chapter 6: General Discussion
Chapter 6: General Discussion
353
Since Ataxia-telangiectasia was first reported in 1926 (Syllaba & Henner, 1926) major
technological advances including the development of positional cloning, DNA sequencing
and flow cytometry techniques have led to a greater understanding of the function of the
ATM gene and the cause of both the neurological and immunological symptoms (reviewed in
(Lavin, 2008). However, the immune system defect in A-T is not yet fully understood.
Recent advances in multicolour flow cytometry allow a wide range of markers to be analysed
simultaneously on a small sample of PBMCs. Using this technique I was able to examine T
cell, B cell and NK cell subsets, NKT cells and expression of CD95, FasL and the IL-7 receptor α
chain, CD127 on A-T lymphocytes. This analysis suggested a congenitally aged immune
system phenotype in A-T. I also used flow cytometry assays to analyse the sensitivity of
lymphoid derived cell lines (LCLs) to CD95-mediated apoptosis induced by the CD95-
activating antibody CH11, and to analyse NKG2D ligand expression on LCLs, B cells and
fibroblasts following DNA damage-induced ATM activation. Interestingly, A-T LCLs showed
an increased sensitivity to CD95-mediated apoptosis compared to normal controls. There
was no evidence of DNA damage-induced NKG2D ligand upregulation on either A-T or
normal cells.
My phenotype analysis of A-T PBMCs clearly showed that the relative proportions of
lymphocyte subsets in A-T are skewed with a naive T and B cell deficiency that I believe is
similar to that of an aged immune system (Gupta & Gollapudi, 2008;Sansoni et al., 2008).
However, unlike age-matched healthy individuals, the deficient immune system of A-T
patients did not change significantly with age. Therefore A-T patients have a congenitally
aged immune system from birth rather than a premature or accelerated rate of aging. This
explains why, in contrast to the progressive neurological symptoms which lead to increasing
loss of motor function with age and commonly result in patients becoming wheelchair
Chapter 6: General Discussion
354
bound, the clinical consequences of the immune deficiency in A-T (immunoglobulin
deficiency, lymphopenia, frequency of non-respiratory tract infections) do not worsen with
age (Nowak-Wegrzyn et al., 2004).
I also found an increase in the percentages of both NK and NKT cells in A-T patients
compared to normal controls. A similar increase in NK and NKT cells (both percentages and
absolute numbers) has been reported in the elderly (reviewed in (Sansoni et al., 2008)). NK
cells are particularly important in defence against viruses and NKT cells protect against viral,
bacterial and parasitic infections. Therefore, the increase in these cells in A-T and the elderly
may compensate for naive T cell deficiency and reduced antigen receptor repertoire. This
could explain why A-T patients do not more frequently suffer from severe viral or
opportunistic infections despite their T cell deficiency (Nowak-Wegrzyn et al., 2004). The
increased proportion of NKT cells in A-T patients also suggests that glycolipid viral adjuvants
which activate NKT cells may be useful in improving their vaccination responses.
In general the group of A-T patients with some ATM activity showed an intermediate
phenotype between that of A-T patients with no ATM activity and normal controls. This
indicates that the presence of even a small amount of residual ATM kinase activity may
reduce the severity of the immune deficiency in A-T. It confirms the findings of Staples et al.
who also showed evidence of a protective effect of residual ATM activity (Staples et al.,
2008).
Other than the abnormalities in lymphocyte subsets, the most dramatic difference between
PBMCs from A-T patients and normal controls was the significantly increased expression of
the death receptor CD95 on A-T cells. Increased CD95 expression on CD4+ and CD8+ T cells
in A-T patients has been reported previously (Giovannetti et al., 2002;Schubert et al., 2000)
Chapter 6: General Discussion
355
but CD95 expression on other lymphocyte subsets was not investigated. Therefore as CD95
is a marker of activation, these studies (Giovannetti et al., 2002;Schubert et al., 2000)
attributed the increased CD95 expression to the naive T cell deficiency. I found that CD95
was increased on all lymphocyte subsets with the exception of NK cells and that the increase
in CD95 expression was particularly high on naive T cells and naive B cells. Therefore the
increased expression is not simply a consequence of reduced output of CD95-ve naive T cells
from the thymus or CD95-ve B cells from the bone marrow as CD95 expression was also
increased on memory cells. My results indicate that the majority of lymphocytes in A-T
patients have an activated phenotype, this is in keeping with the idea of a congenitally aged
immune system as a similar predominance of activated cells and increased CD95 expression
has been shown in the elderly (Aggarwal & Gupta, 1998;Potestio et al., 1999).
The high CD95 expression on A-T lymphocytes together with the increased sensitivity to
CD95-mediated apoptosis of A-T LCLs suggests that increased apoptosis could contribute to
the lymphopenia of A-T patients. However, patients were not deficient in memory T cells or
memory B cells despite the high CD95 expression on these subsets. This apparent
contradiction may be explained by a difference in sensitivity of naive and memory
lymphocytes to CD95-mediated apoptosis. It would be interesting to compare the sensitivity
of different subsets as it seems likely that in common with elderly individuals (Gupta &
Gollapudi, 2008), A-T patients’ naive T cells may be sensitive to and effector memory and
TEMRA T cells, resistant to CD95-mediated apoptosis.
As well as its role in apoptosis, CD95 can provide co-stimulatory signals, which in
combination with TCR signalling can induce proliferation of T cells recognising low-affinity
antigens (Rethi et al., 2008). Therefore increased CD95 expression may lead to increased
proliferation of activated memory T cells in A-T patients. Resistance to CD95-mediated
Chapter 6: General Discussion
356
apoptosis of effector memory and TEMRA T cells together with increased proliferation may
explain why there is no deficiency of memory T cells in A-T patients despite their high CD95
expression.
There was an indication from my results that increased availability of the cytokine IL-7 (due
to lymphopenia) may be involved in CD95 upregulation on both naive and memory CD4+ T
cell subsets. Therefore, treating A-T patients with IL-7 in an attempt to promote naive T cell
proliferation could potentially worsen their lymphopenia.
However, it is possible that antioxidants may prove beneficial in treating lymphopenia in A-T.
A role of reactive oxygen species (ROS) in CD95 upregulation on lymphocytes has been
reported recently (McKallip et al., 2010) and as A-T patients’ cells show evidence of
increased oxidative stress (Reichenbach et al., 2002) it is possible that ROS induced
upregulation of CD95 may contribute to the increased expression on A-T lymphocytes. ROS
have been implicated in CD95-mediated apoptosis in neuronal cells, both by inducing
upregulation of CD95 and FasL, and in signalling DISC formation following FasL binding to
CD95 (Facchinetti et al., 2002). Therefore, increased CD95-mediated apoptosis of neuronal
cells in A-T patients as a consequence of increased oxidative stress may contribute to their
neurological decline. Supporting this hypothesis, evidence from A-T mouse models suggests
that antioxidants slow the rate of progression of the neurological decline by reducing
oxidative stress (Gueven et al., 2006;Reliene et al., 2008;Reliene & Schiestl, 2006). These
mouse studies focussed on the anti-tumour effects of antioxidants in A-T, so the mechanism
by which they slowed the neurological decline was not investigated. However, it is possible
that they work by reducing CD95-mediated apoptosis of neuronal cells. Antioxidants may
also be useful in treating the immune deficiency in A-T if they are able to down regulate
CD95 expression on lymphocytes and consequently reduce sensitivity to both spontaneous
Chapter 6: General Discussion
357
and FasL induced CD95-mediated apoptosis. This could potentially explain the increase in
lymphocyte count reported in A-T patients undergoing treatment with the steroid
bethamethosone (Broccoletti et al., 2008) which is thought to act through an antioxidant
mechanism (Russo et al., 2009).
The effect of antioxidants on CD95 expression and sensitivity to CD95-mediated apoptosis of
A-T lymphocytes could be investigated by culturing A-T LCLs in the presence of an
antioxidant such as N-acetyl-L-cysteine (NAC) and analysing CD95 expression and sensitivity
to CH11-induced CD95-mediated apoptosis. It is not clear if clinical trials are currently being
carried out to analyse the effect of antioxidant treatment on the neurological decline of A-T
patients. However, it would be interesting to also analyse CD95 expression on lymphocytes
and look for any improvement in the lymphopenia of A-T patients during such trials.
Interestingly, in contrast to my finding of increased sensitivity, increased resistance of A-T
cells to CD95-mediated apoptosis as a direct consequence of ATM mutation was suggested
by the work of Stagni et al. (2008). It could be argued that increased CD95 expression on A-T
T cells indicates increased resistance rather than increased sensitivity of both naive and
memory subsets to CD95-mediated apoptosis, as CD95+ve cells which fail to die by
activation-induced cell death during the down phase of an immune response persist in the
bloodstream. However, this hypothesis does not fit with the lymphopenic phenotype of A-T
patients. My results showed an increased sensitivity of A-T LCLs to CD95-mediated
apoptosis but no evidence of a direct role for ATM in regulation of expression of CD95 or of
the caspase 8 inhibitor cFLIP.
I found that CD95 expression (MFI) was reduced on A-T compared to normal LCLs. This was
surprising as my PBMC phenotype analysis clearly showed increased CD95 expression on A-T
Chapter 6: General Discussion
358
lymphocytes. This difference is difficult to explain, however it is possible that it may be
related to differential regulation of CD95 expression by EBV in normal and A-T LCLs. This
hypothesis is hard to prove and there was no evidence of a difference in expression of LMP1
(an EBV protein able to regulate expression of both CD95 and cFLIP (Cahir-McFarland et al.,
2004)) in A-T compared to normal LCLs. However, it would explain why both Stagni et al.
(2008) and I found no difference in CD95 expression between ATMwt and ATMmut
transfected isogenic LCLs, as the EBV infection was already well established prior to
transfection. Primary cell samples are more informative than transformed cell lines as
experimental results are not influenced by viral transformation. However, LCLs are a useful
tool for research, especially when obtaining large volumes of blood for analysis is not
possible as was the case with my study.
An increased sensitivity of A-T lymphocytes to CD95-mediated apoptosis may seem
surprising in the context of the high incidence of leukaemia and lymphoma in A-T patients as
apoptotic resistance is an important characteristic of many tumours. Therefore I analysed
the sensitivity of T-PLL and B-CLL tumours with ATM mutations to CH11-induced CD95-
mediated apoptosis. My results showed that sensitivity to CD95-mediated apoptosis does
not prevent tumour development, as evidenced by the apoptotic sensitivity of T-PLL
tumours. Although common in A-T, T-PLL can also develop in non-lymphopenic, non-A-T
patients. Therefore T cell lymphopenia and subsequent reduced efficiency of immune
surveillance do not fully explain how an apoptotic sensitive tumour is able to develop and
persist. It is likely that the proliferative advantage of the tumour cells outweighs the effect
of increased CD95-mediated apoptosis.
Gasser et al. recently suggested a role for ATM in the upregulation of NKG2D, this may
protect against tumour development by signalling the presence of potentially malignant cells
Chapter 6: General Discussion
359
containing damaged DNA to cytotoxic cells of the immune system (Gasser et al., 2005).
However, I was unable to show DNA damage-induced upregulation of NKG2D ligands on
normal LCLs, B cells or fibroblasts. This suggests that ATM may not be involved in the
process; therefore it is unlikely that a deficiency in the NKG2D system of immune
surveillance contributes to the high incidence of cancer in A-T patients.
I can conclude that the lymphopenia in A-T is primarily caused by a combination of low
thymic output of naive T cells (Giovannetti et al., 2002;Micheli et al., 2003) and possibly
increased CD95-mediated apoptosis of naive T and B cells. It is not caused by a deficiency in
expression of the proliferative cytokine IL-7 or its receptor. Naive T cell deficiency may
account for increased sinopulmonary infections and reduced vaccination responses in A-T as
patients’ immune systems have a reduced capacity to respond to new antigenic challenges.
The similarities of the immune system phenotype of A-T patients with that of the elderly
suggest a possible role of impaired DNA damage repair in immune senescence. Interestingly
a decline in ATM expression and function during normal aging has been shown in mice (Fang
2007, Panda 2007) and a defect in DNA double strand break repair has been reported in
PBMCs from elderly people (Frasca et al., 1999). Regardless of the cause of the deficiency,
the similarities of the aged and A-T immune systems suggest that therapies that prove
beneficial in treating A-T patients (potentially including antioxidants and glycolipid viral
adjuvants) may also be beneficial in improving immune system function in the elderly.
Further work is required to fully explain the potential role of ATM protein kinase in the
increased sensitivity to CD95-mediated apoptosis of A-T lymphocytes and possibly in
immune surveillance. However, advances in our knowledge of the cause of the immune
deficiency in A-T could not only potentially lead to the development of effective new
Chapter 6: General Discussion
360
treatments but also provide an insight into the role of ATM in the immune system,
immunological function, tumour development and ageing in healthy individuals.

References
361
References.
References
362
Adachi, M., Suematsu, S., Kondo, T. et al (1995) Targeted mutation in the Fas gene causes hyperplasia in peripheral lymphoid organs and liver. Nat Genet, 11 (3): 294-300
Aggarwal, S. and Gupta, S. (1998) Increased apoptosis of T cell subsets in aging humans: altered expression of Fas (CD95), Fas ligand, Bcl-2, and Bax. J.Immunol., 160 (4): 1627-1637
Akbar, A. N. and Fletcher, J. M. (2005) Memory T cell homeostasis and senescence during aging. Curr.Opin.Immunol., 17 (5): 480-485
Anheim, M., Monga, B., Fleury, M. et al (2009) Ataxia with oculomotor apraxia type 2: clinical, biological and genotype/phenotype correlation study of a cohort of 90 patients. Brain, 132 (Pt 10): 2688-2698
Appay, V., Sauce, D. and Prelog, M. (2010) The role of the thymus in immunosenescence: lessons from the study of thymectomized individuals. Aging (Albany.NY), 2 (2): 78-81
Bagley, J., Singh, G. and Iacomini, J. (2007) Regulation of oxidative stress responses by ataxia-telangiectasia mutated is required for T cell proliferation. J.Immunol., 178 (8): 4757-4763
Bakkenist, C. J. and Kastan, M. B. (2003) DNA damage activates ATM through intermolecular autophosphorylation and dimer dissociation. Nature, 421 (6922): 499-506
Ball, L. G. and Xiao, W. (2005) Molecular basis of ataxia telangiectasia and related diseases. Acta Pharmacol.Sin., 26 (8): 897-907
Barlow, C., Dennery, P. A., Shigenaga, M. K. et al (1999) Loss of the ataxia-telangiectasia gene product causes oxidative damage in target organs. Proc.Natl.Acad.Sci.U.S.A, 96 (17): 9915-9919
Barzilai, A., Rotman, G. and Shiloh, Y. (2002) ATM deficiency and oxidative stress: a new dimension of defective response to DNA damage. DNA Repair (Amst), 1 (1): 3-25
Berkovich, E., Monnat, R. J., Jr. and Kastan, M. B. (2007) Roles of ATM and NBS1 in chromatin structure modulation and DNA double-strand break repair. Nat.Cell Biol., 9 (6): 683-690
Bleesing, J. J. H., Brown, M. R., Straus, S. E. et al (2001) Immunophenotypic profiles in families with autoimmune lymphoproliferative syndrome. Blood, 98 (8): 2466-2473
Boder, E. and Sedgwick, R. P. (1957) Ataxia telangiectasia. A familial syndrome of progressive cerebellar ataxia, occulocutaneous telangiectasia and frequent pulmonary infection. A preliminary report on 7 children, an autopsy, and a case history. Univ.S.Calif.Med.Bull., 9 15-28
Boder, E. (1985) Ataxia-telangiectasia: an overview. Kroc.Found.Ser., 19 1-63
Boultwood, J. (2001) Ataxia telangiectasia gene mutations in leukaemia and lymphoma. Journal of Clinical Pathology, 54 (7): 512-516
Bredemeyer, A. L., Huang, C. Y., Walker, L. M. et al (2008) Aberrant V(D)J recombination in ataxia telangiectasia mutated-deficient lymphocytes is dependent on nonhomologous DNA end joining. J.Immunol., 181 (4): 2620-2625
References
363
Bredemeyer, A. L., Sharma, G. G., Huang, C. Y. et al (2006) ATM stabilizes DNA double-strand-break complexes during V(D)J recombination. Nature, 442 (7101): 466-470
Broccoletti, T., Del, G. E., Amorosi, S. et al (2008) Steroid-induced improvement of neurological signs in ataxia-telangiectasia patients. Eur.J.Neurol., 15 (3): 223-228
Brugnoni, D., Airò, P et al (1999) Immune reconstitution after bone marrow transplantation for combined immunodeficiencies: down-modulation of Bcl-2 and high expression of CD95/Fas account for increased susceptibility to spontaneous and activation-induced lymphocyte cell death. Bone Marrow Transplantation, 23 (5): 451-457
Bruno, T., Iezzi, S., De, N. F. et al (2008) Che-1 activates XIAP expression in response to DNA damage. Cell Death.Differ., 15 (3): 515-520
Buoni, S., Zannolli, R., Sorrentino, L. et al (2006) Betamethasone and improvement of neurological symptoms in ataxia-telangiectasia. Arch.Neurol., 63 (10): 1479-1482
Burnet, F. M. (1967) Immunological aspects of malignant disease. Lancet, 1 (7501): 1171-1174
Buscemi, G., Savio, C., Zannini, L. et al (2001) Chk2 activation dependence on Nbs1 after DNA damage. Mol.Cell Biol., 21 (15): 5214-5222
Cahir-McFarland, E. D., Carter, K., Rosenwald, A. et al (2004) Role of NF-{kappa}B in Cell Survival and Transcription of Latent Membrane Protein 1-Expressing or Epstein-Barr Virus Latency III-Infected Cells. The Journal of Virology, 78 (8): 4108-4119
Cantisan, S., Solana, R., Lara, R. et al (2010) CD45RA expression on HCMV-specific effector memory CD8+ T cells is associated with the duration and intensity of HCMV replication after transplantation. Clin.Immunol.,
Carbonari, M., Cherchi, M., Paganelli, R. et al (1990) Relative increase of T cells expressing the gamma/delta rather than the alpha/beta receptor in ataxia-telangiectasia. N.Engl.J.Med., 322 (2): 73-76
Cerboni, C., Zingoni, A., Cippitelli, M. et al (2007) Antigen-activated human T lymphocytes express cell-surface NKG2D ligands via an ATM/ATR-dependent mechanism and become susceptible to autologous NK- cell lysis. Blood, 110 (2): 606-615
Chan, A., Hong, D. L., Atzberger, A. et al (2007) CD56bright human NK cells differentiate into CD56dim cells: role of contact with peripheral fibroblasts. J.Immunol., 179 (1): 89-94
Chen, P., Peng, C., Luff, J. et al (2003) Oxidative stress is responsible for deficient survival and dendritogenesis in purkinje neurons from ataxia-telangiectasia mutated mutant mice. J.Neurosci., 23 (36): 11453-11460
Chen, W. H., Kozlovsky, B. F., Effros, R. B. et al (2009) Vaccination in the elderly: an immunological perspective. Trends Immunol., 30 (7): 351-359
Corneo, B., Wendland, R. L., Deriano, L. et al (2007) Rag mutations reveal robust alternative end joining. Nature, 449 (7161): 483-486
References
364
Crawford, T. O., Skolasky, R. L., Fernandez, R. et al (2006) Survival probability in ataxia telangiectasia. Arch.Dis.Child, 91 (7): 610-611
Cullen, S. P. and Martin, S. J. (2008) Mechanisms of granule-dependent killing. Cell Death.Differ., 15 (2): 251-262
Czornak, K., Chughtai, S. and Chrzanowska, K. H. (2008) Mystery of DNA repair: the role of the MRN complex and ATM kinase in DNA damage repair. J.Appl.Genet., 49 (4): 383-396
Davidson, W. F., Giese, T. and Fredrickson, T. N. (1998) Spontaneous Development of Plasmacytoid Tumors in Mice with Defective Fas-Fas Ligand Interactions. The Journal of Experimental Medicine, 187 (11): 1825-1838
Davies, E. G. (2009) Update on the management of the immunodeficiency in ataxia-telangiectasia. Expert.Rev.Clin.Immunol., 5 (5): 565-575
Devadas, S., Zaritskaya, L., Rhee, S. G. et al (2002) Discrete generation of superoxide and hydrogen peroxide by T cell receptor stimulation: selective regulation of mitogen-activated protein kinase activation and fas ligand expression. The Journal of Experimental Medicine, 195 (1): 59-70
Deveraux, Q. L., Takahashi, R., Salvesen, G. S. et al (1997) X-linked IAP is a direct inhibitor of cell-death proteases. Nature, 388 (6639): 300-304
Duchaud, E., Ridet, A., Stoppa-Lyonnet, D. et al (1996) Deregulated Apoptosis in Ataxia Telangiectasia: Association with Clinical Stigmata and Radiosensitivity. Cancer Research, 56 (6): 1400-1404
Dunne, P. J., Faint, J. M., Gudgeon, N. H. et al (2002) Epstein-Barr virus-specific CD8(+) T cells that re-express CD45RA are apoptosis-resistant memory cells that retain replicative potential. Blood, 100 (3): 933-940
Dutton, A., O'Neil, J. D., Milner, A. E. et al (2004) Expression of the cellular FLICE-inhibitory protein (c-FLIP) protects Hodgkin's lymphoma cells from autonomous Fas-mediated death. Proc.Natl.Acad.Sci.U.S.A, 101 (17): 6611-6616
Eagle, R. A., Traherne, J. A., Hair, J. R. et al (2009) ULBP6/RAET1L is an additional human NKG2D ligand. Eur.J.Immunol., 39 (11): 3207-3216
Eagle, R. A. and Trowsdale, J. (2007) Promiscuity and the single receptor: NKG2D. Nat.Rev.Immunol., 7 (9): 737-744
el-Khamisy, S. F., Hartsuiker, E. and Caldecott, K. W. (2007) TDP1 facilitates repair of ionizing radiation-induced DNA single-strand breaks. DNA Repair (Amst), 6 (10): 1485-1495
el-Khamisy, S. F., Saifi, G. M., Weinfeld, M. et al (2005) Defective DNA single-strand break repair in spinocerebellar ataxia with axonal neuropathy-1. Nature, 434 (7029): 108-113
Facchinetti, F., Furegato, S., Terrazzino, S. et al (2002) H(2)O(2) induces upregulation of Fas and Fas ligand expression in NGF-differentiated PC12 cells: modulation by cAMP. J.Neurosci.Res., 69 (2): 178-188
References
365
Fagnoni, F. F., Vescovini, R., Mazzola, M. et al (1996) Expansion of cytotoxic CD8+CD28- T cells in healthy aging people, including centenarians. Immunology, 88 (4): 501-507
Fernandes, N., Sun, Y., Chen, S. et al (2005) DNA damage-induced association of ATM with its target proteins requires a protein interaction domain in the N terminus of ATM. Journal of Biological Chemistry, 280 (15): 15158-15164
Ferrando-Martinez, S., Ruiz-Mateos, E. and Leal, M. (2010) CD27 and CCR7 expression on naive T cells, are both necessary? Immunol.Lett., 127 (2): 157-158
Frasca, D., Barattini, P., Tirindelli, D. et al (1999) Effect of age on DNA binding of the ku protein in irradiated human peripheral blood mononuclear cells (PBMC). Exp.Gerontol., 34 (5): 645-658
Frasca, D., Landin, A. M., Lechner, S. C. et al (2008) Aging down-regulates the transcription factor E2A, activation-induced cytidine deaminase, and Ig class switch in human B cells. J.Immunol., 180 (8): 5283-5290
Fritsch, R. D., Shen, X., Sims, G. P. et al (2005) Stepwise differentiation of CD4 memory T cells defined by expression of CCR7 and CD27. J.Immunol., 175 (10): 6489-6497
Gasser, S., Orsulic, S., Brown, E. J. et al (2005) The DNA damage pathway regulates innate immune system ligands of the NKG2D receptor. Nature, 436 (7054): 1186-1190
Geoffroy-Perez, B., Janin, N., Ossian, K. et al (2002) Variation in breast cancer risk of heterozygotes for ataxia-telangiectasia according to environmental factors. Int.J.Cancer, 99 (4): 619-623
Geserick, P., Drewniok, C., Hupe, M. et al (2008) Suppression of cFLIP is sufficient to sensitize human melanoma cells to T. Oncogene, 27 (22): 3211-3220
Giovannetti, A., Mazzetta, F., Caprini, E. et al (2002) Skewed T-cell receptor repertoire, decreased thymic output, and predominance of terminally differentiated T cells in ataxia telangiectasia. Blood, 100 (12): 4082-4089
Godfrey, D. I., Stankovic, S. and Baxter, A. G. (2010) Raising the NKT cell family. Nat.Immunol., 11 (3): 197-206
Griffith, T. S., Brunner, T., Fletcher, S. M. et al (1995) Fas Ligand-Induced Apoptosis as a Mechanism of Immune Privilege. Science, 270 (5239): 1189-1192
Groh, V., Wu, J., Yee, C. et al (2002) Tumour-derived soluble MIC ligands impair expression of NKG2D and T-cell activation. Nature, 419 (6908): 734-738
Gueven, N., Luff, J., Peng, C. et al (2006) Dramatic extension of tumor latency and correction of neurobehavioral phenotype in Atm-mutant mice with a nitroxide antioxidant. Free Radic.Biol.Med., 41 (6): 992-1000
Gumy-Pause, F., Wacker, P. and Sappino, A. P. (2003) ATM gene and lymphoid malignancies. Leukemia, 18 (2): 238-242
References
366
Gupta, S. (2005) Molecular mechanisms of apoptosis in the cells of the immune system in human aging. Immunol.Rev., 205 114-129
Gupta, S. and Gollapudi, S. (2008) CD95-mediated apoptosis in naive, central and effector memory subsets of CD4+ and CD8+ T cells in aged humans. Exp.Gerontol., 43 (4): 266-274
Gupta, S., Kim, C., Yel, L. et al (2004) A role of fas-associated death domain (FADD) in increased apoptosis in aged humans. J.Clin.Immunol., 24 (1): 24-29
Hahne, M., Renno, T., Schroeter, M. et al (1996a) Activated B cells express functional Fas ligand. European Journal of Immunology, 26 (3): 721-724
Hahne, M., Rimoldi, D., Schroter, M. et al (1996b) Melanoma Cell Expression of Fas(Apo-1/CD95) Ligand: Implications for Tumor Immune Escape. Science, 274 (5291): 1363-1366
Hao, Z., Duncan, G. S., Seagal, J. et al (2008) Fas Receptor Expression in Germinal-Center B Cells Is Essential for T and B Lymphocyte Homeostasis. Immunity, 29 (4): 615-627
Heikkinen, K., Karppinen, S. M., Soini, Y. et al (2003) Mutation screening of Mre11 complex genes: indication of RAD50 involvement in breast and ovarian cancer susceptibility. J.Med.Genet., 40 (12): p. e131
Hildeman, D. A., Mitchell, T., Teague, T. K. et al (1999) Reactive oxygen species regulate activation-induced T cell apoptosis. Immunity., 10 (6): 735-744
Hintzen, R. Q., de, J. R., Lens, S. M. et al (1993) Regulation of CD27 expression on subsets of mature T-lymphocytes. J.Immunol., 151 (5): 2426-2435
Hoves, S., Trapani, J. A. and Voskoboinik, I. (2010) The battlefield of perforin/granzyme cell death pathways. J.Leukoc.Biol., 87 (2): 237-243
Hu, H. and Gatti, R. A. (2008) New approaches to treatment of primary immunodeficiencies: fixing mutations with chemicals. Curr.Opin.Allergy Clin.Immunol., 8 (6): 540-546
Ito, K., Hirao, A., Arai, F. et al (2004) Regulation of oxidative stress by ATM is required for self-renewal of haematopoietic stem cells. Nature, 431 (7011): 997-1002
Ivanov, V. N., Zhou, H., Partridge, M. A. et al (2009) Inhibition of Ataxia Telangiectasia Mutated Kinase Activity Enhances TRAIL-Mediated Apoptosis in Human Melanoma Cells. Cancer Research, 69 (8): 3510-3519
Kamsler, A., Daily, D., Hochman, A. et al (2001) Increased oxidative stress in ataxia telangiectasia evidenced by alterations in redox state of brains from Atm-deficient mice. Cancer Res., 61 (5): 1849-1854
Khan, N., Shariff, N., Cobbold, M. et al (2002) Cytomegalovirus seropositivity drives the CD8 T cell repertoire toward greater clonality in healthy elderly individuals. J.Immunol., 169 (4): 1984-1992
Kim, J. and Wong, P. K. (2009a) Loss of ATM impairs proliferation of neural stem cells through oxidative stress-mediated p38 MAPK signaling. Stem Cells, 27 (8): 1987-1998
References
367
Kim, J. and Wong, P. K. (2009b) Oxidative stress is linked to ERK1/2-p16 signaling-mediated growth defect in ATM-deficient astrocytes. Journal of Biological Chemistry, 284 (21): 14396-14404
Klas, C., Debatin, K. M., Jonker, R. R. et al (1993) Activation interferes with the APO-1 pathway in mature human T cells. International Immunology, 5 (6): 625-630
Kodama, M., Otsubo, C., Hirota, T. et al (2010) Requirement of ATM for Rapid p53 Phosphorylation at Ser46 without Ser/Thr-Gln Sequences. Molecular and Cellular Biology, p. MCB
Kotnis, A., Du, L., Liu, C. et al (2009) Non-homologous end joining in class switch recombination: the beginning of the end. Philos.Trans.R.Soc.Lond B Biol.Sci., 364 (1517): 653-665
Kozlov, S. V., Graham, M. E., Peng, C. et al (2006) Involvement of novel autophosphorylation sites in ATM activation. EMBO J., 25 (15): 3504-3514
Krammer, P. H. (2000) CD95's deadly mission in the immune system. Nature, 407 (6805): 789-795
Krueger, A., Schmitz, I., Baumann, S. et al (2001) Cellular FLICE-inhibitory protein splice variants inhibit different steps of caspase-8 activation at the CD95 death-inducing signaling complex. Journal of Biological Chemistry, 276 (23): 20633-20640
Lakin, N. D., Weber, P., Stankovic, T. et al (1996) Analysis of the ATM protein in wild-type and ataxia telangiectasia cells. Oncogene, 13 (12): 2707-2716
Latinis, K. M., Carr, L. L., Peterson, E. J. et al (1997) Regulation of CD95 (Fas) ligand expression by TCR-mediated signaling events. J.Immunol., 158 (10): 4602-4611
Laurence, J., Mitra, D., Steiner, M. et al (1996) Apoptotic depletion of CD4+ T cells in idiopathic CD4+ T lymphocytopenia. J.Clin.Invest, 97 (3): 672-680
Lavin, M. F. (2008) Ataxia-telangiectasia: from a rare disorder to a paradigm for cell signalling and cancer. Nat.Rev.Mol.Cell Biol., 9 (10): 759-769
Lavin, M. F., Birrell, G., Chen, P. et al (2005) ATM signaling and genomic stability in response to DNA damage. Mutat.Res., 569 (1-2): 123-132
Lavin, M. F., Gueven, N., Bottle, S. et al (2007) Current and potential therapeutic strategies for the treatment of ataxia-telangiectasia. Br.Med.Bull., 81-82 129-147
Le Clorennec, C., Ouk, T. S., Youlyouz-Marfak, I. et al (2008) Molecular Basis of Cytotoxicity of Epstein-Barr Virus (EBV) Latent Membrane Protein 1 (LMP1) in EBV Latency III B Cells: LMP1 Induces Type II Ligand-Independent Autoactivation of CD95/Fas with Caspase 8-Mediated Apoptosis. The Journal of Virology, 82 (13): 6721-6733
Le Clorennec, C., Youlyouz-Marfak, I., Adriaenssens, E. et al (2006) EBV latency III immortalization program sensitizes B cells to induction of CD95-mediated apoptosis via LMP1: role of NF-{kappa}B, STAT1, and p53. Blood, 107 (5): 2070-2078
References
368
Lefton-Greif, M. A., Crawford, T. O., Winkelstein, J. A. et al (2000) Oropharyngeal dysphagia and aspiration in patients with ataxia-telangiectasia. J.Pediatr., 136 (2): 225-231
Li, X., Fujio, M., Imamura, M. et al (2010) Design of a potent CD1d-binding NKT cell ligand as a vaccine adjuvant. Proc.Natl.Acad.Sci.U.S.A, 107 (29): 13010-13015
Li, X. and Heyer, W. D. (2008) Homologous recombination in DNA repair and DNA damage tolerance. Cell Res., 18 (1): 99-113
Lim, M. S., Straus, S. E., Dale, J. K. et al (1998) Pathological Findings in Human Autoimmune Lymphoproliferative Syndrome. American Journal of Pathology, 153 (5): 1541-1550
Lobrich, M. and Jeggo, P. A. (2005a) Harmonising the response to DSBs: a new string in the ATM bow. DNA Repair (Amst), 4 (7): 749-759
Lobrich, M. and Jeggo, P. A. (2005b) The two edges of the ATM sword: Co-operation between repair and checkpoint functions. Radiotherapy and Oncology, 76 (2): 112-118
Luciani, F., Turchetti, G., Franceschi, C. et al (2001) A mathematical model for the immunosenescence. Riv.Biol., 94 (2): 305-318
Lumsden, J. M., McCarty, T., Petiniot, L. K. et al (2004) Immunoglobulin class switch recombination is impaired in Atm-deficient mice. The Journal of Experimental Medicine, 200 (9): 1111-1121
Lundy, S. (2009) Killer B lymphocytes: the evidence and the potential. Inflammation Research, 58 (7): 345-357
Lynch, H. E., Goldberg, G. L., Chidgey, A. et al (2009) Thymic involution and immune reconstitution. Trends Immunol., 30 (7): 366-373
MacFarlane, M., Harper, N., Snowden, R. et al (2001) Mechanisms of resistance to TRAIL-induced apoptosis in primary B cell chronic lymphocytic leukaemia. Oncogene, 21, 44 6809-6818
Matei, I. R., Guidos, C. J. and Danska, J. S. (2006) ATM-dependent DNA damage surveillance in T-cell development and leukemogenesis: the DSB connection. Immunological Reviews, 209 (1): 142-158
Matsuoka, S., Huang, M. and Elledge, S. J. (1998) Linkage of ATM to cell cycle regulation by the Chk2 protein kinase. Science, 282 (5395): 1893-1897
Matsuoka, S., Rotman, G., Ogawa, A. et al (2000) Ataxia telangiectasia-mutated phosphorylates Chk2 in vivo and in vitro. Proc.Natl.Acad.Sci.U.S.A, 97 (19): 10389-10394
Matutes, E., Brito-Babapulle, V., Swansbury, J. et al (1991) Clinical and laboratory features of 78 cases of T-prolymphocytic leukemia. Blood, 78 (12): 3269-3274
Mazzucchelli, R. and Durum, S. K. (2007) Interleukin-7 receptor expression: intelligent design. Nat.Rev.Immunol., 7 (2): 144-154
References
369
McConville, C. M., Stankovic, T., Byrd, P. J. et al (1996) Mutations associated with variant phenotypes in ataxia-telangiectasia. Am.J.Hum.Genet., 59 (2): 320-330
McGrath-Morrow, S. A., Gower, W. A., Rothblum-Oviatt, C. et al (2010) Evaluation and management of pulmonary disease in ataxia-telangiectasia. Pediatr.Pulmonol., 45 (9): 847-859
McKallip, R. J., Lombard, C., Sun, J. et al (2010) Plumbagin-induced apoptosis in lymphocytes is mediated through increased reactive oxygen species production, upregulation of Fas, and activation of the caspase cascade. Toxicol.Appl.Pharmacol., 247 (1): 41-52
Metcalfe, J. A., Parkhill, J., Campbell, L. et al (1996) Accelerated telomere shortening in ataxia telangiectasia. Nat.Genet., 13 (3): 350-353
Meyer-Olson, D., Simons, B. C., Conrad, J. A. et al (2010) Clonal expansion and TCR-independent differentiation shape the HIV-specific CD8+ effector-memory T-cell repertoire in vivo. Blood, 116 (3): 396-405
Micheli, R., Pirovano, S., Calandra, G. et al (2003) Low thymic output and reduced heterogeneity of alpha/beta, but not gamma/delta, T lymphocytes in infants with ataxia-telangiectasia. Neuropediatrics, 34 (3): 165-167
Mizuno, T., Zhong, X. and Rothstein, T. L. (2003) Fas-induced apoptosis in B cells. Apoptosis, 8 (5): 451-460
Moreira, M. C., Barbot, C., Tachi, N. et al (2001) The gene mutated in ataxia-ocular apraxia 1 encodes the new HIT/Zn-finger protein aprataxin. Nat.Genet., 29 (2): 189-193
Moreira, M. C., Klur, S., Watanabe, M. et al (2004) Senataxin, the ortholog of a yeast RNA helicase, is mutant in ataxia-ocular apraxia 2. Nat.Genet., 36 (3): 225-227
Morrell, D., Cromartie, E. and Swift, M. (1986) Mortality and cancer incidence in 263 patients with ataxia-telangiectasia. J Natl Cancer Inst, 77 (1): 89-92
Morrison, C., Sonoda, E., Takao, N. et al (2000) The controlling role of ATM in homologous recombinational repair of DNA damage. EMBO J., 19 (3): 463-471
Nasi, M., Troiano, L., Lugli, E. et al (2006) Thymic output and functionality of the IL-7/IL-7 receptor system in centenarians: implications for the neolymphogenesis at the limit of human life. Aging Cell, 5 (2): 167-175
Nilsson, N., Ingvarsson, S. and Borrebaeck, C. A. (2000) Immature B cells in bone marrow express Fas/FasL. Scand.J.Immunol., 51 (3): 279-284
Nowak, D., Le Toriellec, E., Stern, M. H. et al (2009) Molecular allelokaryotyping of T-cell prolymphocytic leukemia cells with high density single nucleotide polymorphism arrays identifies novel common genomic lesions and acquired uniparental disomy. Haematologica, 94 (4): 518-527
Nowak-Wegrzyn, A., Crawford, T. O., Winkelstein, J. A. et al (2004) Immunodeficiency and infections in ataxia-telangiectasia. J.Pediatr., 144 (4): 505-511
References
370
O'Connell, J., O'Sullivan, G. C., Collins, J. K. et al (1996) The Fas counterattack: Fas-mediated T cell killing by colon cancer cells expressing Fas ligand. The Journal of Experimental Medicine, 184 (3): 1075-1082
Ogawa, T., Kitagawa, M. and Hirokawa, K. (2000) Age-related changes of human bone marrow: a histometric estimation of proliferative cells, apoptotic cells, T cells, B cells and macrophages. Mech.Ageing Dev., 117 (1-3): 57-68
Oliveira, B. F., Nogueira-Machado, J. A. and Chaves, M. M. (2010) The role of oxidative stress in the aging process. ScientificWorldJournal., 10 1121-1128
Olsen, J. H., Hahnemann, J. M., Borresen-Dale, A. L. et al (2001) Cancer in Patients With Ataxia-Telangiectasia and in Their Relatives in the Nordic Countries. JNCI Journal of the National Cancer Institute, 93 (2): 121-127
Overwijk, W. W. and Schluns, K. S. (2009) Functions of gammaC cytokines in immune homeostasis: current and potential clinical applications. Clin.Immunol., 132 (2): 153-165
Pan, Q., Petit-Frere, C., Lahdesmaki, A. et al (2002) Alternative end joining during switch recombination in patients with ataxia-telangiectasia. Eur.J.Immunol., 32 (5): 1300-1308
Pan-Hammarstrom, Q., Dai, S., Zhao, Y. et al (2003) ATM is not required in somatic hypermutation of VH, but is involved in the introduction of mutations in the switch mu region. J.Immunol., 170 (7): 3707-3716
Pan-Hammarstrom, Q., Lahdesmaki, A., Zhao, Y. et al (2006) Disparate roles of ATR and ATM in immunoglobulin class switch recombination and somatic hypermutation. The Journal of Experimental Medicine, 203 (1): 99-110
Pappworth, I. Y., Wang, E. C. and Rowe, M. (2007) The switch from latent to productive infection in epstein-barr virus-infected B cells is associated with sensitization to NK cell killing. The Journal of Virology, 81 (2): 474-482
Park, J. H., Yu, Q., Erman, B. et al (2004) Suppression of IL7Ralpha transcription by IL-7 and other prosurvival cytokines: a novel mechanism for maximizing IL-7-dependent T cell survival. Immunity., 21 (2): 289-302
Pashankar, F., Singhal, V., Akabogu, I. et al (2006) Intact T cell responses in ataxia telangiectasia. Clin.Immunol., 120 (2): 156-162
Pawelec, G., Larbi, A. and Derhovanessian, E. (2010) Senescence of the human immune system. J.Comp Pathol., 142 Suppl 1 p. S39-S44
Poppema, S., Maggio, E. and van den Berg, A. (2004) Development of lymphoma in Autoimmune Lymphoproliferative Syndrome (ALPS) and its relationship to Fas gene mutations. Leuk.Lymphoma, 45 (3): 423-431
Potestio, M., Pawelec, G., Di, L. G. et al (1999) Age-related changes in the expression of CD95 (APO1/FAS) on blood lymphocytes. Exp.Gerontol., 34 (5): 659-673
References
371
Pradelli, L. A., Beneteau, M. and Ricci, J. E. (2010) Mitochondrial control of caspase-dependent and -independent cell death. Cell Mol.Life Sci., 67 (10): 1589-1597
Reichenbach, J., Schubert, R., Schindler, D. et al (2002) Elevated oxidative stress in patients with ataxia telangiectasia. Antioxid.Redox.Signal., 4 (3): 465-469
Reina-San-Martin, B., Chen, H. T., Nussenzweig, A. et al (2004) ATM is required for efficient recombination between immunoglobulin switch regions. The Journal of Experimental Medicine, 200 (9): 1103-1110
Reliene, R., Fleming, S. M., Chesselet, M. F. et al (2008) Effects of antioxidants on cancer prevention and neuromotor performance in Atm deficient mice. Food Chem.Toxicol., 46 (4): 1371-1377
Reliene, R. and Schiestl, R. H. (2006) Glutathione depletion by buthionine sulfoximine induces DNA deletions in mice. Carcinogenesis, 27 (2): 240-244
Reliene, R. and Schiestl, R. H. (2007) Antioxidants suppress lymphoma and increase longevity in Atm-deficient mice. J.Nutr., 137 (1 Suppl): 229S-232S
Rethi, B., Vivar, N., Sammicheli, S. et al (2008) Priming of T cells to Fas-mediated proliferative signals by interleukin-7. Blood, 112 (4): 1195-1204
Roger, P. M., Bernard-Pomier, G., Counillon, E. et al (1999) Overexpression of Fas/CD95 and Fas-induced apoptosis in a patient with idiopathic CD4+ T lymphocytopenia. Clin.Infect.Dis., 28 (5): 1012-1016
Roos, W. P. and Kaina, B. (2006) DNA damage-induced cell death by apoptosis. Trends Mol.Med., 12 (9): 440-450
Rossi, D. J., Jamieson, C. H. and Weissman, I. L. (2008) Stems cells and the pathways to aging and cancer. Cell, 132 (4): 681-696
Rotman, G. and Shiloh, Y. (1997) Ataxia-telangiectasia: is ATM a sensor of oxidative damage and stress? Bioessays, 19 (10): 911-917
Rowe, M., Evans, H. S., Young, L. S. et al (1987) Monoclonal Antibodies to the Latent Membrane Protein of Epstein-Barr Virus Reveal Heterogeneity of the Protein and Inducible Expression in Virus-transformed Cells. Journal of General Virology, 68 (6): 1575-1586
Russo, I., Cosentino, C., Del, G. E. et al (2009) In ataxia-teleangiectasia betamethasone response is inversely correlated to cerebellar atrophy and directly to antioxidative capacity. Eur.J.Neurol., 16 (6): 755-759
Sadighi Akha, A. A., Humphrey, R. L., Winkelstein, J. A. et al (1999) Oligo-/monoclonal gammopathy and hypergammaglobulinemia in ataxia-telangiectasia. A study of 90 patients. Medicine (Baltimore), 78 (6): 370-381
Sallusto, F., Geginat, J. and Lanzavecchia, A. (2004) Central memory and effector memory T cell subsets: function, generation, and maintenance. Annu.Rev.Immunol., 22 745-763
References
372
Sallusto, F., Lenig, D., Forster, R. et al (1999) Two subsets of memory T lymphocytes with distinct homing potentials and effector functions. Nature, 401 (6754): 708-712
Sansoni, P., Cossarizza, A., Brianti, V. et al (1993) Lymphocyte subsets and natural killer cell activity in healthy old people and centenarians. Blood, 82 (9): 2767-2773
Sansoni, P., Vescovini, R., Fagnoni, F. et al (2008) The immune system in extreme longevity. Exp.Gerontol., 43 (2): 61-65
Savitsky, K., Bar-Shira, A., Gilad, S. et al (1995) A single ataxia telangiectasia gene with a product similar to PI-3 kinase. Science, 268 (5218): 1749-1753
Schubert, R., Reichenbach, J., Royer, N. et al (2000) Spontaneous and oxidative stress-induced programmed cell death in lymphocytes from patients with ataxia telangiectasia (AT). Clinical & Experimental Immunology, 119 (1): 140-147
Schubert, R., Reichenbach, J. and Zielen, S. (2002) Deficiencies in CD4+ and CD8+ T cell subsets in ataxia telangiectasia. Clin.Exp.Immunol., 129 (1): 125-132
Shiloh, Y. (2003) ATM and related protein kinases: safeguarding genome integrity. Nat.Rev.Cancer, 3 (3): 155-168
Siegel, R. M., Ka-Ming Chan, F., Chun, H. J. et al (2000) The multifaceted role of Fas signaling in immune cell homeostasis and autoimmunity. Nat Immunol, 1 (6): 469-474
Smith, G. C. M., d'adda di Fagagna, F., Lakin, N. D. et al (1999) Cleavage and Inactivation of ATM during Apoptosis. Molecular and Cellular Biology, 19 (9): 6076-6084
Sneller, M. C., Wang, J., Dale, J. K. et al (1997) Clinical, Immunologic, and Genetic Features of an Autoimmune Lymphoproliferative Syndrome Associated With Abnormal Lymphocyte Apoptosis. Blood, 89 (4): 1341-1348
So, S., Davis, A. J. and Chen, D. J. (2009) Autophosphorylation at serine 1981 stabilizes ATM at DNA damage sites. J.Cell Biol., 187 (7): 977-990
Sondergaard, H. and Skak, K. (2009) IL-21: roles in immunopathology and cancer therapy. Tissue Antigens, 74 (6): 467-479
Stagni, V., di Bari, M. G., Cursi, S. et al (2008) ATM kinase activity modulates Fas sensitivity through the regulation of FLIP in lymphoid cells. Blood, 111 (2): 829-837
Stankovic, T., Stewart, G. S., Byrd, P. et al (2002) ATM mutations in sporadic lymphoid tumours. Leuk.Lymphoma, 43 (8): 1563-1571
Stankovic, T., Weber, P., Stewart, G. et al (1999) Inactivation of ataxia telangiectasia mutated gene in B-cell chronic lymphocytic leukaemia. The Lancet, 353 (9146): 26-29
Staples, E. R., McDermott, E. M., Reiman, A. et al (2008) Immunodeficiency in ataxia telangiectasia is correlated strongly with the presence of two null mutations in the ataxia telangiectasia mutated gene. Clin.Exp.Immunol., 153 (2): 214-220
References
373
Steinmann, G. G. (1986) Changes in the human thymus during aging. Curr.Top.Pathol., 75 43-88
Stewart, G. S., Maser, R. S., Stankovic, T. et al (1999) The DNA double-strand break repair gene hMRE11 is mutated in individuals with an ataxia-telangiectasia-like disorder. Cell, 99 (6): 577-587
Stewart, G. S., Panier, S., Townsend, K. et al (2009) The RIDDLE syndrome protein mediates a ubiquitin-dependent signaling cascade at sites of DNA damage. Cell, 136 (3): 420-434
Stewart, G. S., Stankovic, T., Byrd, P. J. et al (2007) RIDDLE immunodeficiency syndrome is linked to defects in 53BP1-mediated DNA damage signaling. Proc.Natl.Acad.Sci.U.S.A, 104 (43): 16910-16915
Stoppa-Lyonnet, D., Soulier, J., Lauge, A. et al (1998) Inactivation of the ATM Gene in T-Cell Prolymphocytic Leukemias. Blood, 91 (10): 3920-3926
Strasser, A., Jost, P. J. and Nagata, S. (2009) The Many Roles of FAS Receptor Signaling in the Immune System. Immunity, 30 (2): 180-192
Straus, S. E., Jaffe, E. S., Puck, J. M. et al (2001) The development of lymphomas in families with autoimmune lymphoproliferative syndrome with germline Fas mutations and defective lymphocyte apoptosis. Blood, 98 (1): 194-200
Sun, Y., Jiang, X., Chen, S. et al (2005) A role for the Tip60 histone acetyltransferase in the acetylation and activation of ATM. Proc.Natl.Acad.Sci.U.S.A, 102 (37): 13182-13187
Sun, Y., Xu, Y., Roy, K. et al (2007) DNA damage-induced acetylation of lysine 3016 of ATM activates ATM kinase activity. Mol.Cell Biol., 27 (24): 8502-8509
Swift, M., Morrell, D., Massey, R. B. et al (1991) Incidence of cancer in 161 families affected by ataxia-telangiectasia. N.Engl.J.Med., 325 (26): 1831-1836
Syllaba, K. and Henner, K. (1926) Contribution a l'indépendance de l'athétose double idiopathique et congénitale. Atteinte familiale, syndrome dystrophique, signe du résau vasculaire conjonctival, intégrité psychique. Rev.Neurol., 1 541-562
Takahashi, T., Tanaka, M., Brannan, C. I. et al (1994) Generalized lymphoproliferative disease in mice, caused by a point mutation in the fas ligand. Cell, 76 (6): 969-976
Takahashi, Y., Ohta, H. and Takemori, T. (2001) Fas Is Required for Clonal Selection in Germinal Centers and the Subsequent Establishment of the Memory B Cell Repertoire. Immunity, 14 (2): 181-192
Takashima, H., Boerkoel, C. F., John, J. et al (2002) Mutation of TDP1, encoding a topoisomerase I-dependent DNA damage repair enzyme, in spinocerebellar ataxia with axonal neuropathy. Nat.Genet., 32 (2): 267-272
Tauchi, H., Matsuura, S., Kobayashi, J. et al (2002) Nijmegen breakage syndrome gene, NBS1, and molecular links to factors for genome stability. Oncogene, 21 (58): 8967-8980
References
374
Taylor, A. M. and Byrd, P. J. (2005) Molecular pathology of ataxia telangiectasia. J.Clin.Pathol., 58 (10): 1009-1015
Taylor, A. M., Groom, A. and Byrd, P. J. (2004) Ataxia-telangiectasia-like disorder (ATLD)-its clinical presentation and molecular basis. DNA Repair (Amst), 3 (8-9): 1219-1225
Taylor, A. M., Metcalfe, J. A., Thick, J. et al (1996) Leukemia and lymphoma in ataxia telangiectasia. Blood, 87 (2): 423-438
Taylor, A. M. R., Harnden, D. G., Arlette, C. F. et al (1975) Ataxia telangiectasia: a human mutation with abnormal radiation sensitivity. Nature, 258 (5534): 427-429
Tomiyama, H., Matsuda, T. and Takiguchi, M. (2002) Differentiation of human CD8(+) T cells from a memory to memory/effector phenotype. J.Immunol., 168 (11): 5538-5550
Tran, H., Nourse, J., Hall, S. et al (2008) Immunodeficiency-associated lymphomas. Blood Reviews, 22 (5): 261-281
Uziel, T., Savitsky, K., Platzer, M. et al (1996) Genomic Organization of the ATM gene. Genomics, 33 (2): 317-320
van Gent, D. C. and van der Burg, M. (2007) Non-homologous end-joining, a sticky affair. Oncogene, 26 (56): 7731-7740
Veneri, D., Ortolani, R., Franchini, M. et al (2009) Expression of CD27 and CD23 on peripheral blood B lymphocytes in humans of different ages. Blood Transfus., 7 (1): 29-34
Vit, J. P., Moustacchi, E. and Rosselli, F. (2000) ATM protein is required for radiation-induced apoptosis and acts before mitochondrial collapse. International Journal of Radiation Biology, 76 (6): 841-851
Waldmann, T. A., Broder, S., Goldman, C. K. et al (1983) Disorders of B cells and helper T cells in the pathogenesis of the immunoglobulin deficiency of patients with ataxia telangiectasia. J.Clin.Invest, 71 (2): 282-295
Wallin, R. P. A., Screpanti, V., Michaëlsson, J. et al (2003) Regulation of perforin-independent NK cell-mediated cytotoxicity. European Journal of Immunology, 33 (10): 2727-2735
Waltes, R., Kalb, R., Gatei, M. et al (2009) Human RAD50 deficiency in a Nijmegen breakage syndrome-like disorder. Am.J.Hum.Genet., 84 (5): 605-616
Wang, J., Pabla, N., Wang, C. Y. et al (2006) Caspase-mediated cleavage of ATM during cisplatin-induced tubular cell apoptosis: inactivation of its kinase activity toward p53. AJP - Renal Physiology, 291 (6): p. F1300-F1307
Watanabe-Fukunaga, R., Brannan, C. I., Jenkins, N. et al (1992) Lymphoproliferation disorder in mice explained by defects in Fas antigen that mediates apoptosis. Nature,
Watters, D., Khanna, K. K., Beamish, H. et al (1997) Cellular localisation of the ataxia-telangiectasia (ATM) gene product and discrimination between mutated and normal forms. Oncogene, 14 (16): 1911-1921
References
375
Weemaes, C. M., Smeets, D. F. and van der Burgt, C. J. (1994) Nijmegen Breakage syndrome: a progress report. Int.J.Radiat.Biol., 66 (6 Suppl): p. S185-S188
Weninger, W., Crowley, M. A., Manjunath, N. et al (2001) Migratory properties of naive, effector, and memory CD8(+) T cells. The Journal of Experimental Medicine, 194 (7): 953-966
Wong, K. K., Maser, R. S., Bachoo, R. M. et al (2003) Telomere dysfunction and Atm deficiency compromises organ homeostasis and accelerates ageing. Nature, 421 (6923): 643-648
Woods, C. G., Bundey, S. E. and Taylor, A. M. (1990) Unusual features in the inheritance of ataxia telangiectasia. Hum.Genet., 84 (6): 555-562
Wu, J., Chalupny, N. J., Manley, T. J. et al (2003) Intracellular retention of the MHC class I-related chain B ligand of NKG2D by the human cytomegalovirus UL16 glycoprotein. J.Immunol., 170 (8): 4196-4200
Xerri, L., Devilard, E., Hassoun, J. et al (1997) Malignant and reactive cells from human lymphomas frequently express Fas ligand but display a different sensitivity to Fas-mediated apoptosis. Leukaemia, 11 (11): 1868-1877
Xu, Y., Ashley, T., Brainerd, E. E. et al (1996) Targeted disruption of ATM leads to growth retardation, chromosomal fragmentation during meiosis, immune defects, and thymic lymphoma. Genes Dev., 10 (19): 2411-2422
Yamaguchi, M., Yamamoto, K., Miki, T. et al (2003) T-cell prolymphocytic leukemia with der(11)t(1;11)(q21;q23) and ATM deficiency. Cancer Genetics and Cytogenetics, 146 (1): 22-26
Yu, K. O. and Porcelli, S. A. (2005) The diverse functions of CD1d-restricted NKT cells and their potential for immunotherapy. Immunol.Lett., 100 (1): 42-55
Yuille, M., Coignet, L., Abraham, S. et al (1998) ATM is usually rearranged in T-cell prolymphocytic leukaemia. Oncogene, 16 (6): 789-796
Zhang, X., Succi, J., Feng, Z. et al (2004) Artemis is a phosphorylation target of ATM and ATR and is involved in the G2/M DNA damage checkpoint response. Mol.Cell Biol., 24 (20): 9207-9220
Zhou, T., Lee, J. W., Tatavarthi, H. et al (2005) Deficiency in 3'-phosphoglycolate processing in human cells with a hereditary mutation in tyrosyl-DNA phosphodiesterase (TDP1). Nucleic Acids Res., 33 (1): 289-297
Zlotoff, D. A., Schwarz, B. A. and Bhandoola, A. (2008) The long road to the thymus: the generation, mobilization, and circulation of T-cell progenitors in mouse and man. Semin.Immunopathol., 30 (4): 371-382

Appendix
376
Appendix.
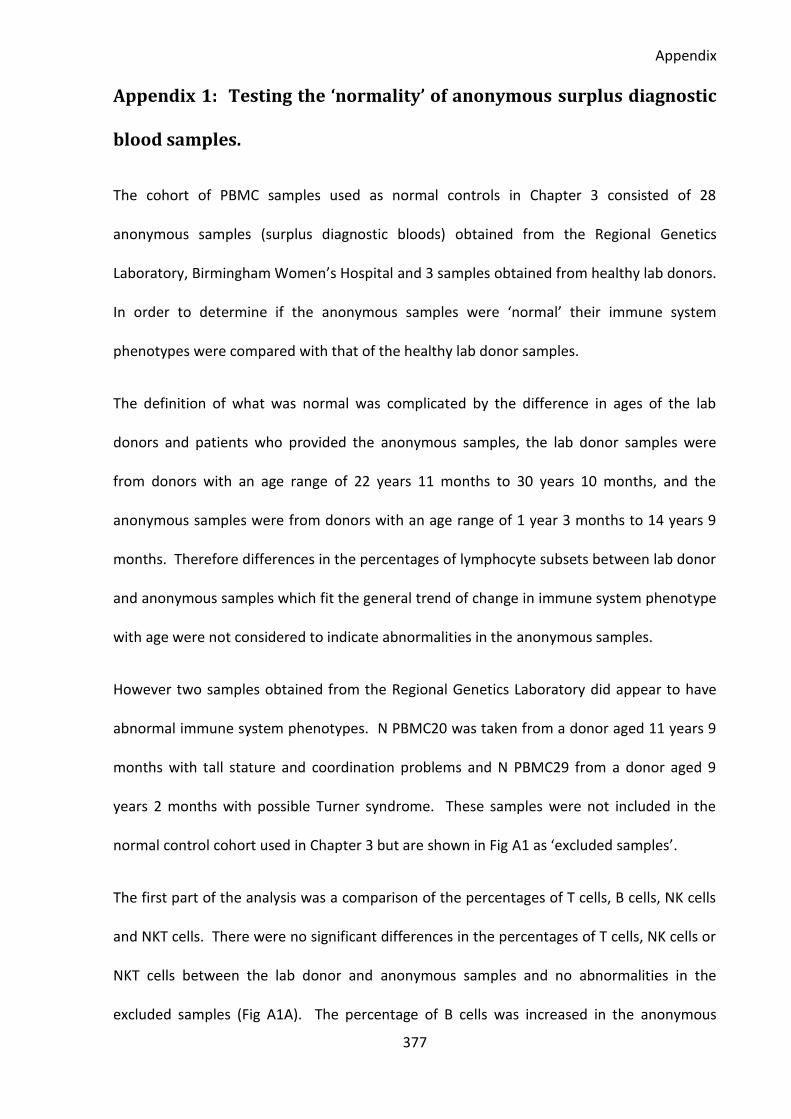
Appendix
377
Appendix 1: Testing the ‘normality’ of anonymous surplus diagnostic
blood samples.
The cohort of PBMC samples used as normal controls in Chapter 3 consisted of 28
anonymous samples (surplus diagnostic bloods) obtained from the Regional Genetics
Laboratory, Birmingham Women’s Hospital and 3 samples obtained from healthy lab donors.
In order to determine if the anonymous samples were ‘normal’ their immune system
phenotypes were compared with that of the healthy lab donor samples.
The definition of what was normal was complicated by the difference in ages of the lab
donors and patients who provided the anonymous samples, the lab donor samples were
from donors with an age range of 22 years 11 months to 30 years 10 months, and the
anonymous samples were from donors with an age range of 1 year 3 months to 14 years 9
months. Therefore differences in the percentages of lymphocyte subsets between lab donor
and anonymous samples which fit the general trend of change in immune system phenotype
with age were not considered to indicate abnormalities in the anonymous samples.
However two samples obtained from the Regional Genetics Laboratory did appear to have
abnormal immune system phenotypes. N PBMC20 was taken from a donor aged 11 years 9
months with tall stature and coordination problems and N PBMC29 from a donor aged 9
years 2 months with possible Turner syndrome. These samples were not included in the
normal control cohort used in Chapter 3 but are shown in Fig A1 as ‘excluded samples’.
The first part of the analysis was a comparison of the percentages of T cells, B cells, NK cells
and NKT cells. There were no significant differences in the percentages of T cells, NK cells or
NKT cells between the lab donor and anonymous samples and no abnormalities in the
excluded samples (Fig A1A). The percentage of B cells was increased in the anonymous
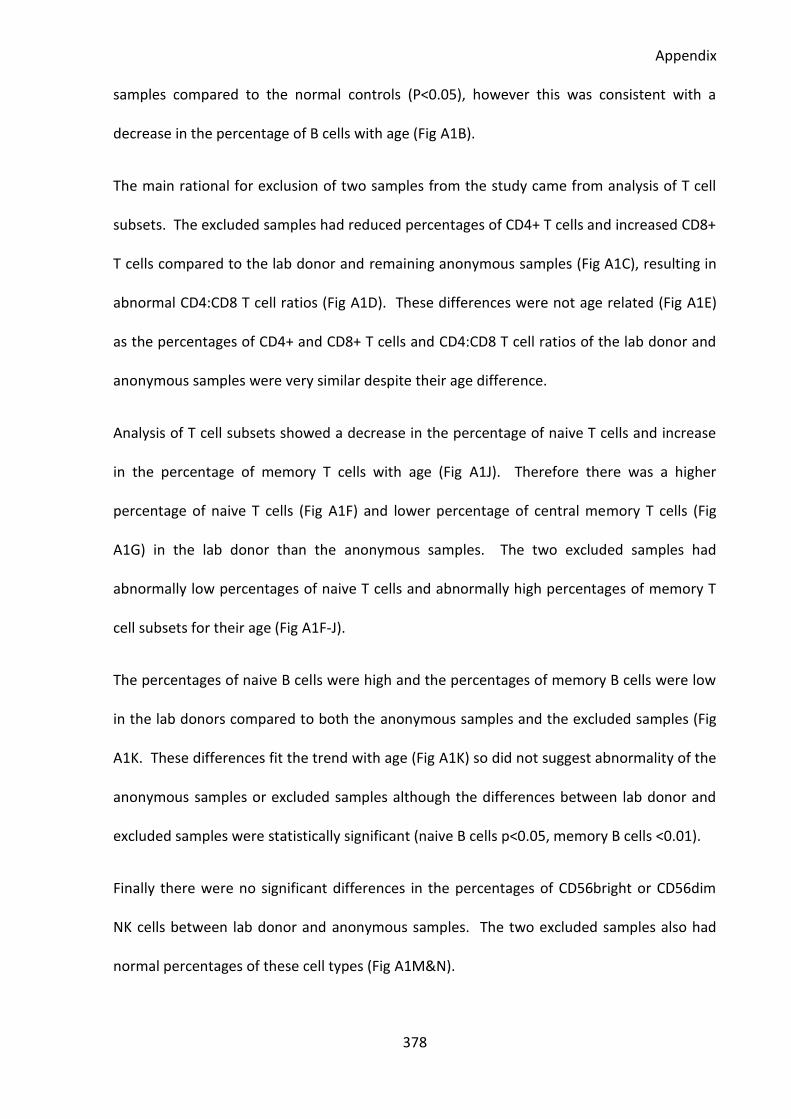
Appendix
378
samples compared to the normal controls (P<0.05), however this was consistent with a
decrease in the percentage of B cells with age (Fig A1B).
The main rational for exclusion of two samples from the study came from analysis of T cell
subsets. The excluded samples had reduced percentages of CD4+ T cells and increased CD8+
T cells compared to the lab donor and remaining anonymous samples (Fig A1C), resulting in
abnormal CD4:CD8 T cell ratios (Fig A1D). These differences were not age related (Fig A1E)
as the percentages of CD4+ and CD8+ T cells and CD4:CD8 T cell ratios of the lab donor and
anonymous samples were very similar despite their age difference.
Analysis of T cell subsets showed a decrease in the percentage of naive T cells and increase
in the percentage of memory T cells with age (Fig A1J). Therefore there was a higher
percentage of naive T cells (Fig A1F) and lower percentage of central memory T cells (Fig
A1G) in the lab donor than the anonymous samples. The two excluded samples had
abnormally low percentages of naive T cells and abnormally high percentages of memory T
cell subsets for their age (Fig A1F-J).
The percentages of naive B cells were high and the percentages of memory B cells were low
in the lab donors compared to both the anonymous samples and the excluded samples (Fig
A1K. These differences fit the trend with age (Fig A1K) so did not suggest abnormality of the
anonymous samples or excluded samples although the differences between lab donor and
excluded samples were statistically significant (naive B cells p<0.05, memory B cells <0.01).
Finally there were no significant differences in the percentages of CD56bright or CD56dim
NK cells between lab donor and anonymous samples. The two excluded samples also had
normal percentages of these cell types (Fig A1M&N).

Appendix
379
This analysis confirmed that with the exception of the two excluded samples the immune
system phenotypes of the anonymous samples were normal so they could be used as part of
a normal control cohort.
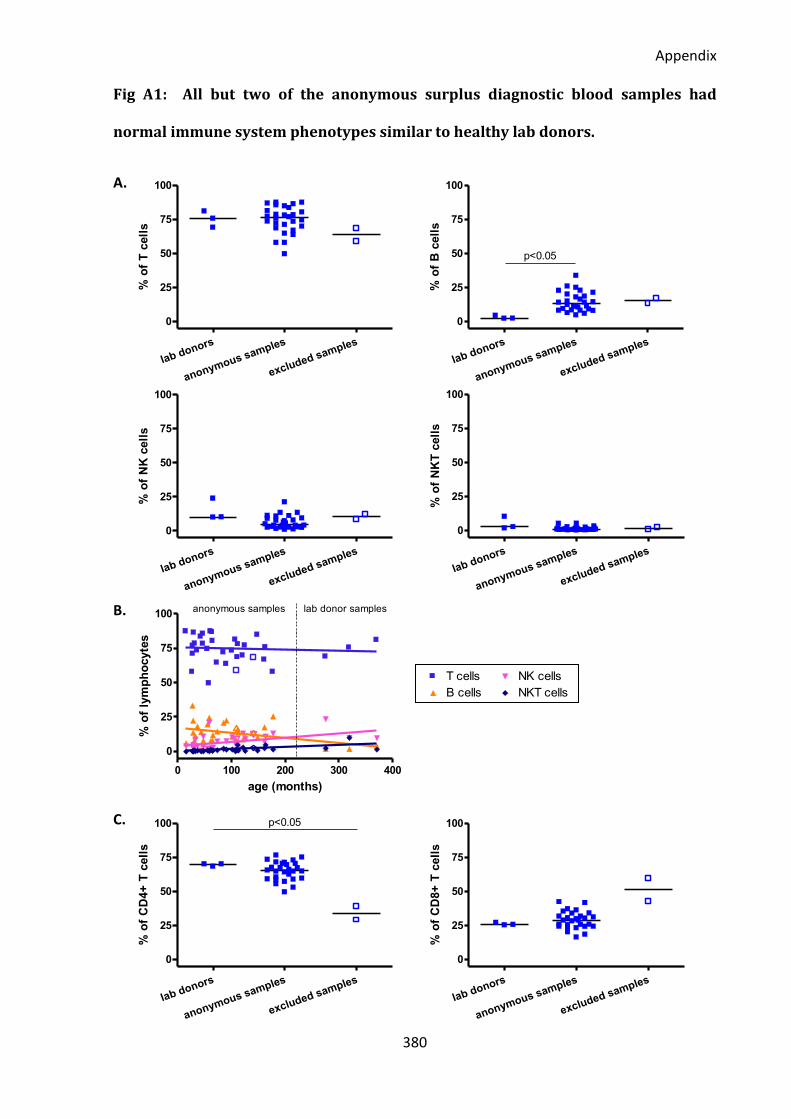
Appendix
380
0 100 200 300 4000
25
50
75
100T cells
B cells
NK cells
NKT cells
r=0.5955p=0.0003
r=0.3191p=ns
r=-0.0972p=ns
r=0.4498p=0.0086
age (months)
% o
f C
D95+
cell
s
lab donors
anonymous samples
excluded samples
0
25
50
75
100
% o
f T
cell
s
lab donors
anonymous samples
excluded samples
0
25
50
75
100
p<0.05
% o
f B
cell
s
lab donors
anonymous samples
excluded samples
0
25
50
75
100
% o
f N
K c
ell
s
lab donors
anonymous samples
excluded samples
0
25
50
75
100
% o
f N
KT
cell
s
0 100 200 300 400
0
25
50
75
100anonymous samples lab donor samples
age (months)
% o
f ly
mp
ho
cyte
s
lab donors
anonymous samples
excluded samples
0
25
50
75
100 p<0.05
% o
f C
D4+
T c
ell
s
lab donors
anonymous samples
excluded samples
0
25
50
75
100
% o
f C
D8+
T c
ell
s
Fig A1: All but two of the anonymous surplus diagnostic blood samples had
normal immune system phenotypes similar to healthy lab donors.
A.
B.
C.
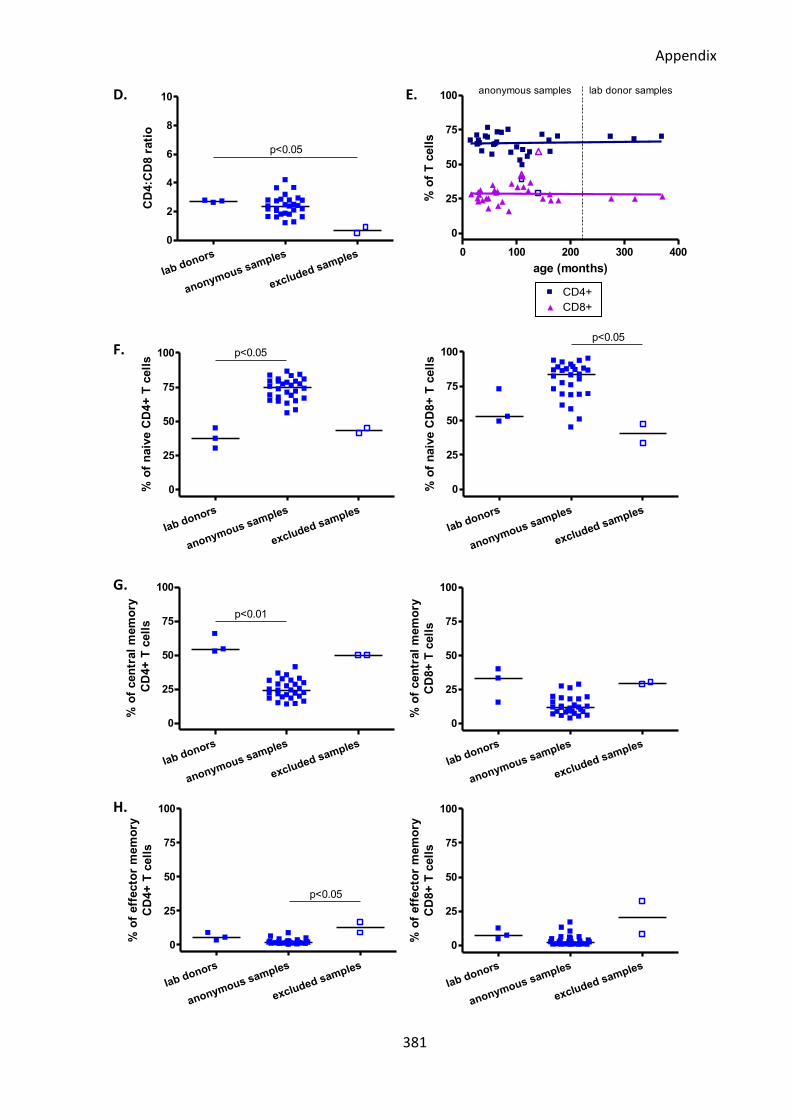
Appendix
381
0 100 200 300 400300
500
700
900CD4+
CD8+
r=-0.0871p=ns
r=-0.0425p=ns
normal
FasL
MF
I o
f F
asL
+ T
cell
slab donors
anonymous samples
excluded samples
0
2
4
6
8
10
p<0.05C
D4:C
D8 r
ati
o
0 100 200 300 400
0
25
50
75
100anonymous samples lab donor samples
age (months)
% o
f T
cell
s
lab donors
anonymous samples
excluded samples
0
25
50
75
100 p<0.05
% o
f n
aiv
e C
D4+
T c
ell
s
lab donors
anonymous samples
excluded samples
0
25
50
75
100
p<0.05
% o
f n
aiv
e C
D8+
T c
ell
s
lab donors
anonymous samples
excluded samples
0
25
50
75
100
p<0.05
% o
f eff
ecto
r m
em
ory
CD
4+
T c
ell
s
lab donors
anonymous samples
excluded samples
0
25
50
75
100
% o
f eff
ecto
r m
em
ory
CD
8+
T c
ell
s
lab donors
anonymous samples
excluded samples
0
25
50
75
100
p<0.01
% o
f cen
tral
mem
ory
CD
4+
T c
ell
s
lab donors
anonymous samples
excluded samples
0
25
50
75
100
% o
f cen
tral
mem
ory
CD
8+
T c
ell
s
D. E.
F.
G.
H.
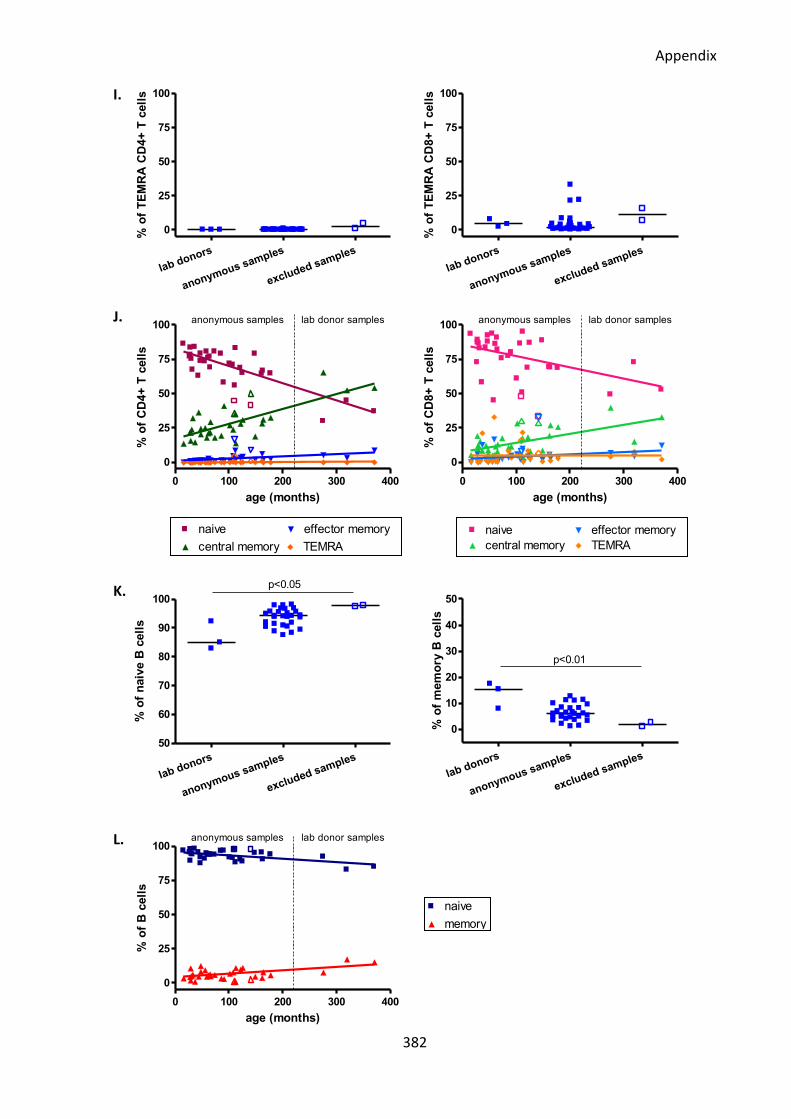
Appendix
382
0 100 200 300 4000
2500
5000
7500
10000naive
central memory
effector memory
TEMRA
r=0.1250p=ns
r=0.0429p=ns
r=0.0179p=ns
r=0.2714p=ns
age (months)
CD
95 M
FI
of
CD
4+
CD
95+
T c
ell
s
0 100 200 300 4000
2000
4000
6000naive
central memory
effector memory
TEMRA
r=0.3321p=ns
r=0.8000p=ns
r=0.3607p=ns
r=0.6000p=ns
age (months)
CD
95 M
FI
of
CD
8+
CD
95+
T c
ell
s
0 100 200 300 400
0
25
50
75
100naive
memory
r=-0.2071p=ns
r=0.2071p=ns
age (months)
% o
f B
cell
s
lab donors
anonymous samples
excluded samples
0
25
50
75
100
% o
f T
EM
RA
CD
4+
T c
ell
s
lab donors
anonymous samples
excluded samples
0
25
50
75
100
% o
f T
EM
RA
CD
8+
T c
ell
s
0 100 200 300 400
0
25
50
75
100lab donor samplesanonymous samples
age (months)
% o
f C
D4+
T c
ell
s
0 100 200 300 400
0
25
50
75
100anonymous samples lab donor samples
age (months)
% o
f C
D8+
T c
ell
s
lab donors
anonymous samples
excluded samples
0
10
20
30
40
50
p<0.01
% o
f m
em
ory
B c
ell
s
lab donors
anonymous samples
excluded samples
50
60
70
80
90
100
p<0.05
% o
f n
aiv
e B
cell
s
0 100 200 300 400
0
25
50
75
100anonymous samples lab donor samples
age (months)
% o
f B
cell
s
I.
J.
K.
L.
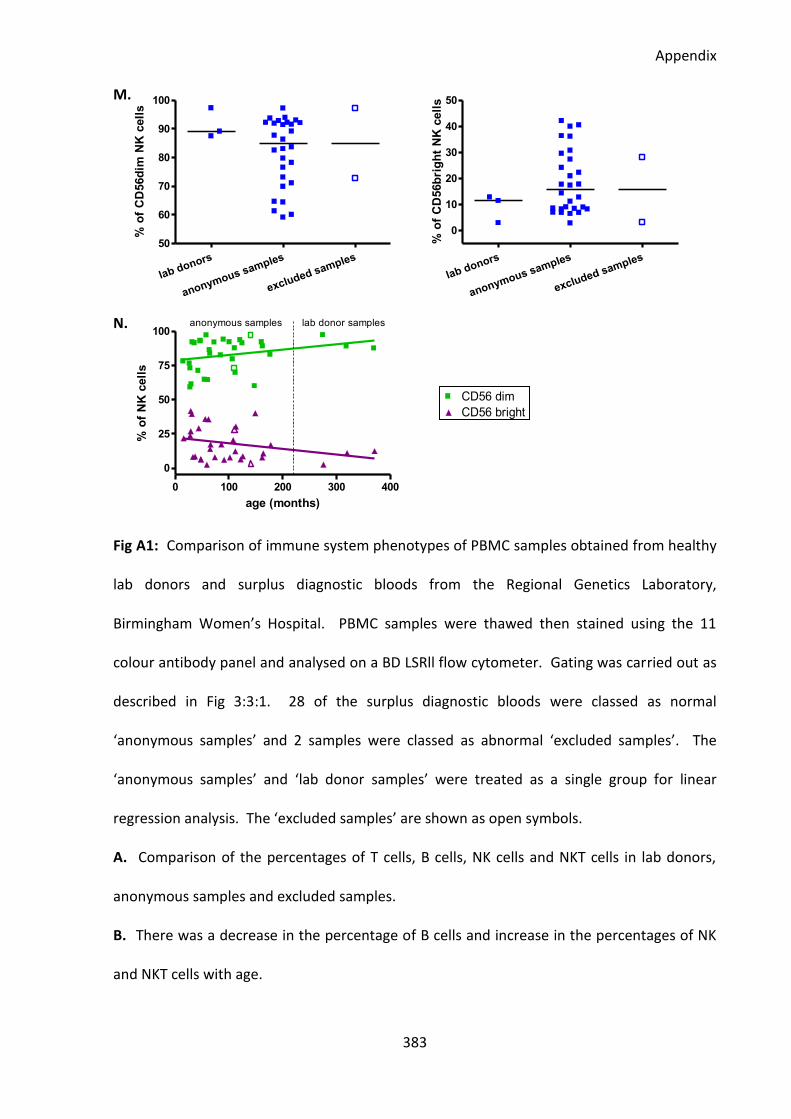
Appendix
383
lab donors
anonymous samples
excluded samples
50
60
70
80
90
100
% o
f C
D56d
im N
K c
ell
s
lab donors
anonymous samples
excluded samples
0
10
20
30
40
50
% o
f C
D56b
rig
ht
NK
cell
s
0 100 200 300 400
0
25
50
75
100anonymous samples lab donor samples
age (months)
% o
f N
K c
ell
s
M.
N.
Fig A1: Comparison of immune system phenotypes of PBMC samples obtained from healthy
lab donors and surplus diagnostic bloods from the Regional Genetics Laboratory,
Birmingham Women’s Hospital. PBMC samples were thawed then stained using the 11
colour antibody panel and analysed on a BD LSRll flow cytometer. Gating was carried out as
described in Fig 3:3:1. 28 of the surplus diagnostic bloods were classed as normal
‘anonymous samples’ and 2 samples were classed as abnormal ‘excluded samples’. The
‘anonymous samples’ and ‘lab donor samples’ were treated as a single group for linear
regression analysis. The ‘excluded samples’ are shown as open symbols.
A. Comparison of the percentages of T cells, B cells, NK cells and NKT cells in lab donors,
anonymous samples and excluded samples.
B. There was a decrease in the percentage of B cells and increase in the percentages of NK
and NKT cells with age.
0 100 200 300 400
0
25
50
75
100CD56 dim
CD56 brightr=0.4107p=ns
r=-0.3786p=ns
age (months)
% o
f N
K c
ell
s
Appendix
384
C. Comparison of the percentages of T cells expressing CD4 and CD8 in lab donor samples,
anonymous samples and excluded samples.
D. Comparison of the CD4:CD8 T cell ratio (% of CD4+ve T cells/% of CD8+ve T cells) of lab
donor samples, anonymous samples and excluded samples.
E. There was no change in the percentages of CD4+ve or CD8+ve T cells with age.
F. Comparison of the percentages of naive CD4+ve and CD8+ve T cells in lab donor samples,
anonymous samples and excluded samples.
G. Comparison of the percentages of central memory CD4+ve and CD8+ve T cells in lab
donor samples, anonymous samples and excluded samples.
H. Comparison of the percentages of effector memory CD4+ve and CD8+ve T cells in lab
donor samples, anonymous samples and excluded samples.
I. Comparison of the percentages of TEMRA CD4+ve and CD8+ve T cells in lab donor
samples, anonymous samples and excluded samples.
J. The percentages of naive T cells decreased and memory T cell subsets increased with age.
K. Comparison of the percentages of naive and memory B cells in lab donor samples,
anonymous samples and excluded samples.
L. The percentages of naive B cells decreased and memory T cells increased with age.
M. Comparison of the percentages of CD56dim and CD56bright NK cells in lab donor
samples, anonymous samples and excluded samples.
N. There was no change in the percentages of CD56dim and CD56bright NK cells with age.