Embed Size (px)
Citation preview

Incentive-Compatible Adaptation of Internet Real-Time Multimedia
Xin Wang, Henning SchulzrinneDept. of Computer Science
Columbia University1214 Amsterdam Avenue
New York, NY [email protected], [email protected]
Abstract
Distributed multimedia applications impose a number of requirements on the network to ensure ac-ceptable quality. Two areas of active research in this context are the enhancement of networks withmechanisms such as resource reservation and special scheduling mechanisms, and the adaptation of net-work resource usage by applications depending on resource availability. A network with enhancementsfor QoS support, and usage and QoS dependent pricing, can use pricing as a natural feedback mechanismto drive adaptive behavior by applications. In this work, we consider a framework in which a multimediaapplication or system of applications carries out adaptation of sending rate and type of network serviceused. The adaptation is based on user utility, defined as the (monetary) value of the current serviceas perceived by the user, relative to the price charged by the network. When the multimedia systemconsists of multiple streams (audio, video, etc.), the framework enables resource requests for individualstreams to be adapted for across-the-system maximization of value to the user. The system bandwidthis dynamically re-distributed among applications in response to changes in price, as well as changes inthe relative utilities with time or under different application scenarios. Mechanisms for resource negoti-ation between the user and the network, and for price formulation in the network, are briefly discussed.Experimental results show that perceived value based adaptation allows bandwidth to be shared amongcompeting users fairly. When network resources are scarce, bandwidth is shown to be distributed amongcompeting applications (and among media streams belonging to a single multimedia system) accordingto their relative elasticity of demand, indicated by the sensitivity of the perceived value to the bandwidth.The effect of weighting (or multiplicatively scaling) and additively shifting the utility function is exam-ined, in the context of changing the demand elasticity, and changing the importance of maintaining aninterruption-free connection.
1 Introduction
The development and use of distributed multimedia applications are growing rapidly. These applicationsusually require a minimum Quality of Service (QoS) from the network, in terms of throughput, packet loss,delay, and jitter. Also, multimedia applications on the Internet commonly employ the UDP transport proto-col, which lacks a congestion control mechanism. These applications can therefore starve TCP applications(which perform congestion control) of their fair share of bandwidth.
To address these problems, one approach is to enhance the network with mechanisms such as resourcereservation [1][5], admission control [6], and special scheduling mechanisms [7]. Another approach is toadjust the bandwidth used by an application according to the existing network conditions [12], relying onsignaling mechanisms such as packet loss rates for feedback.
If resource reservation is done statically (before transmission), resource reservation and provisioningtend to be conservative due to the lack of quantitative knowledge of traffic statistics. Moreover, the resource
1

allocation is based on initial availability of resources and does not take into account changes in availabilityduring an ongoing transmission. Many multimedia applications are long-lived, exacerbating the problem.Compared to resource reservation, the adaptation approach has the advantage of better utilizing availablenetwork resources, which change with time. But if network resources are shared by competing users, usersof rate-adaptive applications do not have any incentive to scale back their sending rate below their accessbandwidth, since selfish users will generally obtain better quality than those that reduce their rate. There hasbeen a lot of recent work that tries to address this problem - by dropping more packets to punish unresponsiveapplications, and by enforcing TCP like fairness [30, 29, 31]. However, these methods do not take intoaccount the fact that some sources may not be able to reduce their transmission rate easily and TCP likerate adaptation does not work well for multimedia applications. Therefore, when congestion happens, thesekinds of fairness schemes may not be appropriate for applications to meet individual QoS expectations.
In a network with enhancements for QoS support, pricing of network services based on the level of ser-vice, usage, and congestion provides a natural and equitable incentive for applications to adapt their sendingrates according to network conditions [14]. Increasing the price during congestion gives the application anincentive to back-off its sending rate and at the same time allows an application with more stringent band-width and QoS requirements to maintain a high quality by paying more. Existing research work in this areais discussed briefly in Section 7.
In earlier work, we presented a Resource Negotiation and Pricing (RNAP) protocol and architecture[14]. RNAP enables the user to select from available network services with different QoS properties andre-negotiate contracted services, and enables the network to dynamically formulate service prices and com-municate current prices to the user. Although dynamic re-negotiation and pricing are integral features ofRNAP, it is compatible with applications with different capabilities and requirements. Applications maychoose services that provide a fixed price, and fixed service parameters during the duration of service. Al-ternatively, if they are not constrained by a fixed user budget, they may use a service with usage-sensitivepricing, and maintain a constant QoS level, paying a higher charge during congestion. Generally, the long-term average cost for fixed-price service is higher since the network provider will add a risk premium.Applications may also beadaptive, that is, operate with a budget constraint, and adjust their service requestsin response to price increases during congestion.
In this paper, we propose an algorithm for computation of a local or incremental price for a service at agiven point in a network; We then propose some approaches towards adaptation of (multimedia) applicationsending rate and/or choice of network services in response to the incentive provided by dynamic networkpricing. We discuss how to maximize user satisfaction in such an environment, subject to the constraintsimposed by the minimum and maximum QoS requirements of the application, and the available budget.We also discuss the allocation of resources to component streams (audio, video, etc.) belonging to a mul-timedia system, for across-the-system maximization of value to the user. We present experimental resultsdemonstrating important features of the adaptation process.
This paper is organized as follows. In section 2 of this paper, we briefly describe the RNAP architecture,as an example of the environment in which incentive-driven adaptation takes place. We then describe theproposed pricing algorithm. In Section 3, we presents some candidate adaptation algorithms. In Section 4,we discuss influence of the dynamic resource negotiation and network dynamics on the system stability. InSection 5, we describe how this adaptation framework is implemented in a real multimedia system environ-ment. In Section 6, we present experimental results demonstrating some of the important features of ourwork Section 7 contains a brief discussion of related research. Finally, we summarize our work in Section8.
2

2 Resource Negotiation and Pricing
In this section, we first briefly describe the RNAP protocol and architecture [14], as a typical frameworkwithin which incentive-driven adaptation by the user takes place. We then describe an algorithm for com-putation of a local or incremental price for a service at a given point in a network;
2.1 Resource Negotiation through RNAP
In the RNAP framework, we assume that the network makes services with certain QoS characteristics avail-able to the user applications, and charges prices for these services that, in general, can vary with the availabil-ity of network resources. Network resources are obtained by user applications through negotiation betweenthe Host Resource Negotiator (HRN) on the user side, and a Network Resource Negotiator (NRN) actingon behalf of the network. The HRN negotiates on behalf of one or multiple applications belonging to amultimedia system. In an RNAP session, the NRN periodically provides the HRN updated prices for a setof services throughQuotationmessage. Based on this information and the current application requirements,the HRN determines the current optimal transmission bandwidth and service parameters for each applica-tion. It re-negotiates the contracted services by sending aReservemessage to the NRN, and receiving aCommitmessage as confirmation or denial.
The HRN only interacts with the local NRN. If its application flows traverse multiple domains, resourcenegotiations are extended from end to end by passing RNAP messages hop-by-hop from the first-hop NRNuntil the destination network NRN, and vice versa. End-to-end prices and charges are computed by accu-mulating local prices and charges asQuotationandCommitmessages travel hop-by-hop upstream.
2.2 Network Pricing and Congestion Control
We assume that the network charges the user appropriately for different services based on the user trafficvolume, the QoS characteristics of the service, and the demand on network resources. It is not necessaryto assume a particular pricing model for the purposes of the multimedia system. As with the resourcenegotiation system, however, we propose a simple pricing algorithm to determine a price for a particularkind of forwarding service from the router based on the competitive market model [43]. The competitivemarket model defines two kinds of agents: consumers and producers. Consumers seek resources fromproducers, and producers create or own the resources. The exchange rate of a resource is called its price.Prices are set where the amount of resource demanded equals the amount of resources supplied.
The router supports multiple services. We also assume that the router is partitioned to provide a separatelink bandwidth and buffer space for each service, on each port. In the discussion that follows, we considerone such logical partition. The routers are considered as the producers and own the link bandwidth and bufferspace for each output port. The flows (individual flows or aggregate of flows) are considered as consumerswho consume resources. The total demand for link bandwidth is based on the aggregate bandwidth reservedon the link for a price computation interval, and the total demand for the buffer space at an output port isthe average buffer occupancy during the interval. The supply bandwidth and buffer space need not be equalto the installed capacity; instead, they are the targeted bandwidth and buffer space utilization. The pricecomputation is performed periodically, with a price update intervalτ . In general, the price update interval ata router is independent of the negotiation interval of the services supported by the router. The price withineach negotiation interval is kept constant, to provide predictability to users. Prices are computed locally atrouters, and collated to form an end-to-end price using the RNAP protocol.
We decompose the total charge computed at a router into three components:holding charge, usagecharge, andcongestion charge.
Usage Charge:
3

The usage charge is determined by the actual resources consumed, the level of service guaranteed tothe user, and the elasticity of the traffic. For example, on a per-byte basis, best-effort traffic will cost lessthan reserved, non-preemptable CBR traffic. The usage price (pu) will be set that it allows a retail networkto recover the cost of the purchase from the wholesale market, and various static costs associated with theservice. It can be represented as:
pu = f(Service, destination, time of day, ...) (1)
The usagechargecu(n) for a periodn in whichV (n) bytes were transmitted is given by:
cu(n) = pu ∗ V (n) (2)
Holding Charge:
The holding charge can be justified as follows. If a particular flow or flow-aggregate does not utilizethe resources (buffer space or bandwidth) set aside for it, we assume that the scheduler allows the resourcesto be used by excess traffic from a lower level of service. The holding charge reflects revenue lost by theprovider because instead of selling the allotted resources at the usage charge of the given service level (ifall of the reserved resources were consumed) it sells the reserved resources at the usage charge of a lowerservice level. The holding price (ph) of a service class is therefore set to be proportional to the differencebetween the usage price for that class and the usage price for the next lower service class. The holding pricecan be represented as:
pih = αi ∗ (piu − pi−1u ) (3)
Whereαi is a scaling factor related to service classi. The holdingchargech(n) when the customer reservesa bandwidthR(n) is given by:
ch(n) = ph ∗R(n) ∗ τ (4)
whereτ is the duration of the period. TheR(n) can be estimated from the traffic specification and QoSrequest of the customer, for example, an effective bandwidth.
Defining a usage charge and a holding charge separately allows the customer to reserve resources con-servatively, without penalizing him excessively for unused resources. As an example, an audio stream canhave periods of silence, when the reserved resources are not used by the customer. Also, not charging thecustomer purely on the basis of reserved resources makes it easier for the customer to keep his reservationlevel constant even during idle periods.
Congestion Charge:
Network congestion arises from a scarcity of network resources, generally bandwidth and buffer space.The congestion charge is imposed only if congestion is deduced, that is, the resource request or averageusage for a partition (in terms of buffer space or bandwidth) exceeds supply (the targeted buffer space orbandwidth). The congestion price for a service class is calculated as an iterative tˆatonnement process [43]:
pc(n) = min[{pc(n− 1) + σ(D,S) ∗ (D − S)/S, 0}+, pmax] (5)
WhereD andS represent the current total demand and supply respectively, andσ is a factor used to adjustthe convergence rate.σ may be a function ofD andS; for example, it is higher when congestion is severe.The router begins to apply the congestion charge only when the total demand exceeds the supply. Even after
4
the congestion is removed, a non-zero, but gradually decreasing congestion charge is applied until it falls to0, to protect against further congestion. The maximum congestion price is bounded by thepmax parameterso that the total price for a service class does not exceed that for a higher level of service. When a serviceclass needs admission control, all new arrivals are rejected when the price reachespmax. If pc reachespmaxfrequently, it indicates that more resources are needed for the corresponding service and new configurationfor local resources may be needed. For a periodn, the total congestion charge is given by
cc(n) = pc(n) ∗ V (n). (6)
Based on a price formulation strategy such as the one we have discussed, a router arrives at a pricestructure for a particular RNAP flow or flow-aggregate at the end of each price update interval. The totalcharge for a session is given by
session charge =N∑n=1
(ch(n) + cu(n) + cc(n)) (7)
whereN is total number of intervals spanned by a session.
3 User Adaptation
In this section, we discuss how a set of user applications performing a given task (for example, a videoconference) adapt their sending rate and quality of service requests to the network in response to changesin service prices, so as to maximize the benefit to the user. The user must define quantitatively, through autility function, the benefit or value associated with a sending rate and QoS parameter-set obtained from aparticular network service. Note a user utility function is private to the user itself. The rest of this sectionis divided into two parts. In Section 3.1, we discuss the definition and general characteristics of an utilityfunction. In Section 3.2, we discuss how sending rate and transmission QoS parameters are selected basedon the utility function.
3.1 The Utility Function
We consider a set of user applications, required to perform a task ormission, for example, audio, video,and whiteboard applications for a video-conference. TheReserverequest from the user specifies certaintransmission parameters for each application. In general, the transmission parameters are the sending rate, aswell as QoS parameters, usually loss and delay. Theutility of a reservation request denotes how beneficial thecorresponding network resource allocation would be towards completing the mission. The utility functionis therefore a function in a multi-dimensional space, with each dimension representing a single transmissionparameter allocation for a particular application. The object of the adaptation is to select a set of transmissionparameters that gives the maximum possible utility relative to the cost of obtaining this service, subject tothe user budget constraint.
3.1.1 Utility as Perceived Value
Clearly, the utility of a transmission depends on its quality as perceived by the user. However, since theuser is paying for the transmission, it appears reasonable to define the utility as theperceived valueofthat quality to the user. For example, an audio transmission requiring a certain sending rate and certainbounds on the end-to-end delay and loss rate may be worth 10 cents/minute to the user. The perceptualvalue is strongly correlated to the perceptual quality, but is not exactly the same. For example, a pairof audio transmissions encoded identically and with the same transmission QoS parameters also have the
5

����
��������
bandwidth
Utility
utility1
utility3utility2
Figure 1:Some example utility functions
same perceived quality, but their perceived values may differ according to the application requirements. Forexample, the requirement of a weekly meeting between native speakers will probably have a lower qualityrequirement than a conferencing system teaching a foreign language and hence the users will see a highervalue for using high quality transmission for the latter.
The measurement of subjective quality of multimedia transmissions has been reported by a number ofresearchers [19][23][24]. Generally, these experiments were intended to derive the Mean Opinion Score(MOS), which is measured as an average perceptive quality across a number of test subjects. But in ourframework, perceived value very strongly reflects individual user preferences, and the application task beingperformed. We consider it likely, therefore, that an user application will have one or more of the followingfeatures:
• allow user to customize utility function(s)
• allow user to define “scenario”-specific utility functions; a particular scenario may be selected by theuser during a session, or may be deduced by the application based on user actions
• allow user to specify a certain time-dependence of the utility function
3.1.2 Utility as a Function of Bandwidth
It is likely that only a few alternative services will be available to a multimedia application on the Internet - atthe current stage of research, some possible services are guaranteed [4] and controlled-load service [?] underthe int-serv model, Expedited Forwarding (EF) [10] under diff-serv, and several classes of service underAssured Forwarding (AF) [11], also under diff-serv. A particular user application would be able to choosefrom a small subset of the available services. Each such service would probably provide some qualitativeor quantitative guarantee for loss and delay. It seems likely, therefore, that the user would develop an utilityfunction as a function of the transmission bandwidth (which in turn would depend on specific encodingparameters such as frame rate, quantization, etc.), at different discrete levels of loss rate and delay.
We can make some general assumptions about the utility function as a function of the bandwidth, at afixed value of loss and delay. The application has a minimum transmission bandwidth, and the utility iszero for bandwidth below this threshold. Also, user experiments reported in the literature [23][24] suggestthat utility functions typically follow a model of diminishing returns to scale, that is, the marginal utilityas a function of bandwidth diminishes with increasing bandwidth and eventually goes to zero, defining amaximum QoS requirement.
Fig. 1 shows some possible utility vs. bandwidth curves. Utility1 is a smooth function. User experimentsfor deducing the utility function would be performed at discrete bandwidths, and some form of interpolation,such as a piecewise linear function (utility2), can be used to approximate the utility function. In addition, in
6

some multimedia applications, only discrete bandwidths are feasible. For example, audio codecs can onlyoperate at certain bandwidth points (Utility3).
3.1.3 Effect of Scaling
In this section, we consider how changes in utility function may influence the resource distribution. Theoperations we consider are an offset applied uniformly to the utility over all bandwidths, and multiplicativescaling of the utility function. We discuss the operation qualitatively here, and present some experimentalresults in section 6.2.4.
The utility function represents the relative preference of the user for different bandwidths. A constant(bandwidth-independent) offset to the utility function will not influence the resource distribution as long asthe valuation of a bandwidth is higher than its cost.
On the other hand, a constant offset of the utility function changes the minimum perceived value. Theminimum perceived value represents how much the user is willing to pay to just keep the application alive.Lowering this value allows the application to be terminated more readily during congestion (high cost).If a user values an uninterrupted service very highly, he increases the perceived value of the “keep alive”bandwidth.
A multiplicative scaling of the utility function by a factor greater than one tends to increase its bandwidthshare, since it results in a bigger additive increase in perceived surplus at higher bandwidth than at lowerbandwidths. Effectively, the demand elasticity of the application is reduced. The opposite effect is observedwhen the scaling factor is less than 1.
3.1.4 Time Dependence of Utility
For a particular application, the value of the information may vary with time. An user may perceive a highervalue initially after the connection is established, and a lower value after a certain duration (typically, a phonecall is very important to the user in the first one minute, compared to one that has lasted 30 minutes), or thereverse (for a movie, the ending is usually more interesting than the introduction). The relative importanceof individual applications in a system may also evolve with time.
The evolution with time of the application utilities may be defined based on various user-defined scenar-ios. A simple way of representing the time evolution is to represent the multiplicative scaling and additiveoffset in Section 3.1.3, with a pair of time dependent parameters,α andβ, so that the time-dependent utilitycan be represented asαj(t) ∗ Uj(·) + βj(t), wherej represents a task performed at a timet.
3.2 Application Adaptation
Consumers in the real-world generally try to obtain the best possible “value” for the money they pay, subjectto their budget and minimum quality requirements; in other words, consumers may prefer lower quality ata lower price if they perceive this as meeting their requirements and offering better value. Intuitively, thisseems to be a reasonable model in a network with QoS support, where the user pays for the level of QoShe receives. In our case, the “value for money” obtained by the user corresponds to the surplus between theutility U(·) with a particular set of transmission parameters (since this is the perceived value), and the costof obtaining that service. The goal of the adaptation is to maximize this surplus, subject to the budget andthe minimum and maximum QoS requirements.
We first consider the adaptation strategy of a single application when its utility is a function only ofbandwidth (at a fixed loss and delay). We then discuss the adaptation strategy when the utility is functionof multiple transmission parameters (bandwidth, loss and delay). Finally, we consider the problem of maxi-mizing themission-wideutility of a system comprising multiple applications performing a certain task. Weassume the applications belong to a single user.
7

bandwidth
Budget line
Cost line1
Cost line 2
Utility
BudgetCost
Utility
(kb/s)
User surplusA
O
B
SaSb
($/time)
b_min b_maxb’ b
Figure 2:A perceived value based rate adaptation model
3.2.1 Adaptation of Single Application over Fixed Transmission Quality
If the quality of transmission is fixed (a particular delay and loss), the application utility (that is, the user-perceived value) increases monotonically with the bandwidth. Hence the maximization problem for the usercan be written as:
max [U(x)− C(x)]s. t. C(x) ≤ b
xmin ≤ x ≤ xmax (8)
Wherex is the bandwidth under consideration,C(x) is the cost for the requested bandwidth,b is the bud-get of user,xmin is the minimum bandwidth requirement, andxmax represents the maximum bandwidthrequirement. Note that U, b and c are in units of money/time.
One way of carrying out this optimization is to fit the utility function to a closed form function. Theoptimal solution is then obtained by using Kuhn-Tucker conditions for a maximum subject to inequalityconstraints.
As mentioned earlier, the application utility is likely to be measured by user experiments and known atdiscrete bandwidths. In this case, it is convenient to represent the utility as a piecewise linear function, asshown in Fig. 2. The figure also assumes a constant unit bandwidth costC, so that the cost-vs-bandwidthis a straight line with slope equal toC. The budget is shown as a horizontal line passing intercepting thecost/utility axis. From the figure, it is evident that the optimal bandwidth iseither the segment end-point with the highest surplus, if this end-point meets the budget constraint (b in Fig.2 case A)or elsethe bandwidth corresponding to the intersection point of the cost line with the budget line (b’ in Fig.2 case B).
3.2.2 Adaptation of Single Application over Multiple Transmission Parameters
We now consider the maximization of the application surplus over a set of transmission parameters (usually,the bandwidth, loss rate and delay). The objective function is as shown earlier in equation 8, butx, xmin andxmax are now vectors corresponding to the set of transmission parameters. If a complete quality of serviceparameter space is considered, the searching cost can be prohibitive. As briefly explained however, webelieve it is likely that the application utility will take the form of a small set of utility versus transmission
8
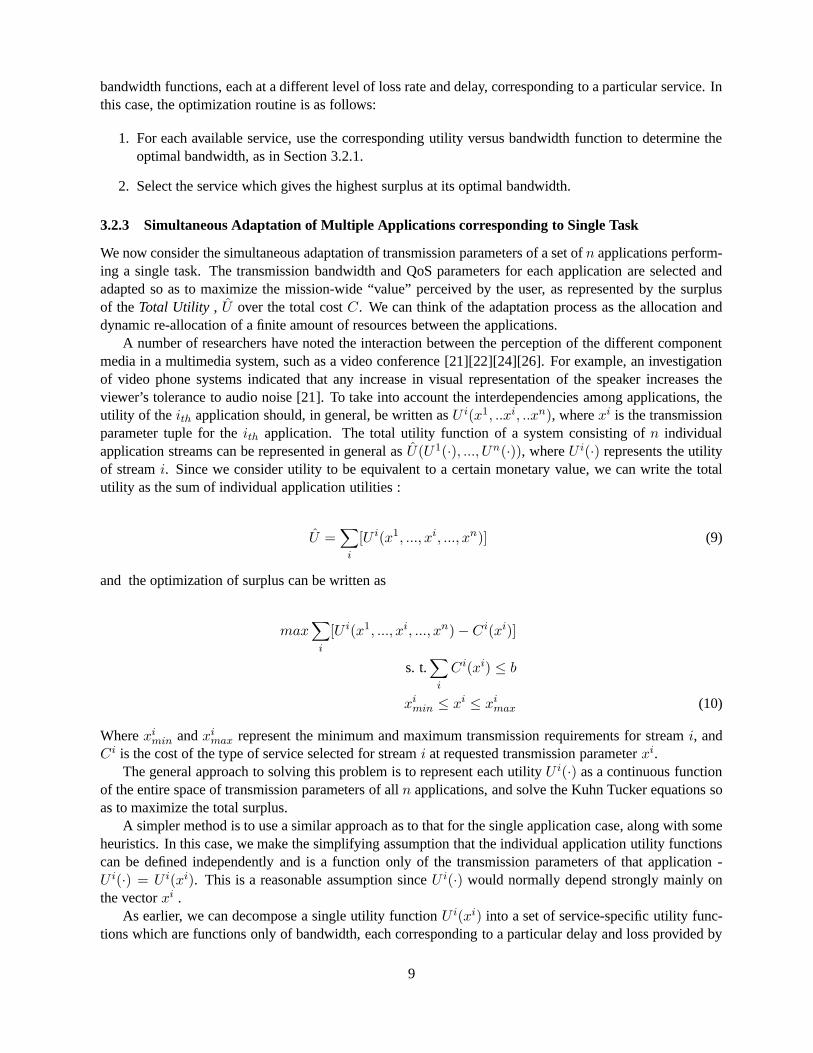
bandwidth functions, each at a different level of loss rate and delay, corresponding to a particular service. Inthis case, the optimization routine is as follows:
1. For each available service, use the corresponding utility versus bandwidth function to determine theoptimal bandwidth, as in Section 3.2.1.
2. Select the service which gives the highest surplus at its optimal bandwidth.
3.2.3 Simultaneous Adaptation of Multiple Applications corresponding to Single Task
We now consider the simultaneous adaptation of transmission parameters of a set ofn applications perform-ing a single task. The transmission bandwidth and QoS parameters for each application are selected andadapted so as to maximize the mission-wide “value” perceived by the user, as represented by the surplusof theTotal Utility , U over the total costC. We can think of the adaptation process as the allocation anddynamic re-allocation of a finite amount of resources between the applications.
A number of researchers have noted the interaction between the perception of the different componentmedia in a multimedia system, such as a video conference [21][22][24][26]. For example, an investigationof video phone systems indicated that any increase in visual representation of the speaker increases theviewer’s tolerance to audio noise [21]. To take into account the interdependencies among applications, theutility of the ith application should, in general, be written asU i(x1, ..xi, ..xn), wherexi is the transmissionparameter tuple for theith application. The total utility function of a system consisting ofn individualapplication streams can be represented in general asU(U1(·), ..., Un(·)), whereU i(·) represents the utilityof streami. Since we consider utility to be equivalent to a certain monetary value, we can write the totalutility as the sum of individual application utilities :
U =∑i
[U i(x1, ..., xi, ..., xn)] (9)
and the optimization of surplus can be written as
max∑i
[U i(x1, ..., xi, ..., xn)− Ci(xi)]
s. t.∑i
Ci(xi) ≤ b
ximin ≤ xi ≤ ximax (10)
Whereximin andximax represent the minimum and maximum transmission requirements for streami, andCi is the cost of the type of service selected for streami at requested transmission parameterxi.
The general approach to solving this problem is to represent each utilityU i(·) as a continuous functionof the entire space of transmission parameters of alln applications, and solve the Kuhn Tucker equations soas to maximize the total surplus.
A simpler method is to use a similar approach as to that for the single application case, along with someheuristics. In this case, we make the simplifying assumption that the individual application utility functionscan be defined independently and is a function only of the transmission parameters of that application -U i(·) = U i(xi). This is a reasonable assumption sinceU i(·) would normally depend strongly mainly onthe vectorxi .
As earlier, we can decompose a single utility functionU i(xi) into a set of service-specific utility func-tions which are functions only of bandwidth, each corresponding to a particular delay and loss provided by
9

a particular service. Clearly, several combinations of services (and hence, service-specific utility functions)are possible. We first consider one particular combination of service-specific utility functions. Let the utilityof an applicationi be defined atLi bandwidth levels. The utility at each level isuil (l = 1, 2, ..Li), and theutility function is piece-wise linear. Segmentl (the straight line between levelsl andl + 1) has a slopekil .The optimal transmission parameter set for a particular combination of service-specific utility functions isthen determined as follows:
1. From the utility function for each applicationi, determine the segment end-pointlopt(l = 1, 2, ..Li),with bandwidthBi
opt, at which the surplus (utility minus cost) is maximized for that application. Letthe cost of the targeted bandwidth beCiopt(Bi
opt).
2. If the total expenditure needed for the system,∑iC
iopt(B
iopt), exceeds the total system budget, go to
step 3, else stop.
3. From all the applications that receive service at levellopt > lmin, find the applicationivictim with thesmallest slope in the surplus (uil −Cil ) from levellopt to lopt− 1 (this corresponds to the smallest sen-sitivity of application surplus to a reduction in bandwidth). Reduce the current bandwidth allocationfor this application to the next lower bandwidth level (lopt = lopt − 1).
4. If the total system expenditure remains greater than the system budget, go back to step 3. If there isexcess budget, allocate the excess budget to the current victim application (from step 3) to acquire asmuch bandwidth as permitted by the budget.
The above algorithm is repeated for each possible combination of service-specific utility functions; eachtime, an optimal transmission parameter set is obtained.
4 System Stability and Network Dynamics
Applications will re-negotiate network services when a price quoted by the network changes or when themedia traffic format changes, resulting in different bandwidth requirements. In addition, a new applicationentering the network or an exisiting application leaving the network will also lead to resource re-allocation.In this section, we first consider the stability of our pricing algorithm, and then the stability of the corre-sponding rate adaptaion process.
4.1 Price Stability
In our proposed pricing strategy of section 2.2, three price components are considered: holding price (ph),usage price (pu), and congestion price (pc). For a specific network provider, the holding price (ph), andusage price (pu) for a particular service are fixed, or change infrequently. Hence, only the stability of thecongestion price needs to be considered.
The adaptation of the proposed congestion price follows thetatonnementprocess for an equilibrium.The price will be quoted upward or downward, depending on whether or not demand exceeds supply, untilthe demand and supply reach equilibrium and a stable pricepe is located.
Since demand is a function of price, we can denote demand asD(p). For a network service class, thetargeted resource supply is fixed and is denoted asS. Suppose the rate of change of price moves directlywith excess demand,E(p) = D(p)− S as follows:
p′ =dp
dt= f(D(p)− S) = f(E(p)) (11)
10
wheref ′ ≥ 0. The price change drives the demand and supply towards equlibrium. If thetatonnementprocess is successful, the mechanism in equation 11 will generate a path of prices which will approachpe
ast increases:
limt→∞
p(t) = pe (12)
If equation 11 holds for any initial pricep andpe is unique, the system is calledglobally stable. If thereis more than one equilibrium-price vector, then ifp(t) reaches any of thepe’s, the model is calledlocallystable. We only consider local stability in our system, where equation 12 holds for all pricesp in someneighborhoodof pe. To prove that the local price stability exists, the functionf(E(p)) can be representedby a Taylor series expansion:
dp
dt= f(E(pe)) + f ′E′(pe)(p− pe) + · · · (13)
The higher order terms are negligible in comparison with the first-order term in equation 13, as long as onlylocal stability is considered. SinceE(pe) = 0 by the definition of price, the equation 13 can be written as:
dp
dt= f ′E′(p− pe) (14)
The solution of this equation is:
p(t) = pe + (p0 − pe)e(f ′E′)t (15)
wherep0 is any initial price.The assertion of stability requires that the exponential term in equation 15 approaches zero ast → ∞.
Sincef ′ > 0, so the stability assertion requires
E′ = Dp(p) < 0 (16)
In a resonable network system, user demand will decrease as the price increases, soDp(p) < 0. This provesthat the proposed price will reach stability as times increases. However, the convergence speed of the systemwill depend on the convergence rate parameterσ(D,S), orσ(p). In our experiments, in order to obtain rapidbut smooth convergence,σ(D,S) is large when the demand is much higher than supply, and is graduallyreduced as the demand approaches supply.
Since the user demand will change as users join and leave, a new stable price may be reached as thetotal user demand changes. In the above process, the total demand and supply are assumed to be knowninstaneously. For a network with delay, this assumption may not be true. Since in our proposed model, theprice is only updated periodically and in the time unit of minutes, the network delay has neglible influenceon the stability.
4.2 Stability of user bandwidth requests
Even though the network can reach stability for any fixed set of bandwidth requirements, the stability can bedisturbed when new applications enter the network and existing applications leave the network. In addition,bandwidth adaptation by a number of users sharing the same link bandwidth can also lead to the oscillationof the system price and user requests, before the demand and supply reach equilibrium.
In the core network, oscillatory behavior can be minimized by aggregating RNAP requests, reducingthe frequency with which the RNAP agent re-allocates resources and adjusts the price??. The resourcenegotiated will be incremented or decremented with some minimum granularity. When the sum of per-flowrequests approaches the resources reserved for the aggregate (or earlier, at some pre-defined threshold),
11

��������
��������MNA MNA MNA
ISC Reservation Agent HRNRNAP
NRN
Internet
RNB
WhiteBoardNeVitNevot
Figure 3:The architecture of the extended MINT system
the client negotiator will reserve an additional block of resources. Similarly, the requested reservationis decremented in blocks as required as the requested bandwidth decreases. The larger the block, the lessfrequently the aggregate session needs to be re-negotiated, but a higher holding cost is incurred for resourceswhich may be under-utilized.
As the network price changes, users will renegotiate resources to optimize their perceived benefit (sur-plus) from the service. The total user requests are hence oscillatory. The piece-wise linear utility functionused to simplify the optimization can sometimes result in a severe oscillation between two adaptation pointsfar apart in bandwidth, as will be seen in the experiments in Section 6.2.1. In our experiments, we usedtwo measures to damp out the oscillations. The first measure was to use a proportional plus derivative (PD)controller. During each negotiation period, instead of letting the requirement jump to a new optimal band-width, the user shifts to a bandwidth between the current one and the optimal one, resulting in temporarilysub-optimal operation. The PD control law regulates the bandwidth request as follows:
ri+1 =
{ri − α0(ri − r∗)− α1(ri − ri−1), if |SP (r∗)−SP (ri)|
SP (ri)> θ
ri, otherwise
(17)
wherer∗ is the desired optimal rate,ri is the rate requested for negotiation periodi, andSP (x) representsthe surplus corresponding to bandwidthx. Quicker convergence is attained by makingα0 large, while theovershoot is minimized by makingα1 large.
In addition to the PD control, the bandwidth was allowed to be adjusted only if the new bandwidth ledto an increase in surplus of at leastθ %. This prevented bandwidth adaptation which did not result in asignificant improvement in the perceived surplus.
5 Dynamic Resource Negotiation and Rate Adaptation in a Multimedia Sys-tem
In the preceding section, we introduced the concept of application utility and system-wide utility. We ex-plained how we define utility, and determine the sending rate and QoS parameters based on the maximizationof user valuation surplus subject to budget constraints.
We now consider how the above work may be applied in the context of a real multimedia system. Asan example, we consider an extended version of the Multimedia Internet Terminal (MINT) [16] system,a flexible multimedia tool set that allows the establishment and control of multimedia sessions across theInternet. The various components of this extended version, and their interactions are shown in Fig. 3.
12

The principal application components of MINT are NeVoT and NeViT. Both NeVoT and NeViT supportrate adaptation. NeVoT is an audio tool that allows the user to join different sessions simultaneously. Thetransmission quality of NeVoT can be changed by switching audio encoding during a transmission, with dif-ferent participants being able to use different encodings at the same time. Currently the encoding algorithmsused in NeVoT include LPC (5.6 kb/s), GSM (13.0 kb/s), DVI (32 kb/s), PCMU (64 kb/s), 16 bit/44.1 khzhigh CD stereo (1411 kb/s). The adaptation of the audio rate in NeVoT is done by switching the codingalgorithm used and in a discrete level.
NeViT is a video tool that is extended to achieve inter-media synchronization, automatic quality ofservice control and interaction with other media agents without being dependent on those agents. NeViTsupports Sun Video card for capturing and compressing video images. The card supports JPEG, MPEG,CellB and YUV video in hardware and NeViT provides the appropriate algorithms for decompressing anddisplaying JPEG, MPEG, and YUV video images. Since video is more flexible in its bandwidth needs andthus lends itself more readily to adaptation, the video media agent NeViT is enhanced with a bandwidthadaptation algorithm that tunes the video frame rate to achieve different transmission data rate.
In addition to the above applications, the framework comprises of certain software agents - a Host Re-source Negotiator (HRN), and a Media Negotiation Agent acting on behalf of each application. These agentsexchange information over the Resource Negotiation Bus (RNB) by using a communication protocol calledPattern Matching Multicast (PMM) [17]. PMM messages are used for HRN and MNAs to exchange mediaparameters during a session, such as the bandwidth and frame rate of a video source, or the compressionalgorithm parameters for an audio. Since MINT allows decoupled media to work together, other mediaagents can easily be attached to the conference BUS without the necessity of changing the system structure.If a newly attached media supports rate adaptation, HRN will also send control message to inform the mediato adjust its rate when necessary.
Each MNA communicates its application requirements (such as minimum bandwidth) and changes inrequirements (for example, a temporary increase in application priority to accomplish a time-critical task) tothe HRN. The HRN negotiates with the network through RNAP for delivery services with specific transmis-sion bandwidths and other QoS parameters for each application. The HRN has a certain budget with whichto obtain network services, and hence it can acquire a finite amount of network resources. It allocates theseresources to the MNA’s such that the system-wide benefit to the user is maximized, as described in section2. Every time the HRN receives updated prices from the network, it determines the optimal sending rateand service parameters for each application, and sends a control message on the RNB. Through this mes-sage, each MNA receives a target transmission bandwidth, and certain QoS assurances. In turn, each MNAinteracts with the media controller of its respective application to adjust its encoding process according tothe targeted transmission rate and the QoS assurances it has received. In effect, the MNA hides the resourcenegotiation and allocation process from the application.
6 Experimental Results and Analysis
In this section, we describe preliminary experimental results demonstrating some of the important featuresof our work, using a simplified implementation of RNAP. The implementation was based on an extension ofthe RSVP signaling protocol, and carried out on a test-bed consisting of two nodes connected by a single 10Mb/s link. An RNAP agent was implemented at each node. Two types of service were implemented - thetraditional best-effort service, and the Controlled Load service proposed within the int-serv model.
Although our implementation was highly simplified, it allowed us to demonstrate several features: theperiodic RNAP negotiation process including resource negotiation and pricing and charging; the stability ofthe usage-sensitive pricing algorithm and its effectiveness in controlling congestion; the adaptation of userapplications in response to changes in network conditions and hence in the service price; and the effect of
13

Ra Rb
R3
R2
R1
S3
S2
S1
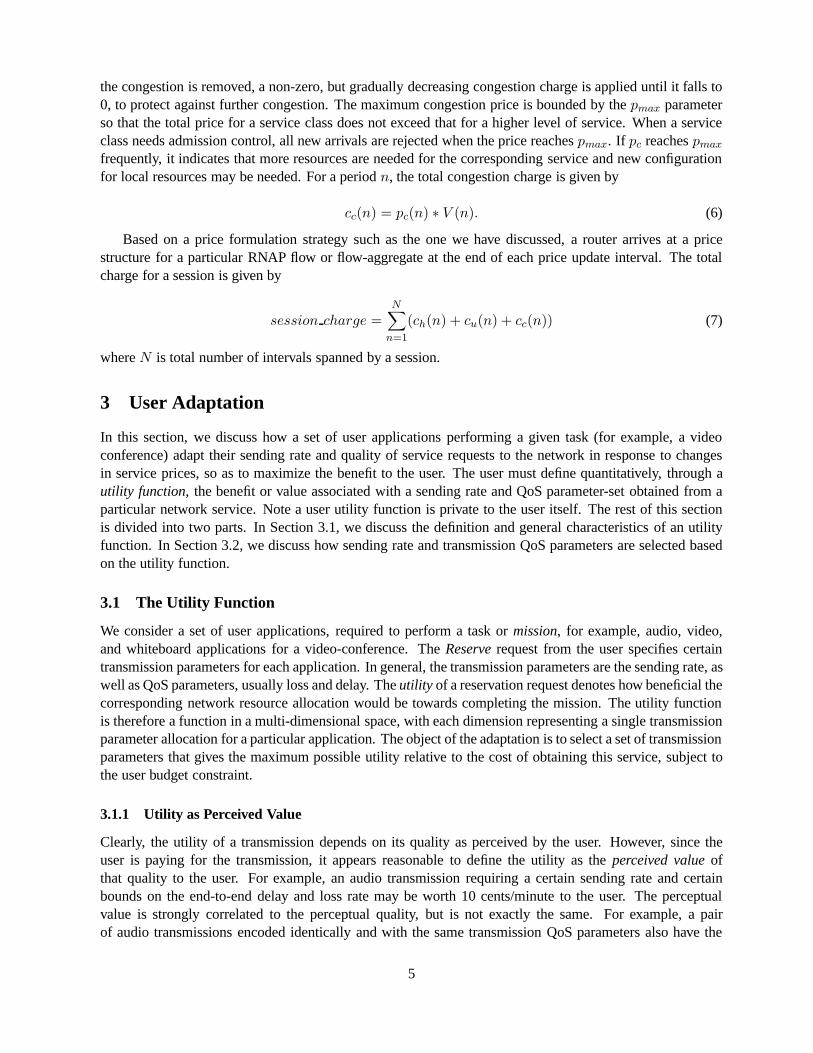
Figure 4:Architecture of test-bed used for the experiments
user utility functions on user adaptation and resource allocation.
6.1 Experimental Setup and Parameters
The test setup consisted of 2 routers (Ra and Rb) connected by a 10 Mb/s link, schematically representedin Fig. 4. Each interface at Ra and Rb had a capacity of 10 Mb/s, of which 4 Mb/s was configured tosupport the high priority Controlled-Load (CL) [3] service, and the remaining bandwidth was configured forbest effort service. Detailed descriptions regarding the price formulation in the network and network statemaintainance are given in [14].
During the experiments, each of three application HRNs (belonging to three different users at S1, S2,and S3) requested the CL service over the link, determining its bandwidth reservation so as to optimize itsown utility (perceived value). Since these experiments are intended as a preliminary demonstration of theworking of the overall adaptation framework, we made the simplifying assumption that application utility isa function only of bandwidth, and other QoS parameters are relatively static or can be compensated for byadjusting the bandwidth requirement (e.g., reserving more bandwidth will reduce delay and loss).
We assumed a service roughly as expensive (per unit bandwidth) as a telephone line. Assuming a chargeof 10 c/min, and a capacity of 64 kb/s, the usage price is set as2.6 c/Mb. Assuming that the next lower levelof service is charged at5 c/min, or1.3 c/Mb, the holding price is set at1.3 c/Mb. The price updation periodwas set at 30 seconds.
While a 4 Mb/s partition of the link was set aside for CL service, the congestion threshold was set to70% of the capacity (2.8 Mb/s). When the total reserved bandwidth on the link exceeded this threshold, thenetwork began to apply the usage-sensitive congestion price to drive the demand down.
For each experiment, we assume that the budget available to each application is such that it can justafford the optimal sending rate when the link is uncongested.
The metrics considered are: the behavior of the price in response to bandwidth demand, the influence ofthe price in driving adaptation of user bandwidth requirements, and the “benefit” gained by the applicationsin terms of the surplus (or perceived value of the service relative to its cost).
6.2 Experimental Results
We now describe a set of experiments which address the following issues: (i) the sharing of bandwidthbetween competing adaptive applications with identical utility functions; (ii) the sharing of bandwidth be-tween competing applications with utility functions reflecting different amounts of elasticity in bandwidthrequirements; (iii) distribution of bandwidth among applications belonging to a single-user multimedia sys-tem so as to maximize mission-wide value; (iv) the influence of specific changes in the utility function onthe bandwidth adaptation; (v) adaptive behavior of audio and video applications belonging to the MINTsystem.
In each experiment, we study the behavior of the price in response to bandwidth demand, the influence ofthe price in driving adaptation of user bandwidth requirements, and the “benefit” gained by the applicationsin terms of the surplus (or perceived value of the service relative to its cost). We ascertain that a stable andequitable distribution of bandwidth is reached in each case.
14

0 200 400 600 800 1000 1200 1400 16000
0.5
1
1.5
2
2.5
3
3.5
Bandwidth (kb/s)
Util
ity/C
ost (
$/m
in)
utility1 utility2 minimum cost
Figure 5:Utility functions used in the experiments of section 6.2.1 and 6.2.3
6.2.1 Bandwidth Sharing between Users
In the first experiment, we study the adaptive behavior when applications having the same utility functionand belonging to different users compete for network resources. The same experiment is performed withtwo different utility functions, Utility1 and Utility2, shown in Fig. 5.
Fig. 6-a1, 6-a2, and 6-a3 show different aspects of adaptive behavior when Utility1 is used. Initially, inresponse to the initial price, each user determines that the optimal bandwidth (giving the maximum surplus)is 1000 kb/s. Since the total reservation of 3000 kb/s made by the three users is higher than the congestionthreshold of 2800 kb/s, the network imposes an additional congestion price, resulting in a gradual increasein the price.
Fig. 6-a1 shows the initial increase in price, from 3.9 cents/Mb, until it stabilizes at 4.2 cents/Mb afterabout 150 seconds (corresponding to 5 negotiation periods). Fig. 6-a1 also shows the variation with timeof the total bandwidth reservation, and Fig. 6-a2 shows the variation with time of the individual bandwidthreservations, and the maximum per-user bandwidth that the user budget permits. As the price increases, eachuser is constrained by its budget to decrease its sending rate in response. As a result, the reserved bandwidthdecreases smoothly, until the link becomes un-congested, and the price stabilizes. Fig. 6 a3 shows a gradualdecrease in the surplus obtained by each user until the price stabilizes. All users are observed to have nearlyidentical adaptation traces.
The second experiment uses Utility2 in Fig. 5. Utility2 differs from Utility1 in that the optimal band-width (at the initial un-congested link price) of 1000 kb/s differs only slightly from the next sub-optimalbandwidth of 700 kb/s with respect to the perceived surplus.
[Show results without PD control in 6 b, and with PD control in 6c?]In Fig. 6 b, the adaptation traces are observed to be different from that shown in Fig. 6 a. When the
price increases, the applications are constrained by their budget to reduce their bandwidths initially. Whenthe price increases to a certain value, the optimal bandwidth requirement for all the users (calculated atslightly different times) shifts to 700 kb/s, since the increase in cost for a larger bandwidth is higher than fora smaller bandwidth. Since the two optimal points in our example are very far apart in bandwidth, and theperceived surplus of the two bandwidth are very close, an oscillation between 2100 kb/s and 3000 kb/s wasobserved in the total bandwidth when this experiment was performed.
To avoid this problem, the control scheme proposed in Section 4.2 was used to reduce the oscillation.In the experiment,α0, α1 and θ from equation 4.2 were set separately as 0.4, 0.6, and 2%. Fig. 6 c-2shows that using the control scheme resulted in the bandwidth requirement of all three users stabilizingwithin seven negotiation periods. The users obtained unequal bandwidth shares inspite of having the sameutility function. This is partly because of the asynchronous user negotiation behavior, and partly because
15

a1)0 500 1000 1500 2000 2500
0
1000
2000
3000
Time (seconds)
Tot
al b
andw
idth
res
erva
tion
requ
est (
kb/s
)
0 500 1000 1500 2000 25000
2
4
6
0 200 400 600 800 1000 1200 1400 1600 1800 20000
1000
2000
3000
Time (seconds)
Tot
al b
andw
idth
res
erva
tion
requ
est (
kb/s
)
0 200 400 600 800 1000 1200 1400 1600 1800 20000
2
4
6
0 200 400 600 800 1000 1200 1400 1600 1800 20000
2
4
6
Pric
e (c
ents
/Mb)
total network bandwidth demand
network bandwidth threshold
network bandwidth price
b1)0 500 1000 1500 2000 2500
0
1000
2000
3000
Time (seconds)
Tot
al b
andw
idth
res
erva
tion
requ
est (
kb/s
)
0 500 1000 1500 2000 25000
2
4
6
0 200 400 600 800 1000 1200 1400 1600 1800 20000
1000
2000
3000
Time (seconds)
Tot
al b
andw
idth
res
erva
tion
requ
est (
kb/s
)
0 200 400 600 800 1000 1200 1400 1600 1800 20000
2
4
6
0 200 400 600 800 1000 1200 1400 1600 1800 20000
1000
2000
3000
Time (seconds)
Tot
al b
andw
idth
res
erva
tion
requ
est (
kb/s
)
0 200 400 600 800 1000 1200 1400 1600 1800 20000
2
4
6
0 200 400 600 800 1000 1200 1400 1600 1800 20000
2
4
6
Pric
e (c
ents
/Mb)
network bandwidth price
network bandwidth threshold
total network bandwidth demand
a2)0 200 400 600 800 1000 1200 1400 1600 1800 2000
930
940
950
960
970
980
990
1000
1010
Time (seconds)
Ban
dwid
th r
eser
vatio
n (k
b/s)
user1 bandwidth request user1 affordable bandwidthuser2 bandwidth request user2 affordable bandwidthuser3 bandwidth request user3 affordable bandwidth
b2)0 200 400 600 800 1000 1200 1400 1600 1800 2000
860
880
900
920
940
960
980
1000
Time (seconds)
Ban
dwid
th r
eser
vatio
n (k
b/s)
user1 bandwidth request user1 affordable bandwidthuser2 bandwidth request user2 affordable bandwidthuser3 bandwidth request user3 affordable bandwidth
a3)0 200 400 600 800 1000 1200 1400 1600 1800 2000
0.26
0.28
0.3
0.32
0.34
0.36
0.38
0.4
0.42
0.44
Time (seconds)
Use
r su
rplu
s ($
/min
)
user1 surplususer2 surplususer3 surplus
b3)0 200 400 600 800 1000 1200 1400 1600 1800 2000
0.32
0.34
0.36
0.38
0.4
0.42
0.44
Time (seconds)
Use
r su
rplu
s ($
/min
)
user1 surplususer2 surplususer3 surplus
Figure 6:Allocation of bandwidth and surplus for three competing users sharing a link. a1, a2, and a3 show the results when theusers all have the Utility 1 function from Fig. 5, and b1, b2, and b2 show corresponding results when the users have the Utility 2function from the same figure
16

0 200 400 600 800 1000 1200 1400 16000
0.5
1
1.5
2
2.5
3
3.5
Bandwidth (kb/s)
Use
r ut
ility
/Cos
t ($/
min
)
utility1 utility2 utility3 minimum cost
Figure 7:Utility functions with different bandwidth sensitivity
a)0 500 1000 1500 2000 2500
650
700
750
800
850
900
950
1000
1050
Time (seconds)
Ban
dwid
th r
eser
vatio
n (k
b/s)
user1 bandwidth request user1 affordable bandwidthuser2 bandwidth request user2 affordable bandwidthuser3 bandwidth request user3 affordable bandwidth
b)0 500 1000 1500 2000 2500
0.28
0.3
0.32
0.34
0.36
0.38
0.4
0.42
0.44
0.46
0.48
Time (seconds)
Use
r su
rplu
s ($
/min
)
user1 surplususer2 surplususer3 surplus
Figure 8:Bandwidth reservation a) and perceived surplus b) when all users have different demand elasticity
of the possible sub-optimal bandwidth request (withinθ % of optimal) resulting from the control schemeof Section 4.2. All three users end up with final surplus values very close to each other (within 2 %). Thisis important since we consider the perceived surplus, rather than the bandwidth, as a measure of the usersatisfaction.
6.2.2 Bandwidth Sensitivity and Demand Elasticity
In this experiment, we study the effect of different elasticities in user demand on user bandwidth sharing andadaptation, using different utility functions (Fig. 7) for different users. An utility function with a smallerslope reflects a higher elasticity in the bandwidth requirement of the user. Fig. 8-a shows that the user withthe more elastic requirement is more sensitive to price changes and reduces his resource requirement fasterwhen the network price increases. Correspondingly, Fig. 9-a shows that as a reward for elastic behavior,the average network charge for the more elastic user is lower, while the three users have similar perceivedsurplus (Fig. 8-b).
Thus, users with less stringent bandwidth requirements express this flexibility through a less bandwidth-sensitive utility function, and bear a greater share of reductions in bandwidth for congestion-control. Userswith more bandwidth-sensitive requirements have to pay a higher charge during congestion to maintain theirbandwidths at current levels.
17

a)0 200 400 600 800 1000 1200 1400 1600 1800 2000
0
0.2
0.4
0.6
0.8
1
1.2
1.4
1.6
1.8
2
Time (seconds)
Res
erva
tion
char
ge (
dolla
rs)
session1 charge per negotiation intervalsession2 charge per negotiation intervalsession3 charge per negotiation interval
b)0 500 1000 1500 2000 2500
0
1000
2000
3000
Time (seconds)
Tot
al b
andw
idth
res
erva
tion
requ
est (
kb/s
)
0 500 1000 1500 2000 25000
2
4
6
0 500 1000 1500 2000 25000
2
4
6
Pric
e (c
ents
/Mb)
network bandwidth price
network bandwidth threshold
total network bandwidth demand
Figure 9: Network charges for different users a) and the total network bandwidth demand and price b) when the users havedifferent demand elasticity
a)0 500 1000 1500 2000 2500
500
1000
1500
2000
2500
3000
Time (seconds)
Ban
dwid
th r
eser
vatio
n (k
b/s)
session1 session2 session3 system affordable total bandwidth
b)0 500 1000 1500 2000 2500
0.2
0.4
0.6
0.8
1
1.2
1.4
1.6
Time (seconds)
Use
r su
rplu
s ($
/min
)
session1session2session3system
Figure 10:Bandwidth reservation a) and perceived surplus value b) for adaptation across media sessions in a system, all sessionshaving the same utility
6.2.3 Adaptation Across Media
The experiments so far show how a utility function serves to guide bandwidth adaptation by an applicationin response to congestion-sensitive pricing in the network, and how bandwidth is shared by competingapplications based on individual demand elasticities. In this section, we look at how utility functions guidethe distribution of bandwidth across different media which are part of a multimedia system belonging to asingle user. The results of two experiments are presented.
In the first experiment, the system consists of three media sessions, all of which have the same utilityfunction, Utility1 shown in Fig. 5. When the system budget is exceeded due to congestion, the HRN adjuststhe application bandwidths downwards according to the adaptation algorithm described in Section 3.2.3.Since all the applications have identical utilities, the total system bandwidth is equally distributed betweenthem at all times, as seen in Fig. 10 a).
The second experiment is similar except that the three media sessions have different utility functionsshown in Fig. 7. Fig. 11 a) shows that when the total optimal bandwidth requirement for all the mediasessions in the system exceeds the system budget, the media session with the more elastic resource demandwill be assigned relatively less bandwidth so as to maximize the overall perceived value. This is a similarresult to that obtained in section 6.2.2 for multiple competing user applications. In effect, the system regardsa media session with more elastic requirements as being more able to absorb bandwidth reductions, and“borrows” bandwidth from this session to give to other sessions.
18

a)0 500 1000 1500 2000 2500
500
1000
1500
2000
2500
3000
Time (seconds)
Ban
dwid
th r
eser
vatio
n (k
b/s)
session1 session2 session3 system affordable total bandwidth
b)0 500 1000 1500 2000 2500
0.2
0.4
0.6
0.8
1
1.2
1.4
1.6
Time (seconds)
Use
r su
rplu
s ($
/min
)
session1session2session3system
Figure 11:Resource reservation a) and perceived surplus value b) among sessions of a system with different bandwidth sensitivity
a)0 200 400 600 800 1000 1200 1400 1600
0
0.5
1
1.5
2
2.5
3
3.5
Bandwidth (kb/s)
Use
r ut
ility
/Cos
t ($/
min
)
utility (α = 1) utility (α = 1.1)utility (α = 1.2)minimum cost
b)0 200 400 600 800 1000 1200 1400 1600
0
0.5
1
1.5
2
2.5
3
3.5
Bandwidth (kb/s)
Use
r ut
ility
/Cos
t ($/
min
)
utility1 (β = 0) utility2 (β = −7.8 c/min) utility3 (β = −15.6 c/min)minimum cost
Figure 12:Equivalent utilities under multiplicative scaling a) and additive shifting b)
6.2.4 Linear Operations on Utility Functions
In this section, we show how linear operations on the utility function, namely multiplicative scaling by aweightα, and additive or subtractive shifting by an amountβ, influence bandwidth selection and distribution.The experiment studies bandwidth distribution between multiple sessions in a system belonging to a singleuser, though similar results have also been observed with applications belonging to different users.
Consider three media sessions belonging to a system, all with the same basic (un-scaled) utility function(we use utility1 of Fig. 7). Sessions 1, 2, and 3 are assigned scaling factors of 1, 1.1, and 1.2 respectively.The resulting scaled utilities are shown in Fig. 12 a).
Fig. 13 shows the variation of individual and system bandwidth allocations and perceived surpluses.Expectedly, when the adaptation is constrained by the system budget, an application with a higherα gets alarger bandwidth share because of its lower elasticity of demand.
We now consider the effect of an offset applied uniformly to the utility over all bandwidths, so thatthe utility function shifts upwards or downwards. In Fig. 14 b), the utility1 function (which is the same asutility1 in Fig. 7 a) is shifted downwards and form utility2 and utility3. Three different sessions are assigneddifferent utility functions.
The results shown on Fig. 14 a) shows that all three sessions are allocated the same bandwidth thoughFig. 14 b) shows that the allocation results in different values of perceived surplus. This is because util-ity function represents the relative preference of the user for different bandwidths. The absolute value ofthe utility is not important - the adaptation algorithm only searches for the bandwidth with the maximumperceived value relative to its cost.
19

a)0 500 1000 1500 2000 2500
500
1000
1500
2000
2500
3000
Time (seconds)
Ban
dwid
th r
eser
vatio
n (k
b/s)
session1 (α = 1) session2 (α = 1.1) session3 (α = 1.2) system affordable system bandwidth
b)0 500 1000 1500 2000 2500
0.2
0.4
0.6
0.8
1
1.2
1.4
1.6
1.8
2
2.2
Time (seconds)
Use
r su
rplu
s ($
/min
)
session1 (α = 1) session2 (α = 1.1)session3 (α = 1.2)system
Figure 13:Bandwidth reservation and perceived surplus for utilities scaled multiplicatively by different amounts
a)0 500 1000 1500 2000 2500 3000
500
1000
1500
2000
2500
3000
Time (seconds)
Ban
dwid
th r
eser
vatio
n (k
b/s)
session1 (β = 0) session2 (β = −7.8 c/min) session3 (β = −15.5 c/min)system affordable system bandwidth
b)0 500 1000 1500 2000 2500 3000
0.5
1
1.5
2
2.5
3
Time (seconds)
Use
r su
rplu
s ($
/min
)
session1 (β = 0) session2 (β = −7.8 c/min) session3 (β = −15.5 c/min)system
Figure 14:Bandwidth reservation and perceived surplus for utilities shifted additively by different amounts
20

a)0 500 1000 1500
0
0.5
1
1.5
2
2.5
3
3.5
Bandwidth (kb/s)
Util
ity/C
ost (
$/m
in)
audio utilityvideo utilityminimum cost
b)0 500 1000 1500 2000 2500 3000 3500
0
5000
Time (seconds)
Tot
al b
andw
idth
res
erva
tion
requ
est (
kb/s
)
0 500 1000 1500 2000 2500 3000 35000
5
Pric
e (c
ents
/Mb)
network bandiwdth price
total network bandiwdth demand
Figure 15:a) Audio and video utility functions used for adaptation by MINT b) Price and total bandwidth variation in the sameexperiment
a)0 500 1000 1500 2000 2500 3000 3500
0
200
400
600
800
1000
1200
Time (seconds)
Ban
dwid
th r
eser
vatio
n (k
b/s)
session1 session2 session3 mint audiomint videomint total
b)0 500 1000 1500 2000 2500 3000 3500
100
200
300
400
500
600
700
Time (seconds)
Use
r su
rplu
s ($
/min
)
session1 session2 session3 mint audiomint videomint total
Figure 16:Individual bandwidth reservations and perceived surplus in the adaptation of Mint applications
6.2.5 Adaptation in MINT
Finally, we examine the adaptive behavior of the audio (NeVoT) and video (NeViT) applications in theMINT video conference system. The utility functions for the audio and video applications are shown in Fig.15 a).
At the un-congested link bandwidth price, the optimal audio bandwidth for MINT is 64 kb/s, and theoptimal video bandwidth is 384 kb/s. The MINT applications compete for bandwidth with three singlemedia applications belonging to different users. The applications use the utility functions of Fig. 7. Thethree user applications are started first, and reach stability at time 630 seconds with bandwidth allocationsof 712 kb/s, 994 kb/s, and 994 kb/s respectively.
At time 2000 seconds, the MINT video conference system is started, and it first requests optimal band-width allocation (64 kb/s + 384 kb/s). The total requested bandwidth exceeds the link congestion threshold,forcing the price up. It is observed the NeVoT bandwidth remains unchanged, and the NeViT bandwidthis reduced to 342 kb/s. The bandwidth share of the three competing user application drops to 700 kb/s,800 kb/s and 907 kb/s respectively. User 1 has the most elastic bandwidth requirement between 700 kb/sand 1000 kb/s, and therefore initially gets a smaller share. But it is less elastic above 700 kb/s, and afterthe MINT applications are started, user 2, which has a relatively greater elasticity near its current alloca-tion, reduces its requirement the most. The above experiment demonstrates the efficacy of the adaptationframework in allowing new sessions to join gracefully even when the network is highly loaded.
21

7 Related Work
In this section we briefly discuss related research work in three main areas: resource reservation and alloca-tion mechanisms; bandwidth adaptation by applications; billing and pricing in the network.
7.1 Resource Reservation and Allocation
Current research in providing QoS support in the Internet is mainly based on two architectures defined byIETF: Per-flow basedintegrated services(int-serv) [8], and class-baseddifferentiated service(diff-serv) [9].In both architectures, implementations should include a mechanism by which the user can request specificnetwork services, and thus acquire network resources. Per-flow resource reservation in int-serv is generallyimplemented through the RSVP reservation protocol [1]. Implementation of resource reservation for diff-serv is a subject of ongoing research, and various approaches have been proposed [32]. In general, RSVPand the implementations of diff-serv lack integrated mechanisms by which the user can select one out ofa spectrum of services, and re-negotiate resource reservations dynamically. They also do not integrate thepricing and billing mechanisms which must accompany such services.
Resource allocation schemes based on perceived-quality have been studied in [36][37][47]. These stud-ies were limited to a local system, and did not address the interaction of the local system with a largenetwork. Liao [48] allocates resources to achieve equal perceived quality. In section 2, we argued thatperceived quality does not directly represent the economic value of communications.
7.2 Bandwidth Adaptation
fixed adjust at adjust adjust adjustrate conn. setup (∼min) (∼10s) (RTT∼100ms)
reservation telephone int-serv/diff-serv, RNAP — —based int-serv/diff-serv RNAPbest effort current based on access RNAP adaptation TCPbased multimedia line speed in literature
Table 1: Comparison of algorithms for adjusting bandwidth in response to congestion
In this section, we categorize approaches towards bandwidth adaptation in reponse to congestion, assummarized in Table 1. The first row of Table 1 shows approaches that rely on reservation, and the secondrow shows approaches that do not. The clumns correspond to adaptation at different time scales, decreasingfrom left to right. In the simplest form, the bandwidth of the application is constant and independent ofthe network condition. Examples include common streaming applications that simply attempt to send dataor reserve a given bandwidth. Many applications can adjust their resource demand at the time of sessioncreation. For reservation-based systems, OPWA [2] can be used to find out the available bandwidth. Forbest-effort systems, the end system may know its network access bandwidth and thus avoid requesting a 1Mb/s stream when connected via a 28.8 kb/s modem.
Truly adaptive applications can adjust their resource usage on several different time-scales. In the table,we show time scales of minutes, seconds to several tens of seconds and on the order of a round-trip time.As far as we know, adjustable reservations on any time scale has not been studied extensively. A lot ofrecent research on adaptation is based on best-effort service, with signaling mechanisms such as packet lossrates for feedback [12]. For example, loss rates can be determined from RTP information [13], which isdistributed on the order of five to several tens of seconds for modest-size receiver groups. Data applications
22
can easily adjust their rate every round-trip time. However, adjustments more frequent than every minute orso are likely to be perceptually annoying.
In earlier work, we described a Resource Negotiation and Pricing Protocol [14]. RNAP enables thenetwork to periodically formulate service prices and communicate current prices to the user. Since RNAPfocuses on dynamic re-negotiation and pricing, it allows the time scale of price updation and rate adaptationto be tailored to user requirements and service characteristics. In general, we envision a time scale of minutesfor the RNAP-based adaptation process.
7.3 Pricing and Billing in the Network
Microeconomic principles has been applied to various network traffic management problems. The studiesin [34][36][38][39][42] are based on a maximization process to determine the optimal resource allocationsuch that the utility (a function that maps a resource amount to a satisfaction level) of a group of users ismaximized. These approaches normally rely on a centralized optimization process, which does not scale.Also, some of the algorithms assume some knowledge of the user’s utility curves and truthful revelation byusers of their utility curves, which may not be practical in a centralized process.
In [33][35][40][41][45], the resources are priced to reflect demand and supply. The pricing modelin these approaches is usage-sensitive - it has been shown that usage-sensitive pricing results in higherutilization than traditional flat (single) pricing [33]. Some of these methods are limited by their reliance ona well-defined statistical model of source traffic, and are generally not intended to adapt to changing trafficdemands.
The scheme presented in [41] is more similar to our work in that it takes into account the networkdynamics (session join or leave) and source traffic characteristics (VBR). It also allows different equilibriumprice over a different time period, depending on the different user resource demand. However, congestion isonly considered during admission control. Our pricing algorithm has two congestion-dependent components- congestion due to excessive resource reservation (holding cost) and congestion due to network usage (usagecost).
In general, the work cited above differs from ours in that it does not enter into detail about the negotiationprocess and the network architecture, and mechanisms for collecting and communicating locally computedprices. Our work is more concerned with developing a flexible and general framework for resource nego-tiation and pricing and billing, decoupled from specific network service protocols and pricing and resourceallocation algorithms. Our work can therefore be regarded as complementary with some of the cited work.
In [46], a charging and payment scheme for RSVP-based QoS reservations is described. A significantdifference from our work is the absence of an explicit price quotation mechanism - instead, the user acceptsor rejects the estimated charge for a reservation request. Also, the scheme is coupled to a particular serviceenvironment (int-serv), whereas our goal is to develop a more flexible negotiation protocol usable withdifferent service models.
8 Summary
We have presented a framework for incentive-driven rate and QoS adaptation by an application or multi-application system. In this framework, the user responds actively to changes in price signaled by the net-work by dynamically adjusting network resource usage by the application. The adaptation is based onthe user-perceived value of a given combination of transmission parameters, relative to the cost of obtain-ing the corresponding service from the network, taking into account constraints imposed by the minimumapplication requirements and the budget specified by the user. In a multi-application system such as a video-conference application, the system budget is distributed among the component media according to changes
23

in price, as well as changes in the relative utilities with time or under different application scenarios, so as tomaximize the overall perceived value relative to cost. Some heuristics are discussed to simplify this process.
Experimental results show that perceived value based adaptation allows bandwidth to be shared amongcompeting users or applications in a system fairly. At the onset of congestion, the bandwidth share of userswith more elastic demands is reduced more, but all users receive equitable levels of perceived surplus. Wehave discussed the stability of the dynamic pricing algorithm and bandwidth adaptation, and a PD controllaw is shown to minimize oscillations and abrupt transitions in the bandwidth adaptation. Multiplicativescaling and additive shifting of utility functions can be used to control the evolution of application utilitieswith time.
References
[1] R. Braden, L. Zhang, S. Berson, S. Herzog, and S. Jamin, “Resource Reservation Protocol (RSVP) -version 1 Functional Specification”, RFC 2205, Set. 1997.
[2] S. Shenker, and L. Breslau, “Two issues in reservation establishment”,Proc. ACM SIGCOMM’95,Cambridge, MA, August 1995.
[3] J. Wroclawski, “Specification of the controlled-load network element service,” RFC 2211, Sept. 1997.
[4] S. Shenker, C. Partridge, and R. Guerin, “Specification of guaranteed quality of service,” RFC 2212,Sept. 1997.
[5] P. Pan and H. Schulzrinne, “YESSIR: A simple reservation mechanism for the Internet”, InInter-national Workshop on Network and Operating Systems Support for Digital Audio and Video (NOSS-DAV’98), Cambridge, England, July 1998.
[6] S. Jamin, S. J. Shenker, and P. B. Danzig, “Comparison of measurement-based admission controlalgorithms for controlled-Load service,”,Proc. IEEE INFOCOM’97, April 1997.
[7] H. Zhang and S. Keshav, “Comparison of rate-based service disciplines”,Proc. ACM SIGCOMM’91,Zurich, Switzerland, Sept. 1991.
[8] R. Braden, D. Clark, and S. Shenker, “Integrated services in the internet architecture: an overview,”Request for Comments (Informational) 1633, Internet Engineering Task Force, June 1994.
[9] K. Nichols, V. Jacobson, and L. Zhang, “A two-bit differentiated services architecture for the Inter-net,” Internet Engineering Task Force, Nov. 1997. Work in progress.
[10] V. Jacobson, K. Nichols, and K. Poduri, “An expedited forwarding PHB,” Internet Draft, InternetEngineering Task Force, Feb. 1999. Work in progress.
[11] J. Heinanen, F. Baker, W. Weiss, and J. Wroclawski, “Assured forwarding PHB group,” Internet Draft,Internet Engineering Task Force, Feb. 1999. Work in progress.
[12] X. Wang and H. Schulzrinne, “Comparison of adaptive Internet multimedia applications,” To appearat IEICE Transactions on Communications., June, 1999.
[13] H. Schulzrinne, S. Casner, R. Frederick, and V. Jacobson, “RTP: a transport protocol for real-timeapplications,” RFC 1889, e, Jan. 1996.
24

[14] X. Wang and H. Schulzrinne, “RNAP: A Resource Negotiation and Pricing Protocol”, to appear atInternational Workshop on Network and Operating Systems Support for Digital Audio and Video(NOSSDAV’99).
[15] R. Velthuys, J. Wong, K. Lyons, G. v. Bochmann, E. Dubois, N. Georganas, G. Neufeld, and T. Ozsu,“Enabling technologies for distributed multimedia applications”, CITR Internal Report, 1995.
[16] D. Sisalem and H. Schulzrinne, “The multimedia Internet terminal (MINT),”Journal of Telecommu-nications, vol. 9, pp. 423-444, 1998.
[17] Henning Schulzrinne, “Dynamic configuration of conferencing applications using pattern-matchingmulticast,”International Workshop on Network and Operating Systems Support for Digital Audio andVideo (NOSSDAV’95), 1995.
[18] H. Varian, “Microeconomic Analysis,” Third Edition.
[19] ITU-T P.800, “Methods for subjective determination of transmission quality”.
[20] H. Knoche, H. De Meer, D. Kirsh, “Utility curves: Mean Opinion Scores considered biased,” Toappear atIWQoS’99, London, June, 1999.
[21] O. Ostberg, B. Lindstrom, and P-O., Renhall, “Contribution of display size to speech intelligibilityin video-phone systems”,International Journal of Human-Computer Interaction, 1(1), pp 149-159,1989.
[22] A. H., Anderson, E. G. Bard, C. Sotillo, A. Newlands, G. Doherty-Sneddon, “Limited visual controlof the intelligibility of speech in face-to-face dialogues,” inPerception and Psychophysics, 59(4),580-592., 1997.
[23] C. Lambrecht and O. Verscheure, “Perceptual quality measure using a spatio-temporal model of hu-man visual system”,Proc. of IS&T/SPIE, San Jose, Feb, 1996.
[24] A. Watson and M. A. Sasse, “Evaluating audio and video quality in low-cost multimedia conferencingsystems,”Interacting with Computers, Vol. 8 (3), pp. 255-275, 1996.
[25] P. Usai and C. Grilli, “Subjective testing methodology to assess price vs. transmission qualityof telecommunication services,” inProc. of 15th International Symposium on Human Factors InTelecommunications, (Melbourne, Australia), Mar. 1995.
[26] E. A. Isaacs and J. C. Tang, “What video can and cannot do for collaboration: A case study,”Multi-media Systems, vol. 2, pp. 63-73, 1994.
[27] M. Podolsky, C. Romer, and S. McCanne, “Simulation of FEC-Based Error Control for Packet Audioon the Internet,” inProceedings of the Conference on Computer Communications (IEEE Infocom),(San Francisco, California), pp. 505, March/April 1998.
[28] R. Vaccaro, “Digital control, a state space approach”, McGraw Hill, New York, 1995
[29] J. Padhyem, J. Kurose, D. Towsley and R. Koodli, “A TCP-Friendly Rate Adjustment Protocol forContinuous Media Flows over Best Effort Networks” ,UMass-CMPSCI Technical ReportTR 98-04,October 1998.
[30] S. Floyd, and K. Fall, “Promoting the Use of End-to-End Congestion Control in the Internet”. Sub-mitted for publication, Feb. 1998.
25

[31] D. Lin and R. Morris, “ Dynamics of random early detection” .Proc. SIGCOMM’97,
[32] Internet 2 Bandwidth Broker Information, http://www.merit.edu/working.groups/i2-qbone-bb.
[33] R. Cocchi, S. Shenker, D. Estrin, and L. Zhang, “Pricing in computer networks: Motivation, formu-lation, and example,”IEEE/ACM Transactions on Networking, vol. 1, pp 614-27, Dec. 1993.
[34] J. F. MacKie-Mason and H. Varian, “Pricing Congestible Network Resources,”IEEE J. Select. AreasCommun.,, vol. 13, no. 7, pp 1141-9, Sept. 1995.
[35] N. Anerousis and A. A. Lazar, “A framework for pricing virtual circuit and virtual path services inatm networks”,ITC-15, pp. 791 - 802, 1997.
[36] A. Hafid, G. V. Bochmann and B. Kerherve,“A quality of service negotiation procedure for distributedmultimedia presentational applications,”Proceedings of the Fifth IEEE International Symposium OnHigh Performance Distributed Computing (HPDC-5), Syracuse, New York, 1996.
[37] T. F. Abdelzaher, E. M. Atkins, and K. Shin, “QoS negotiation in real-time systems and its applicationto automated flight control,” To appear inIEEE Transactions on Software Engineering, 1999.
[38] H. Jiang and S. Jordan, “A pricing model for high speed networks with guaranteed quality of service,”in Proceedings of the Conference on Computer Communications (IEEE Infocom), (San Fransisco,California), Mar. 1996.
[39] S. Low and P. Varaiya, “An algorithm for optimal service provisioning using resource pricing,” inProceedings of the Conference on Computer Communications (IEEE Infocom), (Toronto, Canada),June 1994.
[40] D. F. Ferguson, C. Nikolaou, and Y. Yemini, “An economy for flow control in computer networks,”in Proceedings of theConference on Computer Communications (IEEE Infocom), (Ottawa, Canada),pp. 110-118, IEEE, Apr. 1989.
[41] E. W. Fulp, D. S. Reeves, “Distributed network flow control based on dynamic competive markets,”Proceedings International Conference on Network Protocol (ICNP’98), Austin Texas, Oct. 13-16,1998.
[42] F. P. Kelly, A.K. Maulloo and D.K.H. Tan, “Rate control in communication networks: shadow prices,proportional fairness and stability,”Journal of the Operational Research Society49 (1998), 237-252.
[43] H. Varian, “Microeconomic Analysis,” Third Edition, 1993. W.W. Norton & pany.
[44] Hahn F (1982). Stability. In: Arrow KJ and Intriligator MD (eds), “handbook of Mathematical Eco-nomics”, Volumn II. Noth-Holland, Amesterdam, pp 745-793.
[45] J. Sairamesh, “Economic paradigms for information systems and networks”, PhD thesis, ColumbiaUniversity, New York 1997.
[46] M. Karsten, J. Schmitt, L. Wolf, and R. Steinmetz, “An embedded charging approach for RSVP,”TheSixth International Workshop on Quality of Service (IWQoS’98), pp 91-100, Napa, California, USA.
[47] C. Lee, J. Lehoczky, R. Rajkumar and D. Siewiorek, “On Quality of Service Optimization withDiscrete QoS Options,”Proceedings of the IEEE Real-time Technology and Applications Symposium,June 1999.
26

[48] G. Bianchi, A.T. Campbell, and R.R.-F. Liao, “On utility-fair adaptive services in wireless networks,” 6th International Workshop on Quality of Service (IEEE/IFIP IWQOS’98), Napa Valley, CA, May1998.
27