Embed Size (px)
Citation preview

Incentive Contracts
The Attributes that Matter Most in Driving Favorable OutcomesRobert L. Tremaine
Maximizing Warfi ghter Capability Using Surveyed Necessity Measurement
Application to the USAF F-15C FleetJohn M. Colombi David R. JacquesDennis D. Strouble
Training Architecture Practices in Army AcquisitionAn Approach to Training Software Architecture Practices
in U.S. Army AcquisitionStephen Blanchette
John Bergey
The Application of Supply Network Optimization and Location Analysis to a DoD Repair Supply Chain
William R KillingsworthDavid BerkowitzJohn E. Burnett
James T. Simpson
Reforming How Navy Shipbuilding Contracts Adjust for Material-Cost Risk
Edward G. KeatingRobert MurphyJohn F. Schank
John Birkler
Do Team Goals Affect Team Focus and Performance? A Research Study of DAU’s Program
Management Offi ce Course (PMT 352B)Thomas Robert Edison
49 D
EFENSE A
CQ
UISITIO
N R
EVIEW
JOU
RN
AL
Defense A
cquisition University
Decem
ber 2008 D
AU
Press
December 2008 Vol. 15 No. 3
Learn. Perform. Succeed.
4949

Report Documentation Page Form ApprovedOMB No. 0704-0188
Public reporting burden for the collection of information is estimated to average 1 hour per response, including the time for reviewing instructions, searching existing data sources, gathering andmaintaining the data needed, and completing and reviewing the collection of information. Send comments regarding this burden estimate or any other aspect of this collection of information,including suggestions for reducing this burden, to Washington Headquarters Services, Directorate for Information Operations and Reports, 1215 Jefferson Davis Highway, Suite 1204, ArlingtonVA 22202-4302. Respondents should be aware that notwithstanding any other provision of law, no person shall be subject to a penalty for failing to comply with a collection of information if itdoes not display a currently valid OMB control number.
1. REPORT DATE DEC 2008 2. REPORT TYPE
3. DATES COVERED 00-00-2008 to 00-00-2008
4. TITLE AND SUBTITLE Defense AR Journal, Volume 15, Number 3, December 2008
5a. CONTRACT NUMBER
5b. GRANT NUMBER
5c. PROGRAM ELEMENT NUMBER
6. AUTHOR(S) 5d. PROJECT NUMBER
5e. TASK NUMBER
5f. WORK UNIT NUMBER
7. PERFORMING ORGANIZATION NAME(S) AND ADDRESS(ES) Defense Acquisition University,ATTN: DAU Press,9820 Belvoir Rd Ste3,Fort Belvoir,VA,22060-9910
8. PERFORMING ORGANIZATIONREPORT NUMBER
9. SPONSORING/MONITORING AGENCY NAME(S) AND ADDRESS(ES) 10. SPONSOR/MONITOR’S ACRONYM(S)
11. SPONSOR/MONITOR’S REPORT NUMBER(S)
12. DISTRIBUTION/AVAILABILITY STATEMENT Approved for public release; distribution unlimited
13. SUPPLEMENTARY NOTES
14. ABSTRACT
15. SUBJECT TERMS
16. SECURITY CLASSIFICATION OF: 17. LIMITATION OF ABSTRACT Same as
Report (SAR)
18. NUMBEROF PAGES
128
19a. NAME OFRESPONSIBLE PERSON
a. REPORT unclassified
b. ABSTRACT unclassified
c. THIS PAGE unclassified
Standard Form 298 (Rev. 8-98) Prescribed by ANSI Std Z39-18

Frank J. Anderson, Jr.President, Defense Acquisition University
Board of ReviewAnthony MartocciaOffi ce of Small Business ProgramsDepartment of Defense
Shay AssadDirector, Defense Procurement, Acquisition Policy and Strategic SourcingOffi ce of the Under Secretary of Defense(Acquisition, Technology and Logistics)
Dr. J. Ronald FoxProfessor Business Administration, EmeritusHarvard Business School
ADM James R. Hogg, U.S. Navy (Ret)Director, Chief of Naval Operations, Strategic Studies Group
Scottie KnottDirector, Acquisition Management, Senior Procurement Executive, and Component Acquisition Executive, Defense Logistics Agency
John J. YoungUnder Secretary of Defense(Acquisition, Technology and Logistics)
Dr. Diane R. MurphyChief Executive Offi cer/FounderInformation Technology Management Institute
April G. StephensonDirectorDefense Contract Audit Agency
Eleanor SpectorVice President of ContractsLockheed Martin Corporation
Kathryn C. TurnerPresident and Chief Executive Offi cerStandard Technology, Inc.
Editorial BoardDr. Paul Alfi eri
Chairman and Executive EditorDr. Richard DonnellyThe George Washington University
Randy T. FowlerCurriculum Development and Support Center, Defense Acquisition University
Dr. Ned KockTexas A&M International University
Dr. Ira LewisNaval Postgraduate School
Dr. E. Johnson MaritsThe George Washington University
Dr. Mark MontrollIndustrial College of the Armed Forces
Joseph JohnsonDAU Chief of Staff
Dr. Keith SniderNaval Postgraduate School
Charles E. Tompkins III, Esq.Information Resources Management College
The Defense Acquisition Review Journal, formerly the Acquisition Review Quarterly journal, is published quarterly by the Defense Acquisition University (DAU) Press. Postage is paid at the U.S. Postal facility, Fort Belvoir, VA, and at additional U.S. Postal facilities. Postmaster, send address changes to: Editor, Defense Acquisition Review Journal, DAU Press, 9820 Belvoir Road, Suite 3, Fort Belvoir, VA 22060-5565. For free copies, mail written requests with an original signature to the above address using the subscription form provided in this journal. Articles represent the views of the authors and do not necessarily refl ect the opinion of the DAU or the Department of Defense. Some photos appearing in this publication may be digitally enhanced. ISSN 1553-6408.
The Defense Acquisition Review Journal is available electronically on the DAU Home Page at http://www.dau.mil/pubs/arqtoc.asp
Eduard H. BoydDirector, DAU Press
Paula CroisetierePrepress Production Manager
Norene L. Fagan-BlanchManaging Editor
Harambee DennisGraphic Designer
Denise Balon andNiki Dowdell
Editorial Assistants
Schatz Publishing Group and Collie Johnson
Technical Editing, Design,and Layout
DEFENSEACQUISITION REVIEW JOURNAL
TABLE OF CONTENTSDECEMBER 2008
VOL. 15, NO. 3
A NOTE FROM THE EXECUTIVE EDITOR
217 INCENTIVE CONTRACTS: THE ATTRIBUTES THAT MATTER MOST IN DRIVING FAVORABLE OUTCOMES
Robert L. Tremaine
Incentive contracts have been in place for many years. They represent just one of many contractual tools the Department of Defense has at its disposal to drive certain performance behaviors. Lately, the usefulness of incentive contracts has come into question. The dividends have not been readily apparent. This research study set out to determine what generally afforded strong correlations between incentive-type contracts and expected performance outcomes. Twenty-fi ve weapon system acquisition program offi ces were interviewed in various stages of their acquisition life cycle. A standardized questionnaire-survey was used to capture the data. This article addresses the fi ndings and includes a few key recommendations intended to highlight learning assets available to the acquisition workforce on the use of incentive contracts.
241 MAXIMIZING WARFIGHTER CAPABILITY USING SURVEYED NECESSITY MEASUREMENT: APPLICATION
TO THE USAF F-15C FLEETJohn M. Colombi, David R. Jacques, and Dennis D. Strouble
Within the Department of Defense, with changing missions to counter dynamic and asymmetrical threats, the acquisition workforce strives to maximize capability for joint warfi ghting. How acquisition professionals measure and select capability improvements for the nation’s weapon systems is a perpetual
challenge, made even more complex with constrained defense budgets. This study identifi es a method for determining which upgrades should be purchased (production) for which aircraft in the F-15C fl eet by optimizing a capability proxy measure. Each upgrade’s “necessity” for a given mission area was obtained by conducting a survey of over 250 experienced F-15C pilots. The solution presented in this article should be extensible to other weapon system capability decisions.
261 TRAINING ARCHITECTURE PRACTICES IN ARMY ACQUISITION: AN APPROACH TO TRAINING SOFTWARE ARCHITECTURE
PRACTICES IN U.S. ARMY ACQUISITIONStephen Blanchette and John Bergey
Technology management skills in the Department of Defense (DoD) are not keeping pace with the advanced systems acquired by the DoD, especially as software becomes more prevalent in those systems. For a number of years, software architecture practices have been identifi ed as enablers of program success, yet evidence suggests that too little attention is paid to the topic. The Army Strategic Software Improvement Program (ASSIP) seeks to dramatically improve the acquisition of software-intensive systems, in part through improved acquisition workforce skills. Through ASSIP, the Army has begun to build a level of technical expertise in modern software architecture practices within its acquisition community. This article discusses the training component of the ASSIP Software Architecture Initiative.
277 THE APPLICATION OF SUPPLY NETWORK OPTIMIZATION AND LOCATION ANALYSIS TO A DoD REPAIR SUPPLY CHAIN
William R. Killingsworth, David Berkowitz, John E. Burnett, and James T. Simpson
A major responsibility of the military and its suppliers is to provide an adequate supply of parts and materials to support warfi ghters throughout the world. This article reviews a process used by an Army global supply chain to make a location decision for a critical distribution center. Additionally, it demonstrates the applicability of network optimization techniques to a DoD supply chain location analysis problem. Finally, it investigates the feasibility of making a $15 or $25 million capital investment to provide an alternative repair facility.
293 REFORMING HOW NAVY SHIPBUILDING CONTRACTS ADJUST FOR MATERIAL-COST RISK
Edward G. Keating, Robert Murphy, John F. Schank, and John Birkler
This article describes how the U.S. Navy structures fi xed-price and fi xed-price, incentive-fee shipbuilding contracts and how labor- and material-cost indexes can mitigate shipbuilder risk in either type of contract. The Navy frequently uses the Steel Vessel material-cost index, a Bureau of Labor Statistics-derived cost index based on the mix of materials in a typical commercial cargo ship constructed in the 1950s. The Steel Vessel Index has excessive weighting on iron and steel, thereby providing shipbuilders with a mismatch between their actual and the Index-assumed material cost structure. The authors recommend the Navy use a material-cost index with more up-to-date weightings.
307 DO TEAM GOALS AFFECT TEAM FOCUS AND PERFORMANCE? RESEARCH STUDY OF DAU’S PROGRAM MANAGEMENT
OFFICE COURSE (PMT 352B)Thomas Robert Edison
Teams can be a signifi cant resource to business leaders and can help lead to greater program successes. This study was conducted on student project teams in 12 classes of a Defense Acquisition University (DAU) executive- level, 6-week program management class in six different locations. The study not only underscores the signifi cance of team focus on performance, but also highlights how team characteristics affect team focus and performance. Signifi cant direct relationships were found in the study’s 15 tested hypotheses between work team strategic intent (the team’s purpose, objectives, and strategies) and team performance, as measured by team self-assessments and instructor assessments. The results of this study have applications to the successful use of project teams throughout DoD.
320 CALL FOR AUTHORS
321 GUIDELINES FOR CONTRIBUTORS

DEFENSE ACQUISITION REVIEW JOURNAL
DEFENSE ARJ EXECUTIVE EDITOR
iDecember 2008
DEFENSE ARJEXECUTIVE
EDITOR
Welcome to the Defense Acquisition Review Journal (ARJ) Issue No. 49. Our fi rst article in this issue is “Incentive Contracts: The Attributes That Matter Most in Driving Favorable Outcomes,” by Robert L. Tremaine. This article summarizes the efforts of a DAU research team headed by the author, which was established to investigate and analyze the fi ndings of the Government Accountability Offi ce (GAO) regarding the use of incentives in Department of Defense (DoD) contracting. This is the second article from this research project to appear in the ARJ. The fi rst article, which appeared in Issue No. 48, was a subordinate article by two members of the research team and focused on selected parts of the study. This article, which is more extensive and comprehensive, captures the entire fi ndings from all 25 organizations participating in this Offi ce of the Secretary of Defense-sponsored research. Incentive contracts have been in place for many years, and they represent only one of the many contractual tools the DoD has at its disposal to drive certain performance behaviors. The objective of this study was to determine what correlations exist between incen-tive-type contracts and expected performance outcomes.
The second article, “Maximizing Warfi ghter Capability Using Surveyed Neces-sity Measurement: Application to the USAF F-15C Fleet,” by John M. Colombi, David R. Jacques, and Dennis D. Strouble, examines how upgrades and modifi cations to a legacy weapon system can logically be prioritized and implemented. Within the DoD, with changing missions to counter dynamic and asymmetric threats, the Services strive to maximize capability for joint warfi ghting. A good example is the F-15C program, for which there are a number of available capability upgrades that can markedly improve combat capability and reliability. However, the defense budget does not allow the F-15C program manager to acquire all potential upgrades for every aircraft. The purpose of this research study was to identify a methodology for determining which upgrades should be purchased for which aircraft in the fl eet, by quantitatively using a capability proxy measure. In the attempt to comparatively measure capability, each upgrade’s “necessity” for a given mission area was obtained by conducting a survey of over 250 experienced F-15C pilots. This “necessity” was
DEFENSE ACQUISITION REVIEW JOURNAL
ii December 2008
gauged relative to the F-15C’s expected role in the Concept of Operations of Global Persistent Attack and Homeland Security. A linear programming model searched for the optimal confi guration, which maximized capability of a weapon system—in this case the F-15C—constrained against an overall production budget authority. The solution to this problem is provided, as well as challenges to mathematical acquisi-tion deciding-aiding.
In the third article, “Training Architecture Practices in Army Acquisition: An Approach to Training Software Architecture Practices in U.S. Army Acquisition,” Stephen Blanchette and John Bergey examine the training concept of the Army Strategic Software Improvement Program (ASSIP) Software Architecture Initia-tive. Technology management skills in DoD are not keeping pace with the advanced systems acquired by DoD, especially as software becomes more prevalent in those systems. ASSIP seeks to dramatically improve the acquisition of software-intensive systems by building a level of technical expertise in modern software architecture practices within the acquisition community. The Software Engineering Institute has been working with the Army in a strategic partnership aimed at improving the ability to acquire software-intensive systems.
The fourth article is “The Application of Supply Network Optimization and Location Analysis to a DoD Repair Supply Chain,” by William R. Killingsworth, David Berkowitz, John E. Burnett, and James T. Simpson. The authors discuss the responsibility of the military and its suppliers to provide an adequate supply of parts and materials to support warfi ghters throughout the world. Using an Army helicopter case study, this article reviews a process used by an Army global supply chain to make a location decision for a critical distribution center. Additionally, the authors demonstrate the applicability of network optimization techniques to a supply chain location analysis problem.
The fi fth article, “Reforming How Navy Shipbuilding Contracts Adjust for Mate-rial-Cost Risk,” is authored by Edward G. Keating, Robert Murphy, John F. Schank, and John Birkler. This article describes how the U.S. Navy structures fi xed-price and fi xed-price, incentive-fee shipbuilding contracts and how labor- and material-cost indexes can mitigate shipbuilder risk in either type of contract. The Navy frequently uses the Steel Vessel material-cost index, a Bureau of Labor Statistics-derived cost index based on the mix of materials in a typical commercial cargo ship constructed in the 1950s. The Steel Vessel Index has excessive weighting on iron and steel, thereby providing shipbuilders with a mismatch between their actual and the Index-assumed material cost structure. The authors recommend the Navy use a material-cost index with more up-to-date weightings. Moving toward a better index would also be an opportunity to explore a time-phased material-cost index, e.g., refl ect the fact that shipbuilders typically buy keel steel early in production with on-board electronics procured much later in the construction process. The more accurately a material-cost index captures a shipbuilder’s external material cost risk, the less the Navy should have to pay its shipbuilders.
The sixth article in this issue, “Do Team Goals Affect Team Focus and Perfor-mance? Research Study of DAU’s Program Management Offi ce Course (PMT-352B), is by Thomas Robert Edison. This article characterizes a study of work team per-

DEFENSE ARJ EXECUTIVE EDITOR
iiiDecember 2008
formance in organizations. The Department of Defense, along with many defense industry partners operating in today’s complex and dynamic work environments, is becoming increasingly more dependent on work teams as a means of maximizing cre-ativity and effi ciency from its acquisition workforce. Work teams can be an important resource to defense/business leaders and can help optimize effectiveness of organiza-tions resulting in greater program successes.
Dr. Paul Alfi eriExecutive EditorDefense ARJ
NOTE FROM THE MANAGING EDITOR
This note serves as a correction to the volume number for Defense ARJ edition 48. Instead of July 2008 Vol. 16 No. 2, the cover should read July 2008 Vol. 15 No. 2.

DEFENSE ACQUISITION REVIEW JOURNAL
iv December 2008

December 2008
MAXIMIZING WARFIGHTER CAPABILITY
215
DECEMBER2008
DEFENSE ACQUISITION REVIEW JOURNAL
216 December 2008
Imag
e de
sign
ed b
y Sc
hatz
Pub
lishi
ng G
roup

December 2008
INCENTIVE CONTRACTS
217
INCENTIVE CONTRACTS: THE ATTRIBUTES THAT
MATTER MOST IN DRIVING FAVORABLE OUTCOMES
Robert L. Tremaine
Incentive contracts have been in place for many years. They represent just one of many contractual tools the Department of Defense has at its disposal to drive certain performance behaviors. Lately, the usefulness of incentive contracts has come into question. The dividends have not been readily apparent. This research study set out to determine what generally afforded strong correlations between incentive-type contracts and expected performance outcomes. Twenty-fi ve weapon system acquisition program offi ces were interviewed in various stages of their acquisition life cycle. A standardized questionnaire-survey was used to capture the data. This article addresses the fi ndings and includes a few key recommendations intended to highlight learning assets available to the acquisition workforce on the use of incentive contracts.
AUTHOR'S NOTE
A subordinate article regarding this research project was published in an earlier Defense Acquisition Review Journal, Vol. 48, by two of the seven research team members involved in the same research activity. This article is more extensive and captures the fi ndings of all 25 organizations interviewed in the conduct of this Offi ce of the Secretary of Defense (OSD)-sponsored research. Special thanks are extended to the entire research team, who devoted many hours devel-oping this research approach, conducting interviews, and analyzing the detailed data: Karen Byrd, Leslie Deneault, Alan Gilbreth, Sylvester Hubbard, Leonardo Manning, and Ralph Mitchell.
DEFENSE ACQUISITION REVIEW JOURNAL
218 December 2008
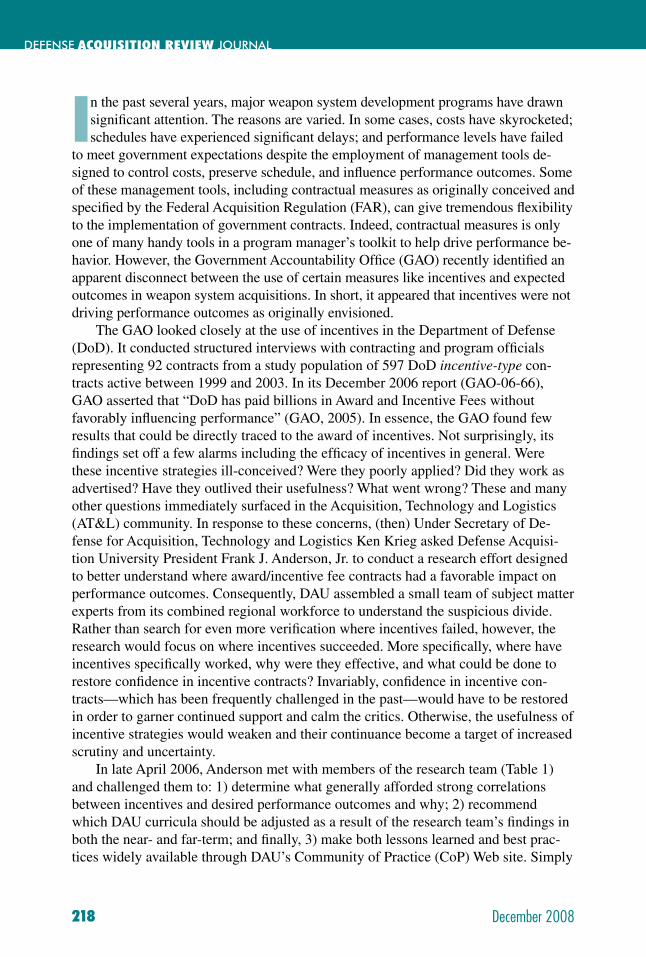
In the past several years, major weapon system development programs have drawn signifi cant attention. The reasons are varied. In some cases, costs have skyrocketed; schedules have experienced signifi cant delays; and performance levels have failed
to meet government expectations despite the employment of management tools de-signed to control costs, preserve schedule, and infl uence performance outcomes. Some of these management tools, including contractual measures as originally conceived and specifi ed by the Federal Acquisition Regulation (FAR), can give tremendous fl exibility to the implementation of government contracts. Indeed, contractual measures is only one of many handy tools in a program manager’s toolkit to help drive performance be-havior. However, the Government Accountability Offi ce (GAO) recently identifi ed an apparent disconnect between the use of certain measures like incentives and expected outcomes in weapon system acquisitions. In short, it appeared that incentives were not driving performance outcomes as originally envisioned.
The GAO looked closely at the use of incentives in the Department of Defense (DoD). It conducted structured interviews with contracting and program offi cials representing 92 contracts from a study population of 597 DoD incentive-type con-tracts active between 1999 and 2003. In its December 2006 report (GAO-06-66), GAO asserted that “DoD has paid billions in Award and Incentive Fees without favorably infl uencing performance” (GAO, 2005). In essence, the GAO found few results that could be directly traced to the award of incentives. Not surprisingly, its fi ndings set off a few alarms including the effi cacy of incentives in general. Were these incentive strategies ill-conceived? Were they poorly applied? Did they work as advertised? Have they outlived their usefulness? What went wrong? These and many other questions immediately surfaced in the Acquisition, Technology and Logistics (AT&L) community. In response to these concerns, (then) Under Secretary of De-fense for Acquisition, Technology and Logistics Ken Krieg asked Defense Acquisi-tion University President Frank J. Anderson, Jr. to conduct a research effort designed to better understand where award/incentive fee contracts had a favorable impact on performance outcomes. Consequently, DAU assembled a small team of subject matter experts from its combined regional workforce to understand the suspicious divide. Rather than search for even more verifi cation where incentives failed, however, the research would focus on where incentives succeeded. More specifi cally, where have incentives specifi cally worked, why were they effective, and what could be done to restore confi dence in incentive contracts? Invariably, confi dence in incentive con-tracts—which has been frequently challenged in the past—would have to be restored in order to garner continued support and calm the critics. Otherwise, the usefulness of incentive strategies would weaken and their continuance become a target of increased scrutiny and uncertainty.
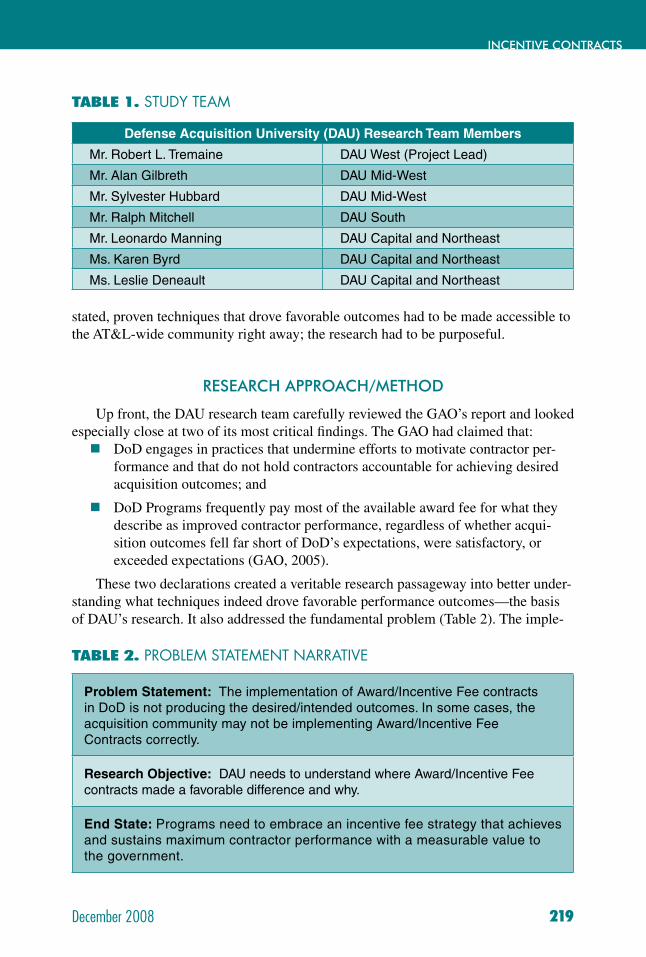
In late April 2006, Anderson met with members of the research team (Table 1) and challenged them to: 1) determine what generally afforded strong correlations between incentives and desired performance outcomes and why; 2) recommend which DAU curricula should be adjusted as a result of the research team’s fi ndings in both the near- and far-term; and fi nally, 3) make both lessons learned and best prac-tices widely available through DAU’s Community of Practice (CoP) Web site. Simply
December 2008
INCENTIVE CONTRACTS
219
stated, proven techniques that drove favorable outcomes had to be made accessible to the AT&L-wide community right away; the research had to be purposeful.
RESEARCH APPROACH/METHOD
Up front, the DAU research team carefully reviewed the GAO’s report and looked especially close at two of its most critical fi ndings. The GAO had claimed that:
DoD engages in practices that undermine efforts to motivate contractor per- formance and that do not hold contractors accountable for achieving desired acquisition outcomes; and
DoD Programs frequently pay most of the available award fee for what they describe as improved contractor performance, regardless of whether acqui-sition outcomes fell far short of DoD’s expectations, were satisfactory, or exceeded expectations (GAO, 2005).
These two declarations created a veritable research passageway into better under-standing what techniques indeed drove favorable performance outcomes—the basis of DAU’s research. It also addressed the fundamental problem (Table 2). The imple-
Defense Acquisition University (DAU) Research Team Members
Mr. Robert L. Tremaine DAU West (Project Lead)
Mr. Alan Gilbreth DAU Mid-West
Mr. Sylvester Hubbard DAU Mid-West
Mr. Ralph Mitchell DAU South
Mr. Leonardo Manning DAU Capital and Northeast
Ms. Karen Byrd DAU Capital and Northeast
Ms. Leslie Deneault DAU Capital and Northeast
TABLE 1. STUDY TEAM
TABLE 2. PROBLEM STATEMENT NARRATIVE
Problem Statement: The implementation of Award/Incentive Fee contracts in DoD is not producing the desired/intended outcomes. In some cases, the acquisition community may not be implementing Award/Incentive Fee Contracts correctly.
Research Objective: DAU needs to understand where Award/Incentive Fee contracts made a favorable difference and why.
End State: Programs need to embrace an incentive fee strategy that achieves and sustains maximum contractor performance with a measurable value to the government.
INCENTIVE CONTRACTS
DEFENSE ACQUISITION REVIEW JOURNAL
220 December 2008
mentation of Award/Incentive Fee contracts in DoD is not producing the desired/in-tended outcomes; and in some cases, the acquisition community may not be imple-menting Award/Incentive contracts correctly. Invariably, programs should embrace an incentive fee strategy that achieves and sustains maximum contractor performance with a measurable value to the government.
GROUND RULES AND ASSUMPTIONS
To both frame and bound the study efforts, DAU’s research team developed a few imperatives. The research would not dispute the validity of incentives nor serve as a reclama to the GAO report; the research would look for both deterministic and probabilistic incentive attributes; and fi nally, the research would begin with a few key assumptions:
Improved contractor performance has not always been achieved through the use of award fee/incentive fee contracts.
Award/incentive fee contracts can be powerful tools to favorably infl uence contractor performance in conjunction with good acquisition fundamentals.
Empirical evidence/measurable results could play a pivotal role in award/in- centive fee determinations.
GAO conclusions on the ineffectiveness of award/incentive fee contracting could be a result of certain ineffective practices that could be undermining policy.
These ground rules and assumptions would serve as a guidepost throughout this research project. Together, they would help keep the research focused and fi xed on the target without drifting from the “end-state” research objective.
FOLLOW-UP DISCUSSIONS WITH THE GAO
For calibration purposes and in search of additional detail, DAU met with the pri-mary authors of the GAO-06-66 Report, Tom Denomme and Ron Schwen, in mid-June 2006 and tunneled deeper into their study fi ndings. Both individuals were very informa-tive. They identifi ed supplementary observations during face-to-face discussions includ-ing two striking assessments: (1) Performance outcomes were sometimes unrealistic, and (2) technical performance measures (e.g., predictors of technical progress along a program’s pathway) did not seem to factor much in the overall Award Fee (T. Denom-me and R. Schwen, personal communication, June 20, 2006). It also became clear that the GAO viewed incentives as a reward, not just a motivational tool.
After allowing for the GAO’s additional comments and conducting a fair amount of deliberation on the DAU’s research direction, the team fashioned a basic game plan. It centered on a correlational research methodology. In other words, the re-search study would target the relationships between certain criterion variables (e.g., the “motivators”) and projected outcomes (e.g., the “successes”).
Ideally, program offi ces would have the most effective criterion variables and help confi rm what Award/Incentive Fee techniques were making a difference—a material difference. As part of their incentive strategy, program offi ces normally select certain criteria depending on what outcome(s) they need to achieve. Invariably, the team felt
DEFENSE ACQUISITION REVIEW JOURNAL
220
December 2008
INCENTIVE CONTRACTS
221
there had to be a few invaluable practices underway. After all, program offi ces would probably have abandoned or signifi cantly reduced the use of incentives if they were not making a difference and selected an alternative course of action instead.
INCENTIVES DEFINED
Contract incentives are varied, but understanding them and appropriately applying them is crucial. In its basic form, an incentive is really an extraordinary tool for certain applications. They come in many varieties. However, all are designed to drive some kind of desired outcome through the use of monetary awards or lack thereof. Incen-tives can be extremely useful when vigilantly and carefully applied, and in accordance with FAR 16.401, they are designed to drive specifi c acquisition objectives by:
Establishing reasonable and attainable targets that are clearly communicated to the contractor; and
Including appropriate incentive arrangements designed to:
Motivate contractor efforts that might not otherwise be emphasized; and•
Discourage contractor ineffi ciency and waste.•
By design, incentives are also tightly integrated into overall acquisition strategies for very specifi c purposes in DoD contracts. They can help reduce risk; they can help combat uncertainty; and they can also help drive favorable behavior throughout a program’s life cycle. By their nature, “incentives should result in expected outcomes” as Defense Procurement and Acquisition Policy Director Shay Assad reinforced at the Program Executive Offi cer/Systems Command (PEO/SYSCOM) Commanders’ Conference held at Fort Belvoir, VA, November 7-8, 2006 (S. Assad, personal com-munication, November 8, 2006). Of course, understanding when and how to apply incentives is just as important and may be the tallest hurdle. More specifi cally and in accordance with the FAR 16.401 and 16.403:
Incentive contracts are appropriate when a fi rm-fi xed-price con-tract is not appropriate and the required supplies or services can be acquired at lower costs and, in certain instances, with improved delivery or technical performance, by relating the amount of profi t or fee payable under the contract to the contractor’s performance … a fi xed-price incentive (fi rm target) contract is appropriate when the parties can negotiate at the outset a fi rm target cost, target profi t, and profi t adjustment formula that will provide a fair and reasonable incentive and a ceiling that provides for the contractor to assume an appropriate share of the risk.
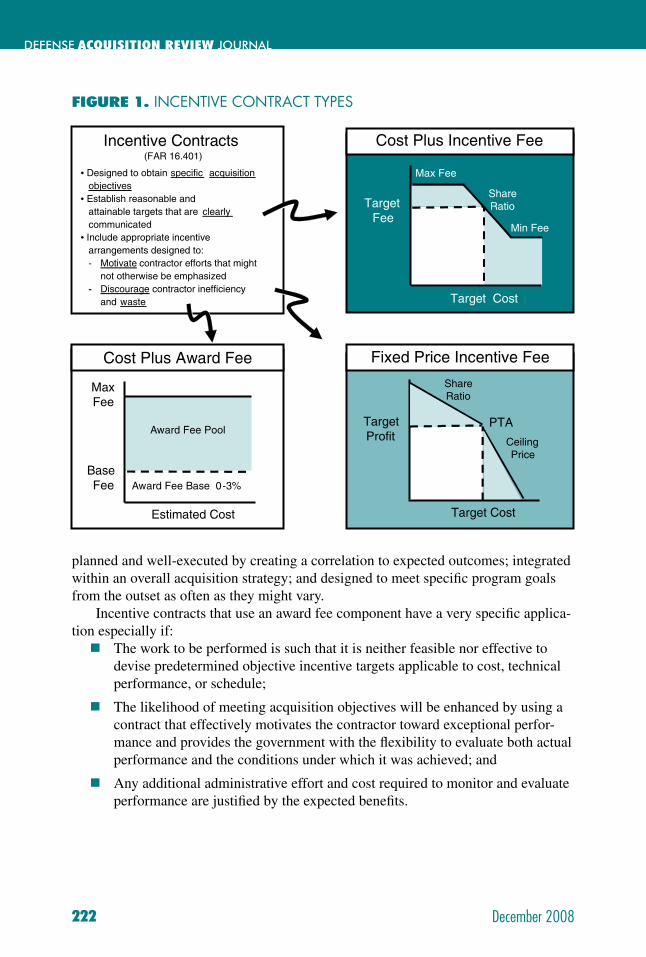
Even though the concept of incentive-type contracts sounds straightforward, its execution is far from simple, especially in an environment like DoD where fund-ing instability, technology barriers, leadership changes, and even cultural barriers frequently reign. Each element alone can potentially handicap a program as program managers would attest. The presence of all four factors can be taxing. Nonetheless, each of the incentive contract varieties (Figure 1) offers hope if they are properly
DEFENSE ACQUISITION REVIEW JOURNAL
222 December 2008
planned and well-executed by creating a correlation to expected outcomes; integrated within an overall acquisition strategy; and designed to meet specifi c program goals from the outset as often as they might vary.
Incentive contracts that use an award fee component have a very specifi c applica-tion especially if:
The work to be performed is such that it is neither feasible nor effective to devise predetermined objective incentive targets applicable to cost, technical performance, or schedule;
The likelihood of meeting acquisition objectives will be enhanced by using a contract that effectively motivates the contractor toward exceptional perfor-mance and provides the government with the fl exibility to evaluate both actual performance and the conditions under which it was achieved; and
Any additional administrative effort and cost required to monitor and evaluate performance are justifi ed by the expected benefi ts.
TargetFee
Share Ratio
Target Cost
Max Fee
Min Fee
Cost Plus Incentive Fee
MaxFee
BaseFee
Estimated Cost
Cost Plus Award Fee
Award Fee Base 0-3%
Award Fee PoolTargetProfit
Target Cost
CeilingPrice
Share Ratio
Fixed Price Incentive Fee
PTA
Incentive Contracts (FAR 16.401)
• Designed to obtain specific acquisitionobjectives
• Establish reasonable and attainable targets that are clearly communicated
• Include appropriate incentive arrangements designed to:- Motivate contractor efforts that might
not otherwise be emphasized- Discourage contractor inefficiency
and waste
FIGURE 1. INCENTIVE CONTRACT TYPES
December 2008
INCENTIVE CONTRACTS
223
INCENTIVES UNDER REVIEW
DAU’s research phase offi cially began with a review of prior related work includ-ing the GAO report (e.g., its fi ndings and potential areas of further interest) and other associated initiatives. As expected, the GAO report sounded a warning bell for incen-tive contracts in general, and many DoD organizations began to take a closer look at their respective portfolios to unearth any “execution” fl aws.
After conducting an abbreviated literature review of incentive-type contracts, the research team found a great deal of writing on the subject. Even before the GAO published its report, a few agency, headquarters staff organizations, and fi eld units had already initiated their own internal reviews and audits of incentives. Some even followed with specifi c guidance in some cases. A few examined root causes where incentive contracts failed and identifi ed remedies to overcome what might be inef-fective incentive practices. These investigations were insightful; they also validated some of the same fi ndings that were eventually uncovered in this research. While many concentrated on various aspects of Award/Incentive fee contracts, none focused exclusively on what drives favorable outcomes.
Interestingly enough, incentive-type contracts have been around for some time and used quite often in one form or another. Even Wilbur and Orville Wright’s “Wright Flyer” contract awarded in February 1908 with the U.S. Army has been argued by some as a classic incentive contract that was based on two key objective criteria—speed and endurance (Snyder, 2001). Over the years, many other govern-ment contracts eventually contained incentive-like features. Nonetheless, the National Aeronautics and Space Administration (NASA) had been largely credited with suc-cessfully instituting formal incentive contracts since the early 1960s. In the last sev-eral years though, incentive contracts have required some further clarifi cation. Senior Pentagon offi cials like (then) Assistant Secretary of the Navy for Research, Develop-ment and Acquisition John J. Young, Jr., have provided more specifi c direction and elucidation. On December 23, 2004, he issued specifi c guidance to make his stand clear. He emphasized, “If use of an award fee is appropriate, a portion of the award fee pool should be available for the contractor to earn based on objective criteria and a portion on the basis of subjective criteria.” He also asserted that “contractors should have to earn fees or profi ts they receive based on their performance” (Young, 2004).
The National Aeronautics and Space Administration (NASA) had been largely credited with successfully instituting formal
incentive contracts since the early 1960s.
DEFENSE ACQUISITION REVIEW JOURNAL
224 December 2008
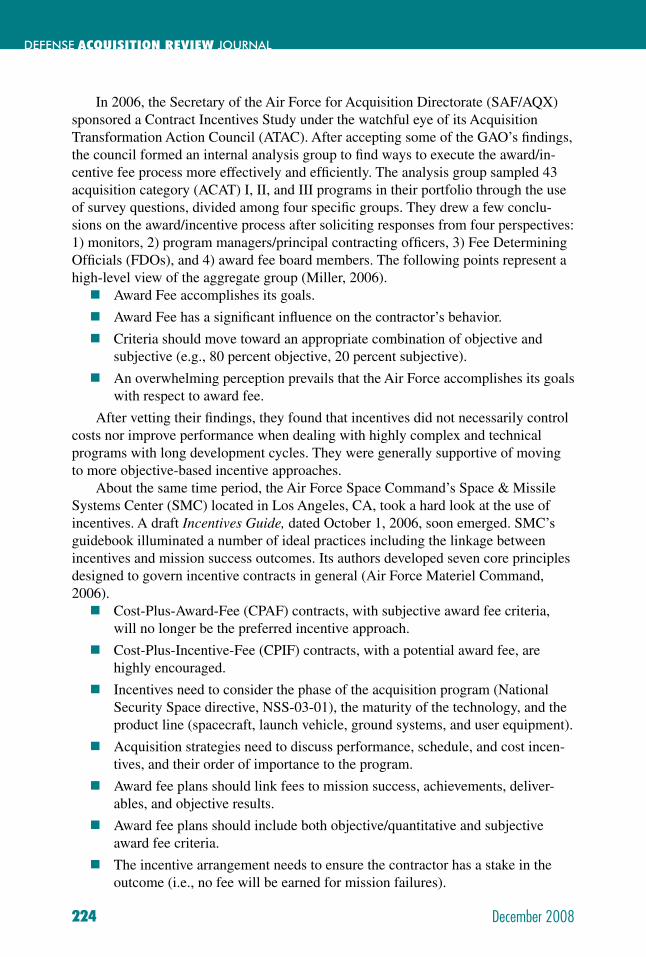
In 2006, the Secretary of the Air Force for Acquisition Directorate (SAF/AQX) sponsored a Contract Incentives Study under the watchful eye of its Acquisition Transformation Action Council (ATAC). After accepting some of the GAO’s fi ndings, the council formed an internal analysis group to fi nd ways to execute the award/in-centive fee process more effectively and effi ciently. The analysis group sampled 43 acquisition category (ACAT) I, II, and III programs in their portfolio through the use of survey questions, divided among four specifi c groups. They drew a few conclu-sions on the award/incentive process after soliciting responses from four perspectives: 1) monitors, 2) program managers/principal contracting offi cers, 3) Fee Determining Offi cials (FDOs), and 4) award fee board members. The following points represent a high-level view of the aggregate group (Miller, 2006).
Award Fee accomplishes its goals.
Award Fee has a signifi cant infl uence on the contractor’s behavior.
Criteria should move toward an appropriate combination of objective and subjective (e.g., 80 percent objective, 20 percent subjective).
An overwhelming perception prevails that the Air Force accomplishes its goals with respect to award fee.
After vetting their fi ndings, they found that incentives did not necessarily control costs nor improve performance when dealing with highly complex and technical programs with long development cycles. They were generally supportive of moving to more objective-based incentive approaches.
About the same time period, the Air Force Space Command’s Space & Missile Systems Center (SMC) located in Los Angeles, CA, took a hard look at the use of incentives. A draft Incentives Guide, dated October 1, 2006, soon emerged. SMC’s guidebook illuminated a number of ideal practices including the linkage between incentives and mission success outcomes. Its authors developed seven core principles designed to govern incentive contracts in general (Air Force Materiel Command, 2006).
Cost-Plus-Award-Fee (CPAF) contracts, with subjective award fee criteria, will no longer be the preferred incentive approach.
Cost-Plus-Incentive-Fee (CPIF) contracts, with a potential award fee, are highly encouraged.
Incentives need to consider the phase of the acquisition program (National Security Space directive, NSS-03-01), the maturity of the technology, and the product line (spacecraft, launch vehicle, ground systems, and user equipment).
Acquisition strategies need to discuss performance, schedule, and cost incen- tives, and their order of importance to the program.
Award fee plans should link fees to mission success, achievements, deliver- ables, and objective results.
Award fee plans should include both objective/quantitative and subjective award fee criteria.
The incentive arrangement needs to ensure the contractor has a stake in the outcome (i.e., no fee will be earned for mission failures).
December 2008
INCENTIVE CONTRACTS
225
SMC’s incentive guide further reinforced what many DoD organizations have increasingly begun to amplify and embed in their incentive contracts—greater em-phasis on objective criteria.
Just recently, the 109th U.S. Congress has also taken more specifi c action. The John Warner National Defense Authorization Act for Fiscal Year 2007, Public Law 109–364, October 17, 2006, sec. 814, now requires the Secretary of Defense to issue guidance to:1. Ensure that all new contracts using award fees link such fees to acquisition
outcomes (which shall be defi ned in terms of program cost, schedule, and performance);
2. Establish standards for identifying the appropriate level of offi cials authorized to approve the use of award and incentive fees in new contracts;
3. Provide guidance on the circumstances in which contractor performance may be judged to be ‘‘excellent’’ or ‘‘superior’’ and the percentage of the available award fee which contractors should be paid for such performance;
4. Establish standards for determining the percentage of the available award fee, if any, which contractors should be paid for performance that is judged to be “ac-ceptable,” “average,” “expected,” “good,” or “satisfactory”;
5. Ensure that no award fee may be paid for contractor performance that is judged to be below satisfactory performance or performance that does not meet the basic requirements of the contract;
6. Provide specifi c direction on the circumstances, if any, in which it may be ap-propriate to roll over award fees that are not earned in one award fee period to a subsequent award fee period or periods;
7. Ensure consistent use of guidelines and defi nitions relating to award and incen-tive fees across the military departments and Defense Agencies;
8. Ensure that the Department of Defense:
Collects relevant data on award and incentive fees paid to contractors•
Has mechanisms in place to evaluate such data on a regular basis;•
9. Include performance measures to evaluate the effectiveness of award and incen-tive fees as a tool for improving contractor performance and achieving desired program outcomes; and
10. Provide mechanisms for sharing proven incentive strategies for the acquisition of different types of products and services among contracting and program manage-ment offi cials.
Whether fully justifi ed or not, Congress became uncomfortable with the track record of incentive contracts and subsequently emphasized key factors affecting their use. The next phase of this research might become even more constructive since it centered on the collection of data that might show it infl uenced favorable outcomes.
DEFENSE ACQUISITION REVIEW JOURNAL
226 December 2008
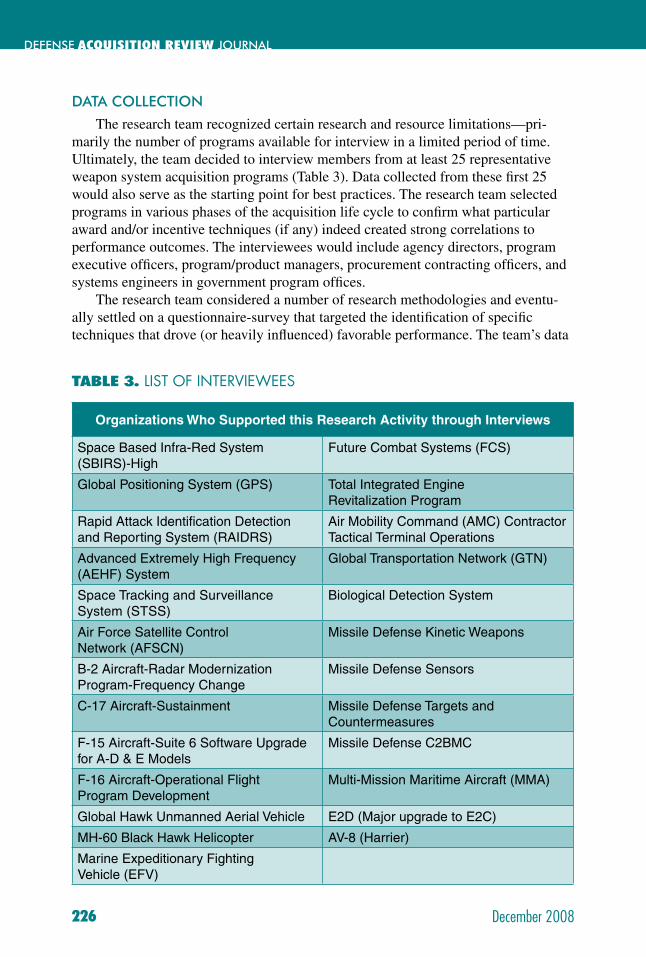
DATA COLLECTION
The research team recognized certain research and resource limitations—pri-marily the number of programs available for interview in a limited period of time. Ultimately, the team decided to interview members from at least 25 representative weapon system acquisition programs (Table 3). Data collected from these fi rst 25 would also serve as the starting point for best practices. The research team selected programs in various phases of the acquisition life cycle to confi rm what particular award and/or incentive techniques (if any) indeed created strong correlations to performance outcomes. The interviewees would include agency directors, program executive offi cers, program/product managers, procurement contracting offi cers, and systems engineers in government program offi ces.
The research team considered a number of research methodologies and eventu-ally settled on a questionnaire-survey that targeted the identifi cation of specifi c techniques that drove (or heavily infl uenced) favorable performance. The team’s data
TABLE 3. LIST OF INTERVIEWEES
Organizations Who Supported this Research Activity through Interviews
Space Based Infra-Red System (SBIRS)-High
Future Combat Systems (FCS)
Global Positioning System (GPS) Total Integrated Engine Revitalization Program
Rapid Attack Identifi cation Detection and Reporting System (RAIDRS)
Air Mobility Command (AMC) Contractor Tactical Terminal Operations
Advanced Extremely High Frequency (AEHF) System
Global Transportation Network (GTN)
Space Tracking and Surveillance System (STSS)
Biological Detection System
Air Force Satellite Control Network (AFSCN)
Missile Defense Kinetic Weapons
B-2 Aircraft-Radar Modernization Program-Frequency Change
Missile Defense Sensors
C-17 Aircraft-Sustainment Missile Defense Targets and Countermeasures
F-15 Aircraft-Suite 6 Software Upgrade for A-D & E Models
Missile Defense C2BMC
F-16 Aircraft-Operational Flight Program Development
Multi-Mission Maritime Aircraft (MMA)
Global Hawk Unmanned Aerial Vehicle E2D (Major upgrade to E2C)
MH-60 Black Hawk Helicopter AV-8 (Harrier)
Marine Expeditionary Fighting Vehicle (EFV)
December 2008
INCENTIVE CONTRACTS
227
collection approach afforded the simultaneous and normalized collection of key data. DAU’s regional collocation with acquisition organizations created a signifi cant geo-graphical advantage. Each of the regional research team members could concentrate on acquisition organizations they already support within their respective locations. They knew their customer base well. The sub-division of regional teams also permit-ted relatively easy access to the program offi ces they occasionally assist.
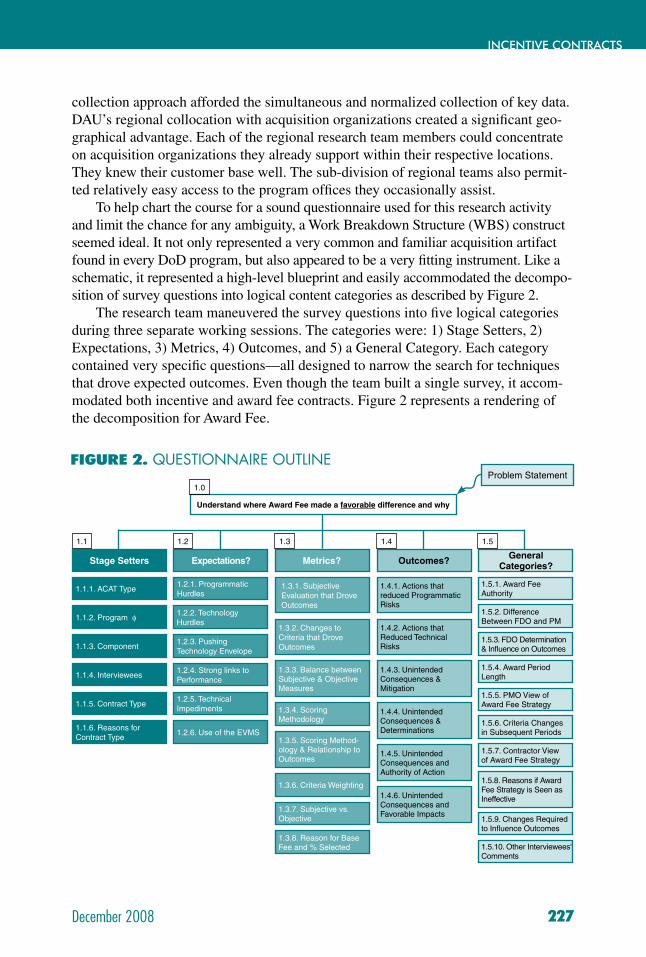
To help chart the course for a sound questionnaire used for this research activity and limit the chance for any ambiguity, a Work Breakdown Structure (WBS) construct seemed ideal. It not only represented a very common and familiar acquisition artifact found in every DoD program, but also appeared to be a very fi tting instrument. Like a schematic, it represented a high-level blueprint and easily accommodated the decompo-sition of survey questions into logical content categories as described by Figure 2.
The research team maneuvered the survey questions into fi ve logical categories during three separate working sessions. The categories were: 1) Stage Setters, 2) Expectations, 3) Metrics, 4) Outcomes, and 5) a General Category. Each category contained very specifi c questions—all designed to narrow the search for techniques that drove expected outcomes. Even though the team built a single survey, it accom-modated both incentive and award fee contracts. Figure 2 represents a rendering of the decomposition for Award Fee.
FIGURE 2. QUESTIONNAIRE OUTLINE
Stage Setters Expectations? Metrics? Outcomes? General Categories?
1.1.6. Reasons for Contract Type
1.1.5. Contract Type
1.1.4. Interviewees
1.1.3. Component
1.1.2. Program φ
1.1.1. ACAT Type
1.2.2. Technology Hurdles
1.2.1. Programmatic Hurdles
1.2.3. Pushing Technology Envelope
1.2.4. Strong links to Performance
1.2.5. Technical Impediments
1.2.6. Use of the EVMS
1.3.1. Subjective Evaluation that Drove Outcomes
1.3.2. Changes to Criteria that Drove Outcomes
1.3.3. Balance between Subjective & Objective Measures
1.3.4. Scoring Methodology
1.3.5. Scoring Method-ology & Relationship to Outcomes
1.3.6. Criteria Weighting
1.3.7. Subjective vs. Objective
1.3.8. Reason for Base Fee and % Selected
1.4.6. Unintended Consequences and Favorable Impacts
1.4.5. Unintended Consequences and Authority of Action
1.4.4. Unintended Consequences & Determinations
1.4.3. Unintended Consequences & Mitigation
1.4.2. Actions that Reduced Technical Risks
1.4.1. Actions that reduced Programmatic Risks
1.5.9. Changes Required to Infl uence Outcomes
1.5.8. Reasons if Award Fee Strategy is Seen as Ineffective
1.5.7. Contractor View of Award Fee Strategy
1.5.6. Criteria Changes in Subsequent Periods
1.5.5. PMO View of Award Fee Strategy
1.5.4. Award Period Length
1.5.3. FDO Determination & Infl uence on Outcomes
1.5.2. Difference Between FDO and PM
1.5.1. Award Fee Authority
1.5.10. Other Interviewees' Comments
1.1 1.2 1.3 1.4 1.5
Understand where Award Fee made a favorable difference and why
1.0
Problem Statement
DEFENSE ACQUISITION REVIEW JOURNAL
228 December 2008
FINDINGS
Strongly Communicated Expectations and Feedback: Frequent and unambigu-ous communication/feedback made a noticeable difference for incentive contracts. Even though incentive contracts require some additional administrative burden, the outcome justifi ed the increased workload of feedback for most programs under this research review. Continuous and open dialogue at both junior and senior levels led to early discovery and timely reconciliation of many known issues and helped keep a program on track.
Space Based Infra-Red Surveillance System (SBIRS)-High created a special- ized response team that routinely tackled issues as a result of a fl ight software quandary originally uncovered by monthly reports. Their team “pays a lot more attention, has a lot more discussion, and serves almost like a fi rst level of evaluation” (personal communication, September 18, 2006).
E2D summarized what many others echoed: “We are very open with the con- tractor. We have no secrets. If they win, we win. Communication is extremely important. The contractor is never surprised by what they get” (personal com-munication, October 12, 2006).
Missile Defense Agency (MDA) Sensors instituted “emphasis letters” during their award periods to stress the importance of certain outcomes or “events” even more (personal communication, September 18, 2006).
Multi-Mission Maritime Aircraft (MMA) employed what they called a “ba- rometer report” during interim reviews to ensure that information from moni-tors was readily available to management at critical junctures. “Our contractor takes it very seriously. Each report is very detailed. The contractor understands well in advance what we see. If the contractor was heading in the wrong direc-tion, early intervention was crucial” (personal communication, October 12, 2006). In some cases, sharing certain information prematurely and without a proper context could have unintended consequences.
In one program, when the contractor received a reduced award, program offi ce personnel were “uninvited” from a few key intermittent reviews. Program offi ce personnel were viewed as critics, not full partners. The program offi ce quickly instituted monthly reviews with the proviso that progress should be measured not only by results but also the agility to take any necessary correc-tive action(s). Things quickly turned around.
F-15 and Global Hawk used more informal monthly feedback sessions to sur- face known issues or raise any potential concerns (personal communication, August 28, 2006; July 27, 2006).
Space Tracking and Surveillance System (STSS) government and contractor program managers meet every Friday to “just talk and keep the lines of com-munication wide open—little issues sometimes surface and can be reconciled almost immediately” according to the government program manager (personal communication, September 27, 2006).
December 2008
INCENTIVE CONTRACTS
229
Missile Defense Kinetic Weapons found communication and expectation management had a direct connection to favorable outcomes (personal commu-nication, October 11, 2006).
B-2 created a glossary tool to improve communication during the evaluation briefi ngs, which proved extremely benefi cial when team member changes occurred as they frequently did. This was particularly important in milestone terms, especially in the clarifi cation of “fi rst fl ight” (personal communication, August 11, 2006). Many organizations found that a strongly prepared and focused evaluation board along with upper management support were very important elements and made a difference.
In E2D, “during the evaluation period, everyone has a binder, copy of the plan, contractor self-assessment, monitor evaluations, historical information, etc. You need this commitment to make this work” (personal communica-tion, October 12, 2006). Ultimately, a set of expectations known by all and a disciplined award fee board structure along with refi ned mechanics seemed to help strengthen the viability of incentives.
In one case, feedback had a multiplying effect. Missile Defense and Coun- termeasures found their contractor performing process improvement reviews based upon mid-term guidance and Air Force determinations (personal com-munication, September 22, 2006).
Undeniably, open and frequent communication/feedback is a driving force behind the effective execution of incentive contracts.
Metrics. The selection of key and enduring measures within an evaluation period, and measures that could be connected to subsequent evaluation periods made a noticeable difference for incentive contracts. Key measures can validate whether or not a program achieved certain necessary intermediate milestones along a program’s critical glide path. They confi rm program momentum. They serve as an early warning system—a bellwether—and answer the age-old question, “Are we on track?” They also fi ll a huge role as performance benchmarks. Those interviewed under this re-search project said when they effectively employed key measures, it also helped them navigate their program pathway despite the unavoidable programmatic turbulence. Their measures surfaced as two types: objective and/or subjective. Without question, selecting the correct type of measure presented the biggest challenge.
Key measures can validate whether or not a program achieved certain necessary intermediate milestones
along a program’s critical glide path.
DEFENSE ACQUISITION REVIEW JOURNAL
230 December 2008
The ability to hard-wire them to achievable outcomes makes objective measures like Technical Performance Measures (TPMs), Cost Performance Indices (CPIs), Schedule Performance Indices (SPIs), etc., invaluable gauges. They serve as tremen-dous forecasting devices when carefully connected to outcomes.
STSS used objective measures in the form of Key Performance Events (KPEs) such as “ground contractor satellite operations (LSOC) facilities established, spacecraft available for space vehicle integration and test, and thermal vacu-um test complete” (personal communication, September 27, 2006). According to the STSS program manager, the contractor also had to “show me that the system worked in the intended environment.”
SBIRS used objective measures in the form of Mission Success Criteria (MSI) like ITS/Increment1 capability and IMCSB-1 System delivered. They reported a signifi cant change when they amplifi ed the importance and subsequent inclusion of mission success in the form of tangible, measurable outcomes (personal communication, September 18, 2006).
Missile Defense Kinetic Weapons felt technical performance outcomes were ide- ally suited for objective measures especially since they rely heavily on test fl ights where mission success is key (personal communication, October 11, 2006).
Global Positioning System (GPS) targeted specifi c milestones/events that either demonstrated space-qualifi ed processes or the completion of space-qualifi ed parts—both critical elements since they directly supported the development of the Gallium Arsenide (GaAs) Solar Arrays used to power the spacecraft. GPS also found that its prime contractor welcomed objective measures in the form of tangible milestones such as specifi c task completion and scheduled deliveries (personal communication, September 20, 2006).
MDA Sensors recognized their software development risk early on since many algorithms came from the Theater High Altitude Area Defense (now Terminal High-Altitude Area Defense) system as Government-Furnished Equipment (GFE). Consequently, they used incentives to drive integration efforts of these algorithms along a well-defi ned pathway (personal communication, September 18, 2006).
STSS found cost controls to be powerful measures, especially if the contractor could share in the savings (personal communication, September 27, 2006).
AV-8 (Harrier) made cost a primary objective criterion since the “work was known, [they] just wanted to keep costs down, and there was a fi rm design specifi cation in place with expectations of little to no modifi cation” (personal communication, September 22, 2006).
Total Integrated Engine Revitalization tied incentives directly to the achieve- ment of doubling Mean Time for Depot Repair from 700 hrs to 1400 hrs (per-sonal communication, August 14, 2006). FCS found incentives more useful when based on delivery of critical sub-components since they were so vital to the aggregate system (personal communication, August 14, 2006).
Many others like F-15 and GPS found that incentives became more strongly correlated to outcomes when they jointly developed incentive criteria with
December 2008
INCENTIVE CONTRACTS
231
their respective contractors and incorporated risk management as a major variable in the overall equation (personal communication, August 28, 2006; September 17, 2006).
In the STSS, both the government and contractor co-developed the incentive criteria to ensure they were meaningful, achievable, useful, measurable, and enduring (personal communication, September 27, 2006).
Subjective criteria, the more elastic of the two measure types, depend on certain factors such as judgment, beliefs, and propensity to yield specifi c out-comes. These measures found their way into many programs including STSS, Rapid Attack Identifi cation Detection and Reporting System (RAIDRS), Global Hawk, and B-2. Each of these programs called for highly effective and comprehensive systems engineering processes, and strengthened their incen-tives to enforce it. RAIDRS also found subjective measures “afforded some freedom of action and much needed fl exibility,” (personal communication, September 19, 2006).
E2D and Advanced Extremely High Frequency (AEHF) found they could “more effectively infl uence how their prime contractor managed subcontractor behav-ior through subjective means” (personal communication, September 20, 2006).
AEHF used subjective measures to drive management responsiveness and ef- fective communication” (personal communication, September 20, 2006).
C-17 inserted customer satisfaction into their overall incentive equation through the use of customer surveys in the context of a CPIF contract that was primarily objective in nature (personal communication, August 16, 2006).
In a few program offi ces like STSS, program personnel found the selection of key outcomes can also make evaluation periods more enduring by creat-ing a bridge between one award fee period and the next. They employed 34 KPEs that spanned nine periods from FY02–FY06 (personal communication, September 27, 2006). In retrospect, these aggregate KPEs kept everyone who was involved with the execution of STSS focused on the goal line, which went well beyond single award fee periods (personal communication, September 27, 2006). Like others, those who structured their award fee plan also under-stood the delicate balance among cost, schedule, and performance incentives, which have been successful in motivating the contractor to take a long-term view of program and mission success rather than a more short-term view of performance during any specifi c period.
What we found particularly interesting was the increased use of objective mea-sures in Award Fee type contracts. We noticed a strong tendency by the organizations interviewed to fi nd more objective and tangible measures in the conduct of their incentive strategies that incorporated award fee. Objective measures that were used as criterion variables seemed to fi ll an air gap by demonstrating the attainment of certain intermediate milestones and irrefutable performance outcomes. Subjective measures were still important, especially since they verifi ed qualitative characteristics; but the
DEFENSE ACQUISITION REVIEW JOURNAL
232 December 2008
combination of objective and subjective measures created some of the strongest cor-relations to expected outcomes.
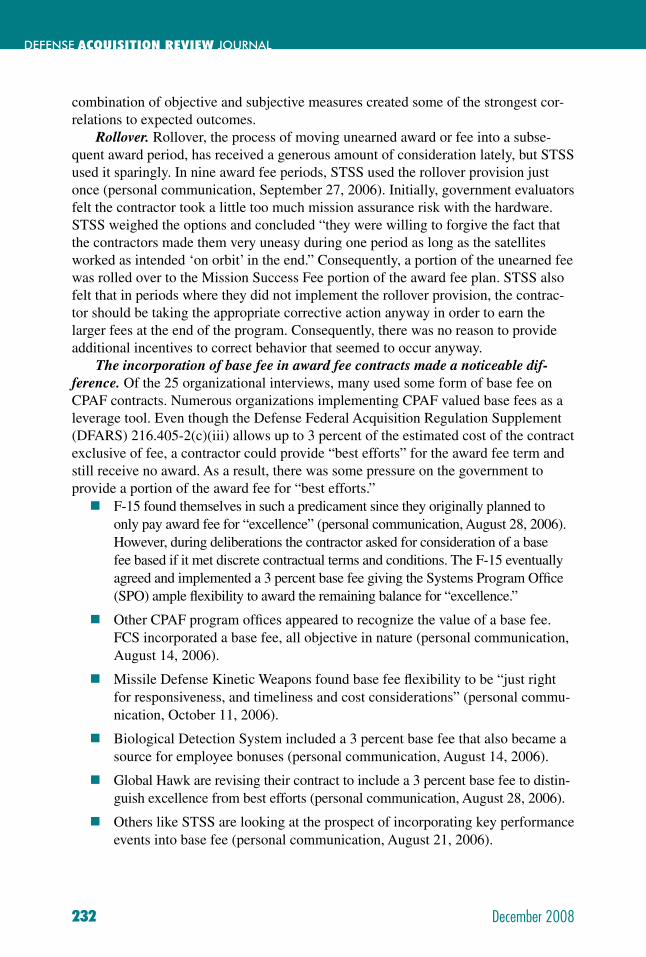
Rollover. Rollover, the process of moving unearned award or fee into a subse-quent award period, has received a generous amount of consideration lately, but STSS used it sparingly. In nine award fee periods, STSS used the rollover provision just once (personal communication, September 27, 2006). Initially, government evaluators felt the contractor took a little too much mission assurance risk with the hardware. STSS weighed the options and concluded “they were willing to forgive the fact that the contractors made them very uneasy during one period as long as the satellites worked as intended ‘on orbit’ in the end.” Consequently, a portion of the unearned fee was rolled over to the Mission Success Fee portion of the award fee plan. STSS also felt that in periods where they did not implement the rollover provision, the contrac-tor should be taking the appropriate corrective action anyway in order to earn the larger fees at the end of the program. Consequently, there was no reason to provide additional incentives to correct behavior that seemed to occur anyway.
The incorporation of base fee in award fee contracts made a noticeable dif-ference. Of the 25 organizational interviews, many used some form of base fee on CPAF contracts. Numerous organizations implementing CPAF valued base fees as a leverage tool. Even though the Defense Federal Acquisition Regulation Supplement (DFARS) 216.405-2(c)(iii) allows up to 3 percent of the estimated cost of the contract exclusive of fee, a contractor could provide “best efforts” for the award fee term and still receive no award. As a result, there was some pressure on the government to provide a portion of the award fee for “best efforts.”
F-15 found themselves in such a predicament since they originally planned to only pay award fee for “excellence” (personal communication, August 28, 2006). However, during deliberations the contractor asked for consideration of a base fee based if it met discrete contractual terms and conditions. The F-15 eventually agreed and implemented a 3 percent base fee giving the Systems Program Offi ce (SPO) ample fl exibility to award the remaining balance for “excellence.”
Other CPAF program offi ces appeared to recognize the value of a base fee. FCS incorporated a base fee, all objective in nature (personal communication, August 14, 2006).
Missile Defense Kinetic Weapons found base fee fl exibility to be “just right for responsiveness, and timeliness and cost considerations” (personal commu-nication, October 11, 2006).
Biological Detection System included a 3 percent base fee that also became a source for employee bonuses (personal communication, August 14, 2006).
Global Hawk are revising their contract to include a 3 percent base fee to distin- guish excellence from best efforts (personal communication, August 28, 2006).
Others like STSS are looking at the prospect of incorporating key performance events into base fee (personal communication, August 21, 2006).
December 2008
INCENTIVE CONTRACTS
233
Our research team found that senior defense industry personnel welcomed the use of base fee to better delineate the difference between “best efforts” (e.g., fee) and “excellence” (e.g., award).
Trained and Experienced Personnel made a noticeable difference for incentive contracts. Nothing seems to have a more dramatic impact in DoD than training and experience. Training draws its roots from practical experience. It is systematic. We learn from our successes and failures in the fi eld and make adjustments accordingly in the way we train. The mantra “train like we fi ght, fi ght like we train” is pervasive in warfi ghter training across DoD, and ultimately leads to advantages on the battle-fi eld. Without question, practical experience helps build better training programs. It can overcome unforeseen shortfalls and the inevitable prevailing uncertainty even with proven systems. The same mindset applies to incentive-type contracts. Program managers that had formalized instruction and/or coached their personnel on the use of incentives indicated they more favorably infl uenced outcomes.
F-15 felt “training and experience made a huge difference” (personal commu- nication, August 28, 2006).
RAIDRS instituted a robust series of Murder Boards for review of assessments generated by performance monitors prior to each Air Force Review Board (AFRB). All performance monitors were required to sit through the review of all other assessments. The process ensured consistent communication with all on the expectations for their assessments in terms of quality, format, scope, etc. (personal communication, September 19, 2006). RAIDRS found that those who go through the process once consistently provide excellent assessments in the future and pass on their lessons learned to others, resulting in a faster review in succeeding periods (personal communication, September 19, 2006).
MDA summed up what the remaining interviewees reiterated. Aside from the specialty training a few of their personnel have received in multiple courses covering incentive contracts, everyone seems to receive the training they need to make incentive contracts work (personal communication, September 22, 2006).
INDUSTRY REINFORCEMENT
Even though the research team did not meet individually with industry represen-tatives, contractor perspectives were considered an important element of this re-search. The team found an expedient method to collect industry’s thoughts on award
Nothing seems to have a more dramatic impact in DoD than training and experience.
DEFENSE ACQUISITION REVIEW JOURNAL
234 December 2008
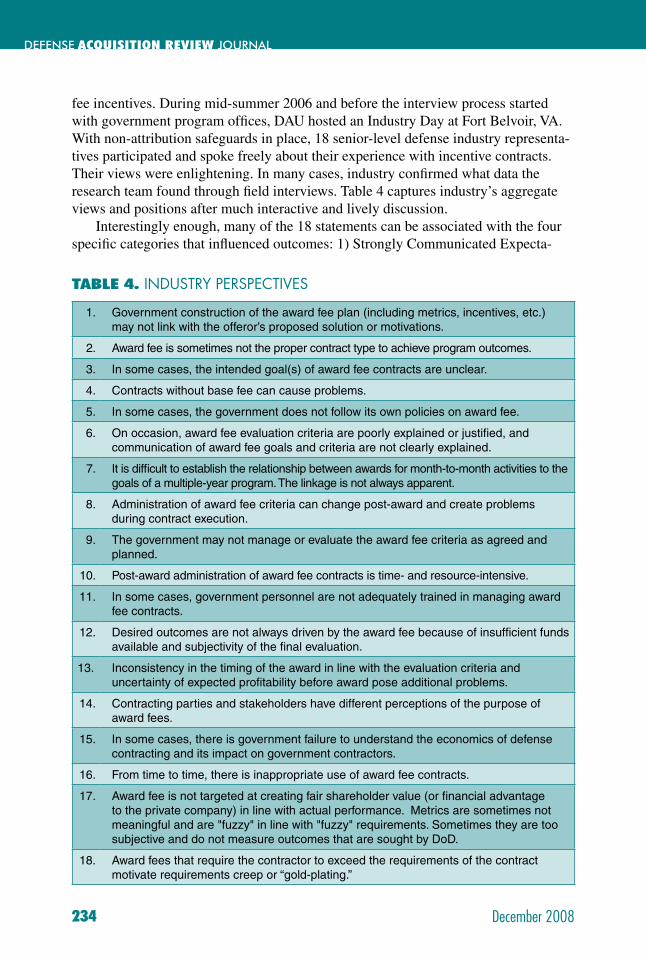
TABLE 4. INDUSTRY PERSPECTIVES
1. Government construction of the award fee plan (including metrics, incentives, etc.) may not link with the offeror’s proposed solution or motivations.
2. Award fee is sometimes not the proper contract type to achieve program outcomes.
3. In some cases, the intended goal(s) of award fee contracts are unclear.
4. Contracts without base fee can cause problems.
5. In some cases, the government does not follow its own policies on award fee.
6. On occasion, award fee evaluation criteria are poorly explained or justifi ed, and communication of award fee goals and criteria are not clearly explained.
7. It is diffi cult to establish the relationship between awards for month-to-month activities to the goals of a multiple-year program. The linkage is not always apparent.
8. Administration of award fee criteria can change post-award and create problems during contract execution.
9. The government may not manage or evaluate the award fee criteria as agreed and planned.
10. Post-award administration of award fee contracts is time- and resource-intensive.
11. In some cases, government personnel are not adequately trained in managing award fee contracts.
12. Desired outcomes are not always driven by the award fee because of insuffi cient funds available and subjectivity of the fi nal evaluation.
13. Inconsistency in the timing of the award in line with the evaluation criteria and uncertainty of expected profi tability before award pose additional problems.
14. Contracting parties and stakeholders have different perceptions of the purpose of award fees.
15. In some cases, there is government failure to understand the economics of defense contracting and its impact on government contractors.
16. From time to time, there is inappropriate use of award fee contracts.
17. Award fee is not targeted at creating fair shareholder value (or fi nancial advantage to the private company) in line with actual performance. Metrics are sometimes not meaningful and are "fuzzy" in line with "fuzzy" requirements. Sometimes they are too subjective and do not measure outcomes that are sought by DoD.
18. Award fees that require the contractor to exceed the requirements of the contract motivate requirements creep or “gold-plating.”
fee incentives. During mid-summer 2006 and before the interview process started with government program offi ces, DAU hosted an Industry Day at Fort Belvoir, VA. With non-attribution safeguards in place, 18 senior-level defense industry representa-tives participated and spoke freely about their experience with incentive contracts. Their views were enlightening. In many cases, industry confi rmed what data the research team found through fi eld interviews. Table 4 captures industry’s aggregate views and positions after much interactive and lively discussion.
Interestingly enough, many of the 18 statements can be associated with the four specifi c categories that infl uenced outcomes: 1) Strongly Communicated Expecta-
December 2008
INCENTIVE CONTRACTS
235
tions and Feedback; 2) Relevant, Achievable, and Enduring Measures within an Evaluation Period; 3) Base Fee; and 4) Training and Experience. Industry comments can also be further subdivided into two general categories—Planning and Execution.
SUMMARY
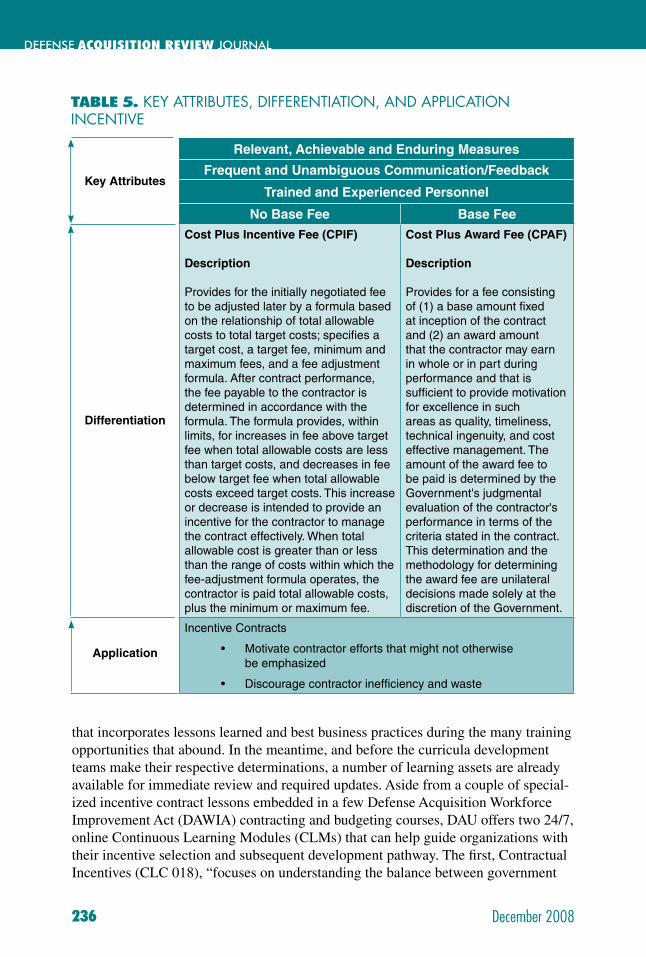
So, what about incentives? Are they still a good tool to drive performance be-haviors despite the recent criticism and doubt? Have organizations found a way to effectively apply incentives and demonstrate the usefulness of incentives? The answer to all of these questions is “yes.” There is no “one size fi ts all,” but the incentive attri-butes that seemed to matter the most in infl uencing performance outcomes for the 25 programs, and generally afforded strong correlations between incentives and desired performance are outlined in Table 5.
Ideally, an optimal incentive strategy features these and perhaps other attributes in the context of cost, schedule, and performance factors forged together as a unifi ed accord. In practice, cost, schedule, and performance are strongly interdependent and tend to interfere with one another’s outcomes. Infl uencing all three, while not at the expense of one another, becomes a delicate balancing act and the challenge for any incentive strategy. For example, emphasizing technical performance could come at the expense of cost and scheduled deliveries. Emphasizing schedule and/or cost could easily come at the expense of technical performance. Nonetheless, all our interview-ees developed incentive strategies that carefully considered the weighting aspect of these three attributes depending on certain program priorities, distinctive program phases, and certain aim points.
One prevailing element distinguishes DoD and other U.S. Government agencies from general industry. Unlike simple commercial development efforts, DoD builds and sustains many “one-of-a-kind” systems that count on “cutting-edge” technolo-gies, operate in unforgiving or threatening conditions, and come under enemy fi re. Invariably, motivational contracting tools like incentives can help organizations managing those systems overcome numerous obstacles and reach very defi nitive outcomes. Incentives provide tremendous fl exibility for the implementation of certain government contracts. Incentives are certainly no panacea, but, if used wisely and judiciously, can help programs either achieve diffi cult milestones and/or recover lost ground by allowing organizations to make the necessary course adjustments as they navigate the inevitable turbulent programmatic waters.
RECOMMENDATIONS
What DAU curricula should be adjusted as a result of the research team’s fi ndings in both the near- and far-term; and how can DAU make both lessons learned and best practices widely available? First, the acquisition contracting workforce, particularly contract specialists working with incentive contracts, must possess a certain under-standing of incentive contracts. Therefore, it seems reasonable that every functional area should have or at least consider an introductory lesson on incentive contracts
DEFENSE ACQUISITION REVIEW JOURNAL
236 December 2008
that incorporates lessons learned and best business practices during the many training opportunities that abound. In the meantime, and before the curricula development teams make their respective determinations, a number of learning assets are already available for immediate review and required updates. Aside from a couple of special-ized incentive contract lessons embedded in a few Defense Acquisition Workforce Improvement Act (DAWIA) contracting and budgeting courses, DAU offers two 24/7, online Continuous Learning Modules (CLMs) that can help guide organizations with their incentive selection and subsequent development pathway. The fi rst, Contractual Incentives (CLC 018), “focuses on understanding the balance between government
TABLE 5. KEY ATTRIBUTES, DIFFERENTIATION, AND APPLICATION INCENTIVE
Relevant, Achievable and Enduring Measures
Frequent and Unambiguous Communication/Feedback
Trained and Experienced Personnel
No Base Fee Base Fee
Cost Plus Incentive Fee (CPIF)
Description
Provides for the initially negotiated fee to be adjusted later by a formula based on the relationship of total allowable costs to total target costs; specifi es a target cost, a target fee, minimum and maximum fees, and a fee adjustment formula. After contract performance, the fee payable to the contractor is determined in accordance with the formula. The formula provides, within limits, for increases in fee above target fee when total allowable costs are less than target costs, and decreases in fee below target fee when total allowable costs exceed target costs. This increase or decrease is intended to provide an incentive for the contractor to manage the contract effectively. When total allowable cost is greater than or less than the range of costs within which the fee-adjustment formula operates, the contractor is paid total allowable costs, plus the minimum or maximum fee.
Cost Plus Award Fee (CPAF)
Description
Provides for a fee consisting of (1) a base amount fi xed at inception of the contract and (2) an award amount that the contractor may earn in whole or in part during performance and that is suffi cient to provide motivation for excellence in such areas as quality, timeliness, technical ingenuity, and cost effective management. The amount of the award fee to be paid is determined by the Government's judgmental evaluation of the contractor's performance in terms of the criteria stated in the contract. This determination and the methodology for determining the award fee are unilateral decisions made solely at the discretion of the Government.
Incentive Contracts
Motivate contractor efforts that might not otherwise • be emphasized
Discourage contractor ineffi ciency and waste•
Key Attributes
Differentiation
Application
December 2008
INCENTIVE CONTRACTS
237
and industry goals and objectives in crafting an effective incentive strategy … that effectively motivates and incentivizes the contractor to deliver what the government needs, when it needs it, and within budget.” The second, Provisional Award Fees (CLC 034), addresses the 2003 rule that permits award fee payments to be made anytime prior to the interim or fi nal evaluation.
Both CLMs are useful, but do not address the execution “essentials.” An “Incen-tive Contracts” CLM that is more comprehensive and readily available to the acqui-sition community is necessary to provide much more assistance on the mechanics and implementation of incentive contracts. Additionally, exploiting the knowledge of seasoned professionals through the increasingly popular collaborative medium called Communities of Practice (CoPs) on the DAU Acquisition Community Con-nection (ACC) Web site can offer access to a wide array of current experiences and lessons learned regarding incentives ranging from the general to the specifi c. DAU has already established a site rich in information on the ACC—Award and Incentive Fee Contracts, at https://acc.dau.mil/CommunityBrowser.aspx?id=105550. Access to these and other collaborative training aids is critically important because once an incentive strategy is in place, its maximum value truly depends on its ability to implement known techniques that can drive favorable outcomes. No better source of experts exists than those who face contract incentive challenges every day—the acquisition workforce professionals who are charged with appropriately implement-ing the techniques that drive outcomes—appreciably.
Mr. Robert L. Tremaine is associate dean at the DAU West Region. Prior to joining DAU, he served over 26 years in the U.S. Air Force in acquisition assignments that spanned air, missile, and space. He holds a B.S. from the U.S. Air Force Academy and an M.S from the Air Force Institute of Technology. He graduated from the Canadian Forces Command and Staff, and U.S. Army War Colleges. He is level III certifi ed in Program Management and Systems Planning, Research, Development and Engineering.
(E-mail address: [email protected])
AUTHOR BIOGRAPHY
DEFENSE ACQUISITION REVIEW JOURNAL
238 December 2008
REFERENCES
Air Force Materiel Command. (2006). Draft Incentive Guide. Space and Missile Systems Center. Wright-Patterson Air Force Base, OH: Author.
Department of Defense (DoD), General Services Administration & National Aero-nautics and Space Administration. (2005, March). Federal Acquisition Regula-tion. Washington, DC: U.S. Government Printing Offi ce.
Miller, J. (2006, August 7). Contract Incentives Transformation Initiative Group (TIG) Brief for the Acquisition Transformation Action Council (ATAC). Pentagon, Washington, DC: Offi ce of the Secretary of the Air Force (Acquisition).
Snyder, T. J. (2001, Summer). Analysis of Air Force contract implementation. Air Force Journal of Logistics, 25(2), 14–21.
United States Congress. (2006, October 17). National Defense Authorization Act for Fiscal Year 2007. H.R. 5122, 109th Congress. Washington, DC: U.S. Government Printing Offi ce.
United States Government Accountability Offi ce. (2005, December). Defense acqui-sitions: DoD has paid billions in award and incentive fees regardless of acquisi-tion outcome. GAO Report 06-66. Washington, DC: U.S. Government Account-ability Offi ce.
Young, J. J. (2004, December 23). Contract profi t and incentives arrangements. Policy Memorandum. Assistant Secretary of the Navy for Research, Development and Acquisition. Retrieved October 2006 from http://acquisition.navy.mil/con-tent/view/full/3868

December 2008
INCENTIVE CONTRACTS
239
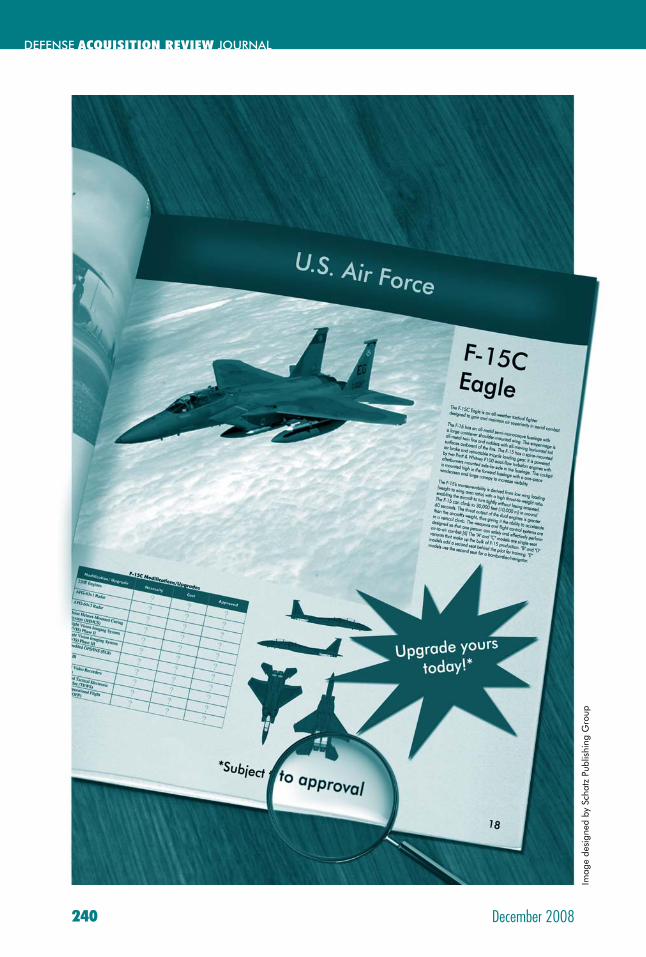
DEFENSE ACQUISITION REVIEW JOURNAL
240 December 2008
Imag
e de
sign
ed b
y Sc
hatz
Pub
lishi
ng G
roup
December 2008
MAXIMIZING WARFIGHTER CAPABILITY
241
MAXIMIZING WARFIGHTER CAPABILITY USING SURVEYED NECESSITY MEASUREMENT:APPLICATION TO THE USAF
F-15C FLEETJohn M. Colombi, David R. Jacques, and Dennis D. Strouble
Within the Department of Defense, with changing missions to counter dynamic and asymmetrical threats, the acquisition workforce strives to maximize capability for joint warfi ghting. How acquisition professionals measure and select capability improvements for the nation’s weapon systems is a perpetual challenge, made even more complex with constrained defense budgets. This study identifi es a method for determining which upgrades should be purchased (production) for which aircraft in the F-15C fl eet by optimizing a capability proxy measure. Each upgrade’s “necessity” for a given mission area was obtained by conducting a survey of over 250 experienced F-15C pilots. The solution presented in this article should be extensible to other weapon system capability decisions.
W ith the planned addition of the F-22A into the United States Air Force (USAF) inventory, the Service developed plans to draw down the F-15 fl eet to 179 total aircraft (F-15 C/D models only) by 2013, eventually transition-
ing most aircraft to the Air National Guard (ANG). However, as a result of decisions made by the Base Realignment and Closure (BRAC) Commission (DoD, 2005) and the 2006 Quadrennial Defense Review (QDR) (DoD, 2006), as well as a reduced F-22A buy, the USAF and ANG will keep an additional number of aircraft in service through 2024. Since current plans and budgets have been based on a fl eet of 179, the budgets will not support installation of all planned upgrades to a larger F-15 fl eet.
This research demonstrates a method for determining the optimal mix of produc-tion upgrades for the future F-15 fl eet (including C and D models, but not E models,
DEFENSE ACQUISITION REVIEW JOURNAL
242 December 2008
which are managed separately) within a constrained budget. To make this determina-tion, the following three questions had to be answered:
Which upgrades (modifi cations) are most needed for the F-15 to perform its mission(s)?
How can these upgrades be compared on a common scale?
Can we maximize a fl eet’s capability for a fi xed budget authority?
The study thus seeks to provide an optimized solution for keeping a large number of aircraft beyond the 179 relevant for combat duty for one to two additional decades of service.
BACKGROUND
The F-15 is an all-weather, maneuverable tactical fi ghter designed to gain and maintain air supremacy over the battlefi eld. This superiority is achieved through a mixture of maneuverability, acceleration, range, weapons, and avionics. The weap-ons and fl ight control systems are designed so one person can safely and effectively perform air-to-air combat. But as the Advanced Tactical Fighter (ATF) program was conceived, this new aircraft was seen to be a replacement for the F-15 fl eet, all A-D variants. However, as the program evolved to the F-22A, the planned buy was cut from 750 aircraft to 442 aircraft to 339 aircraft. It soon became apparent that some F-15C/Ds would need to remain in service alongside the F-22A for the foresee-able future. Prior to 2001, plans were developed to reduce the F-15 fl eet size to 179 aircraft by 2013. These “long-term” aircraft, also known as “Golden Eagles,” were scheduled to receive a large number of modifi cations and upgrades that would extend their combat relevance out to 2025 and beyond. (Due to a crash, there are now only 178 Golden Eagles.) However, in 2002, the F-22A buy was further reduced to 183 aircraft, and the results of the 2005 BRAC mandated keeping a larger ANG F-15C force size than the Air Force had planned. Further, after September of 2001 the air su-periority forces of the DoD have been tasked with an additional mission of homeland defense, a mission largely abandoned after the Cold War ended in the early 1990s. This combination of factors has resulted in a need for additional F-15Cs over the next 20 years.
Since little trade space exists in the fl eet size, largely mandated by BRAC, QDR, and political considerations, and given the current tightly constrained fi scal environ-ment, some sort of decision support process was needed to choose which upgrade(s) will be purchased for which aircraft and in which year. This decision in the past would often have been made in a non-scientifi c manner, attempting to balance con-fl icting though professional recommendations by multiple stakeholders in the acquisi-tion, budget, and operational environments. The complexity of this planning decision is daunting; a number of related factors must be considered, some of which include:
Fleet size over time including retirement schedules
A- and B-Model retirement plans
December 2008
MAXIMIZING WARFIGHTER CAPABILITY
243
Sundown Rule, restricting upgrade spending on aircraft to be retired within 5 years
Prior upgrades (Golden Eagles already have many of these upgrades)
Acquisition costs, including unit price per lot, startup production costs, research and development cost, installation costs, and timing, testing, and certifi cation, etc.
Funding profi les across Future Years Defense Plan (FYDP) and appropriation type
Squadron-specifi c missions, including Deployed Combat within an Air Expe- ditionary Force (AEF), Homeland Security, and Training
System upgrade interdependencies
This research was sponsored by the F-15 system program offi ce and was focused on previously approved modifi cations. The 11 modifi cations examined have been vet-ted through all appropriate requirements and capability reviews. Thus, the challenge was to fi nd the number of each modifi cation to maximize fl eet capability over time to perform the F-15 missions. A tool and method was requested to support this complex acquisition decision.
METHOD
The method used to solve this problem fi rst started with a set of 11 upgrades, pro-vided and currently managed by the program offi ce, which added to F-15 capability. To establish a measure of capability improvement for all upgrades, an online survey of experienced F-15 pilots was released. The survey data were averaged, scaled, and combined with various fl eet and acquisition constraints. All this was input to a linear programming model that searched for the best set of modifi cations and their respec-tive production quantities, constrained primarily by budget authority.
CANDIDATE UPGRADES AND COSTS
The list and description of 11 current upgrades is shown in Table 1. The cost of each upgrade (per aircraft) is shown in Figure 1. Admittedly, there could be some variability in these costs due to variations in total quantity purchased and the quantity purchased per year, but for purposes of this study these costs are representative.
COMPARING UPGRADES ON A COMMON SCALE
A method was needed to evaluate all the candidate upgrades on a common scale that described their “value added” to the aircraft’s capability. Similar techniques have been tried on other Air Force platforms, such as comparing upgrades on a “Mis-sion Availability” improvement scale, a technique used to evaluate Air Warning and Control System (AWACS) upgrades during the Extend Sentry program. As a desired acquisition practice stemming from DoD’s ongoing Capability Based Acquisition
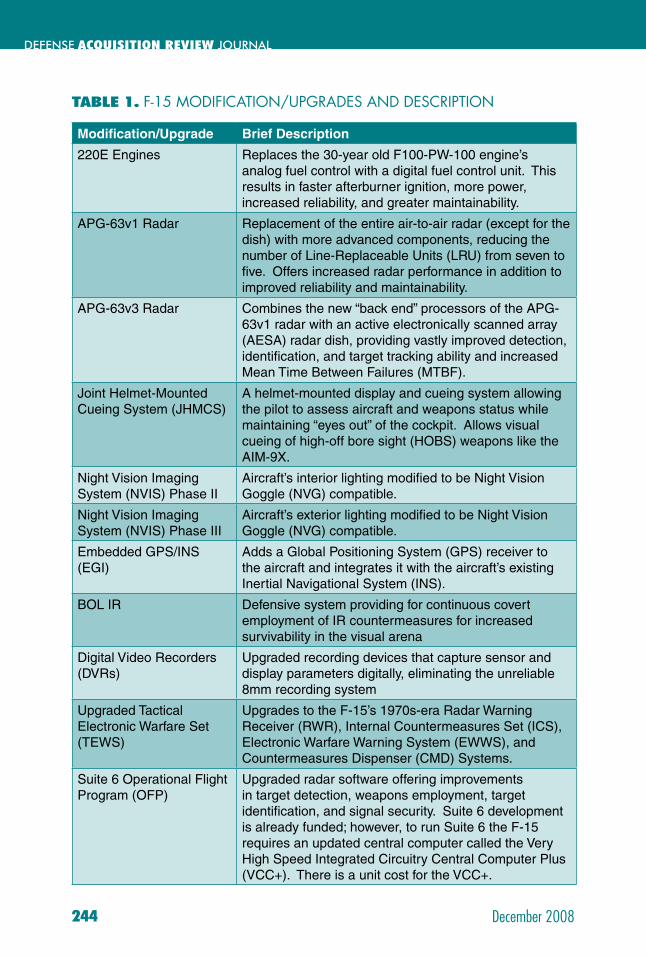
DEFENSE ACQUISITION REVIEW JOURNAL
244 December 2008
TABLE 1. F-15 MODIFICATION/UPGRADES AND DESCRIPTION
Modifi cation/Upgrade Brief Description
220E Engines Replaces the 30-year old F100-PW-100 engine’s analog fuel control with a digital fuel control unit. This results in faster afterburner ignition, more power, increased reliability, and greater maintainability.
APG-63v1 Radar Replacement of the entire air-to-air radar (except for the dish) with more advanced components, reducing the number of Line-Replaceable Units (LRU) from seven to fi ve. Offers increased radar performance in addition to improved reliability and maintainability.
APG-63v3 Radar Combines the new “back end” processors of the APG-63v1 radar with an active electronically scanned array (AESA) radar dish, providing vastly improved detection, identifi cation, and target tracking ability and increased Mean Time Between Failures (MTBF).
Joint Helmet-Mounted Cueing System (JHMCS)
A helmet-mounted display and cueing system allowing the pilot to assess aircraft and weapons status while maintaining “eyes out” of the cockpit. Allows visual cueing of high-off bore sight (HOBS) weapons like the AIM-9X.
Night Vision Imaging System (NVIS) Phase II
Aircraft’s interior lighting modifi ed to be Night Vision Goggle (NVG) compatible.
Night Vision Imaging System (NVIS) Phase III
Aircraft’s exterior lighting modifi ed to be Night Vision Goggle (NVG) compatible.
Embedded GPS/INS (EGI)
Adds a Global Positioning System (GPS) receiver to the aircraft and integrates it with the aircraft’s existing Inertial Navigational System (INS).
BOL IR Defensive system providing for continuous covert employment of IR countermeasures for increased survivability in the visual arena
Digital Video Recorders (DVRs)
Upgraded recording devices that capture sensor and display parameters digitally, eliminating the unreliable 8mm recording system
Upgraded Tactical Electronic Warfare Set (TEWS)
Upgrades to the F-15’s 1970s-era Radar Warning Receiver (RWR), Internal Countermeasures Set (ICS), Electronic Warfare Warning System (EWWS), and Countermeasures Dispenser (CMD) Systems.
Suite 6 Operational Flight Program (OFP)
Upgraded radar software offering improvements in target detection, weapons employment, target identifi cation, and signal security. Suite 6 development is already funded; however, to run Suite 6 the F-15 requires an updated central computer called the Very High Speed Integrated Circuitry Central Computer Plus (VCC+). There is a unit cost for the VCC+.
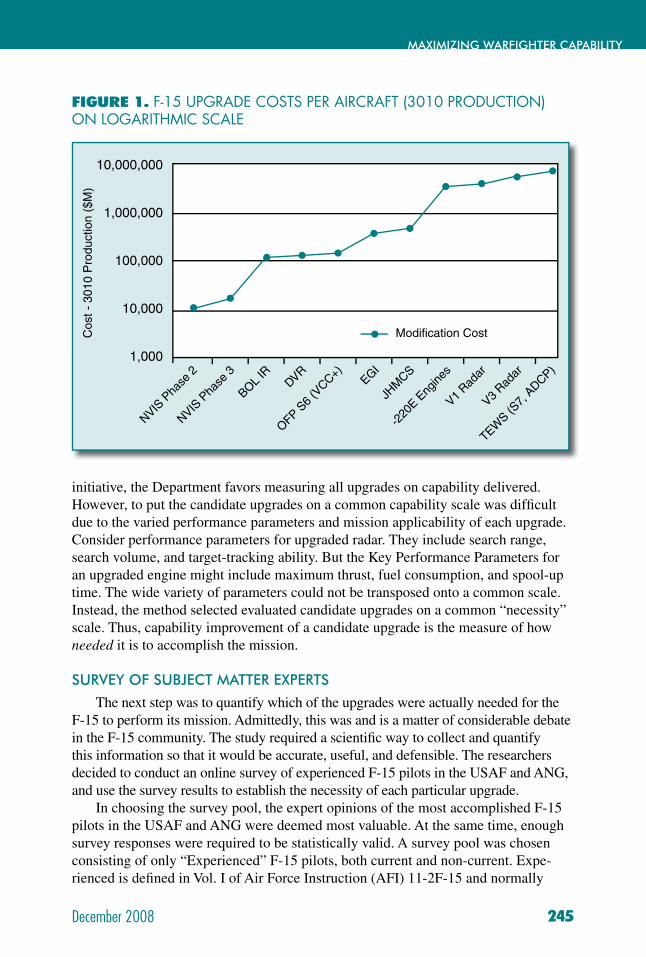
December 2008
MAXIMIZING WARFIGHTER CAPABILITY
245
initiative, the Department favors measuring all upgrades on capability delivered. However, to put the candidate upgrades on a common capability scale was diffi cult due to the varied performance parameters and mission applicability of each upgrade. Consider performance parameters for upgraded radar. They include search range, search volume, and target-tracking ability. But the Key Performance Parameters for an upgraded engine might include maximum thrust, fuel consumption, and spool-up time. The wide variety of parameters could not be transposed onto a common scale. Instead, the method selected evaluated candidate upgrades on a common “necessity” scale. Thus, capability improvement of a candidate upgrade is the measure of how needed it is to accomplish the mission.
SURVEY OF SUBJECT MATTER EXPERTS
The next step was to quantify which of the upgrades were actually needed for the F-15 to perform its mission. Admittedly, this was and is a matter of considerable debate in the F-15 community. The study required a scientifi c way to collect and quantify this information so that it would be accurate, useful, and defensible. The researchers decided to conduct an online survey of experienced F-15 pilots in the USAF and ANG, and use the survey results to establish the necessity of each particular upgrade.
In choosing the survey pool, the expert opinions of the most accomplished F-15 pilots in the USAF and ANG were deemed most valuable. At the same time, enough survey responses were required to be statistically valid. A survey pool was chosen consisting of only “Experienced” F-15 pilots, both current and non-current. Expe-rienced is defi ned in Vol. I of Air Force Instruction (AFI) 11-2F-15 and normally
FIGURE 1. F-15 UPGRADE COSTS PER AIRCRAFT (3010 PRODUCTION) ON LOGARITHMIC SCALE
Cos
t - 3
010
Pro
duct
ion
($M
)
10,000,000
1,000,000
100,000
10,000
1,000
Modifi cation Cost
NVIS P
hase
2
NVIS P
hase
3
BOL IR
DVR
OFP S6
(VCC+) EGI
JHM
CS
-220
E Eng
ines
V1 Rad
ar
V3 Rad
ar
TEWS (S
7, A
DCP)
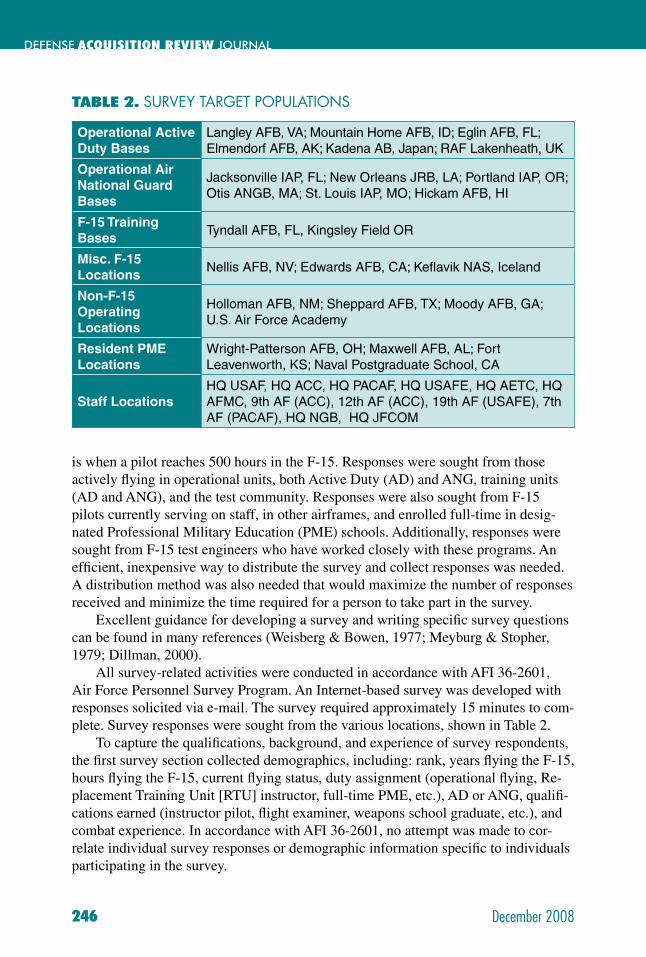
DEFENSE ACQUISITION REVIEW JOURNAL
246 December 2008
is when a pilot reaches 500 hours in the F-15. Responses were sought from those actively fl ying in operational units, both Active Duty (AD) and ANG, training units (AD and ANG), and the test community. Responses were also sought from F-15 pilots currently serving on staff, in other airframes, and enrolled full-time in desig-nated Professional Military Education (PME) schools. Additionally, responses were sought from F-15 test engineers who have worked closely with these programs. An effi cient, inexpensive way to distribute the survey and collect responses was needed. A distribution method was also needed that would maximize the number of responses received and minimize the time required for a person to take part in the survey.
Excellent guidance for developing a survey and writing specifi c survey questions can be found in many references (Weisberg & Bowen, 1977; Meyburg & Stopher, 1979; Dillman, 2000).
All survey-related activities were conducted in accordance with AFI 36-2601, Air Force Personnel Survey Program. An Internet-based survey was developed with responses solicited via e-mail. The survey required approximately 15 minutes to com-plete. Survey responses were sought from the various locations, shown in Table 2.
To capture the qualifi cations, background, and experience of survey respondents, the fi rst survey section collected demographics, including: rank, years fl ying the F-15, hours fl ying the F-15, current fl ying status, duty assignment (operational fl ying, Re-placement Training Unit [RTU] instructor, full-time PME, etc.), AD or ANG, qualifi -cations earned (instructor pilot, fl ight examiner, weapons school graduate, etc.), and combat experience. In accordance with AFI 36-2601, no attempt was made to cor-relate individual survey responses or demographic information specifi c to individuals participating in the survey.
TABLE 2. SURVEY TARGET POPULATIONS
Operational Active Duty Bases
Langley AFB, VA; Mountain Home AFB, ID; Eglin AFB, FL; Elmendorf AFB, AK; Kadena AB, Japan; RAF Lakenheath, UK
Operational Air National Guard Bases
Jacksonville IAP, FL; New Orleans JRB, LA; Portland IAP, OR; Otis ANGB, MA; St. Louis IAP, MO; Hickam AFB, HI
F-15 Training Bases
Tyndall AFB, FL, Kingsley Field OR
Misc. F-15 Locations
Nellis AFB, NV; Edwards AFB, CA; Kefl avik NAS, Iceland
Non-F-15 Operating Locations
Holloman AFB, NM; Sheppard AFB, TX; Moody AFB, GA; U.S. Air Force Academy
Resident PME Locations
Wright-Patterson AFB, OH; Maxwell AFB, AL; Fort Leavenworth, KS; Naval Postgraduate School, CA
Staff LocationsHQ USAF, HQ ACC, HQ PACAF, HQ USAFE, HQ AETC, HQ AFMC, 9th AF (ACC), 12th AF (ACC), 19th AF (USAFE), 7th AF (PACAF), HQ NGB, HQ JFCOM
December 2008
MAXIMIZING WARFIGHTER CAPABILITY
247
The survey sought how necessary a particular upgrade would be for pilots to accomplish their mission. Three mission types considered were Deployed Combat, Homeland Defense, and Replacement Training Unit. The deployed combat mission correlates closely with the Concept of Operations (CONOPS) for Global Persistent Attack (Department of the Air Force, 2004a). The Homeland Defense mission cor-relates closely with the Homeland Security CONOPS (Department of the Air Force, 2004b). These missions were described to the survey respondents.
NECESSITY RATINGS
Survey respondents were asked to rate the necessity of each modifi cation to ac-complish each of the three missions. The upgrades considered were very diverse—some offered an increase in offensive capability (lethality), some defensive capability (surviv-ability), while some offered both. As discussed earlier, the researchers could not fi nd a way to rate all upgrades on a common capability or utility scale. Via the survey, the researchers were able to rate all the upgrades on a common necessity scale.
Survey respondents rated each upgrade’s necessity using the following Likert psychometric scale:
0 – N/A – Don’t Know – Not enough information to answer 1 – Not necessary to accomplish the mission 2 – In rare circumstances may be necessary to accomplish the mission 3 – Sometimes necessary to accomplish the mission 4 – Usually necessary to accomplish the mission 5 – Absolutely necessary to accomplish the mission
The survey respondents rated the necessity of each upgrade against each of the three mission areas—Deployed Combat, Homeland Defense, and Replacement Train-ing Unit. Respondents were instructed to rate an upgrade with respect to its necessity only; they were to ignore the cost or perceived reliability of the upgrade. It was antici-pated some survey respondents would rate many or all of the upgrades as “Absolutely Necessary” or “Usually Necessary,” not providing enough stratifi cation to accurately evaluate the necessity of those systems. For this reason, when a respondent rated mul-tiple upgrades as “Absolutely Necessary,” the respondent was asked to rank-order those upgrades in importance, and then do the same for all the upgrades ranked as “Usually Necessary.” These rank orders were then used to adjust the necessity ratings.
NECESSITY COEFFICIENTS (NC)
The survey necessity ratings needed to be converted to numeric Necessity Coef-fi cients (NC). A simple method would be to simply use the numerical Likert scale and average the results. In his book The Engineering Design of Systems, Buede cites the work of Craig Kirkwood that found exponential functions are most commonly used to approximate the value functions of stakeholders (Buede, 2000). In other words, when user preferences are stated, their highest preferences are preferred many times over to their lower preferences. In some cases, the highest preferences can be orders of magnitude greater in desirability than the lowest preferences. For these reasons,
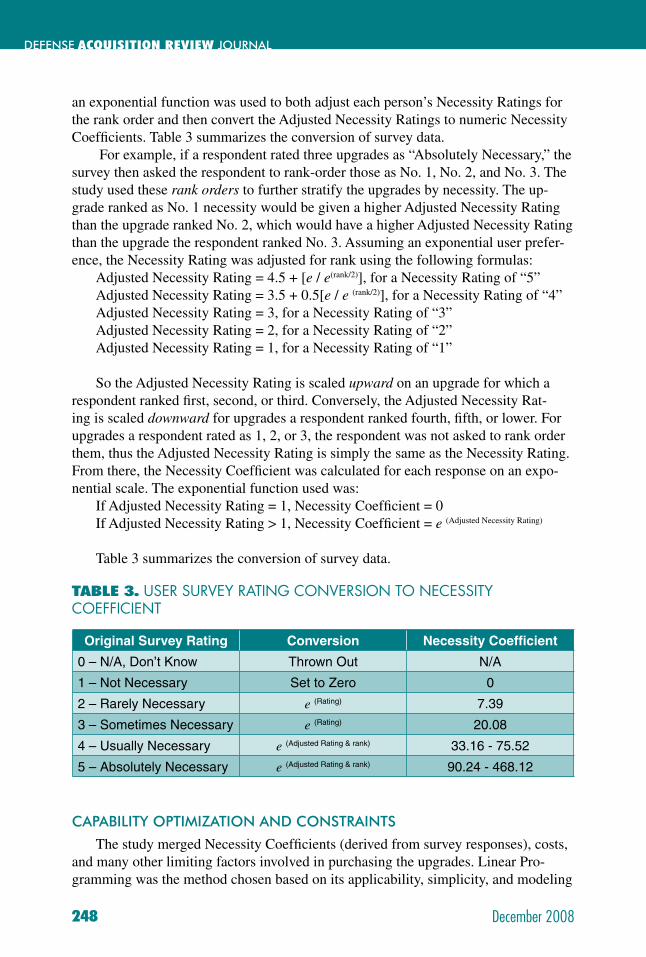
DEFENSE ACQUISITION REVIEW JOURNAL
248 December 2008
an exponential function was used to both adjust each person’s Necessity Ratings for the rank order and then convert the Adjusted Necessity Ratings to numeric Necessity Coeffi cients. Table 3 summarizes the conversion of survey data.
For example, if a respondent rated three upgrades as “Absolutely Necessary,” the survey then asked the respondent to rank-order those as No. 1, No. 2, and No. 3. The study used these rank orders to further stratify the upgrades by necessity. The up-grade ranked as No. 1 necessity would be given a higher Adjusted Necessity Rating than the upgrade ranked No. 2, which would have a higher Adjusted Necessity Rating than the upgrade the respondent ranked No. 3. Assuming an exponential user prefer-ence, the Necessity Rating was adjusted for rank using the following formulas:
Adjusted Necessity Rating = 4.5 + [e / e(rank/2)], for a Necessity Rating of “5”Adjusted Necessity Rating = 3.5 + 0.5[e / e (rank/2)], for a Necessity Rating of “4”Adjusted Necessity Rating = 3, for a Necessity Rating of “3”Adjusted Necessity Rating = 2, for a Necessity Rating of “2”Adjusted Necessity Rating = 1, for a Necessity Rating of “1”
So the Adjusted Necessity Rating is scaled upward on an upgrade for which a respondent ranked fi rst, second, or third. Conversely, the Adjusted Necessity Rat-ing is scaled downward for upgrades a respondent ranked fourth, fi fth, or lower. For upgrades a respondent rated as 1, 2, or 3, the respondent was not asked to rank order them, thus the Adjusted Necessity Rating is simply the same as the Necessity Rating. From there, the Necessity Coeffi cient was calculated for each response on an expo-nential scale. The exponential function used was:
If Adjusted Necessity Rating = 1, Necessity Coeffi cient = 0If Adjusted Necessity Rating > 1, Necessity Coeffi cient = e (Adjusted Necessity Rating)
Table 3 summarizes the conversion of survey data.
CAPABILITY OPTIMIZATION AND CONSTRAINTS
The study merged Necessity Coeffi cients (derived from survey responses), costs, and many other limiting factors involved in purchasing the upgrades. Linear Pro-gramming was the method chosen based on its applicability, simplicity, and modeling
TABLE 3. USER SURVEY RATING CONVERSION TO NECESSITY COEFFICIENT
Original Survey Rating Conversion Necessity Coeffi cient
0 – N/A, Don’t Know Thrown Out N/A
1 – Not Necessary Set to Zero 0
2 – Rarely Necessary e (Rating) 7.39
3 – Sometimes Necessary e (Rating) 20.08
4 – Usually Necessary e (Adjusted Rating & rank) 33.16 - 75.52
5 – Absolutely Necessary e (Adjusted Rating & rank) 90.24 - 468.12
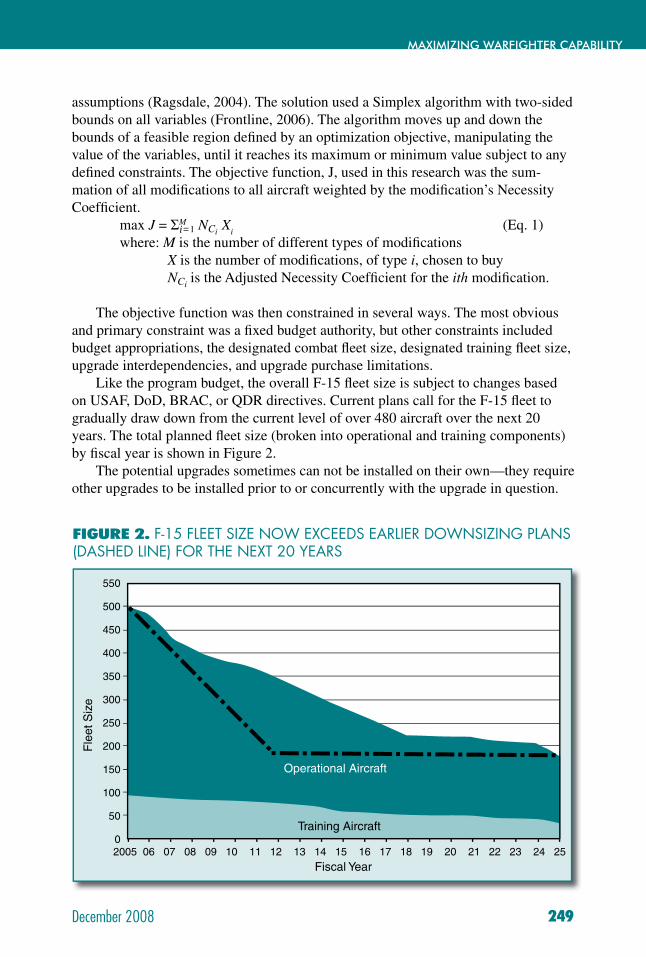
December 2008
MAXIMIZING WARFIGHTER CAPABILITY
249
assumptions (Ragsdale, 2004). The solution used a Simplex algorithm with two-sided bounds on all variables (Frontline, 2006). The algorithm moves up and down the bounds of a feasible region defi ned by an optimization objective, manipulating the value of the variables, until it reaches its maximum or minimum value subject to any defi ned constraints. The objective function, J, used in this research was the sum-mation of all modifi cations to all aircraft weighted by the modifi cation’s Necessity Coeffi cient.
max J = ΣM 1 NCi X
i (Eq. 1)
where: M is the number of different types of modifi cations X is the number of modifi cations, of type i, chosen to buy NCi
is the Adjusted Necessity Coeffi cient for the ith modifi cation.
The objective function was then constrained in several ways. The most obvious and primary constraint was a fi xed budget authority, but other constraints included budget appropriations, the designated combat fl eet size, designated training fl eet size, upgrade interdependencies, and upgrade purchase limitations.
Like the program budget, the overall F-15 fl eet size is subject to changes based on USAF, DoD, BRAC, or QDR directives. Current plans call for the F-15 fl eet to gradually draw down from the current level of over 480 aircraft over the next 20 years. The total planned fl eet size (broken into operational and training components) by fi scal year is shown in Figure 2.
The potential upgrades sometimes can not be installed on their own—they require other upgrades to be installed prior to or concurrently with the upgrade in question.
FIGURE 2. F-15 FLEET SIZE NOW EXCEEDS EARLIER DOWNSIZING PLANS (DASHED LINE) FOR THE NEXT 20 YEARS
Fle
et S
ize
550
500
450
400
350
300
250
200
150
100
50
0
Operational Aircraft
Fiscal Year2005 06 07 08 09 10 11 12 13 14 15 16 17 18 19 20 21 22 23 24 25
Training Aircraft
i=
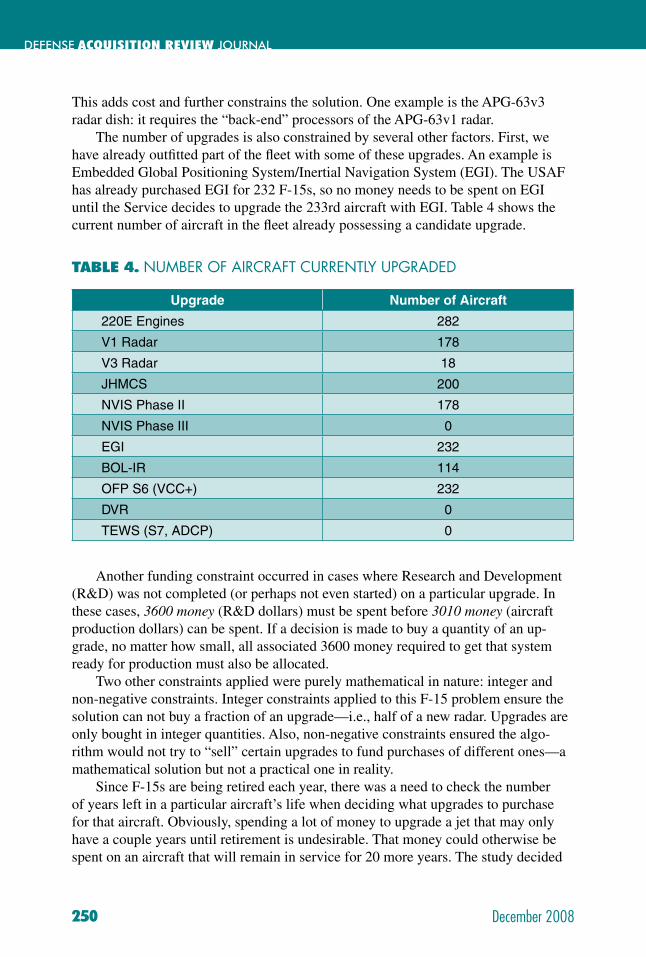
DEFENSE ACQUISITION REVIEW JOURNAL
250 December 2008
This adds cost and further constrains the solution. One example is the APG-63v3 radar dish: it requires the “back-end” processors of the APG-63v1 radar.
The number of upgrades is also constrained by several other factors. First, we have already outfi tted part of the fl eet with some of these upgrades. An example is Embedded Global Positioning System/Inertial Navigation System (EGI). The USAF has already purchased EGI for 232 F-15s, so no money needs to be spent on EGI until the Service decides to upgrade the 233rd aircraft with EGI. Table 4 shows the current number of aircraft in the fl eet already possessing a candidate upgrade.
Another funding constraint occurred in cases where Research and Development (R&D) was not completed (or perhaps not even started) on a particular upgrade. In these cases, 3600 money (R&D dollars) must be spent before 3010 money (aircraft production dollars) can be spent. If a decision is made to buy a quantity of an up-grade, no matter how small, all associated 3600 money required to get that system ready for production must also be allocated.
Two other constraints applied were purely mathematical in nature: integer and non-negative constraints. Integer constraints applied to this F-15 problem ensure the solution can not buy a fraction of an upgrade—i.e., half of a new radar. Upgrades are only bought in integer quantities. Also, non-negative constraints ensured the algo-rithm would not try to “sell” certain upgrades to fund purchases of different ones—a mathematical solution but not a practical one in reality.
Since F-15s are being retired each year, there was a need to check the number of years left in a particular aircraft’s life when deciding what upgrades to purchase for that aircraft. Obviously, spending a lot of money to upgrade a jet that may only have a couple years until retirement is undesirable. That money could otherwise be spent on an aircraft that will remain in service for 20 more years. The study decided
Upgrade Number of Aircraft
220E Engines 282
V1 Radar 178
V3 Radar 18
JHMCS 200
NVIS Phase II 178
NVIS Phase III 0
EGI 232
BOL-IR 114
OFP S6 (VCC+) 232
DVR 0
TEWS (S7, ADCP) 0
TABLE 4. NUMBER OF AIRCRAFT CURRENTLY UPGRADED
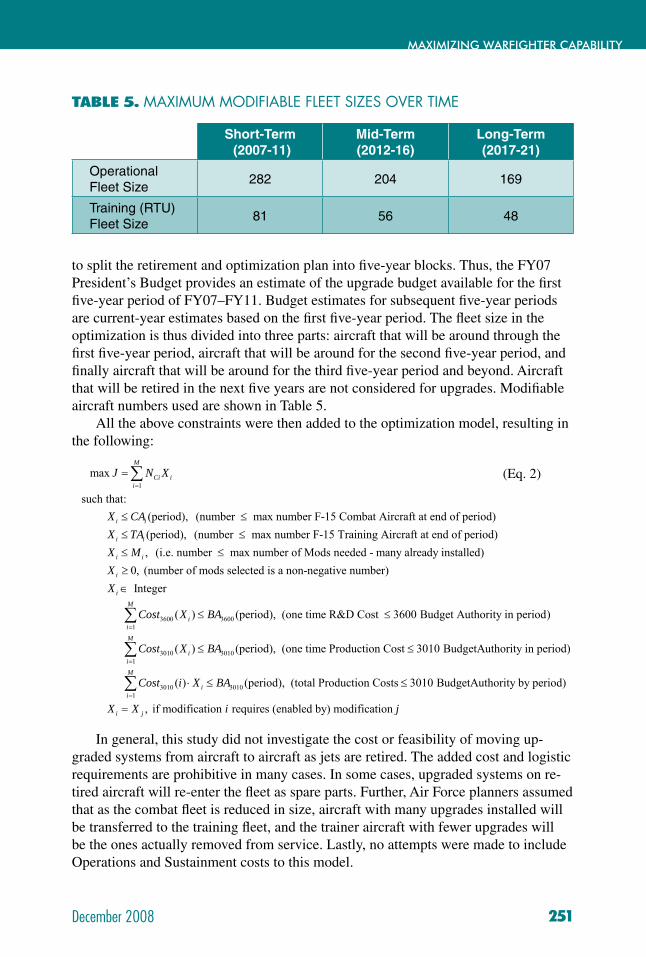
December 2008
MAXIMIZING WARFIGHTER CAPABILITY
251
to split the retirement and optimization plan into fi ve-year blocks. Thus, the FY07 President’s Budget provides an estimate of the upgrade budget available for the fi rst fi ve-year period of FY07–FY11. Budget estimates for subsequent fi ve-year periods are current-year estimates based on the fi rst fi ve-year period. The fl eet size in the optimization is thus divided into three parts: aircraft that will be around through the fi rst fi ve-year period, aircraft that will be around for the second fi ve-year period, and fi nally aircraft that will be around for the third fi ve-year period and beyond. Aircraft that will be retired in the next fi ve years are not considered for upgrades. Modifi able aircraft numbers used are shown in Table 5.
All the above constraints were then added to the optimization model, resulting in the following:
In general, this study did not investigate the cost or feasibility of moving up-graded systems from aircraft to aircraft as jets are retired. The added cost and logistic requirements are prohibitive in many cases. In some cases, upgraded systems on re-tired aircraft will re-enter the fl eet as spare parts. Further, Air Force planners assumed that as the combat fl eet is reduced in size, aircraft with many upgrades installed will be transferred to the training fl eet, and the trainer aircraft with fewer upgrades will be the ones actually removed from service. Lastly, no attempts were made to include Operations and Sustainment costs to this model.
TABLE 5. MAXIMUM MODIFIABLE FLEET SIZES OVER TIME
Short-Term (2007-11)
Mid-Term (2012-16)
Long-Term (2017-21)
Operational Fleet Size
282 204 169
Training (RTU) Fleet Size
81 56 48
1max
such that:(period), (number max number F-15 Combat Aircraft at end of period)(period), (number max number F-15 Training Aircraft at end of period), (i.e. number
M
Ci ii
i i
i i
i i
J N X
X CAX TAX M
=
=
≤ ≤
≤ ≤≤
∑
3600 3600
max number of Mods needed - many already installed)0, (number of mods selected is a non-negative number) Integer
( ) (period), (one time R&D Cost 3600 Budget Authority in peri
i
i
i
XX
Cost X BA
≤
≥∈
≤ ≤1
3010 30101
3010 30101
od)
( ) (period), (one time Production Cost 3010 BudgetAuthority in period)
( ) (period), (total Production Costs 3010 BudgetAuthority by period)
,
M
iM
iiM
ii
i j
Cost X BA
Cost i X BA
X X
=
=
=
≤ ≤
⋅ ≤ ≤
=
∑
∑
∑if modification requires (enabled by) modification i j
(Eq. 2)
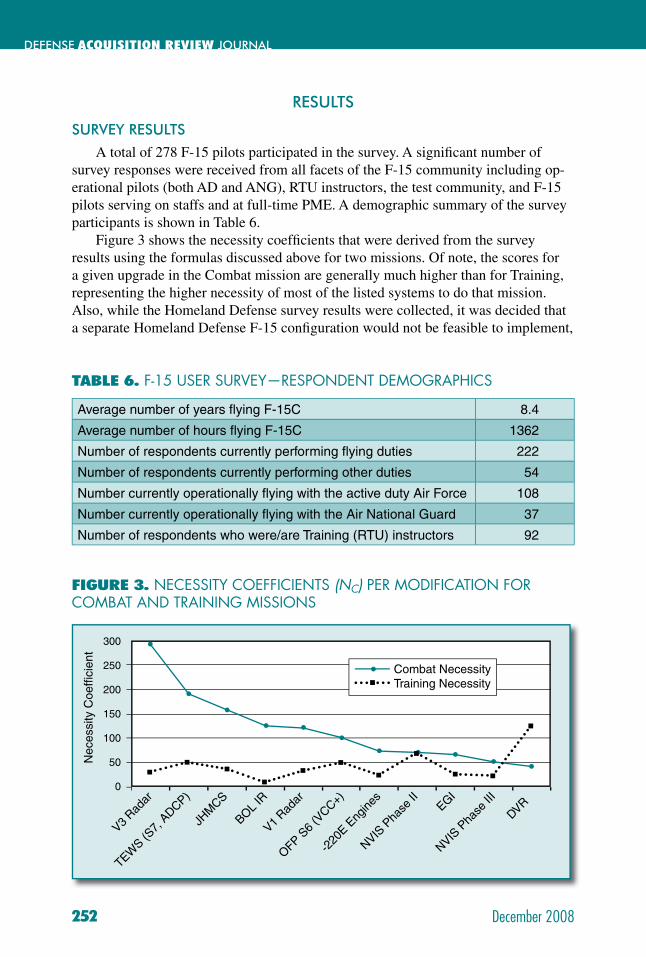
DEFENSE ACQUISITION REVIEW JOURNAL
252 December 2008
RESULTS
SURVEY RESULTS
A total of 278 F-15 pilots participated in the survey. A signifi cant number of survey responses were received from all facets of the F-15 community including op-erational pilots (both AD and ANG), RTU instructors, the test community, and F-15 pilots serving on staffs and at full-time PME. A demographic summary of the survey participants is shown in Table 6.
Figure 3 shows the necessity coeffi cients that were derived from the survey results using the formulas discussed above for two missions. Of note, the scores for a given upgrade in the Combat mission are generally much higher than for Training, representing the higher necessity of most of the listed systems to do that mission. Also, while the Homeland Defense survey results were collected, it was decided that a separate Homeland Defense F-15 confi guration would not be feasible to implement,
FIGURE 3. NECESSITY COEFFICIENTS (NC) PER MODIFICATION FOR COMBAT AND TRAINING MISSIONS
NVIS P
hase
II
NVIS P
hase
III
BOL IR
DVR
OFP S6
(VCC+) EGI
JHM
CS
-220
E Eng
ines
V1 Rad
ar
V3 Rad
ar
TEWS (S
7, A
DCP)
Nec
essi
ty C
oeffi
cien
t
300
250
200
150
100
50
0
Combat NecessityTraining Necessity
TABLE 6. F-15 USER SURVEY—RESPONDENT DEMOGRAPHICS
Average number of years fl ying F-15C 8.4
Average number of hours fl ying F-15C 1362
Number of respondents currently performing fl ying duties 222
Number of respondents currently performing other duties 54
Number currently operationally fl ying with the active duty Air Force 108
Number currently operationally fl ying with the Air National Guard 37
Number of respondents who were/are Training (RTU) instructors 92
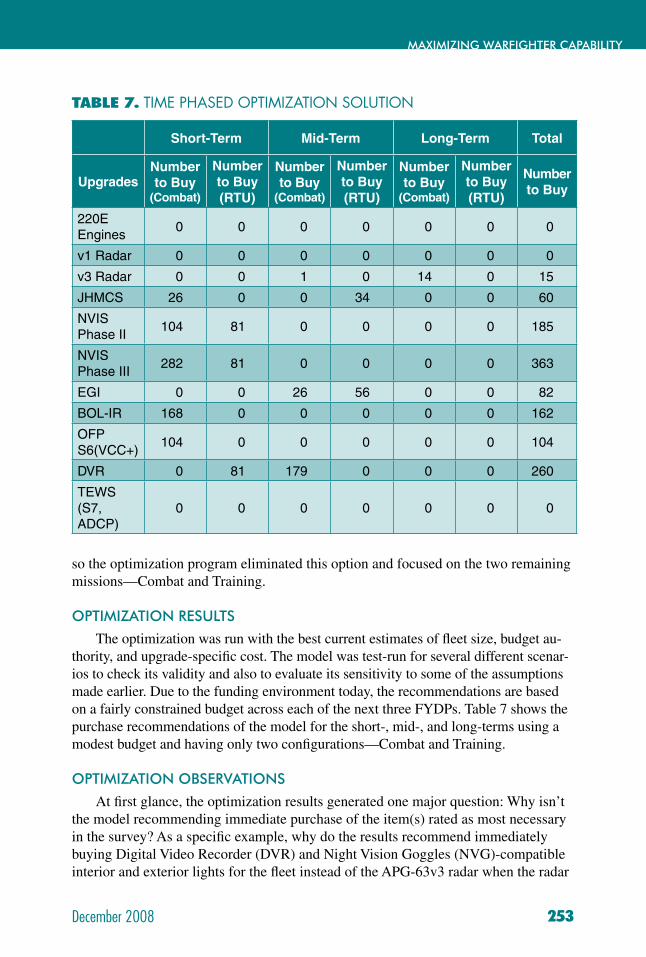
December 2008
MAXIMIZING WARFIGHTER CAPABILITY
253
so the optimization program eliminated this option and focused on the two remaining missions—Combat and Training.
OPTIMIZATION RESULTS
The optimization was run with the best current estimates of fl eet size, budget au-thority, and upgrade-specifi c cost. The model was test-run for several different scenar-ios to check its validity and also to evaluate its sensitivity to some of the assumptions made earlier. Due to the funding environment today, the recommendations are based on a fairly constrained budget across each of the next three FYDPs. Table 7 shows the purchase recommendations of the model for the short-, mid-, and long-terms using a modest budget and having only two confi gurations—Combat and Training.
OPTIMIZATION OBSERVATIONS
At fi rst glance, the optimization results generated one major question: Why isn’t the model recommending immediate purchase of the item(s) rated as most necessary in the survey? As a specifi c example, why do the results recommend immediately buying Digital Video Recorder (DVR) and Night Vision Goggles (NVG)-compatible interior and exterior lights for the fl eet instead of the APG-63v3 radar when the radar
TABLE 7. TIME PHASED OPTIMIZATION SOLUTION
Short-Term Mid-Term Long-Term Total
UpgradesNumberto Buy
(Combat)
Number to Buy (RTU)
Numberto Buy
(Combat)
Number to Buy (RTU)
Numberto Buy
(Combat)
Number to Buy (RTU)
Number to Buy
220E Engines
0 0 0 0 0 0 0
v1 Radar 0 0 0 0 0 0 0
v3 Radar 0 0 1 0 14 0 15
JHMCS 26 0 0 34 0 0 60
NVIS Phase II
104 81 0 0 0 0 185
NVIS Phase III
282 81 0 0 0 0 363
EGI 0 0 26 56 0 0 82
BOL-IR 168 0 0 0 0 0 162
OFP S6(VCC+)
104 0 0 0 0 0 104
DVR 0 81 179 0 0 0 260
TEWS (S7, ADCP)
0 0 0 0 0 0 0
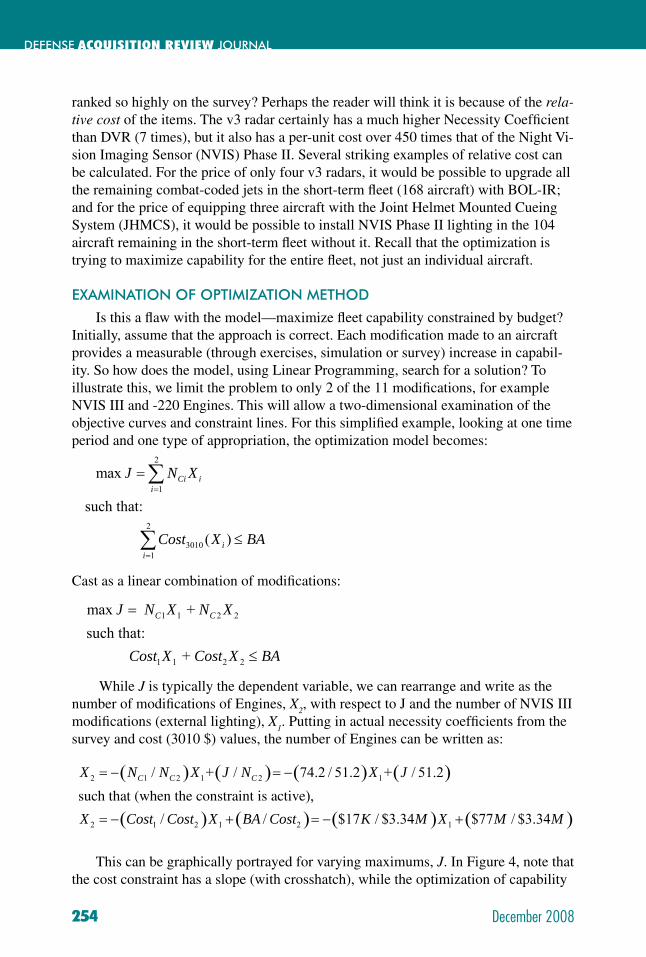
DEFENSE ACQUISITION REVIEW JOURNAL
254 December 2008
ranked so highly on the survey? Perhaps the reader will think it is because of the rela-tive cost of the items. The v3 radar certainly has a much higher Necessity Coeffi cient than DVR (7 times), but it also has a per-unit cost over 450 times that of the Night Vi-sion Imaging Sensor (NVIS) Phase II. Several striking examples of relative cost can be calculated. For the price of only four v3 radars, it would be possible to upgrade all the remaining combat-coded jets in the short-term fl eet (168 aircraft) with BOL-IR; and for the price of equipping three aircraft with the Joint Helmet Mounted Cueing System (JHMCS), it would be possible to install NVIS Phase II lighting in the 104 aircraft remaining in the short-term fl eet without it. Recall that the optimization is trying to maximize capability for the entire fl eet, not just an individual aircraft.
EXAMINATION OF OPTIMIZATION METHOD
Is this a fl aw with the model—maximize fl eet capability constrained by budget? Initially, assume that the approach is correct. Each modifi cation made to an aircraft provides a measurable (through exercises, simulation or survey) increase in capabil-ity. So how does the model, using Linear Programming, search for a solution? To illustrate this, we limit the problem to only 2 of the 11 modifi cations, for example NVIS III and -220 Engines. This will allow a two-dimensional examination of the objective curves and constraint lines. For this simplifi ed example, looking at one time period and one type of appropriation, the optimization model becomes:
Cast as a linear combination of modifi cations:
While J is typically the dependent variable, we can rearrange and write as the number of modifi cations of Engines, X
2, with respect to J and the number of NVIS III
modifi cations (external lighting), X1. Putting in actual necessity coeffi cients from the
survey and cost (3010 $) values, the number of Engines can be written as:
This can be graphically portrayed for varying maximums, J. In Figure 4, note that the cost constraint has a slope (with crosshatch), while the optimization of capability
1 1 2 2
1 1 2 2
max + such that: +
C CJ N X N X
Cost X Cost X BA
=
≤
( ) ( ) ( ) ( )
( ) ( ) ( ) ( )
2 1 2 1 2 1
2 1 2 1 2 1
/ + / 74.2 / 51.2 + / 51.2such that (when the constraint is active),
/ / $17 / $3.34 $77 / $3.34
C C CX N N X J N X J
X Cost Cost X BA Cost K M X M M
= − = −
= − + = − +
2
1
2
30101
max
such that:
( )
Ci ii
ii
J N X
Cost X BA
=
=
=
≤
∑
∑
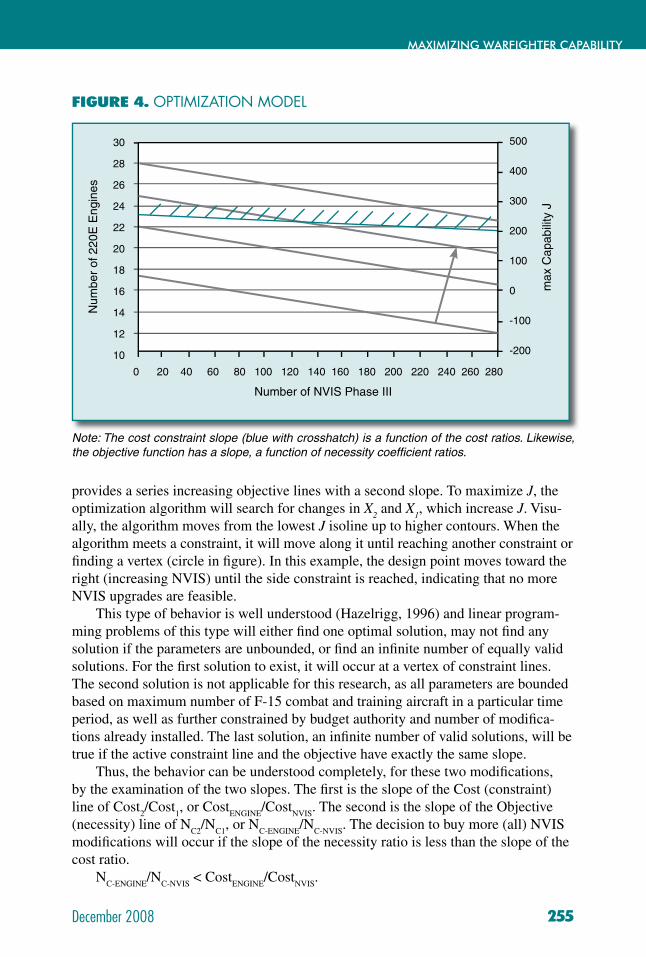
December 2008
MAXIMIZING WARFIGHTER CAPABILITY
255
provides a series increasing objective lines with a second slope. To maximize J, the optimization algorithm will search for changes in X
2 and X
1, which increase J. Visu-
ally, the algorithm moves from the lowest J isoline up to higher contours. When the algorithm meets a constraint, it will move along it until reaching another constraint or fi nding a vertex (circle in fi gure). In this example, the design point moves toward the right (increasing NVIS) until the side constraint is reached, indicating that no more NVIS upgrades are feasible.
This type of behavior is well understood (Hazelrigg, 1996) and linear program-ming problems of this type will either fi nd one optimal solution, may not fi nd any solution if the parameters are unbounded, or fi nd an infi nite number of equally valid solutions. For the fi rst solution to exist, it will occur at a vertex of constraint lines. The second solution is not applicable for this research, as all parameters are bounded based on maximum number of F-15 combat and training aircraft in a particular time period, as well as further constrained by budget authority and number of modifi ca-tions already installed. The last solution, an infi nite number of valid solutions, will be true if the active constraint line and the objective have exactly the same slope.
Thus, the behavior can be understood completely, for these two modifi cations, by the examination of the two slopes. The fi rst is the slope of the Cost (constraint) line of Cost
2/Cost
1, or Cost
ENGINE/Cost
NVIS. The second is the slope of the Objective
(necessity) line of NC2
/NC1
, or NC-ENGINE
/NC-NVIS
. The decision to buy more (all) NVIS modifi cations will occur if the slope of the necessity ratio is less than the slope of the cost ratio.
NC-ENGINE
/NC-NVIS
< CostENGINE
/CostNVIS
.
FIGURE 4. OPTIMIZATION MODEL
Note: The cost constraint slope (blue with crosshatch) is a function of the cost ratios. Likewise, the objective function has a slope, a function of necessity coeffi cient ratios.
30
28
26
24
22
20
18
16
14
12
10
500
400
300
200
100
0
-100
-200
Num
ber
of 2
20E
Eng
ines
max
Cap
abili
ty J
Number of NVIS Phase III
0 20 40 60 80 100 120 140 160 180 200 220 240 260 280
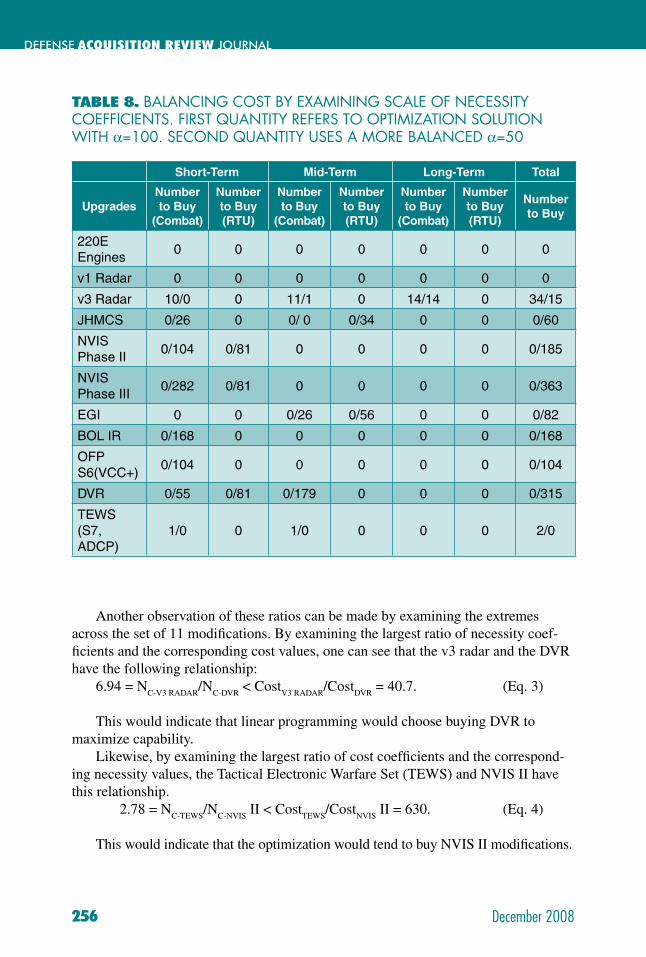
DEFENSE ACQUISITION REVIEW JOURNAL
256 December 2008
Another observation of these ratios can be made by examining the extremes across the set of 11 modifi cations. By examining the largest ratio of necessity coef-fi cients and the corresponding cost values, one can see that the v3 radar and the DVR have the following relationship:
6.94 = NC-V3 RADAR
/NC-DVR
< CostV3 RADAR
/CostDVR
= 40.7. (Eq. 3) This would indicate that linear programming would choose buying DVR to
maximize capability.Likewise, by examining the largest ratio of cost coeffi cients and the correspond-
ing necessity values, the Tactical Electronic Warfare Set (TEWS) and NVIS II have this relationship.
2.78 = NC-TEWS
/NC-NVIS
II < CostTEWS
/CostNVIS
II = 630. (Eq. 4)
This would indicate that the optimization would tend to buy NVIS II modifi cations.
TABLE 8. BALANCING COST BY EXAMINING SCALE OF NECESSITY COEFFICIENTS. FIRST QUANTITY REFERS TO OPTIMIZATION SOLUTION WITH α=100. SECOND QUANTITY USES A MORE BALANCED α=50
Short-Term Mid-Term Long-Term Total
UpgradesNumberto Buy
(Combat)
Number to Buy (RTU)
Numberto Buy
(Combat)
Number to Buy (RTU)
Numberto Buy
(Combat)
Number to Buy (RTU)
Number to Buy
220E Engines
0 0 0 0 0 0 0
v1 Radar 0 0 0 0 0 0 0
v3 Radar 10/0 0 11/1 0 14/14 0 34/15
JHMCS 0/26 0 0/ 0 0/34 0 0 0/60
NVIS Phase II
0/104 0/81 0 0 0 0 0/185
NVIS Phase III
0/282 0/81 0 0 0 0 0/363
EGI 0 0 0/26 0/56 0 0 0/82
BOL IR 0/168 0 0 0 0 0 0/168
OFP S6(VCC+)
0/104 0 0 0 0 0 0/104
DVR 0/55 0/81 0/179 0 0 0 0/315
TEWS (S7, ADCP)
1/0 0 1/0 0 0 0 2/0
December 2008
MAXIMIZING WARFIGHTER CAPABILITY
257
To remedy this situation of always buying low-cost, lease-capable modifi cations, one should examine the spread of Necessity Coeffi cients, NC, and their relation to the spread of cost and budget authority. While the cost scale and constraints must remain on a linear scale, the Necessity Coeffi cients could be further spread, using a larger base. Recall the current scale of NC uses e (Adjusted Rating & rank). One could better balance cost using α (Adjusted Rating & rank), where α is chosen in the range that satisfi es both Equa-tions 3 and 4. For example, using an α of 100 and 50, the following results compa-rable to Table 7 are produced in Table 8.
CONCLUSIONS
This article documents an effective approach to compare system modifi cations in terms of capability provided, through the use of surveying experienced pilots and ex-tracting their assessment of upgrade “necessity” to successfully conduct various mis-sions. Necessity proved to be a novel way to compare, on a common scale, candidate upgrades with widely different system parameters. Additionally, scaling necessity on an exponential scale should better represent a user’s true relative preferences. While a linear programming model can combine cost and necessity (capability), incorporating a myriad of complex constraints and relationships, one must understand the limita-tions of these models. In particular, one should balance scales of necessity and cost by examining point ratio extremes. These ratios (slopes) guide the search algorithms in linear programming to solutions. Results provide recommended modifi cation pur-chases for the USAF F-15 fl eet for combat and training aircraft across three FYDPs. This approach should be extensible across DoD programs, to extract quantitative measures of capability, constrained by budget authority, to provide those capabilities.

DEFENSE ACQUISITION REVIEW JOURNAL
258 December 2008
Lt Col John Colombi, USAF (Ret.), is an assistant professor of Electrical Engineering at the Air Force Institute of Technology (AFIT). He holds a Ph.D. in Electrical Engineering from AFIT. Currently, he teaches graduate courses and leads sponsored research in support of the Systems Engineering program. Dr. Colombi led Command, Control, Communications, Computers, Intelligence, Surveillance, and Reconnaissance systems integration activities, including systems engineering for the Airborne Warning and Control System at Hanscom AFB, MA.
(E-mail address: john.colombi@afi t.edu)
Lt Col David Jacques, USAF (Ret.), is an assistant professor of Aerospace Engineering on the faculty of the Air Force Institute of Technology (AFIT). He holds a Ph.D. in Aeronautical Engineering from AFIT. Dr. Jacques is currently curriculum chair of the Graduate Systems Engineering Program. His research interests are in the areas of concept defi nition and evaluation, architecture modeling, and optimal system design. Dr. Jacques led the activation of the Air Force Center for Systems Engineering.
(E-mail address: David.Jacques@afi t.edu)
Dr. Dennis Strouble is an assistant professor of Systems Engineering Management at the Air Force Institute of Technology. He holds a Ph.D. in Management and a J.D. from Texas Tech University. Currently, he teaches graduate courses in Systems Engineering Management, Information Resource Management and Law, and leads sponsored research in support of the Systems Engineering and Information Research Management programs. Dr. Strouble has taught at several universities, has remained active in the practice of law, and has founded and managed several businesses.
(E-mail address: dennis.strouble@afi t.edu)
AUTHOR BIOGRAPHY
ACKNOWLEDGMENTS
The authors gratefully acknowledge the work of several people who made signifi cant contributions to this article, especially students Joseph Beahm, Bret Anderson, and Robert White. Thanks to the sponsors, Dan Marticello and John McLaughlin, as well as Terry Sampson for survey Web design. Thanks also to the editors/ reviewers for strengthening this work. Finally, thanks to the hun-dreds of F-15 pilots who took the time to respond to the survey.
December 2008
MAXIMIZING WARFIGHTER CAPABILITY
259
REFERENCES
Buede, D. M. (2000). The engineering design of systems, models and methods. New York: John Wiley & Sons.
Department of Defense. (2005, September 8). 2005 Defense Base Closure and Re-alignment Commission Report to Congress.
Department of Defense. (2006, February 6). Quadrennial Defense Review Report.
Department of the Air Force. (2004a, May 24). Global Persistent Attack CONOPS.
Department of the Air Force. (2004b, September 15). Homeland Security CONOPS.
Dillman, Don A. (2000). Mail and Internet surveys: The tailored design method (2nd ed.). New York: John Wiley & Sons.
Frontline Systems, Inc. (2006). Frontline systems solver technology for optimization. Retrieved May 2006 from www.solver.com/
Hazelrigg, George A. (1996). Systems engineering: An approach to information-based design. Upper Saddle River, NJ: Prentice Hall.
Meyburg, Arnim H., & Stopher, Peter R. (1979). Survey sampling and multivariate analysis for social scientists and engineers. Toronto: Lexington Books.
Ragsdale, Cliff T. (2004). Spreadsheet modeling & decision analysis: A practical introduction to management science (4th ed.). Mason, OH: South-Western, a division of Thomson Learning.
Weisberg, Herbert F. & Bowen, Bruce D. (1977). An introduction to survey research and data analysis. San Francisco: W. H. Freeman and Company.

DEFENSE ACQUISITION REVIEW JOURNAL
260 December 2008
Imag
e de
sign
ed b
y H
aram
bee
Den
nis
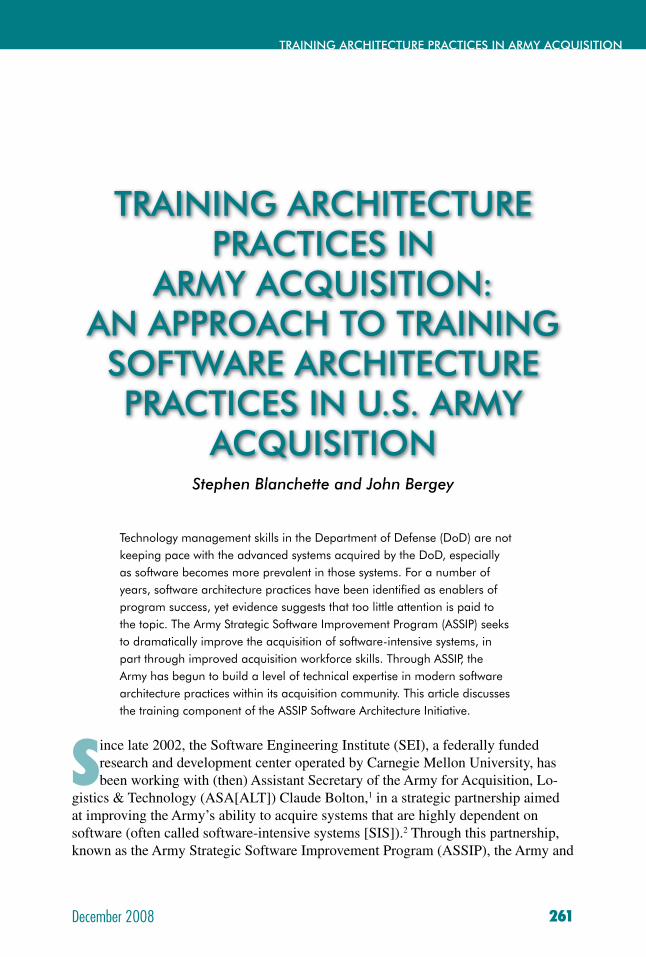
December 2008
INCENTIVE CONTRACTS
261
TRAINING ARCHITECTURE PRACTICES IN ARMY ACQUISITION
Stephen Blanchette and John Bergey
Technology management skills in the Department of Defense (DoD) are not keeping pace with the advanced systems acquired by the DoD, especially as software becomes more prevalent in those systems. For a number of years, software architecture practices have been identifi ed as enablers of program success, yet evidence suggests that too little attention is paid to the topic. The Army Strategic Software Improvement Program (ASSIP) seeks to dramatically improve the acquisition of software-intensive systems, in part through improved acquisition workforce skills. Through ASSIP, the Army has begun to build a level of technical expertise in modern software architecture practices within its acquisition community. This article discusses the training component of the ASSIP Software Architecture Initiative.
Since late 2002, the Software Engineering Institute (SEI), a federally funded research and development center operated by Carnegie Mellon University, has been working with (then) Assistant Secretary of the Army for Acquisition, Lo-
gistics & Technology (ASA[ALT]) Claude Bolton,1 in a strategic partnership aimed at improving the Army’s ability to acquire systems that are highly dependent on software (often called software-intensive systems [SIS]).2 Through this partnership, known as the Army Strategic Software Improvement Program (ASSIP), the Army and
St h Bl h tt d J h B
TRAINING ARCHITECTURE PRACTICES IN
ARMY ACQUISITION: AN APPROACH TO TRAINING SOFTWARE ARCHITECTURE PRACTICES IN U.S. ARMY
ACQUISITION
DEFENSE ACQUISITION REVIEW JOURNAL
262 December 2008
the SEI are engaged in several initiatives designed to enhance the Army’s ability to be a “smart buyer” of software-intensive systems.
The need for ASSIP is readily apparent. Much has been made about the lack of technical depth demonstrated by the Department of Defense (DoD) in managing ever more complex system development programs (Government Accountability Offi ce, 2007; Government Accountability Offi ce, 2008). In fact, in 2007 the Pentagon initi-ated a study of the skills of its acquisition workforce (Erwin, 2007). One contributing factor to the shortage of technical skills is the growing presence of software in virtu-ally every major system, from tanks to bombs to bullets, procured by DoD.
Early ASSIP investigations into Army SIS acquisition indicated, among other things, that while software architecture practices were deemed important for SIS programs, methods and skills to carry out those practices were perceived to be inad-equate. Hence, the ASSIP formulated an initiative to raise the organic capabilities of Army acquisition in this important software development area. This article describes the work done to begin developing a foundation for an organic Army software archi-tecture capability.
WHY SOFTWARE ARCHITECTURE?
One might question the focus on software architecture capabilities within the Army’s acquisition workforce, but the reason becomes obvious when viewing archi-tecture in terms of program success. First, a software architecture is the set of system structures that consist of “software elements, the externally visible properties of those elements, and the relationships among them” (Bass, Clements, & Kazman, 2003, p. 21). The software architecture underpins a system’s software design and code; it represents the earliest design decisions—ones that are often diffi cult to change later (Bass et al., 2003), so getting the architecture “right” has enormous implications for the software and for systems reliant upon that software. It then follows that solid soft-ware architecture practices are essential to successful software-intensive programs.
In fact, the importance of software architecture practices has been known for quite some time. In 1994, the Defense Science Board (DSB) highlighted the potential for software architecture and product line techniques to reduce cost and cycle times
In 2000, the DSB pointed to software architecture as “a central theme for software reuse, product lines, and greater
exploitation of commercial technology and practices” (Defense Science Board Task Force, 2000, p. 3).
December 2008
INCENTIVE CONTRACTS
263
TRAINING ARCHITECTURE PRACTICES IN ARMY ACQUISITION
(Defense Science Board Task Force, 1994). In 2000, the DSB pointed to software ar-chitecture as “a central theme for software reuse, product lines, and greater exploitation of commercial technology and practices” (Defense Science Board Task Force, 2000, p. 3). Further, a 2001 Army lessons-learned workshop focusing on software upgrade programs concluded, in part, that architecture is “a key technical focus for the system” (Anderson et al., 2001, p. 14), making special note of the criticality of the architecture in determining the future ability to upgrade the system (Anderson, et al., 2001).
Given that software architecture practices have been linked to successful SIS acquisition as noted above, one might have expected that such practices would be prevalent in Army (and other Services’) acquisition programs. However, such is not the case. In 2002, the DoD Tri-Service Assessment Initiative (TAI) highlighted poor software architecture practices as one systemic causal factor of software-intensive systems issues, based on TAI assessments of 21 DoD programs (Charette, McGarry, & Baldwin, 2003; McGarry, 2002). Simply performing a task called “software archi-tecture” is insuffi cient to leverage the benefi ts of software architecture. In fact, the act of producing an architecture is inadequate; both acquirer and supplier should also conduct an evaluation of the architecture’s quality and robustness to ensure suitability for current and future needs as the system evolves. Indeed, a few of the larger defense contractors routinely employ some form of architecture evaluation (Bass, Nord, & Wood, 2006).
A recent SEI analysis of 18 software architecture evaluations performed by the Institute between 2000 and 2005 showed that over half of the evaluations revealed signifi cant program risks driven by an organization’s failure to appreciate the extent of the software architecture effort, as evidenced by lack of training, lack of tools, and poor planning. Further, about two-thirds of the risks discovered were risks of omis-sion (architectural decisions either not made or not captured, for example) (Bass, Nord, & Wood, 2006). These observations are consistent with earlier reports that indicated organizations pay insuffi cient attention to software architecture practices, and suggest that architecture evaluators must be experienced enough to probe the architecture in detail rather than accept it at face value.
A review of fi ndings from initial ASSIP data gathering efforts proved consistent with the studies noted above. For instance, acquisition professionals held the general impression that prime contractors’ software architecture abilities were about average (Kasunic, 2004), suggesting a need for architecture evaluations to reduce associ-ated program risk. Yet, according to interviews with some key programs and with the Army’s Program Executive Offi cers (PEOs), government program offi ce staffs were not suffi ciently skilled to evaluate software architectures (Keeler, 2005; Blanchette, 2005).
Thus, software architecture is an acknowledged good practice in SIS programs, but one that is rarely executed effectively or evaluated rigorously.
SOFTWARE ARCHITECTURE INITIATIVE
Given that software architecture was one of the technical challenge areas facing Army program management offi ces (PMOs), the logical next step was to consider
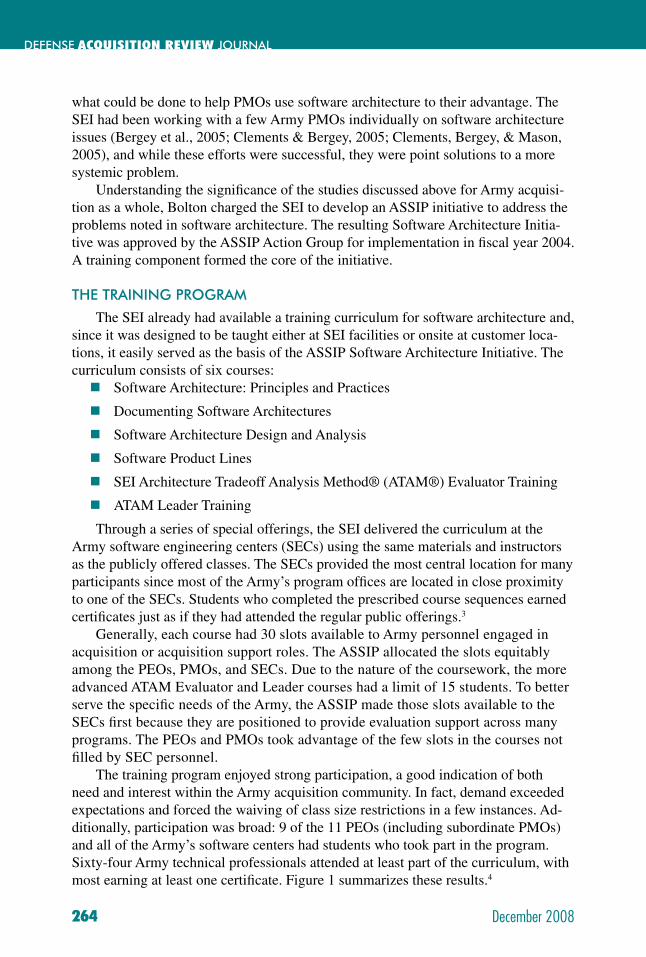
DEFENSE ACQUISITION REVIEW JOURNAL
264 December 2008
what could be done to help PMOs use software architecture to their advantage. The SEI had been working with a few Army PMOs individually on software architecture issues (Bergey et al., 2005; Clements & Bergey, 2005; Clements, Bergey, & Mason, 2005), and while these efforts were successful, they were point solutions to a more systemic problem.
Understanding the signifi cance of the studies discussed above for Army acquisi-tion as a whole, Bolton charged the SEI to develop an ASSIP initiative to address the problems noted in software architecture. The resulting Software Architecture Initia-tive was approved by the ASSIP Action Group for implementation in fi scal year 2004. A training component formed the core of the initiative.
THE TRAINING PROGRAM
The SEI already had available a training curriculum for software architecture and, since it was designed to be taught either at SEI facilities or onsite at customer loca-tions, it easily served as the basis of the ASSIP Software Architecture Initiative. The curriculum consists of six courses:
Software Architecture: Principles and Practices
Documenting Software Architectures
Software Architecture Design and Analysis
Software Product Lines
SEI Architecture Tradeoff Analysis Method® (ATAM®) Evaluator Training
ATAM Leader Training
Through a series of special offerings, the SEI delivered the curriculum at the Army software engineering centers (SECs) using the same materials and instructors as the publicly offered classes. The SECs provided the most central location for many participants since most of the Army’s program offi ces are located in close proximity to one of the SECs. Students who completed the prescribed course sequences earned certifi cates just as if they had attended the regular public offerings.3
Generally, each course had 30 slots available to Army personnel engaged in acquisition or acquisition support roles. The ASSIP allocated the slots equitably among the PEOs, PMOs, and SECs. Due to the nature of the coursework, the more advanced ATAM Evaluator and Leader courses had a limit of 15 students. To better serve the specifi c needs of the Army, the ASSIP made those slots available to the SECs fi rst because they are positioned to provide evaluation support across many programs. The PEOs and PMOs took advantage of the few slots in the courses not fi lled by SEC personnel.
The training program enjoyed strong participation, a good indication of both need and interest within the Army acquisition community. In fact, demand exceeded expectations and forced the waiving of class size restrictions in a few instances. Ad-ditionally, participation was broad: 9 of the 11 PEOs (including subordinate PMOs) and all of the Army’s software centers had students who took part in the program. Sixty-four Army technical professionals attended at least part of the curriculum, with most earning at least one certifi cate. Figure 1 summarizes these results.4
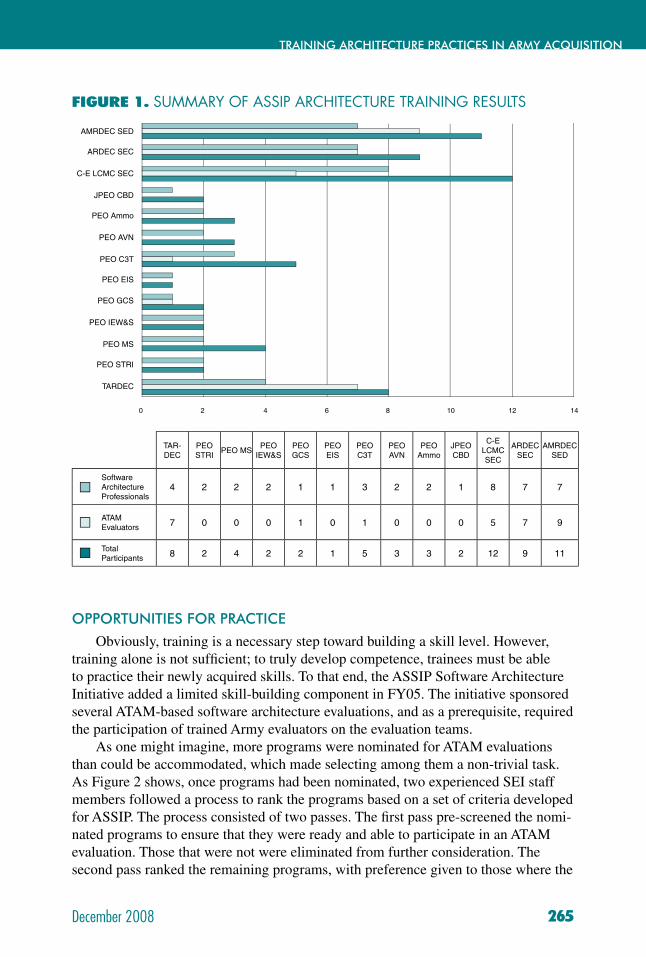
December 2008
INCENTIVE CONTRACTS
265
TRAINING ARCHITECTURE PRACTICES IN ARMY ACQUISITION
OPPORTUNITIES FOR PRACTICE
Obviously, training is a necessary step toward building a skill level. However, training alone is not suffi cient; to truly develop competence, trainees must be able to practice their newly acquired skills. To that end, the ASSIP Software Architecture Initiative added a limited skill-building component in FY05. The initiative sponsored several ATAM-based software architecture evaluations, and as a prerequisite, required the participation of trained Army evaluators on the evaluation teams.
As one might imagine, more programs were nominated for ATAM evaluations than could be accommodated, which made selecting among them a non-trivial task. As Figure 2 shows, once programs had been nominated, two experienced SEI staff members followed a process to rank the programs based on a set of criteria developed for ASSIP. The process consisted of two passes. The fi rst pass pre-screened the nomi-nated programs to ensure that they were ready and able to participate in an ATAM evaluation. Those that were not were eliminated from further consideration. The second pass ranked the remaining programs, with preference given to those where the
FIGURE 1. SUMMARY OF ASSIP ARCHITECTURE TRAINING RESULTS
AMRDEC SED
ARDEC SEC
C-E LCMC SEC
JPEO CBD
PEO Ammo
PEO AVN
PEO C3T
PEO EIS
PEO GCS
PEO IEW&S
PEO MS
PEO STRI
TARDEC
0 2 4 6 8 10 12 14
TAR-DEC
PEO STRI
PEO MSPEO
IEW&SPEO GCS
PEO EIS
PEO C3T
PEO AVN
PEO Ammo
JPEO CBD
C-E LCMC SEC
ARDEC SEC
AMRDEC SED
Software Architecture Professionals
4 2 2 2 1 1 3 2 2 1 8 7 7
ATAM Evaluators 7 0 0 0 1 0 1 0 0 0 5 7 9
Total Participants 8 2 4 2 2 1 5 3 3 2 12 9 11
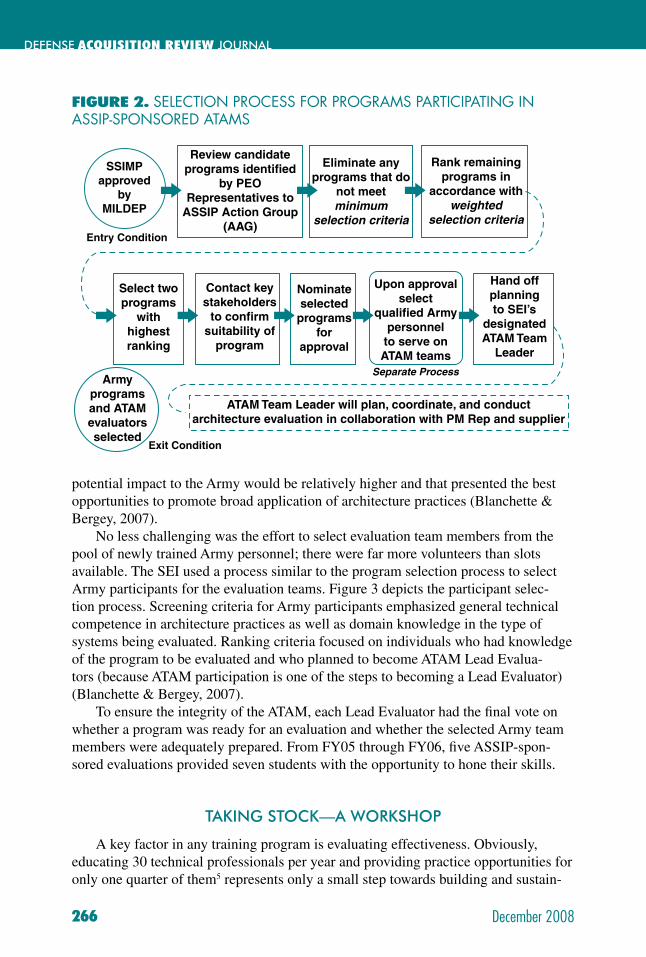
DEFENSE ACQUISITION REVIEW JOURNAL
266 December 2008
potential impact to the Army would be relatively higher and that presented the best opportunities to promote broad application of architecture practices (Blanchette & Bergey, 2007).
No less challenging was the effort to select evaluation team members from the pool of newly trained Army personnel; there were far more volunteers than slots available. The SEI used a process similar to the program selection process to select Army participants for the evaluation teams. Figure 3 depicts the participant selec-tion process. Screening criteria for Army participants emphasized general technical competence in architecture practices as well as domain knowledge in the type of systems being evaluated. Ranking criteria focused on individuals who had knowledge of the program to be evaluated and who planned to become ATAM Lead Evalua-tors (because ATAM participation is one of the steps to becoming a Lead Evaluator) (Blanchette & Bergey, 2007).
To ensure the integrity of the ATAM, each Lead Evaluator had the fi nal vote on whether a program was ready for an evaluation and whether the selected Army team members were adequately prepared. From FY05 through FY06, fi ve ASSIP-spon-sored evaluations provided seven students with the opportunity to hone their skills.
TAKING STOCK—A WORKSHOP
A key factor in any training program is evaluating effectiveness. Obviously, educating 30 technical professionals per year and providing practice opportunities for only one quarter of them5 represents only a small step towards building and sustain-
FIGURE 2. SELECTION PROCESS FOR PROGRAMS PARTICIPATING IN ASSIP-SPONSORED ATAMS
SSIMPapproved
byMILDEP
Review candidateprograms identified
by PEORepresentatives to
ASSIP Action Group(AAG)
Select twoprograms
withhighestranking
Armyprogramsand ATAMevaluatorsselected
Exit Condition
Entry Condition
ATAM Team Leader will plan, coordinate, and conductarchitecture evaluation in collaboration with PM Rep and supplier
Contact keystakeholders
to confirmsuitability of
program
Nominateselected
programsfor
approval
Upon approvalselect
qualified Armypersonnel
to serve onATAM teams
Hand offplanningto SEI’s
designatedATAM Team
Leader
Separate Process
Eliminate anyprograms that do
not meetminimum
selection criteria
Rank remainingprograms in
accordance withweighted
selection criteria
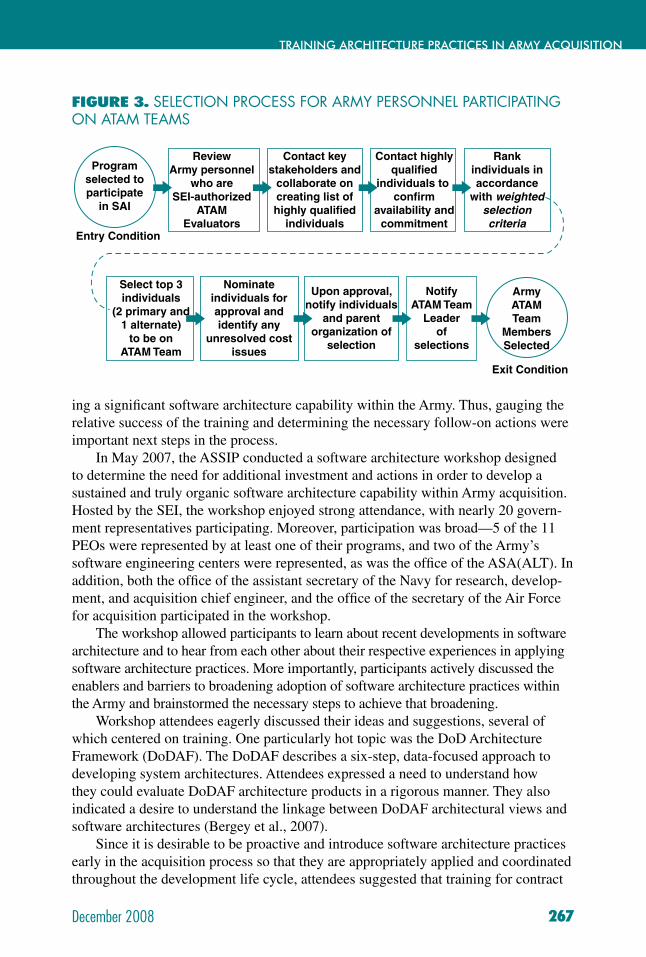
December 2008
INCENTIVE CONTRACTS
267
TRAINING ARCHITECTURE PRACTICES IN ARMY ACQUISITION
FIGURE 3. SELECTION PROCESS FOR ARMY PERSONNEL PARTICIPATING ON ATAM TEAMS
ing a signifi cant software architecture capability within the Army. Thus, gauging the relative success of the training and determining the necessary follow-on actions were important next steps in the process.
In May 2007, the ASSIP conducted a software architecture workshop designed to determine the need for additional investment and actions in order to develop a sustained and truly organic software architecture capability within Army acquisition. Hosted by the SEI, the workshop enjoyed strong attendance, with nearly 20 govern-ment representatives participating. Moreover, participation was broad—5 of the 11 PEOs were represented by at least one of their programs, and two of the Army’s software engineering centers were represented, as was the offi ce of the ASA(ALT). In addition, both the offi ce of the assistant secretary of the Navy for research, develop-ment, and acquisition chief engineer, and the offi ce of the secretary of the Air Force for acquisition participated in the workshop.
The workshop allowed participants to learn about recent developments in software architecture and to hear from each other about their respective experiences in applying software architecture practices. More importantly, participants actively discussed the enablers and barriers to broadening adoption of software architecture practices within the Army and brainstormed the necessary steps to achieve that broadening.
Workshop attendees eagerly discussed their ideas and suggestions, several of which centered on training. One particularly hot topic was the DoD Architecture Framework (DoDAF). The DoDAF describes a six-step, data-focused approach to developing system architectures. Attendees expressed a need to understand how they could evaluate DoDAF architecture products in a rigorous manner. They also indicated a desire to understand the linkage between DoDAF architectural views and software architectures (Bergey et al., 2007).
Since it is desirable to be proactive and introduce software architecture practices early in the acquisition process so that they are appropriately applied and coordinated throughout the development life cycle, attendees suggested that training for contract
Programselected toparticipate
in SAI
Contact keystakeholders and
collaborate oncreating list ofhighly qualified
individuals
Contact highlyqualified
individuals to confirm
availability andcommitment
Rankindividuals inaccordance
with weightedselectioncriteria
Select top 3individuals
(2 primary and1 alternate)
to be onATAM Team
Nominateindividuals forapproval andidentify any
unresolved costissues
Upon approval,notify individuals
and parentorganization of
selection
NotifyATAM Team
Leaderof
selections
ArmyATAMTeam
MembersSelected
Exit Condition
Entry Condition
ReviewArmy personnel
who areSEI-authorized
ATAMEvaluators
DEFENSE ACQUISITION REVIEW JOURNAL
268 December 2008
offi cers would be benefi cial. Doing so would allow them to be familiar enough with the risk reduction concepts to incorporate many of the practices into a request for pro-posal or contract at the beginning of an acquisition. Attendees also noted that while training was good and necessary, it needed to be augmented with guidelines and sup-port materials that would help government personnel apply the knowledge effectively (Bergey et al., 2007).
Finally, several attendees voiced the need to have software architecture practices incorporated into the Defense Acquisition University (DAU) curriculum in order to promulgate the practices more widely and ultimately achieve risk reduction in the software component of system acquisitions across the Services (Bergey et al., 2007). It should be noted that DAU does address software architecture practices and is-sues in its intermediate and advanced courses in software acquisition management; workshop attendees simply felt that a greater degree of technical depth was needed in those courses.
SOME LESSONS LEARNED
Based on results to date of the ASSIP Software Architecture Initiative, several les-sons may be gleaned for organizations contemplating a similar educational program.
TRAINING
The training curriculum itself was the simplest part of the initiative to implement since it already existed in a format that lends itself to this application. In hindsight, though, the manner in which the training was offered and the overall planning for it could have been improved.
For instance, the initiative made the entire software architecture curriculum, including the ATAM Lead Evaluator course, available to all participants. However, actually becoming a Lead Evaluator requires satisfaction of several criteria beyond simply attending the course. In particular, candidates must satisfy course instructors that they possess not only the requisite technical skills but also the necessary leader-ship acumen to be an effective Lead Evaluator. They must have participated on an evaluation team. They must also undergo observation while leading an ATAM evalu-
The Lead Evaluator course should have been offered only to those individuals who not only had an interest in
becoming Lead Evaluators but who had the support of their organizations in satisfying all the criteria.
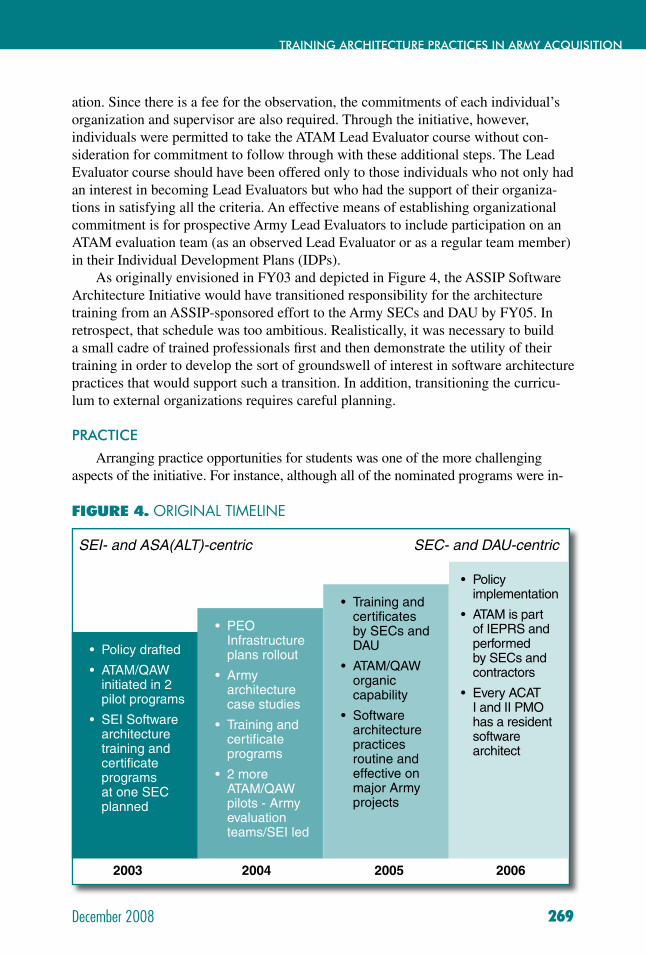
December 2008
INCENTIVE CONTRACTS
269
TRAINING ARCHITECTURE PRACTICES IN ARMY ACQUISITION
ation. Since there is a fee for the observation, the commitments of each individual’s organization and supervisor are also required. Through the initiative, however, individuals were permitted to take the ATAM Lead Evaluator course without con-sideration for commitment to follow through with these additional steps. The Lead Evaluator course should have been offered only to those individuals who not only had an interest in becoming Lead Evaluators but who had the support of their organiza-tions in satisfying all the criteria. An effective means of establishing organizational commitment is for prospective Army Lead Evaluators to include participation on an ATAM evaluation team (as an observed Lead Evaluator or as a regular team member) in their Individual Development Plans (IDPs).
As originally envisioned in FY03 and depicted in Figure 4, the ASSIP Software Architecture Initiative would have transitioned responsibility for the architecture training from an ASSIP-sponsored effort to the Army SECs and DAU by FY05. In retrospect, that schedule was too ambitious. Realistically, it was necessary to build a small cadre of trained professionals fi rst and then demonstrate the utility of their training in order to develop the sort of groundswell of interest in software architecture practices that would support such a transition. In addition, transitioning the curricu-lum to external organizations requires careful planning.
PRACTICE
Arranging practice opportunities for students was one of the more challenging aspects of the initiative. For instance, although all of the nominated programs were in-
FIGURE 4. ORIGINAL TIMELINE
SEI- and ASA(ALT)-centric SEC- and DAU-centric
Policy drafted•
ATAM/QAW • initiated in 2 pilot programs
SEI Software • architecture training and certifi cate programs at one SEC planned
PEO • Infrastructure plans rollout
Army • architecture case studies
Training and • certifi cate programs
2 more • ATAM/QAW pilots - Army evaluation teams/SEI led
Training and • certifi cates by SECs and DAU
ATAM/QAW • organic capability
Software • architecture practices routine and effective on major Army projects
Policy • implementation
ATAM is part • of IEPRS and performed by SECs and contractors
Every ACAT • I and II PMO has a resident software architect
2003 2004 2005 2006
DEFENSE ACQUISITION REVIEW JOURNAL
270 December 2008
terested in receiving a free software architecture evaluation, a few were initially hesitant about having personnel from their PEO or SEC participate, while others objected to having Army personnel from unrelated or external commands on the team. Still others did not want the participation of any Army personnel. Although the objections were handled during the personnel selection process, the requirement for Army personnel to be involved needed to be more explicit in the program nomination process.
A focus of the ATAM evaluation is the actual on-site meetings, and it is easy to forget the other activities, such as pre-evaluation teleconferences and post-evaluation report development, that draw on a participant’s time. These tasks are as essential to a successful outcome as the evaluation meetings, but are easily overlooked if there is a lengthy period between taking the ATAM Evaluator class and participating on a team. There were a couple of instances of misunderstanding about these points when re-cruiting participants for the ATAM evaluations. Although they were resolved without diffi culty, reinforcing the requirements for participation up front, which is now part of the recruitment process, is a better approach.
Finally, having the fl exibility to adjust plans when situations dictate a change is essential; it is not in anyone’s interests to cancel the limited practice opportunities. If a program selected for an architecture evaluation turns out not to be ready for the evalu-ation as planned, fallback options can be explored. For instance, if the architecture is not yet matured to a state where an evaluation would make sense, a quality attribute workshop, in which a team works with the program and its stakeholders to develop and prioritize non-functional requirements, might be substituted. The benefi t of this approach is that evaluation team members are still able to practice techniques that they have learned through training, because eliciting quality attributes is an important step in an ATAM evaluation. Alternatively, if a program’s architecture is suffi ciently mature but not adequately documented for an evaluation, it is possible to postpone the evaluation while working with the program to improve its documentation.
PARTICIPATION
Not surprisingly, the SECs, due to their explicit focus on software, had the highest participation in the training program. The acquisition organizations were distributed relatively evenly in their course attendance, but at a much lower level than the SECs. When it came to nominating programs for architecture evaluations, however, those organizations that acquire software systems, communications systems, or electronics were more inclined to take advantage of the opportunity than those organizations that
The key difference between acquisition organizations is the manner in which they perceive software in their systems.
December 2008
INCENTIVE CONTRACTS
271
TRAINING ARCHITECTURE PRACTICES IN ARMY ACQUISITION
chiefl y acquired weapons systems (despite the fact that weapon systems were likely to contain large amounts of software, communications, and electronic components).
The key difference between acquisition organizations is the manner in which they perceive software in their systems. Weapon systems acquirers tend to focus on the system in its totality; they view software as an enabler rather than a driver of system behavior, and perceive it as relatively less important. Acquirers whose systems are dependent on software for functionality were quick to appreciate the importance of software and the need for software architecture evaluations. These differences suggest that extra effort is necessary to reach out to organizations that tend to treat software as a less important implementation detail in their systems.
Perhaps the most signifi cant outcome of the workshop was that a number of program offi ces indicated that they were only willing to pursue evaluation of their software architectures because ASSIP paid for the evaluations, yet all recognized the value of the evaluation afterwards (Bergey et al., 2007). The ability to turn “nay-sayers” into “yea-sayers” is powerful evidence of the architecture initiative’s suc-cess. However, such fi ndings also suggest that similar education programs must be prepared to counter lack of awareness among program managers about architecture evaluations through funding, policy, or both.
Additionally, it is important to evaluate the effectiveness of the program. In the case of the Army, the workshop validated the need and importance of the architecture training program while also demonstrating a need to expand Army investment in it.
WAY AHEAD
The success of the software architecture initiative led to a number of tasks for ASSIP in FY08 that seek to build on successes as well as to address the lessons learned and workshop results. Among the tasks in progress are the continued offering of the software architecture curriculum, the expansion of opportunities for students to apply techniques in several ASSIP-funded ATAM evaluations, and the introduction of opportunities for selected promising students to advance toward becoming SEI-certi-fi ed ATAM Lead Evaluators. Additionally, a new course, aimed at acquisition execu-tives to increase their awareness of the benefi ts of the disciplined use of software architecture practices, is being developed. The ASSIP also will conduct interviews of
In the case of the Army, the workshop validated the need and importance of the architecture training program while
also demonstrating a need to expand Army investment in it.
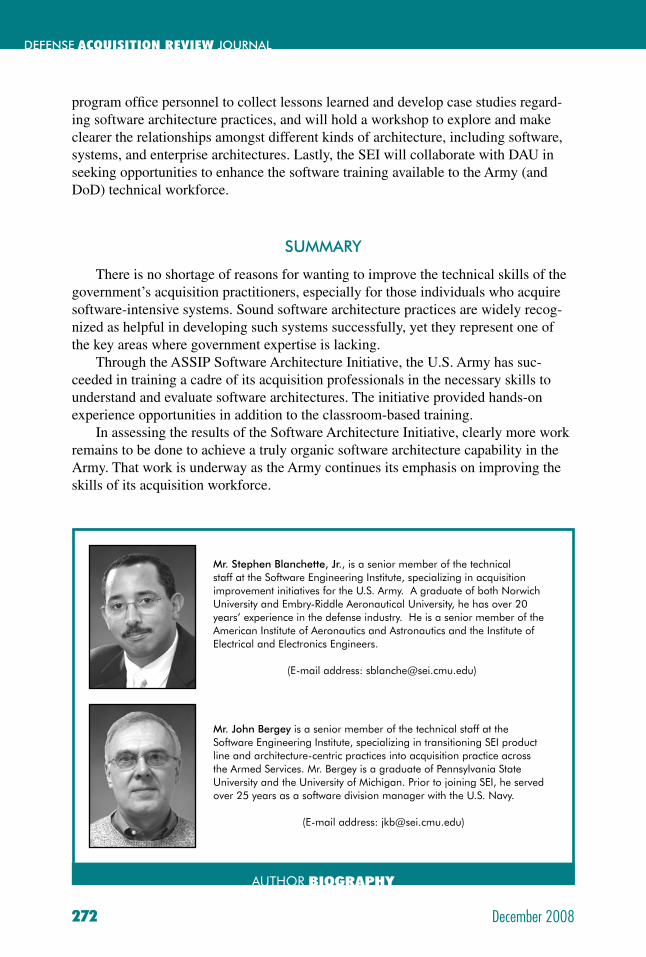
DEFENSE ACQUISITION REVIEW JOURNAL
272 December 2008
program offi ce personnel to collect lessons learned and develop case studies regard-ing software architecture practices, and will hold a workshop to explore and make clearer the relationships amongst different kinds of architecture, including software, systems, and enterprise architectures. Lastly, the SEI will collaborate with DAU in seeking opportunities to enhance the software training available to the Army (and DoD) technical workforce.
SUMMARY
There is no shortage of reasons for wanting to improve the technical skills of the government’s acquisition practitioners, especially for those individuals who acquire software-intensive systems. Sound software architecture practices are widely recog-nized as helpful in developing such systems successfully, yet they represent one of the key areas where government expertise is lacking.
Through the ASSIP Software Architecture Initiative, the U.S. Army has suc-ceeded in training a cadre of its acquisition professionals in the necessary skills to understand and evaluate software architectures. The initiative provided hands-on experience opportunities in addition to the classroom-based training.
In assessing the results of the Software Architecture Initiative, clearly more work remains to be done to achieve a truly organic software architecture capability in the Army. That work is underway as the Army continues its emphasis on improving the skills of its acquisition workforce.
Mr. Stephen Blanchette, Jr., is a senior member of the technical staff at the Software Engineering Institute, specializing in acquisition improvement initiatives for the U.S. Army. A graduate of both Norwich University and Embry-Riddle Aeronautical University, he has over 20 years’ experience in the defense industry. He is a senior member of the American Institute of Aeronautics and Astronautics and the Institute of Electrical and Electronics Engineers.
(E-mail address: [email protected])
Mr. John Bergey is a senior member of the technical staff at the Software Engineering Institute, specializing in transitioning SEI product line and architecture-centric practices into acquisition practice across the Armed Services. Mr. Bergey is a graduate of Pennsylvania State University and the University of Michigan. Prior to joining SEI, he served over 25 years as a software division manager with the U.S. Navy.
(E-mail address: [email protected])
AUTHOR BIOGRAPHY
December 2008
INCENTIVE CONTRACTS
273
TRAINING ARCHITECTURE PRACTICES IN ARMY ACQUISITION
ENDNOTES
1. Claude Bolton, ASA(ALT) retired in January 2008, but the ASSIP continues under Dean Popps, Acting ASA(ALT).
2. According to the Defense Acquisition University (DAU), a software-intensive system is one in which software represents the largest segment in one or more of the following criteria: system development cost, system development risk, system functionality, or development time (Defense Acquisition University, 2005).
3. Three certifi cates—Software Architecture Professional, ATAM Evaluator, and ATAM Lead Evaluator—are available to students who complete the required courses.
4. Participants shown for PEO Missiles and Space were part of the predecessor organizations PEO Tactical Missiles and PEO Air Space and Missile Defense.
5. Only a limited number of contractual engagements provided a suitable opportunity to apply the skills learned in collaboration with the development contractor without being intrusive (i.e., signifi cantly disrupting cost and schedule).
DEFENSE ACQUISITION REVIEW JOURNAL
274 December 2008
REFERENCES
Anderson, W., Bergey, J., Fisher, M., Graettinger, C., Hanson, W. J., Obenza, R., et al. (2001, November). Army workshop on lessons learned from software upgrade programs. Special Report (CMU/SEI-2001-SR-021). Pittsburgh, PA: Software Engineering Institute, Carnegie Mellon University.
Bass, L., Clements, P., & Kazman, R. (2003). Software architecture in practice (2nd ed.). Boston: Addison-Wesley.
Bass, L., Nord, R., & Wood, B. (2006, April). Risk themes from ATAM data: Prelimi-nary results. Pittsburgh, PA: Software Engineering Institute, Carnegie Mellon University.
Bergey, J., Blanchette, S., Gagliardi, M., Klein, M., Little, R., Morrow, T., et al. (2007). Army software architecture workshop: Reporting on Army experiences. Special Report (CMU/SEI-2008-SR-003, Limited distribution). Pittsburgh, PA: Software Engineering Institute, Carnegie Mellon University.
Blanchette, S. (2005, March). U.S. Army acquisition – the Program Executive Offi cer perspective. Special Report (CMU/SEI-2005-SR-002). Pittsburgh, PA: Software Engineering Institute, Carnegie Mellon University.
Blanchette, S., & Bergey, J. (2007, June). Progress toward an organic software ar-chitecture capability in the U.S. Army. Special Report (CMU/SEI-2007-TR-010). Pittsburgh, PA: Software Engineering Institute, Carnegie Mellon University.
Charette, R., McGarry, J., & Baldwin, K. (2003, January). Tri-Service assessment initiative phase 2 systemic analysis results. Tri-Service Assessment Initiative. Retrieved August 1, 2007, from http://www.splc.net/programs/acquisition-sup-port/conf/2003-presentations/charette.pdf
Clements, P., Bergey, J., & Mason, D. (2005, September). Using the SEI Architec-ture Tradeoff Analysis Method to evaluate WIN-T: A case study. Special Report (CMU/SEI-2005-TN-027). Pittsburgh, PA: Software Engineering Institute, Carnegie Mellon University.
Clements, P., & Bergey, J. (2005, September). The U.S. Army's Common Avionics Architecture System (CAAS) product line: A case study. Special Report (CMU/SEI-2005-TR-019). Pittsburgh, PA: Software Engineering Institute, Carnegie Mellon University.
Defense Acquisition University. (2005, July). Glossary of defense acquisition acro-nyms and terms (12th ed.). Fort Belvoir, VA: DAU Press.
Defense Science Board Task Force. (1994, June). Acquiring defense software com-mercially. Retrieved August 1, 2007, from http://www.acq.osd.mil/dsb/reports/commrecialdefensesoftware.pdf
December 2008
INCENTIVE CONTRACTS
275
TRAINING ARCHITECTURE PRACTICES IN ARMY ACQUISITION
Defense Science Board Task Force. (2000, November). Defense software. Retrieved August 1, 2007, from http://www.acq.osd.mil/dsb/reports/defensesoftware.pdf
Erwin, S. I. (2007, April). Pentagon begins broad review of acquisition workforce skills. National Defense, 91(641), 18.
Government Accountability Offi ce. (2007, June). Defense acquisitions: Role of lead systems integrator on future combat systems program poses oversight challenges. (GAO-07-380). Washington, DC: Author.
Government Accountability Offi ce. (2008, January). Defense acquisitions: DoD’s increased reliance on service contractors exacerbates long-standing challenges. Statement of David M. Walker, Comptroller General of the United States, in testimony before the Subcommittee on Defense, Committee on Appropriations, House of Representatives. (GAO-08-621T). Washington, DC: Author.
Kasunic, M. (2004, March). Army Strategic Software Improvement Program (ASSIP) survey of Army acquisition managers. Special Report (CMU/SEI-2004-TR-003). Pittsburgh, PA: Software Engineering Institute, Carnegie Mellon University.
Keeler, K. L. (2005, October). U.S. Army acquisition—The program offi ce perspec-tive. Special Report (CMU/SEI-2005-SR-014). Pittsburgh, PA: Software Engi-neering Institute, Carnegie Mellon University.

DEFENSE ACQUISITION REVIEW JOURNAL
276 December 2008
Imag
e de
sign
ed b
y H
aram
bee
Den
nis
December 2008
THE APPLICATION OF SUPPLY NETWORK OPTIMIZATION
277
THE APPLICATION OF SUPPLY NETWORK
OPTIMIZATION AND LOCATION ANALYSIS TO A DoD REPAIR SUPPLY CHAIN
William R. Killingsworth, David Berkowitz, John E. Burnett, and James T. Simpson
A major responsibility of the military and its suppliers is to provide an adequate supply of parts and materials to support warfi ghters throughout the world. This article reviews a process used by an Army global supply chain to make a location decision for a critical distribution center. Additionally, it demonstrates the applicability of network optimization techniques to a DoD supply chain location analysis problem. Finally, it investigates the feasibility of making a $15 or $25 million capital investment to provide an alternative repair facility.
A major responsibility of the military and its suppliers is to provide an adequate supply of parts and materials to support warfi ghters throughout the world. The exploitation of supply chains has proven to be critical to the effi cient delivery
of these resources. One of the major decisions for supply chain managers is to de-termine the most appropriate location for supply chain facilities such as distribution centers.
Traditional business fi rms routinely make location decisions. Decisions about where to locate retail outlets, warehouses, offi ces, and manufacturing facilities are common supply chain decisions (Byrom, Bennison, Hernandez, & Hooper, 2001). Nevertheless, these decisions can become rather complicated as the fi rm attempts to optimize supply chain performance. The selection of the appropriate blend of proxim-ity to customers, vendors, suppliers, materials, and labor resources while managing fi nancial goals such as lower shipping costs is a signifi cant task for any supply chain
DEFENSE ACQUISITION REVIEW JOURNAL
278 December 2008
manager (Hernandez & Bennison, 2000). The purpose of this article is to: (a) review a process used by an Army global supply chain to make a location decision for a critical distribution center, and (b) provide a prescriptive procedure for other agencies with similar location decision requirements.
We begin this study by briefl y reviewing two relevant location theory frame-works. We then describe the situation underlying the study and the critical supply chain issues. Next, the method and software used in the study are discussed. Follow-ing the presentation of the results of the study, we summarize the study and discuss its implications.
LOCATION DECISION THEORY
Two distinct frameworks are used in location theory to describe location decision making in supply chains. The fi rst framework focuses on minimizing cost, while the second framework focuses on market area and demand location. All other approaches to location decision making are combinations of these two major frameworks.
Minimizing cost and, by proxy, maximizing profi t is the fi rst framework in loca-tion decision theory. This approach focuses on transportation as the major driver of cost. Nevertheless, transportation must be segmented into the inbound and outbound logistics to gain a complete understanding of its impact on the overall transportation cost. Inbound logistics include all the necessary parts for the production or overhaul of the product. The outbound logistics include all the work in process or fi nal prod-ucts being shipped to an end consumer or warehouse for storage. Additionally, any items stored at an intermediate storage facility incur additional costs such as trans-portation cost and carrying cost. Carrying cost includes costs such as storage, re-han-dling, and in many cases, accounts receivable (Stock & Lambert, 2001).
The second framework is a contrast to the low-cost approach and is based on being customer-centered. The market area or demand-oriented framework proposes that the least-cost approach is only one of multiple approaches to profi t maximization (Stock & Lambert, 2001). This argument is based on the notion that customers and suppliers are unevenly dispersed. Hence, a fi rm can be better served by locating close to its suppliers. Moreover, the fi rm can better serve its customers by locating close to the customers. This approach would suggest that better serviced fi rms can better serve their customers, which should yield better satisfi ed customers. The results should be more repeat customers and greater profi ts. Of course, maximizing revenue would rarely be the primary objective for a government application. More relevant objec-tives might include warfi ghter/customer satisfaction, coverage, or cost minimization.
Minimizing cost and, by proxy, maximizing profi t is the fi rst framework in location decision theory.
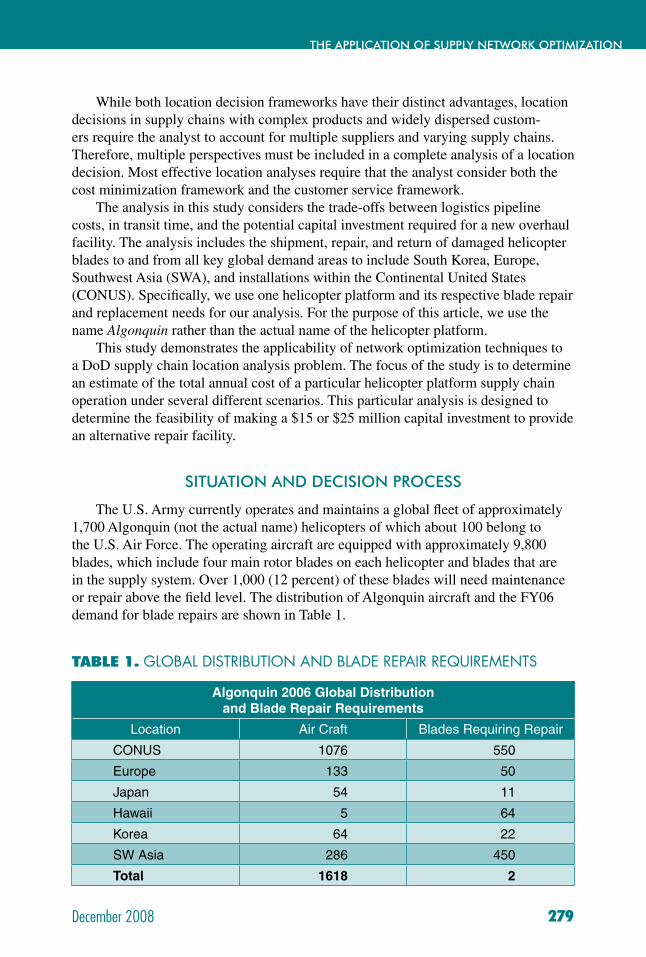
December 2008
THE APPLICATION OF SUPPLY NETWORK OPTIMIZATION
279
While both location decision frameworks have their distinct advantages, location decisions in supply chains with complex products and widely dispersed custom-ers require the analyst to account for multiple suppliers and varying supply chains. Therefore, multiple perspectives must be included in a complete analysis of a location decision. Most effective location analyses require that the analyst consider both the cost minimization framework and the customer service framework.
The analysis in this study considers the trade-offs between logistics pipeline costs, in transit time, and the potential capital investment required for a new overhaul facility. The analysis includes the shipment, repair, and return of damaged helicopter blades to and from all key global demand areas to include South Korea, Europe, Southwest Asia (SWA), and installations within the Continental United States (CONUS). Specifi cally, we use one helicopter platform and its respective blade repair and replacement needs for our analysis. For the purpose of this article, we use the name Algonquin rather than the actual name of the helicopter platform.
This study demonstrates the applicability of network optimization techniques to a DoD supply chain location analysis problem. The focus of the study is to determine an estimate of the total annual cost of a particular helicopter platform supply chain operation under several different scenarios. This particular analysis is designed to determine the feasibility of making a $15 or $25 million capital investment to provide an alternative repair facility.
SITUATION AND DECISION PROCESS
The U.S. Army currently operates and maintains a global fl eet of approximately 1,700 Algonquin (not the actual name) helicopters of which about 100 belong to the U.S. Air Force. The operating aircraft are equipped with approximately 9,800 blades, which include four main rotor blades on each helicopter and blades that are in the supply system. Over 1,000 (12 percent) of these blades will need maintenance or repair above the fi eld level. The distribution of Algonquin aircraft and the FY06 demand for blade repairs are shown in Table 1.
TABLE 1. GLOBAL DISTRIBUTION AND BLADE REPAIR REQUIREMENTS
Algonquin 2006 Global Distribution and Blade Repair Requirements
Location Air Craft Blades Requiring Repair
CONUS 1076 550
Europe 133 50
Japan 54 11
Hawaii 5 64
Korea 64 22
SW Asia 286 450
Total 1618 2

DEFENSE ACQUISITION REVIEW JOURNAL
280 December 2008
The Army Aviation and Missile Command (AMCOM) Integrated Material Man-agement Center (IMMC) manages the transportation, repair, and procurement of Algonquin blades. In FY06, this consisted of 8,300 blades including those installed on helicopters, those in the repair pipeline, and serviceable blades in inventory. Blades removed from helicopters during routine maintenance undergo a comprehensive evalu-ation. Currently, blades are either repaired at Corpus Christi Army Depot (CCAD), returned to the Original Equipment Manufacturer (OEM) for repair, or scrapped.
As shown in Figure 1, in FY05, CCAD completed repairs on 785 blades and the OEM completed 110. Since some blades are lost or scrapped due to damage or exces-sive wear, customer demand requires that the overhaul process must be supplemented by the procurement of new blades. Figure 1 also includes the relationships between the number of blades repaired at the CCAD, the number repaired by the OEM, and the number of new blades from procurement contracts for FY04–FY06. Figure 2
1000
900
800
700
600
500
400
300
200
100
0
FY03 FY04 FY05 FY06Projected
CCAD
OEM
New Procurement
FIGURE 1. BLADE REPAIRS AND PROCUREMENT
700
600
500
400
300
200
100
0
CONUS EuropeSW Asia Hawaii Japan Korea
FY04
FY05
FY06
FIGURE 2. GLOBAL REGIONAL DEMAND FOR BLADES
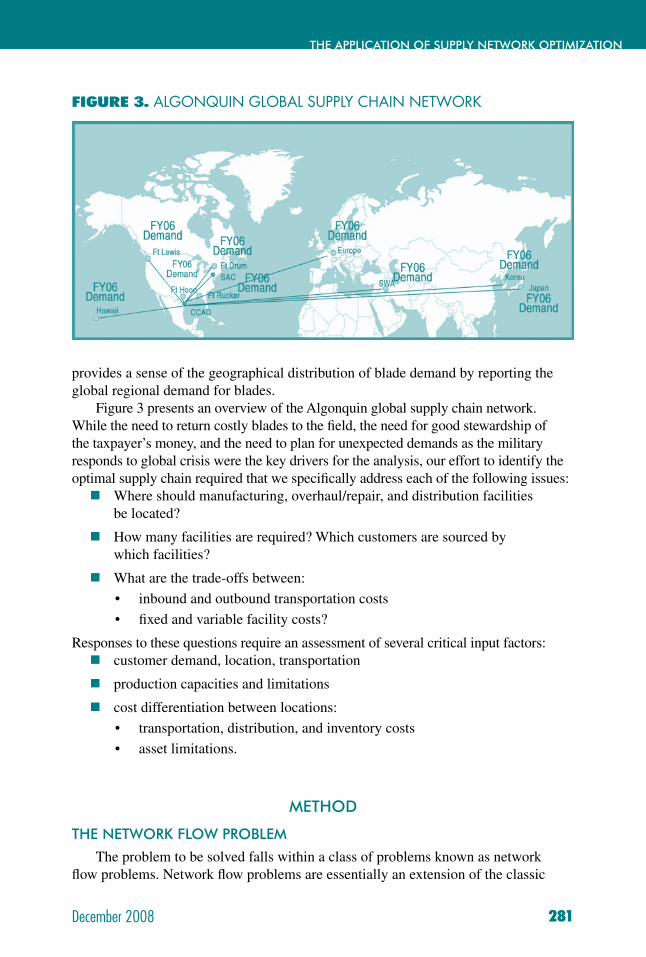
December 2008
THE APPLICATION OF SUPPLY NETWORK OPTIMIZATION
281
provides a sense of the geographical distribution of blade demand by reporting the global regional demand for blades.
Figure 3 presents an overview of the Algonquin global supply chain network. While the need to return costly blades to the fi eld, the need for good stewardship of the taxpayer’s money, and the need to plan for unexpected demands as the military responds to global crisis were the key drivers for the analysis, our effort to identify the optimal supply chain required that we specifi cally address each of the following issues:
Where should manufacturing, overhaul/repair, and distribution facilities be located?
How many facilities are required? Which customers are sourced by which facilities?
What are the trade-offs between:
inbound and outbound transportation costs•
fi xed and variable facility costs? •
Responses to these questions require an assessment of several critical input factors:customer demand, location, transportation
production capacities and limitations
cost differentiation between locations:
transportation, distribution, and inventory costs •
asset limitations.•
METHOD
THE NETWORK FLOW PROBLEM
The problem to be solved falls within a class of problems known as network fl ow problems. Network fl ow problems are essentially an extension of the classic
FIGURE 3. ALGONQUIN GLOBAL SUPPLY CHAIN NETWORK
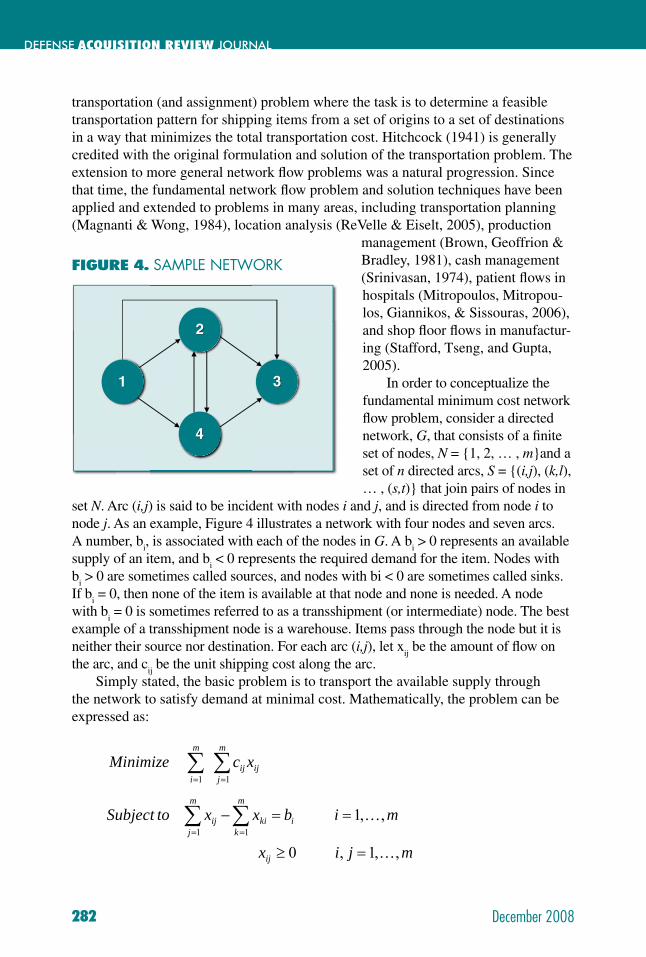
DEFENSE ACQUISITION REVIEW JOURNAL
282 December 2008
transportation (and assignment) problem where the task is to determine a feasible transportation pattern for shipping items from a set of origins to a set of destinations in a way that minimizes the total transportation cost. Hitchcock (1941) is generally credited with the original formulation and solution of the transportation problem. The extension to more general network fl ow problems was a natural progression. Since that time, the fundamental network fl ow problem and solution techniques have been applied and extended to problems in many areas, including transportation planning (Magnanti & Wong, 1984), location analysis (ReVelle & Eiselt, 2005), production
management (Brown, Geoffrion & Bradley, 1981), cash management (Srinivasan, 1974), patient fl ows in hospitals (Mitropoulos, Mitropou-los, Giannikos, & Sissouras, 2006), and shop fl oor fl ows in manufactur-ing (Stafford, Tseng, and Gupta, 2005).
In order to conceptualize the fundamental minimum cost network fl ow problem, consider a directed network, G, that consists of a fi nite set of nodes, N = {1, 2, … , m}and a set of n directed arcs, S = {(i,j), (k,l), … , (s,t)} that join pairs of nodes in
set N. Arc (i,j) is said to be incident with nodes i and j, and is directed from node i to node j. As an example, Figure 4 illustrates a network with four nodes and seven arcs. A number, b
i, is associated with each of the nodes in G. A b
i > 0 represents an available
supply of an item, and bi < 0 represents the required demand for the item. Nodes with
bi > 0 are sometimes called sources, and nodes with bi < 0 are sometimes called sinks.
If bi = 0, then none of the item is available at that node and none is needed. A node
with bi = 0 is sometimes referred to as a transshipment (or intermediate) node. The best
example of a transshipment node is a warehouse. Items pass through the node but it is neither their source nor destination. For each arc (i,j), let x
ij be the amount of fl ow on
the arc, and cij be the unit shipping cost along the arc.
Simply stated, the basic problem is to transport the available supply through the network to satisfy demand at minimal cost. Mathematically, the problem can be expressed as:
∑∑==
m
jijij
m
ixcMinimize
11
mjix
mibxxtoSubject
ij
m
ji
m
kkiij
,,1, 0
,,1 1 1
K
K
=≥
==−∑ ∑= =
11
22
33
44
FIGURE 4. SAMPLE NETWORK
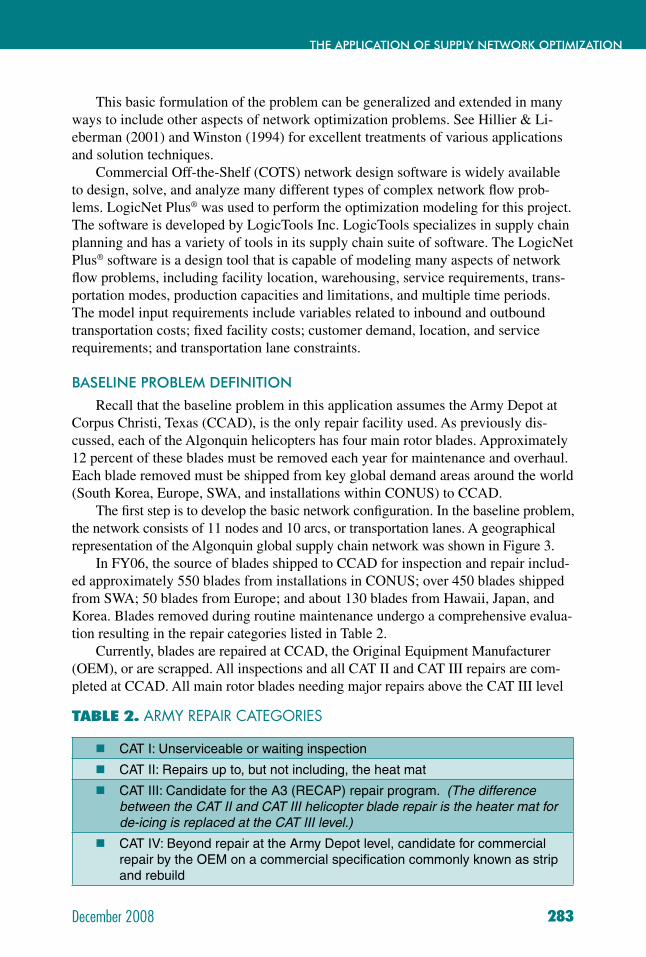
December 2008
THE APPLICATION OF SUPPLY NETWORK OPTIMIZATION
283
This basic formulation of the problem can be generalized and extended in many ways to include other aspects of network optimization problems. See Hillier & Li-eberman (2001) and Winston (1994) for excellent treatments of various applications and solution techniques.
Commercial Off-the-Shelf (COTS) network design software is widely available to design, solve, and analyze many different types of complex network fl ow prob-lems. LogicNet Plus® was used to perform the optimization modeling for this project. The software is developed by LogicTools Inc. LogicTools specializes in supply chain planning and has a variety of tools in its supply chain suite of software. The LogicNet Plus® software is a design tool that is capable of modeling many aspects of network fl ow problems, including facility location, warehousing, service requirements, trans-portation modes, production capacities and limitations, and multiple time periods. The model input requirements include variables related to inbound and outbound transportation costs; fi xed facility costs; customer demand, location, and service requirements; and transportation lane constraints.
BASELINE PROBLEM DEFINITION
Recall that the baseline problem in this application assumes the Army Depot at Corpus Christi, Texas (CCAD), is the only repair facility used. As previously dis-cussed, each of the Algonquin helicopters has four main rotor blades. Approximately 12 percent of these blades must be removed each year for maintenance and overhaul. Each blade removed must be shipped from key global demand areas around the world (South Korea, Europe, SWA, and installations within CONUS) to CCAD.
The fi rst step is to develop the basic network confi guration. In the baseline problem, the network consists of 11 nodes and 10 arcs, or transportation lanes. A geographical representation of the Algonquin global supply chain network was shown in Figure 3.
In FY06, the source of blades shipped to CCAD for inspection and repair includ-ed approximately 550 blades from installations in CONUS; over 450 blades shipped from SWA; 50 blades from Europe; and about 130 blades from Hawaii, Japan, and Korea. Blades removed during routine maintenance undergo a comprehensive evalua-tion resulting in the repair categories listed in Table 2.
Currently, blades are repaired at CCAD, the Original Equipment Manufacturer (OEM), or are scrapped. All inspections and all CAT II and CAT III repairs are com-pleted at CCAD. All main rotor blades needing major repairs above the CAT III level
TABLE 2. ARMY REPAIR CATEGORIES
CAT I: Unserviceable or waiting inspection
CAT II: Repairs up to, but not including, the heat mat
CAT III: Candidate for the A3 (RECAP) repair program. (The difference between the CAT II and CAT III helicopter blade repair is the heater mat for de-icing is replaced at the CAT III level.)
CAT IV: Beyond repair at the Army Depot level, candidate for commercial repair by the OEM on a commercial specifi cation commonly known as strip and rebuild
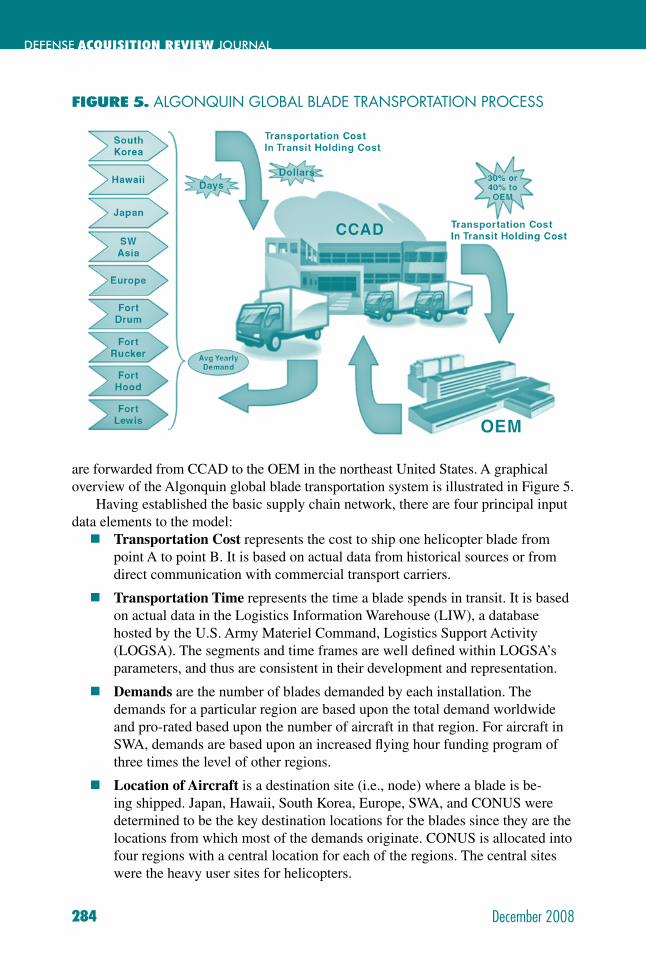
DEFENSE ACQUISITION REVIEW JOURNAL
284 December 2008
are forwarded from CCAD to the OEM in the northeast United States. A graphical overview of the Algonquin global blade transportation system is illustrated in Figure 5.
Having established the basic supply chain network, there are four principal input data elements to the model:
Transportation Cost represents the cost to ship one helicopter blade from point A to point B. It is based on actual data from historical sources or from direct communication with commercial transport carriers.
Transportation Time represents the time a blade spends in transit. It is based on actual data in the Logistics Information Warehouse (LIW), a database hosted by the U.S. Army Materiel Command, Logistics Support Activity (LOGSA). The segments and time frames are well defi ned within LOGSA’s parameters, and thus are consistent in their development and representation.
Demands are the number of blades demanded by each installation. The demands for a particular region are based upon the total demand worldwide and pro-rated based upon the number of aircraft in that region. For aircraft in SWA, demands are based upon an increased fl ying hour funding program of three times the level of other regions.
Location of Aircraft is a destination site (i.e., node) where a blade is be-ing shipped. Japan, Hawaii, South Korea, Europe, SWA, and CONUS were determined to be the key destination locations for the blades since they are the locations from which most of the demands originate. CONUS is allocated into four regions with a central location for each of the regions. The central sites were the heavy user sites for helicopters.
FIGURE 5. ALGONQUIN GLOBAL BLADE TRANSPORTATION PROCESS
December 2008
THE APPLICATION OF SUPPLY NETWORK OPTIMIZATION
285
The two key sources of data were the LOGSA and U.S. Army Aviation and Missile Command (AMCOM). From AMCOM, the main provider was the Integrated Materiel Management Center (IMMC). LOGSA provided most of the transportation times, and the IMMC provided most of the transportation costs.
Two important additional parameters must be specifi ed for this application. First, recall that not every blade must be returned to the OEM to be refurbished. Therefore, the supply and demand of units across the transportation lane from CCAD to the OEM is a parameter of the model. In the base case scenario, it was assumed that 30 percent of the blades require shipment to the OEM. Second, the number of aircraft stationed in a particular geographic region affects the supply and demand of units across various transportation lanes. Therefore, a second parameter of the model is a reallocation of the number of aircraft across geographical regions. The base case represents the current allocation, but different scenarios are investigated that consider substantial troop withdrawals and redistributions across the world.
Having established the basic network structure with fl ows and transportation lanes, identifi ed the transportation costs, and defi ned the transportation times, Logic-Net Plus® performs the mathematical optimization that analyzes the various trade-offs between costs and service requirements. LogicNet Plus® is capable of analyzing and displaying a number of solution variables. The purpose of this study is to demonstrate the applicability of network optimization techniques to a DoD supply chain location analysis problem. Hence, we are primarily interested in determining an estimate of the total annual cost of the Algonquin supply chain operation under several different scenarios. The differential annual costs will allow us to determine if making a $15 or $25 million capital investment to provide an alternative repair facility is feasible.
RESULTS
BASELINE PROBLEM
Network optimization software such as LogicNet Plus® is a useful tool for analyzing different network alternatives, as well as the impact of changes in different parameters such as demand, transit times, transportation costs, location, or capital investment costs. Several critical factors are important to the decision in this applica-tion. The baseline problem represents the current state of operations where all repairs are handled at CCAD and 30 percent of repairs must be sent to the OEM (i.e., CAT IV repairs). Table 3 summarizes the relevant input variables and parameters of the baseline problem. The per blade transportation costs represent the cost of transporting a single blade from a base facility to CCAD. Retrograde costs correspond to the cost of shipping a blade back to the base from CCAD. Recall that a certain percentage of the blades must be returned to the OEM for repairs. The baseline scenario estimates this percentage at 30 percent. The baseline scenarios also refl ect the current allocation of aircraft across the global arena. No reallocation of aircraft is considered. Since no new repair facilities are proposed in the baseline case, there is no capital investment. According to the network model, the baseline supply chain operation for Algonquin rotor blades has an annual cost of $17,990,558. Scenario 1B simply increases the
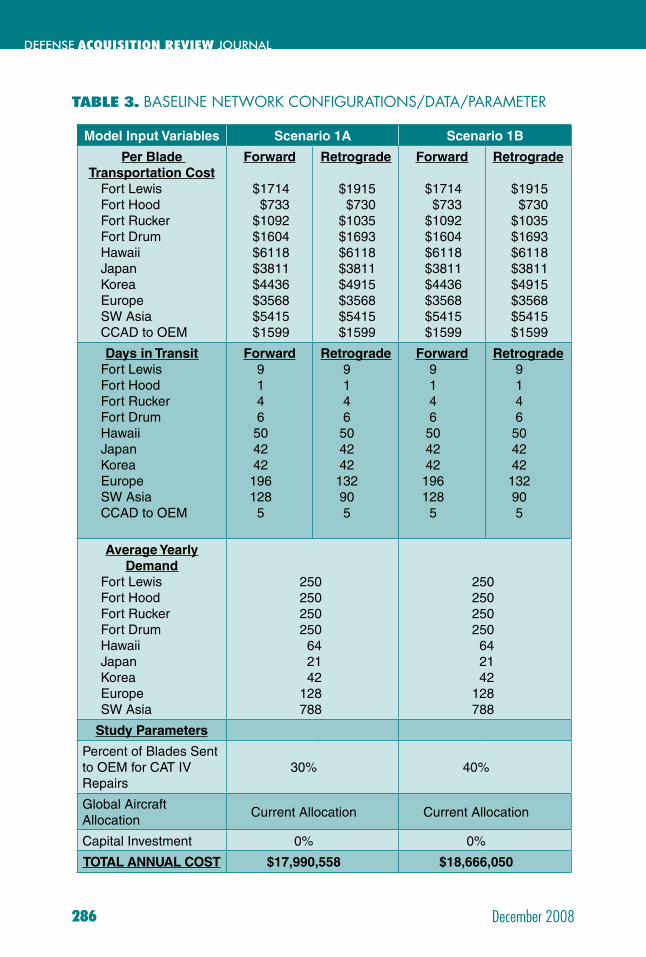
DEFENSE ACQUISITION REVIEW JOURNAL
286 December 2008
TABLE 3. BASELINE NETWORK CONFIGURATIONS/DATA/PARAMETER
Model Input Variables Scenario 1A Scenario 1B
Per Blade Transportation Cost
Fort Lewis Fort Hood Fort Rucker Fort Drum Hawaii Japan Korea Europe SW Asia CCAD to OEM
Forward
$1714$733
$1092$1604$6118$3811$4436$3568$5415$1599
Retrograde
$1915$730
$1035$1693$6118$3811$4915$3568$5415$1599
Forward
$1714$733
$1092$1604$6118$3811$4436$3568$5415$1599
Retrograde
$1915$730
$1035$1693$6118$3811$4915$3568$5415$1599
Days in Transit Fort Lewis Fort Hood Fort Rucker Fort Drum Hawaii Japan Korea Europe SW Asia CCAD to OEM
Forward91465042421961285
Retrograde9146504242132905
Forward91465042421961285
Retrograde9146504242132905
Average Yearly Demand
Fort Lewis Fort Hood Fort Rucker Fort Drum Hawaii Japan Korea Europe SW Asia
250250250250642142
128788
250250250250642142
128788
Study Parameters
Percent of Blades Sent to OEM for CAT IV Repairs
30% 40%
Global Aircraft Allocation
Current Allocation Current Allocation
Capital Investment 0% 0%
TOTAL ANNUAL COST $17,990,558 $18,666,050
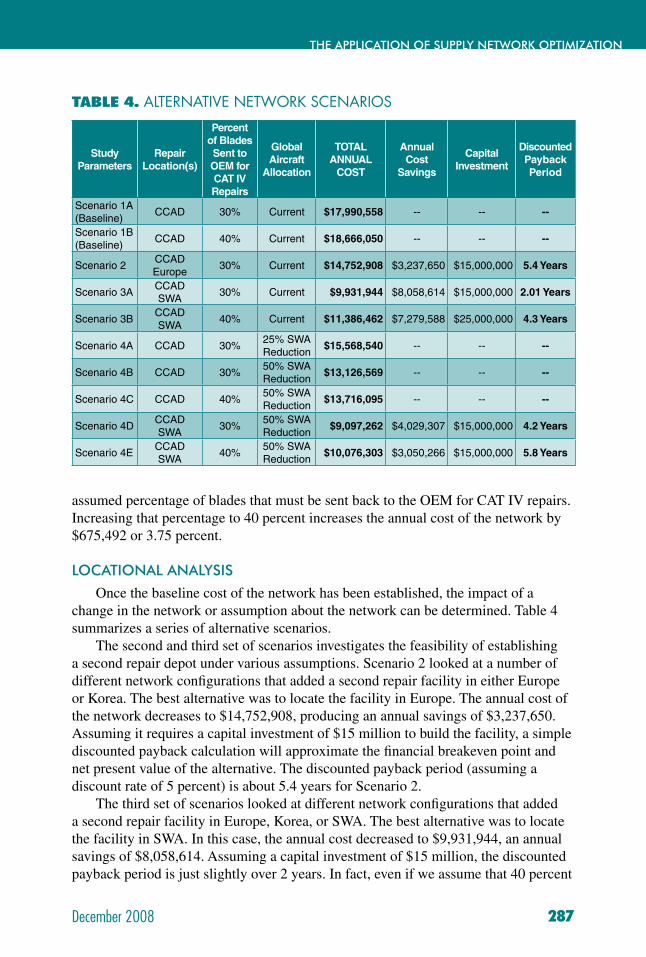
December 2008
THE APPLICATION OF SUPPLY NETWORK OPTIMIZATION
287
assumed percentage of blades that must be sent back to the OEM for CAT IV repairs. Increasing that percentage to 40 percent increases the annual cost of the network by $675,492 or 3.75 percent.
LOCATIONAL ANALYSIS
Once the baseline cost of the network has been established, the impact of a change in the network or assumption about the network can be determined. Table 4 summarizes a series of alternative scenarios.
The second and third set of scenarios investigates the feasibility of establishing a second repair depot under various assumptions. Scenario 2 looked at a number of different network confi gurations that added a second repair facility in either Europe or Korea. The best alternative was to locate the facility in Europe. The annual cost of the network decreases to $14,752,908, producing an annual savings of $3,237,650. Assuming it requires a capital investment of $15 million to build the facility, a simple discounted payback calculation will approximate the fi nancial breakeven point and net present value of the alternative. The discounted payback period (assuming a discount rate of 5 percent) is about 5.4 years for Scenario 2.
The third set of scenarios looked at different network confi gurations that added a second repair facility in Europe, Korea, or SWA. The best alternative was to locate the facility in SWA. In this case, the annual cost decreased to $9,931,944, an annual savings of $8,058,614. Assuming a capital investment of $15 million, the discounted payback period is just slightly over 2 years. In fact, even if we assume that 40 percent
TABLE 4. ALTERNATIVE NETWORK SCENARIOS
Study Parameters
Repair Location(s)
Percent of Blades Sent to OEM for CAT IV Repairs
Global Aircraft
Allocation
TOTAL ANNUAL
COST
Annual Cost
Savings
Capital Investment
Discounted Payback Period
Scenario 1A (Baseline)
CCAD 30% Current $17,990,558 -- -- --
Scenario 1B(Baseline)
CCAD 40% Current $18,666,050 -- -- --
Scenario 2CCADEurope
30% Current $14,752,908 $3,237,650 $15,000,000 5.4 Years
Scenario 3ACCADSWA
30% Current $9,931,944 $8,058,614 $15,000,000 2.01 Years
Scenario 3BCCADSWA
40% Current $11,386,462 $7,279,588 $25,000,000 4.3 Years
Scenario 4A CCAD 30%25% SWA Reduction
$15,568,540 -- -- --
Scenario 4B CCAD 30%50% SWA Reduction
$13,126,569 -- -- --
Scenario 4C CCAD 40%50% SWA Reduction
$13,716,095 -- -- --
Scenario 4DCCADSWA
30%50% SWA Reduction
$9,097,262 $4,029,307 $15,000,000 4.2 Years
Scenario 4ECCADSWA
40%50% SWA Reduction
$10,076,303 $3,050,266 $15,000,000 5.8 Years
DEFENSE ACQUISITION REVIEW JOURNAL
288 December 2008
of the blades must be sent to the OEM and the capital investment is $25 million, the discounted payback period is still 4.3 years (see Scenario 3B). It is not surprising that an additional repair facility in SWA is fi nancially viable. The war in SWA is currently the largest source of demand for blade repairs (see Figure 2). Hence, a repair facility located in the region would drastically reduce the total transportation and in-transit costs associated with shipping blades to and from the largest demand facility.
In anticipation of aircraft being pulled out of SWA, the fourth set of scenarios analyzed the impact of reducing the number of aircraft in the region by 25 and 50 percent. The aircraft were redistributed around the world with the demands adjusted accordingly. The overall effect of such reductions on the total annual cost of the Algonquin supply chain network is substantial. For example, compared to the 1A baseline scenario, the effect of a 25 percent SWA reduction (shown under Scenario 4A) is a decrease in total annual cost of about $2,422,018 (13.5 percent). Reducing the number of SWA aircraft by 50 percent decreases the 1A baseline annual cost even more, to $13,126,569, a 27 percent reduction (see Scenario 4B). If the percentage of blades sent back to the OEM is increased to 40 percent, then the 1B baseline cost is reduced a similar 26.5 percent (see Scenario 4C).
An important question is whether an additional repair facility is still warranted in SWA if there were to be a signifi cant redistribution in the number of aircraft from the region. Scenarios 4D and 4E consider the feasibility of an additional repair facility under such conditions. In Scenario 4D, the number of SWA aircraft is reduced by 50 percent with 30 percent of the blades returned to the OEM. The total annual cost of the network is $9,097,262. This is an annual cost reduction of $4,029,307 over the Scenario 4B cost. The discounted payback period of the cost savings is 4.2 years with a $15 million capital investment, and 7.6 years with $25 million.
If 40 percent of the blades must be returned to the OEM (Scenario 4E), the total annual cost of the network is a little higher at $10,076,303. While this is still an an-nual cost reduction of $3,050,266 over the Scenario 4C cost, the discounted payback period is 5.8 years with a $15 million capital investment, and over 10 years with $25 million. In this case the project is not fi nancially viable at either a $15 or $25 million capital investment.
SUMMARY AND CONCLUSION
The purpose of this article is to present an analytic process used by an Army global supply chain to make a location decision for a critical distribution center. The task is to determine a feasible transportation pattern for shipping items from a set of origins to a set of destinations in a way that minimizes the total transportation cost. Specifi cally, the article describes the use of commercial off-the-shelf network design software (LogicNet Plus®) to assess the feasibility of locating additional distribution centers in a global supply chain network designed to support the delivery of helicop-ter parts.
The process involved fi rst establishing a baseline model (scenario 1), which pro-posed no new distribution facilities and no reallocation of aircraft. Once the baseline

December 2008
THE APPLICATION OF SUPPLY NETWORK OPTIMIZATION
289
was established, we considered the feasibility of adding an additional repair facility in Europe or Korea (scenario 2). The analysis revealed that the addition of a $15 mil-lion facility in Europe would result in an annual savings of about $3.2 million with a discounted payback of 5.4 years. A third set of alternatives (scenario 3) considered the impact of locating the additional $15 million repair facility in Europe, Korea, or SWA. This analysis revealed that the superior alternative would be to locate the additional facility in SWA with an annual cost reduction of about $8.1 million. The discounted payback would be approximately 2 years. The analyses also considered the impact of changes in the percentage of helicopter blades that would be sent to the OEM for repair. Since the war in SWA is currently the largest source of demand for helicopter blade repairs (see Figure 2), this analysis revealed that the location of a repair facility in SWA would dramatically reduce total transportation and in-transit cost associated with shipping blades from the largest demand facility.
To consider the impact of a redistribution of aircraft in the region, we conducted additional analysis (scenarios 4A and 4B) that considered a reduction of aircraft in the region by 25 and 50 percent. The results of the analysis revealed that the reduc-tion of both 25 and 50 percent results in substantial reductions in total annual supply chain cost. The fi nal analysis (scenarios 4D and 4E) considered the feasibility of adding the $15 or $25 million repair facility under the assumption of a 50 percent reduction in aircraft, as well as alternative assumptions about the percentage of blades that would be sent to the OEM for repair. The results suggest that locating a new facility in SWA, while simultaneously reducing the number of aircraft in the region, would not be fi nancially viable.
This study demonstrates the importance of considering all relevant parameters and alternatives when making decisions about supply chain networks. For instance, assumptions about the size of the customer base (e.g., aircraft) and the number of tasks performed (e.g., number of items repaired in existing facilities) can substan-tially impact the fi nancial implications of location decisions. The results of this study suggest that the validity of distribution location decisions depend on a comprehensive understanding of the make-up, geographical distribution of customers, and all rel-evant customer service costs. Also, the cost structure of the network must be known with some certainty to estimate the effects of changes to the system. Finally, this study reveals that sound location decisions require that the both the analysts and managers perform a comprehensive investigation that includes a sensitivity analysis with multiple scenarios.
AUTHOR’S NOTE
Please direct all correspondence concerning this article to David Berkowitz, Department of Management and Marketing, BAB 355, University of Alabama in Huntsville, Huntsville, AL 35899; e-mail [email protected]; call 256-824-6952; or fax 256-824-6328.

DEFENSE ACQUISITION REVIEW JOURNAL
290 December 2008
Dr. William R. Killingsworth is Director of the Center for Management and Economic Research at the University of Alabama in Huntsville. He is also Executive Director of the MIT Forum for Supply Chain Innovation. His research focuses on supply chain design and optimization, enterprise software, product life cycle management, lean enterprise, lean manufacturing, six sigma, and new product development. Clients and research sponsors include government and defense organizations and many companies in the automotive, aviation, and aerospace industries.
Dr. David Berkowitz is Chair of the Management and Marketing Department and Associate Professor of Marketing at UAHuntsville. His research has appeared in leading academic journals such as the Journal of Retailing, Journal of Advertising Research, Journal of Advertising, Defense Acquisition Review Journal, and the Journal of Product Innovation Management and Industrial Marketing Management. At UAHuntsville, Dr. Berkowitz teaches New Product Development, Marketing Emerging Technology, and Marketing Management.
Dr. John E. Burnett is an associate professor of fi nance at UAHuntsville. He received his Ph.D. in fi nance from the University of Alabama and his M.A. in mathematics from the Claremont Graduate University. His research interests are in the areas of behavioral fi nance and investments. His research has appeared in such publications as Applied Financial Economics, Journal of Financial Research, and Quarterly Review of Economics and Finance.
Dr. James T. “Jim” Simpson is Dean and Distinguished Professor of Marketing in the College of Business at UAHuntsville. In 2004 he received the Academy of Marketing Science National Outstanding Marketing Teacher Award. His research has appeared in leading academic journals such as Journal of Marketing Research, Journal of Business Research, Journal of Systems and Software, and European Journal of Innovation Management. He has lectured in Russia, China, Taiwan, Romania, France, and England.
AUTHOR BIOGRAPHY
December 2008
THE APPLICATION OF SUPPLY NETWORK OPTIMIZATION
291
REFERENCES
Brown, G., Geoffrion, A. & Bradley, G. (1981). Production and sales planning with limited shared tooling at the key operation. Management Science, 27(3), 247–259.
Byrom, J. W., Bennison, D., Hernandez, T. & Hooper, P. (2001). The use of geo-graphical data and information in retail locational planning. Journal of Targeting, Measurement and Analysis for Marketing, 9(3), 219–229.
Hernandez, T. & Bennison, D. (2000). The art and science of retail location decisions. International Journal of Retail & Distribution Management, 28(8), 357–367.
Hillier, F. S. & Lieberman, G. J. (2001). Introduction to Operations Research (7th ed.). New York: McGraw-Hill.
Hitchcock, F. L. (1941). The distribution of a product from several sources to numer-ous localities. Journal of Mathematics and Physics, 20, 224–230.
Magnanti, T. L., & Wong, R. T. (1984). Network design and transportation planning: Models and algorithms. Transportation Science, 18(1), 1–55.
Mitropoulos, P., Mitropoulos, I., Giannikos, I. & Sissouras, A. (2006). A biobjective model for the locational planning of hospitals and health centers. Health Care and Management Science, 9(2), 171–179.
ReVelle, C. S., and Eiselt, H. A. (2005). Location analysis: A synthesis and survey. European Journal of Operational Research, 165(1), 1–19.
Srinivasan, V. (1974). A transshipment model for cash management decisions. Man-agement Science, 20(10), 1350–1363.
Stafford, E. F., Tseng, F. T. & Gupta, J. N. D. (2005). Comparative evaluation of MILP fl owshop models. Journal of Operations Research Society, 56(1), 88-101.
Stock, J. R. and Lambert, D. (2001). Strategic Logistics Management (4th ed.). Boston: McGraw Hill.
Winston, W. L. (1994). Operations Research: Applications and Algorithms (3rd ed.). Belmont, CA: Duxbury Press.

DEFENSE ACQUISITION REVIEW JOURNAL
292 December 2008
Phot
o co
urte
sy o
f Nor
thro
p G
rum
man
Shi
pbui
ldin
g
December 2008
REFORMING HOW NAVY SHIPBUILDING CONTRACTS ADJUST FOR MATERIAL-COST RISK
293
Edward G. Keating, Robert Murphy, John F. Schank, and John Birkler
This article describes how the U.S. Navy structures fi xed-price and fi xed-price, incentive-fee shipbuilding contracts and how labor- and material-cost indexes can mitigate shipbuilder risk in either type of contract. The Navy frequently uses the Steel Vessel material-cost index, a Bureau of Labor Statistics-derived cost index based on the mix of materials in a typical commercial cargo ship constructed in the 1950s. The Steel Vessel Index has excessive weighting on iron and steel, thereby providing shipbuilders with a mismatch between their actual and the Index-assumed material cost structure. The authors recommend the Navy use a material-cost index with more up-to-date weightings.
The U.S. Navy wants to provide its shipbuilders with appropriate incentive to produce militarily effective vessels at minimum cost to the Navy. Fixed-price contracts provide incentive to a shipbuilder to produce at minimum cost. After
contract award, cost savings that the shipbuilder can implement fl ow directly to the shipbuilder, resulting in higher profi t. Conversely, the shipbuilder bears cost overruns, resulting in lower-than-anticipated profi ts.
Fixed-price contracting becomes problematic, however, when a shipbuilder is forced to bear risk outside of its control. For instance, ship construction requires ma-terial inputs such as steel, wire, cable, and a myriad of others. If the global prices of these commodities rise, a fi xed-price shipbuilder will have lower profi ts (or increased losses) external to the shipbuilder’s efforts.
Ultimately, the Navy can induce a shipbuilder to agree to any arrangement, including having the shipbuilder bear material-cost risk, by offering the shipbuilder a high enough price. But it is likely to be preferable, at least ex ante, for the Navy to dissipate risk external to its shipbuilder to pay less for the systems the Navy needs.
ward G. Keating, Robert Murphy, John F. Schank, and John Birkler
REFORMING HOW NAVY SHIPBUILDING
CONTRACTS ADJUST FOR MATERIAL-COST RISK
DEFENSE ACQUISITION REVIEW JOURNAL
294 December 2008
Conversely, the Navy should not fully immunize a shipbuilder against risks within the shipbuilder’s control, e.g., if the shipbuilder’s own failures cause a cost overrun. In such a case, the shipbuilder should incur at least a portion of the loss. Of course, it can sometimes be diffi cult to distinguish problems within a shipbuilder’s control from those caused or exacerbated by Navy decisions (e.g., changing require-ments) and from those related to external issues (e.g., the rising global price of steel). The Navy uses labor- and material-cost indexes to attempt to correct for several signifi cant cost risks outside its shipbuilders’ control. The indexes refl ect industry- or economy-wide costs, not the costs of the specifi c shipbuilder.
HOW THE NAVY USES LABOR- AND MATERIAL-COST INDEXES
In this section of the article, we present illustrative examples of how the Navy uses labor- and material-cost indexes. To illustrate the basic concept, we start with a highly oversimplifi ed example of a fi xed-price contract. Subsequently, we turn to an enhanced (though still less complex than reality) example of a contract more in accord with current Navy practices. This latter example is a fi xed-price, incentive-fee (FPIF) contract. An FPIF contract is no longer a “pure” fi xed-price contract in that it requires the Navy and the shipbuilder to share cost changes from the negotiated level with incentives and disincentives for underruns and overruns (whereas a textbook fi xed-price contract would not). The shipbuilder’s actual costs are considered in an FPIF contract; they are not in a fi xed-price contract.
A VERY SIMPLE EXAMPLE
Suppose the Navy signs a fi xed-price contract for a $220 million ship on January 1, 2009, with completion scheduled for January 1, 2012. Suppose $100 million of the payment is to cover expected labor costs, another $100 million is to cover expected material costs, and the fi nal $20 million is intended to be contractor profi t. Of course, the actual cost the shipbuilder incurs determines the shipbuilder’s profi t. Figure 1 shows the shipbuilder’s profi t as a function of the actual labor and material cost of the ship. Increasing costs reduce shipbuilder profi ts dollar-per-dollar.
Adding material-cost indexes to this fi xed-price contract would protect the ship-builder against exogenous cost risk.
Suppose, during the period 2009–2012, the external labor-cost index designated in the contract goes up 5 percent while the designated material-cost index goes up 20 percent. Then the Navy’s actual payment to its shipbuilder would be $245 mil-lion ($105 million for labor, $120 million for materials, $20 million in intended or target profi ts—assuming that the profi t level does not increase with the indexes). The shipbuilder’s actual profi t would then go up or down based on whether its actual cost growth was above or below the indexes’. Obviously, it is of central importance that the cost indexes are agreed on up front.
If, on the other hand, the labor-cost index had risen 5 percent while the mate-rial-cost index had fallen 10 percent, the Navy’s payment to the shipbuilder would be $215 million ($105 million in labor, $90 million in materials, $20 million for target
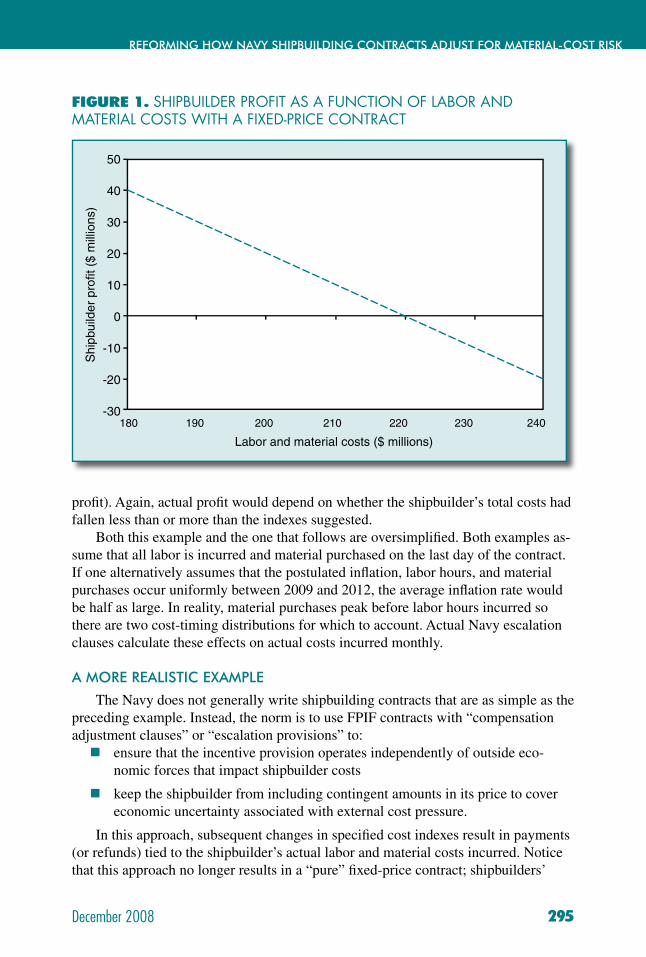
December 2008
REFORMING HOW NAVY SHIPBUILDING CONTRACTS ADJUST FOR MATERIAL-COST RISK
295
profi t). Again, actual profi t would depend on whether the shipbuilder’s total costs had fallen less than or more than the indexes suggested.
Both this example and the one that follows are oversimplifi ed. Both examples as-sume that all labor is incurred and material purchased on the last day of the contract. If one alternatively assumes that the postulated infl ation, labor hours, and material purchases occur uniformly between 2009 and 2012, the average infl ation rate would be half as large. In reality, material purchases peak before labor hours incurred so there are two cost-timing distributions for which to account. Actual Navy escalation clauses calculate these effects on actual costs incurred monthly.
A MORE REALISTIC EXAMPLE
The Navy does not generally write shipbuilding contracts that are as simple as the preceding example. Instead, the norm is to use FPIF contracts with “compensation adjustment clauses” or “escalation provisions” to:
ensure that the incentive provision operates independently of outside eco- nomic forces that impact shipbuilder costs
keep the shipbuilder from including contingent amounts in its price to cover economic uncertainty associated with external cost pressure.
In this approach, subsequent changes in specifi ed cost indexes result in payments (or refunds) tied to the shipbuilder’s actual labor and material costs incurred. Notice that this approach no longer results in a “pure” fi xed-price contract; shipbuilders’
FIGURE 1. SHIPBUILDER PROFIT AS A FUNCTION OF LABOR AND MATERIAL COSTS WITH A FIXED-PRICE CONTRACT
50
40
30
20
10
0
-10
-20
-30
Labor and material costs ($ millions)
Shi
pbui
lder
pro
fi t (
$ m
illio
ns)
180 190 200 210 220 230 240
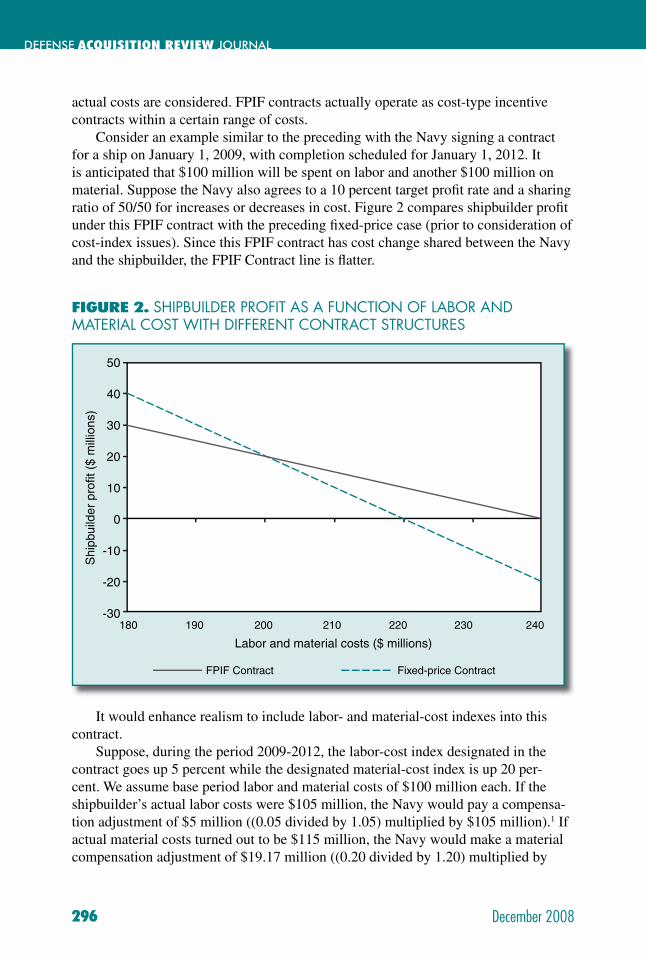
DEFENSE ACQUISITION REVIEW JOURNAL
296 December 2008
actual costs are considered. FPIF contracts actually operate as cost-type incentive contracts within a certain range of costs.
Consider an example similar to the preceding with the Navy signing a contract for a ship on January 1, 2009, with completion scheduled for January 1, 2012. It is anticipated that $100 million will be spent on labor and another $100 million on material. Suppose the Navy also agrees to a 10 percent target profi t rate and a sharing ratio of 50/50 for increases or decreases in cost. Figure 2 compares shipbuilder profi t under this FPIF contract with the preceding fi xed-price case (prior to consideration of cost-index issues). Since this FPIF contract has cost change shared between the Navy and the shipbuilder, the FPIF Contract line is fl atter.
It would enhance realism to include labor- and material-cost indexes into this contract.
Suppose, during the period 2009-2012, the labor-cost index designated in the contract goes up 5 percent while the designated material-cost index is up 20 per-cent. We assume base period labor and material costs of $100 million each. If the shipbuilder’s actual labor costs were $105 million, the Navy would pay a compensa-tion adjustment of $5 million ((0.05 divided by 1.05) multiplied by $105 million).1 If actual material costs turned out to be $115 million, the Navy would make a material compensation adjustment of $19.17 million ((0.20 divided by 1.20) multiplied by
FIGURE 2. SHIPBUILDER PROFIT AS A FUNCTION OF LABOR AND MATERIAL COST WITH DIFFERENT CONTRACT STRUCTURES
Labor and material costs ($ millions)Labor and material costs ($ millions)
50
40
30
20
10
0
-10
-20
-30
Shi
pbui
lder
pro
fi t (
$ m
illio
ns)
180 190 200 210 220 230 240
Labor and material costs ($ millions)
FPIF Contract Fixed-price Contract
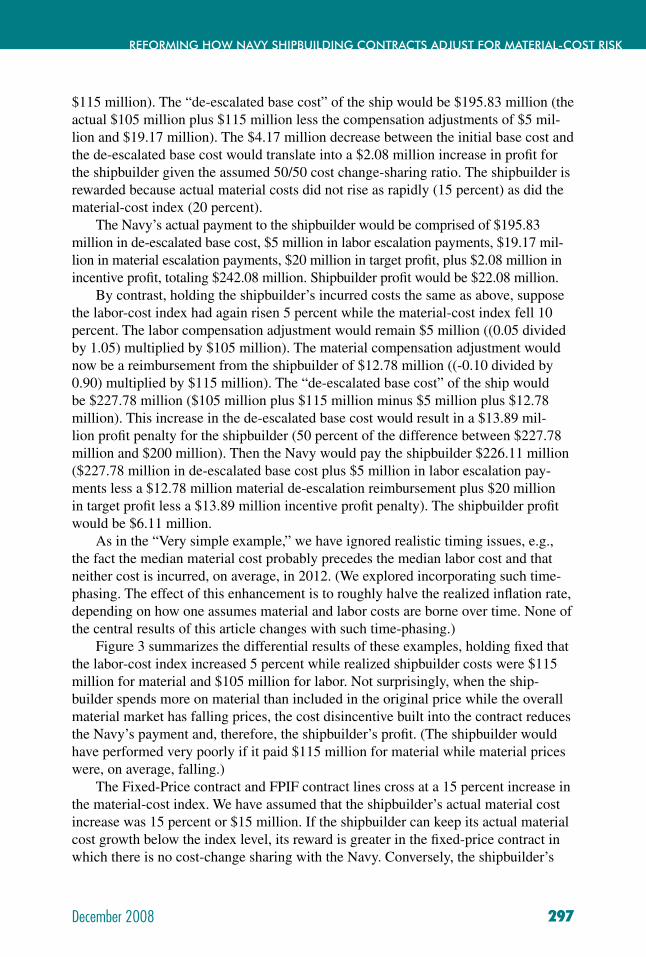
December 2008
REFORMING HOW NAVY SHIPBUILDING CONTRACTS ADJUST FOR MATERIAL-COST RISK
297
$115 million). The “de-escalated base cost” of the ship would be $195.83 million (the actual $105 million plus $115 million less the compensation adjustments of $5 mil-lion and $19.17 million). The $4.17 million decrease between the initial base cost and the de-escalated base cost would translate into a $2.08 million increase in profi t for the shipbuilder given the assumed 50/50 cost change-sharing ratio. The shipbuilder is rewarded because actual material costs did not rise as rapidly (15 percent) as did the material-cost index (20 percent).
The Navy’s actual payment to the shipbuilder would be comprised of $195.83 million in de-escalated base cost, $5 million in labor escalation payments, $19.17 mil-lion in material escalation payments, $20 million in target profi t, plus $2.08 million in incentive profi t, totaling $242.08 million. Shipbuilder profi t would be $22.08 million.
By contrast, holding the shipbuilder’s incurred costs the same as above, suppose the labor-cost index had again risen 5 percent while the material-cost index fell 10 percent. The labor compensation adjustment would remain $5 million ((0.05 divided by 1.05) multiplied by $105 million). The material compensation adjustment would now be a reimbursement from the shipbuilder of $12.78 million ((-0.10 divided by 0.90) multiplied by $115 million). The “de-escalated base cost” of the ship would be $227.78 million ($105 million plus $115 million minus $5 million plus $12.78 million). This increase in the de-escalated base cost would result in a $13.89 mil-lion profi t penalty for the shipbuilder (50 percent of the difference between $227.78 million and $200 million). Then the Navy would pay the shipbuilder $226.11 million ($227.78 million in de-escalated base cost plus $5 million in labor escalation pay-ments less a $12.78 million material de-escalation reimbursement plus $20 million in target profi t less a $13.89 million incentive profi t penalty). The shipbuilder profi t would be $6.11 million.
As in the “Very simple example,” we have ignored realistic timing issues, e.g., the fact the median material cost probably precedes the median labor cost and that neither cost is incurred, on average, in 2012. (We explored incorporating such time-phasing. The effect of this enhancement is to roughly halve the realized infl ation rate, depending on how one assumes material and labor costs are borne over time. None of the central results of this article changes with such time-phasing.)
Figure 3 summarizes the differential results of these examples, holding fi xed that the labor-cost index increased 5 percent while realized shipbuilder costs were $115 million for material and $105 million for labor. Not surprisingly, when the ship-builder spends more on material than included in the original price while the overall material market has falling prices, the cost disincentive built into the contract reduces the Navy’s payment and, therefore, the shipbuilder’s profi t. (The shipbuilder would have performed very poorly if it paid $115 million for material while material prices were, on average, falling.)
The Fixed-Price contract and FPIF contract lines cross at a 15 percent increase in the material-cost index. We have assumed that the shipbuilder’s actual material cost increase was 15 percent or $15 million. If the shipbuilder can keep its actual material cost growth below the index level, its reward is greater in the fi xed-price contract in which there is no cost-change sharing with the Navy. Conversely, the shipbuilder’s
DEFENSE ACQUISITION REVIEW JOURNAL
298 December 2008
profi t does not diminish as rapidly if its actual material costs increase more than the material-cost index with the FPIF contract’s cost-change sharing.
Another way to look at Figure 3 is that, with either type of contract, the ship-builder is “rooting for” its material cost index to increase without, of course, the shipbuilder’s actual material costs increasing commensurably.
If the shipbuilder’s skillful management kept ship costs from rising as much as similar costs had in the general economy, greater profi ts are an appropriate reward. However, if greater profi ts result from escalation payments calculated by an exter-nal price index that does not accurately refl ect what the shipbuilder purchases, then greater profi t is not warranted. Conversely, it would be unfair to penalize a ship-builder if an inappropriate cost index declines or increases less than the shipbuilder’s actual cost environment.
THE STEEL VESSEL INDEX
A longtime material-cost index in Navy shipbuilding is the “Steel Vessel Index.” Based on an estimate by the Maritime Administration of the mix of materials in a typi-cal commercial cargo ship constructed in the 1950s (United States General Accounting Offi ce, 1972), it is a weighted average of three Bureau of Labor Statistics (BLS) pro-ducer price indexes (45 percent iron and steel, 40 percent general-purpose machinery
Labor and material costs ($ millions)Labor and material costs ($ millions)
Sh
ipbu
ilder
pro
fi t
($ m
illio
ns)
-20 -10 0 10 20 30 40
Change in material-cost index (%)
FPIF Contract Fixed-price Contract
50
40
30
20
10
0
-10
-20
FIGURE 3. SHIPBUILDER PROFITS ARE GREATER WHEN THE MATERIAL-COST INDEX RISES MORE AND REALIZED COSTS ARE HELD CONSTANT
December 2008
REFORMING HOW NAVY SHIPBUILDING CONTRACTS ADJUST FOR MATERIAL-COST RISK
299
and equipment, and 15 percent electrical machinery and equipment). If, for instance, the iron and steel price index increased 3 percent in a year, the general-purpose ma-chinery index increased 2 percent, and the electrical machinery index fell 1 percent, the Steel Vessel Index would increase 2 percent (0.45*0.03+0.4*0.02-0.15*0.01).
One criticism of the Steel Vessel material-cost index is that it does not accurately cover the materials used in building a modern ship.2 No modern U.S. Navy ship, for instance, has 45 percent of its material costs in iron and steel. To combat this short-coming, the DDG-51 and T-AKE programs created their own material-cost indexes, using different weights on the same three underlying BLS indexes (DDG-51: 20 percent iron and steel, 43 percent general-purpose machinery, 37 percent electrical machinery; T-AKE: 10 percent iron and steel, 60 percent general-purpose machinery, 30 percent electrical machinery). In the preceding paragraph’s example, whereas the Steel Vessel Index would increase 2 percent, the DDG-51 index would increase 1.09 percent (0.2*0.03+0.43*0.02-0.37*0.01) while the T-AKE index would increase 1.2 percent (0.1*0.03+0.6*0.02-0.3*0.01).
There is an additional challenge with any of these indexes: Even if one correctly identifi ed the mix of materials that went into the ship, the materials would be pur-chased at different stages of ship construction. Steel, for instance, is required early in the construction process. Conversely, combat systems and electrical equipment (perhaps more akin to general-purpose or electrical machinery) are not delivered to the shipyard and consequently do not become incurred costs until much later in construction. Time-phasing the mix of an overall material-cost index could provide greater fi delity. However, it is unlikely that any material-cost index will completely dissipate a shipbuilder’s exogenous material-cost risk.
Historically, the BLS iron and steel price index has been much more volatile than the general-purpose machinery or electrical machinery indexes. Figure 4 displays these indexes’ quarterly returns (with a positive “return” if the cost-index value went up, negative if it fell) between the second quarter of 19473 and the fourth quarter of 2007. We also display the quarterly change in the Bureau of Economic Analysis (BEA) Gross Domestic Product (GDP) price defl ator, a measure of overall infl ation in the economy.
Naturally, given the Steel Vessel Index’s greater relative weighting of the iron and steel price index, it has been more volatile than the DDG-51 or T-AKE indexes. In Figure 5, we plot the standard deviation in the quarterly return and the mean quarterly return for the three ship material-cost indexes and the GDP defl ator between the
Historically, the BLS iron and steel price index has been much more volatile than the general-purpose
machinery or electrical machinery indexes.

DEFENSE ACQUISITION REVIEW JOURNAL
300 December 2008
second quarter of 1947 and the fourth quarter of 2007.4 The Steel Vessel Index had the greatest standard deviation in its quarterly return.
What Figure 5 does not show is how closely correlated any of these indexes is with the actual cost variability a shipbuilder experiences. The best cost index is the one that minimizes a shipbuilder’s exogenous risk and therefore minimizes the risk premium that the Navy must pay the shipbuilder. We know, however, that the Steel Vessel Index over-represents iron and steel costs in current naval warship contracts.
The fact that the Steel Vessel Index has had a mean quarterly return greater than the other indexes and the economy-wide infl ation rate is not prima facie bad news for the Navy. In a competitive setting, a shipbuilder will submit a lower bid ex ante if it expects super-normal escalation. So the Navy’s expected costs are not, in equilibrium, affected by the Index’s mean.
What is more problematic is the known mismatch between the Steel Vessel In-dex’s composition and a shipbuilder’s material cost structure. The shipbuilder bears a risk, for instance, that the prices of iron and steel may tumble while the shipbuilder’s do not. A risk-averse shipbuilder will require a premium to bear this cost structure mismatch-driven risk.
Sources: Bureau of Labor Statistics Web site <http://www.bls.gov/data/home.htm> and Bureau of Economic Analysis Web site <http://www.bea.gov/national/nipaweb/Index.asp>
FIGURE 4. QUARTERLY CHANGES IN DIFFERENT COST INDEXES
-10
-5
0
5
10
15
20
1947 1957 1967 1977 1987 1997 2007
Year
Qua
rter
ly p
rice
inde
x ch
ange
(%)
Iron & steelGeneral-purpose machineryElectrical machineryGDP Deflator
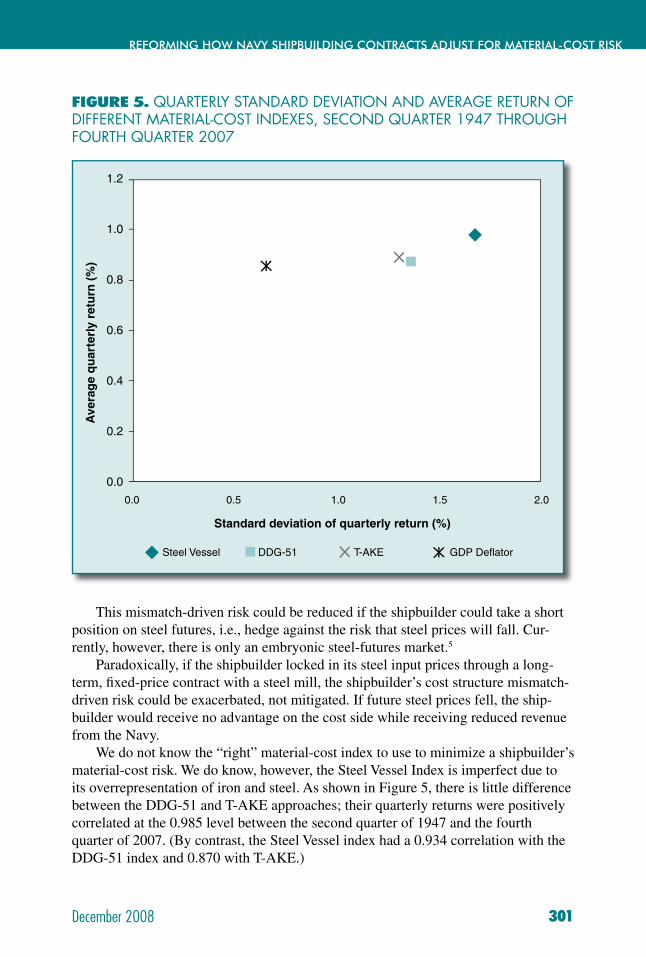
December 2008
REFORMING HOW NAVY SHIPBUILDING CONTRACTS ADJUST FOR MATERIAL-COST RISK
301
This mismatch-driven risk could be reduced if the shipbuilder could take a short position on steel futures, i.e., hedge against the risk that steel prices will fall. Cur-rently, however, there is only an embryonic steel-futures market.5
Paradoxically, if the shipbuilder locked in its steel input prices through a long-term, fi xed-price contract with a steel mill, the shipbuilder’s cost structure mismatch-driven risk could be exacerbated, not mitigated. If future steel prices fell, the ship-builder would receive no advantage on the cost side while receiving reduced revenue from the Navy.
We do not know the “right” material-cost index to use to minimize a shipbuilder’s material-cost risk. We do know, however, the Steel Vessel Index is imperfect due to its overrepresentation of iron and steel. As shown in Figure 5, there is little difference between the DDG-51 and T-AKE approaches; their quarterly returns were positively correlated at the 0.985 level between the second quarter of 1947 and the fourth quarter of 2007. (By contrast, the Steel Vessel index had a 0.934 correlation with the DDG-51 index and 0.870 with T-AKE.)
FIGURE 5. QUARTERLY STANDARD DEVIATION AND AVERAGE RETURN OF DIFFERENT MATERIAL-COST INDEXES, SECOND QUARTER 1947 THROUGH FOURTH QUARTER 2007
1.2
1.0
0.8
0.6
0.4
0.2
0.0
Ave
rag
e q
uar
terl
y re
turn
(%
)
0.0 0.5 1.0 1.5 2.0
Standard deviation of quarterly return (%)
Steel Vessel DDG-51 T-AKE GDP Defl ator
DEFENSE ACQUISITION REVIEW JOURNAL
302 December 2008
Of the three Navy material-cost indexes, T-AKE (0.657) and DDG-51 (0.639) were more highly correlated with the GDP defl ator than was the Steel Vessel Index (0.540). The explanation for the Steel Vessel Index’s relative lack of correlation with overall infl ation in the economy is that the iron and steel cost index had a much lower correlation (0.363) with the GDP defl ator than did the general-purpose machinery (0.634) and electrical machinery (0.605) cost indexes. So a material-cost index that oversamples iron and steel moves away from representation of economy-wide costs.
The foremost argument in favor of the Steel Vessel Index is its familiarity and, consequently, the comfort that some shipbuilders have with the Index. Almost ev-eryone we met in the nautical construction industry knows of the Steel Vessel Index and most have experience with contracts tied to it. The Steel Vessel Index is, perhaps, akin to the Dow Jones Industrial Average in that one would not invent it anew (or at least not with its current weightings), but its fame and tradition keep it in use.6
Having shipbuilders being familiar and comfortable with the Index is desir-able for the Navy and the government if it implies that shipbuilders can be paid less when the Index is in use. The best material-cost index minimizes the exogenous risk that shipbuilders perceive themselves to face so as to therefore minimize Navy ship acquisition costs. Unless one believes familiarity is extremely important, however, the manifest cost structure mismatch of the Steel Vessel Index suggests that its usage does not minimize the Navy’s expected costs.
CONCLUSIONS
We do not think that the Navy should use the Steel Vessel Index to adjust for material cost changes in future shipbuilding contracts. The Steel Vessel Index clearly puts excessive weight on iron and steel relative to the materials actually used in constructing a modern ship. Usage of the Steel Vessel Index does not appropriately mitigate contractor material cost risk. Indeed, from a shipbuilder’s perspective, a new risk is created: the risk that the prices of what the shipbuilder actually buys will rise faster than the price of steel.
The shortcomings of the Steel Vessel Index have been known for many years. The DDG-51 and T-AKE programs created their own material-cost indexes with less weight on iron and steel. Their material-cost indexes, which empirically have been highly correlated with one another, are doubtlessly better indexes than the Steel Ves-sel Index, though they still appear to put too much weight on iron and steel (DDG-51: 20 percent, T-AKE: 10 percent).
We urge the Navy to develop a “Modern Vessel Index” that more appropriately represents the material used in constructing ships. Moving toward a better index would also be an opportunity to explore a time-phased material-cost index, e.g., refl ect the fact that shipbuilders typically buy keel steel early in production with on-board electronics procured much later in the construction process. The more ac-curately a material-cost index captures a shipbuilder’s external material cost risk, the less we expect the Navy to have to pay its shipbuilders.
December 2008
REFORMING HOW NAVY SHIPBUILDING CONTRACTS ADJUST FOR MATERIAL-COST RISK
303
ENDNOTES
1. For expositional simplicity, we are assuming that actual labor costs match the increase in the labor-cost index, allowing us to concentrate on material-cost issues.
2. Indeed, criticism of the Steel Vessel Index pre-dates what we might term “modern” ships. Research in the 1970s (Geismar, 1975) suggested that the Steel Vessel Index was ill-suited to the DD963 Spruance-class destroyer, and the LHA Marine amphibious assault ship, two 1970s-era ship programs. (Both of these ships were very late in delivering, implying that infl ation issues proved to be more important than would have been the case had their production been timelier.)
3. Monthly BLS data on these cost indexes are available back to January 1947. However, the BEA GDP defl ator data are available only quarterly, so we aggregated the BLS data to the quarter level.
4. None of the three ship material-cost indexes existed in 1947. But we can use BLS data to retrospectively compute how they would have evolved.
5. MacDonald (2008) discusses the London Metal Exchange’s launch of a steel-futures contract. By way of background, Anderson (2006) discusses the debate as to the feasibility and desirability of a steel futures market.
6. Discussing an earlier version of this article, Jim Jondrow of the Center for Naval Analyses raised the following analogy to the Navy’s continued use of the Steel Vessel Index: Suppose one owned a portfolio that mirrored the National Association of Securities Dealers Automated Quotation System (NASDAQ) Composite Index, but one observed the Dow Jones Industrial Average (or vice versa). On March 10, 2000, the NASDAQ Composite Index closed at an all-time high of 5046 but then fell precipitously, ultimately hitting a bottom of 1114 on October 9, 2002 (http://en.wikipedia.org/wiki/Nasdaq_Composite). Meanwhile, the Dow Jones Industrial Average closed at 9929 on March 10, 2000, and at 7286 on October 9, 2002 (http://fi nance.yahoo.com/q/hp?s=%5EDJI&a=02&b=10&c=2000&d=09&e=9&f=2002&g=d). The indexes were positively correlated with one another, but the magnitudes of the changes were sharply different.

DEFENSE ACQUISITION REVIEW JOURNAL
304 December 2008
Dr. Edward G. Keating is a senior economist at RAND specializing in applied and empirical issues in defense economics. He has worked on disparate research projects including aircraft depot-level maintenance, replacement of aging aircraft, optimal contract design, outsourcing and privatization, and DoD working capital fund policies. He received a Ph.D. in economic analysis and policy from Stanford University.
(E-mail address: [email protected])
Mr. Robert Murphy retired as a member of the Senior Executive Service after a 33-year career in the U.S. Navy’s Nuclear Propulsion program. He fi nished his career as the Director of Resource Management, responsible for budget, acquisition, and logistics support for the Naval Nuclear Propulsion program. Since retiring from public service, he has been consulting for commercial and government organizations regarding major system acquisitions.
(E-mail address: [email protected])
Mr. John F. Schank is a senior operations research analyst at RAND. He has been involved in a wide range of research issues including shipbuilding acquisition and industrial base analyses, cost analyses, manpower, personnel and training issues, and logistics. He holds a B.S. in Electrical Engineering from Drexel University and an M.S. in Operations Research from the University of Pennsylvania.
(E-mail address: [email protected])
CAPT John Birkler, USNR (Ret.), is a senior management system scientist at RAND. He is responsible for managing U.S. Navy, U.S. Coast Guard, and UK Ministry of Defence research projects. He holds a B.S. and M.S. in physics and completed the UCLA Executive Program in Management in 1992. After completing his third command tour, he retired from the Navy Reserve with the rank of captain.
(E-mail address: [email protected])
AUTHOR BIOGRAPHY
Reforming how Navy Shipbuilding Contracts Adjust for Material-Cost Risk, is derived from a RAND Corporation technical Report TR-520-Navy, entitled "Us-ing the Steel-Vessel Material-Cost Index to Mitigate Shipbuilder Risk," and the RAND Corporation is the copyright holder of the original document.
December 2008
REFORMING HOW NAVY SHIPBUILDING CONTRACTS ADJUST FOR MATERIAL-COST RISK
305
REFERENCES
Anderson, M. (2006, September/October). Steel in your futures. Forward Online: Global Perspective from MSCI. Retrieved March 4, 2007, from http://forward.msci.org/articles/0906steelfutures.cfm
Geismar, D. (1975, September). Composition of material price indices for naval ship contract escalation. Naval Postgraduate School master’s thesis.
MacDonald, A. (2008, February 25). Will steel futures catch on? The Wall Street Journal, 251(45), C2.
United States Department of Commerce, Bureau of Economic Analysis Web site. (n.d.) Retrieved July 17, 2007, from http://www.bea.gov/national/nipaweb/Index.asp
United States Department of Labor, Bureau of Labor Statistics Web site. (n.d.) Re-trieved July 17, 2007, from http://www.bls.gov/data/home.htm
United States General Accounting Offi ce (1972, April). Feasibility of constructing price indexes for weapon systems. Report to the Joint Economic Committee Congress of the United States, B-159896. Retrieved June 17, 2007, from http://archive.gao.gov/f0302/096606.pdf
Wikipedia Web site. (n.d.) Nasdaq composite. Retrieved July 4, 2007, from http://en.wikipedia.org/wiki/Nasdaq_Composite
Yahoo! Finance Web site. (n.d.) Dow Jones industrial average historical prices. Retrieved July 4, 2007, from http://fi nance.yahoo.com/q/hp?s=%5EDJI&a=02&b=10&c=2000&d=09&e=9&f=2002&g=d&z=66&y=0
DEFENSE ACQUISITION REVIEW JOURNAL
306 December 2008
Imag
e de
sign
ed b
y Ji
m E
lmor
e
December 2008
DO TEAM GOALS AFFECT TEAM FOCUS AND PERFORMANCE?
307
DO TEAM GOALS AFFECT TEAM FOCUS AND PERFORMANCE? RESEARCH STUDY OF DAU’S PROGRAM MANAGEMENT
OFFICE COURSE (PMT 352B)Thomas Robert Edison
Teams can be a signifi cant resource to business leaders and can help lead to greater program successes. This study was conducted on student project teams in 12 classes of a Defense Acquisition University (DAU) executive-level, 6-week program management class in six different locations. The study not only underscores the signifi cance of team focus on performance, but also highlights how team characteristics affect team focus and performance. Signifi cant direct relationships were found in the study’s 15 tested hypotheses between work team strategic intent (the team’s purpose, objectives, and strategies) and team performance, as measured by team self-assessments and instructor assessments. The results of this study have applications to the successful use of project teams throughout DoD.
W hat is one of the single most potent tools for program managers—readily available to all? The Department of Defense, as with many other defense industry organizations operating in today’s complex, changing, and some-
times chaotic work environments, is becoming increasingly more dependent on work teams as a means of leveraging maximum creativity, effi ciency, and focus from its acquisition workforce. In today’s constrained fi scal environment of limited budgets and manpower, identifying, defi ning, and understanding the initiatives and strategies that lead to team effectiveness represent a management imperative.
One characteristic that has received signifi cant attention is whether teams with a clear focus and a developed purpose are more effective than those teams that are less focused, with less clear goals or purpose.

DEFENSE ACQUISITION REVIEW JOURNAL
308 December 2008
The Defense Acquisition University (DAU) has embraced teams, and most of the DAU resident courses are taught with students assigned to student work teams. In particular, in DAU’s premier 6-week Program Management Offi ce Course (PMT 352B), teams are used throughout the course to highlight the environment in which a DoD program manager normally interacts with work teams. This article highlights a study conducted on PMT 352B teams to determine if focused teams perform better than those teams that are less focused. Does a team with clear purpose, objectives, and strategies perform more effectively than teams with less clearly defi ned tenets?
Warren Bennis (1985) in his book Leaders, The Strategies for Taking Charge describes the need for cooperation, communication, and collaboration between indi-viduals in order to achieve greatness—and emphasizes the successful deployment of teams in the last two decades to achieve these same results.
In today’s complex and technologically sophisticated society, the most pressing projects require the committed, coordinated, and connected contributions of many tal-ented people. Gone is the myth of the Lone Ranger or a sole champion or larger-than-life hero who can essentially “go it alone.” Tomorrow’s competitive organizations will be managed and inspired by teams of experts, skilled technicians, and team-ap-pointed leaders. Projects, work efforts, and entire programs will be accomplished by a network of linked, disciplined workers skilled in their own right but connected by their commitment to their team’s greater cause, goals, and/or objectives (Bennis & Biederman, 1997).
The Defense Acquisition University and many of its external corporate university partners share the belief that an effective method to enhance product development is through work teams that are focused or intent with the same strategic goals and mis-sions of the corporate leadership. They believe that teams with a signifi cant level of the same strategic focus on the purpose, objectives, and implementing strategies, and that are aligned with the corporate goals and missions, can be an extremely effective tool for enhancing productivity throughout the organization.
For purposes of this study, it was hypothesized that if student team members are aligned in their purpose and objectives to the course goals and learning objectives, then higher levels of student team performance and learning would result. It was further hypothesized that this learning would be more aligned with the learning ob-jectives set forth in the course curriculum and those expressed by the instructors. The team’s understanding of and commitment to the purpose, objectives, and strategies of
Tomorrow’s competitive organizations will be managed and inspired by teams of experts, skilled technicians,
and team-appointed leaders.
December 2008
DO TEAM GOALS AFFECT TEAM FOCUS AND PERFORMANCE?
309
the course ideally would help the team satisfy its primary reason for enrolling in the course: learning and performing the course’s goals and objectives.
Katzenbach and Smith (2003) have accomplished extensive work in the study of teams and their effectiveness. They admitted that no empirical data exist to prove their theories on team effectiveness. This research study provides data to support Kat-zenbach and Smith’s study (2003) and theories on teams: teams can be more effective or perform better if they maintain a Strategic Intent or focus that is understood, and committed to, by all the team members.
PURPOSE OF STUDY
The purpose of this study was to use survey data from PMT 352B student work teams and instructors’ surveys to examine the relationship between work team Strate-gic Intent (strategic purpose, objectives, and strategies) and Team Performance. The studied work teams were chosen from student work teams attending DAU’s Program Management Offi ce Course (PMT 352B). The PMT 352B courses studied were 6-week courses (now reduced to 5 weeks), which teach the concepts and skills neces-sary to become successful program managers. These courses simulate the conditions and stresses with which senior DoD managers are normally presented in making daily and long-term strategic program management decisions. Team Performance was assessed by surveys administered to the work teams (self-assessment performance) and to the PMT 352B instructors, who were teaching the student work teams (exter-nal, instructor assessment).
This research study acquired empirical data from student work team members attending PMT 352B classes. The strategic characteristics of specifi c PMT 352B student work teams were calculated from information gathered from team surveys. The students attending this technical training course on program management at DAU were generally mature (35 to 60 years of age). The teams’ understanding of and com-mitment to their respective team’s strategic management characteristics were mea-sured by surveys administered to the teams in their location of work (the classroom) by the researcher and trained faculty members. The surveys obtained each team member’s perceptions of his or her understanding of and commitment to the specifi c team strategic elements studied in this research—team purpose, objectives, and strate-gies. These strategic elements helped defi ne the teams’ strategic characteristics and were defi ned in the team survey, so there was an understanding of these variables by the survey respondents. This helped defi ne the strategic elements being studied and the data the researcher was seeking.
Data were collected from each team member on their perception of how similar or linked was their level of understanding of and commitment to the other members of the team’s level of understanding of and commitment to the team’s purpose, objec-tives, and strategies. Team similarity was measured both in terms of understanding and commitment to these strategic elements.
The research calculated team data on similarity of team strategic characteristics as measured by understanding and commitment to team purpose, objectives, and
DEFENSE ACQUISITION REVIEW JOURNAL
310 December 2008
strategies. This research analyzed the relationship or correlation of a team’s strategic characteristics (similar understanding of and commitment to team purpose, objec-tives, and strategies) to the Team’s Performance—measured by the team’s self-assess-ment of its performance and by an external assessment by the team’s instructor(s).
The larger the correlation (or r value) is, the stronger the relationship. Any cor-relation above .3 was considered signifi cant and relevant. The study then analyzed the relationship or similarity between a team’s self-assessment of its performance, and the instructors’ external assessment of the same team’s performance. The researcher theorized that the similarity or alignment of a team’s purpose, objectives, and strategies was a strong predictor (a direct correlation) of how well the team members worked together, and effectively communicated in making critical choices vital to the successful performance of the team. Team effectiveness in making decisions and accomplishing the course objectives was theorized to be related to the congruence or alignment of each team member’s individual understanding or alignment to their team’s goals.
This congruence was measured in terms of the member’s understanding of and commitment to the other team members’ strategic elements of purpose, objectives, and strategies. How congruent or similar the members’ strategic characteristics were, the more effective the team should be in accomplishing its purpose, objectives, and strategies. Accomplishing these team strategic elements would make the team per-form better, both as determined by the team’s own standards and by the instructors’ criteria of learning the course objectives. The fl ow chart depicts the research model, which helped to visually portray the variables (independent and dependent), research questions, hypotheses, and relationships involved in this research study. The next two sections highlight the two key variables studied, which were Strategic Intent and Team Performance.
STRATEGIC INTENT
The Strategic Intent of the team is defi ned and highlighted in the fl ow chart as consisting of three team strategic elements: purpose, objectives, and strategies. Strategic Intent is further defi ned as to how each team member was focused or had similarly aligned understanding of and commitment to the team’s strategic elements (purpose, objectives, and strategies), as measured by surveying each team member. The actual measurement of Strategic Intent was then computed by measuring the overall average team scores for Strategic Intent from the individual members’ scores on the team survey.
One of the basic reasons for using the term “Strategic Intent” to highlight the strategic thinking or focus of the teams in this study was to use the previous work of Hamel and Prahaland (1989) in this conceptual or research area. Strategic Intent captures the meaning and nature of the characteristics most representative of what exists in teams or other groups that highlight what they think and perceive about their future goals, vision, or purpose.
As discussed by Hamel and Prahaland (p. 64), an organization’s Strategic Intent or focus is part of the “dream that energizes a company and is more sophisticated
December 2008
DO TEAM GOALS AFFECT TEAM FOCUS AND PERFORMANCE?
311
and more positive than a simple war cry.” These two authors highlighted that Stra-tegic Intent implies a sense of organizational direction, discovery, and destiny. They explained that Strategic Intent is more than the implied particular point of view about the long-term market or competitive position that an organization hopes to build over the coming decade or so. It is the stated and vital focus that makes an organization competitive and driven toward a vision, a future direction, or a destiny that consumes its nature and reason for being (Hamel & Prahaland, 1989).
This research study embraced a similar meaning and value to team Strategic Intent as developed by Hamel and Prahaland—the committed and understood strategic elements of the team that united or focused team actions and decisions as measured by the team’s commitment to and understanding of the team’s purpose, objectives, and strategies.
It was theorized that adequate controls of the decision-making processes are in place within the focused team, which facilitate it to be more effective and successful as a decision maker in focusing on the team purpose and objectives. Additionally, it was theorized that a more integrated and focused team within the overall organiza-tional structure, would enable or leverage the organization itself to be higher per-forming in the long term. Properly disciplined, focused, and integrated teams are the ones that become high-performing teams, and they have been considered “the most versatile unit organizations have for meeting both performance and challenges in today’s complex world” (Katzenbach & Smith, 2003, p. xiii).
TEAM PERFORMANCE
The concept of Team Performance and how to measure it is critically important to the successful deployment of teams in any environment (Kraft, 1996). Throughout corporate universities and many defense industries, the belief prevails that teams make organizations more effective. However, few research efforts have measured team effectiveness with empirical data. The research cited in this study focused primarily on the manufacturing teams that can be assessed using operational mea-sures such as productivity, effi ciency, delivery time, defects, and scrap (Beyerlein, 1995). Some of the challenges presented in this research study on measuring Team Performance were similar to many studies that relied upon self-reported assessments, especially when measuring Team Performance. Team Performance has been studied
Throughout corporate universities and many defense industries, the belief prevails that teams
make organizations more effective.
DEFENSE ACQUISITION REVIEW JOURNAL
312 December 2008
extensively, and many techniques exist to measure it. However, measuring Team Performance in the classroom or even in a program offi ce environment is a challenge without using self-reported or self-assessed performance measures or data.
The nature of the data used in this research necessitated that to obtain team char-acteristics on Strategic Intent, the natural source of the information would be from the team members. The team members were the most reliable source of information on what they thought about the Team Performance and how similar they perceived their beliefs to be regarding team purpose, objectives, and strategies (Strategic Intent). It would be diffi cult if not impossible to obtain “true” unbiased, objective data on teams’ perceptions of their strategic thinking and their performance without using self-reported data.
The effects of self-reported data have been assessed in this research. It was determined that given the nature of the self-reported team member data (aggregated at team level, collected from different sources, locations, and times), the effects of covariance or overlapping data, as highlighted by Podsakoff and Organ (1986), were minimized in this research.
Obviously, the problems of measuring Team Performance are very complex and diffi cult to pinpoint. The existing performance measurement systems in place in an organization are usually not aligned with new initiatives or changes, such as team de-velopment, occurring in today’s workplace. In most of these cases, the measurement systems do not adequately refl ect the impact on effi ciency and effectiveness of the latest initiatives (Beyerlein, 1995). Because of these many diffi culties with the lack of an integrated performance measurement system and the complexities of how teams affect organizations, it is diffi cult, if not impossible, to effectively measure the value of teams with existing databases or performance management systems. Therefore, self-assessment is recognized as one of the more effective ways to measure Team Performance. The other was from the instructors’ assessment of team performance.
OVERALL RESEARCH SUMMARY AND FINDINGS
The table shown here highlights the relative strength of each of the correlation or relationship tests that was conducted in the study. The italicized entries below iden-tify the original 15 Research Question hypotheses, which were all supported at the 95 percent confi dence level, which is considered high in a correlation study. All but the last entry (Question 9 to Instructor Performance) were supported at a 99 percent confi dence level (a very low chance of error). All the tests were supported at the 95 percent confi dence level.
For this article, the following strength of the relationship or support was used: correlations greater than .7 are considered a strong relationship; from .5 to .699 is considered a moderate relationship; and from .3 to .499 is considered a modest relationship/support. All the relationships in the study were supported at the modest level (.3).
The fi rst entry in the Table highlights the strength of the relationship between overall Team Strategic Intent and Team Performance at .731 (a strong relationship), which underscores the infl uence that strategic thinking or developing clear and un-
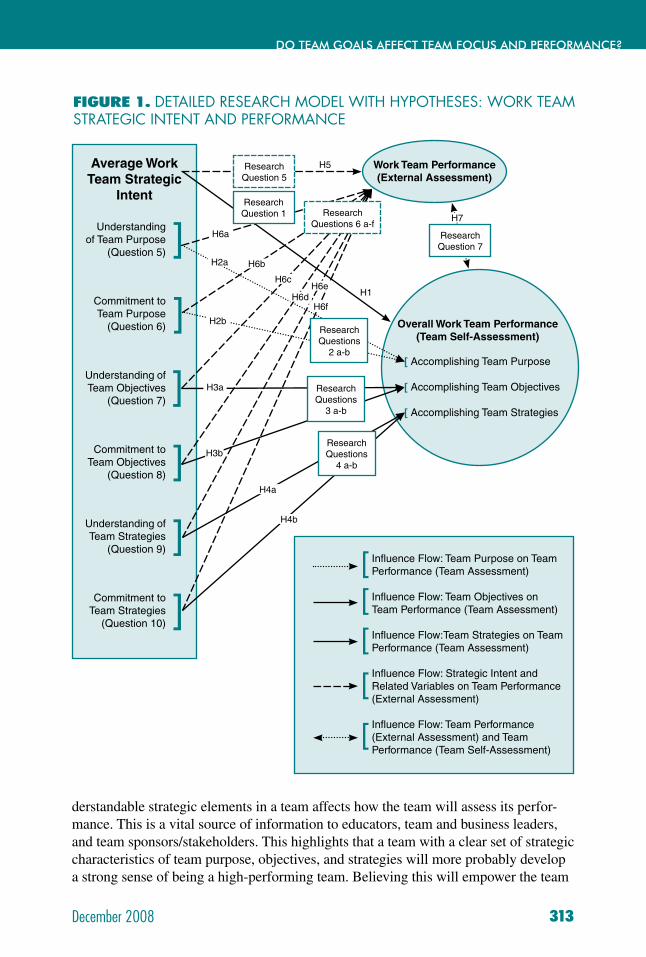
December 2008
DO TEAM GOALS AFFECT TEAM FOCUS AND PERFORMANCE?
313
derstandable strategic elements in a team affects how the team will assess its perfor-mance. This is a vital source of information to educators, team and business leaders, and team sponsors/stakeholders. This highlights that a team with a clear set of strategic characteristics of team purpose, objectives, and strategies will more probably develop a strong sense of being a high-performing team. Believing this will empower the team
FIGURE 1. DETAILED RESEARCH MODEL WITH HYPOTHESES: WORK TEAM STRATEGIC INTENT AND PERFORMANCE
Overall Work Team Performance (Team Self-Assessment)
[ Accomplishing Team Purpose
[ Accomplishing Team Objectives
[ Accomplishing Team Strategies
Work Team Performance (External Assessment)
Research Question 7
H7
Average WorkTeam Strategic
Intent
Understanding of Team Purpose
(Question 5)
Commitment to Team Purpose
(Question 6)
Understanding of Team Objectives
(Question 7)
Commitment to Team Objectives
(Question 8)
Understanding of Team Strategies
(Question 9)
Commitment to Team Strategies
(Question 10)
]
]
]
]
]
]
Research Question 5
H1
Research Question 1
Research Questions
2 a-b
Research Questions
4 a-b
H6d
H5
H6a
H6bH2a
H6e
H6f
H3b
H4a
H4b
Research Questions 6 a-f
Research Questions
3 a-b
H2b
H6c
H3a
Infl uence Flow: Team Purpose on Team Performance (Team Assessment)
Infl uence Flow: Team Objectives on Team Performance (Team Assessment)
Infl uence Flow:Team Strategies on Team Performance (Team Assessment)
Infl uence Flow: Strategic Intent and Related Variables on Team Performance (External Assessment)
Infl uence Flow: Team Performance (External Assessment) and Team Performance (Team Self-Assessment)
[[[
[
[
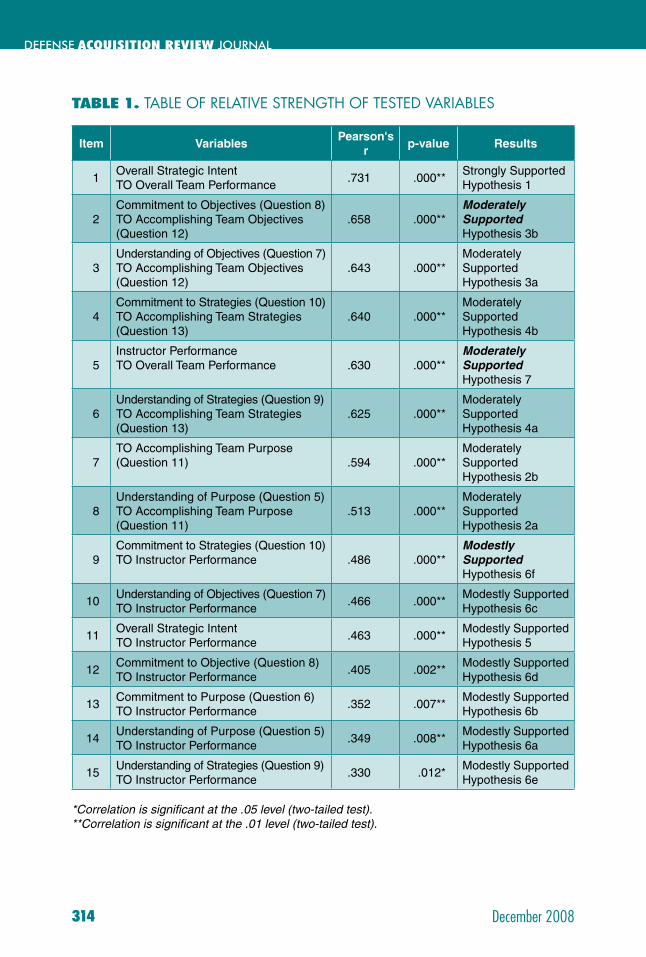
DEFENSE ACQUISITION REVIEW JOURNAL
314 December 2008
TABLE 1. TABLE OF RELATIVE STRENGTH OF TESTED VARIABLES
Item VariablesPearson's
rp-value Results
1Overall Strategic IntentTO Overall Team Performance
.731 .000**Strongly Supported Hypothesis 1
2Commitment to Objectives (Question 8)TO Accomplishing Team Objectives (Question 12)
.658 .000**Moderately Supported Hypothesis 3b
3Understanding of Objectives (Question 7)TO Accomplishing Team Objectives (Question 12)
.643 .000**Moderately Supported Hypothesis 3a
4Commitment to Strategies (Question 10)TO Accomplishing Team Strategies (Question 13)
.640 .000**Moderately Supported Hypothesis 4b
5Instructor PerformanceTO Overall Team Performance .630 .000**
Moderately Supported Hypothesis 7
6Understanding of Strategies (Question 9)TO Accomplishing Team Strategies (Question 13)
.625 .000**Moderately Supported Hypothesis 4a
7TO Accomplishing Team Purpose (Question 11) .594 .000**
Moderately Supported Hypothesis 2b
8Understanding of Purpose (Question 5)TO Accomplishing Team Purpose (Question 11)
.513 .000**Moderately Supported Hypothesis 2a
9Commitment to Strategies (Question 10)TO Instructor Performance .486 .000**
Modestly Supported Hypothesis 6f
10Understanding of Objectives (Question 7)TO Instructor Performance
.466 .000**Modestly Supported Hypothesis 6c
11Overall Strategic Intent TO Instructor Performance
.463 .000**Modestly Supported Hypothesis 5
12Commitment to Objective (Question 8)TO Instructor Performance
.405 .002**Modestly Supported Hypothesis 6d
13Commitment to Purpose (Question 6)TO Instructor Performance
.352 .007**Modestly Supported Hypothesis 6b
14Understanding of Purpose (Question 5)TO Instructor Performance
.349 .008**Modestly Supported Hypothesis 6a
15Understanding of Strategies (Question 9)TO Instructor Performance
.330 .012*Modestly Supported Hypothesis 6e
*Correlation is signifi cant at the .05 level (two-tailed test).**Correlation is signifi cant at the .01 level (two-tailed test).
December 2008
DO TEAM GOALS AFFECT TEAM FOCUS AND PERFORMANCE?
315
to greater team results and even more focused performance. This should also produce better results for the organizations that sponsor them. The leader of this team also needs to know that a focused, intent team will believe it will perform well.
The strength of the relationship between Strategic Intent (SI) and Team Performance at .731 (a strong relationship) is compared to the same relationship between Strategic In-tent and Instructor-Assessed Performance at .463 (modest relationship/correlation). This indicates that team strategic thinking has a greater relationship to or effect upon Team-Assessed Team Performance than its effect on Instructor-Assessed Team Performance. The strength of team Strategic Intent on the instructors’ assessment is signifi cant none-theless and indicates that team strategic thinking not only affects Team Performance, but also how the team’s instructors assessed the team’s performance.
Additional correlation tests highlight that when the individual Strategic Intent questions (5–10) are compared to the overall Team-Assessed Team Performance, sig-nifi cant relationships occur. In fact, the results of these tests are similar in strength to the results obtained on the tests between the Strategic Intent questions to their related individual Team-Assessed Team Performance questions (11–13).
In summary, all but one of the tests was signifi cant at .05 level of signifi cance or .95 confi dence level. The tests highlighted that in general, strategic intent of the teams was positively correlated or related to both team-assessed team performance and instructor-assessed performance.
ADDITIONAL FINDINGS ON DEMOGRAPHICS DATA
Additional tests were conducted on the measured demographic information and its relationship to overall team Strategic Intent, Team-Assessed Team Performance, and Instructor-Assessed Team Performance. Twelve tests were conducted and only 3 tests were supported at the 95 percent confi dence level. Two supported tests related Team Educational Level to Team-Assessed Team Performance and to Instructor-As-sessed Team Performance. Other correlation tests indicated a positive relationship between Team Educational Level and overall Team-Assessed Team Performance and Instructor-Assessed Team Performance at a 95 percent confi dence level. Educational level can make a difference in Team Performance, both as assessed by the team itself and by the instructors. Although not signifi cant at .05, there is also a positive effect or correlation on overall Team Strategic Intent by team Educational Level. Although not statistically signifi cant, there does appear to be some indication that using teams is an effective learning technique in education, and business leaders employing teams in their organizations who want to enhance strategic implementation of corporate stra-tegic goals and initiatives should be aware that teams with higher educational levels tend to have higher Team Strategic Intent (correlation of .239), higher overall Team-Assessed Team Performance (correlation of .296), and higher Instructor-Assessed Team Performance (correlation/modest of .441). Educational Level has a positive effect/correlation on these three research variables. Education has a rather signifi cant effect on Instructor-Assessed Team Performance (correlation of .441).
DEFENSE ACQUISITION REVIEW JOURNAL
316 December 2008
Team age and years of experience have a negative effect on Team Strategic Intent, on overall Team-Assessed Team Performance, and on Instructor-Assessed Team Performance. The strength of the relationships is low, and the signifi cance levels are high. No relationship was supported at the .05 signifi cance level. Although not sup-ported statistically at .05 signifi cance level, this was of interest to the researcher. Age and experience have negative relationships to all the research variables: Strategic In-tent, Team-Assessed Team Performance, and Instructor-Assessed Team Performance.
There is a moderately strong relationship between Team Experience and Team Age (correlation of .643). This is logical and passed the common sense test. The results do not affect this research but highlight the strength of the survey data to develop conclusions regarding the survey sample.
CONCLUSIONS
The main conclusions in this research follow:1. A statistically signifi cant relationship exists between the overall team Strategic
Intent and overall Team-Assessed Team Performance. Teams that have high overall team Strategic Intent (team purpose, objectives, and strategies) also have high overall Team-Assessed Team Performance.
2. A statistically signifi cant relationship exists between the individual team Strategic Intent questions (5–10) and overall Team-Assessed Team Performance. Teams that have high results on individual team Strategic Intent questions (5–10) also have high results on overall Team-Assessed Team Performance. More focused teams perform better.
3. A statistically signifi cant relationship exists between the individual team Stra-tegic Intent questions (5–10) and individual Team-Assessed Team Performance questions (11–13). Teams that have high results on individual team Strategic Intent questions (5–10) also have high results on individual Team-Assessed Team Performance questions (11–13).
4. A statistically signifi cant relationship exists between the overall team Strategic Intent and overall Instructor-Assessed Team Performance (Question 4). Teams that have high overall team Strategic Intent (team purpose, objectives, and strate-gies) also have high Instructor-Assessed Team Performance (Question 4).
5. A statistically signifi cant relationship exists between the individual team Strate-gic Intent questions (5–10) and individual Instructor-Assessed Team Performance (Question 4). Teams that possessed high scores on each individual’s Questions 5–10 dealing with team Strategic Intent also had high Instructor-Assessed Team Performance.
6. A statistically signifi cant relationship exists between the overall Team-Assessed Team Performance (Questions 11–13) and overall Instructor-Assessed Team Performance (Question 4). Teams that have high overall Team-Assessed Team Performance (Questions 11–13) also have high Instructor-Assessed Team Perfor-mance (Question 4).
December 2008
DO TEAM GOALS AFFECT TEAM FOCUS AND PERFORMANCE?
317
7. A statistically signifi cant relationship exists between the overall Team-Educa-tional Level and overall Instructor-Assessed Team Performance (Question 4). Teams that have high overall Team Educational Level also have high Instructor-Assessed Team Performance (Question 4). There is some indication (supported at .05 signifi cance level) that there is also a relationship between the overall Team Educational Level and both overall Team-Assessed Team Performance (Ques-tions 11–13) (supported at .05 signifi cance level) and overall Strategic Intent (Questions 5–10) (not supported at .05 signifi cance level). The more educated the team, the higher the team performance.
8. There is some indication (not supported at .05 signifi cance level) that an indi-rect or negative relationship also exists between the overall Team Average Age and all of the following: (a) overall team Strategic Intent (Questions 5–10), (b) overall Team-Assessed Team Performance (Questions 11–13), and (c) overall Instructor-Assessed Team Performance (Question 4). The older the team, the lower the team performance.
9. There is some indication (not supported at .05 signifi cance level) that an indirect or negative relationship also exists between the overall Team Average Years Ex-perience and all the following: (a) overall team Strategic Intent (Questions 5–10), (b) overall Team-Assessed Team Performance (Questions 11–13), and (c) overall Instructor-Assessed Team Performance (Question 4). The strengths of these rela-tionships and signifi cance levels do not allow for statistical signifi cance of these relationships. The interesting aspect of these studies highlights that with more data and research, age and experience may have statistically signifi cant negative effects on the research variables of overall team Strategic Intent, Team-Assessed Team Performance, and Instructor-Assessed Team Performance.
CONCLUDING STATEMENT
Teams can be a signifi cant resource to business leaders and lead to greater program successes. Using teams can be one of the most potent tools for program managers—readily available to all. Little empirical data exist on what strategic characteristics make teams more effective. Does a work team’s success depend on how strategically focused or intent the team is? Do team-developed purpose, objec-tives, and strategies (strategic intent) have an effect on how well teams perform? This research study hypothesized and proved that work team strategic intent characteris-tics (team-developed purpose, objectives, and strategies) were directly or positively related to the performance of student work teams.
Signifi cant positive correlation relationships were found in all 15 studied hypoth-eses between work team strategic intent and team performance, as measured by team self-assessments and instructor assessments. Additionally, a positive correlation was found between the team self-assessment of performance and the instructors’ assess-ment of the team performance.
The research provided signifi cant empirical data on the positive correlation relationships between work team strategic intent and work team performance. It
DEFENSE ACQUISITION REVIEW JOURNAL
318 December 2008
Dr. Thomas R. Edison, currently the Academic Chair for Life Cycle Logistics at Defense Acquisition University West Region, San Diego, CA, has a doctorate from Alliant International University in Strategic Management, a master’s degree in Logistics Management from Air Force Institute of Technology, and a master’s degree in Education from Chapman University. He is a Certifi ed Professional Logistician by the International Society of Logistics. Dr. Edison has more than 37 years’ experience in acquisition and logistics.
(E-mail address: [email protected])
AUTHOR BIOGRAPHY
also defi ned the characteristics that were used to determine the strategic intent of a work team or any work unit. It created empirical support for Katzenbach and Smith’s theories from their studies in The Wisdom of Teams: Creating the High-Performance Organization (2003) on the success of real teams, based on being committed to a common purpose and performance goals. Additionally, it created a survey to measure the strategic intent of team members and teams in general. Finally, it introduced the study of strategic thinking or use of strategic intent as a method or process for evalu-ating team performance.
The complexity of team performance and the large number of future potential infl uences and additional areas of research needed on teams were highlighted in the research. This may help explain why so many organizations using teams in both the public and private sector today are having diffi culty as they try to reposition them-selves in an ever more turbulent environment, and why teams are often not as effec-tive or successful as possible.
Properly disciplined, focused, and integrated teams are the ones that become high performing teams, and are considered “the most versatile unit organizations have for meeting both performance and challenges in today’s complex world” (Katzenbach & Smith, 2003, p. xiii). This study has identifi ed that Strategic Intent or clearly focused team purpose, objectives, and strategies can make teams more high performing and even more versatile and effective in an organization—both in the short- and long-term.

December 2008
DO TEAM GOALS AFFECT TEAM FOCUS AND PERFORMANCE?
319
REFERENCES
Bennis, W. G. (1985). Leaders: The strategies for taking charge. New York: Harper and Row.
Bennis, W. G., & Biederman, P. W. (1997). Organizing genius: The secrets of creative collaboration. Reading, MA: Addison-Wesley.
Beyerlein, M. (1995). Measuring team performance: The literature. Work Team News-letter, 5(3), 93–99. Denton, TX: University of North Texas.
Hamel, G., & Prahaland, C. (1989, May-June). Strategic intent. Harvard Business Review, 67(3), 63–76.
Katzenbach, J. R., & Smith, D. K. (2003). The wisdom of teams: Creating the high-performance organization. New York: Harper Collins Publishers.
Kraft, R. (1996). The relationship of team leadership and work team performance. Unpublished doctoral dissertation, The George Washington University, Washing-ton, DC.
Podsakoff, P. M., & Organ, D. W. (1986, Winter). Self-reports in organizational research: Problems and prospects. Journal of Management, 12(4), 531–542.

320 December 2008
CALL FOR AUTHORSWe are currently soliciting articles and subject matter experts for the 2009 Defense Acquisition Review Journal (ARJ) print year. Please see our guidelines for contributors for submission deadlines.
Even if your agency does not require you to publish, consider these career-enhancing possibilities:• Share your acquisition research results
with the Defense Acquisition Workforce.• Change the way DoD does business.• Help others avoid pitfalls with lessons
learned or best practices from your project or program.
• Teach others with a step-by-step tutorial on a process or approach.
• Share new information that your program has uncovered or discovered through the implementation of new initiatives.
• Condense your graduate project into something useful to the Defense Acquisition Workforce.
Enjoy these benefi ts:• Earn 25 continuous learning points for
publishing in a refereed journal.• Get promoted or rewarded.• Become part of a focus group ss shhaharingnggg
similar interests.• Become a nationally recognized eeeexpxpxppxppererererererttt t t
in your fi eld or speciality.y.y.y• Be asked to speak at aaaa confef rerencncnce ee orororo
symposium.
We invite all Defense Acquisition Workforce
professionals to submit an article based on research, lessons learned,
opinion, or tutorial.
If you are interested, contact the Defense ARJ managing editor ([email protected]) and provide contact information and a brief description of your article. Please visit
the guidelines for authors at http://www.dau.mil/pubs/arq/arqart.asp.
December 2008 321
DEFENSE ARJ GUIDELINES FOR CONTRIBUTORS
DEFENSE ARJGUIDELINES FOR CONTRIBUTORS
The Defense Acquisition Review Journal (ARJ) is a scholarly peer-reviewed journal published by the Defense Acquisition University (DAU). All submissions receive a blind review to ensure impartial evaluation.
IN GENERAL
We encourage prospective authors to coauthor with others to add depth to their submissions. It is recommended that a mentor be selected who has published before or has expertise in the subject presented in the manuscript.
Authors should become familiar with the construction of previous Defense ARJs and adhere to the use of endnotes versus footnotes, formatting of bibliographies, and the use of designated style guides. It is also the responsibility of the corresponding author to furnish government agency/employer clearance with each submission.
SUBMISSIONS
We welcome submissions from anyone involved in the defense acquisition process. Defense acquisition is defi ned as the conceptualization, initiation, design, development, testing, contracting, pro duction, deployment, logistic support, modifi cation, and disposal of weapons and other systems, supplies, or services needed by the Department of Defense (DoD), or intended for use to support military missions.
RESEARCH ARTICLES
Manuscripts should refl ect research or empirically supported experience in one or more of the aforementioned areas of acquisition. Research, lessons learned, or tutorial articles should not exceed 4,500 words. Opinion articles should be limited to 1,500 words.
Research articles are characterized by a systematic inquiry into a subject to discover/revise facts or theories.

DEFENSE ACQUISITION REVIEW JOURNAL
322 December 2008
MANUSCRIPT SECTIONS
A brief abstract (120-word limit) provides a compre hensive summary of the article and must accompany your submission. Abstracts give readers the opportunity to quickly review an article’s content and also allow information services to index and retrieve articles.
The introduction, which should not be labeled, opens the body of the paper and states the problem being studied and the rationale for the research undertaken.
The methods section should include a detailed methodology that clearly describes work performed. Although it is appropriate to refer to previous publications in this section, the author should provide enough information so that the experienced reader need not read earlier works to gain an understanding of the methodology.
The results section should concisely summarize fi ndings of the research and follow the train of thought established in the methods section. This section should not refer to previous publications, but should be devoted solely to the current fi ndings of the author.
The discussion section should emphasize the major fi ndings of the study and its signifi cance. Information presented in the aforementioned sections should not be repeated.
RESEARCH CONSIDERATIONS
Contributors should also consider the following questions in reviewing their research-based articles prior to submission:
Is the research question signifi cant?
Are research instruments reliable and valid?
Are outcomes measured in a way clearly related to the variables under study?
Does the research design fully and unambiguously test the hypothesis?
Are needed controls built into the study?
Contributors of research-based submissions are also reminded they should share any materials and methodologies necessary to verify their conclusions.
CRITERIA FOR TUTORIALS
Tutorials should provide special instruction or knowledge relevant to an area of defense acquisition to be of benefi t to the Defense Acquisition Workforce.
Topics for submission should rely on or be derived from observation or experiment, rather than theory. The submission should provide knowledge in a particular area for a particular purpose.
December 2008
DEFENSE ARJ GUIDELINES FOR CONTRIBUTORS
323
OPINION CRITERIA
Opinion articles should refl ect judgments based on the special knowledge of the expert and should be based on observable phenomena and presented in a factual manner; that is, submissions should imply detachment. The observation and judgment should not refl ect the author’s personal feelings or thoughts. Nevertheless, an opinion piece should clearly express a fresh point of view, rather than negatively criticize the view of another previous author.
MANUSCRIPT STYLE
We will require you to recast your last version of the manuscript, especially citations (endnotes instead of footnotes), into the format required in two specifi c style manuals. The ARJ follows the author (date) form of citation. We expect you to use the Publication Manual of the American Psychological Association (5th Edition), and the Chicago Manual of Style (15th Edition).
Contributors are encouraged to seek the advice of a reference librarian in completing citations of government documents because standard formulas of citations may provide incomplete information in reference to government works. Helpful guidance is also available in Garner, D. L. and Smith, D. H., 1993, The Complete Guide to Citing Government Documents: A Manual for Writers and Librarians (Rev. Ed.), Bethesda, MD: Congressional Information Service, Inc.
COPYRIGHT INFORMATION
The ARJ is a publication of the United States Government and as such is not copyrighted. Because the ARJ is posted as a complete document on the DAU home page, we will not accept copyrighted articles that require special posting requirements or restrictions. If we do publish your copyrighted article, we will print only the usual caveats. The work of federal employees undertaken as part of their offi cial duties is not subject to copyright except in rare cases.
In citing the work of others, it is the contributor’s responsibility to obtain permission from a copyright holder if the proposed use exceeds the fair use provisions of the law (see U.S. Government Printing Offi ce, 1994, Circular 92: Copyright Law of the United States of America, p. 15, Washington, DC: Author). Contributors will be required to submit a copy of the written permission to the Managing Editor before publication.
COPYRIGHT POLICY
We reserve the right to decline any article that falls into these problem copyright categories:
The author cannot obtain offi cial permission to use previously copyrighted material in the article.
DEFENSE ACQUISITION REVIEW JOURNAL
324 December 2008
The author will not allow DAU to post the article with the rest of the ARJ issue on our home page.
The author requires that unusual copyright notices be posted with the article.
To publish the article requires copyright payment by the DAU Press.
MANUSCRIPT FORMAT
Pages should be double-spaced and organized in the following order: title page, abstract, body, reference list, author’s note (if any), and fi gures or tables. Figures or tables should not be inserted (or embedded, etc.) into the text, but segregated (one to a page) following the text. If material is submitted on a computer diskette or e-mailed, each fi gure or table should be saved to a separate, exportable fi le (i.e., a readable EPS fi le). For additional information on the preparation of fi gures or tables, see CBE Scientifi c Illustration Committee, 1988, Illustrating Science: Standards for Publication, Bethesda, MD: Council of Biology Editors, Inc. Please restructure briefi ng charts and slides to a look similar to those in previous issues of the ARJ.
The author (or corresponding author in cases of multiple authorship) should attach to the manuscript a signed cover letter that provides all of the authors’ names, mailing and e-mail addresses, telephone and fax numbers. The letter should verify that the submission is an original product of the author; that it has not been published before; and that it is not under consideration by another publication. Details about the manuscript should also be included in this letter: for example, title, word length, a description of the computer application programs, and fi le names used on enclosed diskettes or in e-mail attachments, etc.
AUTHOR PHOTOS
Please send us a cover letter; biographical sketch for each author (not to exceed 70 words); head and shoulder print(s) or digitized photo(s) (saved at 300 pixels per inch, at least 5 X 7 inches, and as a TIFF or JPEG fi le); prints of photos will be accepted and returned upon request; one copy of the printed manuscript; and any diskettes. These items should be sturdily packaged and mailed to: Department of Defense, Defense Acquisition University, Attn: DAU Press (Defense ARJ Managing Editor), Suite 3, 9820 Belvoir Road, Fort Belvoir, VA 22060-5565.
DEFENSE ARJ PRINT SCHEDULE
2009
The Defense ARJ is published in quarterly theme editions. Please consult the DAU home page for current themes being solicited. See print schedule below.

December 2008
DEFENSE ARJ GUIDELINES FOR CONTRIBUTORS
325
Due Date Publication Date
July 1, 2008 January 2009
November 15, 2008 April 2009
January 2, 2009 July 2009
April 1, 2009 October 2009
In most cases, the author will be notifi ed that the submission has been received within 48 hours of its arrival. Following an initial review, submissions will be referred to referees and for subsequent consideration by the Executive Editor, Defense ARJ.
Contributors may direct their questions to the Managing Editor, Defense ARJ, at the address shown above, or by calling 703-805-3801 (fax: 703-805-2917), or via the Internet at [email protected].
The DAU Home Page can be accessed at: http://www.dau.mil.

Defense Acquisition University Web Sitehttp://www.dau.mil Your Online Access to Acquisition
Research, Consulting, Information, and Course Offerings
DAU Homepage• Performance Learning Model• ACQuire• DAU Online Resources Tour
I Need Training• General Information• Course Schedules• Apply for a Course• Pre-Course Information• Login—Distance Learning Courses • Browse Distance Learning Courses
Continuous Learning• Register for Continuous Learning Modules• Browse Continuous Learning Modules• Login – Continuous Learning Modules• Conferences and Symposiums
Knowledge Sharing• Acquisition Community Connection (ACC)• AT&L Knowledge Sharing System (AKSS)• DAU Virtual Library
Performance Support• Description and Contacts• Consulting• Facilitated Decision Making• Rapid Deployment Training• Targeted Training• Ask a Professor (AAP)
Now you can search the DAU Web site and our online publications!
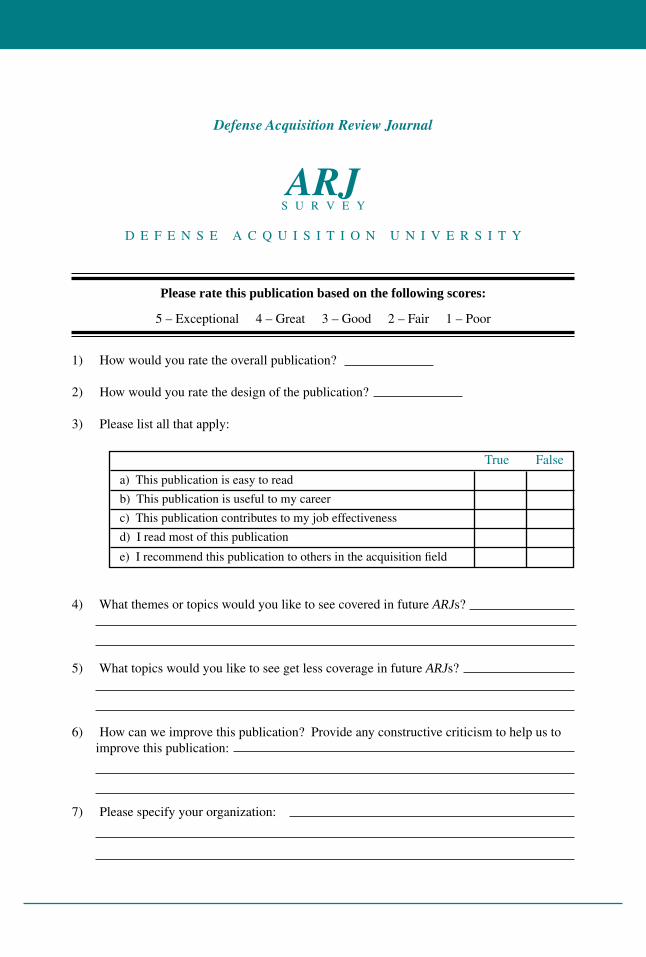
Defense Acquisition Review Journal
ARJS U R V E Y
D E F E N S E A C Q U I S I T I O N U N I V E R S I T Y
Please rate this publication based on the following scores:
5 – Exceptional 4 – Great 3 – Good 2 – Fair 1 – Poor
1) How would you rate the overall publication?
2) How would you rate the design of the publication?
3) Please list all that apply:
True False
a) This publication is easy to read
b) This publication is useful to my career
c) This publication contributes to my job effectiveness
d) I read most of this publication
e) I recommend this publication to others in the acquisition field
4) What themes or topics would you like to see covered in future ARJs?
5) What topics would you like to see get less coverage in future ARJs?
6) How can we improve this publication? Provide any constructive criticism to help us to improve this publication:
7) Please specify your organization:

First initialof last name
Defense ARJQuantity ______
Defense AT&LQuantity ______
New Subscription
Cancellation
Change of Address
Date Form Completed
Last Name
First Name
New Address
Old Address
Day/Work Phone
Signature (Required)
PLEASE MAIL OR FAX TO: 703-805-2917
The Privacy Act and Freedom of Information Act
If you provide us your business address, you may become part of mailing lists we are
required to provide to other agencies who request the lists as public information.
If you prefer not to be part of these lists, use your home address. Please do not in-
clude your rank, grade, service, or other personal identifiers.
Defense Acquisition Review Journal
ARJS U B S C R I P T I O N


Insert Cover


![Effects of incentive contracts in research and - [email protected]](https://img.pdfslide.net/doc/110x75/62073a5549d709492c2f3dd6/effects-of-incentive-contracts-in-research-and-emailprotected.jpg)
