Embed Size (px)
Citation preview

May 2013
Greater Mekong Subregion Development Analysis Network
INCLUSIVE DEVELOPMENT
IN THE GREATER MEKONG
SUBREGION : AN ASSESSMENT
Cambodia Development Resource Institute (CDRI), Cambodia
Lao Statistics Bureau (LSB), Lao PDR
National Economic Research Institute (NERI), Lao PDR
Thailand Development Research Institute (TDRI), Thailand
Central Institute for Economic Management (CIEM), Vietnam
Vietnam Institute of Economics (VIE), Vietnam Academy of Social Sciences (VASS), Vietnam
Faculty of Management and Economics (FME), Kunming University of Science and Technology (KUST), Yunnan Province of China
A GMS-DAN Publication Phnom Penh, February 2014
Greater Mekong Subregion Development Analysis Network (GMS-DAN) with Support from the Rockefeller Foundation and International Development Research Centre (IDRC)
Yunnan Province
CHINA
VIETNAM
LAOS
THAILAND
CAMBODIA
MYANMAR
Guangxi Zhuang Autonomous Region
Yangon
Bangkok
Hanoi
Kunming
Nanning
Phnom Penh
Vientiane


INCLUSIVE DEVELOPMENT IN THE GREATER MEKONG
SUBREGION: AN ASSESSMENT
A GMS-DAN PublicationPhnom Penh, February 2014
Greater Mekong Subregion Development Analysis Network

© 2014 Greater Mekong Subregion Development Analysis Network (GMS-DAN)
All rights reserved. No part of this publication may be reproduced, stored in a retrieval system or transmitted in any form or by any means—electronic, mechanical, photocopying, recording, or otherwise—without the written permission of the GMS-DAN and its member institutions.
The designations employed in GMS-DAN publications and the presentation of material contained therein do not imply any expression whatsoever on the part of the GMS-DAN or its member institutions concerning the legal status of any country, territory, city or area or its authorities, or concerning the delimitation of its frontiers or boundaries.
The responsibility for opinions expressed in signed articles, studies and other contributions rests solely with their authors, and publication does not necessarily constitute an endorsement by the GMS-DAN, its member institu-tions, or its donors.
ISBN-10: 99950–52–90-4
Inclusive Development in the Greater Mekong Subregion: An Assessment
February 2014
This work was carried out with the aid of a grant from the Rockefeller Foundation and International Development Research Centre (IDRC).
Suggested citation: Authors (2014), “Title of Chapter”, in CDRI (2014), Inclusive Development in the Greater Mekong
Subregion: An Assessment (Phnom Penh: CDRI)
Editing: Allen Myers, Jan Taylor and Susan WatkinsCover design and Layout: Oum ChanthaPrinted and Bound in Cambodia by Angkor Offset Printing

LIST OF AUTHORS
Jayant Menon Lead Economist, ADB
Cambodia
Srinivasa Madhur Director of Research, CDRIRoth Vathana Research Associate, CDRILun Pide Research Associate, CDRI
Lao PDR
Leeber Leebuapao Director General, NERIPhetsamone Sone Deputy Director, LSBVanthana Nolintha Researcher, NERIAmphaphone Sayasenh Researcher, NERIKorakoon Silaphet Researcher, LSBPhetsavanh Boutlasy Researcher, LSB
Thailand
Srawooth Paitoonpong Senior Research Fellow, TDRIJirawat Panpiemras Research Fellow, TDRIPloycarat Nana Researcher, TDRIJanjira Sodasith Researcher, TDRI
Vietnam
Nguyen Thi Kim Dung Senior Researcher, CIEMTran Trung Hieu Senior Researcher, CIEMDo Son Tung Researcher, VIE-VASS
Yunnan Province, China
Wen Shuhui Dean, FME-KUSTXiong Bin Associate Professor, FME-KUSTJiang Yapeng Lecturer

vii
Table of Contents
List of figures, Table and appendices ..................................................................................xivAcronyms and Abbreviations ..................................................................................................xxForward ......................................................................................................................................xxi
Chapter 1. Growth, Development and Inclusion in the Greater Mekong Subregion: An Assessment ............................................1
1. Introduction ...................................................................................................22. Inclusive Growth: Conceptual Underpinnings ........................................4
2.1. How Different is it from Pro-poor Growth? ...................................52.2. Does Growth Increase Inequality? .....................................................52.3. Does Inequality Hinder Growth? .......................................................62.4. Does Inequality Beget More Inequality? ...........................................7
3. Income Inclusiveness ...................................................................................83.1. Per capita Income .................................................................................83.2. Structure of the Economy ..................................................................93.3. Poverty ..................................................................................................103.4. Income Inequality and Polarisation ..................................................133.5. Human Development .........................................................................15
4. Health ...........................................................................................................154.1. Life Expectancy ...................................................................................154.2. Maternal and Child Mortality ............................................................174.3. Contagious Diseases and Diet ..........................................................204.4. Public Expenditure on Health ..........................................................22
5. Education .....................................................................................................235.1. Literacy Rates .......................................................................................235.2. Enrolment Rates .................................................................................245.3. Schooling and Learning .....................................................................265.4. Public Expenditure on Education ....................................................28
6. Gender, Water, Sanitation and Other Basic Necessities .......................286.1. Gender Equality ..................................................................................286.2. Improved Water...................................................................................306.3. Improved Sanitation ...........................................................................306.4. Electricity and Cooking Fuel .............................................................316.5. Social Protection .................................................................................32
7. Conclusions..................................................................................................33References ........................................................................................................36

viii
Chapter 2. Inclusive Development in Cambodia: An Assessment ...39
1. Introduction .................................................................................................401.1. Growth, Poverty and Inequality ........................................................401.2. Growth, Poverty and Inequality in Cambodia’s Development ....401.3. Objectives, Rationale and Structure .................................................41
2. Literature review ........................................................................................432.1. Growth, Poverty and Inequality ........................................................432.2. Inclusive Growth .................................................................................46
3. Theoretical Framework ..............................................................................474. Data ...............................................................................................................475. Indicators of Well-Being and Capability, CPI and Poverty Lines ......49
5.1. Indicators of Interest .........................................................................495.2. CPI and Poverty Lines ......................................................................49
6. Poverty Profile Analysis .............................................................................506.1. Updates on per Capita Household Consumption ........................506.2. Poverty Estimates ..............................................................................51
6.2.1. Consumption Dimension .......................................................516.2.2. Non-Consumption Dimensions ............................................52
6.3. Inequality Estimates of Household per Capita Consumption ...537. Pro-Poor Growth .......................................................................................54
7.1. Consumption .....................................................................................547.2. Non-Consumption ............................................................................57
8. Constraints on Inclusive Growth .............................................................599. Conclusion and Recommendations ........................................................60References ........................................................................................................63Annexes ............................................................................................................66
Annex Tables ...............................................................................................66Annex Figures .............................................................................................78
Appendix A ......................................................................................................86Appendix B ......................................................................................................88Appendix C ......................................................................................................92Appendix D......................................................................................................92Appendix E ......................................................................................................93
Chapter 3. Inclusive Development in Lao PDR: An Assessment ......96
1. Introduction .................................................................................................972. Income-Based Assessment of Growth Inclusiveness ...........................98
2.1. Economic Growth and Structure .....................................................982.1.1. Growth .......................................................................................982.1.2. Structural Change .....................................................................992.1.3. Conclusion on Economic Growth and
Structural Change ...................................................................1002.2. Productive Employment ..................................................................100
ix
2.2.1. Sectoral Distribution of Labour Force ...............................1002.2.2. Labour Productivity ...............................................................1012.2.3. Vulnerable Employment .......................................................1022.2.4. Conclusion on Productive Employment ............................102
2.3. Poverty Profile ...................................................................................1022.3.1. Poverty Headcount ...............................................................1022.3.2. Food Poverty ...........................................................................1042.3.3. Poverty Gap ............................................................................1062.3.4. Poverty Severity Index ...........................................................1072.3.5. Conclusion on Poverty Measures ........................................108
2.4. Inequality ............................................................................................1082.4.1. Gini Coefficient ......................................................................1082.4.2. Growth and Inequality Effect on Poverty Reduction ......1102.4.3. Consumption Quintiles and Growth Incidence Curve ....1112.4.4. Theil Coefficient .....................................................................1122.4.5. Conclusion on Inequality Measures ....................................112
3. Non-Income-Based Assessment of Growth Inclusiveness ..............1133.1. Access to Economic Resources ......................................................113
3.1.1. Access to Electricity ...............................................................1133.1.2. Access to Land .......................................................................1133.1.3. Access to Roads ......................................................................1143.1.4. Asset Ownership ....................................................................1143.1.5. Conclusion on Access to Economic Resources ................116
3.2. Enhancing Human Capabilities ......................................................1163.2.1. Education ................................................................................1163.2.2. Health .......................................................................................1173.2.3. Nutrition ..................................................................................1193.2.4. Sanitation .................................................................................1193.2.5. Conclusion on Enhancing Human Capabilities ................120
3.3. Gender Equality ................................................................................1213.3.1. Access to Education ..............................................................1213.3.2. Access to Productive Employment .....................................1223.3.3. Conclusion on Gender Equality .........................................122
3.4. Social Safety Nets ..............................................................................1223.4.1. Conclusion on Social Protection .........................................124
4. Inclusiveness Composite Index ..............................................................1254.1. Growth, Employment Generation and Economic
Infrastructure .....................................................................................1254.2. Poverty and Inequality ......................................................................1264.3. Human Capabilities...........................................................................1264.4. Social Protection ...............................................................................126
5. Challenges ..................................................................................................1276. Conclusion ................................................................................................129References ......................................................................................................130
x
Chapter 4. Inclusive Development in Thailand: An Assessment ....131
1. Introduction ...............................................................................................1322. Income Dimension ...................................................................................132
2.1. Economic Growth ............................................................................1322.2. Poverty ................................................................................................1342.3. Income Inequality .............................................................................1362.4. Pro-Poor Growth in Thailand .........................................................141
3. Non-Income Dimension .........................................................................1433.1. Access to Economic Opportunities ...............................................143
3.1.1. Education ................................................................................1433.1.2. Health .......................................................................................1443.1.3. Productive Employment .......................................................1463.1.4. Information and Communication Technology .................147
3.2. Social Safety Nets ..............................................................................1483.2.1. Older Person Allowance (OPA) ...........................................1493.2.2. Disability Allowance ..............................................................1503.2.3. HIV/AIDS Allowance ..........................................................151
3.3. Governance Indicators .....................................................................1523.4. Public Spending on Health and Education ...................................153
4. Index variables ...........................................................................................1544.1. Growth, Employment and Economic Infrastructure .................1544.2. Poverty and Inequality ......................................................................1554.3. Gender Equity ...................................................................................1554.4. Human Capabilities...........................................................................1564.5. Social Protection ...............................................................................156
5. Conclusion .................................................................................................156References ......................................................................................................157Appendix 1 ....................................................................................................159Appendix 2 ....................................................................................................162
Chapter 5. Inclusive Development in Vietnam: An Assessment ......168
1. Introduction ...............................................................................................1691.1. Background and Rationale ...............................................................1691.2. Objectives of the Study ...................................................................1701.3. Research Approach and Methodology ..........................................170
1.3.1. Definition of Poverty and Inclusiveness ...........................1701.3.2. Scope and Methodology .......................................................171
1.4. Organisation of the Report .............................................................1722. Current State of Economy ......................................................................173
2.1. Rapid Growth ....................................................................................1732.2. Macroeconomic Instability and Protection of the Poor .............174
3. Poverty Reduction and Inequality .........................................................175
xi
3.1. Income Poverty Reduction ..............................................................1753.1.1. Depth and Severity .................................................................1763.1.2. Regional Poverty Gap ...........................................................1773.1.3. Poverty by Ethnicity...............................................................178
3.2. Income Inequality .............................................................................1793.2.1. Gini Coefficient ......................................................................1793.2.2. Theil Indices ..........................................................................1793.2.3. Income Inequality by Quintiles ............................................1803.2.4. Theil L Index .........................................................................180
4. Non-Income Dimensions ........................................................................1814.1. Access to Education and Training..................................................1814.2. Access to Health Care .....................................................................1834.3. Productive Employment ..................................................................186
4.3.1. Labour Productivity ...............................................................1864.3.2. Productive Employment .......................................................1874.4. Economic Infrastructure ..........................................................1894.4.1. Access to Housing .................................................................1914.4.2. Access to Drinking Water .....................................................192
5. Social Protection ......................................................................................1935.1. Social Protection System ..................................................................193
5.1.1. Labour Market Support .......................................................1935.1.2. Social Security Component ...................................................1955.1.3. Social Assistance System ......................................................197
5.2. Government Expenditure on Social Protection .........................1996. Overall Assessment and Concluding Remarks .....................................200
6.1. Overall Assessment .........................................................................2006.2. Concluding Remarks.........................................................................200
References ......................................................................................................203
Chapter 6. Inclusive Development in Yunnan Province of China: An Assessment .......................................................................................205
1. Socio-Economic Development of Yunnan Province .........................2061.1. Economic Growth ............................................................................206
1.1.1. Real GDP Growth .................................................................2061.1.2. Per Capita GDP ....................................................................206
1.2. Economic Structure ........................................................................2061.3. Employment by Sectors ...................................................................206
2. Income and Distribution .........................................................................2082.1. Poverty Situation ..............................................................................2082.2. Income Gap .......................................................................................209
2.2.1. Urban per Capita Disposable Income and Rural per Capita Net Income .................................................................209
2.2.2. Theil Index ..............................................................................209

xii
3. Social Security, Health Care, Education and Credit ...........................2103.1. Social Security ....................................................................................2103.2. Health Care ........................................................................................2113.3 Education ............................................................................................2123.4. Credit ..................................................................................................213
4. Overall Assessment of Inclusive Growth .............................................2144.1. McKinley Index ................................................................................2144.2. Conclusion .........................................................................................216
Chapter 7. Inclusive Development in China: An Assessment ............217
1. China’s Socio-Economic Development ..............................................2181.1. Economic Growth and Regional Development Gap .................218
1.1.1. Real GDP Growth Rate .......................................................2181.1.2. Changes to GDP per Capita .................................................2181.1.3. Regional Economic Development Differences ................220
1.1.3.1. Comparative Analysis of Real GDP Growth in Eastern, Central and Western Regions ................220
1.1.3.2. Comparative Analysis of Real GDP per Capita Growth in Eastern, Central and Western Regions................................................220
1.2. Structure of Production .................................................................2211.3. Employment Changes in the Three Sectors ................................2221.4. Resource Use and Environmental Impact in China’s Economic
Growth ..............................................................................................2221.4.1. Per Unit Energy Consumption of GDP ...........................2221.4.2. Per Unit Output of Atmospheric Pollution .......................223
1.5. Urban and Rural Infrastructure Development .............................2241.5.1. Electricity Consumption in Urban and Rural Areas .........2241.5.2. Communications in Urban and Rural Areas .....................224
2. Pro-poor Income Growth and Distribution .......................................2252.1. The Poor Population ........................................................................225
2.1.1. International Poverty Standard ............................................2252.1.2. Government’s Poverty Standard ..........................................2252.1.3. Poverty on the International Standard ................................2262.1.4. Poverty Status Quo on China’s Poverty Standard .............226
2.2. Income Differences and Unequal Distribution ............................2282.2.1. Gini Coefficient ......................................................................2282.2.2. The Theil Index ......................................................................229
2.2.2.1. Research Methodology ............................................2292.2.2.2. Source of the Statistics ............................................2302.2.2.3. Results and Discussion ............................................231
2.2.3. Quintiles Measure ..................................................................234

xiii
3. Social Security, Health, Education and Financial Support ................2353.1. Current Situation of Social Security .............................................2353.2. Health..................................................................................................2363.3. Education ..........................................................................................2373.4. Governance .......................................................................................238
4. Comprehensive Assessment of China’s Inclusive Growth ...............2394.1. Construction and Calculations of the McKinley Index ............2394.2. Factors Impeding Inclusive Growth .............................................2414.3. Conclusion ........................................................................................242
References .....................................................................................................242
List of GMS -DAN Publications ...........................................................................243
xiv
LIST OF FIGURES, TABLE AND APPENDICES
Chapter 1Figure 1: Trends in Life Expectancy at Birth (years), 1994-2012 ....................................16Figure 2: Trends in Healthy Life Expectancy (years), 1990–2010 ...................................17Figure 3: Trends in Maternal Mortality Rate (per 100,000 live births), 1990–2010 ......17Figure 4: Births Attended by Skilled Health Staff (% of total), 2006-2011 ..................18Figure 5: Trends in Infant Mortality (per 1000 live births), 1994-2011 ..........................18Figure 6: Trends in Under-five Mortality (per 1000 live births), 1994-2011 ..................19Figure 7: Trends in the Incidence of Tuberculosis (per 100,000 people), 1994-2011 .20Figure 8: Trends in the Prevalence of HIV (% of population ages 15-49),
1994-2011 ................................................................................................................21Figure 9: Trends in Undernourishment (% of population), 1990/1992-2006/2011 ...22Figure 1 0: Trends in Public Expenditure on Health (% of GDP), 1995-2010 ...............23Figure 11: Trends in Youth Literacy Rate (% of people aged 15-24), 1990-2005/2010 23Figure 12: Trends in Primary Gross Enrolment (% gross), 1990-2002/2011 .................24Figure 13: Trends in Secondary Gross Enrolment (% gross), 1990/91-2002/11 ..........25Figure 14: Trends in Tertiary Gross Enrolment (% gross), 1990-2002/2011 .................25Figure 15: Mean Years of Schooling, 2010, and Expected Years of Schooling, 2011 ...26Figure 16: Pupil-Teacher Ratio, Primary, 1997/2000-2011 ................................................27Figure 17: Trends in Public Expenditure on Education (% of GDP), 1990/1999-
2000/2011 ...............................................................................................................28Figure 18: Trends in Access to Improved Water Sources
(% of population with access), 1994-2010 .........................................................30Figure 19: Trends in Improved Sanitation Facilities (% of population with access),
1994-2010 ................................................................................................................31Figure 20: Access to Electricity, 2009 and 2011 (% of population with access).............32Figure 21: Social Protection Expenditure and Index, 2009 ................................................33
Table 1: Income Convergence – Real per capita Gross National Income (GNI, PPP$ at 2005 prices) ....................................................................................9
Table 2: Structural Convergence (% of GDP – Constant Prices – Agri./Ind./Service)......................................10
Table 3: Structural Convergence (% of employment – Agri./Ind./Serv.) ...................10Table 4: Progress in Poverty Reduction – Headcount % (National) .............................11Table 5: Progress in Poverty Reduction – Headcount % (USD1.25-a-day) .................11Table 6: Progress in Poverty Reduction – Headcount (USD2-a-day) ...........................12Table 7: Trends in Economic Inequality – Consumption Gini ......................................13Table 8: Trends in Economic Polarisation – Consumption Share of Top 20% over
Bottom 20% (ratio) ................................................................................................14Table 9: Trends in Human Development (HDI)..............................................................15Table 10: Gender Equity ........................................................................................................29

xv
Chapter 2Figure 1: Current Mean per Capita Consumption, by Geographical Areas (riels) .......78Figure 2: Density Curves of Real Daily per Capita Consumption ..................................78Figure 3: Density Curves of Real Daily per Capita Consumption,
by Geographical Areas ..........................................................................................78Figure 4: Poverty Headcount of Real per Capita Consumption .....................................78Figure 5: Poverty Headcount of Real per Capita Consumption .....................................78Figure 6: Poverty Gap of Real per Capita Consumption .................................................78Figure 7: Severity of Poverty of Real per Capita Consumption......................................79Figure 8: Estimated Gini Coefficients of Inequality in per Capita Consumption,
by Geographical Domain ......................................................................................79Figure 9: PEGR (α=0) and Actual Growth ........................................................................79Figure 10: Cumulative Distribution Function Curves of per Capita Consumption ......79Figure 11: Poverty Headcount of Current per Capita Food Consumption ....................79Figure 12: Poverty Headcount (α=0) of Real per Capita Consumption,
by Geographical Areas ..........................................................................................79Figure 13: Poverty Headcount of Current per Capita Non-Food Consumption ...........80Figure 14: Poverty Gap (α=1) of Real per Capita Consumption .....................................80Figure 15: Poverty Headcount (α=0) of Real per Capita Consumption ..........................80Figure 16: Poverty Headcount (α=0) of Real per Capita Consumption,
by Education of Household Head, 2011 ...........................................................80Figure 17: Poverty Headcount (α=0) of Real per Capita Consumption
by Provinces, 2011 .................................................................................................80Figure 18: Lorenz Curves of Real Consumption per Capita, KHR .................................80
Table 1: Sampled PSU (Villages) and HHs in CSES .......................................................66Table 2: CDHS Sample Size ................................................................................................66Table 3: Non-Income Variables Description ....................................................................66Table 4: Temporal Food and Non-Food CPI (2004=100) .............................................66Table 5: Total Temporal Poverty Line (riels) .....................................................................67Table 6: Linked Food and Non-Food CPI (Phnom Penh 2004=100) ..........................67Table 7: Total Linked Poverty Line (riels) ..........................................................................67Table 8: Mean Daily per Capita Expenditure (current prices, riels) ..............................67Table 9: Average Real Daily per Capita Expenditure (2004 = 100, riels) .....................69Table 10: Consumption Share by Deciles (Percent, 2004=100) .......................................71Table 11: Education ................................................................................................................72Table 12: Under-Five Children’s Nutritional Status ...........................................................72Table 13: Under-Five Children’s Nutrition Status by Quintile (z-score) .........................73Table 14: Wealth Index ...........................................................................................................73Table 15: Estimated Gini Coefficients of Inequality in per Capita Consumption,
by Year .....................................................................................................................73Table 16: Estimated Gini Coefficients of Inequality in per Capita Consumption,
by Geographical Domains ....................................................................................73Table 17: Gini Coefficients of Real Income per Capita (2009, Phnom Penh = 100) ..74Table 18: Atkison Index on per Capita Consumption, by Year .......................................74

xvi
Table 19: Decomposition of Theil Indices of Inequality on Real per Capita Consumption ..........................................................................................................74
Table 20: Land Inequality, by Geographical Domain and Household Characteristics .75Table 21: Growth and Inequality Effects on Poverty .......................................................75Table 22: Poverty Equivalent Growth Rates ......................................................................76Table 23: Growth and Inequality Effect on Health Poverty .............................................76Table 24: Growth and Inequality Effect on Education Poverty ......................................77Table 25: Growth and Inequality Effect on Wealth Poverty ............................................77Table 26: Household Health and Education by Wealth Status 2005-10 (z-score) .........77Table 27: Housing Characteristics, by per Capita Consumption Quintile in 2011
and 2004-11 changes ............................................................................................81Table 28: Household Education, by per Capita Consumption Quintile in 2011
and 2004-11 changes ..............................................................................................83Table 29: Employment Indicators among Population Aged 10 and Above,
by per Capita Consumption Quintile 2011 and changes 2004-11 ..................85Table 30: Thresholds of Pro-poor Growth Index .............................................................91
Chapter 3Figure 1: Real GDP Growth Rate and Contribution of Resource Sector .....................98Figure 2: Real GDP Per Capita Growth ..............................................................................99Figure 3: Structure of GDP ..................................................................................................99Figure 4: Structure of Industrial Value Added .................................................................100Figure 5: Sectoral Distribution of Workers .....................................................................101Figure 6: Labour Productivity by Sector ...........................................................................101Figure 7: Share of Own-Account and Unpaid Family Workers in Labour Force ......102Figure 8: Poverty Headcount across Provinces ................................................................103Figure 9: Gini Coefficient, 1992/93-2007/08 ..................................................................109Figure 10: Reduction of Poverty Headcount, Growth Effect and
Redistribution Effect (annual change) ..............................................................111Figure 11: Consumption Quintiles, 1992/93-2007/08 .....................................................112Figure 12: Percentage of Villages with Electricity .............................................................113Figure 13: Household Access to Land ................................................................................114Figure 14: Asset Ownership, All Households, 2002-03 & 2007-08 ................................115Figure 15: Asset Ownership, Poor Households, 2002-03 & 2007-08 .............................115Figure 16: Asset Ownership, Villages without Road Access, 2002-03 & 2007-08 ........116Figure 17: Net Primary Enrolment ......................................................................................117Figure 18: Lower Secondary School Enrolment Rate .......................................................117Figure 19: Under-Five and Infant Mortality Rates .............................................................118Figure 20: DPT and Measles Immunisation among Children Aged 12-23 Months .....118Figure 21: Under-Nutrition and Malnutrition among Children under Five .................119Figure 22: Percent of Population with Access to Improved Sanitation Facilities ......120Figure 23: Percentage of Population with Access to Improved Water Source .............120Figure 24: Adult Literacy Rate ..............................................................................................121Figure 25: Ratio of Female Students to Male Students in Secondary Education .........121Figure 26: Share of Women in Non-Agriculture Employment in 2012 .........................122

xvii
Figure 27: Coverage of Social Protection Programmes, by Target Group ....................123Figure 28: Social Protection Index Components ...............................................................124
Table 1: Poverty Headcount ..............................................................................................103Table 2: Food Poverty (%) .................................................................................................105Table 3: Comparison of Poverty Headcount and Food Poverty .................................106Table 4: Poverty Gap in Lao PDR ....................................................................................106Table 5: Poverty Severity Index .........................................................................................107Table 6: Gini Coefficient ....................................................................................................109Table 7: Theil Indexes .........................................................................................................112Table 8: Access to Main Road ..........................................................................................114Table 9: Composite Inclusive Growth Index and Its Components ............................127
Chapter 4Figure 1: Year-on-Year Growth Rate of GDP (at 1988 prices) of Thailand ..............133Figure 2: Percentage Shares of GDP, 1960-2010 ............................................................133Figure 3: GDP per Capita Growth.....................................................................................134Figure 4: Poverty Head Count, Poverty Gap and Poverty Severity Indices .................135Figure 5: Poverty Headcount by Age and Sex, 2010 .......................................................135Figure 6: Income by Quintile (THB/person/month) .....................................................140Figure 7: Income Ratios between Quintiles ......................................................................140Figure 8: Poverty and Inequality, 1962-2010 .....................................................................141Figure 9: Average Years of Schooling for Adults (15+) .................................................143Figure 10: School Enrolment (% of population in relevant age group) ........................144Figure 11: Life Expectancy ....................................................................................................145Figure 12: Infant Mortality Rate (per 1000 births) ............................................................145Figure 13: Labour Participation Rate (age 15+) .................................................................146Figure 14: Proportion of Internet Users .............................................................................148Figure 15: Trend and Structure of Government Expenditure on Social Protection
Programmes ..........................................................................................................149
Table 1: Percentage of Poor People in Socio-Economic Subgroups ..........................136Table 2: Inequality Measures .............................................................................................137Table 3: Theil Indices for Rural and Urban Income Inequality ...................................137Table 4: Gini Coefficient by Region .................................................................................139Table 5: Decomposition of Poverty Reduction into Growth, Inequality
and Poverty Line Change ....................................................................................139Table 6: Pro-poor Growth, 1986-2009 ............................................................................141Table 7: Labour Productivity .............................................................................................147Table 8: Number of People Employed, 2010 .................................................................147Table 9: Social Pension by Age ..........................................................................................150Table 10: Recipients of Older Person Allowance.............................................................150Table 11: Recipients of Disability Allowance ...................................................................151Table 12: Recipients of AIDs/HIV Allowance ................................................................151Table 13: Governance Indicators ........................................................................................153

xviii
Table 14: Public Spending on Health and Education ......................................................153Table 15: Composite Index Variables .................................................................................154
Chapter 5Figure 1: Analytical Framework for Assessment of Inclusive Growth ........................172Figure 2: GDP Growth, Aggregate and by Major Sectors, 1990-2010 ........................173Figure 3: General, Rural and Urban Poverty Rate, 1998-2010 .......................................176Figure 4: Poverty by Geographical Region, 1998-2010 ...................................................177Figure 5: Poverty, by Ethnic Groups, 1993-2010 .............................................................178Figure 6: Gini Coefficient for Expenditure, 1993-2010 ..................................................179Figure 7: Theil L and Theil T for Expenditure, 1993-2010............................................179Figure 8: Inequality between Quintiles (VND/person/month) ....................................180Figure 9: Decomposition of Theil L Index, 1993-2010 .................................................180Figure 10: Maternal Mortality Ratio (maternal deaths per 100,000 live births) .............184Figure 11: Child Mortality Rate in Urban and Rural Areas, 2006 (per 1000) ................186Figure 12: Maternal Mortality Ratio disparity between Urban and Rural Areas ...........186
Table 1: GDP per Capita 1990-2010 ................................................................................174Table 2: Depth and Severity of Poverty in Vietnam ......................................................177Table 3: Composition of the Poor, by Ethnic Group, 1993-2010 ...............................178Table 4: The Literacy Rate (over 10 years old) (%) ........................................................181Table 5: Number of Schools ............................................................................................182Table 6: Schooling, by Level, Area and Income, 2010 (%) ...........................................182Table 7: Access to Health Care, 1993-2010 .....................................................................184Table 8: Under-One Mortality Rate, by Region (per 1000 live births) ........................185 Table 9: Labour Productivity, 2006-10 (VND 1000/worker) ......................................187Table 10: Employed Population by Sector, 1999 and 2010 ............................................187Table 11: Employment Growth and Types, 2001-11 (%) ...............................................188Table 12: Structure of Employment, by Occupation and Gender, 1 April 2010 ........189Table 13: Access to Infrastructure in ‘Extremely Difficult Communes’. .....................190Table 14: Number of Durable Goods Possessed, 2006-10 (per 100 households) ......190Table 15: Housing, by Type, Location and Income, 2010, (%) ......................................191Table 16: Access to Drinking Water, 2010 (%) .................................................................192Figure 13: Structure of Social Protection System ..............................................................194Table 17: Social Insurance Participants and Beneficiaries, 1996-2008 ..........................195Table 18: Social Health Insurance Coverage, 1993-2008 ................................................196Table 19: Weight and Score for McKlinley Index ............................................................200
Chapter 6Figure 1: Real GDP Growth of Yunnan Province, 2000-11 .........................................206Figure 2: Per Capita GDP of Yunnan Province, 2000-11 ..............................................207Figure 3: Shares of Real GDP in Yunnan Province ........................................................207Figure 4: Sectoral Shares of Employment in Yunnan Province, 2001-11 (%) ............207Figure 5: Poor Population of Yunnan Province, 2003-08 ..............................................208Figure 6: Poor Population of Yunnan Province and its Proportion of China’s Total Poor ..208

xix
Figure 7: Urban and Rural Incomes, 2000-10...................................................................209Figure 8: Theil Index of Income Gap of Yunnan Province, 1999-2008 .....................210Figure 9: Social Security Expenditure in Yunnan, 2000-11 (% of GDP) ....................211Figure 10: Medical care in Yunnan Province, 2000-11 ......................................................212Figure 11: Enrolment Rate for School-Aged Children in Yunnan Province, 2000-11 213Figure 12: Illiteracy in Yunnan Province, 1964-2010 ........................................................213Figure 13: Loan Balance in Yunnan Province, 2000-11 ....................................................214
Table 1: Theil Index and Its Components for per Capita Income of Households in Yunnan Province, 1999-2008 ........................................................................210
Table 2: Inclusive Growth Indicators for Yunnan Province ........................................214
Chapter 7Figure 1: China’s Real GDP Growth Rate from 1979 to 2010 ......................................218Figure 2: China’s GDP per Capita from 1995 to 2010 (USD) .......................................219Figure 3: World Rankings of China’s Nominal GDP and GDP per Capita ..............219Figure 4: Real GDP Growth Rates of China’s Eastern, Central and Western Areas .220Figure 5: Real GDP per Capita in the Eastern, Central and Western Regions ...........221Figure 6: Shares of Three Sectors in Real GDP ..............................................................221Figure 7: Employment in Three Sectors, 1993 to 2010 ..................................................222Figure 8: Per Unit Energy Consumption of GDP in China, 1993-2010 ....................223Figure 9: Per Unit Output of Atmospheric Pollution, 2003 to 2010 ...........................223Figure 10: Electricity Consumption of China’s Urban and Rural Areas ........................224Figure 11: Phone Use in Urban and Rural Areas ...............................................................225Figure 12: Poor Population and Poverty Rate ....................................................................228Figure 13: Gini Coefficient (Income) ...................................................................................229Figure 14: 2000-10 Theil Indexes of China, Rural Region, Urban Region and
Urban-Rural Region ............................................................................................231Figure 15: Incomes of Urban and Rural Residents (CNY/year).....................................233Figure 16: 2000-10 Theil Index in Eastern, Central and Western China and Between
Regions ...................................................................................................................234Figure 17: Proportion of Total Income Received by Poorest 20% of Population ......235Figure 18: Medical Personnel in Institutions per 1000 People.........................................236Figure 19: Under-Five Child Mortality Rate (per 1000 live births) .................................237
Table 1: China’s Poor Population ......................................................................................226Table 2: Poverty Situation of Rural Households in China ............................................227Table 3: Theil Index of 2000-10 Urban and Rural Household Income per Person
and its Composition ............................................................................................232Table 4: Theil Index of 2000-10 GDP Per Capita and Its Composition in the Three
Regions ...................................................................................................................233Table 5: Proportion of Total Income Received by Poorest 20% of Population .....234Table 6: Transparency International Corruption Perceptions Index Rating of China ...239Table 7: Weights and Scores for Indicators of McKinley Index .................................240

xx
ACRONYMS AND ABBREVIATIONS
ADB Asian Development BankASEAN Association of Southeast Asian NationsCDC Council for the Development of CambodiaCDHS Cambodia Demographic and Health Survey CLMV Cambodia, Laos, Myanmar, VietnamCPI Consumer Price Index CSES Cambodia Socio-Economic SurveyGDP Gross Domestic ProductGMS Greater Mekong SubregionGNI Gross National IncomeGSO General Statistical OfficeHDI Human Development IndexHH HouseholdHIV Human Immunodeficiency VirusILSSA Institute of Labour Science and social affairsIMF International Monetary FundMOLISA Ministry of Labour, Invalids and Social AffairsMPI Ministry of Planning and InvestmentNIS National Institute of Statistics OECD Organisation for Economic Co-operation and Development PEGR Poverty Equivalent Growth RatePSU Primary Sampling UnitSTEM Science, Technology, Engineering and MathematicsUNDP United Nations Development ProgrammeUSD United States DollarVHLSS Vietnam Household Living Standard SurveyWB World BankWDI World Development IndicatorsWEF World Economic Forum

xxi
FOREWORD
Over the past decade, the countries of the Greater Mekong Subregion (GMS) have experienced relatively high levels of growth. However, policymakers, their economic advisers, and development partners, have become increasingly concerned that robust growth by itself is not enough, that it should also be inclusive, achieving positive benefits for both the affluent and the poor, enhancing livelihoods, reducing poverty and inequality, and improving other key development indicators in areas such as health and education. In this context the Greater Mekong Subregion Development Analysis Network (GMS-DAN) is pleased to present the findings of its most recent study on “Inclusive Development in the GMS: An Assessment”.
The GMS-DAN 9 research programme was divided into two stages. The second stage examines the role of policy and institutions in achieving inclusive development in health and education in the GMS. The GMS-DAN 9 progamme, including the production of this volume, was supported by the Rockefeller Foundation and the International Development Research Centre of Canada. Seven research institutes from five GMS countries participated in the study – Cambodia Development Resource Institute (the co-ordinating institute), Thailand Development Research Institute, Central Institute for Economic Management of Vietnam, Vietnam Institute of Economics of the Vietnam Academy of Social Sciences, National Economic Research Institute of Lao PDR, Lao Statistics Bureau of Lao PDR, and Faculty of Management and Economics, Kunming University of Science and Technology of Yunnan Province of China.
Inclusive growth is based on two mutually reinforcing concepts. First, high rates of sustainable growth will create and expand economic opportunities, while broader access to these opportunities will ensure that all members of society can participate in and benefit from growth. Development is inclusive when growth is sustainable and accompanied by a considerable reduction in poverty and inequality. Traditionally, GMS countries have placed “the poverty reduction goal” high on their development agendas, supporting the objective of making the growth process more inclusive, but with variations in development priorities and strategies.
In support of GMS member country development strategies, the objectives of more inclusive growth and development have also been embraced by many development agencies, both bilateral and multilateral, particularly in the Asian Development Bank’s GMS programme, and by other international organisations, local and international non-government organisations, and the development research community. This current GMS-DAN theme of inclusive growth, in its subregional and regional integration contexts, is also of great relevance to government-development partner-private sector cooperation in meeting the current development challenges of the GMS countries. A deeper analysis of the inclusiveness of growth and development will enable better targeting of development policy and practice.

xxii
This volume includes five GMS country chapters and a synthesis chapter, which draws together the data and information from the five country reports to produce an analysis of the GMS as a whole. We trust this volume will make a useful contribution to research knowledge and policy discussion on inclusive development in the GMS, and to the capacity of the GMS-DAN partner institutes to deepen their ongoing analytical work in this subject area.
Larry Strange
Executive Director, CDRI

1Growth, Development and Inclusion in the Greater Mekong Subregion: An Assessment 1
Chapter 1Growth, Development and Inclusion in the
Greater Mekong Subregion: An Assessment
by Srinivasa Madhur and Jayant Menon*1
*1The authors would like to thank Ker Bopha, Data Analyst for research assistance.

2 Growth, Development and Inclusion in the Greater Mekong Subregion: An Assessment
1. INTRODUCTION
The Greater Mekong Subregion (GMS) is a natural geographic area linked by the Mekong River. It covers the five Southeast Asian countries – Cambodia, Laos, Myanmar, Thailand and Vietnam – along with the Yunnan province and the Guangxi Zhuang autonomous region of China. The subregion covers about 2.6 million square kilometres of land and is home to around 326 million people with an average per capita income of about USD1500 at current exchange rates. Although only part of China belongs to the subregion, the subregion’s members, including China, are commonly referred to as the GMS countries.
In the last couple of decades, most GMS countries have experienced strong economic growth. Indeed, three GMS countries – Thailand, China and Vietnam – belong to the global list of 16 post-war high-growth economies, i.e. those that grew at an average annual rate of more than 7 percent for 25 years or more. Thailand posted that kind of high growth for 37 years between 1960-1997, and China has done so for more than 50 years since 1961 (Commission on Growth and Development 2008). In 2011, Vietnam joined this globally coveted country club. Both Cambodia and Laos – which have now grown at above 7 percent per year for about 20 years – are also on course to join the high-growth country list in the next few years. Both of these countries are now included in the select list of what the IMF has recently referred to as the dynamic low-income countries that started their economic take-offs in the 1990s (IMF 2013). Myanmar, too, with its recent opening-up initiatives, is now beginning to explore and articulate visions of strong growth in the future.
Global development experience indicates that strong economic growth is a prerequisite for fostering inclusive development – a process in which the fruits of growth and development are shared equitably among the different segments of the population in a society. However, it also highlights that growth in itself is not a sufficient condition for such equitable socioeconomic development. Growth does not automatically trickle down to all the segments of the population, especially to the poorer ones; the benefits are not necessarily shared by society at large. In modern parlance, growth may not be inclusive. In its extreme form, growth may be so non-inclusive that it benefits mostly the people in the top income/wealth brackets and bypasses the rest. In less extreme cases, growth may not be inclusive enough in that it may benefit the richer segments of a society more than the poorer segments. Growth inclusion or non-inclusion is thus a matter of degree. Global development experience indicates that countries that experience less-inclusive growth also find it difficult to sustain strong growth over the long haul (ADB 2012a).
Non-inclusive growth may be socially undesirable too, as it often leads to the perpetuation of economic inequality and social polarisation across generations through “political capture”, “privilege cascade” and “opportunity hoarding” by the rich (Oxfam 2014). It may not even be socially acceptable, in which case it could lead to social unrest and civil conflict (Basu 2011; Sachs 2011; Stiglitz 2012; WEF 2014). In very basic terms, rising inequalities can pose a risk to political and social stability, undermining the very basis of growth itself.
3Growth, Development and Inclusion in the Greater Mekong Subregion: An Assessment 3
Moreover, there is no guarantee that countries achieving strong growth necessarily make substantial progress in the non-income dimensions of development (UNDP 2010). Consequently, even strong growth might not necessarily lead to equitable improvements in access to health, education, and even basic necessities such as safe drinking water and sanitation, affordable electricity and modern cooking fuels.
Lack of inclusion in these non-income dimensions often constrains human capital formation and therefore growth itself (ADB 2012a). Indeed, achievements in terms of health, education and other necessities are also thought to be ends in themselves in the development process. For this reason, development inclusiveness goes beyond inclusiveness in growth alone to embrace both the income and the non-income dimensions.
The multi-dimensional nature of development inclusiveness is aptly summarised by Takehiko Nakao, President of the Asian Development Bank: “For growth to be sustainable, it also needs to be inclusive... we must address issues of income inequality, access to good education and health services, gender equity and provision of social safety nets... Inclusive growth is ultimately an issue of empowerment – a concept much emphasized by Nobel Laureate Amartya Sen. Empowerment is not just a means of development, but should also be a primary objective of development.” (ADB 2013a)
The objective of this paper is to assess how far the GMS countries have come towards achieving such a broader goal of development inclusiveness – not just the income dimension of inclusiveness, but also its non-income dimensions. The paper addresses two key questions: (i) How inclusive has growth and development been in the GMS countries? (ii) Based on the emerging patterns of development inclusiveness in these countries, what are the broad lessons and emerging challenges for sustaining growth, development and inclusiveness in the future? In so doing, it examines empirical evidence across a wide range of macroeconomic and sectoral development indicators.
The paper focuses mostly on outcomes in both the income and non-income dimensions of inclusiveness. The aim is to systematically document the key trends in inclusiveness, arrive at an assessment of development inclusiveness in the GMS countries in its various dimensions, and identify broad lessons and challenges for the future. It does not purport to explain the trends in development inclusiveness over time or across GMS countries. Nor does it provide specific policy options for achieving better inclusiveness in the GMS countries.In examining the income dimensions of inclusion, the paper looks at the pace and the structural/sectoral pattern of growth (i.e. the changing balance between agriculture, industry and the service sector); trends in poverty, income distribution and income polarisation between the rich and the poor; and overall human development (see Section 3). In evaluating the non-income dimensions of inclusiveness, several indicators structured around four broad groups to capture the main features of health, education, gender and basic services are tracked. Section 4 examines progress in improving people’s health among the GMS countries. Section 5 looks at how the GMS countries have fared in educating their people. Section 6 focuses on inclusiveness with regard
4 Growth, Development and Inclusion in the Greater Mekong Subregion: An Assessment
to gender equality and people’s access to necessities (such as improved sanitation, safe drinking water, electricity, modern cooking fuel and social protection). As a prelude to the empirical assessments of inclusiveness in Sections 3 to 6, Section 2 dwells on the conceptual underpinnings of inclusive growth – the core of development inclusiveness – and how it is related to other similar concepts that are often used in the development literature. Finally, Section 7 presents the paper’s key conclusions.
2. INCLUSIVE GROWTH: CONCEPTUAL UNDERPINNINGS
Although there is no agreed formal definition of “inclusive growth”, there is a growing consensus on the basic elements that need to be present to distinguish it from other related concepts, such as pro-poor growth. A commonly accepted definition treats inclusive growth as growth that not only creates opportunities but also makes those opportunities accessible to all (Ali and Zhuang 2007). Following this definition, growth is inclusive when it allows all members of a society to participate in and contribute to the growth process on an equal basis, regardless of their individual circumstances. In this sense, inclusive growth must both generate, and be driven by, productive and sustainable jobs. Inclusive growth recognises that economic growth and social policy cannot be treated separately. The persistence of growing inequities and exclusion suggests that they can no longer be treated as an unavoidable residual outcome of a market-led growth process to be tackled separately. Inclusive growth must, therefore, encompass aspects of equity, equality of opportunity, and protection against employment transitions and disturbances.
Furthermore, inclusive growth refers to both the pace and pattern of growth, and is both an outcome and a process. On the one hand, it requires that everyone participates in the growth process, both in organising its progression and in generating the growth itself. On the other hand, it requires that everyone shares equitably in the benefits of growth. Therefore, inclusive growth implies participation and benefit sharing. Participation without benefit sharing makes growth unjust, and sharing benefits without participation prevents it from being a desirable welfare outcome. As the idea of inclusive growth gains increasing recognition, it is now acceptable even for so-called mainstream economists to address inequality in the design stage of growth programmes and policies, rather than considering it only as an afterthought (ADB 2012a).
In understanding the totality of “inclusion”, the recognition has grown that other forms of inequity can exist and need to be addressed, sometimes independently. In poor countries in particular, educational capabilities and skills development, as well as health conditions and outcomes, are strongly skewed in favour of the richer segments of the population. While inclusive growth stresses the need to improve access to both health and education, there is a need also to ensure that removing barriers to access translates into results in the form of better outcomes. A healthy and skilled workforce is vital to sustaining a country’s growth. The same applies to a host of related areas, such as basic sanitation and clean drinking water. Improving outcomes in all of these areas are not only desirable ends in themselves, they are also critical for achieving robust, sustainable growth.

5Growth, Development and Inclusion in the Greater Mekong Subregion: An Assessment 5
2.1. How Different is it from Pro-poor Growth?
In the past, discussion about the impact of growth on poverty and inequality has focused on concepts such as broad-based or pro-poor growth (Tandon and Zhuang 2007). How does inclusive growth relate to these concepts? Inclusive growth advances these concepts by adding access and opportunities, but it is more closely related to an absolute, rather than a relative, definition of pro-poor growth.
Under the absolute definition, growth is considered to be pro-poor as long as poor people benefit in absolute terms, as reflected in some agreed measure of poverty (Ravallion and Chen 1997), regardless of the benefit achieved by others. In contrast, in the relative definition, growth is “pro-poor” only if the incomes of poor people grow faster than those of the population as a whole, so that inequality declines. However, while absolute pro-poor growth can be the result of direct income redistribution schemes, redistribution does not suffice for growth to be inclusive. Productivity must also be improved and new employment opportunities created. In short, inclusive growth is about increasing the pace of growth and enlarging the size of the economy, while at the same time levelling the playing field for investment and expanding and ensuring fair access to productive employment opportunities (Ali and Zhuang 2007).
Whichever concept of pro-poor growth – absolute or relative – is adopted, the difference between pro-poor growth and inclusive growth is obvious. The former refers to growth with poverty reduction, whereas the latter refers to growth with inequality reduction. Since poverty (as it is generally measured) is an extreme form of inequality, inclusive growth is a much broader concept than pro-poor growth.
2.2. Does Growth Increase Inequality?
Since inclusive growth is built on the twin pillars of strong growth and inequality reduction, there is a legitimate concern as to whether there is a trade-off between growth and inequality. The conventional view is that rapid economic growth in the early stage of development, while able to make significant inroads into poverty, also tends to be associated with rising income inequality (Kuznets 1955). Indeed, rising inequality in developing countries, as they move from being predominantly agricultural to being more industrial, is postulated by the Kuznets curve, or inverted U-hypothesis. While the rise in income inequality in the process of industrialisation, driven by convergence and rapid growth, is widely evident – as posited by Kuznets – the persistence of such inequality has raised further questions.
How can these adverse side effects of rapid growth on inequality be avoided, or at least minimised? A good starting point in addressing this question would be to identify the factors driving the inequality. There are no general theories, as the relationship may be region or even country specific. A recent study on inequality in Asia identifies three processes as the key drivers for the rising inequality in developing Asia: technological change, globalisation, and market-oriented reforms (ADB 2012a). All three are also considered the primary drivers of economic growth, suggesting that many of the factors driving rapid growth can also be linked to rising inequality. These forces have tended to

6 Growth, Development and Inclusion in the Greater Mekong Subregion: An Assessment
favour owners of capital over labour, high-skilled over low-skilled workers, and urban and coastal areas over rural and inland regions. All three factors are perhaps present among the GMS countries to varying degrees, although globalisation and market-oriented reforms are the dominant ones.
Even so, reducing growth in order to reduce inequality is not a relevant policy option. Similarly, reversing the trend towards greater openness and market orientation is not the way to go to address inequality if these factors are the main ones driving it. If convergence at the expense of internal cohesion is seen as a hollow victory, then so, too, must the preservation of internal cohesion at the expense of convergence. Clearly, the challenge lies in striking a balance between the two, where convergence can continue without further threatening internal cohesion.
2.3. Does Inequality Hinder Growth?
There is another reason why rising inequality must be addressed. We need to recognise that the link between inequality and growth can run in both directions. So far, we have focused on the impact that growth can have on inequality. But both theory and empirical evidence point to a number of ways in which the level of inequality can affect growth.
High and/or rising inequality and polarisation pose risks to political and social stability. The persistence of inequality can trigger social and political tensions and even lead to conflict, as is currently evident in parts of Asia and in the Middle East. Political stability and social cohesion are factors that contribute to sustained growth, and each of these factors can be adversely affected by income and social inequality. A deficiency in these two areas can lead to lower growth and lower effectiveness in responding to economic crises (Rodrik 1999).
There is little disagreement that rising inequality can result in political and social instability, and that political and social instability can in turn negatively affect growth. The dispute seems to revolve around the other channels, including economic, through which rising inequality can affect growth and its sustainability. There are theoretical arguments that support both a positive and negative relationship.
There are a number of reasons to expect a negative relationship or to expect high inequality to reduce growth. One argument is that, due to credit market imperfections or other institutional barriers, poor households tend to under-invest in higher education for their children. High levels of inequality can create institutions and cultures that favour those who have significant economic and political influence; that is, income inequality entrenches discrimination in other areas such as access to healthcare and education, thereby reinforcing and perpetuating inequality. High inequality is then bad for growth because (given the diminishing marginal returns on education) the average productivity of the human capital in an economy with high levels of inequality is low. This is because the poor under-invest in human capital even when return on their investment would have been high, while the rich over-invest in human capital even as the return on their investment becomes progressively lower.

7Growth, Development and Inclusion in the Greater Mekong Subregion: An Assessment 7
Yet, the same credit market imperfections could make inequality good for growth. This can occur if investment and innovation require large start-up costs relative to a country’s median income. In such a case, inequality in the form of capital concentration would help to increase investment and thus raise economic growth. This argument, however, works best in a closed economy setting. Once we allow for access to foreign savings, either in the form of debt or equity, the need for domestic capital concentration diminishes. If this is true, inequality is no longer required for growth in rich countries as long as the economy is open. Alternatively, access to foreign capital is even more important in poor countries if the negative impact of inequality on growth is to be ameliorated (Menon 2013).
As with theory, the empirical evidence on the relationship between inequality and growth is mixed. Barro (2000) finds little overall relationship between income inequality and rates of growth and investment when tested against a broad panel of countries. When the sample is broken down into poor and rich countries, however, higher inequality is found to retard growth in poor countries and encourage it in richer ones. Initial conditions such as the level of per capita incomes therefore appear to matter in determining this relationship. A number of other studies tend to provide support for a negative relationship in cross-country regressions (Alesina and Rodrik 1994; Persson and Tebellini 1994). More recently, the study by the Growth Commission (Kanbur and Spence 2010) shows that growth strategies cannot succeed without a commitment to equality of opportunity; that is, giving everyone a fair chance to participate in the growth process and to enjoy the fruits that follow. Berg et al. (2008) find that inequality is also an obstacle to sustainable growth, since growth spells tend to be shorter in countries with greater inequality.
On balance, it would be fair to conclude that the evidence tends to favour a negative rather than a positive relationship. Therefore, both theory and evidence would suggest that addressing inequality is important for sustaining growth, and ensuring internal cohesion is necessary for convergence to continue in the future. Indeed, growth and equality should not be seen as trade-offs, but as part of a virtuous circle. More economic opportunities for the poorer people, when not at the expense of other groups in society, can lead to higher growth, which in turn can bring about further opportunities.
2.4. Does Inequality Beget More Inequality?
If inequality can be viewed as bad for growth, then persistent and/or rising inequality must be even worse for growth. Indeed, there are studies suggesting that, left unaddressed, inequality begets more inequality. This view stems from the literature on the role of “institutions” in the growth process. Although their role has long been recognised, their prominence has been emphasised more recently, with some even citing them as the ultimate determinants of growth (Acemoglu and Robinson 2012). High levels of inequality can create institutions and cultures that favour those who have significant economic and political influence, thereby perpetuating the cycle of inequality and aggravating the social tensions that follow. That is, income inequality entrenches discrimination in other areas such as access to healthcare and education, which reinforces and perpetuates inequality.

8 Growth, Development and Inclusion in the Greater Mekong Subregion: An Assessment
In contrast, greater equity can help to create influence for a larger group of people, and this can shape institutions that will promote the interests of even more members of the economy, reducing the sense of exclusion and polarisation.
For instance, “chronic” disparities in power, wealth and status among different socioeconomic groups are perpetuated by economic, political, and sociocultural mechanisms and institutions (Bourguignon et al. 2006). The capture of political power by an elite leads to political inequality and aggravates the initial inequality in endowments and opportunities. Apart from path dependency, or hysteresis that suggest asymmetric effects that limit the ease of reversing high levels of inequality, the process of addressing inequality can also lead to undesirable outcomes. Redistribution efforts can create disincentives for investment by raising taxes on those making the investments, dampening growth in the long run. On the other hand, economic elites may turn to corruption in the face of redistribution so as to maintain the status quo, which hurts the credibility of institutions and is also likely to decrease growth (Alesina and Rodrik 1994). This suggests that it is even more important that governments pursue a pattern of growth that limits the negative consequences on the distribution of income that results from it.
3. INCOME INCLUSIVENESS
In assessing the income dimensions of inclusiveness, this paper looks at empirical evidence on five key indicators across the GMS countries: per capita income, structure of the economy, poverty, income/consumption inequality/polarisation, and overall human development.
3.1. Per capita Income
In 1995, just three years after the GMS countries started their cooperation project, Thailand was their richest member, with a real per capita gross national income (GNI, at 2005 prices) of USD5567 (Table 1). Although reliable data on Myanmar’s income for the 1990s is not available, indicators of economic activity that are available suggest that, by the mid-1990s, it was perhaps the poorest GMS country. Seventeen years later, although Myanmar remains the poorest, the region has seen significant convergence in real per capita incomes. China has now replaced Thailand as the richest GMS country. At close to USD8000, China’s real per capita GNI (at 2005 prices) in 2012 was higher than Thailand’s, whereas in 1995 China’s real per capita GNI was only one-third of Thailand’s level (Table 1). The more than quadrupling of China’s per capita income during 1995-2012, compared with Thailand’s 40 percent increase, has been the highest inter-country income convergence posted among the GMS members.

9Growth, Development and Inclusion in the Greater Mekong Subregion: An Assessment 9
Table 1: Income Convergence – Real per capita Gross National Income (GNI, PPP$ at 2005 prices)
CountryPer Capita GNI
1995 2012 Multiple (2012/1995)
Cambodia 797 2095 2.6Laos 1081 2435 2.3Myanmar NA 1817 NAVietnam 1218 2970 2.4Thailand 5567 7722 1.4China 1818 7945 4.4Source: UNDP-Human Development Report 2010, 2013
Although less impressive than China, other countries have also recorded significant income convergence with Thailand. In 1995, Cambodia’s per capita GNI was about 14 percent of Thailand’s level; by 2012, that ratio had almost doubled. Both Laos and Vietnam have achieved similar narrowing of their income gaps. Despite this convergence, however, the CLMV (Cambodia, Laos, Myanmar and Vietnam) countries as a group remain substantially behind Thailand. The richest country among them, Vietnam still has a per capita income less than 40 percent of Thailand’s level. This indicates that there is substantial scope for further income convergence between the CLMV countries and both Thailand and China. While the onus of closing this income gap rests squarely on CLMV countries adopting appropriate national development strategies and policies, collaboration among the GMS countries and at the broader ASEAN and East Asian levels could play a complementary role in enabling the CLMV countries to narrow their development gaps with Thailand and China.
3.2. Structure of the Economy
Income convergence has been accompanied by convergence in the structure of GMS economies. Vietnam is a case in point. In 1999, agriculture accounted for about 32 percent of Vietnam’s gross domestic product (GDP) at constant prices, but by 2011 that share had been halved (Table 2). Similar structural changes in output have occurred in both Laos and Cambodia. Even in Myanmar – the GMS country that has seen the least structural change in the past decades – agriculture’s share in output seems to have declined from 45 percent in the 1990s to about 31 percent in 2012 (ADB 2013b). Despite these convergences, the structural transformations of the CLMV countries are far from complete. For example, in both Thailand and China agriculture now accounts for only about 10 percent of GDP, indicating that the CLMV countries have some way to go in terms of structural change. Interestingly, the structure of output in China’s Yunnan province is akin to that of Vietnam, implying that Yunnan has a long way to go to structurally converge with its more prosperous counterparts within China and within the GMS more generally.

10 Growth, Development and Inclusion in the Greater Mekong Subregion: An Assessment
Table 2: Structural Convergence (% of GDP – Constant Prices – Agri./Ind./Service)Country Initial year Latest year
Cambodia (1993-2011) 46/13/35 25/27/41Laos (1995-2010) 54/21/25 28/33/39Vietnam (1999-2010) 32/25/43 16/42/42Thailand (1995-2009) 10/40/50 10/40/50China (1993-2010) 20/46/34 10/47/43
Yunnan (2000-2010) 20/43/37 15/43/42Source: GMS-DAN country studies
As the structure of output changes, so will the employment structure of these countries. All GMS countries have witnessed a significant decline in the share of agricultural employment (Table 3). Yet agriculture still accounts for as much as 72 percent of employment in Laos, about 62 percent in Cambodia and almost 50 percent in Vietnam – much higher than in Thailand and China. Interestingly, although the structure of output of China’s Yunnan province is comparable to that of Vietnam, its employment structure more closely resembles that of Cambodia. As the CLMV countries continue to industrialise, a further reduction in the share of agriculture in their output and employment towards levels now prevalent in China and Thailand is likely to occur. Such structural changes could contribute to enhanced inclusiveness of growth, as many of those who are now dependent on low-paid agricultural jobs could shift to more productive and better-paid jobs in the industrial and service sectors. At the same time, even those who remain in agriculture are more likely to be engaged in more productive and higher paying agricultural activities.
Table 3: Structural Convergence (% of employment – Agri./Ind./Serv.)Country Initial year Latest year
Cambodia (1993-2011) 80/2/17 62/10/28Laos (1995-2011) 85/4/11 72/8/20Vietnam (1999-2010) 69/15/16 48/22/30Thailand (1993-2011) 57/17/26 38/21/41China (1993-2010) 56/23/21 36/28/36
Yunnan (2000-2010) 74/9/17 59/13/28Source: GMS-DAN country studies
3.3. Poverty
People who live in poverty are often defined as those who earn/consume a minimum amount of food and other basic necessities: this is an extreme form of economic inequality. Therefore, the initial steps towards making growth more inclusive should begin by reducing poverty – making growth more pro-poor. All the GMS countries have achieved significant reductions in poverty, whether measured using individual national poverty lines or the more standardised international poverty lines. The poverty

11Growth, Development and Inclusion in the Greater Mekong Subregion: An Assessment 11
headcount rates using the national poverty lines now range from 2 percent in China to 28 percent in Laos (Table 4).
Table 4: Progress in Poverty Reduction – Headcount % (National)Country Initial yr. Final yr. pp. per yr.
Cambodia (1993-2011) 45 19.8 -1.40Laos (1993-2008) 46 27.6 -1.23Vietnam (1998-2010) 37.4 14.2 -1.93Thailand (1988-2010) 42.2 7.8 -1.56China (2003-2010) 6.6 2 -0.66Yunnan, China (2003-2008) 8.2 5.6 -0.52
Source: GMS-DAN country studies and national sources
Using the well-known USD1.25 a day international poverty line also reveals substantial annual reductions in poverty, albeit varied across countries. By 1990, Thailand had reduced the USD1.25 a day poverty rate to about 12 percent. Excluding Thailand, in the early 1990s, poverty rates ranged from 49 percent in Cambodia to 64 percent in Vietnam; China’s poverty rate, then at 60 percent, was closer to Vietnam’s, while Laos’ rate at 56 percent stood in the middle of the range (Table 5). Since then, Vietnam has posted an impressive annual reduction in poverty at the rate of more than 3 percent, followed by China, Cambodia, and Laos, in that order.
Latest available data indicates that the USD1.25 a day poverty rate is negligible in Thailand. Outside of Thailand, it now ranges from about 13 percent in China (closer to Thailand’s rate in 1990) to 34 percent in Laos (even higher than Myanmar’s rate in 2005). It appears then that since the early 1990s, growth has been most pro-poor in Vietnam and China, while it has been the least pro-poor in Laos. In comparison, Cambodia’s growth has been moderately pro-poor – a result consistent with more detailed analysis of the pro-poorness of the country’s growth (Roth and Lun, chap. 2). Given this, among the GMS countries, the task of reducing extreme poverty in the future seems to be the most challenging for Laos and less so for China, Vietnam, Cambodia and Myanmar, in that order.
Table 5: Progress in Poverty Reduction – Headcount % (USD1.25-a-day)Country Name Initial yr. Final yr. pp. per yr.
Cambodia (1994-2009) 48.6 18.6 -2.00
Laos (1992-2008) 55.7 33.9 -1.36
Myanmar (2005-2010) 32.1 25.6 -1.30
Vietnam (1993-2008) 63.7 16.9 -3.12
Thailand (1990-2010) 11.6 2 -0.48
China (1990-2008) 60.2 13.1 -2.62Source: ADB 2012b; World Bank-World Development Indicators dataset 2013; GMS-DAN country studies; CDRI 2013; national sources
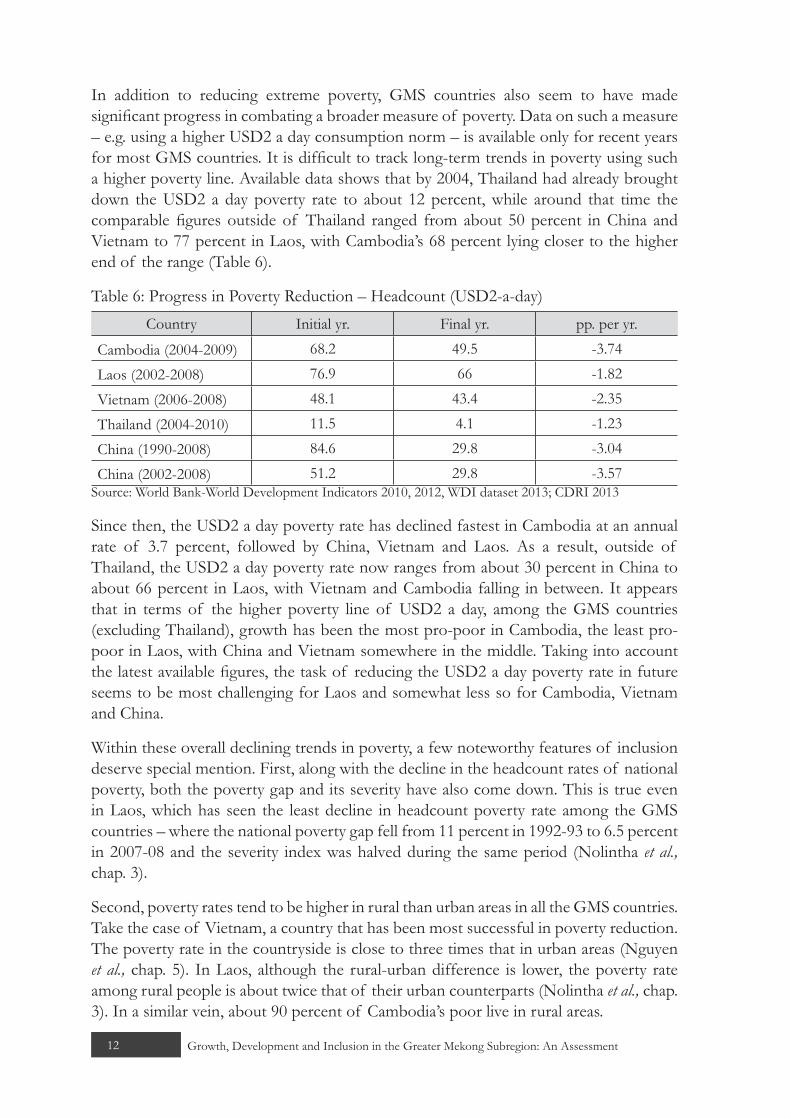
12 Growth, Development and Inclusion in the Greater Mekong Subregion: An Assessment
In addition to reducing extreme poverty, GMS countries also seem to have made significant progress in combating a broader measure of poverty. Data on such a measure – e.g. using a higher USD2 a day consumption norm – is available only for recent years for most GMS countries. It is difficult to track long-term trends in poverty using such a higher poverty line. Available data shows that by 2004, Thailand had already brought down the USD2 a day poverty rate to about 12 percent, while around that time the comparable figures outside of Thailand ranged from about 50 percent in China and Vietnam to 77 percent in Laos, with Cambodia’s 68 percent lying closer to the higher end of the range (Table 6).
Table 6: Progress in Poverty Reduction – Headcount (USD2-a-day)Country Initial yr. Final yr. pp. per yr.
Cambodia (2004-2009) 68.2 49.5 -3.74
Laos (2002-2008) 76.9 66 -1.82
Vietnam (2006-2008) 48.1 43.4 -2.35
Thailand (2004-2010) 11.5 4.1 -1.23
China (1990-2008) 84.6 29.8 -3.04
China (2002-2008) 51.2 29.8 -3.57Source: World Bank-World Development Indicators 2010, 2012, WDI dataset 2013; CDRI 2013
Since then, the USD2 a day poverty rate has declined fastest in Cambodia at an annual rate of 3.7 percent, followed by China, Vietnam and Laos. As a result, outside of Thailand, the USD2 a day poverty rate now ranges from about 30 percent in China to about 66 percent in Laos, with Vietnam and Cambodia falling in between. It appears that in terms of the higher poverty line of USD2 a day, among the GMS countries (excluding Thailand), growth has been the most pro-poor in Cambodia, the least pro-poor in Laos, with China and Vietnam somewhere in the middle. Taking into account the latest available figures, the task of reducing the USD2 a day poverty rate in future seems to be most challenging for Laos and somewhat less so for Cambodia, Vietnam and China.
Within these overall declining trends in poverty, a few noteworthy features of inclusion deserve special mention. First, along with the decline in the headcount rates of national poverty, both the poverty gap and its severity have also come down. This is true even in Laos, which has seen the least decline in headcount poverty rate among the GMS countries – where the national poverty gap fell from 11 percent in 1992-93 to 6.5 percent in 2007-08 and the severity index was halved during the same period (Nolintha et al., chap. 3).
Second, poverty rates tend to be higher in rural than urban areas in all the GMS countries. Take the case of Vietnam, a country that has been most successful in poverty reduction. The poverty rate in the countryside is close to three times that in urban areas (Nguyen et al., chap. 5). In Laos, although the rural-urban difference is lower, the poverty rate among rural people is about twice that of their urban counterparts (Nolintha et al., chap. 3). In a similar vein, about 90 percent of Cambodia’s poor live in rural areas.

13Growth, Development and Inclusion in the Greater Mekong Subregion: An Assessment 13
Third, even among the rural areas, poverty is higher in hard-to-reach locations such as remote, mountainous regions. Within rural Laos, villages connected with roads have poverty rates that are one-third lower than those in villages without roads. The northern mountainous regions in Vietnam have thrice the poverty rates prevalent in the rest of the country. Similarly, the northeastern mountainous provinces in Cambodia have much higher poverty rates than the rest of rural Cambodia (CDRI 2013).
Fourth, poverty is higher among minority groups than among the majority ethnic people. In Vietnam, for example, poverty rates among the ethnic minority groups are more than five times those found among the ethnic majorities. In Laos, the poverty rate among the ethnic minorities is more than thrice that among the Lao-Tai majority population.
All of these indicate that despite the very impressive poverty reduction achieved by the GMS, significant pockets of vulnerabilities, including social exclusion, remain especially among CLMV members.
3.4. Income Inequality and Polarisation
While the headcount poverty rate, however measured, indicates the extreme form of income inequality, the Gini coefficient gives a broader measure across the entire range of the income distribution. In the early 1990s, the Gini coefficient using per capita consumption ranged from about 31 in Laos to about 44 in Thailand, with China’s and Vietnam’s figures closer to the lower limit and Cambodia’s closer to the upper limit (Table 7). Since then, however, Cambodia and Thailand have seen substantial declines in economic inequality: Cambodia’s consumption Gini fell by about 7 percentage points and Thailand’s by 5 percentage points. In contrast, China’s consumption Gini increased by a substantial 11 percentage points, while the figures for Laos and Vietnam went up by about 5 percentage points. As a result, latest available data indicates that overall income inequality is now lowest in Cambodia (Gini of 31) and highest in China (Gini of 43), with Laos closer to the lower limit of the range, Thailand closer to the upper limit, and Vietnam around the middle. Thus, China has the mammoth task of bringing about a more equal income distribution. The major challenge for Laos and Vietnam appears to be one of preventing inequality from rising further, while for Cambodia and Thailand it is one of preserving the past gains in income equality.
Table 7: Trends in Economic Inequality – Consumption GiniCountry Initial yr. Final yr. Change
Cambodia (1994-2011)** 38.3 31.0 -7.3
Laos (1992-2008)** 30.5 35.4 4.9Vietnam (1993-2010)** 33 37.8 4.8Thailand (1990-2010)** 44 39 -5.0China (1990-2008)* 32.4 43.4 11.0
Source: * ADB 2012a; ** GMS-DAN country studies and national sources
Almost similar inequality patterns are observed if, instead of the Gini, the Theil index – another measure of income/consumption inequality – is used. Within this overall

14 Growth, Development and Inclusion in the Greater Mekong Subregion: An Assessment
pattern, evidence points towards a significantly higher level of inequality in urban than in rural areas. Moreover, with the notable exception of China, changes in income/consumption inequalities were much more due to intra-urban and intra-rural changes than to changes in inequalities between urban and rural areas (inter-regional). Take the case of Thailand. The intra-urban and intra-rural changes in inequalities accounted for almost 85 percent of the changes in national inequality (Paitoonpong et al., chap. 4). Similar dominance of intra-regional changes in national inequality change was seen in Laos (more than 90 percent), Cambodia and Vietnam (75 percent) (Roth and Lun, chap. 2; Nguyen et al., chap. 5). In sharp contrast, about 75 percent of the change in national-level inequality in China has been accounted for by changes between rural and urban inequality (Xiong et al., chap. 7).
Another way of examining inequality is to look at signs of polarisation in income and consumption at the extreme ends of the income distribution. “… while the Gini coefficient is important, the gap between the richest and the poorest is important as well” (Basu 2011: 164). One way of assessing such income/consumption polarisation is to look at the income/consumption shares of the richest and the poorest segments of the population. The ratio of the income share of the top 20 percent to that of the bottom 20 percent of the population is one such commonly used measure. This measure reveals that in the early 1990s, Thailand had the highest economic polarisation, with the richest 20 percent of the population having an income of about nine times that of the poorest 20 percent, while Laos had the lowest economic polarisation with the richest 20 percent of the population having an income of only about four times that of the poorest; other GMS countries had consumption polarisation figures in the range of 5.1 to 5.9 – if anything closer to that of Laos than to that of Thailand (Table 8).
Table 8: Trends in Economic Polarisation – Consumption Share of Top 20% over Bottom 20% (ratio)Country Initial yr. Final yr. Change
Cambodia (1994-2011)** 5.8 5.3 -0.5
Laos (1992-2008)* 4.3 5.9 1.6
Vietnam (1992-2008)* 5.6 5.9 0.3
Thailand (1990-2009)* 8.8 7.1 -1.7
China (1990-2008)* 5.1 9.6 4.5Source: * ADB 2012a; ** GMS-DAN country studies and national sources
Since then, however, China has seen an almost doubling of economic polarisation. Indeed, the income share of the poorest 20 percent of the people in China had declined from 5.7 percent in 2000 to 4.4 percent by 2010 (Xiong et al., chap. 7). Laos, too, experienced an increase in economic polarisation, although of a smaller magnitude than China’s. Among the remaining GMS countries, economic polarisation lessened in Thailand and Cambodia while it remained more or less unchanged in Vietnam. Latest available data indicates that economic polarisation is now lowest in Cambodia, and highest in China. Among the remaining GMS countries, economic polarisation in Thailand (although

15Growth, Development and Inclusion in the Greater Mekong Subregion: An Assessment 15
lower than in the early 1990s) is closer to the upper limit of the range while that of Laos and Vietnam is closer to the lower limit. Thus, as in the case of income/consumption inequality, the challenge of combating income/consumption polarisation seems to be the most daunting for China and Thailand. The task seems to be less challenging for the other GMS countries, although the experiences of China and Thailand clearly show that there is no room for complacency.
3.5. Human Development
The human development index (HDI) is a composite index that captures both income and non-income dimensions of inclusiveness, giving equal weight to income, health, and education indicators. Available data indicates that in 1995, Thailand had the highest and Myanmar the lowest HDI. By 2012, Myanmar still had the lowest HDI, but China had overtaken Thailand: China’s HDI is now about 1 percent higher than Thailand’s, whereas in 1995 Thailand’s figure was about 12 percent higher than China’s (Table 9). Other GMS countries have made impressive progress in achieving better human development, although less dramatically than China. The increases in HDI during 1995-2012 range from 35 percent in Vietnam to 45 percent in Myanmar, with Cambodia and Laos witnessing increases of 40 percent and above. These improvements were about double the gain made by Thailand. The CLMV countries are gradually closing their human development gaps with Thailand.
Table 9: Trends in Human Development (HDI)
Country 1995 2012 Percentage Change in HDI 1995-2012
Cambodia 0.385 0.543 41.0Laos 0.388 0.543 40.0Myanmar 0.343 0.498 45.2Vietnam 0.457 0.617 35.0Thailand 0.581 0.690 18.8China 0.518 0.699 35.0
Source: UNDP-Human Development Report 2010, 2013
4. HEALTH
4.1. Life Expectancy
The development literature acknowledges that if a country’s health status were to be represented by just one summary measure from the various readily available data, life expectancy at birth would be the indicator of choice. UNDP’s HDI reflects this reasoning. In 1994, Thailand had the highest life expectancy at birth among the GMS countries at 72 years, while Cambodia was at the bottom of the table with a life expectancy of 56 years. China (71 years) and Vietnam (68 years) had figures closer to the upper end and Laos (58 years) and Myanmar (59 years) had figures closer to the lower end of this range. In the 18 years that followed, with the exception of Cambodia, countries with lower

16 Growth, Development and Inclusion in the Greater Mekong Subregion: An Assessment
life expectancy in the initial years posted higher increases in life expectancy – leading to gradual convergence in life expectancy at birth (Figure 1). Indeed, the fastest convergence was achieved by Vietnam, which, with a life expectancy of 75 years, now has the highest figure among the GMS countries, followed by China, Thailand, Laos, Myanmar and Cambodia. At current levels, the scope for further raising the life expectancy is much larger for Cambodia, Myanmar and Laos than for the rest of the GMS countries.
Figure 1: Trends in Life Expectancy at Birth (years), 1994-2012
64
68
66
7574 74
62.0
64.0
66.0
68.0
70.0
72.0
74.0
76.0
0.02.04.06.08.0
10.012.014.016.018.020.0
Cambodia Laos Myanmar Vietnam Thailand China
Yea
rs (
Late
st Y
ear)
% C
hang
e
% Change Latest Year
Source: UNDP-Human Development Report 2002, 2013; World Bank-World Development Indicators 2001, 2013, WDI dataset 2013; GMS-DAN country studies
The standard measure of life expectancy, however, does not necessarily factor in the overall health status of people. Consider two persons with the same years of life, but one of them lives with various health ailments and the other lives disease-free. Adjusting for health conditions, the latter clearly has a healthier life expectancy than the former.
Using one such measure of healthy life expectancy, the relative positions of GMS countries are somewhat different from that of the standard measure. With a life expectancy of 68 years, China tops the GMS table followed by Vietnam, Thailand, Cambodia and Laos (Figure 2). This implies that China loses on average about six years equivalent of life due to health ailments, while Vietnam and Thailand lose about nine years, and Laos loses about 12 years. Although Cambodia loses only about six years due to health ailments, its percentage loss is much higher than that of China. Once again, at current levels, the CLMV countries have the largest scope for improving healthy life expectancy through higher investments and better delivery of healthcare and other basic services. The other GMS countries are in better shape, but the nature of their health-related challenges may change away from primary healthcare and communicable disease control to the gradually rising burden of non-communicable, life-style-related diseases such as respiratory disorders, cardiovascular ailments and diabetes.

17Growth, Development and Inclusion in the Greater Mekong Subregion: An Assessment 17
Figure 2: Trends in Healthy Life Expectancy (years), 1990–2010
58 5665.9 65.3 68
010
20
30
40
50
60
70
80
0.0
5.0
10.0
15.0
20.0
Cambodia Laos Vietnam Thailand China
Yea
rs (
Late
st Y
ear)
% C
hang
e
% Change Latest Year
Source: Salomon 2012
4.2. Maternal and Child Mortality
Maternal and child health tend to be poor in most low-income countries. Reflecting this, in 1990, Laos had the highest maternal mortality rate of about 1600 per 100,000 live births and Thailand had the lowest figure of 54 per 100,000 live births. Outside of these two countries, Cambodia had a maternal mortality rate of about 830, followed by Myanmar (420), Vietnam (240) and China (120). By 2010, although the relative rankings of the GMS countries remained the same as in 1990, all had made substantial progress. Between 1990 and 2012, with the exception of Myanmar, GMS countries achieved about 70-77 percent reductions in maternal mortality rates; the figure for Myanmar was lower at about 50 percent (Figure 3). Given the current levels, further reducing the maternal mortality rate seems to be the most challenging for Laos, followed by Cambodia, Myanmar and Vietnam. Figure 3: Trends in Maternal Mortality Rate (per 100,000 live births), 1990–2010
206
410
200
6912 32
-80.0-30.020.070.0120.0170.0220.0270.0320.0370.0420.0
-80.0-30.020.070.0
120.0170.0220.0270.0320.0370.0420.0
Cambodia Laos Myanmar Vietnam Thailand China
Per 1
00, 0
00 L
ive
Birth
s (L
ates
t Yea
r)
%Ch
ange
% Change Latest Year
Source: UNDP-Human Development Report 2002, 2013; World Bank-World Development Indicators 2001, 2013, WDI dataset 2013; ADB 2012b
The key determinant of maternal mortality rates seems to be access to skilled health staff at the time of childbirth. Not surprisingly, Laos, with the lowest percentage of births

18 Growth, Development and Inclusion in the Greater Mekong Subregion: An Assessment
attended by skilled health staff among the GMS countries, has the highest maternal mortality rate. Thailand is at the other end of the GMS spectrum. Indeed, there seems to be an inverse correlation between maternal mortality rate and the proportion of births attended by skilled health staff (Figure 4).Figure 4: Births Attended by Skilled Health Staff (% of total), 2006-2011
0102030405060708090
100110
Cambodia Laos Myanmar Vietnam Thailand China
% o
f To
tal
Source: UNDP-Human Development Report 2002, 2013; World Bank-World Development Indicators 2001, 2013, WDI dataset 2013
Like maternal mortality rates, trends in infant mortality rates have shown heartening declines among the GMS countries in the last two decades. In 1994, Thailand had the lowest infant mortality rate of 15 per 1000 live births and Myanmar the highest rate of 64, with Cambodia (57) and Laos (54) near the upper limit and Vietnam (25) and China (21) near the lower limit of this range. Once again, by 2011 the relative ranking of the GMS countries in terms of infant mortality rates had not changed from that of 1990. Yet GMS countries have made big strides in reducing infant mortality rates – China by about 66 percent, Cambodia and Laos by close to 60 percent, Vietnam by 48 percent, Thailand by 44 percent, and Myanmar by 34 percent (Figure 5). The scope for further reductions in infant mortality rates is the largest for Myanmar, Cambodia and Laos, while more modest for the other GMS countries.
Figure 5: Trends in Infant Mortality (per 1000 live births), 1994-2011
36 34
48
1711 13
-70.0-60.0-50.0-40.0-30.0-20.0-10.00.010.020.030.040.050.060.0
-70.0-60.0-50.0-40.0-30.0-20.0-10.0
0.010.020.030.040.050.060.0
Cambodia Laos Myanmar Vietnam Thailand China
Per 1
000
Live
Birt
hs (L
ates
t Yea
r)
% C
hang
e
% Change Latest Year
Source: World Bank-World Development Indicators 2012; UNDP-Human Development Report 2013

19Growth, Development and Inclusion in the Greater Mekong Subregion: An Assessment 19
The mortality rate for children under five years of age shows a similar pattern. Although the relative rankings of the GMS countries remained unchanged between 1994 and 2011, all countries achieved substantial reductions in this category. The reductions in under-five mortality rates between 1994 and 2011 ranged from about 50 percent in Thailand, Vietnam and Myanmar to 71 percent in Laos, with the figure for China and Cambodia closer to that of Laos (Figure 6). As in the case of the infant mortality rate, the scope for further reductions in under-five mortality rates is the largest for Myanmar, Cambodia and Laos, while more modest for the other GMS countries.
Figure 6: Trends in Under-five Mortality (per 1000 live births), 1994-2011
4334
48
2212 15
-75.0
-60.0
-45.0
-30.0
-15.0
0.0
15.0
30.0
45.0
60.0
-75.0
-60.0
-45.0
-30.0
-15.0
0.0
15.0
30.0
45.0
60.0
Cambodia Laos Myanmar Vietnam Thailand China
Per 1
000
Live
Birt
hs (L
ates
t Yea
r)
%Ch
ange
% Change Latest Year
Source: World Bank-World Development Indicators 2012; UNDP-Human Development Report 2013
In most countries, both availability of, and access to, skilled health personnel are generally lower in rural than in urban areas. Consequently, rural areas have significantly higher maternal and child mortality rates than urban areas. In rural Vietnam, for example, the maternal mortality rates are about twice those in urban counterparts; similarly, mortality rates among Vietnamese children are two and half times the corresponding urban figures. Furthermore, within rural areas, the hard-to-reach mountainous areas have twice the rate of the rest of rural Vietnam (Nguyen et al., chap. 5). A similar pattern is present in other GMS countries. Although rural-urban discrepancy has fallen dramatically in China since the early 1990s, the under-five mortality rate in rural areas is about twice that in urban China (Xiong et al., chap. 7). Similar rural-urban disparities in child mortality are seen in Cambodia and Laos, too (CDRI 2013; Nolintha et al., chap. 3). As in the case of Vietnam, child mortality rates in Cambodia’s northeastern mountainous regions are much higher than they are in the rest of the country (CDRI 2013).
Although comparable data on mortality rates among children across income/wealth groups is not available for all GMS countries, it is interesting that, in Cambodia, the pro-poorness of the key elements of child nutrition increased in the first half of the 2000s, and then showed mixed trends in the second half (Roth and Lun, chap. 2). Infant and child mortality rates in Cambodia are now about three times higher for the poorest
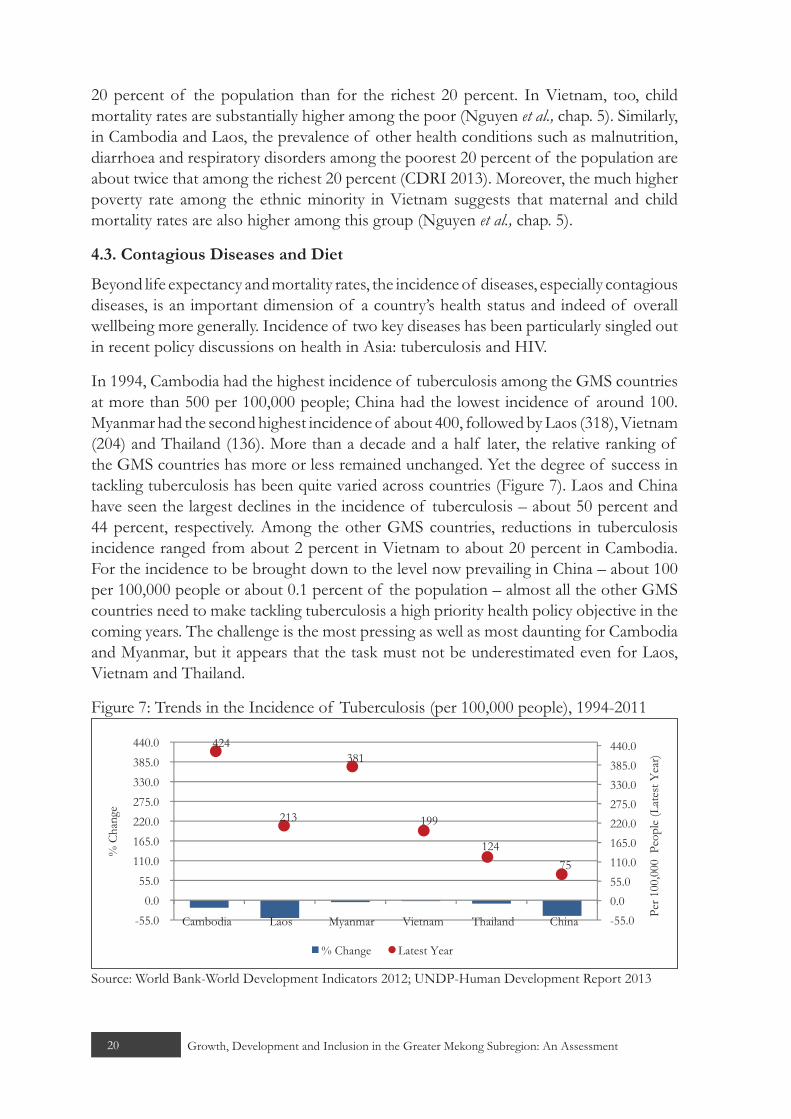
20 Growth, Development and Inclusion in the Greater Mekong Subregion: An Assessment
20 percent of the population than for the richest 20 percent. In Vietnam, too, child mortality rates are substantially higher among the poor (Nguyen et al., chap. 5). Similarly, in Cambodia and Laos, the prevalence of other health conditions such as malnutrition, diarrhoea and respiratory disorders among the poorest 20 percent of the population are about twice that among the richest 20 percent (CDRI 2013). Moreover, the much higher poverty rate among the ethnic minority in Vietnam suggests that maternal and child mortality rates are also higher among this group (Nguyen et al., chap. 5).
4.3. Contagious Diseases and Diet
Beyond life expectancy and mortality rates, the incidence of diseases, especially contagious diseases, is an important dimension of a country’s health status and indeed of overall wellbeing more generally. Incidence of two key diseases has been particularly singled out in recent policy discussions on health in Asia: tuberculosis and HIV.
In 1994, Cambodia had the highest incidence of tuberculosis among the GMS countries at more than 500 per 100,000 people; China had the lowest incidence of around 100. Myanmar had the second highest incidence of about 400, followed by Laos (318), Vietnam (204) and Thailand (136). More than a decade and a half later, the relative ranking of the GMS countries has more or less remained unchanged. Yet the degree of success in tackling tuberculosis has been quite varied across countries (Figure 7). Laos and China have seen the largest declines in the incidence of tuberculosis – about 50 percent and 44 percent, respectively. Among the other GMS countries, reductions in tuberculosis incidence ranged from about 2 percent in Vietnam to about 20 percent in Cambodia. For the incidence to be brought down to the level now prevailing in China – about 100 per 100,000 people or about 0.1 percent of the population – almost all the other GMS countries need to make tackling tuberculosis a high priority health policy objective in the coming years. The challenge is the most pressing as well as most daunting for Cambodia and Myanmar, but it appears that the task must not be underestimated even for Laos, Vietnam and Thailand.
Figure 7: Trends in the Incidence of Tuberculosis (per 100,000 people), 1994-2011
424
213
381
199
12475
-55.00.055.0110.0165.0220.0275.0330.0385.0440.0
-55.00.0
55.0110.0165.0220.0275.0330.0385.0440.0
Cambodia Laos Myanmar Vietnam Thailand China
Per 1
00,0
00 P
eopl
e (L
ates
t Yea
r)
% C
hang
e
% Change Latest Year
Source: World Bank-World Development Indicators 2012; UNDP-Human Development Report 2013

21Growth, Development and Inclusion in the Greater Mekong Subregion: An Assessment 21
The prevalence of HIV infection is a is another key dimension contagious disease. In the mid-1900s, the prevalence of HIV – measured as the incidence of the infection as a percentage of the population aged 15-49 years – was the highest in Thailand at about 2.1 percent and the lowest in China (negligible). At 1.3 percent Cambodia had the second highest rate of prevalence followed by Myanmar (0.5 percent), Vietnam (0.1 percent), and Laos (0.1 percent). Both Thailand and Cambodia – the then high incidence countries – made substantial progress in reducing the prevalence of HIV in the next decade and a half. Between 1994 and 2011, Thailand’s prevalence rate fell by nearly 1 percentage point and Cambodia’s by 0.7 percentage points (Figure 8). In contrast, the prevalence rates edged up in all other GMS countries, most notably in Vietnam (by 0.4 percentage points). Looking ahead, Thailand and Cambodia – the two countries with initially high prevalence rates – face the challenges of making further reductions, while Myanmar, Vietnam and Laos face the challenge of preventing the incidence of the disease from further escalating. In comparison, China’s challenge seems to be one of sustaining the low prevalence rate.
Figure 8: Trends in the Prevalence of HIV (% of population ages 15-49), 1994-2011
0.6
0.3
0.6 0.5
1.2
0.1
-1.0
-0.5
0.0
0.5
1.0
1.5
-1.0
-0.5
0.0
0.5
1.0
1.5
Cambodia Laos Myanmar Vietnam Thailand China
% o
f Po
pula
tion
Age
s 15-
49
(Lat
est Y
ear)
Perc
enta
ge P
oint
Cha
nge
Percentage Point Change Latest Year
Source: World Bank-World Development Indicators 2012; UNDP-Human Development Report 2013
Going beyond life expectancy, mortality rates and contagious diseases, the overall health of the people depends upon the quality of their diet. Indeed, along with safe drinking water and improved sanitation, diet can be viewed as fundamental for a healthy life. A commonly used indicator for assessing a country’s quality of diet is the percentage of undernourished people in its population. In the early 1990s, Thailand had the lowest percentage (about 13 percent) and Laos had the highest at close to 40 percent, with the extent of undernourishment in Cambodia closer to that of Laos, and that of the other countries closer to Thailand’s. Latest available figures for the years 2006-11 indicate that Laos still has the highest percent of undernourished population (28 percent) among the GMS countries, while Thailand has the lowest (7 percent), with Cambodia closer to Laos and the other GMS countries somewhere in the middle (Figure 9). Once again, the scope for improving diet and reducing undernourishment appears to be largest for Laos and Cambodia (perhaps Myanmar, too) and more modest for the other countries, although China seems to have more room for improvement than Thailand and even Vietnam.

22 Growth, Development and Inclusion in the Greater Mekong Subregion: An Assessment
Figure 9: Trends in Undernourishment (% of population), 1990/1992-2006/2011
17 289 7 12
-90
-60
-30
0
30
-90.0
-60.0
-30.0
0.0
30.0
Cambodia Laos Vietnam Thailand China
% o
f Po
pula
tion
(Lat
est Y
ear)
% C
hang
e
% Change Latest Year
Source: UNDP-Human Development Report 2002, 2013; World Bank-World Development Indicators 2001, 2013, WDI dataset 2013
4.4. Public Expenditure on Health
The health status of the people, especially in developing countries, depends largely on public expenditure on health and the efficiency with which such expenditure is used to deliver quality healthcare. The latter in turn is inextricably linked to a whole gamut of factors – organisation of the health system, health sector governance, quality of health personnel, provision and distribution of medicines, and even physical infrastructure such as roads and transport linking people with healthcare centres, to name a few.
In terms of public expenditure on health (relative to GDP), the GMS countries show huge heterogeneity. In the mid-1990s, Laos had a public health expenditure of about 2.5 percent of GDP – the highest figure then among the GMS countries – followed by China, Thailand, Vietnam (about 1.8 percent), Cambodia (1 percent) and Myanmar (0.4 percent). Since then, trends in public expenditure on health have been quite dramatic across the GMS countries. By 2010, public expenditure on health declined by 1 percentage point in Laos, while it increased by around 1 percentage point in four of the other GMS countries – Thailand, Cambodia, China and Vietnam. In Myanmar, it increased marginally (Figure 10). Today, public expenditures on health are in the 2.5 to 3 percent range in China, Thailand and Vietnam, followed by Cambodia, Laos and Myanmar. Looking ahead, it appears that Myanmar has a huge task of stepping up public expenditure on health, while the challenge for Cambodia and Laos appears to be one of gradually increasing it closer to the 3 to 4 percent (of GDP) mark, even as they focus on increasing the efficiency of these expenditures.

23Growth, Development and Inclusion in the Greater Mekong Subregion: An Assessment 23
Figure 10: Trends in Public Expenditure on Health (% of GDP), 1995-2010
2.1
1.5
0.2
2.62.9 2.9
-1.0
-0.5
0.0
0.5
1.0
1.5
2.0
2.5
3.0
-1.0
-0.5
0.0
0.5
1.0
1.5
2.0
2.5
3.0
Cambodia Laos Myanmar Vietnam Thailand China % o
f G
DP
(Lat
est Y
ear)
Perc
enta
ge P
oint
Cha
nge
Percentage Point Change Latest Year
Source: World Bank-World Development Indicators 2012; UNDP-Human Development Report 2013
5. EDUCATION
The HDI incorporates two education indicators: mean years of schooling and expected years of schooling. While these indicators do summarise the education attainments of the population, there are many more aspects of education that need to be examined for a more complete assessment of the education status of the people. 5.1. Literacy Rates
A basic indicator of how inclusive a country’s development process is, and specifically the education system, is the youth literacy rate (people in the age group of 15-24 years). In 1990, four GMS countries – China, Myanmar, Thailand and Vietnam – had already achieved youth literacy rates of 94-95 percent. In contrast, Cambodia had a much lower rate of 74 percent, and Laos even lower at 70 percent. Since then, both Cambodia and Laos have taken big strides in spreading literacy among their youth. As a result, although the relative ranking of the countries remains unchanged from 1990, youth literacy rates in both Cambodia and Laos have shown substantial convergence towards the other countries’ levels (Figure 11). At present, China, Myanmar, Thailand and Vietnam have close to universal youth literacy rates (in the 95-100 percent range), while Cambodia and Laos are moving towards that target.
Figure 11: Trends in Youth Literacy Rate (% of people aged 15-24), 1990-2005/2010
CountryLiteracy rate, youth total (% of people ages 15-24)
Latest yr. % changeCambodia 87.1 18.5Laos 83.9 19.7Myanmar 95.8 1.4Vietnam 96.9 3.0Thailand 98.1 NA China 99.4 4.3
Source: UNDP-Human Development Report 2005, 2013; World Bank-World Development Indicators 2013, WDI dataset 2013; CDRI 2013

24 Growth, Development and Inclusion in the Greater Mekong Subregion: An Assessment
More or less the same pattern of trends and achievements can be observed in the adult literacy rate (15 years and older). Adult literacy rates are now in the 92-94 percent range in China, Myanmar, Thailand and Vietnam, while they are lower in Cambodia (78 percent) and Laos (73 percent).
5.2. Enrolment Rates
In the 1990s, primary gross enrolments were already very high among the GMS countries, in the range of 95 percent in Cambodia and 129 percent in China. Since then, primary gross enrolments have shown a further increase across the GMS countries, except in China and Thailand (Figure 12). The fall in China is not a cause for concern as it is still above 100 percent; in contrast, the decline in primary gross enrolment rate in Thailand to below 100 percent is a matter of concern, as it indicates that at least around 9 percent of the eligible primary school cohorts are not enrolling. It is encouraging that Cambodia and Laos now have high enrolment rates and are also moving towards achieving universal primary education. That said, it appears that there is significant scope for improving the quality of primary education in some of the GMS countries – notably in Cambodia, Laos and Myanmar, and even in Vietnam.
Turning to secondary school enrolment rates, in the early 1990s, Thailand had the highest gross secondary enrolment rate of about 60 percent and Cambodia had the lowest rate of 38 percent; China (40 percent) and Laos (41 percent) had rates closer to that of Cambodia while Vietnam’s rate (52 percent) was closer to that of Thailand. Since then China has more than doubled its enrolment rate. Other GMS countries have posted much more modest increases. As a result, China has now replaced Thailand as the GMS country with the highest secondary enrolment rate of 81 percent, although Thailand and Vietnam now have rates close to that of China (Figure 13). Given that Cambodia and Laos now have secondary enrolments rates of below 50 percent and Myanmar just above the 50 percent mark, these countries have much work to do in raising their scores. For the other GMS countries, as they move closer towards universal secondary education, improving the quality of secondary education is emerging as a major challenge.
Figure 12: Trends in Primary Gross Enrolment (% gross), 1990-2002/2011
126 126 126
106
91
111
0.0
20.0
40.0
60.0
80.0
100.0
120.0
140.0
-20.0
-10.0
0.0
10.0
20.0
30.0
40.0
Cambodia Laos Myanmar Vietnam Thailand China
Gro
ss E
nrol
men
t (La
test
Yea
r)
% C
hang
e
% Change Latest Year
Source: World Bank-World Development Indicators 2012, 2013; UNDP-Human Development Report 2013
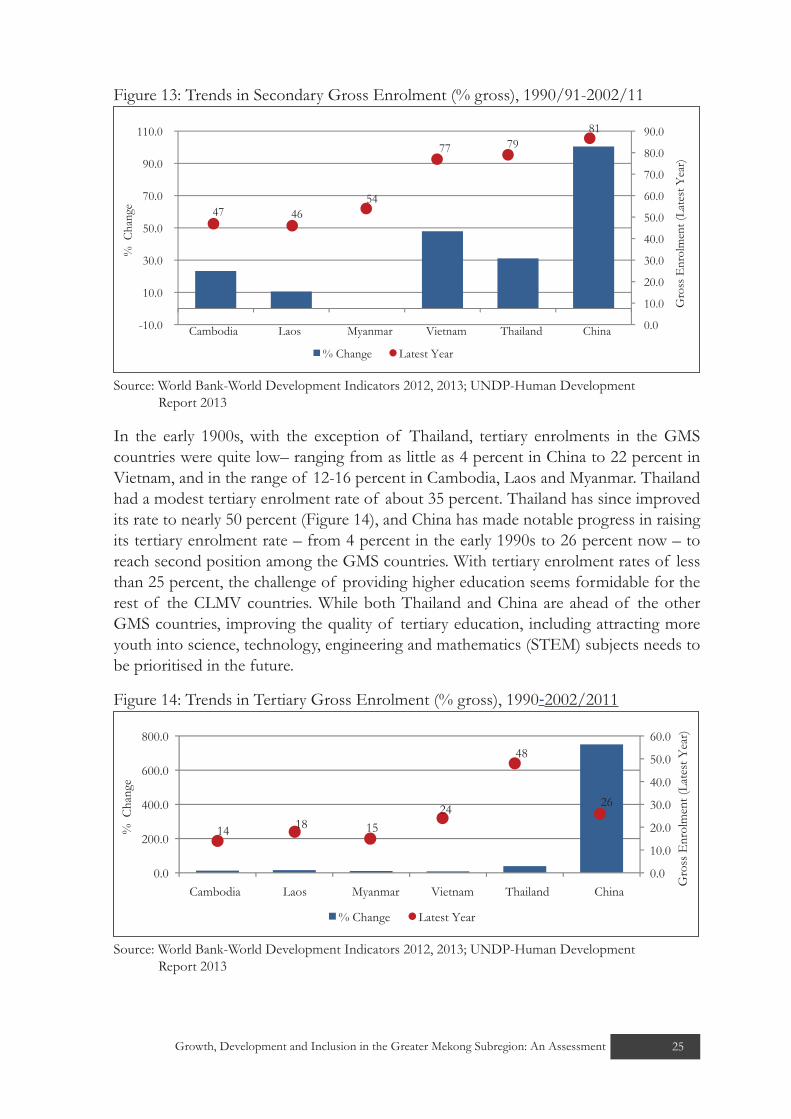
25Growth, Development and Inclusion in the Greater Mekong Subregion: An Assessment 25
Figure 13: Trends in Secondary Gross Enrolment (% gross), 1990/91-2002/11
47 4654
77 7981
0.0
10.0
20.0
30.0
40.0
50.0
60.0
70.0
80.0
90.0
-10.0
10.0
30.0
50.0
70.0
90.0
110.0
Cambodia Laos Myanmar Vietnam Thailand China
Gro
ss E
nrol
men
t (La
test
Yea
r)
% C
hang
e
% Change Latest Year
Source: World Bank-World Development Indicators 2012, 2013; UNDP-Human Development Report 2013
In the early 1900s, with the exception of Thailand, tertiary enrolments in the GMS countries were quite low– ranging from as little as 4 percent in China to 22 percent in Vietnam, and in the range of 12-16 percent in Cambodia, Laos and Myanmar. Thailand had a modest tertiary enrolment rate of about 35 percent. Thailand has since improved its rate to nearly 50 percent (Figure 14), and China has made notable progress in raising its tertiary enrolment rate – from 4 percent in the early 1990s to 26 percent now – to reach second position among the GMS countries. With tertiary enrolment rates of less than 25 percent, the challenge of providing higher education seems formidable for the rest of the CLMV countries. While both Thailand and China are ahead of the other GMS countries, improving the quality of tertiary education, including attracting more youth into science, technology, engineering and mathematics (STEM) subjects needs to be prioritised in the future.
Figure 14: Trends in Tertiary Gross Enrolment (% gross), 1990-2002/2011
14 18 1524
48
26
0.0
10.0
20.0
30.0
40.0
50.0
60.0
0.0
200.0
400.0
600.0
800.0
Cambodia Laos Myanmar Vietnam Thailand China
Gro
ss E
nrol
men
t (La
test
Yea
r)
% C
hang
e
% Change Latest Year
Source: World Bank-World Development Indicators 2012, 2013; UNDP-Human Development Report 2013
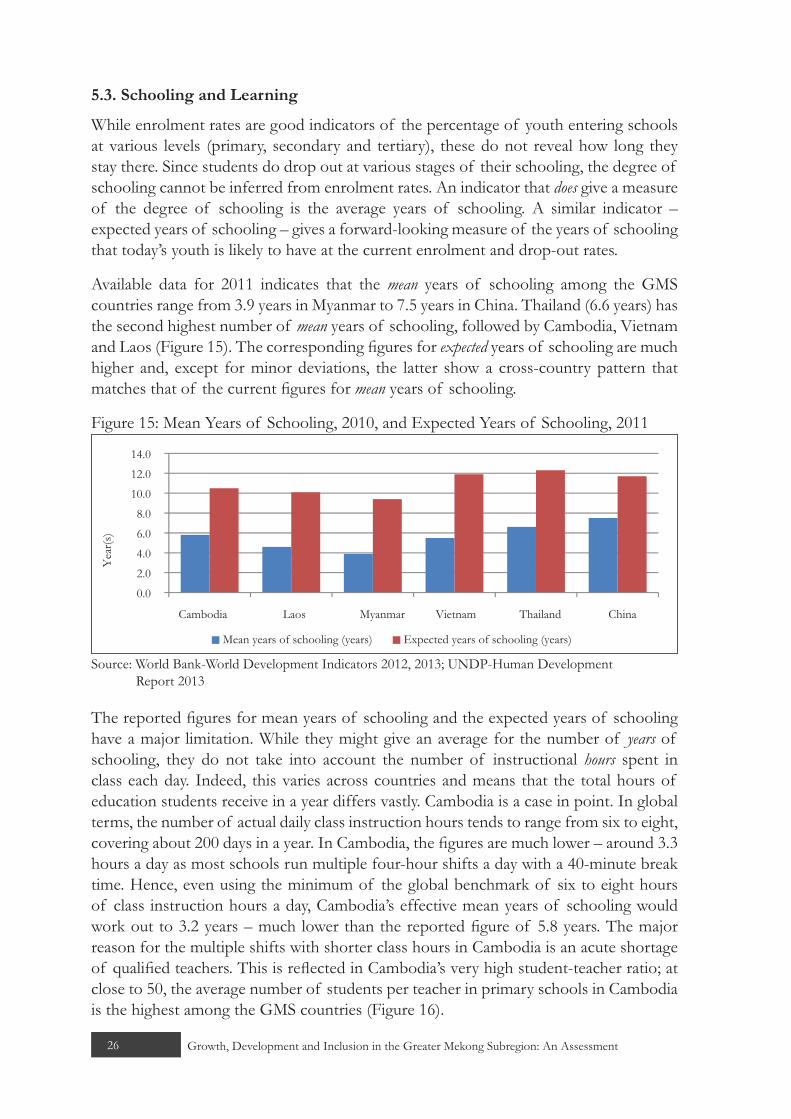
26 Growth, Development and Inclusion in the Greater Mekong Subregion: An Assessment
5.3. Schooling and Learning
While enrolment rates are good indicators of the percentage of youth entering schools at various levels (primary, secondary and tertiary), these do not reveal how long they stay there. Since students do drop out at various stages of their schooling, the degree of schooling cannot be inferred from enrolment rates. An indicator that does give a measure of the degree of schooling is the average years of schooling. A similar indicator – expected years of schooling – gives a forward-looking measure of the years of schooling that today’s youth is likely to have at the current enrolment and drop-out rates.
Available data for 2011 indicates that the mean years of schooling among the GMS countries range from 3.9 years in Myanmar to 7.5 years in China. Thailand (6.6 years) has the second highest number of mean years of schooling, followed by Cambodia, Vietnam and Laos (Figure 15). The corresponding figures for expected years of schooling are much higher and, except for minor deviations, the latter show a cross-country pattern that matches that of the current figures for mean years of schooling.
Figure 15: Mean Years of Schooling, 2010, and Expected Years of Schooling, 2011
0.0
2.0
4.0
6.0
8.0
10.012.0
14.0
Cambodia Laos Myanmar Vietnam Thailand China
Yea
r(s)
Mean�years�of�schooling�(years) Expected�years�of�schooling�(years)
Source: World Bank-World Development Indicators 2012, 2013; UNDP-Human Development Report 2013
The reported figures for mean years of schooling and the expected years of schooling have a major limitation. While they might give an average for the number of years of schooling, they do not take into account the number of instructional hours spent in class each day. Indeed, this varies across countries and means that the total hours of education students receive in a year differs vastly. Cambodia is a case in point. In global terms, the number of actual daily class instruction hours tends to range from six to eight, covering about 200 days in a year. In Cambodia, the figures are much lower – around 3.3 hours a day as most schools run multiple four-hour shifts a day with a 40-minute break time. Hence, even using the minimum of the global benchmark of six to eight hours of class instruction hours a day, Cambodia’s effective mean years of schooling would work out to 3.2 years – much lower than the reported figure of 5.8 years. The major reason for the multiple shifts with shorter class hours in Cambodia is an acute shortage of qualified teachers. This is reflected in Cambodia’s very high student-teacher ratio; at close to 50, the average number of students per teacher in primary schools in Cambodia is the highest among the GMS countries (Figure 16).
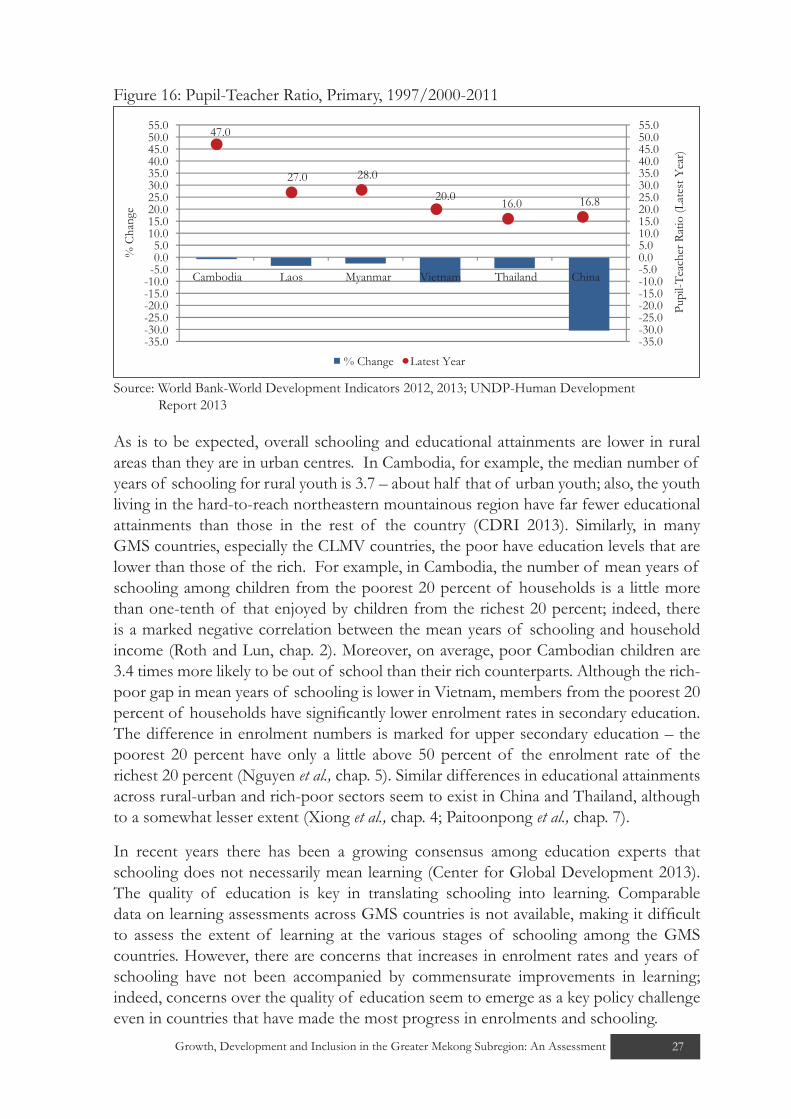
27Growth, Development and Inclusion in the Greater Mekong Subregion: An Assessment 27
Figure 16: Pupil-Teacher Ratio, Primary, 1997/2000-2011
47.0
27.0 28.0
20.0 16.0 16.8
-35.0-30.0-25.0-20.0-15.0-10.0-5.00.05.010.015.020.025.030.035.040.045.050.055.0
-35.0-30.0-25.0-20.0-15.0-10.0-5.00.05.0
10.015.020.025.030.035.040.045.050.055.0
Cambodia Laos Myanmar Vietnam Thailand China
Pupi
l-Tea
cher
Rat
io (L
ates
t Yea
r)
% C
hang
e
% Change Latest Year
Source: World Bank-World Development Indicators 2012, 2013; UNDP-Human Development Report 2013
As is to be expected, overall schooling and educational attainments are lower in rural areas than they are in urban centres. In Cambodia, for example, the median number of years of schooling for rural youth is 3.7 – about half that of urban youth; also, the youth living in the hard-to-reach northeastern mountainous region have far fewer educational attainments than those in the rest of the country (CDRI 2013). Similarly, in many GMS countries, especially the CLMV countries, the poor have education levels that are lower than those of the rich. For example, in Cambodia, the number of mean years of schooling among children from the poorest 20 percent of households is a little more than one-tenth of that enjoyed by children from the richest 20 percent; indeed, there is a marked negative correlation between the mean years of schooling and household income (Roth and Lun, chap. 2). Moreover, on average, poor Cambodian children are 3.4 times more likely to be out of school than their rich counterparts. Although the rich-poor gap in mean years of schooling is lower in Vietnam, members from the poorest 20 percent of households have significantly lower enrolment rates in secondary education. The difference in enrolment numbers is marked for upper secondary education – the poorest 20 percent have only a little above 50 percent of the enrolment rate of the richest 20 percent (Nguyen et al., chap. 5). Similar differences in educational attainments across rural-urban and rich-poor sectors seem to exist in China and Thailand, although to a somewhat lesser extent (Xiong et al., chap. 4; Paitoonpong et al., chap. 7).
In recent years there has been a growing consensus among education experts that schooling does not necessarily mean learning (Center for Global Development 2013). The quality of education is key in translating schooling into learning. Comparable data on learning assessments across GMS countries is not available, making it difficult to assess the extent of learning at the various stages of schooling among the GMS countries. However, there are concerns that increases in enrolment rates and years of schooling have not been accompanied by commensurate improvements in learning; indeed, concerns over the quality of education seem to emerge as a key policy challenge even in countries that have made the most progress in enrolments and schooling.

28 Growth, Development and Inclusion in the Greater Mekong Subregion: An Assessment
That poor children are likely to have a lower quality of education further exacerbates the problem. Take, for example, Thailand’s primary education: “Although all children are able to enrol in primary schools, the schools differ greatly in quality. Poor children are more likely to end up in a lower quality school, which is usually a state school that offers free tuition but lacks important resources such as high-quality teachers and school equipment” (Paitoonpong et al., chap. 4, p. 144). In Vietnam, “… although the millennium goal of universal education has been fulfilled … the quality of education remains low and insufficient to meet the country’s new development requirements” (Nguyen et al., chap. 5, p. 183). Other GMS countries share similar concerns over the quality of their education.
5.4. Public Expenditure on Education
As in the case of health, education achievements in a developing country depend on public spending on education and the efficiency with which such spending is utilised. Latest available data indicates that today, public spending on education among the GMS countries ranges from less than 1 percent of GDP in Myanmar to 6.6 percent in Vietnam. Thailand has the second highest figure (3.8 percent), followed by Laos, China and Cambodia (Figure 17).
Figure 17: Trends in Public Expenditure on Education (% of GDP), 1990/1999-2000/2011
2.63.3
0.8
6.6
3.82.9
-1.5
0.0
1.5
3.0
4.5
6.0
7.5
-1.5
0.0
1.5
3.0
4.5
6.0
7.5
Cambodia Laos Myanmar Vietnam Thailand China
% o
f G
DP
(Lat
est Y
ear)
Perc
enta
ge P
oint
Cha
nge
Percentage Point Change Latest Year
Source: World Bank-World Development Indicators 2012, 2013; UNDP-Human Development Report 2013
Interestingly, Thailand has seen a decline in its public expenditure over time. Other countries seem to have stepped up such expenditures. At current levels, Myanmar seems to be the most in need of a major increase in public spending on education, while the task seems to be more modest for the other GMS countries. All the GMS countries would benefit from public spending efficiency in the education sector.
6. GENDER, WATER, SANITATION AND OTHER BASIC NECESSITIES
6.1. Gender Equality
Greater gender equality – in access to productive employment, healthcare and education, and the development process more generally – is both an end in itself and a means

29Growth, Development and Inclusion in the Greater Mekong Subregion: An Assessment 29
for more inclusive growth and development. In terms of the commonly used gender equity indexes – UNDP’s gender inequality index and the World Economic Forum’s (WEF’s) gender gap index – Cambodia and Laos seem to lag considerably behind China, Thailand and Vietnam (Table 10). However, in terms of the social institutions and gender equity index, recently introduced by the Organization for Economic Cooperation and Development (OECD), Cambodia ranks far ahead of the rest. While the UNDP’s and WEF’s gender indexes mostly measure gender equality outcomes, the OECD’s index measures both the outcomes and the legal and institutional frameworks that are in place to foster gender equality (CDRI 2013). These discrepancies in aggregate measures of gender equality make it difficult to make strict comparisons in gender equality across the GMS countries. Despite this, it seems that most GMS countries are making significant efforts to bring about greater gender equality.
Table 10: Gender Equity
Country
Gender Inequality Index, 2012*
Gender Gap Index, 2012**
Legal and Distribution Discrimination Against Women, 2012***
Rank Value* Rank Score** Rank out of 86 countries SIGI score***
Cambodia 96 0.473 103 0.6457 13 0.1213
Laos 100 0.483 NA NA 49 0.2599
Vietnam 48 0.299 66 0.6867 43 0.2393
Thailand 66 0.360 65 0.6893 25 0.1475
China 35 0.213 69 0.6853 42 0.2388Note: * 0=when women and men fare equally, 1=where one gender fares as poorly as possible in all
measured dimensions; ** the highest possible score is 1 (equality) and the lowest possible score is 0 (inequality); *** 0 = low discrimination, 1 = high discrimination
Source: 1. UNDP-Human Development Report 2013; 2.World Economic Forum-Global Gender Gap Index Report 2012; 3. OECD-Social Institutions and Gender Index 2012
Gender-neutral access to education is the foundation of sustained gender equality. GMS countries do score well on this account. Even in Cambodia, where the two aggregate outcome measures of gender equality rank the country behind others, there has been little gender inequality in education (World Bank 2013). In Laos, too, the ratio of female to male students is showing strong signs of converging towards unity, having risen from 0.76 in the mid-2000s to about 0.84 now (Xiong et al., chap. 3). Similarly, in Thailand the gap between males and females has narrowed considerably; on average, males now receive only about five months of schooling more than females (Paitoonpong et al., chap. 4). Similar trends in closing the gender gap in education are evident in both China and Vietnam (Xiong et al., chap. 5; Nguyen et al., chap. 7). Political empowerment of women has proceeded at a slower pace, but is gathering momentum. In terms of women’s representation in national parliaments, it is only about 5 percent in Myanmar and in the range of 16 percent in Thailand to 25 percent in Laos and Vietnam (CDRI 2013).

30 Growth, Development and Inclusion in the Greater Mekong Subregion: An Assessment
6.2. Improved Water
Access to safe drinking water at affordable prices makes as great a contribution to the overall health of individuals and societies as a balanced diet does. In the mid-1990s, Thailand had the highest percentage of the population with access to improved water at 88 percent, while Cambodia had the lowest percentage at 32 percent. Vietnam and China, with about 65 percent of the population having access to improved water, were closer to Thailand’s level. They were followed by Myanmar (57 percent) and Laos (39 percent). Although that relative ranking has remained more or less unchanged, by 2010, most GMS countries had made significant progress in improving access to safe drinking water. As a result, more than 90 percent of people have access to improved water in Thailand, Vietnam and China. The corresponding figure for Myanmar is an impressive 83 percent, while both Cambodia and Laos have doubled the percentage of people with access, to 67 percent and 64 percent, respectively (Figure 18). The key challenge ahead for Cambodia, Laos and Myanmar is to bring about further increases in the coverage of improved drinking water sources, most importantly in their rural areas and the poorer regions. The challenge for China and Vietnam is to build on the current robust levels of coverage and work towards universal access to safe drinking water.
Figure 18: Trends in Access to Improved Water Sources (% of population with access), 1994-2010
64 67
8395 96 91
0.0
20.0
40.0
60.0
80.0
100.0
0.0
5.0
10.0
15.0
20.0
25.0
30.0
35.0
Cambodia Laos Myanmar Vietnam Thailand China
% o
f Po
pulat
ion
with
Acc
ess (
Late
st Y
ear)
Perc
enta
ge P
oint
Cha
nge
Percentage Point Change Latest Year
Source: World Bank-World Development Indicators 2013
6.3. Improved Sanitation
Achievements in providing improved sanitation have been more uneven across the GMS countries than progress in the provision of safe water. In the mid-1990s, Thailand had the highest percentage of the population with access to improved sanitation (88 percent) and Cambodia had the lowest at only 9 percent. Myanmar had the second highest sanitation access rate of 55 percent, followed by Vietnam (44 percent), China (32 percent) and Laos (16 percent). Once again, although that relative ranking among the GMS countries had remained largely unchanged by 2010, some GMS countries have made big strides in increasing the access rates, while others have lagged behind. With a 47 percentage point increase, Laos now has an access rate closer to that of China, and Vietnam has now

31Growth, Development and Inclusion in the Greater Mekong Subregion: An Assessment 31
reached the access rate of 76 percent and caught up with Myanmar (Figure 19). Despite more than tripling the access rate, Cambodia lags far behind the other GMS countries in the provision of improved sanitation. Similarly, despite a doubling, China’s current sanitation access rate is less impressive compared with the other GMS countries as well as relative to China’s per capita income. Going forward, Cambodia faces a daunting task in improving the provision of modern sanitation facilities. Cambodia’s rather high number of deaths due to water pollution is largely attributable to the low levels of access to sanitation and safe water and the very high percentage of people living on degraded land. The challenge seems to be more manageable yet significant for countries such as Laos and China, while Vietnam and Myanmar appear to be on course to catch up with Thailand’s close to universal sanitation access rate. Once again, as in the case of safe drinking water, with the exception of Thailand, the key challenge lies in bringing better sanitation within the reach and use of rural and poorer households.
Figure 19: Trends in Improved Sanitation Facilities (% of population with access), 1994-2010
32
63
76 76
96
65
0.0
20.0
40.0
60.0
80.0
100.0
120.0
0.0
20.0
40.0
60.0
80.0
100.0
120.0
Cambodia Laos Myanmar Vietnam Thailand China%
of
Popu
latio
n w
ith A
cces
s (La
test
Yea
r)
Perc
enta
ge P
oint
Cha
nge
Percentage Point Change Latest Year
Source: World Bank-World Development Indicators 2013
6.4. Electricity and Cooking Fuel
Achievements in providing access to other basic needs such as electricity and modern cooking fuels – which have a huge bearing on the health of the people – vary a great deal across the GMS countries. For example, while most people in China, Thailand and Vietnam have access to electricity, this is true for only 37 percent of people in Cambodia, while the figure for Laos is 55 percent (Figure 20). Close to two-thirds of households in Thailand have access to modern cooking fuel, whereas only about 3 percent of homes in Laos and 10 percent in Cambodia have such access. Even in Vietnam, only one-third of households use modern cooking fuels. As is to be expected, the key challenge is one of increasing the access to electricity and modern cooking fuels for poorer households in rural areas.

32 Growth, Development and Inclusion in the Greater Mekong Subregion: An Assessment
Figure 20: Access to Electricity, 2009 and 2011 (% of population with access)
0.0
20.0
40.0
60.0
80.0
100.0
Cambodia (2011)
Laos (2009)
Myanmar (2009)
Vietnam (2009)
China (2009)
Thailand (2009)
Source: World Bank-World Development Indicators 2013; GMS-DAN country study for Cambodia only
The heavy reliance on traditional fuels such as wood and charcoal results in excessive indoor air pollution that leads not only to respiratory and related health problems but also to human fatalities. Not surprisingly, the number of deaths due to indoor air pollution (per million people) in the GMS countries is almost inversely related to access to modern cooking fuels. In China, in addition to indoor air pollution, outdoor air pollution causes a large number of respiratory diseases and deaths.
6.5. Social Protection
How a country takes care of its most vulnerable people and households is a further indicator of the inclusivity of its development process. Social safety nets, such as benefits for the sick, disabled and unemployed, extra help for the poor, and pensions for the elderly, are essential components of a modern, inclusive society. Broadly, such social protection measures include social insurance (pension, health insurance, unemployment benefits and severance payments); social assistance (social transfers, i.e. social assistance for those in extreme need, such as health assistance, child welfare, assistance for the elderly, disability programmes, disaster relief); and labour market transfers (cash or food-for-work programmes, assistance for skill development and training). Government expenditure on these programmes is one measure of social protection. An index of social protection that adjusts such social protection expenditure to levels of per capita income and poverty of a country is an alternative measure (ADB 2013c). In terms of both of these measures, China provides the highest social protection among the GMS countries, followed by Vietnam, Thailand, Cambodia and Laos (Figure 21).
The challenge of providing effective social protection is thus most formidable for Cambodia and Laos (CDRI 2013; Nolintha et al., chap. 3). For the other GMS countries, it is important to gradually sustain the current levels of social protection, with continuous fine-tuning of their social protection programmes to meet changing needs as their development process matures in the coming years (Nguyen et al., chap. 4; Paitoonpong et al., chap. 5; Xiong et al., chap. 7).

33Growth, Development and Inclusion in the Greater Mekong Subregion: An Assessment 33
Figure 21: Social Protection Expenditure and Index, 2009
1.0 0.9
4.7
3.6
5.4
0.0
1.0
2.0
3.0
4.0
5.0
6.0
0.000
0.020
0.040
0.060
0.080
0.100
0.120
0.140
0.160
Cambodia Laos Vietnam Thailand China
% o
f G
DP
Inde
x
Overall Social Protection Index Social Protection Expenditures (% of GDP)
Source: ADB 2013c
7. CONCLUSIONS
In general, past growth in the GMS countries has been robust and inclusive in that poorer GMS countries have grown at faster rates. This has led to notable income convergence among them. The most remarkable income convergence has been achieved by China, which, by 2011, had replaced Thailand as the richest GMS country. Cambodia, Laos, Myanmar and Vietnam have also narrowed their income gaps with Thailand, although they still have a long way to go to completely catch up. Myanmar’s catching-up process, which is already underway, could accelerate in the years to come.
GMS countries have also undergone substantial structural changes. The share of agriculture in their national output and employment has declined and the shares of the industrial and service sectors have gone up. Hence, GMS countries have also seen notable structural convergence. These structural changes and convergences are likely to continue. In the process, people who are now employed in low-productivity agricultural occupations could move to higher paying industrial and service sector jobs, and even those who still remain in agriculture could enjoy more productive employment. If this process of structural change is well managed, it has the potential to make future growth highly inclusive.
Past growth among the GMS countries has been accompanied by significant poverty reduction, irrespective of the poverty line chosen. Growth has generally been pro-poor and inclusive, although achievements have varied quite a bit across the countries. With the exception of Thailand, which had substantially reduced poverty by the mid-1990s, China and Vietnam have made the most progress in poverty reduction. While Cambodia, Laos and Myanmar have all seen significant reductions in poverty in the past, they still have an equally long way to go before eliminating it. Furthermore, as the poor and the near-poor are more exposed to economic and environmental vulnerabilities that threaten their livelihoods and general quality of life, there is the added challenge of reducing these vulnerabilities. In almost all countries, including China and Thailand, the

34 Growth, Development and Inclusion in the Greater Mekong Subregion: An Assessment
remaining poor are mostly in rural areas and live in hard-to-reach mountainous regions; in Laos and Vietnam, they also belong to ethnic minority groups.
In terms of broader inequality and polarisation measures of income inclusiveness, past experience has been much more varied than that relating to pro-poorness of growth. Countries with higher income inequalities in the mid-1990s, for example Thailand and Cambodia, have seen a decline in inequalities – more than those whose inequalities were initially lower, such as Laos and Vietnam. Indeed, those latter countries have seen a rise in inequalities. China’s rise in income inequality and polarisation has been the most dramatic. China thus has the daunting task of reducing income inequality and polarisation, followed by Laos and Vietnam. Meanwhile, the key challenge for Cambodia and Thailand seems to be one of preserving the past gains and keeping inequality and polarisation from rising. Unlike the other GMS countries, the increase in inequality in China has been due mostly to a rise in the rural-urban income differential. This adds an intra-country regional dimension to China’s challenge.
Since the mid-1990s, GMS countries have made substantial progress in the various dimensions of health. Overall life expectancy has increased, maternal and child mortality rates have declined, and the incidence of contagious diseases has fallen. Outside of Thailand, improvements in health have been the most impressive in China and Vietnam. Going forward, despite their past successes, Cambodia and Laos face major challenges in bringing about further advancements in health – from improving maternal and child health to combating contagious diseases. Myanmar’s challenges are even more formidable, particularly given its very low public expenditure on health. Other GMS countries are more likely to face challenges in dealing with changes in disease patterns, away from primary health ailments and contagious diseases to more life-style and environment-related ones. China is a case in point, which is already seeing such changes in disease patterns and the consequent policy challenges (Yang et al. 2013; Lancet Commission 2013). Irrespective of the disease patterns, all GMS countries will need to pay increased attention to making access to affordable healthcare more equitable and inclusive – across geographic regions (by reducing rural-urban gaps in access) and across the different segments of the society (by reducing the rich-poor gaps in access).
GMS countries have also taken big strides in educating their youth. Even Cambodia and Laos are now close to achieving universal primary education. Achievements in secondary and tertiary education have, however, been much more varied across countries. In terms of secondary enrolments, while China and Vietnam have closed their gaps with Thailand, Cambodia and Laos are lagging far behind the rest of the GMS countries. In tertiary enrolment rates, despite a dramatic improvement, even China lags far behind Thailand. Once again, Cambodia, Laos, and Myanmar seem to have much more work to do in further educating their people – by making education more accessible and affordable to rural and poorer youth. That said, other countries, too, face huge challenges in improving access to higher education, not to mention the task of enhancing the quality of education at almost all levels.
35Growth, Development and Inclusion in the Greater Mekong Subregion: An Assessment 35
Meeting basic needs – electricity, safe water, improved sanitation, modern cooking fuels – on a more universal level is another priority for the GMS countries. Once again, this challenge is most pressing, as well as daunting, for the poorer GMS countries: Cambodia, Laos and Myanmar. The challenge for China and Vietnam is primarily one of building on the current robust levels of access to these basic facilities and working towards universal access in the coming years. Since these basic services have such a huge potential to promote good health, there is a need to coordinate interventions in these areas with programmes and policies for fostering wellbeing among the population at large. In terms of providing social protection, China tops the GMS table, with Vietnam and Thailand having reasonable degrees of social protection in place. The challenge of providing effective social protection is more formidable for Cambodia, Laos and Myanmar. At the same time, it is important to keep in mind that no amount of social safety nets and cash transfers is a substitute for facilitating better access at affordable prices to health, education and basic services from which even the most impoverished can benefit.
In both the income and non-income dimensions of inclusiveness, GMS countries are making significant progress in bringing about gender equality, although political empowerment of women has proceeded more slowly. Overall, it appears that Cambodia and Laos are lagging behind China and Vietnam on this front. Irrespective of the exact ranking of the GMS countries in gender equality, all would benefit vastly from working towards gender-neutral access to healthcare, education and other basic services.
In addressing these challenges for making growth and development more inclusive in the region, GMS countries need to recognise the nexus between poverty, health and education. Global development experience shows that the problems of poverty are magnified by the lack of access to healthcare and quality education experienced by the poor. Similarly, increasing educational opportunities should go hand in hand with better access to healthcare at affordable prices. Educated people, in turn, are better able to understand and follow healthy lifestyle practices and hence benefit from better healthcare facilities. Thus, policy actions and institutional reforms in each of these areas need to be well coordinated to maximise the impact of each individual set of interventions. Moreover, while many GMS countries need to step up public spending on health, education and other basic needs, they should also pay more attention to increasing the efficiency of these expenditures through better governance and institutional reforms.

36 Growth, Development and Inclusion in the Greater Mekong Subregion: An Assessment
REFERENCES
Acemoglu, Daron and James Robinson (2012), Why Nations Fail (New York: Crown Business)
ADB, Asian Development Bank (2012a), Asian Development Outlook 2012 – Confronting Rising Inequality in Asia (Manila: ADB)
ADB (2012b), Myanmar in Transition: Opportunities and Challenges (Manila: ADB)ADB (2013a), “Toward a More Innovative, Inclusive, and Integrated Asia and Pacific”,
Opening Address by President Takehiko Nakao at the ADB Annual Meeting, 4 May 2013, New Delhi
ADB (2013b), Myanmar Country Diagnostic Study: Policy Brief (Manila: ADB)ADB (2013c), The Social Protection Index – Assessing Results for Asia and the Pacific (Manila:
ADB)Alesina, Alberto and DaniRodrik (1994), “Distributive Politics and Economic
Growth”, Quarterly Journal of Economics, 109(2), pp.65-90Ali, Ifzal and Juzhong. Zhuang (2007), Inclusive Growth toward a Prosperous Asia: Policy
Implications, ERD Working Paper Series No. 97 (Manila: ADB)Barro, Robert J. (2000), “Inequality and Growth in a Panel of Countries”, Journal of
Economic Growth, 5, pp. 5-32Basu, Kaushik (2011), Beyond the Invisible Hand: Groundwork for a New Economics (New
Delhi: Penguin)Berg, Andrew, Jonathan David Ostry and Jeromin Zettelmeyer (2008), What Makes
Growth Sustained? IMF Working Paper 08/59 (Washington, DC: IMF)Bourguignon, Francois, Francisco Ferreira and Michael Walton (2006), Equity, Efficient
and Inequality Traps: A Research Agenda, Working Paper Series rwp06-025 (Harvard University, John F. Kennedy School of Government)
CDRI (2013), Cambodia’s Development Dynamics: Past Performance and Emerging Priorities (Phnom Penh: CDRI)
Center for Global Development (2013), Schooling Is Not Education! Using Assessment to Change the Politics of Non-Learning (Washington DC: Center for Global Development)
Commission on Growth and Development (2008), The Growth Report: Strategies for Sustained Growth and Inclusive Development (Washington, DC: World Bank)
International Monetary Fund (IMF) (2013), World Economic Outlook (Washington, DC: IMF)
Kanbur, Ravi and Michael Spence (2010), Equity and Growth in a Globalizing World: Commission on Growth and Development (Washington, DC: World Bank)
Kuznets, Simon (1955), “Economic Growth and Income Inequality”, American Economic Review 45(1), pp. 1-28
Lancet Commission (2013), “Global Health 2035: A World Converging within a Generation”, The Lancet 382, pp.1898-955

37Growth, Development and Inclusion in the Greater Mekong Subregion: An Assessment 37
Menon, Jayant (2013), “Narrowing the Development Divide in ASEAN: the Role of Policy”, Asian- Pacific Economic Literature 27(2), pp. 25-51
OECD, Organisation for Economic Cooperation and Development (2012), 2012 SIGI – Social Institutions and Gender Index: Understanding the Drivers of Gender Inequality (Paris: OECD)
Oxfam (2014), “Working for the Few: Political Capture and Economic Inequality”, Oxfam Briefing Paper, WWW.oxfam.org (accessed January 2014)
Persson, Torsten and Guido Tabellini (1994), “Is Inequality Harmful for Growth?” American Economic Review, 84(3), pp.600-621
Ravallion, Martin and Shaohua Chen (1997), “What Can New Survey Data Tell Us about Recent Changes in Distribution and Poverty?”,World Bank Economic Review 11(2), pp. 357-82
Rodrik, Dani (1999), “Where did all the Growth Go? External Shocks, Social Conflict and Growth Collapses”, Journal of Economic Growth 4(4), pp. 385-412
Sachs, Jeffrey D. (2011), The Price of Civilization: Economics and Ethics after the Fall (New York: Random House)
Salomon, Joshua A., Haidong Wang, Michael K Freeman, Theo Vos, Abraham D Flaxman, Alan D. Lopez, and Christopher JL. Murray (2012), “Healthy Life Expectancy for 187 Countries, 1990-2010: A Systematic Analysis for the Global Burden Disease Study 2010”, The Lancet, 380 (9859), pp. 2144-2162
Stiglitz, Joseph E. (2012), The Price of Inequality (London: Penguin)Tandon, Ajay, and Zhuang Juzhong (2007), “Inclusiveness of Economic Growth in the
People’s Republic of China: What Do Population Health Outcomes Tell Us?” ERD Policy Brief Series No. 47 (Manila: ADB)
UNDP, United Nations Development Programme (2010), Human Development Report 2010: The Real Wealth of Nations – Pathways to Human Development (New York: UNDP)
UNDP (2011), Human Development Report 2011: Sustainability and Equity – A Better Future for All (New York: UNDP)
UNDP (2013), Human Development Report 2013: The Rise of the South – Human Progress in a Diverse World (New York: UNDP)
WEF, World Economic Forum (2012), The Global Gender Gap Report 2012 (Geneva: WEF)
WEF (2014), The Global Risk Report, 2014 (Geneva: WEF)World Bank (2013) World Development Indicators 2013, http://databank.worldbank.org/
data/download/WDI-2013-ebook.pdf (accessed July 2013)Yang Gonghuan, Yu Wang, Yixin Zeng, George F Gao, Xiaofeng Liang, Maigeng
Zhou, Xia Wan, Shicheng Yu, Yuhong Jiang, Mohsen Naghavi, Theo Vos, Haidong Wang, Alan D. Lopez, Christopher J. L. Murray (2013), “Rapid Health Transition in China, 1990-2010: Findings from the Global Burden of Disease Study 2010”, The Lancet, 381, pp. 1987-2015


39Inclusive Development in Cambodia: An Assessment 39
Chapter 2Inclusive Development in Cambodia: An Assessment
by Roth Vathana and Lun Pide

40 Inclusive Development in Cambodia: An Assessment
1. INTRODUCTION
1.1. Growth, Poverty and Inequality
Improvement in aggregate or average income is considered the main goal of all economies; overall economic growth is believed to be an effective means to achieve this, albeit not the only one. An often cited “trickle down” effect is well projected in the literature, implying that as long as rapid and sustained growth of real gross domestic product per capita is attained, income distribution will take care of itself (e.g., World Bank 2000, 1990; Ravallion & Chen 1997; Fields 2001; Kraay 2006).
Experiences in most developing countries largely support the positive relation between average income growth and poverty reduction. China is a case in point where a 10 percent annual growth rate has lifted millions of Chinese from poverty, which fell from about 60 percent at the onset of reform to 10 percent in 2004 (Dollar 2007).Other statistical data in China also support the claim that overall economic growth will benefit the poor.
However, this is hardly the end of the development agenda, given the sizeable variations in the contribution of economic growth to poverty reduction. One immediate observation from urban-rural income distribution in China, for example, is a growing income disparity (NBS 2011). Although the average income in rural areas implies that more people are moving into higher income brackets, there exists a widening relative income gap. An interesting question is why this is so and what impact it has on the economy.
1.2. Growth, Poverty and Inequality in Cambodia’s Development
Cambodia has been one of the fastest growing economies in the world, achieving an average annual growth rate of 8 percent for the past decade and double digit growth in 2004-07 (ADB 2011). The World Bank (2012b) is optimistic about the country’s growth, at least for this and the next two years, foreseeing a reasonable rate of approximately 6.7 percent per annum. The devastating flood in 2011, jeopardising industrial and, especially, agricultural production, and the ongoing global financial and European debt crises, have impacted the country’s GDP, yet the economy recovered relatively quickly. Increased private consumption, still vibrant exports of garments and textiles, mainly to the US and EU, increased foreign and domestic investment, the effort to increase milled rice exports to 1 million tonnes by 2015 and the increased number of visitor (3.1 million in 2011) all have a share in this success.
Economic liberalisation and trade openness in Cambodia are high. Indicators of openness include membership of ASEAN and the World Trade Organisation, a free inflow and outflow of foreign and domestic capital and a trade volume that exceeds 80 percent of GDP (RGC 2012: 13). Strong growth is also attributable partly to the country’s flexible fiscal and, to a lesser extent, monetary policies. The government was responsive and agile in addressing the flood and global financial crisis. The government’s budget deficit reached its highest level, 8.4 percent of GDP, in 2009, due mainly to the stimulus package enacted to mitigate the global economic slowdown (World Bank 2012b).

41Inclusive Development in Cambodia: An Assessment 41
However, challenges remain to ensure sustained growth and to be competitive, particularly with the implementation of ASEAN Economic Community initiatives. The country’s economy depends mainly on agriculture, tourism, garments and construction (Guimbert 2010: 3). Major manufacturing products are garments and textiles and a few agro-related products such as paddy, rice, fish and rubber exported mainly to the US and EU. The rule of law is still a major concern. Doing business is seen as complicated, slow and relatively unpredictable. Informal fees and the many procedures with government agencies and ministries are a concern. Cambodia was ranked 138th of 183 economies for ease of doing business (World Bank 2012a).
The next question is how growth should be distributed to ensure that the benefits reach the majority of society, not just a small group. Distribution of overall economic benefits can be examined through a poverty reduction lens. A high poverty incidence when growth is high implies that the benefits do not reach the poorest quintiles. Even when growth does reduce poverty, this can be hindered by increased inequality.
The trickle-down effect of Cambodia’s high growth over the last decade is ambiguous in view of rising inequality, from Gini coefficients of 39.6 in 2004 to 43.1 in 2007 (World Bank 2009: ix). The reduction of poverty is worth applauding, but the fact that the rural poverty rate fell more slowly than the urban rate suggests that the urban-rural income gap has widened. This puts a question mark on the country’s development prospects when sustained growth and poverty alleviation, especially among the rural population, are the next priorities.
1.3. Objectives, Rationale and Structure
Trickle-down effects are debatable, and practitioners and economists have largely come to agree that growth alone, albeit a precondition for a well-developed economy, is not enough to produce a recognisable reduction in poverty incidence (Ali & Son 2007: 1). There is also a debate on Kuznets’ theoretical discussion of a growth-inequality hypothesis, asserting that inequality increases only temporarily during the early stages of growth, but decreases when workers move from low-productivity agriculture to high-productivity industry (Kuznets 1955; Arthur 1983; Ali 2007). Some studies also signal the adverse consequences of rising inequality. Widening income inequality or unequal access to assets or public goods and services poses a threat to socio-political stability and undermines poverty reduction and subsequently growth (Alesina & Rodrik 1994; Alesina & Perotti 1996; ADB 2007: 10). Alongside growth, there should be mechanisms, tailored to the development context, to enlarge the economic base to incorporate marginalised groups and those who are left behind by prosperity. The government needs to ensure that the majority of society can participate in, contribute to and benefit from growth.
In the last two decades, terms have emerged in the literature to discuss how the poor can be aided. The most common terms are pro-poor growth—either absolute or relative—and inclusive growth. Pro-poor growth has been central in development thinking and practices in the 2000s. Although defining pro-poor growth is less controversial,

42 Inclusive Development in Cambodia: An Assessment
achieving it has been hotly debated and elusive. Some argue that the poor will benefit from sustained fast growth, indicating that redistribution is not so important since it can hamper economic efficiency. Others articulate that growth without redistribution is not enough to help the poor and vulnerable, so governments must design policies biased to the poor to ensure that they are able to participate in, contribute to and benefit from growth. Thus, both efficiency and equity have to be considered. Inclusive growth is not a completely new concept; it largely embodies the concept and, to some extent, measurement, of pro-poor growth. In fact, pro-poor growth is sometimes called “shared” or “inclusive” growth (e.g., Wiggins & Higgins 2008: 1). However, what seems new is that it encompasses not only the income (consumption) dimension but also other aspects, the two most important of which are social protection and access to economic opportunities, especially employment. The dynamism of inclusive growth is mainly the change in access to opportunity. Inclusive growth also necessitates that growth be accompanied by decreasing inequality in both income and opportunities in order to ensure economic and political stability and social cohesion.
The study therefore contributes to a growing empirical literature on pro-poor and inclusive growth, specifically applied to Cambodia. The paper also aims to examine how much inequality affects the nexus of growth and poverty. Lastly, the paper seeks to provide an update on the poverty profile in Cambodia, decomposing poverty rates by population sub-groups.
Three aspects distinguish our paper from others on growth, poverty and inequality in Cambodia. First, in addition to outlining the poverty profile, we examine empirically whether the country’s growth has been pro-poor in relative terms, meaning that inequality declines over time. The relation between growth and poverty in Cambodia is rather ambiguous, demanding an empirical poverty decomposition to clarify the nexus. No paper, to the best of our knowledge, has done that. The World Bank’s (2009) “Poverty profile and trend in Cambodia” is the most commonly cited report on poverty and inequality. There have been other reports by CDRI diagnosing poverty, but these employ data which is mostly not nationally representative. The government also produces its own poverty figures using an asset approach with data from the commune database (World Bank 2009; Tong 2012; RGC 2012: 15). Jalilian et al. (2009: 4) estimate that the growth elasticity of poverty in Cambodia is about 1, below the developing country average, which is between 2.5 and 5. However, as the authors acknowledge, this is a rough estimate and does not take into account the inequality elasticity of poverty, which is believed to affect poverty reduction (Wiggins & Higgins 2008: 3). Using an inclusive growth index, McKinley (2010: 19) scores Cambodia as 5.05 for economic inclusiveness, which is satisfactory (defined as between 4 and 7). However, the study does not systematically take inequality into account, and the weighting scheme is somewhat subjective. Second, we extend this pro-poor framework to non-income dimensions: education, healthcare and household wealth. This extension is necessary to investigate poverty through a “capability” lens (Sen 1999: 87). Lastly, our analysis aligns with the concept of inclusive growth. We also examine qualitatively access to economic opportunities disaggregated into occupations, regions and household characteristics.

43Inclusive Development in Cambodia: An Assessment 43
The rest of the paper is organised as follows. Section 2 highlights recent academic and policy debates on pro-poor and inclusive growth. Section 3 outlines conceptual, analytical and theoretical discussions on growth, poverty, inequality and their nexus. Section 4 describes the data used in the analyses. Section 5 highlights consumption and non-consumption indicators of interest and price indices used in calculating real terms. Section 6 analyses the poverty profile, including the poverty headcount ratio and inequality, while Section 7 details pro-poor growth in both income and non-income dimensions. Section 8 highlights a number of policy constraints on achieving inclusive growth. Section 9 concludes the paper and provides some recommendations.
2. LITERATURE REVIEW
2.1. Growth, Poverty and Inequality
Poverty is multidimensional. Answering questions about the poor—Who are they? Where do they live? What are their occupations? How many are there? What makes them poor?—is an important first step if governments are to tackle the issue and create effective policies to help them. Haughton and Khandker (2009: 3) write that there are at least four good reasons to measure poverty: (1) to put the poor on the development agenda, (2) to design policies to alleviate poverty, (3) to establish systematic monitoring and evaluation to measure the effectiveness of interventions and (4) to evaluate institutional effectiveness.
The World Bank (1990: 26) defines poverty as “the inability to attain a minimal standard of living”. One of the difficulties in measuring poverty is choosing indicators that best represent well-being or standard of living. Often used indicators are income and consumption per capita. However, deprivation can be more than an unacceptably low income or insufficient food; it can also be lack of access to education and health, employment opportunities or even freedom of expression and political involvement. Sen (1999: 87) goes a step further, arguing that a person can be deprived not only through low income but also by lack of “capability”, even though low income is an important precondition for impoverishment.
We know well enough that good policies—political and macro-economic stability, investment in physical and human capital, a stable and strong financial system etc.—are necessary for sustained fast growth, and this growth will later have positive consequences for poverty reduction. On the other hand, we do not know much about the nexus of policies and income growth and change in income distribution. There has been almost a consensus among economists and practitioners that sustained fast growth is a predisposing condition for any well-developed economy and specifically for poverty reduction. Yet it is hardly sufficient. Disagreement flourishes over how growth can be channelled to the bottom quintiles; how to ensure growth that is pro-poor and inclusive has been a hotly debated issue.
Lopez (2011, 2004: 5) provides a concise review of pro-poor growth definitions that have been used in practice and for policy making, and the contributions of reviewed papers in explaining and measuring pro-poor growth. He argues that pro-growth strategies are
44 Inclusive Development in Cambodia: An Assessment
pro-poor strategies in the long run regardless of their effect on income inequality. The poor generally benefit from growth that results from good policies; and there is no statistically significant evidence on the impact of income inequality on growth. Ravallion and Chen (2003) argue that the poor do not lose in either absolute or relative terms from increased average living standards. In other words, poverty will fall during boom times and worsen during contractions. Kraay (2006) points out that overall income growth will be pro-poor in the medium and long terms. Thus, policies and institutional changes that aim at improving “broad-based” economic growth are said to be pro-poor.
Roemer and Gugerty (1997) write that the effect of growth on poverty has a “one-to-one” relation for the poorest 40 percent, meaning that average growth of real per capita income of 10 percent would translate into a 10 percent increase in the income of the poorest 40 percent. The relation between growth and income of the poorest 20 percent is “one to 0.921”: a 10 percent increase in average income would mean a 9.2 percent increase in the income of the poorest 20 percent. The study also argues that policies that ensure a sound and stable macro-economy and openness to the world are significant for poverty reduction, affecting poverty mainly through sustained, fast economic growth. Adam (2004) shows that the size of the effect of growth on poverty reduction depends largely on how one defines economic growth. He writes that poverty could be reduced by 27.9 percent by 10 percent growth if “growth” refers to increased average income (consumption). However, if growth is defined as the increase in GDP per capita, the growth elasticity of poverty would be a statistically insignificant 1 to -2.27. Easterly (1999) finds that, generally, life is good during fast growth and growth per se does not significantly affect income distribution. Others who find no impact of growth on income inequality include Dollar and Kraay (2002), Ravallion and Chen (1997) and Deininger and Squire (1996).
The definition and measures of these studies have their own problems in that there might be a scenario in which the poor can benefit unacceptably little from growth (e.g., Lopez 2011: 5). They also neglect the effects of income inequality on poverty reduction. Moreover, these studies are usually criticised on the basis that cross-country data often masks countries’ differences in development, how they define the poor and poverty line and regional and household characteristics. Also, the experience and data of some country case studies do not simply articulate this straightforward relation between growth and poverty reduction. Analysts agree that household survey data is superior to macro-level data of growth and per capita income for diagnosing the poverty profile and examining growth, the poor and their relationship.
Kakwani and Pernia (2000) define pro-poor growth as any growth in which the poor benefit proportionally more than the rich, meaning that the average income of the poorest quintiles has to increase proportionally more than the overall average: inequality must fall over time. The authors argue that total poverty elasticity is attributable to both growth and inequality effects. They propose a pro-poor growth index in which growth is pro-poor when the index is greater than 1. A criticism of this proposed definition and measure is that it can suggest efficiency-equity trade-offs having to compromise high growth with redistribution. Governments need to design policies that are biased to

45Inclusive Development in Cambodia: An Assessment 45
the poor so as to assist them to participate in, contribute to and benefit from growth. Progressive taxes and social protection schemes are examples.
Both arguments have validity in practice and policy making. But the applicability of these definitions and measures is highly dependent on a number of economic and political characteristics. Clearly, one cannot simply ignore the effect of inequality on poverty reduction, for high inequality can cause socio-political turmoil and hinder the effort to alleviate poverty and sustain growth. Income differences between and within regions have widened in some fast growing economies, e.g. China and Cambodia. This might imply that although the poor benefit from growth, the distribution has been uneven (Ravallion & Chen 2004; World Bank 2009). Therefore, if the poor are not assisted in some ways and at certain times, their ability to participate in, contribute to and benefit from growth might be further jeopardised. Temporary assistance is even more necessary in low-income countries, where initial inequality of income and capability is high.
There might be several reasons for increased inequality. First, individual endowments and factor inputs largely explain the difference in income distribution. Another underlying factor is job “mobility” from agriculture to non-agriculture. How flexible an individual can be in moving from one employment to another generally has implications for income distribution. Other social and political aspects advanced in the literature, such as education, health and trade liberalisation, have also contributed (Birdsall et al. 1995; Motonishi 2006; Wan & Zhou 2005; Kuznets 1955; Kanbur & Zhang 2005; Bourguignon & Morrison 1998). Wan and Zhou (2005) argue that geography, capital inputs, farming structure and other inputs are the contributing factors to income inequality. Motonishi (2006) show that the shift from agriculture to non-agriculture, education and financial development partly explained increased income inequality in Thailand. Kanbur and Zhang (2005) assert that policies promoting heavy industry, trade liberalisation and decentralisation in China have contributed to urban-rural and costal-inland inequality.
Others have focused on decomposing growth patterns of poverty and inequality rather than examining the effects of overall growth. One question that these studies have tried to evaluate is whether the sectoral composition of economic activities—mainly agriculture, industry and services—influences poverty and inequality dependently and/or independently of GDP growth (Montalvo & Ravallion 2010; Tiffin & Irz 2006; Benjamin et al. 2005). Montalvo and Ravallion (2010) indicate that although secondary and tertiary sectors have contributed significantly to overall economic growth, agriculture has been the driving force in lifting millions of Chinese out of poverty. Tiffin and Irz (2006) also find strong evidence to support the claim that agriculture is the driving force for growth in developing countries, while the trend was mixed in developed countries. The decomposition of growth’s effect on poverty and inequality has been significant for at least two reasons. If the assertion that the sectoral pattern of growth independently affects poverty and inequality holds, policies to redistribute income would be directed to the sector that does the heavy lifting against poverty. Secondly, understanding the real causes of poverty and inequality would be an asset to achieve checks and balances between growth and inequality given that a reasonable level of inequality might not be detrimental to growth.

46 Inclusive Development in Cambodia: An Assessment
Measuring poverty is challenging, but not as challenging as designing and keeping track of the effectiveness of interventions and institutions devoted to poverty alleviation. Regarding the causality of growth, poverty and inequality, three things stand out in the literature that deserve more careful conceptual and analytical attention. First, most of the early studies on poverty and growth used cross-country data to test the relations empirically. This can make generalisation of the results vulnerable because of diverse development contexts and policies. Second, the causality of economic growth and income inequality has been mixed. Countries like Japan, South Korea, and Singapore have grown their economies and maintained a reasonable level of inequality, while others such as China, Indonesia, Vietnam, Cambodia and Thailand have not yet narrowed income disparities. Thus, it is not impossible to achieve high growth with relatively acceptable level of inequality. Formally, unclear causality between growth and inequality might create an endogeneity problem. Third, data unavailability or limitations, particularly longitudinal data, constrained early studies. However, recently more comprehensive and sophisticated country and household socio-economic data have become available to researchers.
2.2. Inclusive Growth
Inclusive growth is a fairly recent concept and theoretical framework. The ADB considers any growth as inclusive if it enlarges economic opportunities and makes them available to the poor, non-poor and rich. Two aspects of inclusive growth are that it is “non-discriminatory” and “disadvantage-reducing” (Klasen 2010; Rauniya & Kanbur 2010, 2009; OECD 2008; Lundstrom & Ronnås 2006). This implies that economic growth, mainly of income, needs to be accompanied by declining inequality. The World Bank’s similar definition acknowledges growth as inclusive if it involves the majority of the society through employment generation (Ianchovichina & Lundstrom 2009). However, the bank seems not to put so much emphasis on reducing inequality, arguing that one of the distinctive characteristics of inclusive growth is that it is long term, while income redistribution is a short-term strategy or should not be pursued. That would mean that as long as the poor benefit from growth, no matter how small the benefit is and even if inequality remains unchanged or increases, that achievement is economically and socially satisfactory.
Clearly, how researchers define inclusive growth reflects the economic and political thinking on which they rely. The World Bank’s lesser emphasis on redistribution and view that government should not interfere in economic activities seem deeply rooted in Western economic thought. Nonetheless, that ideology is more likely to be effective in economies where initial inequality is relatively low and individuals start from a fairly similar point. Thus, short- and medium-term government interventions in the market to ensure a level playing field are viewed as necessary, especially for developing countries such as Cambodia.
47Inclusive Development in Cambodia: An Assessment 47
3. THEORETICAL FRAMEWORK
It is necessary to emphasise the reasons we utilise a pro-poor growth approach to assess economic inclusiveness in Cambodia. First, the paper adopts the inclusive definition proposed by the ADB, which acknowledges that sustained rapid growth needs to be accompanied by declining income and non-income inequality. Thus, the pro-poor growth approach of Kakwani and Pernia (2000) is applicable. Second, as mentioned earlier, there seems to be no unified framework for inclusive growth. Some of the proposed approaches to evaluate country progress include growth diagnostics to identify constraints possibly impeding growth (Hausmann et al. 2008); the extension of growth diagnostic analytics of Hausmann, Rodrik and Velasco’s framework proposed by Ianchovichina and Lundstrom (2009); a social opportunity function similar to a social welfare function (Ali & Son 2007); an inclusive growth index (McKinley 2010).
These analytical frameworks have both merits and problems. The rationale for growth diagnostics of Hausmann et al. (2008) is the belief that there might be constraints on rapid growth; removing those can accelerate economic growth and subsequently improve other development indicators such as poverty reduction. Nonetheless, this approach uses firms as units of analyses, ignoring specific household characteristics. Also, the framework does not handle inequality effects on poverty systematically. McKinley (2010) proposes a single index which is to be compared with a pre-determined threshold of growth performance. The good point about this approach is that it takes a wide variety of variables—growth, social protection, employment, gender and even access to electricity—into account. Each indicator is weighted based on its perceived importance. However, a limitation is that this weighing is quite subjective. Secondly, the approach seems to demand well-recorded and multidimensional data sets, which are limited in developing countries. Lastly, he does not consider the inequality elasticity of poverty. Some of these limitations were also raised by the author (McKinley 2010: 12). Ali and Son (2007) use a social welfare function to decompose access to opportunities such as education and health in order to average the growth in opportunity of a society and its distribution. They construct an “equity index of opportunity (OEI)” to measure the degree of economic inclusiveness. Their rationale is that opportunity is dependent on two factors: (1) average available opportunity and (2) how the opportunity is distributed. This proposed analytical framework is akin to that of Kakwani and Son (2008) used in this paper (non-income dimension). Appendix B provides detailed accounts of the pro-poor growth framework proposed by Kakwani and Son (2008).
4. DATA
The study uses four rounds of the Cambodia Socio Economic Survey (CSES)—2004, 2007, 2009 and 2011— and three rounds of the CDHS—2000, 2005 and 2010. Annex Tables 1 and 2 illustrate observations of the primary sampling unit (villages) and sampled households in each village of the CSES and some important characteristics

48 Inclusive Development in Cambodia: An Assessment
of the Cambodia Demographic and Health Survey. The survey sample size varied in each round, a complete CSES of 15,000 sampled households occurring every five years. Surveys of a relatively small sample size of a little more than 3000 households have been conducted by the National Institute of Statistics every year since 2007.
A major objective of the CSES is to understand socio-economic characteristics of Cambodian households nationwide to assist in policy making and keep track of policy interventions. The CSES aims to measure household income and consumption/expenditure and other important characteristics. Indicators of eight main social-political-cultural areas are reported; these include demographic characteristics, housing, agriculture, education, labour force, health and nutrition, victimisation and household income and consumption. These characteristics fit the needs of our paper and especially the proposed frameworks.
Stratified sampling1FF in three stages was used to select required sample size.
The required number of PSU (villages) were selected in the first stage. Then, enumeration areas were picked from each village; and the number of households was selected from each area in the last stage. This sampling design has implications for our calculation of population characteristics, e.g., mean income/consumption or poverty headcount. Failing to take the sampling design into account can potentially generate biased and unrepresentative results. Thus, household weight—already calculated and available in the data set—will be used. There are missing observations, the differences between sample size shown in the survey design and those in the actual data sets, but they are negligible (refer to Annex Table 1 for details).
We utilise the CDHS data set in 2000, 2005 and 2010, where data on years of schooling, school attendance, child mortality and nutrition and household assets is available. The CDHS is a rich data set providing a wide array of information on especially infant and maternal health situations. The survey produced four datasets in 1998, 2000, 2005 and 2010. A nationally representative selection of men and women aged 15-49 was interviewed across 14 individual provinces and five groups of provinces,2 both urban and rural (see Annex Table 2 for detailed samples of each year).
1 For detailed information on sampling design, please refer to the technical report on survey design and implementation of each CSES.
2 Fourteen individual provinces: Banteay Meanchey, Kompong Cham, Kompong Chhnang, Kompong Speu, Kompong Thom, Kandal, Kratie, Phnom Penh, Prey Veng, Pursat, Siem Reap, Svay Rieng, Takeo and Oddar Meanchey. Five groups of provinces: Battambang and Pailin, Kampot and Kep, Preah Sihanouk and Koh Kong, Preah Vihear and Stung Treng, and Mondolkiri and Ratanakkiri. In 2000, there were only 12 individual provinces, and in 1998 there were none.

49Inclusive Development in Cambodia: An Assessment 49
5. INDICATORS OF WELL-BEING AND CAPABILITY, CONSUMER PRICE INDEX (CPI) AND POVERTY LINES
5.1. Indicators of Interest
Two variables are central to measuring the poverty rate: indicators of interest and poverty line. The latter represents a predetermined line of well-being or standard of living below which a household is considered poor. One often observed difficulty in poverty measurement is the selection of indicators to denote well-being or standard of living. The most widely used indicator is either income or consumption. Many would argue that consumption expenditure is more reliable and correct since households are more willing to report what they have spent than what they have earned. There has also been agreement that, on average, high household consumption largely reflects high income; thus, income and consumption are two sides of the same coin.
Haughton and Khandker (2009: 30) write that income is often used as a measure of living standard in developed economies while consumption is more commonly used in low-income countries. They show that using consumption has three advantages: (1) it shows the current material standard of living, (2) it smoothes irregularities and (3) it is less understated than income. We employ consumption as a measure of well-being because of its relative accuracy—at least in Cambodia—and the fact that previous studies used consumption/expenditure to measure poverty (e.g., World Bank 2009). Consumption consists of food and non-food items (see Appendix E for details of 2009 and 2011 consumption; for 2004 and 2007, see World Bank 2009: 106-108). Household daily per capita consumption is used as the indicator of household well-being. To ensure robustness, expenditure per adult equivalent (“OECD expenditure”) is also used.
The proxies for well-being are multi-dimensional. Three main dimensions are chosen: education, health and standard of living. Our choice of the three dimensions is motivated by the well-known UN multi-dimensional poverty index, which uses them. We utilise the CDHS data sets of 2000, 2005 and 2010 (see Annex Table 3 for detailed non-income variables). We extend Kakwani’s pro-poor growth approach in which the non-income growth elasticity of poverty is measured and decomposed into pure non-income growth and inequality effects. Households that are income/consumption poor might not be education poor or vice versa. In such a case, we might observe different pro-poor growth outcomes between monetary and non-monetary dimensions.
5.2. CPI and Poverty Lines
The study uses national poverty lines to prepare a poverty profile and calculate a pro-poor growth index against which progress is evaluated. Although there have been frequent recommendations to the government to update the consumption basket, which would be key to a new poverty line, previous studies, notably by the World Bank, have employed inflation-adjusted 1993-94 poverty lines. We do not attempt to estimate a new consumption bundle given the enormity of the task and the information required. We simply adopt the existing food and non-food poverty lines and CPI available for 2004 and 2007 prepared by the World Bank (2009). The remaining task is to estimate CPI and poverty lines for 2009 and 2011.

50 Inclusive Development in Cambodia: An Assessment
Annex Tables 4, 5, 6 and 7 provide CPI and poverty lines. Cambodia’s poverty lines are based on food and non-food components and are expressed as daily per capita expenditure for Phnom Penh, other urban and rural areas. The food poverty line is based on an average subsistence diet of 2100 calories per day. Thus the updated regional food poverty line for 2007 is obtained by multiplying the 2004 food poverty line by temporal food prices of each region (Annex Table 5). Three-step procedures were used to estimate the food poverty line from one study period to another (World Bank 2009: 6). The first step involves calculating regional price differences using village food prices available in the CSES and the quantity weighting from the 1993-94 baseline reference food bundle. The second step is to estimate food price inflation in Phnom Penh. The last step is to combine spatial and Phnom Penh prices to estimate other urban and rural prices. Although this method can be accurate, it is lengthy and complicated. Therefore the study only estimates the Phnom Penh CPI and assumes a proportional increase (decrease) in the other two regions. To update the non-food poverty line, we estimate the average non-food CPI in Phnom Penh and assume the increase (decrease) in the two other regions. These prices are used to inflate the non-food poverty line in 2004.
6. POVERTY PROFILE ANALYSIS
6.1. Updates on per Capita Household Consumption
The World Bank (2009: vii) finds that real per capita household consumption increased between 2004 and 2007 in all three geographical areas. The poverty headcount for the whole population relative to the national poverty line declined from 34.8 percent in 2004 to 30.1 percent in 2007, while the poverty headcount relative to the food poverty line fell from 19.7 percent to 18.0 percent in the same period. During this period, average real per capita consumption increased by 21 percent, and by 10.7 and 11.5 percent amongst the poorest and next poorest quintiles respectively. The study also reports that the reduction in poverty coincided with increased consumption inequality, from Gini 39 in 2004 to 43 in 2007.
The study estimates similarly increasing per capita consumption and poverty reduction from 2004 to 2007 and from 2009 to 2011 (Annex Table 8). Current per capita daily consumption increased from KHR3384.33, plus or minus KHR129.39, in 2004 to KHR5248.29, plus or minus KHR467.65, in 2007.3 Average per capita consumption in Cambodia grew from KHR3384.33 in 2004 to KHR8766.69, plus or minus KHR594.25, in 2011. A statistically significant analysis of variance test ( rejects the null hypothesis of equal sample means between the years. Annex Figure 1 and Table 8 further decompose current per capita household consumption by population sub-groups.
Current per capita consumption increased between 2004 and 2011 in all three domains, except for a slight decrease in ‘other urban’ during 2009-11. The general trend depicted
3 The confidence interval within which the value of variables of interest lies is more useful than point estimates. The interval estimates are used to avoid any strong conclusions from the results and the arguments that can arise when there are different estimates between this and previous studies.

51Inclusive Development in Cambodia: An Assessment 51
in Annex Table 8 is that per capita household consumption of all sub-groups increased from 2004, and the between-group mean differences in each year are statistically significant at 1 and 5 percent confidence levels. This implies that the living standards and household well-being of average Cambodians improved. The per capita consumption of households increased between 2004 and 2011, but the per capita consumption of households whose head worked in agriculture grew the most. However, per capita consumption in these households is still lower than in households whose head works in industry or services. Another point worth mentioning is that per capita consumption is significantly higher in female-headed households than in male-headed ones. However, the standard error of per capita consumption of female-headed households is larger, indicating that the generalisation is weak.
6.2. Poverty Estimates
6.2.1. Consumption Annex Figures 1 and 2 present probability density functions of real daily per capita household consumption for the four survey rounds and three geographical domains using pooled data. The general trend since 2004 is that per capita consumption has increased, implying that the poorest quintiles increased their consumption. Consumption distributions have been skewed to the right; the level of skewedness rose from 10.8 in 2004 to 17.9 in 2011. However, it is not uncommon to observe such distributions in per capita consumption. The shift partly reflects increased living standards and well-being of average Cambodians and provides an early indication that the poverty headcount ratio is declining. The improvement in per capita consumption can largely be attributed to the double digit GDP growth between 2004 and 2007 and the quick recovery from the 2008 global financial crisis and the 2011 flood.
The ongoing European debt crisis has not yet devastated Cambodia’s exports, mainly garments. The government has been praised for its responsiveness and agility in adopting a stimulus package and reallocating resources to priority and flood-affected sectors and areas. This expansionary policy caused a government budget deficit of 8.4 percent of GDP in 2009 (World Bank 2012b).
It is worth emphasising the increase in per capita household consumption between 2007 and 2009. The common perception was that consumption would decrease given the low GDP growth to 0.1 percent in 2009 from 10.2 percent in 2007 (World Bank 2012b). For instance, during 2008-09, exports of goods dropped by 14.2 percent, and garment exports were down 19.0 percent. Fixed asset investment in garments approved by the Council for the Development of Cambodia went down 52.6 percent between 2007 and 2009 (CDC 2007, 2009). The situation might be expected to decrease living standards, contrary to the picture presented in Annex Figure 2. But the survey data we use reveal that overall consumption growth was positive. Two reasons are advanced to explain this. First, there have always been discrepancies between macro and micro survey data, especially on consumption. Second, a substantial number of households were surveyed in the last two quarters of 2008, before income and consumption were significantly affected by the crises.
52 Inclusive Development in Cambodia: An Assessment
This study avoids calculating exact values for the proposed class of Foster, Greer and Thorbecke and other poverty estimates for two reasons. First, we agree with the recommendation of the World Bank (2009) that the government should construct new poverty lines and alter the ways in which poverty is monitored because the commonly used poverty lines based on the consumption bundle of 1993-94 are dated. Using inflation-adjusted 1993-94 poverty lines to calculate poverty rates for subsequent years could result in an unrealistically low level of poverty, and our estimates for 2009 and 2011 support that concern. Thus the study is unable to construct a new consumption bundle for a more realistic and reliable poverty line for 2009 and 2011. Second, although we can report the confidence interval within which the poverty rate might fall, reporting exact figures is still controversial and politically sensitive. Therefore, the study reports the overall trends.
Annex Figure 4 presents the poverty headcount index based on real per capita household consumption. This is a sensitivity test for poverty estimates based on particular poverty lines. It clearly shows that, regardless of the poverty line, the poverty headcount rate fell from 2004. The results also depict the improved situation of households who live near or far from the poverty lines. Annex Figure 5 illustrates that since 2004 the poverty gap has decreased, suggesting that the living standards of the poor have improved (also see Annex Figure 7). Annex Table 10 shows that, although the richest 10 percent had 33.0 percent of the total consumption, the share of the bottom 10 and 20 percent has increased since 2004. The same table shows that middle-class families have gradually increased their consumption share.
Disaggregating poverty reveals a number of interesting observations. First, poverty is largely still a rural phenomenon (Annex Figure 12). This conclusion is supported by disaggregating the poverty headcount ratio by occupation of the household head. Annex Figure 15 shows that poverty is high in households whose heads work in agriculture and low among households whose heads work in services and industry sectors. Also, the poverty incidence is high among families whose heads never attended school. The higher the heads’ education, the more families are able to consume.
6.2.2. Non-Consumption DimensionsThe average education of household adult members (15 and over) did not change much between 2000 and 2010 (Annex Table 11). They average 3.3 years of schooling—less than two years in the lowest quintile and five years in the top group. This suggests that enhancing adult education has not been a major focus of the government. The average years of schooling of children increased from 2000 to 2005 but declined in 2010.
Childhood mortality has been declining over time. The under-five mortality rate was 124 per 1000 live births in 2000 but dropped to 83 in 2005 and 54 in 2010, a decrease of 56 percent within 10 years. Children’s nutritional status significantly improved between 2000 and 2005, with a reduction in the number of stunted, wasted and underweight children. However, the performance was not satisfactory in the following five years; the number of underweight children showed almost no improvement, the number of
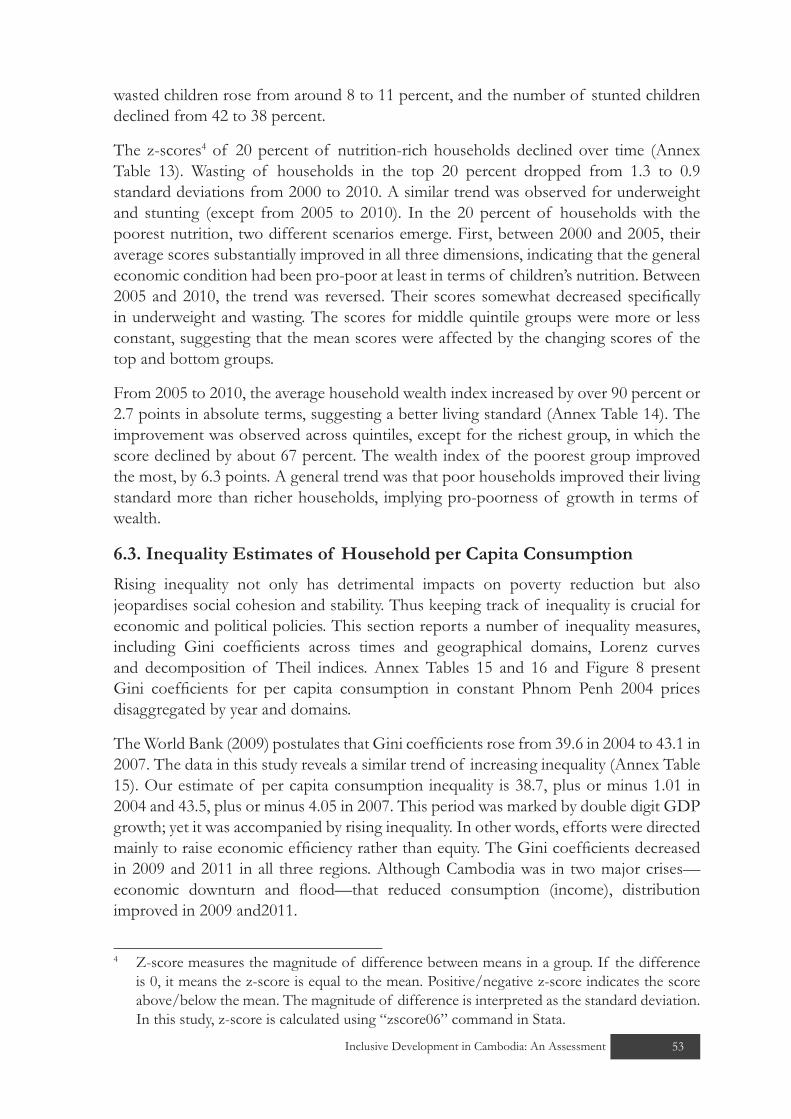
53Inclusive Development in Cambodia: An Assessment 53
wasted children rose from around 8 to 11 percent, and the number of stunted children declined from 42 to 38 percent.
The z-scores4 of 20 percent of nutrition-rich households declined over time (Annex Table 13). Wasting of households in the top 20 percent dropped from 1.3 to 0.9 standard deviations from 2000 to 2010. A similar trend was observed for underweight and stunting (except from 2005 to 2010). In the 20 percent of households with the poorest nutrition, two different scenarios emerge. First, between 2000 and 2005, their average scores substantially improved in all three dimensions, indicating that the general economic condition had been pro-poor at least in terms of children’s nutrition. Between 2005 and 2010, the trend was reversed. Their scores somewhat decreased specifically in underweight and wasting. The scores for middle quintile groups were more or less constant, suggesting that the mean scores were affected by the changing scores of the top and bottom groups.
From 2005 to 2010, the average household wealth index increased by over 90 percent or 2.7 points in absolute terms, suggesting a better living standard (Annex Table 14). The improvement was observed across quintiles, except for the richest group, in which the score declined by about 67 percent. The wealth index of the poorest group improved the most, by 6.3 points. A general trend was that poor households improved their living standard more than richer households, implying pro-poorness of growth in terms of wealth.
6.3. Inequality Estimates of Household per Capita Consumption
Rising inequality not only has detrimental impacts on poverty reduction but also jeopardises social cohesion and stability. Thus keeping track of inequality is crucial for economic and political policies. This section reports a number of inequality measures, including Gini coefficients across times and geographical domains, Lorenz curves and decomposition of Theil indices. Annex Tables 15 and 16 and Figure 8 present Gini coefficients for per capita consumption in constant Phnom Penh 2004 prices disaggregated by year and domains.
The World Bank (2009) postulates that Gini coefficients rose from 39.6 in 2004 to 43.1 in 2007. The data in this study reveals a similar trend of increasing inequality (Annex Table 15). Our estimate of per capita consumption inequality is 38.7, plus or minus 1.01 in 2004 and 43.5, plus or minus 4.05 in 2007. This period was marked by double digit GDP growth; yet it was accompanied by rising inequality. In other words, efforts were directed mainly to raise economic efficiency rather than equity. The Gini coefficients decreased in 2009 and 2011 in all three regions. Although Cambodia was in two major crises—economic downturn and flood—that reduced consumption (income), distribution improved in 2009 and2011.
4 Z-score measures the magnitude of difference between means in a group. If the difference is 0, it means the z-score is equal to the mean. Positive/negative z-score indicates the score above/below the mean. The magnitude of difference is interpreted as the standard deviation. In this study, z-score is calculated using “zscore06” command in Stata.

54 Inclusive Development in Cambodia: An Assessment
Annex Figure 8 shows Gini coefficients for per capita consumption disaggregated by geographical domains. The general observation is that inequality decreased in all three areas between 2004 and 2011. Gini coefficients in Phnom Penh decreased from 36.5 in 2004 to 29.5 in 2011 while those in other urban dropped from 43.7 to 33.1. Gini coefficients in rural areas decreased from 38.7 to 36.0 in the same period.
Decomposition of Theil’s L and T indices on real per capita consumption reveals similar decreased inequality for Cambodia and geographical areas (Annex Table 19). Theil’s L shows that inequality fell by 9.3 percent between 2004 and 2011 to 0.224. Decreased inequality was also observed in the three domains, significantly so in other urban (-43.3 percent) and Phnom Penh (-36.8 percent). Inequality was attributable mainly to within-group differences.
7. PRO-POOR GROWTH
7.1. Consumption
Basically, living standards of the poor can be improved through two channels: (1) consumption (income) can be redistributed from the rich to the poor and (2) consumption (income) of both the poor and rich can increase (Easterly 2001: 14). The latter can constitute two additional circumstances: the consumption (income) of the poor can increase equally with or more than that of the rich. Although previous empirical studies, notably that by Ravallion and Chen (2004) and Kraay (2006), postulated that poverty reduction has been much more attributable to sustained rapid growth and the statistical association is one-to-one (Kraay 2006), growth is hardly a sufficient condition per se for poverty reduction and is not a panacea. The above studies seem to imply that if distribution does not get worse, growth elasticity of poverty will be strong. However, practical examples especially in most poor countries do not really strictly follow the suggested findings. Even if growth does not jeopardise distribution, how growth is distributed is necessary and largely sufficient. Thus, thoroughly understanding the effects of growth and inequality on poverty reduction is crucial not only for policy making but also for sustainability and social cohesion.
Annex Table 21 presents the breakdown of total poverty elasticity to growth and inequality effects using the relative pro-poor growth framework proposed in section 3. The decomposition is done using a class of Foster, Greer and Thorbecke poverty indices as shown in the first column, namely the poverty headcount ratio, poverty gap and squared poverty gap. Column (a) depicts actual growth of per capita household consumption. The figures in column (a) are slightly different from those in Table 9 because we used a logarithm form to calculate growth figures in Table 15 rather than the level form used in Table 9, in order to ensure consistency of form in calculating total poverty elasticity. Column (e) illustrates the pro-poor indices to assess pro-poorness of outcome indicators. The indices are evaluated against the thresholds presented in Table 32 of Appendix B.
The proportion below the national poverty line, as measured by the poverty headcount ratio, dropped by 4.70 percentage points from 2004 to 2007—an average of 1.60 percent
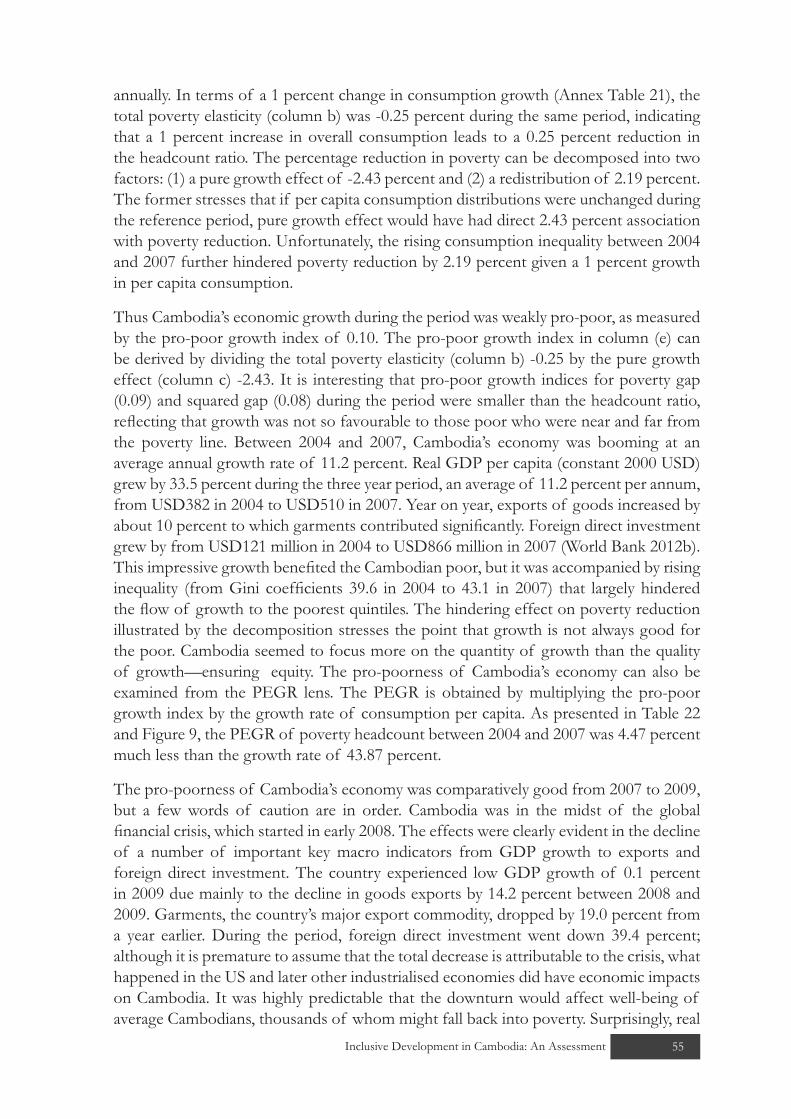
55Inclusive Development in Cambodia: An Assessment 55
annually. In terms of a 1 percent change in consumption growth (Annex Table 21), the total poverty elasticity (column b) was -0.25 percent during the same period, indicating that a 1 percent increase in overall consumption leads to a 0.25 percent reduction in the headcount ratio. The percentage reduction in poverty can be decomposed into two factors: (1) a pure growth effect of -2.43 percent and (2) a redistribution of 2.19 percent. The former stresses that if per capita consumption distributions were unchanged during the reference period, pure growth effect would have had direct 2.43 percent association with poverty reduction. Unfortunately, the rising consumption inequality between 2004 and 2007 further hindered poverty reduction by 2.19 percent given a 1 percent growth in per capita consumption.
Thus Cambodia’s economic growth during the period was weakly pro-poor, as measured by the pro-poor growth index of 0.10. The pro-poor growth index in column (e) can be derived by dividing the total poverty elasticity (column b) -0.25 by the pure growth effect (column c) -2.43. It is interesting that pro-poor growth indices for poverty gap (0.09) and squared gap (0.08) during the period were smaller than the headcount ratio, reflecting that growth was not so favourable to those poor who were near and far from the poverty line. Between 2004 and 2007, Cambodia’s economy was booming at an average annual growth rate of 11.2 percent. Real GDP per capita (constant 2000 USD) grew by 33.5 percent during the three year period, an average of 11.2 percent per annum, from USD382 in 2004 to USD510 in 2007. Year on year, exports of goods increased by about 10 percent to which garments contributed significantly. Foreign direct investment grew by from USD121 million in 2004 to USD866 million in 2007 (World Bank 2012b). This impressive growth benefited the Cambodian poor, but it was accompanied by rising inequality (from Gini coefficients 39.6 in 2004 to 43.1 in 2007) that largely hindered the flow of growth to the poorest quintiles. The hindering effect on poverty reduction illustrated by the decomposition stresses the point that growth is not always good for the poor. Cambodia seemed to focus more on the quantity of growth than the quality of growth—ensuring equity. The pro-poorness of Cambodia’s economy can also be examined from the PEGR lens. The PEGR is obtained by multiplying the pro-poor growth index by the growth rate of consumption per capita. As presented in Table 22 and Figure 9, the PEGR of poverty headcount between 2004 and 2007 was 4.47 percent much less than the growth rate of 43.87 percent.
The pro-poorness of Cambodia’s economy was comparatively good from 2007 to 2009, but a few words of caution are in order. Cambodia was in the midst of the global financial crisis, which started in early 2008. The effects were clearly evident in the decline of a number of important key macro indicators from GDP growth to exports and foreign direct investment. The country experienced low GDP growth of 0.1 percent in 2009 due mainly to the decline in goods exports by 14.2 percent between 2008 and 2009. Garments, the country’s major export commodity, dropped by 19.0 percent from a year earlier. During the period, foreign direct investment went down 39.4 percent; although it is premature to assume that the total decrease is attributable to the crisis, what happened in the US and later other industrialised economies did have economic impacts on Cambodia. It was highly predictable that the downturn would affect well-being of average Cambodians, thousands of whom might fall back into poverty. Surprisingly, real

56 Inclusive Development in Cambodia: An Assessment
GDP per capita rose by 4.5 percent from 2007 to 2009. Secondly, one of this study’s weaknesses is that we are not able to compute actual figures on a class of Foster, Greer and Thorbecke poverty, particularly for 2009 and 2011, and there is a need to compute new poverty lines. The current inflation-adjusted 1993/94 poverty lines are likely to be outdated given the changing consumption behaviour of Cambodians. Nonetheless, this shortcoming does not prevent constructing a pro-poor growth index for those periods because our sensitivity analysis reveals that the poverty rate has dropped since 2004 regardless of poverty line.
As shown in Figure 4, the poverty headcount ratio dropped after 2004 regardless of poverty line, providing an optimistic view of the economy and especially the living standards of the poor. In terms of a 1 percent change (Annex Table 21), the total poverty elasticity between 2007 and 2009 was -2.30 percent, indicating that a 1 percent increase in consumption growth would translate into a 2.30 percent reduction in poverty. The reduction was attributable to a pure growth determinant of 3.04 percent and distribution factor of 0.74 percent. Although inequality elasticity of poverty is positive, hindering the effect of growth on poverty, the magnitude was small. In addition, the pro-poor growth index of 0.76 indicates the economy between the two periods was pro-poor. This can be verified by examining the PEGR (30.67 percent), which was only slightly less than actual growth. The pro-poor growth indices of 0.81 for poverty gap and 0.85 for squared gap indicate that growth has been favourable to those who are far from poverty lines.
The period between 2009 and 2011 was marked by two major events: recovery from the impacts of the global financial and European debt crises, which significantly affected Cambodia’s exports, particularly garments, and the devastating flood. These crises caused concern that Cambodia’s narrowly based economy would slow and the proportion below the national poverty line could significantly increase. However, the economy rebounded to a GDP growth rate of 6.9 percent in 2011. In three years, fixed asset investment in textiles and footwear increased by an annual average growth rate of 52.85 percent from USD120.9 million to USD431.5 million (CDC 2009, 2011). Total exports rose by 19.4 percent annually and of textiles and footwear by 18.5 percent. Exports to the US went up 11.3 percent per annum, while exports to the EU rose from USD689 million to USD1.4 billion (Ministry of Economy and Finance 2009, 2011). Another event contributing to recovery was the initiative of exporting 1 million tonnes of milled rice by 2015. The “rice policy paper” was both adopted by the Council of Ministers and officially launched in 2010 with the objective of producing a surplus of 4 million tonnes of paddy rice and at least 1 million tonnes of milled rice exports (Committee for Economic and Financial Policy 2011:1). Rice exports jumped from USD10.9 million in 2009 to USD107 million in 2011.
The results of our decomposition align with this performance. The proportion below the national poverty line declined between 2009 and 2011; the conclusion is supported
5 Present value was used to calculate annual growth rate. The formula is given by PV = FV x (1+g)t, where PV is the present value, FV is the future value, g is the annualised growth rate between the initial and terminal periods and t is the total duration. Thus, the annualised growth rate g is given by g = (FV/PV)1⁄t - 1.

57Inclusive Development in Cambodia: An Assessment 57
by the sensitivity analysis (Figure 4). The total poverty elasticity between the periods was -0.68 percent, implying that a 1 percent increase in consumption growth contributed a 0.68 percent reduction in poverty. The reduction is decomposed into a pure growth effect of -0.50 percent and distribution factor of -0.17 percent. Inequality between 2009 and 2011 significantly improved, indicating to some extent that the poor are able to participate in, contribute to and benefit from growth. The pro-poor growth index of 1.34 means that the economy between the two periods was strictly pro-poor. This can be verified by examining the PEGR (15.17 percent,) which was more than the actual growth of 10.78 percent. Indices of 1.26 for poverty gap and 1.42 for squared gap indicate that growth has been favourable to those far from poverty lines.
7.2. Non-Consumption
We break down the results of each non-consumption indicator into three periods: from 2000 to 2005, 2005 to 2010 and 2000-2010.
As illustrated in Annex Table 23, the improvement in nutrition among children between 2000 and 2005 is highly pro-poor. The progress of the health-poor group was larger than the health-non-poor group within this period, reflecting a better policy focus on the improvement of children’s health. The growth in mean z-scores of stunting, underweight and wasting indicators is all pro-poor. In absolute terms, the increase by 0.036 standard deviations of stunting z-score reduces stunted children (those below -2 standard deviations) by 0.05 percent. This reduction in headcount of stunted children is contributed by both the improvement in z-score itself (a better nutrition condition) and the improvement in distribution of z-score—in the absence of growth, the stunting headcount falls by 0.04 percent. This makes the growth pro-poor. The pro-poor index for stunting is large, 6.25. For wasting and underweight, the results are similar and highly pro-poor in the same period. Pro-poor growth index of wasting is 3.41, while underweight is 1.25.
However, from 2005 to 2010, the results are mixed. The stunting indicator is pro-poor. The improvement in mean z-score (0.15 standard deviations) translates into a 0.05 percent reduction in the number of stunted children, which is entirely caused by growth of z-score alone while the distribution remains unchanged. This indicator would have been highly pro-poor if the distribution of z-score had been more in favour of the poor. There is almost no improvement in mean z-score of the underweight indicator within the period, yet the growth is still pro-poor. The logic is that negative growth, which translates into a rising incidence of underweight children, is offset by a better distribution, making the headcount of underweight children decline (by 0.012 percent). There was an improvement of z-scores among the lowest group, yet the significant decline in z-scores of top groups made the mean z-score subside. The situation is still pro-poor. The wasting indicator is less pro-poor. A reduction in mean z-scores of wasting increases incidents of wasting in children as one might expect (shown by the negative pure growth effects) while the distribution of z-scores worsens, making the overall poverty elasticity increase by 0.03 percent. Investigating growth and its quality from 2000 to 2010, the results are that it is highly pro-poor. There is progress in children’s nutrition within the

58 Inclusive Development in Cambodia: An Assessment
period, accompanied by a better distribution. This suggests the pace of reduction of malnourished children is fast as distribution improves.
The pro-poorness of growth as judged from education varies between adults and children. While there is no general definition as to who is education poor, we arbitrarily define the education poor as those whose years of schooling are the lowest 30 percent. We use the base year’s poverty line to calculate the poverty headcount used to compute poverty elasticity and pro-poor index. For example, the line in 2005 is used to calculate pro-poor index between 2005 and 2010 while the line in 2000 is used between 2000 and 2005. Annex Table 24 shows the results.
Between 2000 and 2005, the general improvement in household education is moderately pro-poor; the pro-poor index is 0.45. The average 0.28 increase in years of schooling of all household members reduces the education poor by 0.04 percent, an outcome due to higher pure growth elasticity (-0.09) but poor distribution (+0.05). That means the growth outcome benefits the education rich more than the education poor. In the same period, adult education experienced almost no change. The CDHS data show that education of household heads remained about 3.3 years between 2000 and 2010. Informal education might play a role to improve the education of these people. There is of course much literature suggesting a high return to productivity from education, especially at primary level. Children’s education, shows significant change as one might expect, and it is highly pro-poor.
From 2005 to 2010, despite a reduction in household education (by 0.15 years), the outcome is still pro-poor. While negative growth results in more education-poor households, a better distribution offsets much of the negative effects. As shown in Table 24, a 0.15 reduction in years of schooling puts 0.09 percent more households into education poverty, but the inequality effect moves 0.08 percent of households out of education poverty. The adverse effect would have been more serious if the distribution had worsened or not improved. Children’s education follows the same trend: negative growth but still pro-poor.
The other dimension to examine is the standard of living measured by the wealth index. Data on wealth index of households in 2000 is not available, so we can discuss only the results in 2005 to 2010. Within that period, on average, the wealth index improved by around 2.7 points. This improvement therefore reduces the headcount of wealth-poor households defined by those who in 2005 were in the lowest 30 percent. The size of the decline is 0.11 percent. This growth outcome is highly pro-poor, as wealth distribution improves in favour of the poor group. The distribution helps 0.07 percent of households to move out of the poor group (Annex Table 25).
The link between the health and education of households and their wealth status is interesting, to see whether poorer households in terms of wealth also have poorer health and education than richer households. This is similar to what Grosse et al. (2008) call conditional pro-poor growth. Apart from that, we use a wealth index instead of income data because CDHS data does not include consumption or income data. As shown in
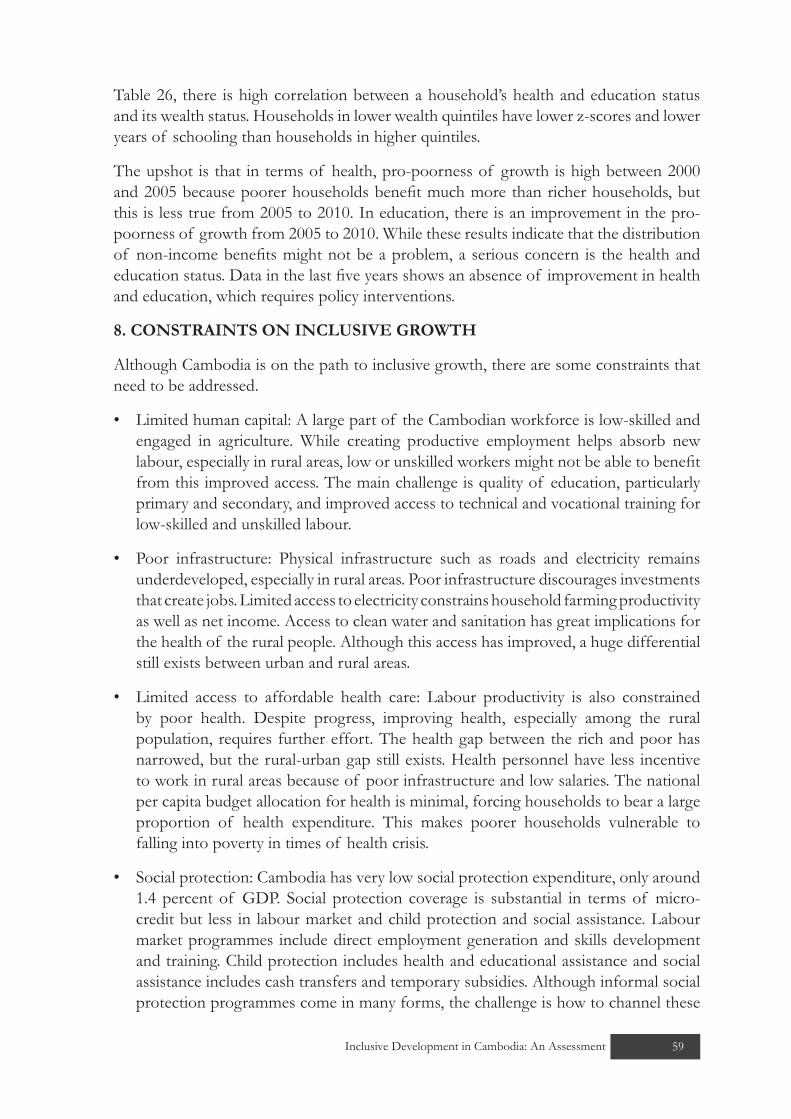
59Inclusive Development in Cambodia: An Assessment 59
Table 26, there is high correlation between a household’s health and education status and its wealth status. Households in lower wealth quintiles have lower z-scores and lower years of schooling than households in higher quintiles.
The upshot is that in terms of health, pro-poorness of growth is high between 2000 and 2005 because poorer households benefit much more than richer households, but this is less true from 2005 to 2010. In education, there is an improvement in the pro-poorness of growth from 2005 to 2010. While these results indicate that the distribution of non-income benefits might not be a problem, a serious concern is the health and education status. Data in the last five years shows an absence of improvement in health and education, which requires policy interventions.
8. CONSTRAINTS ON INCLUSIVE GROWTH
Although Cambodia is on the path to inclusive growth, there are some constraints that need to be addressed.
Limited human capital: A large part of the Cambodian workforce is low-skilled and • engaged in agriculture. While creating productive employment helps absorb new labour, especially in rural areas, low or unskilled workers might not be able to benefit from this improved access. The main challenge is quality of education, particularly primary and secondary, and improved access to technical and vocational training for low-skilled and unskilled labour.
Poor infrastructure: Physical infrastructure such as roads and electricity remains • underdeveloped, especially in rural areas. Poor infrastructure discourages investments that create jobs. Limited access to electricity constrains household farming productivity as well as net income. Access to clean water and sanitation has great implications for the health of the rural people. Although this access has improved, a huge differential still exists between urban and rural areas.
Limited access to affordable health care: Labour productivity is also constrained • by poor health. Despite progress, improving health, especially among the rural population, requires further effort. The health gap between the rich and poor has narrowed, but the rural-urban gap still exists. Health personnel have less incentive to work in rural areas because of poor infrastructure and low salaries. The national per capita budget allocation for health is minimal, forcing households to bear a large proportion of health expenditure. This makes poorer households vulnerable to falling into poverty in times of health crisis.
Social protection: Cambodia has very low social protection expenditure, only around • 1.4 percent of GDP. Social protection coverage is substantial in terms of micro-credit but less in labour market and child protection and social assistance. Labour market programmes include direct employment generation and skills development and training. Child protection includes health and educational assistance and social assistance includes cash transfers and temporary subsidies. Although informal social protection programmes come in many forms, the challenge is how to channel these

60 Inclusive Development in Cambodia: An Assessment
into formal programmes. The enacting of the National Social Protection Strategy in 2011 could pave the way for an integrated social protection system.
Weak governance: The World Bank’s governance indicators rank Cambodia lower • than other countries in ASEAN for rule of law, which includes contract enforcement, property rights, police and courts as well as the likelihood of crime and violence. Corruption is also a concern; despite improvement, the country scores low on this indicator. The other dimension to look at is whether Cambodia’s regulatory environment is supportive of private sector development. The ease of doing business indicator, which captures the regulatory environment, ranked Cambodia 138 out of 183 countries in 2012, moving up from 147 in 2010. This position is better than Laos and Timor-Leste. Cambodia scores very poorly (171) in the starting business indicator, the lowest among ASEAN countries. Cambodia still has lengthy, complex and costly procedures to go through for those wishing to start a business.
9. CONCLUSION AND RECOMMENDATIONS
The objectives of this report are: (1) to provide an updated poverty profile in Cambodia and population sub-groups, (2) to contribute to empirical literature on pro-poor growth—in relative terms—and inclusive growth and (3) to decompose total poverty elasticity. The poverty profile analysis presents poverty and inequality using a number of measures (e.g., a class of Foster-Greer-Thorbecke poverty indices and Gini coefficients). The pro-poor growth framework proposed by Kakwani and Pernia (2000) is used to decompose total poverty elasticity to growth and inequality effects. The decomposition is done for both income and non-income dimensions.
The report uses four rounds of the Cambodia Socio-Economic Survey (20004, 2007, 2009 and 2011) and three rounds of the Cambodia Demographic and Health Survey (2000, 2005 and 2010). Inflation-adjusted 1993-94 poverty lines are the yardstick used to calculate the proportion of the poor and to assess their situation. Although the existing poverty lines are likely to be outdated, the study could not calculate new poverty lines. Additionally, the study adopts the consumer price index proposed by the World Bank (2009) between 2004 and 2007. For 2009 and 2011 we estimated CPI for the three regions by using the Phnom Penh CPI.
The results show that the poverty incidence decreased over the observed periods. Between 2004 and 2007, the poverty headcount index dropped from 34.8 to 30.1 percent. This reduction was accompanied by rising inequality, from Gini coefficients of 39.6 to 43.1 (World Bank 2009). Poverty reduction continued over 2007 to 2009 and to 2011. The study does not provide exact figures for poverty, particularly from 2007. However, reduced poverty incidence was confirmed by the sensitivity analysis. The poverty rate also decreased in the three major geographical domains. Phnom Penh has the lowest poverty rate, followed by ‘other urban’ and then rural. Despite improvements, poverty is still a rural phenomenon indicating that both private and public investment in education, health and infrastructure should be increased. The poverty rate is also high among households whose heads work in agriculture and have no education. During the

61Inclusive Development in Cambodia: An Assessment 61
observed periods, inequality decreased noticeably in all three regions. Between 2004 and 2011, inequality of per capita household consumption, as measured by the Gini coefficient, dropped from 38.7 in 2004 to 36.0 in 2011.
Based on consumption, Cambodia’s economy has been moderately pro-poor since 2004, indicating a gradual move from quantity of growth to quality of growth. Between 2004 and 2011, the pro-poor growth index was 0.53. The index is obtained by dividing total poverty elasticity by the pure growth effect if the average growth in per capita consumption between the reference periods is positive. The total elasticity was -1.80 percent which could be decomposed into pure growth effect of -3.40 percent and inequality effect of 1.60 percent. The pure growth of -3.40 percent indicates that the average growth rate of per capita consumption reduced poverty by 3.40 percent if distribution remained unchanged. However, the inequality effect of 1.60 percent prevented such a direct flow of growth. The study found that improved distribution since 2004 has had a favourable impact on the poor. The detrimental effect of inequality could be seen in the pro-poor growth index of 0.10 between 2004 and 2007. The total poverty elasticity of -0.25 percent was attributable to the pure growth effect of -2.43 and the inequality effect of 2.19 percent. Poverty would have been further reduced if distribution were unchanged or inequality had decreased.
Cambodia is also on track toward achieving non-consumption pro-poor growth, the main contributor to inclusive growth. The standard of living has substantially improved and is pro-poor. The overall performance in terms of health, proxied by the nutritional status of children, has been just satisfactory. Between 2000 and 2005 the improvement was dramatic and highly pro-poor, suggesting that there existed an effective policy geared toward improving health for this group. However, the progress from 2005 to 2010 was slower and uneven. Education was also uneven. Pro-poorness of growth was observed in both 2000-05 and 2005-10 for children’s education, but not for overall education in 2000-05. While achieving pro-poor growth in this non-consumption dimension is a path to inclusive growth, the challenge is to ensure the growth itself. While distribution of non-consumption indicators was good, the growth of, for example, nutritional indicators was slow or absent between 2005 and 2010, slowing poverty reduction. Therefore, high growth among those non-consumption dimensions is even more important than the quality of such growth.
Although the study cannot comment on what policies are likely to promote pro-poor or inclusive growth, the report makes some preliminary recommendations.
The report joins in a recommendation by the World Bank (2009) that a new set of • poverty lines should be developed because the existing inflation-adjusted 1993/94 poverty lines are likely to be outdated. The study finds that, using those existing poverty lines, the proportion of the poor, particularly for 2009 and 2011, was surprisingly low and might not reflect the actual number of poor.
Poverty is decreasing, but the figure depends on the poverty line (e.g., USD1.25 or • USD2 per capita consumption per day). This indicates that Cambodia should consider

62 Inclusive Development in Cambodia: An Assessment
a new way of monitoring poverty. A higher poverty line is not only relevant for policy making but also enhances rigorous and accurate strategic planning. Cambodia will be moving into the lower middle income category in roughly the next three years if the country grows at an average annual rate of 7 percent. This could mean that Cambodia is not eligible for some favourable conditions it now receives. The ASEAN Economic Community will require rigorous monitoring of the economy and poverty.
Questions in the Cambodia Socio-Economic Survey should be kept consistent from • one round to the next to allow comparisons. Additionally, the National Institute of Statistics should maintain panel data of households. This would allow us to understand better the situation of the poor and movement into and out of poverty.
Improved distribution complements an average increase in consumption in improving • the lives of the poor. Thus, distributional policies and mechanisms are an integral part of the growth agenda. The official five-year National Social Protection Strategy has kick-started the process. However, effective and transparent implementation is a concern.
The report puts priority on improving non-consumption indicators, especially • the nutritional status of children and adult education. Distributional policy in this dimension is important but perhaps not a priority in that little growth of those indicators is observed, and it will remain a challenge for the country for many years to come.

63Inclusive Development in Cambodia: An Assessment 63
REFERENCES
Adam, Richard H. Jr. (2004), “Economic Growth, Inequality and Poverty: Estimating the Growth Elasticity of Poverty”, World Development, 32 (12), pp. 1989-2014
ADB (2011), Key Indicators for Asia and the Pacific, Statistical Database System (Manila: ADB)
ADB (2007), Key Indicators 2007: Inequality in Asia (Manila: ADB)Alesina, Alberto & Dani Rodrik (1994), “Distributive Politics and Economic Growth”,
Quarterly Journal of Economics, 109 (2), pp. 465–490Alesina, Alberto & Roberto Perotti (1996), “Income Distribution, Political Instability,
and Investment”, European Economic Review, 40 (6), pp. 1203–1228Ali, Ifzal (2007), “Inequality and the Imperative for Inclusive Growth in Asia”, Asian
Development Review, 24 (2), pp. 1–16Ali, Ifzal & Son Hwa Hyun (2007), “Measuring Inclusive Growth”, Asian Development
Review, 24 (1), pp. 11-31 Arthur, Lewis W. (1983), “Development and Distribution”, in Mark Gersovitz (ed.),
Selected Economic Writings of W. Arthur Lewis (New York: New York University Press)Birdsall, Nancy, David Ross & Richard Sabot (1995), “Inequality and Growth
Reconsidered: Lessons from East Asia”, World Bank Economic Review, 9 (3), pp. 477-508
Benjamin, Dwayne, Loren Brandt & John Giles (2005), “The Evolution of Income Inequality in Rural China”, Economic Development and Cultural Change, 53 (4), pp. 769-824.
Bourguignon, Francois & Christian Morrison (1998), “Inequality and development: the role of dualism”, Journal of Development Economics, 57, pp. 233-257
CDC (2011), Projects Approved, Cambodian Investment Board (Phnom Penh: CDC)CDC (2009), Projects Approved, Cambodian Investment Board (Phnom Penh: CDC)CDC (2007), Projects Approved, Cambodian Investment Board (Phnom Penh: CDC)Committee for Economic and Financial Policy (2011), Review Report on the Implementation
of the Policy Paper on the Promotion of Paddy Production and Rice Export 2010-2011 (Phnom Penh: Committee for Economic and Financial Policy)
Deininger, Klaus & Lyn Squire (1996), “A New Data Set Measuring Income Inequality”, World Bank Economic Review, 10 (3), pp. 565-591
Dollar, David (2007), Poverty, Inequality, and Social Disparities during China’s Economic Reform, World Bank Policy Research Working Paper No. 4253 (Washington, DC: World Bank)
Dollar, David & Aart Kraay (2002), “Growth is Good for the Poor”, Journal of Economic Growth, 7 (3), pp. 195-225
Easterly, William (2001), The Elusive Quest for Growth (Cambridge: MIT)Easterly, William (1999), “Life during Growth”, Journal of Economic Growth, 4 (3), pp.
239-276Fields, Gary S. (2001), Distribution and Development (New York: Russell Sage Foundation)Foster, James, Joel Greer & Erik Thorbecke (1984), “A Class of Decomposable
Poverty Measures”, Econometrica, 52 (3), pp. 761-766

64 Inclusive Development in Cambodia: An Assessment
Grosse, Melanie, Kenneth Harttgen & Stephan Klasen (2008), “Measuring Pro-Poor Growth in Non-Income Dimension”, World Development, 36 (6), pp. 1021-1047
Guimbert, Stephane (2010), Cambodia 1998-2008: An Episode of Rapid Growth, World Bank Policy Research Working Paper No. 5271 (Washington, DC: World Bank)
Haughton, Jonathan & Shahidu R. Khandker (2009), What Is Poverty and Why Measure It? Handbook on Poverty and Inequality (Washington, DC: World Bank)
Hausmann, Ricardo, Bailey Klinger & Rodrigo Wagner (2008), Doing Growth Diagnostics in Practice: A ‘Mindbook’, CID Working Paper No. 177 (Cambridge: Harvard University)
Ianchovichina, Elena & Susanna Lundstrom (2009), Inclusive Growth Analytics Framework and Application, World Bank Policy Research Working Paper 4851 (Washington, DC: World Bank)
Jalilian, Hossein, Chan Sophal, Glenda Reyes & Chan Hang Saing (2009), Global Financial Crisis Discussion Series, Paper 4: Cambodia (London: Overseas Development Institute)
Kakwani, Nanak & Son Hyun G. (2008), “Poverty Equivalent Growth Rate”, Review of Income and Wealth, 54 (4), pp. 643-654
Kakwani, Nanak & Ernesto M. Pernia (2000), “What is Pro-poor Growth?” Asian Development Review, 18 (1), pp. 2-15
Kanbur, Ravi & Zhang Xiaobo (2005), “Fifty Years of Regional Inequality in China: a Journey Through Central Planning, Reform, and Openness”, Review of Development Economics, 9 (1), pp. 87-106
Klasen, Stephan (2010), Measuring and Monitoring Inclusive Growth: Multiple Definitions, Open Questions, and Some Constructive Proposals, Sustainable Development Working Paper Series 12 (Manila: ADB)
Kraay, Aart (2006), “When is growth pro-poor? Evidence from a panel of countries”, Journal of Development Economics, 80, pp. 198-227
Kuznets, Simon (1955), “Economic Growth and Income Inequality”, American Economic Review, 45 (1), pp. 1-28
Lopez, Humberto J. (2011), Pro-poor growth: a review of what we know (and of what we don’t), Poverty Reduction Group (Washington, DC: World Bank)
Lopez, Humberto J. (2004), Pro-Growth, pro-poor: Is there a trade-off ?, World Bank Policy Research Working Paper No. 3378 (Washington, DC: World Bank)
Lundstrom, Susanna & Per Ronnås (2006), Integrated Economic Analysis for Pro-Poor Growth (Stockholm: SIDA)
McKinley, Terry (2010), Inclusive Growth Criteria and Indicators: An Inclusive Growth Index for Diagnosis of Country Progress, Sustainable Development Working Paper Series 14 (Manila: ADB)
Ministry of Economy and Finance (2011), Exported Products (Phnom Penh: MEF)Ministry of Economy and Finance(2009), Exported Products (Phnom Penh: MEF)Montalvo, Jose, G. & Martin Ravallion (2010), “The pattern of growth and poverty
reduction in China”, Journal of Comparative Economics, 38, pp. 2-16Motonishi, Taizo (2006), “Why has income inequality in Thailand increased? An
analysis using surveys from 1975 to 1998”, Japan and the World Economy, 18, pp. 464-487

65Inclusive Development in Cambodia: An Assessment 65
National Bureau of Statistics (2011), China’s Statistical Yearbook (Beijing: NBS) NIS (2000), Cambodia Demographic and Health Survey 2000, (Phnom Penh: National
Institute of Statistics)NIS (2005), Cambodia Demographic and Health Survey 2005, (Phnom Penh: National
Institute of Statistics)NIS (2010), Cambodia Demographic and Health Survey 2010, (Phnom Penh: National
Institute of Statistics)OECD (2008), Growing Unequal? Income Distribution and Poverty in OECD Countries (Paris:
OECD)Rauniya, Ganesh & Ravi Kanbur (2010), Inclusive development: Two Papers on
Conceptualization, Application, and Perspective (Manila: IED)Rauniya, Ganesh & Ravi Kanbur (2009), Inclusive Growth and Inclusive Development: A
Review and Synthesis of Asian Development Bank Literature (Manila: ADB) Ravallion, Martin & Chen Shaohua (2004), “China’s (Uneven) Progress Against
Poverty”, Development Research Group (Washington, DC: World Bank)Ravallion, Martin & Chen Shaohua (2003), “Measuring pro-poor growth”, Economic
Letters, 78, pp. 93-99 Ravallion, Martin & Chen Shaohua (1997), “What Can New Survey Data Tell Us about
Recent Changes in Distribution and Poverty?” World Bank Economic Review, 11(2), pp. 357-382
Royal Government of Cambodia (2012), Mid-Term Review 2011 on National Strategic Development Plan Update 2009-2013 (Phnom Penh: RGC)
Roemer, Michael & Mary Kay Gugerty (1997), Does Economic Growth Reduce Poverty?, Technical Paper, Harvard Institute for International Development (Cambridge: Harvard)
Sen, Amartya (1999), Development as Freedom (New York: Random House)Tiffin, Richard & Xavier Irz (2006), “Is agriculture the engine for growth?” Agricultural
Economics, 35, pp. 79-89Tong Kimsun (2012), Analysing Chronic Poverty in Rural Cambodia: Evidence from Panel
Data, Working Paper 66 (Phnom Penh: CDRI)Wan Guanghua & Zhou Zhangyue (2005), “Income Inequality in Rural China:
Regression-based Decomposition Using Household Data”, Review of Development Economics, 9 (1), pp. 107-120
Wiggins, Steve & Kate Higgins (2008), Pro-poor growth and development, Briefing Paper 33 (London: ODI)
World Bank (2012a), Doing Business in a More Transparent World (Washington DC: World Bank)
World Bank (2012b), Capturing New Sources of Growth, East Asia and Pacific Economic Update, vol. 1 (Washington, DC: World Bank)
World Bank (2009), Poverty Profile and trend in Cambodia: Findings from the 2007 Cambodia Socio-Economic Survey (CSES), Report No. 48618-KH (Washington, DC: World Bank)
World Bank (2000), World Development Report: Attacking Poverty (New York: Oxford University Press)
World Bank (1990), World Development Report: Poverty (New York: Oxford University Press)

66 Inclusive Development in Cambodia: An Assessment
ANNEXES
ANNEX TABLES
Table 1: Sampled PSU (Villages) and HHs in CSESRegion 2004 2007 2009 2011
PSU_N HH_N PSU_N HH_N PSU_N HH_N PSU_N HH_NPhnom Penh 115 1359 74 737 109 1113 75 747Other Urban 210 2099 63 628 134 1331 64 638Rural 575 11490 223 2228 477 9526 221 2207Total_CSES 900 14948 360 3593 720 11970 360 3592Total_NIS 900 15000 360 3600 720 12000 360 3600Missing 0 52 0 7 0 30 0 8Missing (% of total_NIS)
0 0.3 0 0.2 0 0.3 0 0.2
Sources: CSES 2004, 2007, 2009 & 2011
Table 2: CDHS Sample SizeYear Women Response Rate Men Response Rate Total
2000 15351 99% − − 15351
2005 16823 98% 6731 93% 23554
2010 18754 98% 8239 95% 26993Source: NIS 2000, 2005 & 2010
Table 3: Non-Income Variables DescriptionDimension Indicator DescriptionEducation Years of schooling Average years of schooling of all household members
HealthUnderweight Average weight-age z-score of children under 5Stunting Average height-age z-score of children under 5Wasting Average height-weight z-score of children under 5
Standard Living Wealth index A composite index on dwelling and household characteristics, consumer goods and assets.
Table 4: Temporal Food and Non-Food CPI (2004=100)Region Food CPI Non-food CPI
2004 2007 2009 2011 2004 2007 2009 2011Phnom Penh 100 137.2 190.5 199.7 100 113.7 138.9 147.6Other Urban 100 145.0 185.4 194.6 100 112.0 138.3 147.0Rural 100 141.4 195.9 205.1 100 110.4 135.2 143.9
Food poverty line Non-food poverty lineRegion 2004 2007 2009 2011 2004 2007 2009 2011Phnom Penh 1782.0 2445.0 3394.7 3559.2 569.0 647.0 790.3 839.9Other Urban 1568.0 2274.0 2907.1 3051.8 384.0 430.0 531.1 564.5Rural 1389.0 1965.0 2721.1 2849.3 364.0 402.0 492.1 523.8

67Inclusive Development in Cambodia: An Assessment 67
Table 5: Total Temporal Poverty Line (riels)Region 2004 2007 2009 2011Phnom Penh 2351 3092 4185 4399Other Urban 1952 2704 3438 3616Rural 1753 2367 3213 3373
Table 6: Linked Food and Non-Food CPI (Phnom Penh 2004=100)Region Linked food CPI Linked non-food CPI
2004 2007 2009 2011 2004 2007 2009 2011Phnom Penh 100.0 137.2 190.5 199.7 100.0 113.7 138.9 147.6Other Urban 88.0 127.6 163.2 171.3 89.1 99.8 123.2 131.0Rural 77.9 110.2 152.6 159.8 83.2 91.8 112.5 119.7
Food poverty line Non-food poverty lineRegion 2004 2007 2009 2011 2004 2007 2009 2011Phnom Penh 1782 2444.9 3394.7 3559.2 569 647.0 790.3 839.9Other Urban 1380 1760.7 2251.2 2363.3 342 341.5 421.6 448.1Rural 1082 1192.4 1651.2 1729.1 303 278.0 340.7 362.6
Table 7: Total Linked Poverty Line (riels)Region 2004 2007 2009 2011Phnom Penh 2351 3092 4185 4399Other Urban 1722 2102 2673 2811Rural 1385 1470 1992 2092
Source: World Bank 2009; authors’ calculation
Table 8: Mean Daily per Capita Expenditure (current prices, riels)2004(1)
2007(2)
2009(3)
2011(4)
2004-11(5) = (4) - (1)
By strata Phnom Penh 8349.36
(401.2)14232.72
(706.9)16877.43
(749.5)18393.18
(761.86)+10043.82
Other Urban 4749.19(244.0)
7362.42(1033.2)
10987.79(532.2)
10111.11(605.7)
+5361.92
Rural 2704.38(55.35)
3906.28(205.8)
6457.87(113.89)
7265.89(335.1)
+4561.51
By sex of HH head Female-headed HH 3594.61
(120.6)5393.9(276.9)
8353.3(274.2)
9895.2(1213.0)
+6300.54
Male-headed HH 3343.06(64.9)
5251.7(246.2)
7764.8(132.8)
8512.9(209.0)
+5169.88
By age of HH head < 35 3173.09
(80.9)4210.3(175.8)
6778.2(120.6)
7995.4(285.4)
+4822.31

68 Inclusive Development in Cambodia: An Assessment
>= 35 and < 45 3183.70(75.8)
4976.2(456.6)
7419.7(153.5)
8158.8(257.4)
+4975.07
>= 45 3641.4(82.4)
5832.4(271.3)
8554.2(180.1)
9346.4(478.9)
+5705.00
By education of HH head Primary and Lower secondary (< 9)
3235.79(67.0)
4770.1(247.0)
7475.2(127.7)
8053.9(214.2)
+4818.19
Upper secondary (>=9 and <=12)
4992.80(170.8)
7828.1(626.0)
11,078.4(317.0)
10901.8(381.8)
+5909.00
No education 2506.00(71.5)
3540.0(167.7)
5778.5(111.3)
7400.7(1197.2)
+4894.75
By HH size Large HH (>5) 2910.32
(69.2)4505.6(248.9)
6772.4(142.6)
7603.8(602.6)
+4693.48
Small HH (≤5) 3886.93(79.3)
5950.3(307.3)
8834.4(157.1)
9523.8(247.0)
+5636.86
By land owned, size of plots Large land ownership ( hectare/person)
2842.78(63.7)
4183.9(325.1)
6806.9(137.7)
8084.5(716.1)
+4011.04
Small land ownership or landless
2559.73(58.6)
3695.9(269.4)
6341.2(133.9)
6853.8(218.0)
+5524.79
By current migration status <=2 members migrated
5068.30(168.6)
6301.3(348.7)
8027.90(244.7)
8460.6(464.7)
+3392.32
>=3 members migrated
3070.36(60.0)
4478.6(237.4)
7620.65(207.6)
9710.6(1748)
+6640.22
By occupation of HH head Agriculture 2366.86
(41.5)3345.08
(86.7)6013.2
(82.6)6680.8(196.1)
+4314.00
Industry 4010.29(393.6)
7199.95(1787.4)
9916.1(666.2)
9628.9(474.4)
+5618.63
Services 5000.32(147.8)
7695.07(415.3)
11897.4(348.5)
12170.2(379.0)
+7169.91
% change 2004-07 2007-09 2009-2011 2004-2011
By regionPhnom Penh 70.46 18.58 8.98 120.29Other Urban 55.02 49.12 -7.90 112.90Rural 44.44 65.32 12.51 168.67By sex of HH head Female-headed HH 50.06 54.86 18.46 175.28 Male-headed HH 56.02 48.87 9.63 154.65By age of HH head < 35 32.69 60.99 17.96 151.98 >= 35 and < 45 56.03 49.10 9.96 156.27

69Inclusive Development in Cambodia: An Assessment 69
>= 45 60.17 46.67 9.26 156.67By education of HH head Primary and Lower
secondary (< 9) 47.42 56.71 7.74 148.90
Upper secondary (>=9 and <=12)
56.79 41.52 -1.59 118.35
No education 41.26 66.06 25.89 195.32By HH size Large HH (>5) 54.81 50.31 12.28 161.27 Small HH (≤5) 53.09 48.47 7.80 145.02By land ownership, size of plot Large land ownership
( hectare/person)47.18 62.69 0.69 141.10
Small land ownership or landless
44.39 71.75 27.49 215.84
By current migration status <= 2 member
migrated24.33 27.40 5.39 66.93
>= 3 members migrated
45.87 70.16 27.42 216.27
By occupation of HH head Agriculture 41.33 79.76 11.10 182.27 Industry 79.54 37.72 -2.90 140.11 Services 53.89 54.61 2.29 143.39
Notes: a. Figures in the parentheses are linearised standard errors, which take survey sampling design (stratified) into
account. b. Independent t-tests of between-group differences in mean per capita consumption and one way analysis of
variance tests were conducted. Results are that all mean differences between groups in each survey round are statistically significant at 1 and 5 percent confidence levels. Mean differences of each population sub-group between 2004 and 2011 (column 5) are also statistically significant at 1 and 5 percent confidence levels.
c. Please refer to Annex Table 9 for 2004 constant per capita HH consumption of population sub-groups. Source: Authors’ calculation using CSES
Table 9: Average Real Daily per Capita Expenditure (2004 = 100, riels)2004(1)
2007(2)
2009(3)
2011(4)
2004-2011(4) - (1)
By regionPhnom Penh 8349.36
(401.2)11743.33
(601.2)10904.73
(513.5)11199.17
(486.3)+2849.81
Other Urban 4749.19(244.0)
5884.23(858.1)
7013.93(352.2)
6092.59(380.9)
+1343.40
Rural 2704.38(55.3)
3098.80(180.1)
3967.64(75.4)
4304.34(228.4)
+1599.96
By sex of HH head Female-headed HH 3594.61
(120.6)4324.04(232.9)
5238.78(195.3)
5981.64(839.4)
+2387.04
Male-headed HH 3343.06(64.94)
4186.21(212.0)
4840.03(88.2)
5069.44(135.9)
+1726.38

70 Inclusive Development in Cambodia: An Assessment
By age of HH head < 35 3173.09
(80.9)3315.52(146.1)
4127.43(76.7)
4695.50(184.3)
+1522.41
>= 35 and < 45 3183.70(75.8)
4008.42(402.3)
4610.37(101.8)
4841.98(165.6)
+1658.27
>= 45 3641.41(82.4)
4696.89(231.7)
5390.47(123.5)
5629.03(327.7)
+1987.62
By education of HH head Primary (< 9) 3235.79
(67.0)3818.21(218.2)
4650.63(86.9)
4778.49(142.2)
+1542.69
Secondary (>=9 and <=12)
4992.80(170.8)
6363.73(527.2)
7031.97(213.4)
6552.19(243.1)
+1559.38
No education 2506.00(71.5)
2772.72(140.7)
3576.36(71.7)
4434.69(828.0)
+1928.69
By HH size Large HH (>5) 2910.32
(69.2)3611.64(216.5)
4227.67(96.0)
4580.34(414.2)
+1670.03
Small HH (≤5) 3886.93(79.3)
4778.30(264.6)
5512.08(106.2)
5664.37(162.3)
+1777.43
By land ownership, size of plot Large land
ownership (hectare/person)
2842.78(63.7)
3333.86(288.4)
4205.65(90.9)
4853.07(493.6)
+2010.29
Small land ownership or landless
2559.73(58.6)
2928.75(238.0)
3904.69(87.6)
4045.02(143.2)
+1485.30
By current migration status <= 2 member
migrated5068.30(168.6)
5068.24(296.4)
5052.90(169.4)
5055.83(315.6)
+12.47
>= 3 members migrated
3070.36(60.09)
3582.11(208.0)
4768.79(141.9)
5945.83(1212.79)
+2875.46
By occupation of HH head Agriculture 2366.86
(41.5)3345.08
(86.7)3699.64
(53.7)3943.93(130.9)
+1577.07
Industry 4010.29(293.6)
7199.95(1787.4)
6251.39(465.5)
5703.88(302.8)
+1693.59
Services 5000.32(147.8)
7695.07(415.3)
7588.28(238.7)
7342.33(240.8)
+2342.01
% change from previous year2004-07 2007-09 2009-2011 2004-2011
By regionPhnom Penh 40.65 -7.14 2.70 34.13Other Urban 23.90 19.20 -13.14 28.29Rural 14.58 28.04 8.49 59.16
By sex of HH head Female-headed HH 20.29 21.15 14.18 66.41 Male-headed HH 25.22 15.62 4.74 51.64By age of HH head < 35 4.49 24.49 13.76 47.98 >= 35 and < 45 25.90 15.02 5.02 52.09

71Inclusive Development in Cambodia: An Assessment 71
>= 45 28.99 14.77 4.43 54.58By education of HH head Primary (< 9) 18.00 21.80 2.75 47.68 Secondary (>=9 and <=12)
27.46 10.50 -6.82 31.23
No education 10.64 28.98 24.00 76.96By HH size Large HH (>5) 24.10 17.06 8.34 57.38 Small HH (≤5) 22.93 15.36 2.76 45.73By land ownership, size of plot Large land
ownership ( hectare/person)
17.27 26.15 15.39 70.72
Small land ownership or landless
14.42 33.32 3.59 58.03
By current migration status <= 2 member
migrated0.00 -0.30 0.06 -0.25
>= 3 members migrated
16.67 33.13 24.68 93.65
By occupation of HH head Agriculture 41.33 10.60 6.60 66.63 Industry 79.54 -13.17 -8.76 42.23 Services 53.89 1.39 -3.24 46.84
Source: Authors’ calculation using CSES
Table 10: Consumption Share by Deciles (Percent, 2004=100)Group 2011 2009 2007 2004
Decile_01 3.26 3.31 2.21 2.79
Decile_02 4.38 4.43 3.12 3.86
Decile_03 5.11 5.26 3.79 4.63
Decile_04 5.83 6.05 4.49 5.38
Decile_05 6.67 6.95 5.35 6.20
Decile_06 7.66 7.95 6.53 7.25
Decile_07 9.18 9.30 8.27 8.62
Decile_08 11.53 11.33 11.26 10.73
Decile_09 15.70 14.97 16.46 14.93
Decile_10 30.68 30.44 38.54 35.61Note: Decile_01 represents the poorest 10 percent while Decile_10 denotes the richest 10 percent of per capita
consumption distribution.Source: Authors’ calculation using CSES

72 Inclusive Development in Cambodia: An Assessment
Table 11: Education2000 2005 2010
Mean Std. Mean Std. Mean Std.
Average years of schooling (adult members)
3.33 1.15 3.32 1.19 3.31 1.17
Quintile1 1.68 0.43 1.65 0.45 1.63 0.452 2.79 0.24 2.78 0.25 2.77 0.253 3.41 0.10 3.40 0.11 3.40 0.114 3.93 0.16 3.93 0.16 3.92 0.165 4.99 0.53 5.01 0.57 5.01 0.54
Average years of schooling (child members)
1.92 1.38 2.77 1.48 2.16 1.44
Quintile1 0.59 0.45 0.78 0.39 0.58 0.462 1.51 0.13 1.52 0.11 1.50 0.113 2.14 0.20 2.15 0.21 2.13 0.204 3.05 0.24 3.08 0.25 3.07 0.235 4.55 0.71 4.64 0.76 4.50 0.64
Average years of schooling (all members)
2.83 1.10 3.12 1.09 2.96 1.10
Quintile1 1.51 0.53 1.58 0.48 1.54 0.502 2.45 0.15 2.46 0.15 2.44 0.153 2.95 0.10 2.95 0.11 2.94 0.114 3.64 0.27 3.63 0.27 3.63 0.285 4.81 0.54 4.82 0.56 4.86 0.60
Source: Authors’ calculations using CDHS
Table 12: Under-Five Children’s Nutritional Status2000 2005 2010
Mean Z-Score
Headcount (%)
Mean Z-Score
Headcount (%)
Mean Z-Score
Headcount (%)
Stunted − 1.81(1.89)
48.06 − 1.77(1.37)
42.06 − 1.62(1.38)
38.16
Underweight − 1.7(1.27)
38.6 − 1.43(1.05)
27.4 − 1.44(1.02)
26.9
Wasting − 0.88(1.61)
17.7 − 0.58(1.18)
7.8 − 0.71(1.19)
10.8
Note: Standard errors are in parentheses. A child is considered stunted, underweight or wasting if his/her z-score is less than 2 standard deviations.
Source: Authors’ calculations using CDHS

73Inclusive Development in Cambodia: An Assessment 73
Table 13: Under-Five Children’s Nutrition Status by Quintile (z-score)Stunted (mean) Underweight (mean) Wasting (mean)
Quintile 2000 2005 2010 2000 2005 2010 2000 2005 2010
1 − 3.98 − 3.76 − 3.70 − 3.28 − 2.98 − 3.03 − 2.77 − 2.24 − 2.42
2 − 2.52 − 2.49 − 2.48 − 2.08 − 2.07 − 2.05 − 1.25 − 1.22 − 1.23
3 − 1.84 − 1.82 − 1.82 − 1.53 − 1.51 − 1.52 − 0.68 − 0.69 − 0.69
4 − 1.12 − 1.13 − 1.15 − 0.99 − 0.98 − 1.01 − 0.16 − 0.15 − 0.16
5 0.79 0.16 0.30 0.1 0.01 − 0.04 1.26 1.00 0.87Source: Authors’ calculations using CDHS
Table 14: Wealth Index2005 2010
Mean Std. Mean Std.Wealth index − 2.88 4.31 − 0.18 0.82Wealth quintile
Poorest − 7.36 0.59 − 1.02 0.10Poorer − 5.75 0.43 − 0.72 0.08Middle − 4.21 0.48 − 0.35 0.13Richer − 1.93 0.92 0.26 0.24Richest 4.21 3.20 1.38 0.44
Source: Authors’ calculations using CDHS
Table 15: Estimated Gini Coefficients of Inequality in per Capita Consumption, by Year
Year Estimate Standard Error Lower Bound Upper Bound2004 0.387 0.006 0.374 0.4012007 0.435 0.024 0.386 0.4822009 0.362 0.006 0.348 0.3752011 0.360 0.031 0.299 0.422
Note: The standard errors reflect 95 percent confidence interval. Source: Authors’ calculation using CSES
Table 16: Estimated Gini Coefficients of Inequality in per Capita Consumption, by Geographical Domains
Domains 2004 2007 2009 2011 % Change2004-09
% Change2004-11
Phnom Penh 0.365(0.012)
0.329(0.017)
0.351(0.016)
0.295(0.014)
-3.83 -19.17
Other Urban 0.437(0.015)
0.336(0.017)
0.384(0.018)
0.331(0.018)
-12.12 -24.25
Rural 0.329(0.008)
0.388(0.040)
0.311(0.007)
0.326(0.048)
-5.47 -0.91
Population 0.387(0.006)
0.435(0.024)
0.362(0.006)
0.360 (0.031)
-6.46 -6.97
Note: Figures in parentheses are linearised standard errors taking into account stratified sampling and reflect the 95 percent confidence level. Source: Authors’ calculation using CSES

74 Inclusive Development in Cambodia: An Assessment
Table 17: Gini Coefficients of Real Income per Capita (2009, Phnom Penh = 100)Indicators 2004 2007 2009 2011 % Change
2004-09% Change2004-11
Cambodia 0.471(0.004)
0.460(0.007)
0.436(0.004)
0.411(0.006)
-7.43 -12.73
Phnom Penh 0.449(0.011)
0.414(0.009)
0.395(0.007)
0.353(0.009)
-12.02 -21.38
Other Urban 0.457(0.009)
0.429(0.013)
0.431(0.009)
0.426(0.014)
-5.69 -6.78
Rural 0.410(0.004)
0.393(0.007)
0.395(0.003)
0.383(0.007)
-3.65 -6.58
Female-headed 0.467(0.004)
0.458(0.013)
0.452(0.007)
0.423(0.011)
-3.21 -9.42
Male-headed 0.486(0.007)
0.459(0.008)
0.433(0.004)
0.407(0.007)
-10.90 -16.25
Note: Figures in parentheses are linearised standard errors taking into account stratified sampling and reflect the 95 percent confidence level. Pre-tax annual income per capita is variable of interest.
Source: Authors’ calculation using CSES
Table 18: Atkison Index on per Capita Consumption, by YearYear ε=0.05 ε=0.1 ε=0.25 ε=0.5 ε=0.75 ε=12004 0.016
(0.001)0.032
(0.001)0.075
(0.002)0.136
(0.003)0.188
(0.004)0.233
(0.005)2007 0.022
(0.002)0.042
(0.004)0.098
(0.008)0.177
(0.012)0.240
(0.014)0.294
(0.015)2009 0.013
(0.001)0.026
(0.001)0.062
(0.002)0.113
(0.003)0.157
(0.004)0.196
(0.005)2011 0.014
(0.002)0.028
(0.004)0.064
(0.008)0.116
(0.013)0.160
(0.014)0.198
(0.016)Source: Authors’ calculation using CSES
Table 19: Decomposition of Theil Indices of Inequality on Real per Capita Consumption (Phnom Penh 2004 = 100)
Domains Theil’s L (GE(0))2004 2007 2009 2011 % Change
2004-09% Change2004-11
Population 0.247(0.008)
0.316(0.039)
0.215(0.008)
0.224(0.045)
-13.060 -9.355
Phnom Penh 0.224(0.017)
0.178(0.019)
0.207(0.020)
0.141(0.013)
-7.644 -36.841
Other Urban 0.317(0.024)
0.194(0.017)
0.240(0.023)
0.179(0.020)
-24.117 -43.323
Rural 0.182(0.009)
0.265(0.060)
0.160(0.008)
0.201(0.067)
-11.768 10.609
Decomposition Within groups 0.199
(…)0.249(…)
0.173(…)
0.192(…)
-13.214 -3.581
Between groups 0.047(0.002)
0.067(0.004)
0.042(0.001)
0.032(0.001)
-11.281 -32.542

75Inclusive Development in Cambodia: An Assessment 75
Between inequality as % of total inequality
19.110 21.308 19.501 14.222 2.046 -25.579
Domains Theil’s T (GE(1))2004 2007 2009 2011 % Change
2004-2009% Change2004-2011
Population 0.308(0.013)
0.454(0.093)
0.266(0.015)
0.357(0.124)
13.560 15.773
Phnom Penh 0.233(0.020)
0.202(0.025)
0.246(0.032)
0.147(0.016)
5.474 -37.104
Other Urban 0.372(0.035)
0.179(0.019)
0.269(0.032)
0.190(0.021)
-27.890 -48.964
Rural 0.232(0.016)
0.464(0.153)
0.201(0.015)
0.394(0.189)
-13.467 69.538
Decomposition Within groups 0.253
(…)0.370(…)
0.219(…)
0.320(…)
-13.494 26.525
Between groups 0.055(0.002)
0.084(0.004)
0.048(0.001)
0.037(0.001)
-13.862 -33.304
Between inequality as % of total inequality
17.970 18.422 17.907 10.352 -0.349 -42.391
Figures in parentheses are standard errors. Source: Authors’ calculation using CSES
Table 20: Land Inequality, by Geographical Domain and Household CharacteristicsCharacteristics 2011 2009 2007Cambodia 0.506 (0.013) 0.538 (0.018) 0.550 (0.034)Phnom Penh 0.646 (0.077) 0.682 (0.033) 0.668 (0.057)Other urban 0.623 (0.043) 0.598 (0.029) 0.555 (0.032)Rural 0.497 (0.014) 0.533 (0.019) 0.548 (0.036)Female-headed 0.538 (0.029) 0.537 (0.025) 0.470 (0.032)Male-headed 0.499 (0.014) 0.535 (0.018) 0.554 (0.037)Note: Figures in parentheses are standard errors. Variable used to calculate these inequalities is total area of
agricultural land owned. Source: authors’ calculations using CSES.
Table 21: Growth and Inequality Effects on Poverty Poverty measures Actual growth
(%)(a)
Total Poverty Elasticity
(%)(b) = (c)+(d)
Decomposed by Pro-poor Growth Index(e) = (b)/(c)
Pure Growth Effect (%)
(c)
Inequality Effect (%)(d)
Headcount Index2004-2007 43.87 -0.25 -2.43 2.19 0.102007-2009 40.53 -2.30 -3.04 0.74 0.762009-2011 10.78 -6.28 -4.68 -1.59 1.342004-2011 95.18 -1.80 -3.40 1.60 0.532004-2009 84.40 -1.23 -3.04 1.81 0.402007-2011 51.31 -3.13 -3.55 0.42 0.88Poverty Gap 2004-2007 43.87 -0.28 -3.19 2.91 0.092007-2009 40.53 -3.14 -3.86 0.72 0.81

76 Inclusive Development in Cambodia: An Assessment
2009-2011 10.78 -6.23 -4.96 -1.27 1.262004-2011 95.18 -2.17 -3.98 1.80 0.552004-2009 84.40 -1.65 -3.74 2.09 0.442007-2011 51.31 -3.79 -4.17 0.38 0.91Squared Poverty Gap 2004-2007 43.87 -0.29 -3.68 3.39 0.082007-2009 40.53 -3.77 -4.42 0.65 0.852009-2011 10.78 -6.22 -5.35 -0.87 1.412004-2011 95.18 -2.44 -4.37 1.93 0.562004-2009 84.40 -1.96 -4.19 2.24 0.472007-2011 51.31 -4.28 -4.57 0.29 0.94Source: Authors’ calculations using CSES
Table 22: Poverty Equivalent Growth Rates (%)Year Actual
growth ratePoverty equivalent growth rates
Headcount ratio
Poverty gap ratio
Severity of poverty
2004-2007 43.87 4.47 3.89 3.462007-2009 40.53 30.67 32.94 34.552009-2011 10.78 14.45 13.53 12.532004-2011 95.18 50.47 51.99 53.172004-2009 84.40 34.17 37.28 39.422007-2011 51.31 45.29 46.60 48.04
Source: Authors’ calculations using CSES
Table 23: Growth and Inequality Effect on Health Poverty
Poverty Headcount Index
Actual growth
(absolute)(a)
Total Poverty Elasticity
(%)(b) = (c) + (d)
Decomposed by Pro-poor Growth Index
(e)=(b)/(c)
PEGR(absolute)
(a)*(e)
Pure Growth Effect (%)
(c)
Inequality Effect (%)
(d)
Stunting
2000-2005 0.036 -0.051 -0.008 -0.043 6.255 0.2222005-2010 0.155 -0.055 -0.056 0.000 0.993 0.1542000-2010 0.190 -0.106 -0.065 -0.042 1.646 1.313Underweight
2000-2005 0.268 -0.111 -0.089 -0.023 1.258 0.3372005-2010 -0.0001 -0.012 0.001 -0.013 1.0832 0.0002000-2010 0.268 -0.124 -0.094 -0.030 1.314 0.352Wasting
2000-2005 0.303 -0.104 -0.030 -0.074 3.415 1.0342005-2010 -0.131 0.024 0.012 0.017 0.7261 -0.3122000-2010 0.171 -0.075 -0.019 -0.056 3.932 0.674Source: Authors’ calculations using CSES

77Inclusive Development in Cambodia: An Assessment 77
Table 24: Growth and Inequality Effect on Education PovertyActual growth
(absolute)(a)
Total Poverty Elasticity
(%)(b) = (c) + (d)
Decomposed by Pro-poor Growth Index
(e)=(b)/(c)
PEGR(absolute)
(a)*(e)Pure Growth
Effect (%)(c)
Inequality Effect (%)
(d)
Adult Education
2000-2005 -0.009 0.012 0.000 0.012 0.000 0.0002005-2010 -0.007 0.008 0.000 0.008 0.000 0.000Children Education
2000-2005 0.848 -0.080 -0.066 -0.014 1.205 1.0222005-2010 -0.621 0.057 0.066 -0.009 1.160 -0.720Household education
2000-2005 0.285 -0.044 -0.099 0.055 0.449 0.1282005-2010 -0.156 0.019 0.099 -0.080 5.178 -0.807Source: Authors’ calculations using CSES
Table 25: Growth and Inequality Effect on Wealth Poverty
Actual growth
(absolute)(a)
Total Poverty Elasticity
(%)(b) = (c) + (d)
Decomposed by Pro-poor Growth Index
(e)=(b)/(c)
PEGR(absolute)
(a)*(e)Pure Growth
Effect (%)(c)
Inequality Effect (%)
(d)
2005-2010 2.698 -0.111 -0.036 -0.075 3.073 8.288Source: Authors’ calculations using CSES
Table 26: Household Health and Education by Wealth Status 2005-10 (z-score)
Wealth quintile Stunting Underweight Wasting Years of schooling
1 -2.10 -1.66 -0.67 2.702 -1.88 -1.58 -0.72 2.923 -1.69 -1.45 -0.64 2.994 -1.54 -1.37 -0.71 3.115 -1.46 -1.24 -0.61 3.24
Source: Authors’ calculations using CDHS

78 Inclusive Development in Cambodia: An Assessment
ANNEX FIGURES
Figure 1: Current Mean per Capita Consumption, by Geographical Areas (riels)
0
5000
10000
15000
20000
Phnom Penh Other Urban Rural
2004 2007 2009 2011
Note: the error bars represent linearised standard errors of mean per capita consumption.
Source: Authors’ calculations using CSES
Figure 2: Density Curves of Real Daily per Capita Consumption
0.0
001
.000
2.0
003
Prob
abili
ty d
ensit
y fu
nctio
n
0 4000 8000 12000 16000 20000real per capita consumption, KHR
2004 2007 2009 2011
Source: Authors’ calculations using CSES
Figure 3: Density Curves of Real Daily per Capita Consumption, by Geographical Areas
0.00
01.00
02.00
03pr
obab
ility d
ensit
y fun
ction
0 6000 12000 18000 24000 30000real per capita consumption, KHR
Phnom Penh Other UrbanRural
Source: Authors’ calculations using CSES
Figure 4: Poverty Headcount of Real per Capita Consumption (α=0)
0.2
.4.6
.81
FGT
(z, a
lpha
= 0
)
0 4600 9200 13800 18400 23000Poverty line (z)
2004 20072009 2011
Source: Authors’ calculations using CSES
Figure 5: Poverty Headcount of Real per Capita Consumption (adult equivalent) (α=0)
0.2
.4.6
.81
FGT
(z, a
lpha
= 0
)
0 4600 9200 13800 18400 23000Poverty line (z)
2004 20072009 2011
Source: Authors’ calculations using CSES
Figure 6: Poverty Gap of Real per Capita Consumption (α=1)
0.2
.4.6
.8FG
T (z
, alp
ha =
1)
0 4600 9200 13800 18400 23000Poverty line (z)
2004 20072009 2011
Source: Authors’ calculations using CSES
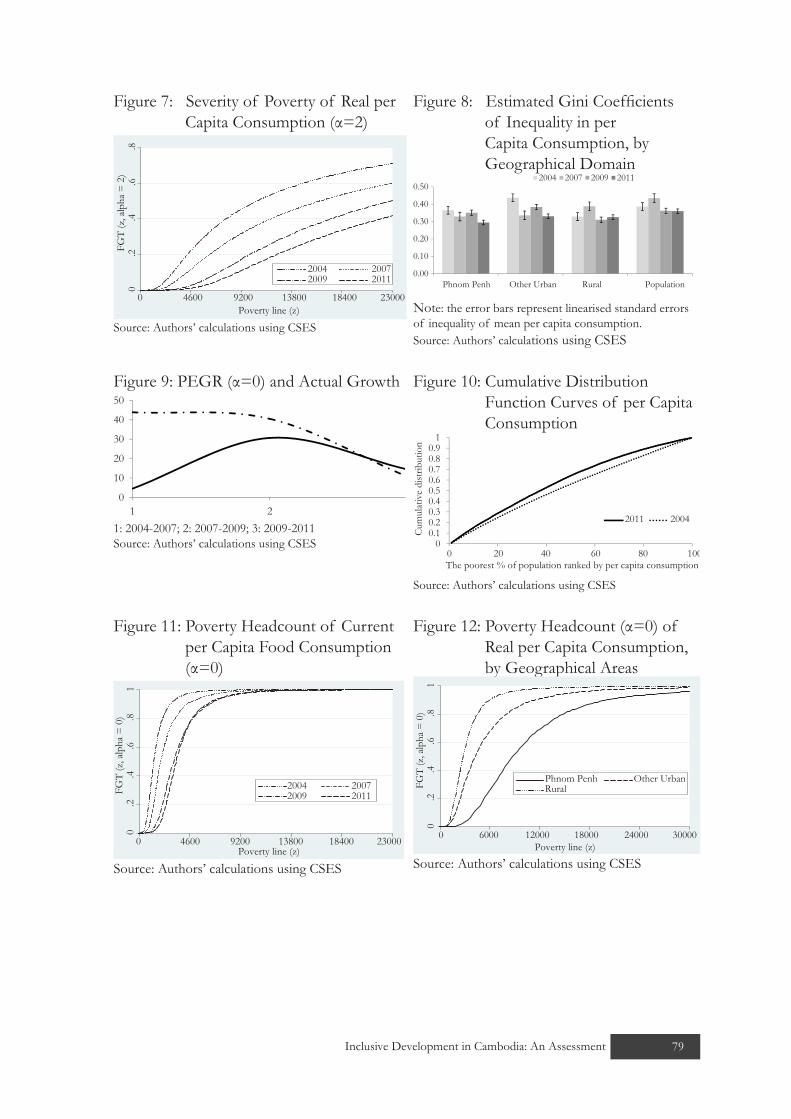
79Inclusive Development in Cambodia: An Assessment 79
Figure 7: Severity of Poverty of Real per Capita Consumption (α=2)
0.2
.4.6
.8FG
T (z
, alp
ha =
2)
0 4600 9200 13800 18400 23000Poverty line (z)
2004 20072009 2011
Source: Authors’ calculations using CSES
Figure 8: Estimated Gini Coefficients of Inequality in per Capita Consumption, by Geographical Domain
0.00
0.10
0.20
0.30
0.40
0.50
Phnom Penh Other Urban Rural Population
2004 2007 2009 2011
Note: the error bars represent linearised standard errors of inequality of mean per capita consumption.Source: Authors’ calculations using CSES
Figure 9: PEGR (α=0) and Actual Growth
0
10
20
30
40
50
3211: 2004-2007; 2: 2007-2009; 3: 2009-2011Source: Authors’ calculations using CSES
Figure 10: Cumulative Distribution Function Curves of per Capita Consumption
Source: Authors’ calculations using CSES
Figure 11: Poverty Headcount of Current per Capita Food Consumption (α=0)
0.2
.4.6
.81
FGT
(z, a
lpha
= 0
)
0 4600 9200 13800 18400 23000Poverty line (z)
2004 20072009 2011
Source: Authors’ calculations using CSES
Figure 12: Poverty Headcount (α=0) of Real per Capita Consumption, by Geographical Areas
0.2
.4.6
.81
FGT
(z, a
lpha
= 0
)
0 6000 12000 18000 24000 30000Poverty line (z)
Phnom Penh Other Urban Rural
Source: Authors’ calculations using CSES

80 Inclusive Development in Cambodia: An Assessment
Figure 13: Poverty Headcount of Current per Capita Non-Food Consumption (α=0)
0.2
.4.6
.81
FGT
(z, a
lpha
= 0
)
0 3000 6000 9000 12000 15000Poverty line (z)
2004 20072009 2011
Source: Authors’ calculations using CSES
Figure 14: Poverty Gap (α=1) of Real per Capita Consumption, by Geographical Areas
0.2
.4.6
.8FG
T (z
, alp
ha =
1)
0 4600 9200 13800 18400 23000Poverty line (z)
Phnom Penh Other UrbanRural
Source: Authors’ calculations using CSES
Figure 15: Poverty Headcount (α=0) of Real per Capita Consumption, by Occupation, 2011
0.2
.4.6
.81
FGT
(z, a
lpha
= 0
)
0 4600 9200 13800 18400 23000Poverty line (z)
agriculture industryservices
Source: Authors’ calculations using CSES
Figure 16: Poverty Headcount (α=0) of Real per Capita Consumption, by Education of Household Head, 2011
0.2
.4.6
.81
FGT
(z, a
lpha
= 0
)
0 4600 9200 13800 18400 23000Poverty line (z)
primary secondaryno education
Source: Authors’ calculations using CSES
Figure 17: Poverty Headcount (α=0) of Real per Capita Consumption by Provinces, 2011
0.2
.4.6
.81
FGT
(z, a
lpha
= 0
)
0 4000 8000 12000 16000 20000Poverty line (z)
Phnom Penh NorthernCentral EasternSouthern Western
Northern provinces: Oddar Meanchey, Preah Vihear, Ratanakkiri, Siem Reap and Stung Treng
Central provinces: Kompong Chhnang, Kompong Speu, Kompong Thom. This excludes Phnom Penh
Eastern provinces: Kompong Cham, Kratie and Mondolkiri
Southern provinces: Preah Sihanouk, Kampot, Kandal, Kep, Koh Kong, Prey Veng, Svay Rieng and Takeo
Western provinces: Banteay Meanchey, Battambang, Pailin and Pursat
Source: Authors’ calculation using CSES
Figure 18: Lorenz Curves of Real Consumption per Capita, KHR
0.2
.4.6
.81
L(p)
0 .2 .4 .6 .8 1Percentiles of consumption per capita, KHR
2004 20072009 2011
Source: Authors’ calculations using CSES

81In
clusiv
e D
evelo
pmen
t in
Cam
bodi
a: A
n A
sses
smen
t81
Tabl
e 27
: Hou
sing
Char
acte
ristic
s, by
per
Cap
ita C
onsu
mpt
ion
Qui
ntile
in 2
011
and
2004
-11
chan
ges
Char
acte
ristic
s
Hou
sing
char
acte
ristic
s by
per c
apita
con
sum
ptio
n
quin
tile,
2011
Perc
enta
ge c
hang
es, 2
004-
2011
Poor
est
Nex
t po
ores
tM
iddl
eN
ext
riche
stRi
ches
tPo
ores
tN
ext
poor
est
Mid
dle
Nex
t ric
hest
Rich
est
Room
s per
cap
ita*
0.2
0.2
0.3
0.4
0.5
-0.7
10.5
11.8
19.4
27.0
Livi
ng a
rea
(sq
met
res)
per
cap
ita*
5.7
7.3
9.0
10.9
15.3
7.1
10.2
16.4
18.4
17.8
Hou
ses o
wne
d (%
)96
.495
.595
.794
.288
.5-0
.3-1
.6-0
.90.
2-4
.8W
all-B
ambo
o, T
hatc
h/lea
ves,
Gra
ss (%
)51
.839
.125
.315
.26.
013
.65.
8-5
.1-7
.4-2
.8
Wall
-Woo
d or
logs
(%)
36.1
48.0
58.1
64.5
37.2
17.2
23.5
29.2
30.7
5.7
Wall
-Plyw
ood
(%)
0.6
0.2
0.7
0.9
0.9
-14.
3-1
6.5
-17.
1-2
0.2
-20.
5W
all-C
oncr
ete,
brick
, sto
ne (%
)2.
33.
55.
110
.851
.62.
02.
72.
94.
221
.5W
all-G
alvan
ised
iron
or a
lum
iniu
m
or o
ther
met
al sh
eets
(%)
7.7
7.9
9.6
7.0
3.3
6.3
5.5
7.0
4.4
0.9
Roof
-Tha
tch/
leave
s/gr
ass (
%)
23.1
12.6
9.1
5.3
1.9
-14.
7-1
2.9
-11.
3-9
.6-2
.8Ro
of-T
iles (
%)
15.2
26.5
29.5
34.6
25.4
-5.2
-2.0
-0.8
-0.4
-4.2
Roof
-Fib
rous
cem
ent (
%)
7.1
9.3
11.0
9.6
9.8
3.8
6.4
6.9
3.5
0.8
Roof
-Galv
anise
d iro
n or
alu
min
ium
(%)
53.7
51.0
49.5
48.3
41.6
29.2
18.1
13.7
11.4
-0.6
Roof
-Con
cret
e (%
)0.
00.
20.
31.
321
.0-0
.5-0
.5-0
.8-0
.29.
4Fl
oor-E
arth
, clay
(%)
8.1
6.5
6.2
6.1
3.4
1.2
-0.6
-1.6
-1.5
-2.2
Floo
r-Woo
den
plan
ks (%
)53
.452
.355
.656
.731
.9-2
8.9
-29.
6-2
4.6
-14.
9-1
3.9
Floo
r-Bam
boo
strip
s (%
)35
.235
.227
.519
.06.
535
.235
.227
.519
.06.
5Fl
oor-C
emen
t/Br
ick/S
tone
(%)
2.3
5.0
6.8
10.9
14.7
1.6
3.5
4.2
4.6
3.5
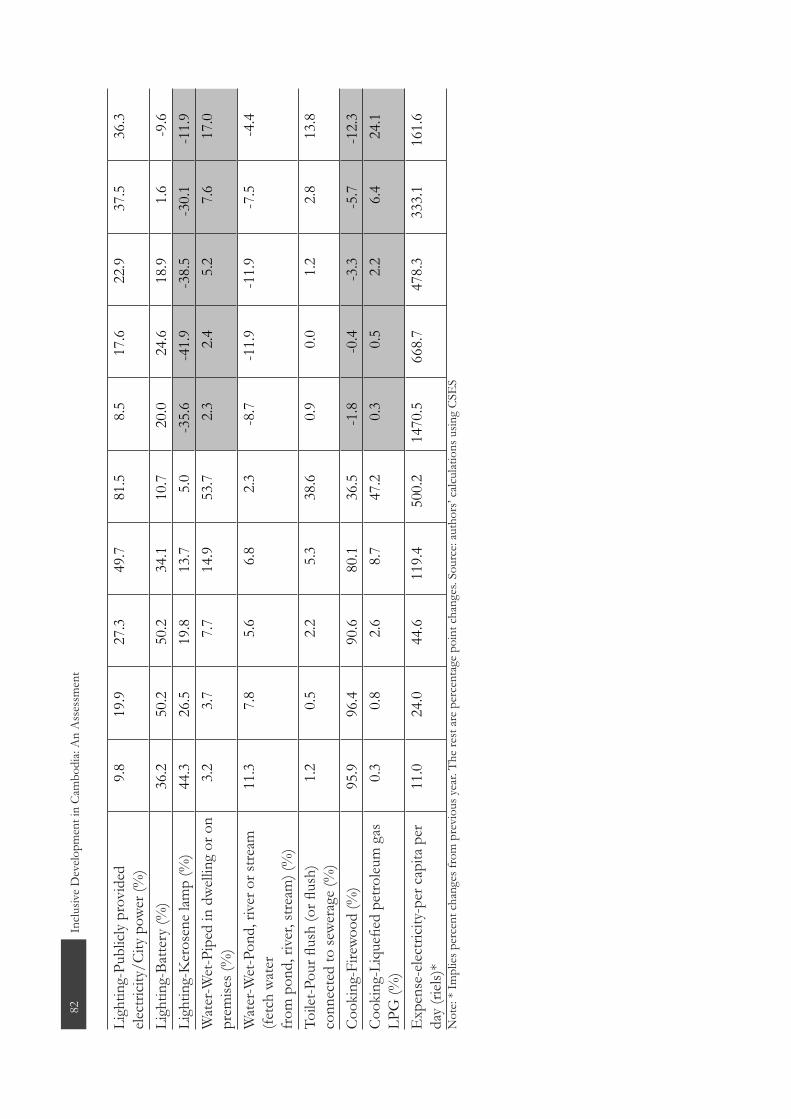
82In
clusiv
e D
evelo
pmen
t in
Cam
bodi
a: A
n A
sses
smen
t
Ligh
ting-
Publ
icly
prov
ided
ele
ctric
ity/C
ity p
ower
(%)
9.8
19.9
27.3
49.7
81.5
8.5
17.6
22.9
37.5
36.3
Ligh
ting-
Batte
ry (%
)36
.250
.250
.234
.110
.720
.024
.618
.91.
6-9
.6Li
ghtin
g-K
eros
ene
lamp
(%)
44.3
26.5
19.8
13.7
5.0
-35.
6-4
1.9
-38.
5-3
0.1
-11.
9W
ater
-Wet
-Pip
ed in
dw
ellin
g or
on
prem
ises (
%)
3.2
3.7
7.7
14.9
53.7
2.3
2.4
5.2
7.6
17.0
Wat
er-W
et-P
ond,
rive
r or s
tream
(fe
tch
wat
er
from
pon
d, ri
ver,
stre
am) (
%)
11.3
7.8
5.6
6.8
2.3
-8.7
-11.
9-1
1.9
-7.5
-4.4
Toile
t-Pou
r flus
h (o
r flus
h)
conn
ecte
d to
sew
erag
e (%
)1.
20.
52.
25.
338
.60.
90.
01.
22.
813
.8
Cook
ing-
Fire
wood
(%)
95.9
96.4
90.6
80.1
36.5
-1.8
-0.4
-3.3
-5.7
-12.
3Co
okin
g-Li
quefi
ed p
etro
leum
gas
LP
G (%
)0.
30.
82.
68.
747
.20.
30.
52.
26.
424
.1
Exp
ense
-elec
tricit
y-pe
r cap
ita p
er
day
(riels
)*11
.024
.044
.611
9.4
500.
214
70.5
668.
747
8.3
333.
116
1.6
Not
e: *
Impl
ies p
erce
nt c
hang
es fr
om p
revi
ous y
ear.
The
rest
are
per
cent
age
poin
t cha
nges
. Sou
rce:
auth
ors’
calcu
latio
ns u
sing
CSE
S
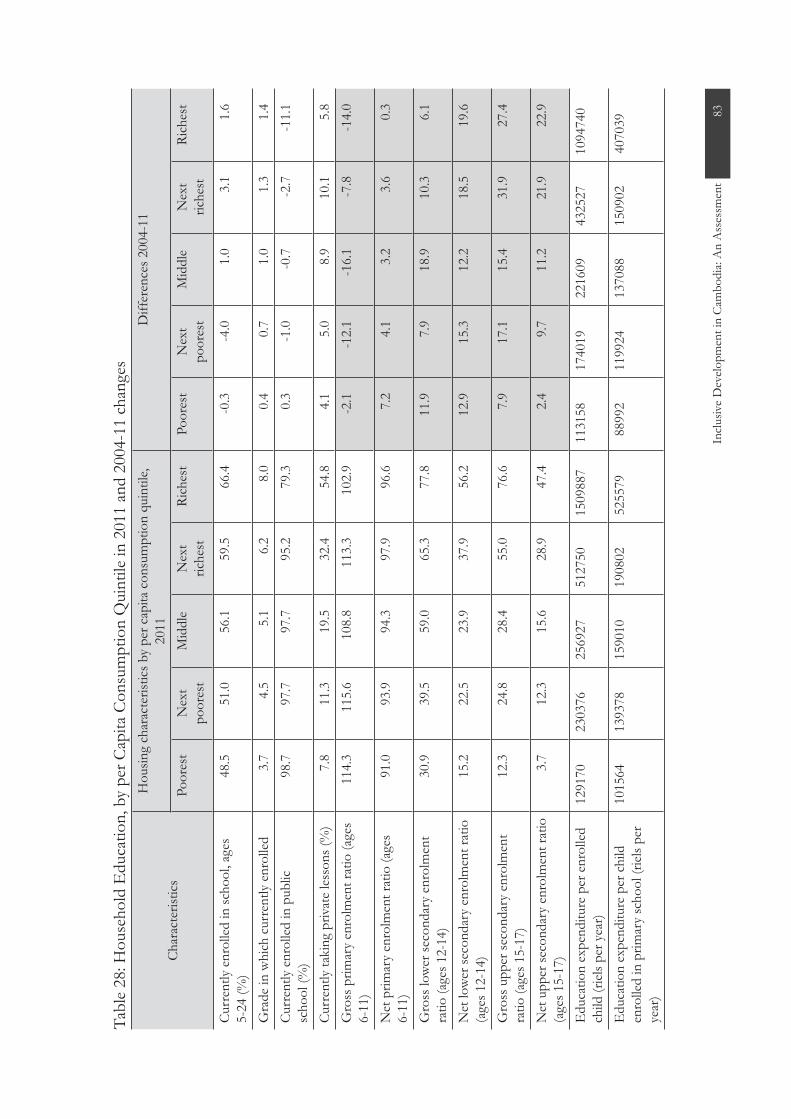
83In
clusiv
e D
evelo
pmen
t in
Cam
bodi
a: A
n A
sses
smen
t83
Tabl
e 28
: Hou
seho
ld E
duca
tion,
by
per C
apita
Con
sum
ptio
n Q
uint
ile in
201
1 an
d 20
04-1
1 ch
ange
s
Char
acte
ristic
s
Hou
sing
char
acte
ristic
s by
per c
apita
con
sum
ptio
n qu
intil
e, 20
11D
iffer
ence
s 200
4-11
Poor
est
Nex
t po
ores
tM
iddl
eN
ext
riche
stRi
ches
tPo
ores
tN
ext
poor
est
Mid
dle
Nex
t ric
hest
Rich
est
Curr
ently
enr
olled
in sc
hool
, age
s 5-
24 (%
)48
.551
.056
.159
.566
.4-0
.3-4
.01.
03.
11.
6
Gra
de in
whi
ch c
urre
ntly
enro
lled
3.7
4.5
5.1
6.2
8.0
0.4
0.7
1.0
1.3
1.4
Curr
ently
enr
olled
in p
ublic
sc
hool
(%)
98.7
97.7
97.7
95.2
79.3
0.3
-1.0
-0.7
-2.7
-11.
1
Curr
ently
taki
ng p
rivat
e les
sons
(%)
7.8
11.3
19.5
32.4
54.8
4.1
5.0
8.9
10.1
5.8
Gro
ss p
rimar
y en
rolm
ent r
atio
(age
s 6-
11)
114.
311
5.6
108.
811
3.3
102.
9-2
.1-1
2.1
-16.
1-7
.8-1
4.0
Net
prim
ary
enro
lmen
t rat
io (a
ges
6-11
)91
.093
.994
.397
.996
.67.
24.
13.
23.
60.
3
Gro
ss lo
wer
seco
ndar
y en
rolm
ent
ratio
(age
s 12-
14)
30.9
39.5
59.0
65.3
77.8
11.9
7.9
18.9
10.3
6.1
Net
low
er se
cond
ary
enro
lmen
t rat
io
(age
s 12-
14)
15.2
22.5
23.9
37.9
56.2
12.9
15.3
12.2
18.5
19.6
Gro
ss u
pper
seco
ndar
y en
rolm
ent
ratio
(age
s 15-
17)
12.3
24.8
28.4
55.0
76.6
7.9
17.1
15.4
31.9
27.4
Net
upp
er se
cond
ary
enro
lmen
t rat
io
(age
s 15-
17)
3.7
12.3
15.6
28.9
47.4
2.4
9.7
11.2
21.9
22.9
Edu
catio
n ex
pend
iture
per
enr
olled
ch
ild (r
iels p
er y
ear)
1291
7023
0376
2569
2751
2750
1509
887
1131
5817
4019
2216
0943
2527
1094
740
Edu
catio
n ex
pend
iture
per
chi
ld
enro
lled
in p
rimar
y sc
hool
(riel
s per
ye
ar)
1015
6413
9378
1590
1019
0802
5255
7988
992
1199
2413
7088
1509
0240
7039

84In
clusiv
e D
evelo
pmen
t in
Cam
bodi
a: A
n A
sses
smen
t
Edu
catio
n ex
pend
iture
per
chi
ld
enro
lled
in lo
wer
seco
ndar
y sc
hool
(ri
els p
er y
ear)
2307
9027
2454
3622
9146
9054
9835
5019
0493
2133
8027
5843
3076
0259
8617
Edu
catio
n ex
pend
iture
per
chi
ld
enro
lled
in u
pper
seco
ndar
y sc
hool
(ri
els p
er y
ear)
5171
1256
2582
6481
5010
5381
416
4668
841
8224
4159
3537
3978
7042
4999
3395
Scho
ol fe
es p
er c
hild
enr
olled
in
publ
ic pr
imar
y sc
hool
(riel
s per
yea
r)0
2241
886
6460
9058
0-1
0919
7974
042
6469
653
Scho
ol fe
es p
er c
hild
enr
olled
in
priv
ate
prim
ary
scho
ol (r
iels p
er y
ear)
00
1037
4485
2807
1910
941
0-1
2202
8749
577
4520
1661
743
Scho
ol fe
es p
er c
hild
enr
olled
in
publ
ic lo
wer
seco
ndar
y sc
hool
(riel
s pe
r yea
r)
6142
5978
5264
4502
814
6172
5588
4379
335
1490
663
362
Scho
ol fe
es p
er c
hild
enr
olled
in
publ
ic up
per s
econ
dary
scho
ol (r
iels
per y
ear)
4967
428
229
4599
322
2974
3486
1248
157
1937
719
630
1348
1117
4982
Eve
r atte
nded
scho
ol, a
ge 5
+ (%
)71
.881
.182
.985
.992
.59.
79.
08.
26.
75.
2Li
tera
te, a
ge 1
5+ (%
)63
.375
.978
.282
.691
.610
.912
.811
.39.
47.
6H
ighe
st g
rade
com
plet
ed, a
ge 1
5+5.
25.
66.
16.
88.
610
.112
.213
.116
.016
.0E
ver a
ttend
ed n
onfo
rmal
class
, age
15
+ (%
)1.
91.
22.
24.
215
.51.
40.
31.
42.
211
.4
Curr
ently
atte
ndin
g in
form
al cla
ss,
ages
5-2
4 (%
)1.
72.
43.
57.
724
.21.
12.
02.
75.
718
.5
Sour
ce: a
utho
rs’ c
alcul
atio
ns u
sing
CSE
S

85In
clusiv
e D
evelo
pmen
t in
Cam
bodi
a: A
n A
sses
smen
t85
Tabl
e 29
: Em
ploy
men
t Ind
icato
rs a
mon
g Po
pulat
ion
Age
d 10
and
Abo
ve, b
y pe
r Cap
ita C
onsu
mpt
ion
Qui
ntile
201
1 an
d ch
ange
s 200
4-11
Char
acte
ristic
sH
ousin
g ch
arac
teris
tics b
y pe
r cap
ita c
onsu
mpt
ion
quin
tile,
2011
Diff
eren
ces 2
004-
11
Poor
est
Nex
t po
ores
tM
iddl
eN
ext
riche
stRi
ches
tPo
ores
tN
ext
poor
est
Mid
dle
Nex
t ric
hest
Rich
est
Labo
ur fo
rce
parti
cipat
ion
rate
(LFP
R) (%
) (a
ge >
=10
)
81.5
84.6
82.6
80.1
70.3
6.8
9.3
5.7
5.0
1.0
LFPR
male
s (%
)86
.088
.586
.885
.177
.94.
46.
23.
13.
92.
0LF
PR fe
male
s (%
)80
.382
.981
.678
.666
.110
.212
.09.
37.
30.
2LF
PR c
hild
ren/
yout
h ag
es 1
0-19
(%)
63.4
68.9
62.9
54.7
33.4
1.1
5.9
-0.6
-2.5
-9.1
LFPR
chi
ldre
n/yo
uth
ages
10-
19 (%
), m
ale66
.868
.262
.753
.927
.91.
63.
8-1
.9-1
.5-1
1.4
LFPR
chi
ldre
n/yo
uth
ages
10-
19 (%
), fe
male
62.5
68.9
64.6
53.9
37.9
2.0
7.3
2.4
-3.4
-0.7
6
Em
ploy
ed d
urin
g las
t 7
days
(% o
f to
tal w
orki
ng
age
popu
latio
n)
81.5
84.6
82.6
80.1
70.3
5.8
8.1
4.0
4.0
0.7
A
gricu
lture
69.3
68.3
66.0
56.8
21.9
-2.8
-3.4
0.5
2.6
-4.3
In
dust
ry9.
311
.19.
912
.111
.0-0
.72.
82.
01.
80.
4
Serv
ices
21.3
20.6
23.8
30.7
66.0
7.3
3.9
1.4
-1.4
9.1
Une
mpl
oym
ent r
ate
durin
g las
t 7 d
ays (
% o
f lab
our f
orce
)
0.0
0.0
0.3
0.3
0.4
-0.6
-1.0
-0.2
-0.5
-1.2
Sour
ce: a
utho
rs’ c
alcul
atio
ns u
sing
CSE
S

86 Inclusive Development in Cambodia: An Assessment
APPENDIX A
Poverty and Inequality Measures
This section details the measurement we use to diagnose poverty in Cambodia. It also helps us to answer such questions as Who are they? Where do they live? What are their occupations? How many poor are there? We use a number of poverty measures, since each one has its own problems and shortcomings. Complementary measures can help us examine poverty from different angles and avoid having significantly different results of each measure.
Poverty Measures6
The Foster, Greer and Thorbecke (1984) index is one of the most commonly used measures. The index representing a class of poverty measures can be written as:
P1
N
G
z
N
, ,
G y ,
I
I
where Pα is a set of poverty measures, α is a measure of the sensitivity of the index
to poverty, z is the poverty line, yi is the value of consumption per capita for the ith
person’s household and N is the number of persons in the survey. As mentioned, lowness in income (consumption) is a cause of impoverishment and impoverished life is determined if a person has daily income (consumption) per capita less than a predetermined line, called the poverty line. Thus, I
i = 1 denotes that standard of living
of person ith is above the poverty line and Ii = 0 indicates the person is below the line.
α = 0 is the poverty headcount of the population; α = 1 reflects the poverty gap, which measures poverty severity and the extent to which the poor are below the poverty line, a predetermined minimum standard of living; and α = 2 measures squared poverty gap. This poverty index can also be decomposed to analyse poverty for population sub-groups and the contribution of each group to total poverty. Sub-groups include, for example, disaggregation by regions, sex of household head, occupation, sectors etc. This would augment our understanding on the situation of the poor and especially policy design to help them move out of poverty (Haughton and Khandker 2009: 72).
Inequality Measures
To examine inequality, the study employs a few inequality measures proposed by the literature, one of which is the Gini coefficient, the most widely used. It measures income (consumption) distribution and is calculated as the ratio of the area between the Lorenz
6 Poverty measures presented in this part are mainly adopted from those in Haughton & Khandker (2009).
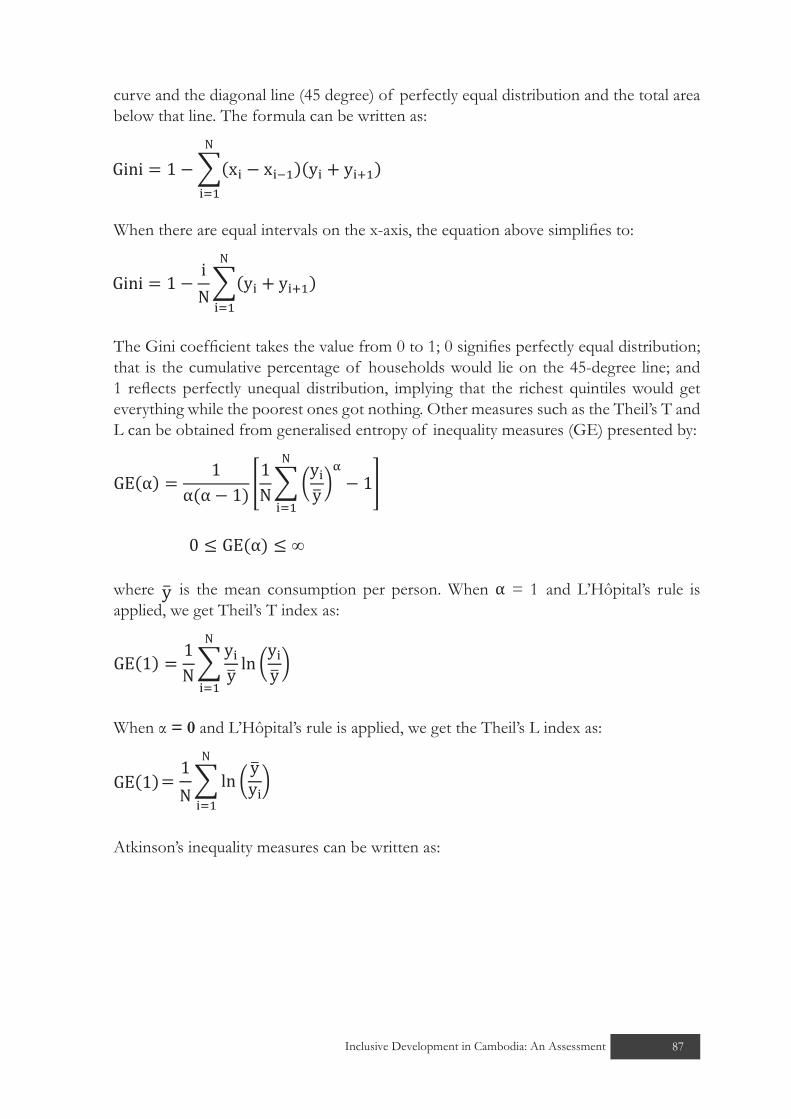
87Inclusive Development in Cambodia: An Assessment 87
curve and the diagonal line (45 degree) of perfectly equal distribution and the total area below that line. The formula can be written as:
x y
N
When there are equal intervals on the x-axis, the equation above simplifies to:
iy
N
N
The Gini coefficient takes the value from 0 to 1; 0 signifies perfectly equal distribution; that is the cumulative percentage of households would lie on the 45-degree line; and 1 reflects perfectly unequal distribution, implying that the richest quintiles would get everything while the poorest ones got nothing. Other measures such as the Theil’s T and L can be obtained from generalised entropy of inequality measures (GE) presented by:
GE α1 1
N
y
y
N
∞
where is the mean consumption per person. When α = 1 and L’Hôpital’s rule is applied, we get Theil’s T index as:
GE 11 y y
yy
N
N
When α = 0 and L’Hôpital’s rule is applied, we get the Theil’s L index as:
1 yN
N
GE 1 y
Atkinson’s inequality measures can be written as:

88 Inclusive Development in Cambodia: An Assessment
A1
N
y
y
N
A∏ y NN
y
APPENDIX B
Pro-poor growth: income (consumption) approach
To examine whether Cambodia’s growth in the past decade has been pro-poor in relative terms, we adopt the pro-poor approach proposed by Kakwani and Pernia (2000). The basic intuition of their framework to explain growth-poverty-inequality link is that total poverty elasticity is dependent on both sustained fast growth and inequality. Given that rationale, we can write:
(1)
where ρ represents a class of poverty measures, z is the pre-determined poverty line, c denotes average consumption of the household and L(ρ) reflects consumption distribution between individuals in the survey.
If c is the consumption of an individual, a random variable with a density function f(c), and z is the poverty line; then the decomposable poverty measures can be written as7
P z, c f c dc (2)
where ρ(z, c) is a homogenous function of degree zero in z and c such that
P z, z , , and
(3)
Kakwani and Son (2008) show that the change in poverty is dependent on two factors: the consumption (income) change of a poor individual resulting from the change in the mean income (consumption) of the society (growth elasticity of poverty) and the change in inequality accompanying the mean consumption (income) growth rate (inequality
7 This decomposable general class of poverty measures can be applied to a class of poverty measures proposed by Foster-Greer-Thorbecke (Foster et al. 1984) or Watt index. Foster-Greer-Thorbeck poverty measures can be written as f c dc, where α is the parameter of inequality aversion. When α = 0, ρ represents the headcount index; α = 1, ρ is poverty gap index; and α = 2, ρ is squared poverty gap or the severity of poverty index. The Watt index can be obtained as c dc.
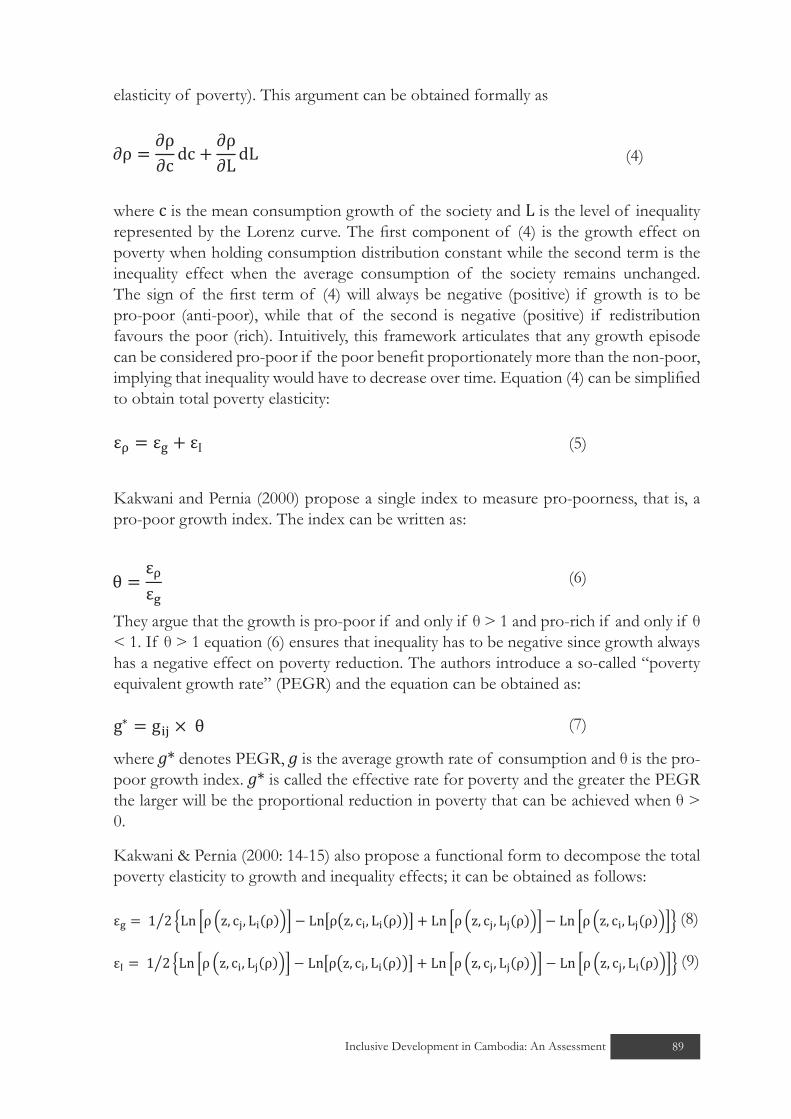
89Inclusive Development in Cambodia: An Assessment 89
elasticity of poverty). This argument can be obtained formally as
(4)
where c is the mean consumption growth of the society and L is the level of inequality represented by the Lorenz curve. The first component of (4) is the growth effect on poverty when holding consumption distribution constant while the second term is the inequality effect when the average consumption of the society remains unchanged. The sign of the first term of (4) will always be negative (positive) if growth is to be pro-poor (anti-poor), while that of the second is negative (positive) if redistribution favours the poor (rich). Intuitively, this framework articulates that any growth episode can be considered pro-poor if the poor benefit proportionately more than the non-poor, implying that inequality would have to decrease over time. Equation (4) can be simplified to obtain total poverty elasticity:
(5)
Kakwani and Pernia (2000) propose a single index to measure pro-poorness, that is, a pro-poor growth index. The index can be written as:
(6)
They argue that the growth is pro-poor if and only if θ > 1 and pro-rich if and only if θ < 1. If θ > 1 equation (6) ensures that inequality has to be negative since growth always has a negative effect on poverty reduction. The authors introduce a so-called “poverty equivalent growth rate” (PEGR) and the equation can be obtained as:
g (7)
where g* denotes PEGR, g is the average growth rate of consumption and θ is the pro-poor growth index. g* is called the effective rate for poverty and the greater the PEGR the larger will be the proportional reduction in poverty that can be achieved when θ > 0.
Kakwani & Pernia (2000: 14-15) also propose a functional form to decompose the total poverty elasticity to growth and inequality effects; it can be obtained as follows:
(8)
(9)

90 Inclusive Development in Cambodia: An Assessment
A few words on equations (8) & (9) are in order. Firstly, both equations clearly depict the rationale behind the pro-poor growth approach used partly to explain growth-poverty-inequality link. The decomposition is done in a way that takes the effects of growth and inequality on poverty into account. Equation (8) illustrates the pure growth effect on poverty keeping consumption distribution constant. Thus, variables are consumption between the two year periods, c
j and c
i; while L
j (ρ) and L
i(ρ) are the same. Equation (9)
is just the opposite, measuring inequality effect on poverty; that is, it allows consumption distribution to change between the two periods, L
j (ρ) and L
i(ρ), and consumption
growth, cj and c
i, remains unchanged. Then, to apply this framework, we need survey
data across years—either cross-section or panel data sets. The time aspect is imbedded in the subscripts j and i; the former represents the next period and the latter denotes the preceding one. Dividing each equation by half represents the average of the two periods.
Pro-Poor Growth: Non-Income Approach
There have been few attempts to use non-income indicators to measure pro-poor growth. To Grosse et al. (2008), pro-poor growth should be viewed as a multidimensional phenomenon. It is more interesting to understand that households who are not income/consumption poor may be non-income poor, if one looks at, e.g., their average education or health status.
To measure pro-poor growth using non-income aspects, we adopt a method employed by Grosse et al. (2008), who extend both Ravallion and Chen (2003)’s and Kakwani and Pernia (2000)’s income (consumption) pro-poor growth approach to non-income. This paper mainly adopts Grosse’s approach using Kakwani and Pernia’s. All else remains the same; this method only replaces an income/consumption variable with non-income variables.
The PEGR is calculated using each of the proposed non-income variables (see Section 5 on detailed indicators used in the analyses). For instance, if average education of a household is employed, the PEGR can be written as:
(10)
(11)
(12)
where gedu
is the growth of median years of schooling between the two periods. θedu
is the ratio between the total elasticity of poverty (ε
ρ.edu) and pure growth elasticity
of poverty (εg.edu
). The calculation starts from ranking the median years of schooling from the highest to the lowest so that poverty line can be specified. Here, we determine households below the 30th percentile education poorest as the poverty headcount. Therefore, intuitively, pure growth elasticity of poverty of –1.5 means if overall median years of schooling of all households in the sample increase by 1 percent, keeping

91Inclusive Development in Cambodia: An Assessment 91
distribution constant, the number of education-poor households drops by 1.5 percent, which is elastic. Inequality effects (ε
I.edu) calculate whether in the absence of growth of
median years of schooling the number of education-poor households decreases due to improved education service provision, which is indeed the necessary condition for pro-poor education growth.
As mentioned above, the pro-poor growth index is evaluated against predetermined and, to some extent, value judgement thresholds. A growth scenario is said to be pro-poor if θ > 1 and pro-rich if θ < 1. However, this might be a bit rigid in evaluation. Thus, we adopt a range of thresholds proposed by Kakwani and Pernia (2000) as shown in Table 32.
Table 30: Thresholds of Pro-poor Growth IndexPro-poor index Value judgement θ < 0 Growth is anti-poor.0 < θ ≤ 0.33 Growth is weakly pro-poor.0.33 < θ ≤ 0.66 Growth is moderately pro-poor.0.66 < θ < 1.0 Growth is pro-poor.θ ≥ 1.0 Growth is strickly pro-poor.
Source: Kakwani and Pernia 2000

92 Inclusive Development in Cambodia: An Assessment
APPENDIX C
Conceptual Framework for Inclusive Growth
POVERTY REDUCTION
INCLUSIVE
GROWTH
ECONOMIC OPPORTUNITIES
SOCIAL SAFETY NET
INSTITUTIONAL STRENGTHS
EQUAL ACCESS TO ECONOMIC
OPPORTUNITIES
Source: ADB (2007)
APPENDIX D
Policies, Growth, Inequality and Poverty Reduction
Economic Growth (Change in Average income over time)
Inequality (Change in Income
Distribution)
Poverty Reduction (Change in Poverty
over time)Policy Reforms
?We don’t know enough
?We don’t know enough We know enough
We know enoughWe know enough
Source: Lopez 2011

93Inclusive Development in Cambodia: An Assessment 93
APPENDIX E
Sources of Data Used to Estimate Household Consumption
Consumption category
2011 CSES 2009 CSES
Source of information
Reference period
Number of days in reference
period (conversion
factor)
Source of information
Reference period
Number of days in reference
period (conversion
factor)
Food, beverages 1. and Tobacco
Household questionnaire, section 01.B: Q1-20
Last 7 days 7 Household questionnaire, section 01.B: Q1-20
Last 7 days 7
Clothing and 2. footwear
Household questionnaire, section 01.C: Q5
Last 6 months 182.5 Household questionnaire, section 01.C: Q5
Last 6 months
182.5
Housing and utilities 3.
3.1 House and house maintenance3.1.1 Rent/accommodationActual rent paid Household
questionnaire, section 04: Q25a
Last month 30.4 Household questionnaire, section 04: Q25a
Last month 30.4
Estimated rent (for households not paying rent)
Household questionnaire, section 08: Q6 for owner-occupied housing, and an imputed value (based on regression) for housing not owned but for which no rent was paid
Last Month 30.4
Household questionnaire, section 08: Q6 for owner-occupied housing, and an imputed value (based on regression) for housing not owned but for which no rent was paid
Month 30.4
Hotel/accommodation charges
Diary expenditure, items 6210,6211
Calendar month
Number of days in calendar month
Diary expenditure, items 6210,6211
Calendar month
Number of days in calendar month
3.1.2 Housing maintenance and repairs
Household questionnaire, section 04: Q26
Last month 30.4 Household questionnaire, section 04: Q26
Last month 30.4
3.2 Utilities 3.2.1 Water and sanitation Water charges Household
questionnaire, section 04: Q16
Last month 30.4 Household questionnaire, section 04: Q16
Last month 30.4
Sewage and waste water disposal
Household questionnaire, section 04: Q20
Last month 30.4 Household questionnaire, section 04: Q20
Last month 30.4
Garbage collection Household questionnaire, section 04: Q21
Last month 30.4 Household questionnaire, section 04: Q21
Last month 30.4
3.2.2 Fuel/power for cooking & lighting 3.2.2.1 Non-wood fuels

94 Inclusive Development in Cambodia: An Assessment
Electricity Household questionnaire, section 04: Q23a
Last month 30.4 Household questionnaire, section 04: Q23a
Last month 30.4
Gas Household questionnaire, section 04: Q23b
Last month 30.4 Household questionnaire, section 04: Q23b
Last month 30.4
Kerosene Household questionnaire, section 04: Q23c
Last month 30.4 Household questionnaire, section 04: Q23c
Last month 30.4
Battery Household questionnaire, section 04: Q23f
Last month 30.4 Household questionnaire, section 04: Q23f
Last month 30.4
3.2.2.2 Wood fuelsFirewood Household
questionnaire, section 04: Q23d
Last month 30.4 Household questionnaire, section 04: Q23d
Last month 30.4
Charcoal Household questionnaire, section 04: Q23e
Last month 30.4 Household questionnaire, section 04: Q23e
Last month 30.4
3.2.2.3 Other fuels Household questionnaire, section 04: Q23g
Last month 30.4 Household questionnaire, section 04: Q23g
Last month 30.4
Household furnishings and household operations4.
Furniture, furnishings and household equipment and operation
Household questionnaire, section 01.C: Q6
Last 12 months
365 Household questionnaire, section 01.C: Q6
Last 12 months
365
Domestic salaries Household questionnaire, section 01.C: Q7
Last 12 months
365 Household questionnaire, section 01.C: Q7
Last 12 months
365
Health expenditure 5.
5.1 Medical care Household questionnaire, section 01.C: Q1
Last 1 month 30.4 Household questionnaire, section 01.C: Q1
Last 1 month
30.4
5.2 Health care Household questionnaire, section 13.B: Q10-11 (expenditure for all household members reporting illness, injury or other health problem)
Last 30 days 30.4
Household questionnaire, section 13.B: Q10-11 (expenditure for all household members reporting illness, injury or other health problem)
Last 30 days 30.4
Transportation6. Diary expenditure, items 5010-5140
Calendar month
Number of days in calendar
month
Diary expenditure, items 5010-5140
Calendar month
Number of days in calendar month
Communications7. Diary expenditure, items 5150-5172
Recreation8. Household questionnaire, section 01.C: Q8-9
Last 12 months
365 Household questionnaire, section 01.C: Q8-9
Last 12 months
365
Gambling 9. Household questionnaire, section 01.C: Q12
Last 12 months
365 Household questionnaire, section 01.C: Q12
Last 12 months
365

95Inclusive Development in Cambodia: An Assessment 95
Education10. Household questionnaire, section 01.C: Q10 and section 2, Q16a-16h (total is given in Q16h)
Last 12 months
365 Household questionnaire, section 01.C: Q10 and section 2, Q16a-16h (total is given in Q16h)
Last 12 months
365
Personal care and personal effects 11.
11.1 Personal care Diary expenditure, items 6220-6243
Calendar month
Number of days in calendar
month
Diary expenditure, items 6220-6243
Calendar month
Number of days in
calendar month11.2 Personal effects Household
questionnaire, section 01.C: Q11
Last 12 months
365 Household questionnaire, section 01.C: Q11
Last 12 months
365
Miscellaneous 12. items
Household questionnaire, section 01.C: Q13
Last 12 months
365 Household questionnaire, section 01.C: Q13
Last 12 months
365
Source: CSES 2009 & 2011Note: We adopted this framework from World Bank 2009

Chapter 3Inclusive Development
in Lao PDR: An Assessmentby Vanthana Nolintha, Amphaphone Sayasenh,
Leeber Leebuapao and Phetsamone Sone
with the assistance of
Korakoon Silaphet and Phetsavanh Boutlasy

97Inclusive Development in Lao PDR: An Assessment 97
1. INTRODUCTION
Economic growth has long been an important objective of government in both developed and developing countries. However, development objectives have shifted from a purely rapid growth focus to sustainable development and, more recently, to inclusive growth. Sustainable development is “meeting the needs of the present without compromising the ability of future generations to meet their own needs” (United Nations 1987). Following this broad concept, development strategies for sustainable growth will balance economic growth with preservation of the environment and natural resources. Sustainable growth deals with inter-temporal choices. Inclusive growth, on the other hand, is the type of sustainable growth that expands economic opportunities and ensures accessibility for all. The World Bank (2009) defines inclusive growth as growth that is broad-based across sectors and allows a large part of the country’s labour force to contribute to and benefit from it. Inclusive growth also deals with the pace and pattern of growth, focusing on both employment and productivity growth in which the government plays a facilitating role (World Bank 2009).
Since the introduction of the market-based economic policy in 1986, the government of the Lao PDR has undertaken reforms with the objective of improving living standards. The Five Year Socio-Economic Development Plan is one of the major mechanisms highlighting development strategies and priorities in different periods. The concepts of sustainable development and inclusiveness, although not used explicitly, have been integrated into the core objectives of the Seventh Five Year Plan for 2011-15. Reducing poverty and disparities between urban and rural areas and between districts, provinces and regions is clearly stated as one of the main objectives (GoL 2011). In addition, the seventh plan also makes an explicit link between economic growth, social development and environmental protection. This shows that the government realises the importance of sustainable and inclusive growth and is beginning to integrate these concepts into the development agenda.
The overall objective of this study is to examine the current stage of growth inclusiveness in Laos. The specific objectives are to identify the key variables that can be employed to measure growth inclusiveness and to identify main obstacles for achieving more inclusive growth.
This study will examine the state of growth inclusiveness in Laos by analysing both outcomes and the process of growth in income and non-income dimensions. Secondary data will be the primary source of the analysis. The study will also analyse inclusiveness based on Mckinley’s (2010) composite index.
Section 2 will describe recent economic performance as the context for this study. Section 3 will evaluate the inclusiveness of growth from an income standpoint, followed by non-income dimension analysis in Section 4. The composite growth inclusiveness index will be calculated and analysed in Section 5. The final section will point out challenges for inclusiveness and propose some policies and areas for further investigation.
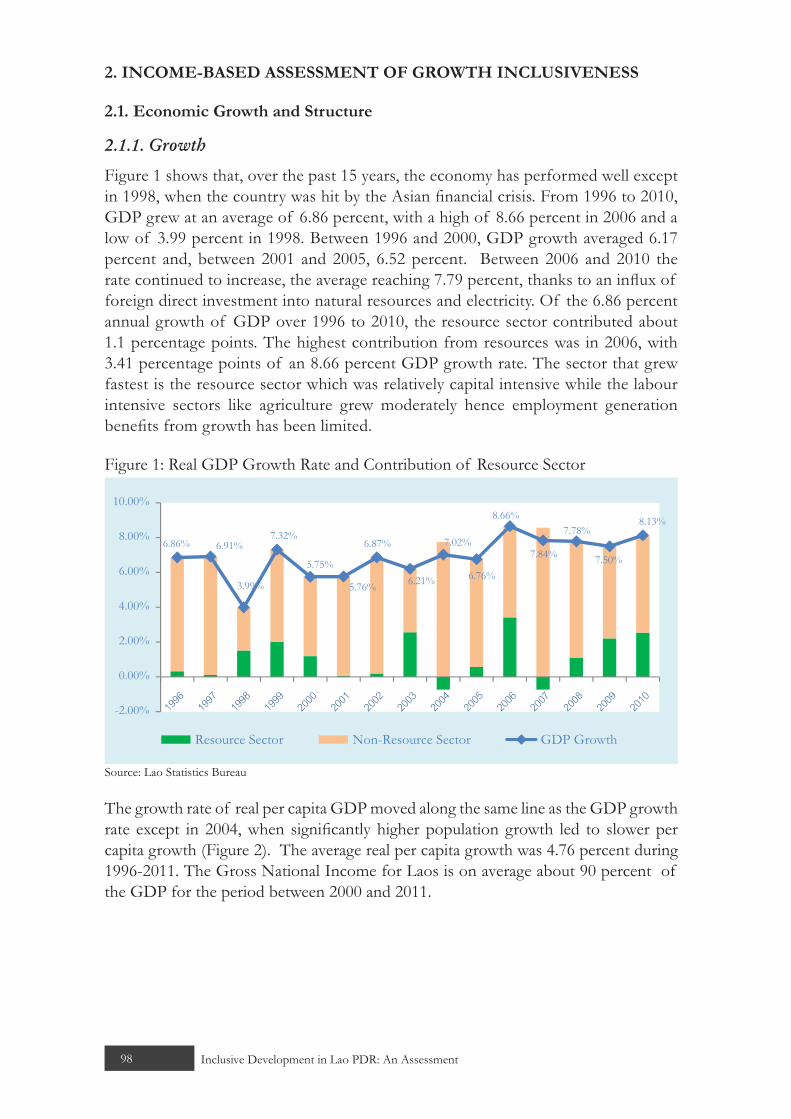
98 Inclusive Development in Lao PDR: An Assessment
2. INCOME-BASED ASSESSMENT OF GROWTH INCLUSIVENESS
2.1. Economic Growth and Structure
2.1.1. Growth
Figure 1 shows that, over the past 15 years, the economy has performed well except in 1998, when the country was hit by the Asian financial crisis. From 1996 to 2010, GDP grew at an average of 6.86 percent, with a high of 8.66 percent in 2006 and a low of 3.99 percent in 1998. Between 1996 and 2000, GDP growth averaged 6.17 percent and, between 2001 and 2005, 6.52 percent. Between 2006 and 2010 the rate continued to increase, the average reaching 7.79 percent, thanks to an influx of foreign direct investment into natural resources and electricity. Of the 6.86 percent annual growth of GDP over 1996 to 2010, the resource sector contributed about 1.1 percentage points. The highest contribution from resources was in 2006, with 3.41 percentage points of an 8.66 percent GDP growth rate. The sector that grew fastest is the resource sector which was relatively capital intensive while the labour intensive sectors like agriculture grew moderately hence employment generation benefits from growth has been limited.
Figure 1: Real GDP Growth Rate and Contribution of Resource Sector
6.86% 6.91%
3.99%
7.32%
5.75%
5.76%
6.87%
6.21%
7.02%
6.76%
8.66%
7.84%
7.78%
7.50%
8.13%
-2.00%
0.00%
2.00%
4.00%
6.00%
8.00%
10.00%
Resource Sector Non-Resource Sector GDP Growth
Source: Lao Statistics Bureau
The growth rate of real per capita GDP moved along the same line as the GDP growth rate except in 2004, when significantly higher population growth led to slower per capita growth (Figure 2). The average real per capita growth was 4.76 percent during 1996-2011. The Gross National Income for Laos is on average about 90 percent of the GDP for the period between 2000 and 2011.

99Inclusive Development in Lao PDR: An Assessment 99
Figure 2: Real GDP Per Capita Growth
4.47
7.00%
6.00%
5.00%
4.00%
3.00%
2.00%
1.00%
0.00%
4.575.07
1.77
1996
1997
1998
1999
2000
2001
2002
2003
2004
2003
2006
2007
2008
2009
2010
2011
3.58
3.64
4.76
4.16 3.88
5.94
6.28
5.52
5.51
5.26
5.92
5.86
Source: Lao Statistics Bureau
2.1.2. Structural Change
The structure of the economy has moved toward high value added sectors over time. In 1995, nine years after the introduction of the New Economic Mechanism, which ended the central-planning economic regime, the share of agricultural value added was more than half (53.66 percent) of total GDP. However, it then declined substantially, to 45.83 percent in 2000, 34.38 percent in 2005 and 28.41 percent in 2010. Over the same period, the share of services value added in GDP increased from 25.32 percent in 1995 to 30.59 percent in 2000, 37.26 percent 2005 and 39.32 percent in 2010. The share of industrial value added exhibited a mixed picture; its share of GDP dropped slightly, from 18.55 percent in 1995 to 18.01 percent in 2000, and then increased to 22.03 percent in 2005 and 25.93 percent in 2010 (Figure 3).
Figure 3: Structure of GDP
0
0.2
0.4
0.6
0.8
1
1.2
1995 2000 2005 2010
Agriculture
Industry
Service
Import Duties
Source: Lao Statistics Bureau

100 Inclusive Development in Lao PDR: An Assessment
Figure 4: Structure of Industrial Value Added
0
0.2
0.4
0.6
0.8
1
1.2
2000
2005
2006
2007
2008
2009
2010
Construction
Electricity and water supply
Manufacturing
Mining
Source: Lao Statistics Bureau
The increased share of industrial value-added in GDP between 2000 and 2005 was, to a great extent, contributed by the boom of the mining sector, which is capital intensive (Figure 4); thus, this increased industrial value-added does not imply a big increase in employment. However, since the mining share in industrial value added peaked in 2006, it has declined and been overtaken by manufacturing (Figure 4). Therefore, it can be said that increases in industrial value added have generated more employment in recent years.
2.1.3. Conclusion on Economic Growth and Structural Change
GDP and GDP per capita growth have been robust and stable over the past two decades. The growth has been driven in recent years by high value added and more employment-generating sectors such as manufacturing and services. Therefore, Laos’ economic growth has been very satisfactory.
2.2. Productive Employment
Productive employment is the key to inclusive growth because it is the most important source of income security. The following indicators provide a picture of productive employment generation.
2.2.1. Sectoral Distribution of Labour Force
The labour force participation rate has been high over the last two decades. About 83.85 percent of the working-age population were in the labour force in 1995; this declined slightly to 80.20 percent in 2005. Although there have been high labour force participation rates and a change of economic structure towards high value-added sectors since 1995, Laos has made little progress in expanding productive employment, as a majority of the active population are still concentrated in agriculture. In 1995, 85.4 percent of workers were in agriculture, declining to 78.5 percent in 2005 and 71.9

101Inclusive Development in Lao PDR: An Assessment 101
percent in 2011. The share of workers in services in 1995 was 11.1 percent, jumping to 16.7 percent in 2005 and 19.9 percent in 2011. Workers in industry, the highest value-added sector, were only 3.5 percent in 1995, increased marginally to 4.8 percent in 2005, but increased considerably to 8.2 percent in 2012. Although the share of industrial workers is still small, the faster pace of increase is a good sign.
Figure 5: Sectoral Distribution of Workers
85.4
78.5
71.9
3.5
4.8
8.2
11.1
16.7
19.9
0 20 40 60 80 100
1995
2005
2011
Agriculture Industry Services
Source: Lao Statistics BureauNote: 1995 and 2005 numbers are from population census, 2011 numbers from labour survey.
2.2.2. Labour Productivity
Figure 6 presents labour productivity (the amount of annual value added by one worker) in 1995 and 2005 in 1990 prices. The figure shows little improvement over the period. In 1995 the labour productivity of agriculture, the sector that accommodates most workers, was 0.2 million kip, increasing to 0.3 million kip in 2005. The labour productivity of services was 0.9 million kip in 1995 and in 2005. The labour productivity of industry made the most progress among the three sectors, increasing from 2.1 million kip in 1995 to 3.4 million kip in 2005.
Figure 6: Labour Productivity by Sector
0.9
0.9
2.1
3.4
0.2
0.3
0 0.5 1 1.5 2 2.5 3 3.5 4
1995
2005
Mill
ion
Kip
, 199
0 P
rice
s
agriculture industry services
Source: The 4th National Human Development Report, UNDP, Lao PDR 2009

102 Inclusive Development in Lao PDR: An Assessment
2.2.3. Vulnerable Employment
Own-account workers’ and unpaid family workers’ incomes are vulnerable due to the nature of the work they are engaged in. These two groups accounted for 88 percent of the total labour force in 1995, and the share remained unchanged in 2005; however, the share of own-account workers declined from 55 percent to 42 percent and the share of unpaid family workers increased from 33 percent to 46 percent (Figure 7).
Figure 7: Share of Own-Account and Unpaid Family Workers in Labour Force
55
4233
46
0%
10%
20%
30%
40%
50%
60%
50025991Share of own-account workers Share of unpaid family workers
Source: 1995 and 2005 population census, Lao Statistics Bureau
2.2.4. Conclusion on Productive Employment
Overall, Laos has made very little progress in generating productive employment. A very large proportion of workers are in agriculture and create relatively little value added. Moreover, over the 10 years from 1995 to 2005, labour productivity increased very marginally, and 88 percent of the labour force are own-account and unpaid family workers, whose incomes are vulnerable.
2.3. Poverty Profile
2.3.1. Poverty Headcount
There has been substantial progress in reducing poverty over the past two decades. The proportion of poor, using the international poverty line,1 decreased from 55.7 percent in 1992-93 to 33.9 percent in 2007-08. The poverty headcount, based on the national poverty line,2 also decreased sharply, from 46 percent to 27.6 percent, over the same period. The poverty analysis in this paper is based on the national poverty line for local context and richness of available data. Poverty eradication is most remarkable in urban areas and least in rural areas without roads. Across regions, poverty is prominent in the north and less severe in the south. The reduction in provincial variations in poverty was most observable during 2002-03 compared with 1997-98 (Figure 8). The poverty profile also differs substantially with border areas, district slope, village altitude and
1 The international poverty line is USD1.25 a day at 2005 prices.2 Defined as the combination of 2100 calories per person per day and an allowance for non-
food consumption.

103Inclusive Development in Lao PDR: An Assessment 103
ethnic groups (Table 1). The area close to the Vietnamese border is the poorest region and has the slowest progress. Districts with large areas of steep land and upland areas have a higher incidence of poverty and slower progress in poverty eradication.
Figure 8: Poverty Headcount across Provinces
0.0
10.0
20.0
30.0
40.0
50.0
60.0
70.0
80.0
0 1992/93 1997/98 ����������������� 2002/03 ������� 2007/08
Source: Lao Statistics BureauNote: Each point refers to the poverty level in each province in each time period. When all the points stay
closer to one another and to the average line, there is less degree of variation in poverty levels across the provinces.
Table 1: Poverty HeadcountLao PDR 1992-93 1997-98 2002-03 2007-08National Poverty Line 46.0 39.1 33.5 27.6USD1.25 PPP Poverty Line 55.7 49.3 44 33.9Area 1992-93 1997-98 2002-03 2007-08Urban 26.5 22.1 19.7 17.4Rural 51.8 42.5 37.6 31.7
Rural with road 42.8 31.7 31.3 29.9Rural w-9o road 60.4 50.8 46.2 42.6
Region 1992-93 1997-98 2002-03 2007-08Vientiane 33.6 13.5 16.7 15.2North 51.6 47.3 37.9 32.5Central 45.0 39.4 35.4 29.8South 45.7 39.8 32.6 22.8Border 1992-93 1997-98 2002-03 2007-08Inland 47.2 37.5 32.3 29.2Thai border 33.4 29.4 22.5 16.1Vietnam border 58.4 66.3 61.1 54.5China-Myanmar border 49.1 46.4 28.1 28.2Cambodia border 68.1 38.5 39.8 23.1
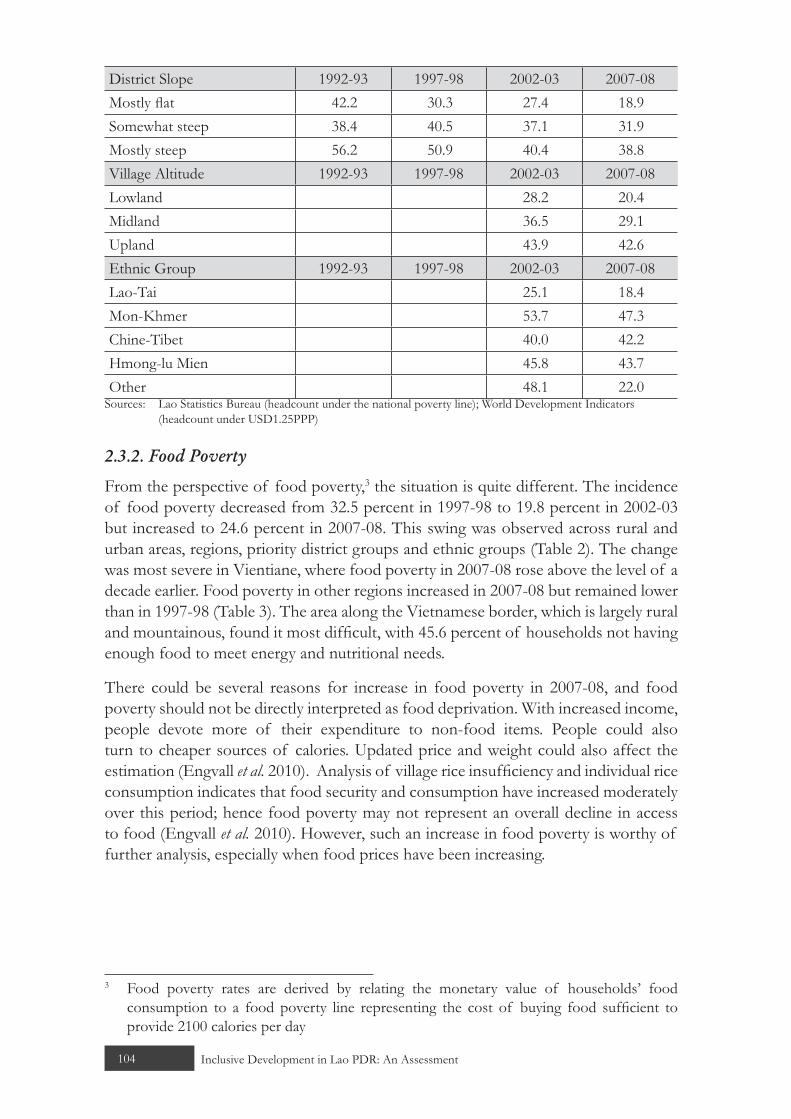
104 Inclusive Development in Lao PDR: An Assessment
District Slope 1992-93 1997-98 2002-03 2007-08Mostly flat 42.2 30.3 27.4 18.9Somewhat steep 38.4 40.5 37.1 31.9Mostly steep 56.2 50.9 40.4 38.8Village Altitude 1992-93 1997-98 2002-03 2007-08Lowland 28.2 20.4Midland 36.5 29.1Upland 43.9 42.6Ethnic Group 1992-93 1997-98 2002-03 2007-08Lao-Tai 25.1 18.4Mon-Khmer 53.7 47.3Chine-Tibet 40.0 42.2Hmong-lu Mien 45.8 43.7Other 48.1 22.0
Sources: Lao Statistics Bureau (headcount under the national poverty line); World Development Indicators (headcount under USD1.25PPP)
2.3.2. Food Poverty
From the perspective of food poverty,3 the situation is quite different. The incidence of food poverty decreased from 32.5 percent in 1997-98 to 19.8 percent in 2002-03 but increased to 24.6 percent in 2007-08. This swing was observed across rural and urban areas, regions, priority district groups and ethnic groups (Table 2). The change was most severe in Vientiane, where food poverty in 2007-08 rose above the level of a decade earlier. Food poverty in other regions increased in 2007-08 but remained lower than in 1997-98 (Table 3). The area along the Vietnamese border, which is largely rural and mountainous, found it most difficult, with 45.6 percent of households not having enough food to meet energy and nutritional needs.
There could be several reasons for increase in food poverty in 2007-08, and food poverty should not be directly interpreted as food deprivation. With increased income, people devote more of their expenditure to non-food items. People could also turn to cheaper sources of calories. Updated price and weight could also affect the estimation (Engvall et al. 2010). Analysis of village rice insufficiency and individual rice consumption indicates that food security and consumption have increased moderately over this period; hence food poverty may not represent an overall decline in access to food (Engvall et al. 2010). However, such an increase in food poverty is worthy of further analysis, especially when food prices have been increasing.
3 Food poverty rates are derived by relating the monetary value of households’ food consumption to a food poverty line representing the cost of buying food sufficient to provide 2100 calories per day

105Inclusive Development in Lao PDR: An Assessment 105
Table 2: Food Poverty (%) 1997-98 2002-03 2007-08Lao PDR 32.5 19.8 24.6Area 1997-98 2002-03 2007-08Urban 22.3 14.3 18.5Rural 34.5 21.5 27.1
Rural with road 27.5 16.9 25.3Rural w/o road 39.9 27.6 38.4
Region 1997-98 2002-03 2007-08Vientiane 12.4 11.6 18.5North 36.1 23.3 24.8Central 32.0 19.8 28.1South 38.8 18.7 21.8Border 1997-98 2002-03 2007-08Inland 31.8 19.3 27.4Thai border 24.6 13.4 12.9Vietnamese border 52.8 34.4 45.6Chinese-Myanmar border 28.0 9.8 23.7
Cambodian border 36.0 32.0 28.4District Slope 1997-98 2002-03 2007-08Mostly flat 28.2 16.9 18.3Somewhat steep 29.6 18.3 26.5Mostly steep 39.7 24.5 34.0Village Altitude 1997-98 2002-03 2007-08Lowland 16.3 18.5Midland 22.8 25.0Upland 25.9 38.1Priority District 1997-98 2002-03 2007-08First priority 51.6 26.9 38.8Second priority 31.7 25.9 32.1Other 26.0 16.1 17.8Ethnic Groups 1997-98 2002-03 2007-08Lao-Tai 14.5 17.4Mon-Khmer 31.9 39.3Chine-Tibet 16.6 32.5Hmong-lu Mien 30.8 39.8Other 38.1 34.9
Source: Lao Statistics Bureau

106 Inclusive Development in Lao PDR: An Assessment
Table 3: Comparison of Poverty Headcount and Food Poverty, by Region and Year (%)
2007/08 level Compared to 2002/03 Compared to 1997/98
Food
povertyPoverty
headcountFood
povertyPoverty
headcountFood
povertyPoverty
headcountLao PDR 24.6 27.6 24.40 -17.70 -24.20 -29.50Vientiane 18.5 15.2 59.20 -11.90 49.00 12.90North 24.8 32.5 6.60 -15.60 -31.20 -31.20Central 28.1 29.8 41.70 -4.30 -12.30 -24.30South 21.8 22.8 16.80 -7.70 -43.70 -42.70Source: Lao Statistics Bureau
2.3.3. Poverty Gap
The poverty gap, which reflects the depth of poverty, shows some interesting and slightly different features of poverty. Nationally, the poverty gap decreased from 11.2 percent in 1992-93 to 6.5 percent in 2007-08. Rural areas performed slightly better than urban areas in reducing the poverty gap. Similarly to the pattern of the poverty headcount, the areas showing the most progress in reducing the poverty gap were the northern region, areas with relatively flatter landscape and lowlands (Table 4). However, rural areas without roads and the upland areas increased the poverty gap from 2002-03 to 2007-08. The poverty gap in Vientiane was unchanged in 2007-08 compared with 2002-03 but increased compared to 1997-98.
Table 4: Poverty gap in Lao PDR 1992-93 1997-98 2002-03 2007-08Lao PDR 11.2 10.3 8.0 6.5Area 1992-93 1997-98 2002-03 2007-08Urban 5.5 4.9 4.1 3.4Rural 12.9 11.4 9.2 7.7
Rural with road 9.9 7.3 7.1 6.9Rural w/o road 15.8 14.5 12 13.1
Region 1992-93 1997-98 2002-03 2007-08Vientiane 7.0 2.8 3.4 3.4North 13.4 13.9 9.4 7.7Central 10.3 9.7 8.4 6.9South 11.9 10.0 7.6 5.6Border 1992-93 1997-98 2002-03 2007-08Inland 11.0 9.8 7.5 6.8Thai border 6.8 6.2 4.8 3.0Vietnamese border 19.1 21.3 17.1 16.2Chinese-Myanmar border 11.4 12.9 5.3 5.3
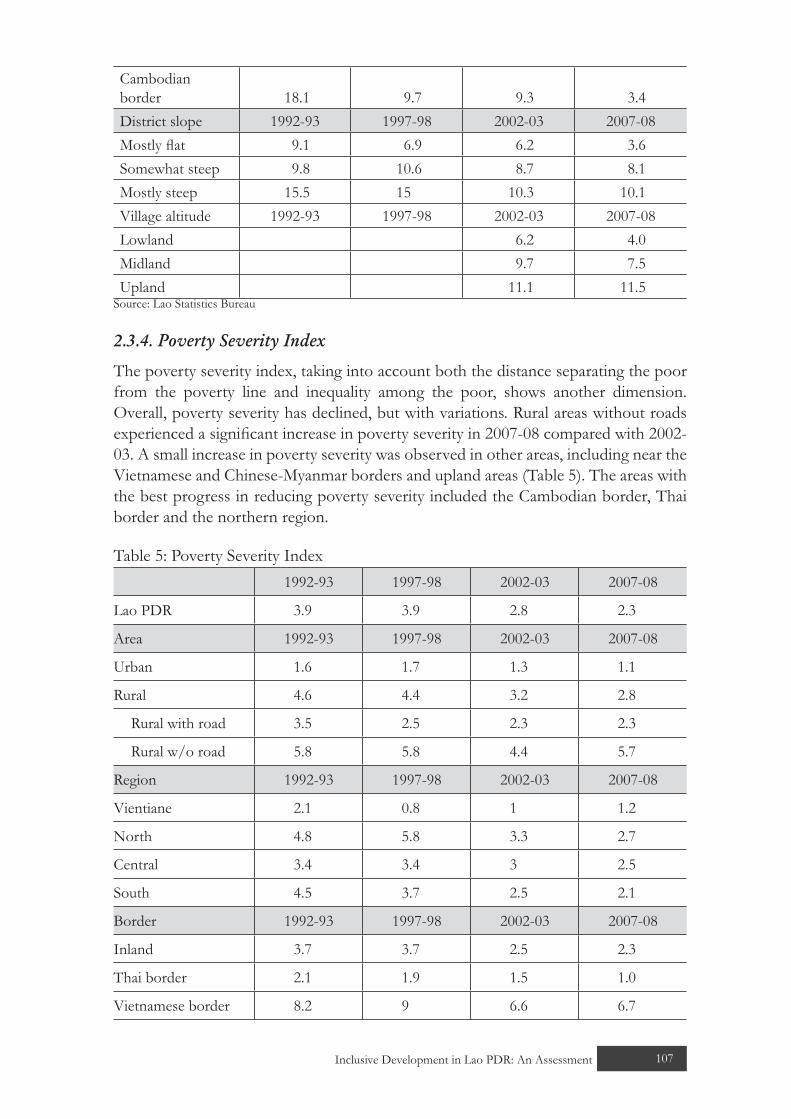
107Inclusive Development in Lao PDR: An Assessment 107
Cambodian border 18.1 9.7 9.3 3.4District slope 1992-93 1997-98 2002-03 2007-08Mostly flat 9.1 6.9 6.2 3.6Somewhat steep 9.8 10.6 8.7 8.1Mostly steep 15.5 15 10.3 10.1Village altitude 1992-93 1997-98 2002-03 2007-08Lowland 6.2 4.0Midland 9.7 7.5Upland 11.1 11.5
Source: Lao Statistics Bureau
2.3.4. Poverty Severity Index
The poverty severity index, taking into account both the distance separating the poor from the poverty line and inequality among the poor, shows another dimension. Overall, poverty severity has declined, but with variations. Rural areas without roads experienced a significant increase in poverty severity in 2007-08 compared with 2002-03. A small increase in poverty severity was observed in other areas, including near the Vietnamese and Chinese-Myanmar borders and upland areas (Table 5). The areas with the best progress in reducing poverty severity included the Cambodian border, Thai border and the northern region.
Table 5: Poverty Severity Index 1992-93 1997-98 2002-03 2007-08
Lao PDR 3.9 3.9 2.8 2.3
Area 1992-93 1997-98 2002-03 2007-08
Urban 1.6 1.7 1.3 1.1
Rural 4.6 4.4 3.2 2.8
Rural with road 3.5 2.5 2.3 2.3
Rural w/o road 5.8 5.8 4.4 5.7
Region 1992-93 1997-98 2002-03 2007-08
Vientiane 2.1 0.8 1 1.2
North 4.8 5.8 3.3 2.7
Central 3.4 3.4 3 2.5
South 4.5 3.7 2.5 2.1
Border 1992-93 1997-98 2002-03 2007-08
Inland 3.7 3.7 2.5 2.3
Thai border 2.1 1.9 1.5 1.0
Vietnamese border 8.2 9 6.6 6.7

108 Inclusive Development in Lao PDR: An Assessment
Chinese-Myanmar border
3.5 5.1 1.5 1.6
Cambodian border 6.9 3.8 3 0.7
District slope 1992-93 1997-98 2002-03 2007-08
Mostly flat 2.9 2.3 2 1.1
Somewhat steep 3.7 3.8 2.9 3.0
Mostly steep 5.8 6.2 3.8 3.7
Village altitude 1992-93 1997-98 2002-03 2007-08
Lowland 2 1.2
Midland 3.7 3.0
Upland 3.9 4.3Source: Lao Statistics Bureau
2.3.5. Conclusion on Poverty Measures
The overall progress of poverty alleviation in Laos over 15 years has been remarkable. Poverty headcounts, using both the national poverty line and the international poverty line, decreased significantly. The poverty gap and poverty severity showed a similar trend. However, differences are observed across periods and characteristics. 1997-98 to 2002-03 was the most successful period for poverty reduction by all poverty definitions. The south performed better than other regions, while the north lagged behind. The border area with Thailand, which is the most populous border area, with a high degree of foreign trade integration, had the most outstanding poverty reduction and consequently a lower poverty incidence than the rest of the country. Elevation seems to have a significant impact on poverty. The upland area, with lower population but an abundance of natural resources, has the highest incidence of poverty and slowest poverty reduction. Areas with the best links to markets and infrastructure had the fastest declines in poverty.
2.4. Inequality
2.4.1. Gini Coefficient
Consumption inequality, as measured by the Gini coefficient, increased significantly from 1992-93 to 1997-98, which could be considered the post-reform period of the Lao economy. Inequality then fell gradually from 1997-98 to 2002-03, the period of recovery from the Asian financial crisis, before increasing again in the most recent period of high economic growth. This trend was observed in both urban and rural areas (Figure 9). A comparison of the Gini coefficient by different categories is provided in Table 6. Vientiane, as expected, had the highest level of inequality, and the north experienced the most rapid increase in inequality in the latest period. Inequality in border areas can be classified into two groups: high inequality in areas near the Thai border and inland, and lower inequality in other border areas. As with poverty, land slope and altitude have an impact on inequality. Despite increasing inequality,

109Inclusive Development in Lao PDR: An Assessment 109
compared with some countries with the same or lower level of income4 and countries in the region, the Gini coefficient of Laos is considered moderate.5
Figure 9: Gini Coefficient, 1992/93-2007/08
30.5 30.929.0
34.9
39.7
32.132.634.8
30.3
35.4 36.333.4
0.0
10.0
20.0
30.0
40.0
Lao PDR Urban Rural
1992/3 1997/8 2002/3 2007/8
Source: Lao Statistics Bureau
Table 6: Gini Coefficient 1992-93 1997-98 2002-03 2007-08
Lao PDR 30.5 34.9 32.6 35.4
Gini index 30.43 34.91 32.63 36.74
Area
Urban 30.9 39.7 34.8 36.3
Rural 29 32.1 30.3 33.4
Rural with road 29.3 32.1 30.3 33.2
Rural w/o road 27.5 30.9 29.4 33.3
Region
Vientiane 29.7 36.9 36 38.0
North 26.9 34.5 30.7 35.2
Central 31.5 32.5 31 34.0
4 The World Bank categorises Laos as a lower middle income country. Thus the Gini coefficients of some low and lower middle income countries will be used for comparison.
5 Gini coefficients of some countries for comparison: Vietnam: 35.57 (2008), Cambodia: 44.4 (2008), Philippines: 42.98 (2008), Thailand: 40 (2009), Malaysia : 46.2 (2009), Indonesia: 34 (2005), China: 42.5 (2005), Timor-Leste: 31.9 (2007) and Mongolia: 36.52 (36.52).

110 Inclusive Development in Lao PDR: An Assessment
South 32.3 32.4 31.4 32.2
Border
Inland 30.2 34.6 33.5 34.5
Thai border 28.9 35.2 30.9 35.4
Vietnamese border 34.2 28.9 25.8 29.4
Chinese-Myanmar border 21.1 31.1 25.9 29.6
Cambodian border 26.8 29.3 28 29.8
District slope
Mostly flat 31.5 34.7 33.7 34.6
Somewhat steep 29.3 38.5 31.4 35.9
Mostly steep 28.1 31.4 30.1 33.5
Village altitude
Lowland 33.3 35.0
Midland 31.1 35.2
Upland 29.4 32.4
Priority district
First priority 29.9 29.7 27.9 31.9
Second priority 31.9 29.6 32.0 32.7
Other 30.1 34.9 32.7 35.1
Ethnic groups
Lao-Tai 33.0 35.0
Mon-Khmer 27.0 31.1
Chine-Tibet 23.0 26.3
Hmong-lu Mien 29.0 31.7
Other 29.0 25.8Source: Lao Statistics Bureau
2.4.2. Growth and Inequality Effect on Poverty Reduction
Change in inequality has implications for the relationship between economic growth and poverty reduction. Increases in growth can have a better effect on poverty reduction with a better distribution of income. Engvall et al. (2010) decompose the reduction in headcount poverty in Laos into growth and redistribution effects. They find that the increase in mean income contributes most of the reduction in poverty, and increases in inequality have adverse effects on poverty in most of the study periods (Figure 10). Without adverse distribution change (increase in inequality), poverty eradication could have been more rapid.

111Inclusive Development in Lao PDR: An Assessment 111
Figure 10: Reduction of Poverty Headcount, Growth Effect and Redistribution Effect (annual change)
-7.00%
-6.00%
-5.00%
-4.00%
-3.00%
-2.00%
-1.00%
0.00%
1.00%
2.00%
3.00%
1992
/3-19
97/8
1992
/3-20
07/8
1997
/8-20
02/3
2002
/3-20
07/8
Redistribution component
Growth component
Annual change to poverty headcount
Source: Engvall et al. 2010
2.4.3. Consumption Quintiles and Growth Incidence Curve
The changes in income quintiles provide supporting evidence of the inequality trend. Growth of consumption of the richest quintile is the main driver of changes in inequality. During 1992-93 to 1997-98 the share of consumption of the fifth, richest, quintile increased while the shares of other quintiles fell (Figure 11). This same pattern occurred between 2002-03 and 2007-08. However, inequality decreased from 1997-98 to 2002-03, when the share of consumption of the fifth quintile decreased while other quintiles increased their shares. The ratio of the fifth to first consumption quintile fluctuated in the same pattern as the Gini coefficient; however, its movement within a band between 4 and 6 suggests that the change in inequality was not severe.
Similarly, Engvall et al. (2010) use the data on consumption growth of different percentiles to construct the growth incidence curve, which illustrates the impact of consumption growth across the population. During 1992-03 to 1997-98, consumption growth increased with the consumption deciles, suggesting that richer people experienced a higher increase in consumption. However, during 1997-98 to 2002-03, lower deciles and those below the poverty line experienced a relatively more rapid increase in consumption, resulting in a decline in inequality in this period. In the latest period, the population in the lower consumption deciles achieved slower consumption growth, while the other extreme received a robust increase. Therefore, consumption inequality increases again in this last period.

112 Inclusive Development in Lao PDR: An Assessment
Figure 11: Consumption Quintiles, 1992/93-2007/08
4.32
5.40
4.85
5.87
-
1.00
2.00
3.00
4.00
5.00
6.00
7.00
-
20.00
40.00
60.00
80.00
100.00
120.00
1992/93 1997/98 2002/03 2007/08
1st 2nd 3rd 4th 5th Quintile Ratio
Source: Lao Statistics Bureau
2.4.4. Theil Coefficient
The Theil indexes also indicate an increase in inequality between 2002-03 and 2007-08. Decomposing the overall inequality suggests that the between-area inequality contributes less than 7 percent of the total, while the rest of the inequality is explained by within-area inequality. Inequality in rural areas has risen faster than in urban areas (Table 7).
Table 7: Theil Indexes Theil’s L (GE(0)) Theil’s T (GE(1))
Area 2002-03 2007-08 2002-03 2007-08Lao PDR 0.18 0.22 0.21 0.27 Urban 0.21 0.21 0.24 0.24 Rural 0.16 0.20 0.18 0.27 Decomposition Within Inequality 0.17 0.21 0.20 0.26 Between Inequality 0.01 0.01 0.01 0.01 Between inequality as % of total inequality
7.02% 6.47% 6.39% 5.45%
Source: Authors’ calculation using 3rd and 4th Lao Expenditure and Consumption Survey data
2.4.5. Conclusion on Inequality Measures
Various indicators suggest that inequality in Laos increased between 1992-93 and 1997-98, declined between 1997-98 and 2002-03, then increased from 2002-03 to 2007-08. Inequality in urban and rural areas moved in the same direction. Interestingly, inequality fell during the economic slowdown caused by the crisis and rose during good economic conditions. Although inequality has risen in recent years in line with economic growth, most indicators remain low. Thus, performance in this area is considered satisfactory.
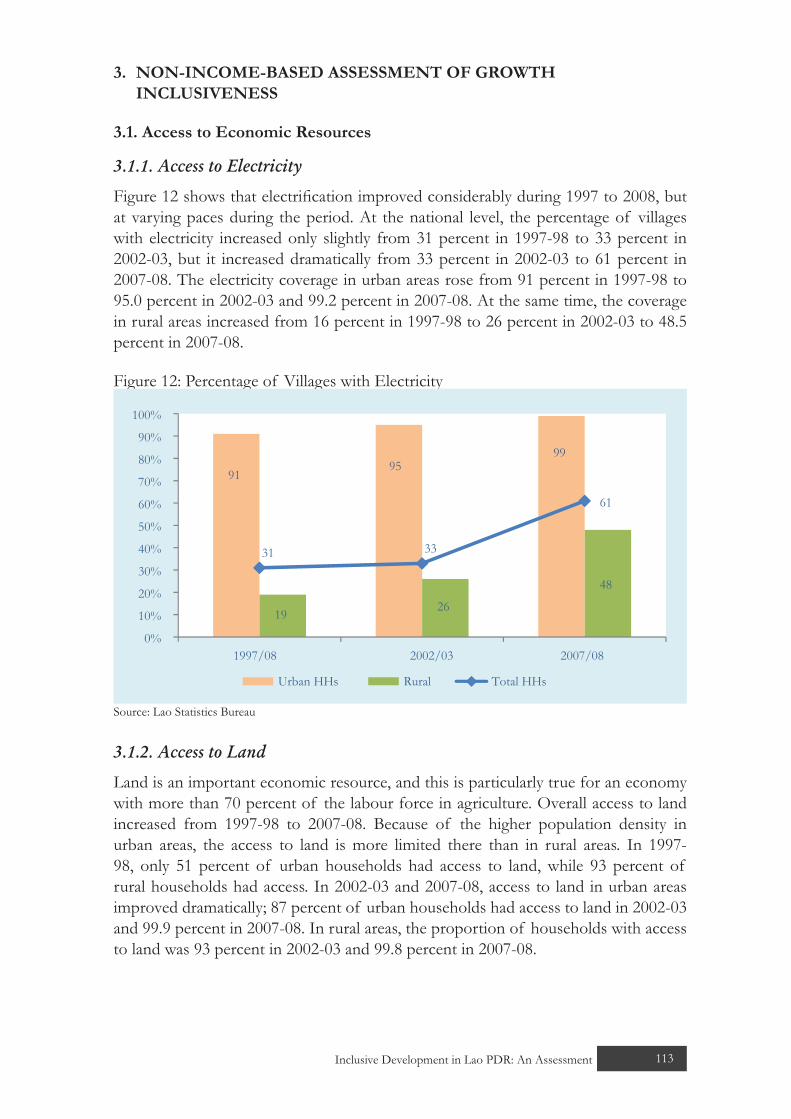
113Inclusive Development in Lao PDR: An Assessment 113
3. NON-INCOME-BASED ASSESSMENT OF GROWTH INCLUSIVENESS
3.1. Access to Economic Resources
3.1.1. Access to Electricity
Figure 12 shows that electrification improved considerably during 1997 to 2008, but at varying paces during the period. At the national level, the percentage of villages with electricity increased only slightly from 31 percent in 1997-98 to 33 percent in 2002-03, but it increased dramatically from 33 percent in 2002-03 to 61 percent in 2007-08. The electricity coverage in urban areas rose from 91 percent in 1997-98 to 95.0 percent in 2002-03 and 99.2 percent in 2007-08. At the same time, the coverage in rural areas increased from 16 percent in 1997-98 to 26 percent in 2002-03 to 48.5 percent in 2007-08.
Figure 12: Percentage of Villages with Electricity
9195
99
19 26
48
31 33
61
0%
10%
20%
30%
40%
50%
60%
70%
80%
90%
100%
1997/08 2002/03 2007/08
Urban HHs Rural Total HHs
Source: Lao Statistics Bureau
3.1.2. Access to Land
Land is an important economic resource, and this is particularly true for an economy with more than 70 percent of the labour force in agriculture. Overall access to land increased from 1997-98 to 2007-08. Because of the higher population density in urban areas, the access to land is more limited there than in rural areas. In 1997-98, only 51 percent of urban households had access to land, while 93 percent of rural households had access. In 2002-03 and 2007-08, access to land in urban areas improved dramatically; 87 percent of urban households had access to land in 2002-03 and 99.9 percent in 2007-08. In rural areas, the proportion of households with access to land was 93 percent in 2002-03 and 99.8 percent in 2007-08.

114 Inclusive Development in Lao PDR: An Assessment
Figure 13: Household Access to Land
51.0
87.0
99.9
93.093.0 99.8
86.092.0
99.8
0.0%
10.0%
20.0%
30.0%
40.0%
50.0%
60.0%
70.0%
80.0%
90.0%
100.0%
1997/1998 2002/03 2007/08
Urban Rural Lao PDR
Source: Lao Statistics Bureau
3.1.3. Access to Roads
Access to main roads improved from 2002-03 to 2007-08; the percentage of roads reachable by urban and rural areas increased in both dry and rainy seasons (Table 8). About 71 percent of households could access roads during the dry season in 2002-03, and in 2007-08 the proportion increased to 99.8 percent. The proportion of households with rainy season access to roads also increased, from 54 percent in 2002-03 to 84.2 percent in 2007-08.
Table 8: Access to Main Road 2002-03 2007-08
Average distance to
nearest road
Reachable in dry season
Reachable in rainy season
Average distance to
nearest road
Reachable in dry season
Reachable in rainy season
km % % km % %Lao PDR 5.0 71.0 54.0 17.3 99.8 84.2Urban 0.0 100.0 97.0 0.0 100.0 98.4Rural with road 2.0 84.0 65.0 5.0 100.0 79.6Rural without road 12.0 35.0 17.0 18.0 83.3 16.7Source: Lao Statistics Bureau
3.1.4. Asset Ownership
Asset ownership is an important indicator that can supplement other indicators of access to economic resources. As shown in Figures 14, 15 and 16, there is ample evidence of asset accumulation. Even poor households managed to invest in assets such as TVs, motorbikes and mobile phones. For villages without road access, more households also own assets although the increase lags behind other areas. This suggests that livelihoods have improved in recent years.

115Inclusive Development in Lao PDR: An Assessment 115
Figure 14: Asset Ownership, All Households, 2002-03 & 2007-08
0% 20% 40% 60% 80% 100%
Radio
TV
Bicycle
Motorbike
Mobile Phone
Steam Cooker
Electric Cooker
Refrigerator
Tractor2002-03
2007-08
Source: Lao Statistics Bureau
Figure 15: Asset Ownership, Poor Households, 2002-03 & 2007-08
0% 20% 40% 60% 80% 100%
Radio
TV
Bicycle
Motorbike
Mobile Phone
Steam Cooker
Electric Cooker
Refrigerator
Tractor 2002-03
2007-08
Source: Lao Statistics Bureau

116 Inclusive Development in Lao PDR: An Assessment
Figure 16: Asset Ownership, Villages without Road Access, 2002-03 & 2007-08
0% 20% 40% 60% 80% 100%
Radio
TV
Bicycle
Motorbike
Mobile Phone
Steam Cooker
Electric Cooker
Refrigerator
Tractor 2002-03
2007-08
Source: Lao Statistics Bureau
3.1.5. Conclusion on Access to Economic Resources
The indicators suggest that there has been improvement in access to economic resources in both urban and rural areas. However, there is still room for improvement, particularly in rural areas.
3.2. Enhancing Human Capabilities
Enhancing human capabilities is the key to inclusive growth; indicators in this area reflect whether people possess the capabilities necessary to be productively employed and to take advantage of economic opportunities. This area includes access to education, health and nutrition.
3.2.1. Education
Laos has made remarkable progress in boosting school enrolments for both male and female students. The net primary school enrolment rate has continuously increased, from 83.9 percent in 2005-06 to 95.2 percent in 2011-12. The gap between primary school enrolment rates of boys and girls has also narrowed (Figure 17).
The lower secondary school enrolment rate has also increased, but at a much slower pace than in primary schools. The lower secondary rate was 51.7 percent in 2005-06, increasing to 64.7 percent in 2011-12. The gap between boys’ and girls’ enrolment rates also narrowed (Figure 18).

117Inclusive Development in Lao PDR: An Assessment 117
Figure 17: Net Primary Enrolment (%)
70
75
80
85
90
95
100
Total Female Male
2004
-05
2005
-06
2006
-07
2007
-08
2008
-09
2009
-10
2010
-11
Source: Ministry of Education
Figure 18: Lower Secondary School Enrolment Rate
0
10
20
30
40
50
60
70
80
Total Female Male
2005
-06
2006
-07
2007
-08
2008
-09
2009
-10
2010
-11
2011
-12
Source: Ministry of Education
3.2.2. Health
Progress in improving basic health care has been noteworthy. Child and infant mortality rates have declined by more than half over the last two decades (Figure 19). However, vaccination is a mixed picture (Figure 20). In 1990, the under-five mortality rate was 145 per 1000 live births; in 1999 it fell to 93 and in 2010 to 54. The infant mortality rate has also made good progress.
Immunisation plays a key role in reducing child mortality; therefore, this indicator can supplement the mortality rate in providing a picture of health sector performance. Figure 20 shows that the coverage of infant vaccination has made mixed progress in the last decade. The percentages of children who have received DPT, measles, polio and tuberculosis vaccines declined from 2000 to 2006 but increased between 2006 and

118 Inclusive Development in Lao PDR: An Assessment
2012. In 2000 the proportion of children who received DPT vaccine was 52.8 percent; it then dropped to 31.8 percent in 2006 but increased to 51.5 percent in 2012. Similarly, the percentage of children who received measles vaccine was 41.8 percent in 2000, dropped to 33 percent in 2006 and increased to 55.3 percent in 2012. In 2000, 57.1 percent of children had received polio vaccine; in 2006 the percentage went down to 32.2 percent but in 2012 increased to 55.3 percent. The percentages of children who had received tuberculosis vaccine were 69.3 in 2000, 61 in 2006 and 77.1 in 2012.
Figure 19: Under-Five and Infant Mortality Rates
0
20
40
60
80
100
120
Infant Mortality Rate (per 1,000 live birth Under-five Mortality Rate (per 1,000 live birth)
1995
1996
1997
1998
1999
2000
2001
2002
2003
2004
2005
2006
2007
2008
2009
2010
2011
Source: World Development Indicators, World Bank
Figure 20: DPT and Measles Immunisation among Children Aged 12-23 Months (%)
52.8
41.8
57.1
69.3
31.8 33 32.2
61
51.555.3
49.1
77.1
0
10
20
30
40
50
60
70
80
90
DPT Measles Polio Tuberculosis
2000 2006 2012
Source: Lao Statistics Bureau

119Inclusive Development in Lao PDR: An Assessment 119
3.2.3. Nutrition
Progress in reducing malnutrition and under-nutrition has been mixed. Underweight children among the under-fives declined from 37.1 percent in 2006 to 26.6 percent in 2012; however, the rate is still high. There was no improvement in the prevalence of stunting among under-five children; instead of going down, the rate increased from 40.4 percent in 2006 to 44.2 percent in 2012. The prevalence of wasting declined moderately, from 6.5 percent in 2006 to 5.9 percent in 2012 (Figure 21).
Figure 21: Under-Nutrition and Malnutrition among Children under Five (%)
37.1
40.4
6.5
26.6
44.2
5.90
5
10
15
20
25
30
35
40
45
50
Prevalence of Underweight
Prevalence of Stunting
2006 2012
Prevalence of Wasting
Source: Lao Statistics Bureau
3.2.4. Sanitation
Over the last 15 years, the population with access to improved sanitation facilities and improved water sources has increased significantly.
In 1995 the proportion of the population with access to improved sanitation facilities was less than 20 percent, and there was a huge gap between rural and urban areas. Access increased very slowly from 1995 to 1998 but became much faster from 1999 onward; by 2010 the population with access to improved sanitation facilities was slightly more than 60 percent. Despite this rapid increase, the gap between urban and rural areas remains large; in 2010, 89 percent of the urban population had access to improved sanitation facilities, but only 50 percent of the rural population.
The population with access to improved water sources increased from less than 40 percent in 1995 to 67 percent in 2010. Over the past 15 years there was no improvement in urban area, while the proportion of rural people with access to improved water increased from 32 percent in 1995 to 62 percent in 2010 (Figure 23).
Interestingly, the continuing decrease in child mortality suggests that the mixed progress in immunisation coverage of children has not interrupted this progress. This may imply that there have been improvements in other health areas.
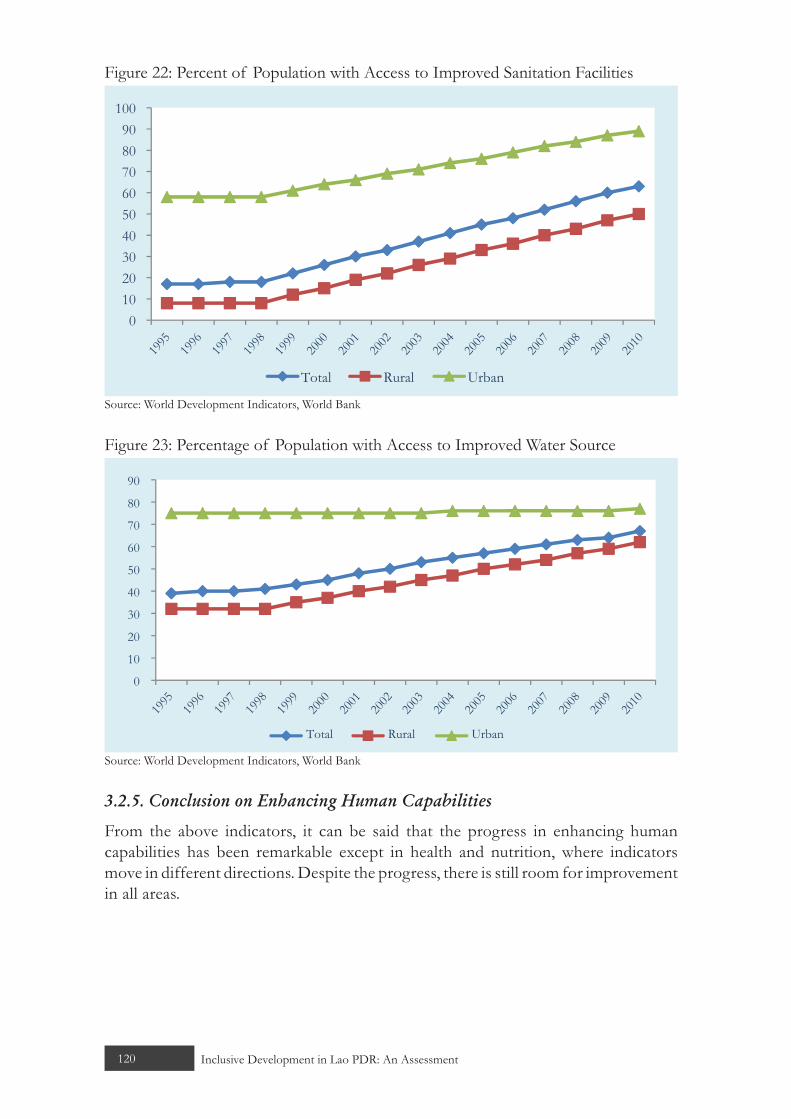
120 Inclusive Development in Lao PDR: An Assessment
Figure 22: Percent of Population with Access to Improved Sanitation Facilities
0102030405060708090
100
Total Rural Urban
1995
1996
1997
1998
1999
2000
2001
2002
2003
2004
2005
2006
2007
2008
2009
2010
Source: World Development Indicators, World Bank
Figure 23: Percentage of Population with Access to Improved Water Source
0
10
20
30
40
50
60
70
80
90
Total
1995
1996
1997
1998
1999
2000
2001
2002
2003
2004
2005
2006
2007
2008
2009
2010
Rural Urban
Source: World Development Indicators, World Bank
3.2.5. Conclusion on Enhancing Human Capabilities
From the above indicators, it can be said that the progress in enhancing human capabilities has been remarkable except in health and nutrition, where indicators move in different directions. Despite the progress, there is still room for improvement in all areas.

121Inclusive Development in Lao PDR: An Assessment 121
3.3. Gender Equality
3.3.1. Access to Education
In 1995, the adult literacy rate was 60.25 percent. The rate increased over 10 years, reaching 69.58 percent in 2000 and 72.7 percent in 2005. However, the literacy rate of female adults is still much lower. This indicates that women have been given opportunities, but there is more to be done for females to catch up.
Figure 24: Adult Literacy Rate (%)
60.2569.58 72.70
0102030405060708090
1995 2000 2005
Adult Literacy Rate, (Female) Adult Literacy Rate, (Male)
Adult Literacy Rate, (Total)
Source: UNESCO
Figure 25 suggests that between 2005-06 and 2011-12, more education opportunities were provided for young females. The ratio of female students to male students in secondary education increased from 75.9 percent to 84.3 percent.
Figure 25: Ratio of Female Students to Male Students in Secondary Education
75.90
2005
/06
2006
/07
2007
/08
2008
/09
2009
/10
2010
/11
2011
/12
76.7778.22
79.4580.78
82.49
84.29
70.00%
72.00%
74.00%
76.00%
78.00%
80.00%
82.00%
84.00%
86.00%
Source: Ministry of Education

122 Inclusive Development in Lao PDR: An Assessment
3.3.2. Access to Productive Employment
The share of women in non-agricultural employment suggests that there is gender equality in access to productive employment. In 2012, women accounted for 46 percent of non-agriculture employment.
Figure 26: Share of Women in Non-Agriculture Employment in 2012
Male54%
Female46%
Source: Lao Statistics Bureau
3.3.3. Conclusion on Gender Equality
Gender equality in access to education and productive employment has improved over time; in recent years, women have had an almost equal share with men in both education and productive employment.
3.4. Social Safety Nets
In 2004 the Asian Development Bank carried out a pilot study to develop a methodology for assessing and comparing social protection efforts between countries. The study included Bangladesh, Indonesia, Mongolia, Nepal, Pakistan and Vietnam and was completed in 2005. The Social Protection Index (SPI) was its key component. Encouraged by the results of the pilot study, the ADB carried out follow-up studies in another 25 Asian and Pacific countries to enable the calculation of SPIs and the creation of a database of social protection programmes throughout the region. The 2005-08 studies derived the SPI from four components: 1. total expenditure on all social protection programmes, 2. beneficiaries of social protection programmes in target groups, 3. number of poor social protection beneficiaries and 4. average social protection expenditure for each poor person. SPIs and their components from 31 Asian and Pacific countries have been put together in a book (ADB 2008); Laos is

123Inclusive Development in Lao PDR: An Assessment 123
ranked 23rd in the consolidated list. Its performance on each component is below the Asian average, as follows:6
The Lao PDR’s expenditure on social protection was only 1.3 percent of GDP, putting it among the lowest social protection spenders. The biggest portion of total social protection expenditure is on microfinance programmes (35 percent), followed by social insurance (31 percent), social assistance (15 percent), labour market programmes (10 percent) and child protection (9 percent). Only 21 percent of the population is covered by social protection programmes, lower than the Asian average (35 percent). The microcredit scheme for the poor had the highest coverage, 57 percent, while health care coverage and care for the elderly were extremely low, 3 percent and 7 percent, respectively (Figure 27).
Figure 27: Coverage of Social Protection Programmes, by Target Group
0%
10%
20%
30%
40%
50%
60%
Unem/U
der e
mployed
Elderly
Health
CarePoo
r-Soc
ial Assi
stanc
eThe
Poor-M
icroc
redit
Disable
d
Childre
n
Source: ADB 2008
The proportion of poor receiving social protection in Laos is also lower than the Asian average—only 40 percent compared with 57 percent. However, a higher coverage ratio of poor beneficiaries compared with overall coverage implies that a large portion of social protection programming has reached the poor. This indicator shows the extent to which social protection programmes reach the poor but does not tell the magnitude of the assistance. To evaluate the magnitude, the average social protection expenditure for each poor person can be used. This is defined as the per capita social protection expenditure going to the poor as a percentage of the national poverty line. The average social protection expenditure for each poor beneficiary in Laos is 7 percent of the poverty line, much lower than the Asian average of 23 percent.
By plotting each of the four dimensions, Figure 28 illustrates that social protection in Laos is still very underdeveloped; the score in each dimension is much lower than the highest possible score.
6 Data used in the study are 2004/05 data.
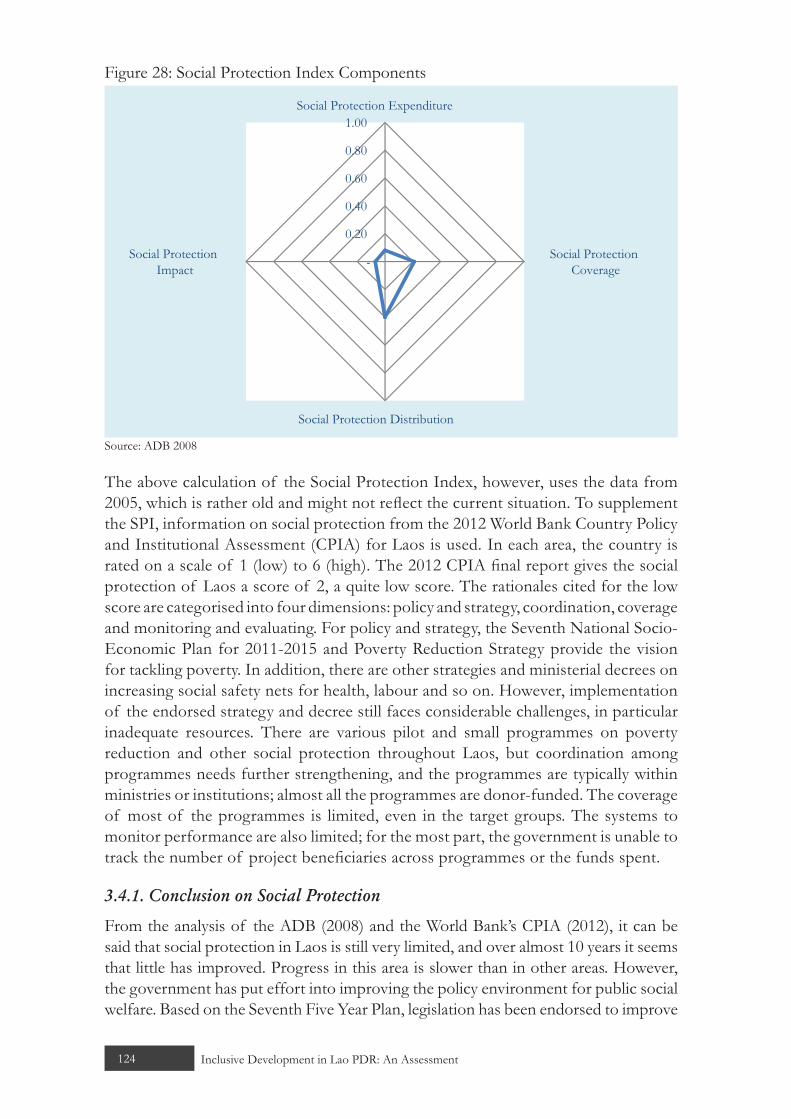
124 Inclusive Development in Lao PDR: An Assessment
Figure 28: Social Protection Index Components
-
0.20
0.40
0.60
0.80
1.00 Social Protection Expenditure
Social Protection Coverage
Social Protection Distribution
Social Protection Impact
Source: ADB 2008
The above calculation of the Social Protection Index, however, uses the data from 2005, which is rather old and might not reflect the current situation. To supplement the SPI, information on social protection from the 2012 World Bank Country Policy and Institutional Assessment (CPIA) for Laos is used. In each area, the country is rated on a scale of 1 (low) to 6 (high). The 2012 CPIA final report gives the social protection of Laos a score of 2, a quite low score. The rationales cited for the low score are categorised into four dimensions: policy and strategy, coordination, coverage and monitoring and evaluating. For policy and strategy, the Seventh National Socio-Economic Plan for 2011-2015 and Poverty Reduction Strategy provide the vision for tackling poverty. In addition, there are other strategies and ministerial decrees on increasing social safety nets for health, labour and so on. However, implementation of the endorsed strategy and decree still faces considerable challenges, in particular inadequate resources. There are various pilot and small programmes on poverty reduction and other social protection throughout Laos, but coordination among programmes needs further strengthening, and the programmes are typically within ministries or institutions; almost all the programmes are donor-funded. The coverage of most of the programmes is limited, even in the target groups. The systems to monitor performance are also limited; for the most part, the government is unable to track the number of project beneficiaries across programmes or the funds spent.
3.4.1. Conclusion on Social Protection
From the analysis of the ADB (2008) and the World Bank’s CPIA (2012), it can be said that social protection in Laos is still very limited, and over almost 10 years it seems that little has improved. Progress in this area is slower than in other areas. However, the government has put effort into improving the policy environment for public social welfare. Based on the Seventh Five Year Plan, legislation has been endorsed to improve

125Inclusive Development in Lao PDR: An Assessment 125
public social welfare. This includes Decree No. 70/PM, as an elaboration of Decree No. 178/PM on Public Social Welfare, and integrated decrees 71/PM, 194/PM and 145/PM into Decree 343/PM.
4. INCLUSIVENESS COMPOSITE INDEX
To assess the inclusiveness of growth in Laos, the composite inclusive growth index proposed by Mckinley (2010) is adopted. Mckinley identifies indicators in four areas: (1) growth, productive employment and economic infrastructure; (2) income poverty and equity, including gender equity; (3) human capabilities; and (4) social protection. The index uses these indicators to suggest a diagnostic approach, based on weights and scores, that can help countries assess their progress towards inclusive growth.
The calculation of the index for Laos here tries to reflect the current state of inclusiveness; thus, the data used in judging the score in each area is the most recent available. However, the most recent data in each area are from different years. In addition, in scoring each area, both the trend and level of the indicator are taken into account. The scores are, to a great extent, subject to the judgment of the research team after consultation with stakeholders.7 It was agreed that calculation of the index was a very useful exercise and needs to be further developed; disaggregation may be needed in the Lao context. The National Economic Research Institute will lead and take the initiative in collaboration with Lao Statistics Bureau after the completion of the LECS 5. The inclusive growth index will then be updated for 2012. Therefore, some caution needs to be used when interpreting the index.
4.1. Growth, Employment Generation and Economic Infrastructure
As analysed above, the overall GDP and per capita GDP growth rate have been robust during two decades, with only a slight interruption during the Asian financial crisis. In addition, growth has been driven by a high value-added sector in recent years as the share of industry in GDP increases. Therefore, Laos is given a score of 8 for this component.
Although the proportion of workers in the high value-added sector has increased, the increase is very marginal and the proportion is still less than 10 percent. In addition, 88 percent of the labour force are own-account or unpaid family workers, whose incomes are vulnerable. Therefore, on generating productive employment, Laos receives a score of 3, signalling the need for priority to be given to this area.
As Laos is still in an early stage of development, the government has made efforts to upgrade economic infrastructure and extend it to rural areas. There has been a dramatic improvement in access to electricity and roads in both urban and rural areas. However, there is still room to do better. To supplement the other indicators, access to land and asset ownership are used to provide a better picture of progress in livelihoods. These two indicators also suggest an improvement. Laos is given a score of 5 for this area.
7 The Lao research team organised a consultation workshop on calculation of the composite inclusive growth index on 5 March 2013 with representatives from relevant ministries and from international organisation in the Lao PDR.

126 Inclusive Development in Lao PDR: An Assessment
4.2. Poverty and Inequality
The progress in reducing poverty has been impressive. The poverty incidence, based on both the national and international poverty line, has declined substantially. The poverty gap and poverty severity have also decreased. However, the performance has not been even. Therefore a score of 7 is given to this area.
As income increases, inequality often seems to increase as well. This is also true for Laos. Inequality increased from 1992-93 to 1997-98, decreased during 1997-98 to 2002-03 and increased again from 2002-03 to 2007-08. However, compared with countries at the same or lower level of income and some countries in the region, the inequality in Laos is only moderate. Therefore, it is given a score of 5.
Gender equality in access to both education and productive employment has been improved. In both areas the share of women is high and not far from of the share of males. However, there is still room for improvement, particularly in education. Therefore, this receives a score of 6.
4.3. Human Capabilities
Health care has made considerable progress, as shown by the continuous decrease in the child mortality rate. However, nutrition has had mixed progress as the prevalence of under-nutrition is still high. Coverage of immunisation is still low. For health and nutrition, Laos is given a score of 5.
Access to education has significantly improved. Thanks to free and compulsory primary education, net primary enrolment reached 95 percent in 2012. However, in lower secondary school, it drops to only 65 percent. Therefore, Laos receives a score of 6.
Laos has also made considerable progress in access to improved sanitation facilities and improved water sources. However, access is still low in rural areas and the progress in urban areas is slow. Thus, it receives a score of 6.
4.4. Social Protection
Social protection is another area that needs improvement. The ADB (2008) suggests that in government spending on social protection, its coverage and its impact, Laos has made little progress and is well below the Asian average. The World Bank’s Country Policy and Institutional Assessment 2012 reached a similar conclusion. Therefore, Laos is given a score of 3 in this area.
The composite inclusive growth index is calculated based on the above indicators and their given weights. The calculation yields a value of 5.6, which places Laos in the middle of the satisfactory range (Table 9).

127Inclusive Development in Lao PDR: An Assessment 127
Table 9: Composite Inclusive Growth Index and Its ComponentsIndicators Weight Score Weighted
ScoreI Success in achieving growth, employment
generation and access to economic infrastructure
50 percent 5.9 2.95
Economic growth 25 percent 8.00 2.00Productive employment 15 percent 3.00 0.45Access to economic infrastructure 10 percent 5.00 0.50
II Success in reducing extreme poverty, moderate poverty and inequality
25 percent 6 1.50
Poverty measures 10 percent 7.00 0.70Inequality measure 10 percent 5.00 0.50Incorporating gender equity into inclusive growth
5 percent 6.00 0.30
III Success in enhancing human capabilities 15 percent 5.6667 0.85Health and nutrition 5 percent 5.00 0.25Education 5 percent 6.00 0.30Sanitation 5 percent 6.00 0.30
IV Social protection 10 percent 3 0.3Inclusive Growth Composite Index 5.60
Source: Authors’ calculation Performance score: Unsatisfactory (1-3), Satisfactory (4-7), Superior Progress (8-10)
5. CHALLENGES
The income and non-income indicators suggest that the overall livelihood of people has improved over time. The improvement is, to a large extent, due to income increase from rapid economic growth over the last two decades. Growth has also translated into poverty reduction across the region. Despite these promising trends, inequality increased in the early to mid-2000s. This implies that growth, especially in the last period, has been less inclusive. This section of the paper discusses some challenges in attaining inclusive growth.
Reliance on natural resources: Economic growth since 2005 has been driven by expansion of the natural resources sector, especially mining. This resources boom period coincided with a period of increasing inequality and a higher increase in consumption (income) of the richest percentiles. This suggests that natural resource-based growth might bring some problems of redistribution. To a certain extent, this is related to the characteristics of the mining and hydroelectric sectors, which are capital intensive and demand only highly skilled labour. The output-employment elasticity is 0.29 for mining8 and 0.38 for electricity, gas and water (MPI & UNDP 2009). Recent growth
8 This suggests that a 1 percent increase in output of the mining sector generates only an 0.29 percent increase in employment. The elasticity is 0.4 for the whole economy, 0.94 for the service sector and 1.32 for hotels and restaurants.

128 Inclusive Development in Lao PDR: An Assessment
has therefore provided limited employment benefits. In addition, there is concern that natural resource-based economies often experience an increase in inequality9 (Xiaobo & Shenggen 2000). For growth to be inclusive, sectors that could generate more employment and improve the income of the poorest should grow faster.
Public investment: Government investment can affect inequality and inclusiveness. Public investment often has specific objectives, for instance improving infrastructure in a priority area. This preference in an investment programme by itself can affect inequality. In addition, investment in different sectors could have different impacts on growth and inequality. For instance, an empirical analysis finds that government public investment in China has benefited the coastal area more than the inland and government therefore has to change its investment strategy to address the increasing regional inequality (Xiaobo & Shenggen 2000).10 The direction of public investment in Laos has relied on overall development objectives and priorities of the government, which, to the knowledge of the authors, have not been the result of empirical experiment on the causality and impacts of such development on different stakeholders. Therefore, it is highly likely that recent public investment has not addressed inequality and inclusiveness. For growth to be more inclusive, the investment programme should be carefully and formally studied and linked with inclusiveness improvement objectives.
Education and vocational training: Recent development suggests that the economy has been in transformation from agriculture to a more services and industrial base. For a large share of the population, who mainly rely on agriculture, to benefit from this transformation, their skills have to be properly prepared. Education and vocational school development and future directions of economic diversification have to be better aligned.
Poverty reduction programme: Despite a specific development programme for priority areas, poverty remains higher in these areas, and poverty reduction has been slower. This suggests that the existing poverty reduction programme has not been very effective in priority areas.
Social protection: Laos is still in a very early stage of the development of a social protection system. Government spending in this area is still very low, and most social protection programmes are carried out by donors.
9 The concentration of the mineral sector together with low quality investment and a low level of education contributes to the relationship between resource boom and inequality in Africa (Deaton 1999).The least developed countries, which often have weaker social infrastructure and dysfunctional economic policy, often experience the impact of a resource boom as increasing rent seeking and inequality (Lane & Tornell1995). However, Goderis and Malone (2011), using a panel econometric analysis of 90 countries finds that a resource boom actually lowers income inequality in the year of the boom, then the effect gradually diminishes until inequality returns to the level before the boom.
10 Additional investment in education and irrigation in the western region will help reduce regional inequality. Additional investment in the coastal region, however, will widen inequality.
129Inclusive Development in Lao PDR: An Assessment 129
6. CONCLUSION
Laos generally performed well in generating rapid economic growth and improving livelihoods. However, in terms of overall inclusiveness of growth, its composite inclusive growth index is only 5.6, the middle of the satisfactory range, as there are mixed performances in both income and non-income aspects of growth inclusiveness. Overall economic growth and per capita growth have been robust, an average of 6.86 percent for GDP growth and 4.76 percent for per capita growth over the last two decades.
Poverty has been substantially eradicated over time, but there are large variations in poverty reduction progress across urban and rural areas, regions, border areas and land elevation. After falling during the aftermath of the Asian financial crisis, inequality has increased in recent years. The level of inequality is, however, moderate compared with other countries with the same or lower levels of income, and countries in the region.
The worst dimension of inclusive growth is the generation of productive employment. There has been little progress in this area, and a majority of workers are still in a low value-added sector, and more than 80 percent are own-account and unpaid family workers. In non-income aspects, Laos has done well in enhancing human capabilities and increasing access to economic infrastructure and resources, but little progress has been observed in social protection.
Based on the assessment of the current stage of growth inclusiveness, this study identifies the following needs for further research in order to understand better the scale and dynamic of growth inclusiveness in Laos:
case studies on the effectiveness of the poverty reduction programmes;• assessment of the determinants of inequality in rural areas;• assessment of the impact of the natural resources sector on local communities; • study of factors that affect access to economic resources; • study of factors that can improve economic activities in rural areas; • study of social protection in the Lao PDR and factors that affect its performance.•
The findings of this paper, based on currently available data, have provided a broad picture of the current situation of growth inclusiveness in Laos. Because of the nature of this research, which is part of a broader assessment exercise, the absence of much required data and information and the subjectivity of assessments, the findings from this research, including in particular the growth inclusiveness index should be interpreted and used with caution. The findings from this phase, however, will be used as a road map for further investigation in the next phase of our collaborative network (DAN). Phase 2 of this collaborated research project will address national policy and institutional changes, if any, to achieve greater growth inclusiveness in Laos and the Greater Mekong Subregion. The role and the contributions of subregional or regional cooperation will also be identified.

130 Inclusive Development in Lao PDR: An Assessment
REFERENCES
Asian Development Bank (2008), Social Protection Index for Committed Poverty Reduction, Vol. 2. (Manila: ADB)
Deaton, Angus (1999), “Commodity Prices and Growth in Africa”, Journal of Economic Perspectives, 13, pp. 23-40.
Engvall, Anders, Magnus Lindelow, Nina Fenton & Phonesaly Souksavath (2010), Poverty in Laos—2008 (Vientiane: Ministry of Planning and Investment)
Goderis, Benedikt & Samuel W. Malone (2011), Natural Resource Booms and Inequality: Theory and Evidence. Scandinavian Journal of Economics, Vol. 133, Issue 2, pp. 388-417
GOL (2011), Seventh Five Year Socio-Economic Development Plan for Lao PDR for 2011-2015 (Vientiane: Ministry of Planning and Investment)
Lane, Philip R., & Aaron Tornell (1995), “Power Concentration and Growth”, Harvard Institute of Economic Research Discussion Paper 1720, May.
McKinley, Terry (2010), Inclusive Growth Criteria and Indicators: An Inclusive Growth Index for Diagnosis of Country Progress, ADB Sustainable Development Working Paper No.14. (Manila: ADB)
Ministry of Planning and Investment of Lao PDR & United Nation Development Program (2009), “Employment and Livelihood Lao PDR 2009, 4th Human Development Report” (Vientiane)
United Nations (1987), “Report of the World Commission on Environment and Development”, General Assembly Resolution 42/187, 11 December 1987, Retrieved: 2007-04-12 http://www.un.org/documents/ga/res/42/ares42-187.htm
World Bank (2012), “Lao PDR Country Policy and Institutional Assessment Report”, (Vientiane)
World Bank (2009), “What is inclusive growth?”, Retrieved: 2013-1-1. http://s i te resources.wor ldbank .org/INTDEBTDEPT/Resources/468980-1218567884549/WhatIsInclusiveGrowth20081230.pdf
Zhang Xiaobo & Fan Shenggen (2000), “Public investment and regional inequality in rural China”, EPTD Discussion Paper 71 (Washington, DC: International Food Policy Research Institute)

Chapter 4Inclusive Development
in Thailand: An Assessmentby Srawooth Paitoonpong, Jirawat Panpiemras,
Ploycarat Nana and Janjira Sodasith

132 Inclusive Development in Thailand: An Assessment
1. INTRODUCTION
Developing countries, including those in Asia, experienced rapid economic growth that led to a dramatic reduction in the level of extreme poverty during the 2000s. At the same time, rising inequalities persisted. This shifted the focus from traditional development strategies to inclusive growth paradigm in the late 2000s. Previous development strategies have focused on creating rapid growth to “trickle down” to the poor in the hope that the wages of the poor would gradually catch up with the rest of the population. However, this effect might not always manifest, and inequality continues to persist. There is evidence that on many occasions the poorest have benefited from economic growth much less than other income groups. In contrast, inclusive growth emphasizes creating economic opportunities and ensuring that opportunities are accessible to all.
Although the term “inclusive growth” is widely used in the literature, there are various definitions. According to the Asian Development Bank, inclusive growth is the condition of high rates of sustainable growth and creation of broader access to economic opportunities. Therefore, inclusive growth is not only about creating and enlarging economic opportunities, but also making those opportunities equitably available to all members of society to participate in and benefit from growth (Asian Development Bank 2012). This is the concept used in this paper. The definition offered by the World Bank is slightly weaker: growth is inclusive as long as poor people ultimately benefit from it to a certain extent. By this definition, whether the poor benefit relatively more or less than the rest of the population as a whole is irrelevant (Ianchovichina et al., 2008).
In this paper, we aim to assess the current state of inclusive growth in Thailand in order to build knowledge and understanding of the issue as well as to inform public policy. Specifically, we attempt to identify the key variables to measure the state of inclusiveness of growth in Thailand and the main obstacles to overcome. Analyzing the state of inclusive growth, we focus on three main dimensions: income (economic growth, poverty and income inequality), non-income aspects (access to economic opportunities, social safety nets and governance) and both income and non-income index variables.
The structure of the paper is as follows. In Section 2, we examine the income dimension. Section 3 examines the non-income dimension. Section 4 analyzes the index variables. Section 5 describes the current stage of inclusive growth and points out important concerns.
2. INCOME DIMENSION
2.1. Economic Growth
Figure 1 depicts year-on-year real GDP growth rates from 1994 to 2011. Although Thailand suffered from economic crises, the average growth rate was 1.56 percent, which suggests satisfactory progress. The Asian financial crisis in 1997 caused growth to drop to almost -13.9 percent (Q2 and Q3, 1998). The economy recovered in 1999 with growth

133Inclusive Development in Thailand: An Assessment 133
fluctuations between 2 and 8 percent from 1999 to 2008. The economy was hit again by the subprime mortgage crisis towards the end of 2008 and 2009, causing the real GDP growth rate to drop from 5.2 percent in the second quarter of 2008 to -2.8 percent in the subsequent five quarters before recovering to 5.9 percent in the fourth quarter of 2009. The devastating flood in some parts of the country in 2011 caused growth to plunge to -9 percent in Q4.
Figure 2 demonstrates the transformation of Thailand from an agricultural-driven economy to a service and industrial-based one, which yields higher value added. In 2010, the service sector contributed 49 percent of Thailand’s GDP. Since 1952, the service sector has contributed the most to GDP, overtaking agriculture, the long-time largest sector. Manufacturing overtook agriculture in 1977 with a share of 27.3% of GDP, while agriculture contributed 24.8% of GDP. Since then manufacturing has rapidly taken off. Within just four decades, it has become a main driving force of economic growth, with a share of 40 percent of GDP in 2010. After decades of relative decline, agriculture’s share of GDP has started to increase slowly and eventually reached a level similar to that of the 1990s.
Figure 1: Year-on-Year Growth Rate of GDP (at 1988 prices) of Thailand, 1994-2011
Asian financial crisis
Agriculture
25
20
15
10
5
0
-5
-10
-15
Year/Quarter
Perc
ent
1994
/Q1
1994
/Q3
1995
/Q1
1995
/Q3
1996
/Q1
1996
/Q3
1997
/Q1
1997
/Q3
1998
/Q1
1998
/Q3
1999
/Q1
1999
/Q3
2000
/Q1
2000
/Q3
2001
/Q1
2001
/Q3
2002
/Q1
2002
/Q3
2003
/Q1
2003
/Q3
2004
/Q1
2004
/Q3
2005
/Q1
2005
/Q3
2006
/Q1
2006
/Q3
2007
/Q1
2007
/Q3
2008
/Q1
2008
/Q3
2009
/Q1
2009
/Q3
2010
/Q1
2010
/Q3
2011
/Q1
2011
/Q3
Non-Agriculture Gross Domestic Product
Subprime mortgage financial crisisFlood disaster
Source: Paitoonpong 2012
Figure 2: Percentage Shares of GDP, 1960-2010%
60.00
50.00
40.00
30.00
20.00
10.00
0.00
1951
1953
1955
1957
1959
1961
1963
1965
1967
1969
1971
1973
1975
1977
1979
1981
1983
1985
1951
1987
1989
1991
1993
1995
1997
1999
2001
2003
2005
2007
2009
agriculture manufacture service
Source: World Development Indicators 2013

134 Inclusive Development in Thailand: An Assessment
Figure 3: GDP per Capita Growth
15
10
5
0
-5
-10
-15
%
1961
1963
1965
1967
1969
1971
1973
1975
1977
1979
1981
1983
1985
1951
1987
1989
1991
1993
1995
1997
1999
2001
2003
2005
2007
2009
Source: World Development Indicators 2013
Thailand has generally enjoyed positive GDP per capita growth rates over the years, as shown in Figure 3. A few exceptions are the negative rates between 1997 and 1998 due to the Asian financial crisis and in 2009 as a result of the domestic political unrest and the global subprime mortgage crisis. The Thai economy is quite resilient to external shocks. Thailand recovered quite quickly from the economic crisis in 2009; it took only about a year to turn the negative GDP per capita growth to a positive one.
2.2. Poverty
Figure 4 shows the poverty headcount ratios in Thailand based on poverty lines ($1.25/day (PPP) and $2/day (PPP)), as well as on the national poverty line, which corresponds to expenditure needed in order to acquire basic consumption.1 Overall, all three poverty headcount ratios have declined continuously over the years. For example, the ratio based on the national poverty line declined from 42.2 percent in 1988 to 7.8 percent in 2010. The period when Thailand had most success in poverty reduction was 1988-96. This period also had the most prominent economic growth rates, an average of approximately 15 percent real GDP growth per year. This supports the argument that high and sustainable growth is a pre-condition for reducing poverty.
A reduction in the ratio does not necessarily mean that poverty is less intense or less severe. The intensity of poverty can be measured by the poverty gap index, which is the mean of the gap between expenditure/income of the poor and the poverty line. Overall, Thailand has experienced a smaller poverty gap, which means the poor population have expenditure closer to the national poverty line, as shown in Figure 4. In 2010, the poverty gap for Thailand was 1.33, which is a significant decrease from 2000, when it was as high as 4.24. The changes in the poverty gap index together with the headcount ratio indicate that the proportion of the poor in the population decreased, and that the poor were also getting closer to the poverty line. However, a decline in this index may not necessarily reflect that the extremely poor are better off.
The squared poverty gap, also known as the poverty severity index, measures how poor the poor are, taking into account the inequality among the poor by putting
1 The national poverty line has been adjusted annually and has moved up continuously from THB633/month in 1998 to THB1678/month in 2010.
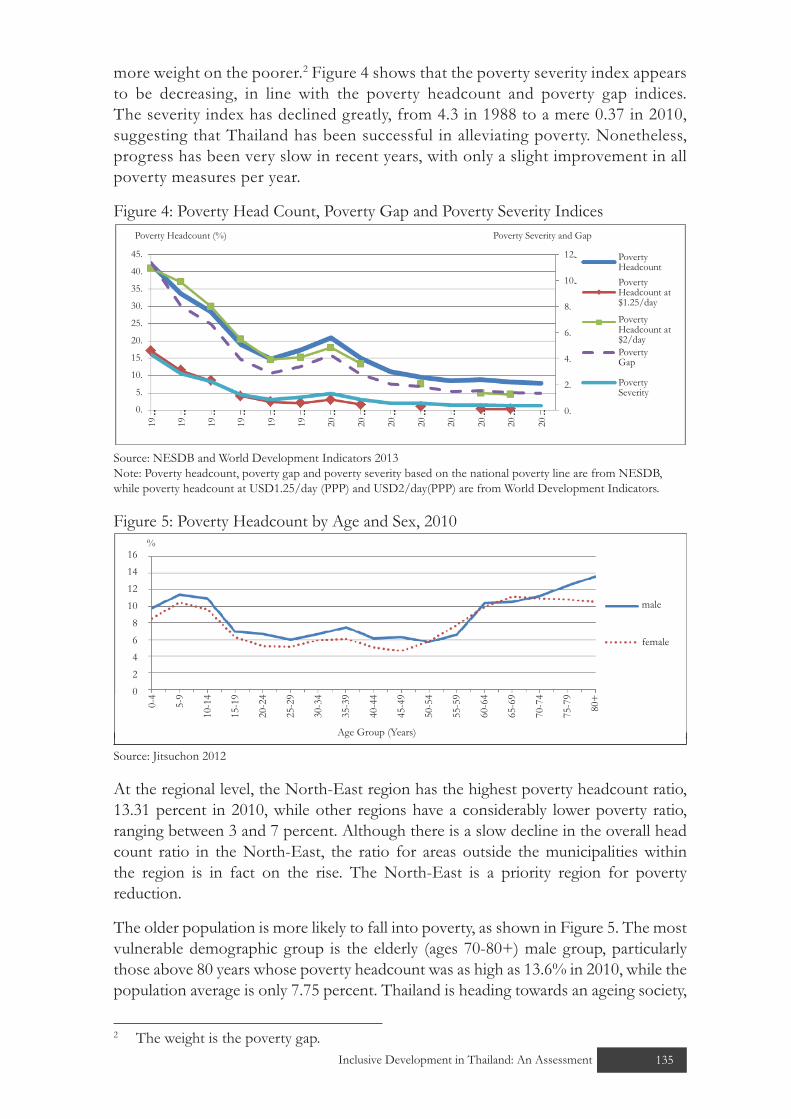
135Inclusive Development in Thailand: An Assessment 135
more weight on the poorer.2 Figure 4 shows that the poverty severity index appears to be decreasing, in line with the poverty headcount and poverty gap indices. The severity index has declined greatly, from 4.3 in 1988 to a mere 0.37 in 2010, suggesting that Thailand has been successful in alleviating poverty. Nonetheless, progress has been very slow in recent years, with only a slight improvement in all poverty measures per year.
Figure 4: Poverty Head Count, Poverty Gap and Poverty Severity Indices
45.
40.
35.
30.
25.
20.
15.
10.
5.
0.
12.
10.
8.
6.
4.
2.
0.
Poverty Headcount (%) Poverty Severity and Gap
Poverty HeadcountPoverty Headcount at $1.25/day
Poverty Headcount at $2/dayPoverty Gap
PovertySeverity
19 19 19 19 19 19 20 20 20 20 20 20 20 20
Source: NESDB and World Development Indicators 2013 Note: Poverty headcount, poverty gap and poverty severity based on the national poverty line are from NESDB, while poverty headcount at USD1.25/day (PPP) and USD2/day(PPP) are from World Development Indicators.
Figure 5: Poverty Headcount by Age and Sex, 2010
1614121086420
%
male
female
Age Group (Years)
0-4
5-9
10-1
4
15-1
9
20-2
4
25-2
9
30-3
4
35-3
9
40-4
4
45-4
9
50-5
4
55-5
9
60-6
4
65-6
9
70-7
4
75-7
9
80+
Source: Jitsuchon 2012
At the regional level, the North-East region has the highest poverty headcount ratio, 13.31 percent in 2010, while other regions have a considerably lower poverty ratio, ranging between 3 and 7 percent. Although there is a slow decline in the overall head count ratio in the North-East, the ratio for areas outside the municipalities within the region is in fact on the rise. The North-East is a priority region for poverty reduction.
The older population is more likely to fall into poverty, as shown in Figure 5. The most vulnerable demographic group is the elderly (ages 70-80+) male group, particularly those above 80 years whose poverty headcount was as high as 13.6% in 2010, while the population average is only 7.75 percent. Thailand is heading towards an ageing society,
2 The weight is the poverty gap.

136 Inclusive Development in Thailand: An Assessment
which implies that the state needs to pay closer attention to the future of the growing elderly poor population by ensuring that they are well protected by social protection programmes.
Table 1: Percentage of Poor People in Socio-Economic Subgroups (out of the total poor population)
2003 2005 2007 2009Agricultural landowners 31.62 30.98 29.87 34.05Agricultural land tenants (rent) 7.64 7.42 7.15 6.07Fishing, forestry and agricultural services workers 0.7 5.74 7.15 6.64Non-agriculture self-employed workers 5.17 8.09 9.34 6.49Professionals, academics and executives 1.14 1.3 0.79 0.74Agricultural workers 16.99 7.97 6.97 6.42General workers 1.78 1.18 1.52 0.68Clerks, employees, employees who trade in services
5.26 4.85 4.57 6.99
Operators in production processes 10.68 10.89 10.58 9.6Those with income support and not employed
(pension, welfare benefits, allowance)19.02 21.57 22.06 22.31
Total 100 100 100 100Source: NESDB 2013
Poverty by socio-economic subgroups is a useful indicator of the inclusiveness of growth. Agriculture is the sector with the least growth and lowest value added and is widely regarded as the sector with the largest poor population in the country. In fact, Table 1 shows that households described as “agricultural landowners” make up the biggest share of the total poor population, with 34 percent in 2009, a substantial increase from 29.9 percent in 2007 and much higher than other socio-economic subgroups, such as ‘clerks, employees and employees who trade in services’ (6.9% in 2009) and ‘operators in production process’ (9.6% in 2009).
2.3. Income Inequality
From the growth and poverty analysis above, there is no doubt that high and sustainable economic growth contributed to poverty alleviation in Thailand by reducing the incidence, intensity and severity of poverty. However, the stronger definition of inclusive growth focuses not only on providing opportunities for the poor but also on equal distribution of the benefits from growth. In this section, we present measures of inequality that will help us to better understand the current state of the inclusiveness of growth in Thailand.
Table 2 shows the most commonly used indicators of inequality, the Gini coefficient (calculated using both income and expenditure data) and Theil indices (all calculated using both income and expenditure data) from 1990 to 2010. The Gini has been decreasing since 1992. We cannot observe such a clear trend here, but over a longer time, one can see that inequality reached its peak in 1992 and has been on a decreasing trend since then (Figure 7). The Theil indices have a similar pattern. Moreover, it is

137Inclusive Development in Thailand: An Assessment 137
interesting that during periods of high economic growth, predominantly 1990-96 and 2000-04, both indices appear to be in decline, implying a more equitable redistribution of wealth. However, the relationship between the Gini index and poverty reduction is not monotonic. An improvement in the Gini index could simply be a result of a more equitable income distribution between the rich and the middle-income group.
Table 2: Inequality Measures
Gini (Exp)
Gini (Income)
Theil T (Exp)
Theil T (Income)
Theil L (Exp)
Theil L (income)
1990 0.44 0.52 0.39 0.55 0.32 0.461992 0.45 0.54 0.40 0.59 0.34 0.501994 0.44 0.52 0.38 0.55 0.32 0.471996 0.43 0.51 0.37 0.53 0.31 0.461998 0.41 0.51 0.31 0.51 0.27 0.442000 0.43 0.52 0.35 0.53 0.30 0.482002 0.42 0.51 0.34 0.51 0.29 0.452004 0.43 0.49 0.35 0.47 0.30 0.422006 0.42 0.51 0.33 0.55 0.29 0.472007 0.40 0.50 0.29 0.52 0.26 0.432008 0.40 - 0.30 - 0.26 -2009 0.40 0.49 0.30 0.49 0.26 0.402010 0.39 - 0.29 - 0.25 -
Source: Authors’ calculation using Socio-economic Survey (SES) data
Table 3: Theil Indices for Rural and Urban Income InequalityTheil L Theil T
Overall within
within urban
within rural Between Overall
withinwithin urban
within rural Between
1990 0.3591 0.1056 0.2535 0.0976 0.4425 0.2266 0.2159 0.10381992 0.3582 0.1064 0.2518 0.1410 0.4413 0.2471 0.1942 0.14891994 0.3689 0.1106 0.2583 0.1021 0.4431 0.2318 0.2113 0.10811996 0.3502 0.1059 0.2443 0.1058 0.4157 0.2203 0.1954 0.11181998 0.3528 0.1078 0.2451 0.0898 0.4105 0.2114 0.1991 0.09482000 0.3779 0.1167 0.2612 0.0985 0.4238 0.2240 0.1998 0.10372002 0.3568 0.1140 0.2427 0.0887 0.4180 0.2209 0.1971 0.09282004 0.3446 0.1102 0.2344 0.0726 0.3986 0.2026 0.1960 0.07602006 0.4039 0.1195 0.2844 0.0650 0.4769 0.2254 0.2515 0.06902007 0.3696 0.1098 0.2598 0.0629 0.4475 0.2108 0.2367 0.06672008 - - - - - - - -2009 0.3492 0.1084 0.2408 0.0569 0.4268 0.2033 0.2235 0.05992010 -
Source: Authors’ calculation using SES data
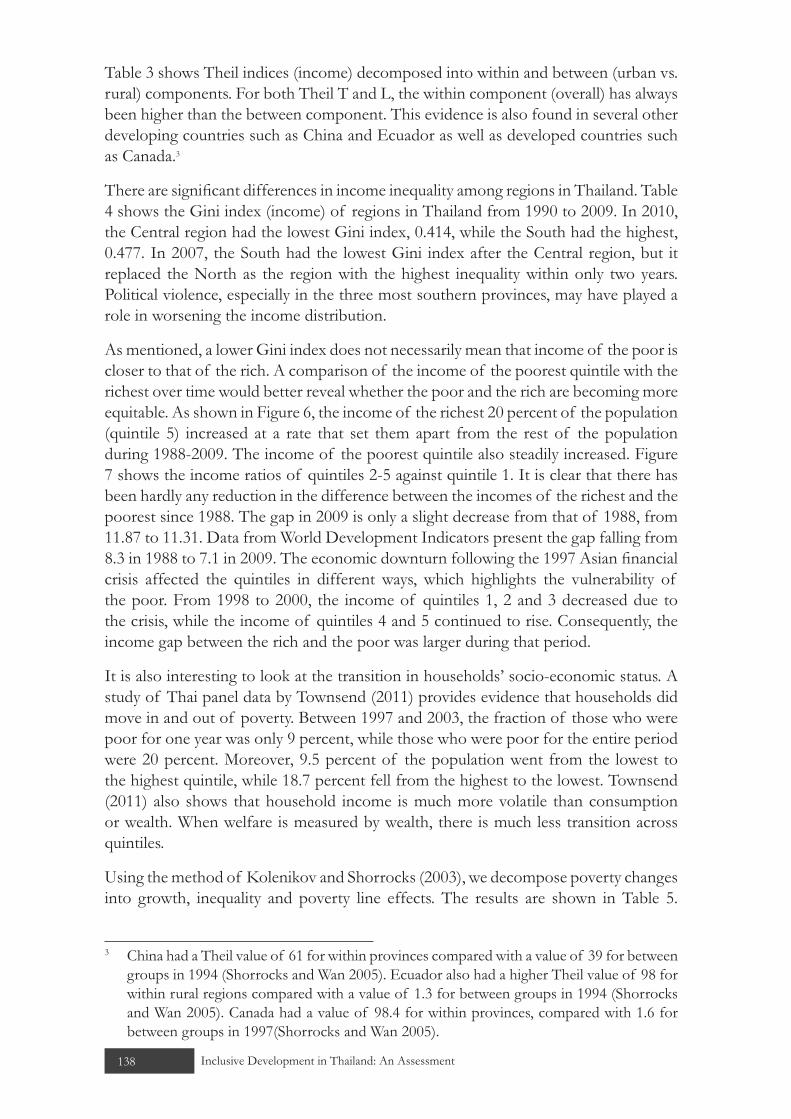
138 Inclusive Development in Thailand: An Assessment
Table 3 shows Theil indices (income) decomposed into within and between (urban vs. rural) components. For both Theil T and L, the within component (overall) has always been higher than the between component. This evidence is also found in several other developing countries such as China and Ecuador as well as developed countries such as Canada.3
There are significant differences in income inequality among regions in Thailand. Table 4 shows the Gini index (income) of regions in Thailand from 1990 to 2009. In 2010, the Central region had the lowest Gini index, 0.414, while the South had the highest, 0.477. In 2007, the South had the lowest Gini index after the Central region, but it replaced the North as the region with the highest inequality within only two years. Political violence, especially in the three most southern provinces, may have played a role in worsening the income distribution.
As mentioned, a lower Gini index does not necessarily mean that income of the poor is closer to that of the rich. A comparison of the income of the poorest quintile with the richest over time would better reveal whether the poor and the rich are becoming more equitable. As shown in Figure 6, the income of the richest 20 percent of the population (quintile 5) increased at a rate that set them apart from the rest of the population during 1988-2009. The income of the poorest quintile also steadily increased. Figure 7 shows the income ratios of quintiles 2-5 against quintile 1. It is clear that there has been hardly any reduction in the difference between the incomes of the richest and the poorest since 1988. The gap in 2009 is only a slight decrease from that of 1988, from 11.87 to 11.31. Data from World Development Indicators present the gap falling from 8.3 in 1988 to 7.1 in 2009. The economic downturn following the 1997 Asian financial crisis affected the quintiles in different ways, which highlights the vulnerability of the poor. From 1998 to 2000, the income of quintiles 1, 2 and 3 decreased due to the crisis, while the income of quintiles 4 and 5 continued to rise. Consequently, the income gap between the rich and the poor was larger during that period.
It is also interesting to look at the transition in households’ socio-economic status. A study of Thai panel data by Townsend (2011) provides evidence that households did move in and out of poverty. Between 1997 and 2003, the fraction of those who were poor for one year was only 9 percent, while those who were poor for the entire period were 20 percent. Moreover, 9.5 percent of the population went from the lowest to the highest quintile, while 18.7 percent fell from the highest to the lowest. Townsend (2011) also shows that household income is much more volatile than consumption or wealth. When welfare is measured by wealth, there is much less transition across quintiles.
Using the method of Kolenikov and Shorrocks (2003), we decompose poverty changes into growth, inequality and poverty line effects. The results are shown in Table 5.
3 China had a Theil value of 61 for within provinces compared with a value of 39 for between groups in 1994 (Shorrocks and Wan 2005). Ecuador also had a higher Theil value of 98 for within rural regions compared with a value of 1.3 for between groups in 1994 (Shorrocks and Wan 2005). Canada had a value of 98.4 for within provinces, compared with 1.6 for between groups in 1997(Shorrocks and Wan 2005).

139Inclusive Development in Thailand: An Assessment 139
Other things being constant, growth shifts the income distribution to the right and reduces poverty. An increase in inequality could flatten the left tail of the distribution and results in a higher poverty rate. An increase in the poverty line will surely increase the poverty rate. The numbers in Table 5 indicate the percentage point changes of poverty headcount caused by each effect. Positive numbers suggest an increase in poverty, while negative numbers suggest a decrease. In all sub-periods as well as the entire period (1988-2010), the growth effects dominate the inequality effects. In the second, third and fifth sub-periods, the growth and inequality effect work in the same direction. However, the growth and inequality effects worked in the opposite direction in 1988-92, when Thailand experienced high growth and increased inequality, and in 1996-2000 (a recession period), when negative growth generated a negative effect, but improved inequality partially offset the negative impact.
Table 4: Gini Coefficient by Region (income) Country Bangkok Central North Northeast South
1990 0.515 0.42 0.48 0.468 0.434 0.469
1992 0.536 0.457 0.462 0.476 0.471 0.481
1994 0.52 0.405 0.461 0.468 0.472 0.498
1996 0.513 0.401 0.468 0.458 0.47 0.47
1998 0.507 0.415 0.443 0.462 0.46 0.491
2000 0.522 0.417 0.448 0.469 0.483 0.476
2002 0.507 0.438 0.437 0.467 0.469 0.464
2004 0.493 0.422 0.433 0.478 0.448 0.445
2006 0.511 0.452 0.443 0.483 0.494 0.473
2007 0.497 0.468 0.422 0.469 0.468 0.46
2009 0.485 0.468 0.414 0.446 0.463 0.477Source: NESDB 2013
Table 5: Decomposition of Poverty Reduction into Growth, Inequality and Poverty Line Change
1988-1992 1992-1996 1996-2000 2000-2004 2004-2010 1988-2010Growth effect -21.90 -9.22 4.37 -13.75 -6.41 -39.91Inequality effect 2.92 -6.38 -1.05 0.44 -3.85 -6.65Change in poverty line
0.07 1.92 2.90 3.50 6.84 9.34
Total change in poverty rate
-16.76 -13.68 6.22 -9.82 -3.41 -37.21
Note: The poverty rate is the proportion of total population whose expenditure is below national poverty lines. All numbers are in terms of percentage points. Expenditure and poverty lines are in real terms.

140 Inclusive Development in Thailand: An Assessment
Figure 6: Income by Quintile (THB/person/month)
18000.
16000.
14000.
12000.
10000.
8000.
6000.
4000.
2000.
0.
Baht/Person/Month
Quintile 1 (lowest 20%)
Quintile 2 (second 20%)
Quintile 3 (third 20%)
Quintile 4 (forth 20%)
Quintile 5 (highest 20%)
1988
1990
1992
1994
1996
1998
2000
2002
2004
2006
2007
2009
Source: NESDB 2013
Figure 7: Income Ratios between Quintiles
0.00
2.00
4.00
6.00
8.00
10.00
12.00
14.00
16.00
1988
1990
1992
1994
1996
1998
2000
2002
2004
2006
2007
2009
Q5/Q1
Q4/Q1
Q3/Q1
Q2/Q1
Income ratio between quintiles
Source: NESDB 2013
The relationship between poverty and income inequality could suggest an important implication for the changes in income of the poor relative to the non-poor. As shown in Figure 8, during the 1960s-80s, poverty and inequality generally moved in the opposite direction; poverty was decreasing, but inequality was increasing. This could imply that the income of the non-poor might increase much faster than that of the poor. However, since the 1990s, while poverty was still decreasing, inequality also seemed to be decreasing despite some temporary movements up and down. This implies that there might be occasions when the income of the poor grew at a faster rate than that of the non-poor. We further explore this issue in the next section.

141Inclusive Development in Thailand: An Assessment 141
Figure 8: Poverty and Inequality, 1962-2010
0.40
0.45
0.50
0.55
0
20
40
60
80
100
120
1962
1964
1966
1968
1970
1972
1974
1976
1978
1980
1982
1984
1986
1988
1990
1992
1994
1996
1998
2000
2002
2004
2006
2008
2010
Gin
i coe
fficie
nt
Pove
rty in
ciden
ce (%
)
Year
Poverty incidence Gini coefficient
Source: Paitoonpong 2012. Note: Poverty incidence from 1962-1986 are extrapolated values. Any value exceeding 100 should be interpreted as close to 100.
2.4. Pro-Poor Growth in Thailand
In this section, we analyze whether growth benefits the poor, using measures reflecting three different concepts of pro-poor growth. First, Ravallion (2004) defines pro-poor growth as growth that reduces poverty (poverty-reduction pro-poor growth). A stronger definition of pro-poor growth focuses on inequality reduction accompanying poverty reduction during economic growth (Kakwani and Pernia 2000). This can be either “relative” or “absolute” pro-poor growth. Relative pro-poor growth requires the poor to benefit proportionally more than the non-poor. Absolute pro-poor growth is a stronger concept, requiring the poor to benefit more in absolute terms than the non-poor. Pro-poor and inclusive growths are similar terms that are sometimes used interchangeably. However, there are differences between the two. Pro-poor growth usually focuses on income, while inclusive growth is a broader concept, focusing on both income and non-income dimensions.
Table 6: Pro-poor Growth, 1986-2009Period Growth of real
mean income (%)Relative pro-poor
growthAbsolute pro-poor growth
Poverty reduction
1986 - 88 11.58 No No Yes1988 - 90 14.72 No No Yes1990 - 92 21.11 No No Yes1992 - 94 8.68 Yes No Yes1994 - 96 18.05 Yes No Yes1996 - 98 -1.21 No No No1998 - 00 -1.44 No No No2000 - 02 11.45 Yes No Yes2002 - 04 6.86 No No Ye2004 - 06 10.30 No No No2006 - 07 2.97 Yes No Yes2007 - 09 7.63 Yes No Yes
Source: Authors’ calculation using SES data

142 Inclusive Development in Thailand: An Assessment
We calculate the poverty equivalent growth rate (PEGR) in both relative and absolute pro-poor growth cases using the method in Kakwani and Son (2008) (see Appendix 1 for the framework and data). Evidence of different types of pro-poor growth during 1986-2009 is reported in Table 6.From 1986 to 1992, there was no evidence that the poor received more benefits from growth than the non-poor in either relative or absolute senses despite the reduction in poverty. Between 1992 and 1996, there was evidence that the poor benefited from growth proportionally more than the non-poor, but there was no evidence of absolute pro-poor growth throughout the studied period. During the economic crisis, 1996-2000, income loss for the poor appeared to be more than that of the non-poor, both relatively and absolutely.
Between 2000 and 2009 (except 2004-06), the poverty headcount ratio was in decline. Nonetheless, there were periods (2000-02, 2006-07 and 2007-09) when the poor benefited proportionally more than the non-poor. The relative pro-poor growth observed during these periods could be a result of populist policies first introduced by Prime Minister Thaksin Shinawatra and his Thai Rak Thai (TRT) party. The policies were primarily designed to reduce spending, increase opportunities (such as access to credit) and increase incomes of the poor. Policies such as the Universal Healthcare Coverage scheme, the Village Fund programme and the Small, Medium, Large Village Grant programme (SML) were very popular, and the TRT party was able to gain many votes from the poor. The Democrat Party, becoming the government after the TRT, was forced to continue with these programmes in order to gain votes. Recently, new populist policies have been introduced under the leadership of Prime Minister Yingluck Shinawatra, namely the first-car buyer policy, tax exemptions for first-home buyers and the rice-pledging scheme.4
Without a doubt, the poor have benefited from the populist policies. Nonetheless, there are criticisms and concerns over the negative impacts of these populist policies. First, the policies encourage people to wait passively for government assistance and therefore do not bother to improve their skills. The policies also take away resources that could have been used to promote sustainable growth. Moreover, studies show that these populist policies could be detrimental to both public and household debt. Public debt is projected to increase from 45 percent of GDP at the end of 2012 to almost 50 percent in 2013 (Chaitrong 2013). The estimated cost of the rice-pledging scheme is THB376 billion for the 2011-12 harvest season, with losses of an estimated THB115 billion. The losses for the 2012-13 harvest season are estimated to be THB132 billion. The two harvest season losses combined will be equivalent to 1 percent of GDP (Chaitrong 2013). Household debts were also projected to increase rapidly by the beginning of 2014 as more people seek various loan channels to take advantage of
4 The first-car buyer policy is a tax rebate on the first car ever purchased by the owner. The eligible owner must be at least 21 years old and keep ownership of the car for at least five years. The vehicle must be domestically manufactured and worth less than THB1 million, with engine capacity not exceeding 1500 cc. Under the first-home scheme, individuals are eligible for a tax deduction of up to 10 percent of property prices. In the rice-pledging scheme, the government will buy rice at roughly THB15,000 (USD485)per tonne, a price well above current market prices, as a safety net for farmers.

143Inclusive Development in Thailand: An Assessment 143
the new policies. For example, the popular first-car buyer scheme has led to over THB750,000 million of total debt in commercial banks (Bangkokbiz News 2012).
Whether they are desirable or not, the populist policies are likely to remain because they have established a powerful weapon that political parties use to compete for votes. Given the pervasiveness of these policies, relative pro-poor growth may continue in the short run. However, such growth might not be sustainable. Therefore, policymakers must carefully consider the trade-off between short-term benefits and long-term economic stability and growth when designing policies.
3. NON-INCOME DIMENSION
Persistent inequality in Thailand can be attributed to unevenly distributed growth and access to economic opportunities, inadequate social safety nets and weak public services and institutional arrangements. Departing from the standard pro-poor analysis, which is mainly done by examining monetary aspects of growth, this paper investigates non-monetary aspects such as access to economic opportunities (education, health, nutrition, productive employment, information and communication technology, social safety nets and governance) that are fundamental to sustainable and inclusive growth.
3.1. Access to Economic Opportunities
3.1.1. Education
Equal access to education creates opportunities for individuals to obtain the knowledge necessary to participate in the labour market and earn higher wages. Moreover, education is important not only in terms of contributing to the outcome of growth, but also its process. From Figure 9, average years of schooling for adults (ages 15 and above) have gradually increased, from 7.6 years in 2004 to 8.1 years in 2009. Evidently, there is inequality in the average number of years of schooling by gender. The average number of years of schooling for women are lower than those for men. However, the gap has narrowed from 0.6 years in 2004 to 0.4 years in 2009, implying that the average for women is growing at a faster rate.
Figure 9: Average Years of Schooling for Adults (15+)
8.4
8.2
8.
7.8
7.6
7.4
7.2
7.
6.8
Years
Men
Women
Total
2004
2005
2006
2007
2008
2009
Source: NESDB 2013

144 Inclusive Development in Thailand: An Assessment
Since 2003, the school enrolment rate in Thailand has been at least 80 percent, as shown in Figure 10. However, from 2006 to 2009, the rate declined slightly from 84 percent to 82 percent. The education level with the most decline in enrolment rate was higher education (bachelor degree and under), from 62.5 percent to 56.2 percent. Other enrolment rates, except high school, have also been in decline. The only increase in enrolment rates was that of upper secondary school, which increased from 65.8 percent in 2006 to 69.6 percent in 2009. Despite the slight decline in the enrolment rates of some levels, the rates are still reasonably high in general. Access to education is no longer a major problem; in fact, keeping the students in schools remains the challenge. For example, 68 percent of a cohort of students who attended first grade in 1998 managed to reach high-school level and only 54 percent of them graduated (Siamwalla et al., 2011). Although all children are able to enrol in primary schools, the schools differ greatly in quality. Poor children are more likely to end up in a lower quality school, which is usually a state school that offers free tuition but lacks important resources such as high-quality teachers and school equipment.
Figure 10: School Enrolment (% of population in relevant age group)
120
100
80
60
40
20
0
(%)Total
Pre-School (Age 3-5)
Primary School (Age 6-11)
Lower Secondary School (Age 12-14)
Upper Secondary School (Age 15-17)
Bachelor’s Degree and under (Age 18-21)
1994
1995
1996
1997
1998
1999
2000
2001
2002
2003
2004
2005
2006
2007
2008
2009
Source: NESDB 2013. Note: The primary school enrolment rate exceed 100 percent because there are children above 11 years old still attending primary education. Thus, the number of children enrolled is higher than the total population of the relevant age group.
3.1.2. Health
The opportunity to maintain good health is an important aspect of inclusive growth. The poor are especially vulnerable to ill-health because they do not always earn sufficient income to sustain health and longevity. Life expectancy at birth indicates the number of years a newborn infant would live if the pattern of mortality rate were to stay the same throughout life (World Bank, 2012). The higher average life expectancy implies better health of the population. The World Development Indicators show that life expectancy at birth in Thailand has been increasing gradually, from 72.7 years in 2002 to 73.9 years in 2010. This shows an overall improvement in living conditions. The gap between men and women has always been wide, but quite steady throughout the past decade. The average life expectancy for women for 2005-10 was 77.5 years,
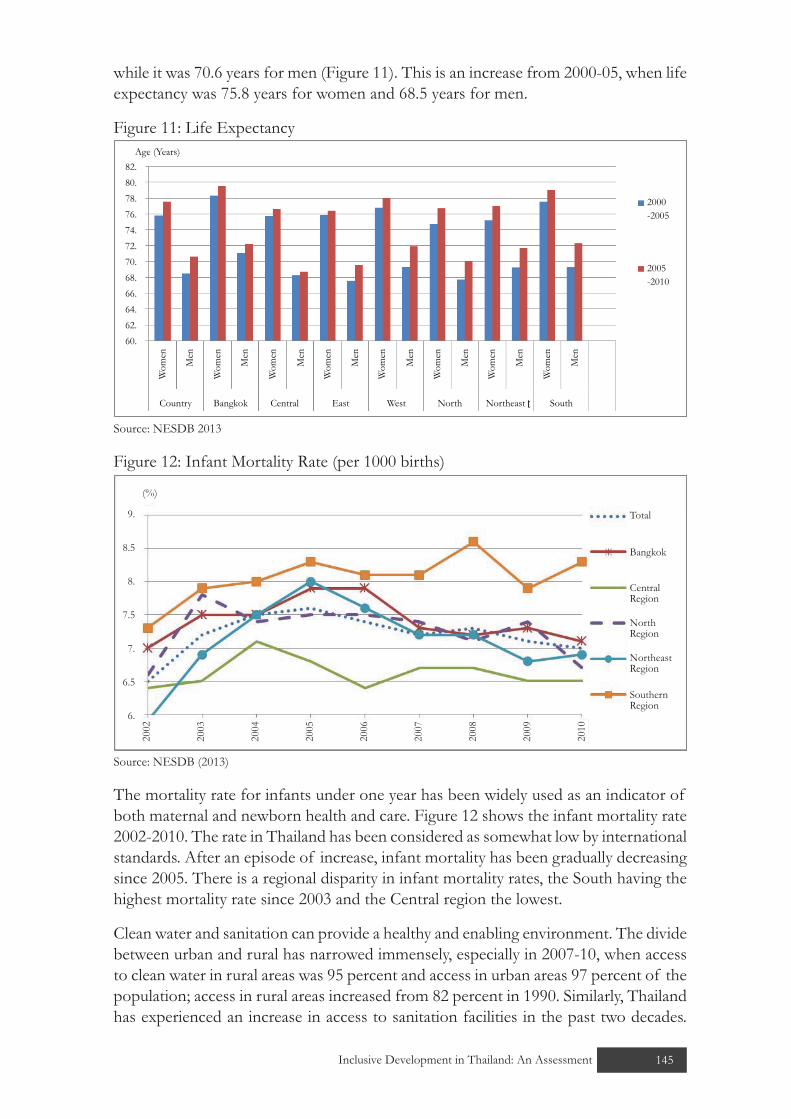
145Inclusive Development in Thailand: An Assessment 145
while it was 70.6 years for men (Figure 11). This is an increase from 2000-05, when life expectancy was 75.8 years for women and 68.5 years for men.
Figure 11: Life Expectancy
2000-2005
2005-2010
82.80.78.76.74.72.70.68.66.64.62.60.
Age (Years)W
omen
Wom
en
Wom
en
Wom
en
Wom
en
Wom
en
Wom
en
Wom
en
Men
Men
Men
Men
Men
Men
Men
Men
Country Bangkok Central East West North Northeast South
Source: NESDB 2013
Figure 12: Infant Mortality Rate (per 1000 births)
9.
8.5
8.
7.5
7.
6.5
6.
(%)
Total
Bangkok
Central Region
North Region
NortheastRegion
SouthernRegion
2002
2003
2004
2005
2006
2007
2008
2009
2010
Source: NESDB (2013)
The mortality rate for infants under one year has been widely used as an indicator of both maternal and newborn health and care. Figure 12 shows the infant mortality rate 2002-2010. The rate in Thailand has been considered as somewhat low by international standards. After an episode of increase, infant mortality has been gradually decreasing since 2005. There is a regional disparity in infant mortality rates, the South having the highest mortality rate since 2003 and the Central region the lowest.
Clean water and sanitation can provide a healthy and enabling environment. The divide between urban and rural has narrowed immensely, especially in 2007-10, when access to clean water in rural areas was 95 percent and access in urban areas 97 percent of the population; access in rural areas increased from 82 percent in 1990. Similarly, Thailand has experienced an increase in access to sanitation facilities in the past two decades.

146 Inclusive Development in Thailand: An Assessment
The gap between urban and rural narrowed greatly due to the significant improvement in rural areas, 96 percent of the population having access to sanitation facilities in 2010 compared with 80 percent in 1990.
3.1.3. Productive Employment
Labour productivity is key to progress on inclusive growth because productivity is crucial to high and sustainable economic growth, which is a pre-condition of inclusive growth. As shown in Table 7, Thailand experienced a rapid increase in labour productivity from 2001 to 2007, followed by slow growth in 2008 and then a sharp decline in 2009. This decline could be due to the impact of the economic downturn. The sector with the most productivity over the decade was financial transactions, followed by transport and manufacturing. The sectors with relatively low labour productivity are construction, hotels and restaurants, wholesale and retail and agriculture.
Figure 13: Labour Participation Rate (age 15+)
84.082.080.078.076.074.072.070.068.066.064.062.060.0
% of population
Labour Participation Rate, male
Labour Participation Rate, female
Labour Participation Rate, total
2000
2002
2001
2003
2004
2005
2006
2007
2008
2009
2010
Source: World Development Indicators 2013
Productive employment has been cited as a major determinant of the inclusiveness of economic growth. Productive employment is defined as employment that yields sufficient returns to permit workers and their dependants a level of consumption above the poverty line (Ronnås and Kwong, 2009). Table 8 shows the number of workers employed in various sectors in 2010. The largest proportion of Thai workers (more than 40 percent) worked in agriculture, which creates relatively low value-added and yields relatively low wages. This suggests that there is a need to increase productivity in the agriculture sector, and to encourage more workers to participate in more highly productive sectors.
The industry with the most formal employment is manufacturing, with 4 million formal workers and approximately 1 million informal workers in 2010. In contrast to manufacturing, there were 14,485,521 million informal workers in agriculture and only 1,259,691 formal workers. This means that the majority of workers in this sector do not receive social benefits such as social security and are not protected by any workers’ unions. We have already established that the majority of the poor are employed within agriculture. This new finding adds concerns about the extent of the social protection that informal poor workers receive.

147Inclusive Development in Thailand: An Assessment 147
Table 7: Labour Productivity (THB/person/year)
2001 2002 2003 2004 2005 2006 2007 2008 2009Agriculture 20564 20091 22914 22497 21940 22040 22124 22429 22233Manufacturing 225588 235693 248792 260464 268417 288458 300268 321617 309664Construction 46482 45122 44046 42680 44054 45605 46777 42994 41347Wholesale and Retail
100172 97001 94961 93372 97588 101793 105703 103938 96823
Hotels and Restaurants
61869 60712 55351 59100 57979 66501 67377 67406 61630
Transport 308609 328267 324542 332859 34648 380193 408329 385135 368676Financial transactions
282972 351294 387061 423816 430175 413702 434617 426052 443858
Total 95738 97912 102484 106200 109425 113675 117424 117823 113033Source: NESDB 2013
Table 8: Number of People Employed, 2010 (millions)
Formal Employment Informal Employment
Agriculture 1.19 14.22Manufacturing 4.08 1.10Construction 1.11 0.97Wholesale and Retail 2.07 4.03Hotels and Restaurants 0.69 1.86Transport 0.52 0.52Financial transactions 0.35 0.01Total employment 14.56 28.13
Source: NESDB 2013
There is a big gap in employment between males and females, which reflects unequal opportunities. From Figure 13, it is clear that the labour participation rate of men has been much higher than that of women. It is possible that women face more barriers in entering the labour market.
3.1.4. Information and Communication Technology
Information and communication technology, including the internet and mobile phones, has become an important means of communication and learning. As shown in Figure 14, the ratio of internet users in Thailand has been on the rise for many years. In 2010, 22.4 percent of the population had access to the internet, an increase of 10.41 percentage points from 2005. The percentage of internet users in Bangkok has been significantly higher than in other regions, while the percentage in the North-East has always been at the bottom.
The proportion of mobile phone users to the total population has also been on the rise, from 28.2 percent in 2004 to 61.8 percent in 2010 (Figure 14). As in the case of the internet, there is still a large gap between the rate in Bangkok and in other regions, and the North-East has always been at the bottom.

148 Inclusive Development in Thailand: An Assessment
Figure 14: Proportion of Internet Users
45.
40.
35.
30.
25.
20.
15.
10.
5.
0.
%
2004
2005
2006
2007
2008
2009
2010
Total
Bangkok
Central RegionNorthern Region
NortheastRegion
SouthernRegion
Source: NESDB 2013
3.2. Social Safety Nets
Social safety nets have major implications for inclusive growth because they are a means for promoting savings and investments for the poor.5 If the poor are able to save household costs through social safety nets, such as health and education benefits, they will be able to use their resources to create more economic opportunities for themselves. Social protection can be growth-enhancing by increasing poor people’s access to assets (Conceição and Levine 2010).
Two major indicators are used to capture social safety nets in Thailand: total government expenditure on social protection programmes; and ratio of beneficiaries of social protection programmes to the targeted population. The present social protection system in Thailand is a multi-pillar one, with a few schemes to cover different sectors of employment (Appendix 2).
Figure 15 shows the trend and the total government expenditure on social protection programmes (excluding transfers in kind) from 1990 to 2010. The expenditure consists of social security benefits (SSB), social assistance benefits (SAB) and unfunded employee social benefits (UEB).6 From 1990 to 2010, total social benefits in cash increased from THB18,265 million to THB241,113 million, a growth rate of 14.4 percent per year. UEB is much larger than SAB and SSB, THB176,492 million compared with THB44,910 million and THB19,711 million, respectively. The UEB covers those who are in formal employment, in both the private and public sectors. However, a large
5 The World Bank defined SSNs very broadly and even included social insurance within the SSN umbrella. The International Labour Organization used a narrower definition of SSNs. Social insurance systems financed by contributions from employers and workers did not strictly fall within the ILO’s SSN framework. The ILO maintained that ‘‘the social safety net is a government-provided anti-poverty benefit’’ (Paitoonpong et al., 2008). There is a broader concept, social safety floor is a basic set of social rights derived from human right treaties, including access to essential services and social transfers, in cash or in kind, to guarantee income security, food security and adequate nutrition.
6 Unfunded employee social insurance benefits are benefits payable to employees, their dependants or survivors by employers administering unfunded social insurance schemes.

149Inclusive Development in Thailand: An Assessment 149
number of people who are informally employed receive less protection from the state since they can benefit only from the smaller funds, SAB and SSB.
Figure 15: Trend and Structure of Government Expenditure on Social Protection Programmes
300000
250000
200000
150000
100000
50000
0
million baht
SBK* SSB SAB UEB
1990
1991
1992
1993
1994
1995
1996
1997
1998
1999
2000
2001
2002
2003
2004
2005
2006
2007
2008
2009
2010
Source: NESDB 2013*SBK is social benefits other than social transfers in kind. SSB is social security benefits in cash. SAB is social assistance in cash. UEB is unfunded employee social benefits.
3.2.1. Older Person’s Allowance (OPA)
Since the elderly population is more likely to be poor, social protection programmes to provide financial security for the elderly would have a major impact on the inclusiveness of growth. The universal OPA or “social pension” covers the elderly from both formal and informal sectors. The OPA is a social assistance or welfare transfer provided by the government.7 The programme was initiated in 1993 to provide income for the poor or disabled elderly. It was means-tested before turning into a universal programme in 2009.Since 2011, the allowance has been adjustable according to the beneficiary’s age (Table 9).
Table 10 provides the number and proportion of recipients of the OPA. It proved to be quite successful in broadening the coverage of the elderly population. The number of recipients increased from 20,000 in 1993 to 5,698,414 in 2011. The proportion recipients in the total of older population increased from less than 1 percent in 1993 to 61.7 percent in 2011.
Workers in formal sectors can benefit from the Old Age Pension (OAP), which began in 1999 and requires 15 years of contributions for eligibility. The first participants who will receive the benefit will be those retiring in 2014. The long-term effect of the OAP remains questionable because the programme’s contribution rate might be too low to sustain it fully in the long term. In addition, the lack of minimum contribution means that workers with lower pay cannot receive a large enough pension to keep them from poverty after retirement.
7 The eligibility for the OPA includes having Thai nationality, living in an OPA administration area, being 60 years old or over, not receiving other forms of social protection and not residing in a nursing home provided by local or national government.
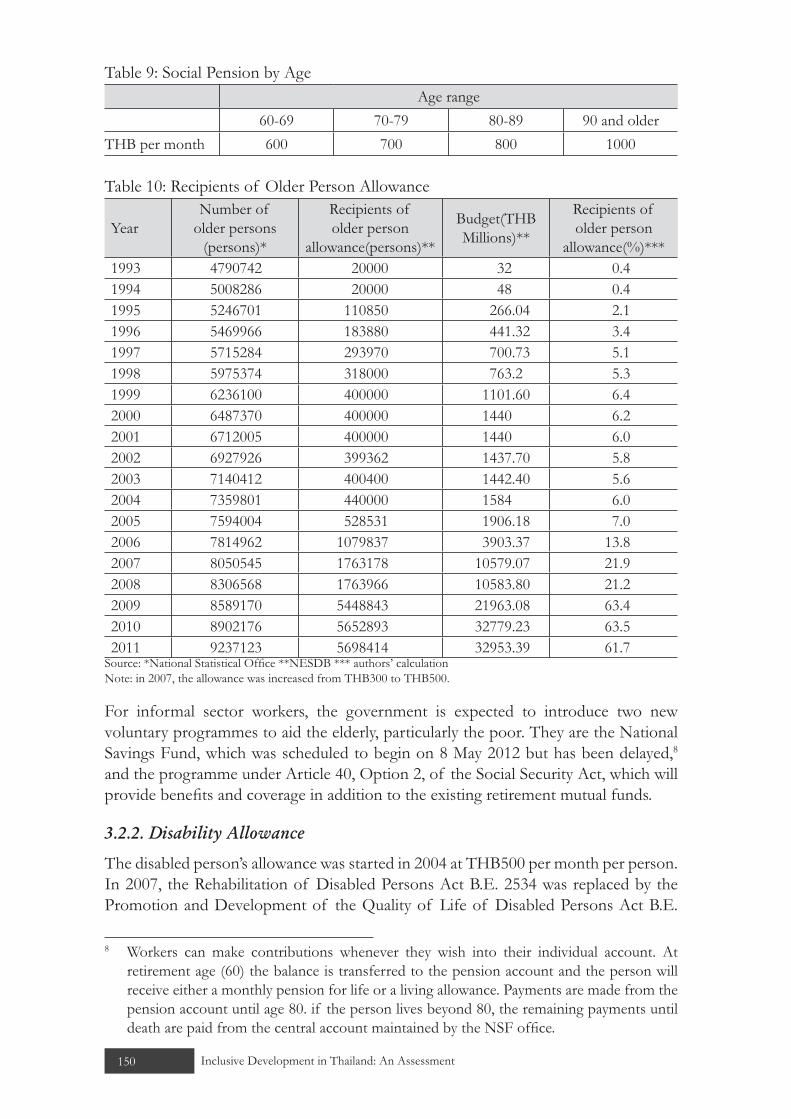
150 Inclusive Development in Thailand: An Assessment
Table 9: Social Pension by AgeAge range
60-69 70-79 80-89 90 and olderTHB per month 600 700 800 1000
Table 10: Recipients of Older Person Allowance
YearNumber of
older persons (persons)*
Recipients of older person
allowance(persons)**
Budget(THB Millions)**
Recipients of older person
allowance(%)***1993 4790742 20000 32 0.41994 5008286 20000 48 0.41995 5246701 110850 266.04 2.11996 5469966 183880 441.32 3.41997 5715284 293970 700.73 5.11998 5975374 318000 763.2 5.31999 6236100 400000 1101.60 6.42000 6487370 400000 1440 6.22001 6712005 400000 1440 6.02002 6927926 399362 1437.70 5.82003 7140412 400400 1442.40 5.62004 7359801 440000 1584 6.02005 7594004 528531 1906.18 7.02006 7814962 1079837 3903.37 13.82007 8050545 1763178 10579.07 21.92008 8306568 1763966 10583.80 21.22009 8589170 5448843 21963.08 63.42010 8902176 5652893 32779.23 63.52011 9237123 5698414 32953.39 61.7
Source: *National Statistical Office **NESDB *** authors’ calculation Note: in 2007, the allowance was increased from THB300 to THB500.
For informal sector workers, the government is expected to introduce two new voluntary programmes to aid the elderly, particularly the poor. They are the National Savings Fund, which was scheduled to begin on 8 May 2012 but has been delayed,8 and the programme under Article 40, Option 2, of the Social Security Act, which will provide benefits and coverage in addition to the existing retirement mutual funds.
3.2.2. Disability Allowance
The disabled person’s allowance was started in 2004 at THB500 per month per person. In 2007, the Rehabilitation of Disabled Persons Act B.E. 2534 was replaced by the Promotion and Development of the Quality of Life of Disabled Persons Act B.E.
8 Workers can make contributions whenever they wish into their individual account. At retirement age (60) the balance is transferred to the pension account and the person will receive either a monthly pension for life or a living allowance. Payments are made from the pension account until age 80. if the person lives beyond 80, the remaining payments until death are paid from the central account maintained by the NSF office.

151Inclusive Development in Thailand: An Assessment 151
2550.9 The new law redefines the criteria to cover more types of disability. Table 9 shows the number of recipients of disability allowance from 2004 to 2011. The number of recipients increased from 24,000 in 2004 to 990,883 in 2011. The proportion of recipients in the total number of disabled persons is not available due to lack of official data.
Table 11: Recipients of Disability AllowanceYear Recipients* (persons) Budget** (THB million)2004 24000 1442005 25172 151.032006 42308 253.852007 235495 1413.372008 236012 1416.622009 262742 1577.322010 835061 3497.062011 990883 5945.30
Source: * National Office for Employment of Persons with Disability. ** Department of Local Administration, Ministry of Interior
3.2.3. HIV/AIDS Allowance
To assist AIDS/HIV patients, the government provides a monthly allowance of THB500 per person to eligible recipents.10 The number and proportion of recipients of the allowance has been continuously increasing (Table 12). Meanwhile, the number of HIV/AIDS patients declined by 17 percent from 2004 to 2011.
Table 12: Recipients of AIDs/HIV Allowance
year AIDs/HIV patients* Recipients** Budget**
(THB million)Recipients as % of patients
2004 583190 6000 36 1.02005 562243 6004 36.05 1.02006 556848 23805 142.86 4.22007 546578 27603 165.64 5.02008 532522 27613 165.76 5.12009 516632 35230 171.74 6.82010 499324 40332 224.36 8.02011 481770 40811 225.31 8.4
Source:* Bureau of Epidemiology, Ministry of Public Health. ** Department of Local Administration, Ministry of Interior
9 The eligibility requirements include having Thai nationality, having disabled person ID, not staying in a care facility of the government or private agencies funded by the government and not being imprisoned by court order.
10 The eligibility requirements include being medically certified with HIV/AIDS symptoms, having income of less than THB20,000per year, being alone and unable to be employed and residing within the area of responsibility of a local administration.

152 Inclusive Development in Thailand: An Assessment
3.3. Governance Indicators
Governance is the traditions and institutions by which authority is exercised. This includes (1) the process by which governments are selected, monitored and replaced; (2) the capacity of the government to formulate and implement sound policies; and (3) the respect of citizens and the state for the institutions that govern economic and social interactions among them (Kaufman et al. 2010). To assess governance in Thailand, we rely on the Worldwide Governance Indicators, which consist of six composite indicators of broad dimensions: voice and accountability, political stability and absence of violence/terrorism, government effectiveness, regulatory quality, rule of law and control of corruption.11
Table 13 shows Thailand’s scores for each indicator in 2000, 2005 and 2010. To assess whether the change over time in an indicator is significant, we follow a rule of thumb proposed by Kaufman et al. (2001): a change is significant when the 90 percent confidence intervals of the indicator during the two periods do not overlap. Based on this rule, there are only two significant changes in the scores. The voice and accountability indicator in 2005 declined significantly from that of 2000. More recently, the government effectiveness indicator in 2010 decreased significantly from 2005. Although there are only two significant changes in the scores, the percentile rank has declined considerably in all indicators. This means that other countries have outperformed Thailand. The biggest falls in the rankings were the voice and accountability indicator and the political stability indicator. The government effectiveness indicator showed the least decline. The decline in the rankings implies that Thailand is losing its competitiveness and becoming a less attractive foreign direct investment destination, which could adversely affect sustainable growth.
11 Voice and accountability capture perceptions of citizens on their ability to participate in selecting their government, as well as freedom of expression, freedom of association and free media. Political stability and absence of violence/terrorism capture perceptions on the likelihood of the government being destabilised or overthrown by unconstitutional or violent means, including politically motivated violence and terrorism. Government effectiveness captures perceptions on the quality of public services, quality of civil service and the degree of its independence from political pressures, quality of policy formulation and implementation and the credibility of the government’s commitment to such policies. Regulatory quality captures perceptions of the ability of the government to formulate and implement sound policies and regulations that permit and promote private sector development. Rule of law captures perceptions on whether agents have confidence in and abide by the rules of society and in particular the quality of contract enforcement, property rights, the police and the courts, as well as the likelihood of crime and violence. Control of corruption captures perceptions of the extent to which public power is exercised for private gain, including both petty and grand forms of corruption, as well as “elite capture” and private interests (Kaufman et al. 2001).

153Inclusive Development in Thailand: An Assessment 153
Table 13: Governance Indicators
Governance Indicator Year
Percentile Rank
Governance Score Standard
Error90% Confidence
Intervals(0-100) (-2.5 to +2.5)
Voice and Accountability
2010 30.3 -0.56 0.11 -0.38 -0.742005 44.7 -0.15 0.16 0.11 -0.412000 63.9 0.52 0.21 0.87 0.17
Political Stability/Absence of Violence
2010 12.7 -1.22 0.23 -0.84 -1.602005 22.1 -0.86 0.27 -0.42 -1.302000 60.1 0.36 0.3 0.85 -0.13
Government Effectiveness
2010 58.4 0.09 0.19 0.40 -0.222005 65.9 0.38 0.17 0.66 0.102000 61 0.15 0.19 0.46 -0.16
Regulatory Quality
2010 56.5 0.19 0.17 0.47 -0.092005 64.7 0.46 0.17 0.74 0.182000 65.7 0.42 0.21 0.77 0.07
Rule of Law2010 49.8 -0.2 0.14 0.03 -0.432005 54.1 0.08 0.16 0.34 -0.182000 67.5 0.55 0.15 0.80 0.30
Control of Corruption
2010 46.9 -0.34 0.14 -0.11 -0.572005 53.2 -0.1 0.14 0.13 -0.332000 55.6 -0.13 0.18 0.17 -0.43
Source: World Governance Indicators 2012
3.4. Public Spending on Health and Education
The public expenditure to GDP ratio reflects the commitment of the state to transfer resources towards the well-being of the population. The World Development Indicators show a somewhat positive view of public spending on health and education. Within ASEAN, Thailand is one of the leading countries in both indicators. From 1995 to 2009, public spending on education fluctuated around 3-5 percent of GDP. In 2010, it was 4.1 percent of GDP, higher than Singapore, Indonesia and the Philippines (2009), but lower than Malaysia (2009). In the same period, public spending on health varied at around 2-3 percent of GDP. In 2010, it was at 2.91 percent of GDP, the highest among ASEAN countries.
Table 14: Public Spending on Health and EducationYear Health (% of GDP)* Education (% of GDP)**
1995 1.66 3.21996 1.81 3.51997 2.16 4.61998 2.05 4.71999 1.92 5.02000 1.91 5.42001 1.87 5.0

154 Inclusive Development in Thailand: An Assessment
2002 2.35 4.12003 2.28 4.02004 2.28 4.22005 2.29 4.22006 2.54 4.32007 2.72 3.82008 3.02 3.82009 3.11 4.12010 2.91 3.8
Source: World Development Indicators
4. INDEX VARIABLES
To evaluate inclusive growth in Thailand, we adopt the composite index proposed by McKinley (2010) as an overall comparable measure of national inclusive growth. The composite index comprises 10 indicators: growth, employment, economic infrastructure, poverty, inequality, gender equity, health and nutrition, education, sanitation and water and social protection, and is a weighted sum of all scores. Overall, Thailand receives a score of 6.75, which is at the upper end of the satisfactory range (Table 15).
Table 15: Composite Index VariablesCategory Score Weight Total
Growth 7 0.25 1.75Employment 6 0.15 0.90Economic Infrastructure
9 0.10 0.90
Poverty 6 0.10 0.60Inequality 5 0.10 0.50Gender Equity 8 0.05 0.40Health and Nutrition 7 0.05 0.35Education 6 0.05 0.30Sanitation and Water 9 0.05 0.45Social Protection 6 0.10 0.6Total 1.00 6.75
Note: a score of 1-3 is regarded as unsatisfactory progress, 4-7 as satisfactory progress and 8-10 as superior progress.
4.1. Growth, Employment and Economic Infrastructure
Despite a few downturns, the Thai economy has grown substantially over the decades. The Asian financial crisis in 1997 brought the GDP per capita growth to as low as -11.6 per cent in 1998, and the subprime mortgage crisis brought it down to -2.9 percent in 2009. The economy bounced back rapidly in 2010 with 7.2 percent growth, which indicates a high potential for good economic performance. Thus, Thailand receives a score of 7. It will need to focus on maintaining sustainability in order to achieve a higher score.

155Inclusive Development in Thailand: An Assessment 155
Thailand has been experiencing a change in the structure of productive employment with a recent decrease in the share of total employment in industry from 20.7 percent in 2007 to 19.5 percent in 2009. At the same time, the share of total employment in services increased from 37.4 percent in 2007 to 38.9 percent in 2009. The share of total employment in agriculture decreased consistently over the decade, from 64 percent in 1990 to 41.5 percent in 2009. Moreover, the proportion of own-account and contributing family workers increased slightly, from 53.1 percent in 2004 to 53.4 percent in 2007 (International Labour Organization, 2013). The score of 6 in the employment category means there is still room for improvement, especially to improve efficiency by increasing employment in higher productivity and value-added sectors.
Progress on access to economic infrastructure has been tremendous. The share of mobile phone subscribers per 100 people has increased dramatically, from 4.8 percent in 2000 to 90.6 percent in 2008 and 113 percent in 2011. The population with access to electricity is also impressive at 99.3 percent in 2009. There is still room to improve by aiming to have 100 percent of the population with access to electricity.
4.2. Poverty and Inequality
Poverty reduction has been consistent, which is evident from the decreasing poverty headcount ratio based on the national poverty line. NESDB data show the poverty incidence decreasing from 11.16 percent in 2004 to 7.8 percent in 2010, while World Development Indicators show the poverty incidence falling from 21 percent in 2000 to 9.6 percent in 2006 to 8.1 percent in 2009. The poverty incidence based on the USD2 line decreased from 18.1 percent in 2000 to 7.6 percent in 2006 to 4.58 percent in 2009. However, poverty reduction has not been significant in recent years. Moreover, the poverty incidence in other developing countries appears lower, for example Malaysia (2.3 percent in 2009) and Argentina (3.4 percent in 2009).
In terms of inequality, Thailand still has a relatively high Gini coefficient despite the decrease from 0.52 in 2000 to 0.51 in 2006. Progress on inequality reduction has been slow.
4.3. Gender Equity
Young women and men are nearly equal in literacy. The ratio of young (15-24) literate females to males has been close to unity: 0.997 in 2000 and 0.996 in 2005. Moreover, the ratio of female to male secondary school enrolment has been a little more than one:1.09 in 2007 and 1.08 in 2011, meaning that secondary enrolment is biased in favour of females (World Bank, 2013).
Maternal health has improved. Births attended by skilled health personnel rose from 97 percent in 2006 to 99 percent in 2010. At the same time, maternal mortality per 100,000 births dropped from 54 in 1990 to 48 in 2010. This is still behind many developed countries, such as Sweden (4 in 2010), the United States (21 in 2010) (World Bank, 2013) and the United Kingdom (12 in 2010. This suggests substantial room for improvement.

156 Inclusive Development in Thailand: An Assessment
The share of women in waged non-agricultural employment is the area with the least improvement (from 44.1 percent in 2000 to 45.5 percent in 2009) (World Bank, 2013). Overall, Thailand receives a score of 8 in the gender equity category.
4.4. Human Capabilities
Under-five mortality per 1000 live births has improved from 21 in 1995 to 12 in 2011.These results still fall behind developed countries; for example the rate in Japan is 3 Germany 4 and the United Kingdom 5. The proportion of children under 5 who are underweight was 7 percent from 2005-2010 (World Bank, 2013). Therefore, a score of 7 has been given for health and nutrition.
Access to education is no longer a major obstacle. The net primary enrolment rate was 92 percent in 2007, while the net secondary enrolment rate was 69.6 percent in 2009 (World Bank, 2013). This suggests that a large proportion of students do not go on to secondary education, which is an issue that requires more attention.
Thailand has achieved significant progress on increasing access to clean water and sanitation. The share of the population with a clean water source increased from 91 percent in 1990 to 98 percent in 2008. The share with access to sanitation rose from 80 percent in 1990 to 96 percent in 2010. This suggests a healthier quality of life.
4.5. Social Protection
Unlike other countries within the GMS, the social protection index has not been calculated for Thailand by the Asian Development Bank. Therefore, the authors calculated the composite score for social protection in Thailand using the latest methodology of the ADB (2011). Thailand receives a score of 0.40, which is higher than the regional average of 0.36 (calculated from 31 countries for which the index is available; see ADB[2008] for details).
In summary, Thailand has made great progress in almost all dimensions of inclusive growth. The areas in which it has made superior progress are economic infrastructure, gender equality and sanitation and water. All other areas are in the highly satisfactory range, which highlights that Thailand has broadened access to economic opportunities. The major area of concern is income inequality. Overall, the country receives a score of 6.85, at the upper end of the satisfactory range. It should be noted that the way the scores are given is highly subjective, depending solely on the authors’ view. As a result, using the index for cross-country comparison should be done with caution.
5. CONCLUSION
We find that Thailand has experienced periods of inclusive growth, meaning that the poorer population has benefited economically and socially at some point in the country’s economic progress. The income analysis shows that the country is quite successful in poverty alleviation and the creation of more economic opportunities for the poor. Although inequality measures such as the Gini and Theil indices have been decreasing, there is still a concern over income inequality. The income of the top 20 percent of the population is much higher than the remaining quintiles, despite all quintiles having experienced increases.

157Inclusive Development in Thailand: An Assessment 157
In the non-income dimension of inclusive growth, Thailand has done exceptionally well with regards to economic infrastructure, sanitation and water and gender equity. Nevertheless, women still have less access than men to education and labour participation. Regional disparity, particularly unequal access to education, health and economic infrastructure, hinders the inclusiveness of growth as knowledge and resources are not transferred towards the poorer regions. Thailand has a myriad of social protection programmes, but there is still much room for improvement in the quality of coverage, particularly of the elderly poor, the group most at risk of poverty. Thailand’s rank in the Worldwide Governance Indicators has been lowered considerably for all indicators, especially government effectiveness and voice and accountability. The government needs to improve its ability to maintain political stability, which is crucial to expanding economic opportunities. Moreover, it needs to pay more attention to accountability mechanisms that could allow citizens more participation in creating a proper environment for inclusive growth. Lastly, the composite index proposed by McKinley (2010) shows a satisfactory level of inclusive growth.
REFERENCES
Asian Development Bank (2008), Social Protection Index for Committed Poverty Reduction,Vol. 2. (Manila: ADB)
Asian Development Bank (2012), Kingdom of Thailand: Updating and Improving the Social Protection Index. Technical Assistance Consultant’s Report (Manila: ADB)
Asian Development Bank (2011), The Revised Social Protection Index. Methodology and Handbook (Manila: ADB)
Bangkokbiznews (2012), http://www.bangkokbiznews.com/home/detail/auto-mobile/auto-mobile /20130111/485382/ - .html (accessed 19 August 2012)
Chaitrong, Wichit (2012), “Rice-pledging concerns WB”, The Nation, 20 December [online] Available at: http://www.nationmultimedia.com/business/Rice-pledging-concerns-WB-30196472.html (accessed 15 January 2013)
Chandoevit, Worawan (2006), Social Security Systems in Thailand (Bangkok: Thailand Development Research Institute)
Conceição, Pedro and Sebastian Levine (2010), “Social Protection key to strong and inclusive growth”, United Nations Development Programme Commentary
Ianchovichina, Elena, Susanna Lundstrom and Leonardo Garrido (2008), “What is Inclusive Growth?”, World Bank note(Washington DC: World Bank)
International Labour Organization (2013), LABORSTA, http://laborsta.ilo.org/(accessed 28 March 2013)
Jitsuchon, Somchai (2011), Toward Universal Social Welfare in 2017(Bangkok: Thailand Development Research Institute).
Kakwani, Nanak (1980), Income Inequality and Poverty: Methods of Estimation and Policy Applications, Oxford University Press, New York
Kakwani, Nanak (1993), “Poverty and Economic Growth with Application to Cote D’Ivoire”, Review of Income and Wealth, Vol. 39, pp. 121-139

158 Inclusive Development in Thailand: An Assessment
Kakwani, Nanak and Ernesto M. Pernia (2000), “What is Pro-Poor Growth?”, Asian Development Review, Vol. 16, No.1, pp. 1-22.
Kakwani, Nanak and Son G. Hyun (2008),“Poverty Equivalent Growth Rate”, Review of Income and Wealth, Vol.54, No.4, pp. 643-655.
Kaufmann, Daniel, Aart Kraay and Massimo Matzruzzi (2010), The Worldwide Governance Indicators: Methodology and Analytical Issues, World Bank Policy Research Working Paper 5430(Washington DC: World Bank Development Research Group)
Kolenikov, Stanislav and Anthony Shorrocks (2003), “A Decomposition Analysis of Regional Poverty in Russia”, UNU-WIDER Research Paper, No. 2003/74, pp. 1-44
McKinley, Terry (2010), Inclusive Growth Criteria and Indicators: An Inclusive Growth Index for Diagnosis of Country Progress, ADB Sustainable Development Working Paper 14(Manila: Asian Development Bank)
National Economic and Social Development Board (2013), Social Statistics, http://social.nesdb.go.th/SocialStat/StatSubDefault_Final.aspx?catid=13 (accessed 28 March 2013)
Paitoonpong, S. (2012), Social Protection in East Asia: THAILAND, 6th Workshop on Social Protection in East Asia, April 27-28, 2012, Korea: Seoul National University
Paitoonpong, Srawooth, Shigeyuki Abe and Nipon Puopongsakorn (2008), The meaning of ‘social safety nets’, Journal of Asian Economics, Vol. 19, No. 5-6.
Ravallion, Martin (2004), “Pro-poor Growth: A Primer”, Development Research Group, The World Bank, Washington DC
Ronnås, Per and Miranda Kwong (2009), “Deriving Targets for Productive Employment from Poverty Targets”, http://www.ilo.org/wcmsp5/groups/public/---ed_emp/---ed_emp_msu/documents/briefingnote/wcms_155817.pdf (accessed 19/08/12)
Townsend, Robert M. (2011), Financial Systems in Developing Economies: Growth, Inequality and Policy Evaluation in Thailand (New York: Oxford University Press)
Siamwalla, Ammar, Dilaga Lattapiphat and Somkiat Tangkitvanich (2012), “Revamping the Thai Education System: Quality for All”, Paper presented at Thailand Development Research Institute Year-End Conference 2012(Bangkok: Thailand Development Research Institute)
Shorrock, Anthony and Guanghua Wan (2005), “Spatial decomposition of inequality”, Journal of Economic Geography, Vol.5, pp. 59-81.
Son, Hyun G. and Nanak Kakwani (2008), “Global Estimates of Pro-Poor Growth”, World Development, 36,6, pp.1048-1066
World Bank (2013), http://info.worldbank.org/governance/wgi/pdf/ge.pdf. (Worldwide Governance Indicators Concept Measured. (accessed 19 August 2012)
World Bank (2013), World Development Indicator 2013, http://data.worldbank.org/data-catalog/world-development-indicators (accessed 28 March 2013)

159Inclusive Development in Thailand: An Assessment 159
APPENDIX 1
Poverty Equivalence Growth Rate
To analyse pro-poor growth in Thailand, we adopt a poverty equivalent growth rate (PEGR) featured in Kakwani and Son (2008) and Son and Kakwani (2008). We briefly provide a conceptual framework below.
Following Kakwani and Son (2008), we assume that the income x of an individual has a density function f(x), and z is the poverty line. A general class of additively decomposable poverty measures can be written as
(1)
Where p(z, x) is a homogenous function of degree zero in z and x.12 A growth rate (percentage change) of the poverty measure is
(2)
Assuming that p equals the cumulative distribution function of x, p= F(x), we can rewrite (2) as
(3)
Where is the growth rate of income of the population at the pth percentile.
Let L(p) be the Lorenz function measuring the share of total income acquired by the bottom pth percentile of population (individuals are arranged in an ascending order with respect to their income). Following Kakwani (1980), we can write
x(p) = μL’(p) (4)
Where μ is the mean income of the population, and L’(p) is the slope of the Lorenz curve. Taking the logarithm of (4) and then differentiating it, we have
g(p) = γ + dln L’(p) (5)
Where γ = dlnμ is the growth rate of the mean income of the population. Substituting (5) into (2) and rearranging terms, we have
(6)
Dividing both sides of (6) by the growth rate of mean income, γ, we can rewrite (6) as
P = G + I (7)
12 If we substitute p(z,x)=(z-x)/z)^α, where α is the parameter of inequality aversion, the Foster-Greer-Thorbecke poverty measure is obtained from equation (1). When α=0,1,2, the poverty measure yields the headcount ratio, the poverty gap ratio and the severity of poverty respectively.

160 Inclusive Development in Thailand: An Assessment
is the growth elasticity of poverty, which is the percentage change in poverty resulting from a 1 percentage point change in the growth rate of mean income. The growth elasticity of poverty is decomposed into two factors. The first factor is the income growth effect, G = 1
∫0
∂p x(p)dp. This measures how poverty responds to the
change in income growth rate, given that the income inequality is unchanged during the growth process (i.e. everyone’s income changes by the same proportion). In this context, the larger income growth rate would result in a greater reduction in poverty. Thus, the income growth effect is always negative. This factor is called the neutral growth elasticity of poverty in Kakwani (1993).
The second factor is the inequality effect, I = 1
∫0
∂p x(p)dln L’(p)dp. That is the change in
poverty due to the change in relative income inequality occurring during the growth process. Kakwani and Son (2008) define that growth as pro-poor (anti-poor) if the change in inequality that accompanies the growth reduces (increases) poverty. Therefore, growth is pro-poor (anti-poor) if the growth elasticity of poverty is greater (less) than the neutral growth elasticity of poverty. In other words, growth is pro-poor (in a relative sense) if Ø = (P/G) > 1. During a recession, a negative growth rate, growth is pro-poor (in relative sense) if Ø = (P/G) < 1. Ø = (P/G) = 1 implies neutral growth with everyone receiving the proportionally same benefit.
Kakwani and Son (2008) and Son and Kakwani (2008) define the poverty equivalent growth rate, γ*, as the growth rate that will result in the same level of poverty reduction as the actual growth rate, γ, if the growth had not been accompanied by any change in inequality. That is
γ*G* = γP or γ* = (P/G*)γ = Ø*γ (8)
During a period of economic growth γ > 0 growth is pro-poor, in a relative sense, if Ø > 1 (I < 0), which implies that γ* > γ. During a period of recession (γ < 0), the negative growth is pro-poor if Ø < 1 (I > 0), which implies that γ* < γ.
Kakwani and Son (2008) define a growth process as pro-poor in an absolute sense when the absolute benefits of growth that the poor receive are equal or greater than the absolute benefits that the non-poor receive. Similarly to the relative pro-poor growth case, a neutral absolute growth elasticity of poverty is defined as the growth elasticity of poverty when the benefits of growth are equally distributed to everyone. The elasticity can be written as
(9)
where μ is the mean income. This elasticity measures how poverty responds to the change in the mean income, provided that everyone receives the same absolute benefits of growth. Moreover, G* > G implies that poverty reduction, in the case in which people receive equal absolute benefits, is always greater than the case in which people receive equal proportional benefits.

161Inclusive Development in Thailand: An Assessment 161
As in the case of absolute pro-poor growth, the poverty equivalent growth rate can be defined as the growth rate, γ*, that will result in the same level of poverty reduction as the actual growth rate, γ, if the growth has not been accompanied by any change in inequality. In the case of absolute pro-poor growth, the relationship between the poverty equivalent growth rate and the actual growth rate is
(10)
During a period of economic growth (γ > 0), the growth is pro-poor, in a relative sense, if Ø* > 1 (I < 0), which implies that γ* > γ. During a recession (γ < 0) , the negative growth is pro-poor if Ø* < 1 (I > 0), which implies that γ* < γ. Noticeably, since Ø is greater than Ø*, absolute pro-poor implies relative pro-poor, but not the other way around.
Data
The measure used in calculating the poverty equivalent growth rate is the poverty headcount ratio (the proportion of people with income below the national poverty line). Data used in calculating all measures of pro-poor growth are from the Socio-Economic Survey (SES) 1986-2009. The SES is a household survey conducted every two years, except 2006-09, when the survey was conducted annually. The poverty lines used to calculate all three measures are official poverty lines that take into account spatial price differences and needs that differ depending on household sizes and compositions. To calculate the pro-poor measures, we convert nominal income and poverty line to real variables.

162
Inclu
sive
Dev
elopm
ent i
n Th
ailan
d: A
n A
sses
smen
t
AP
PE
ND
IX 2
Mul
ti-Pi
llar S
ocial
Pro
tect
ion
Syst
em in
Tha
iland
, 201
113
13
Dat
a ar
e fo
r Dec
embe
r 201
1 un
less s
pecifi
ed o
ther
wise
, not
yet
inclu
ding
a n
umbe
r of
gove
rnm
ent s
chem
es th
at h
ave
not b
een
impl
emen
ted
in th
e se
cond
qua
rter o
f 20
12.
14
By th
e ca
bine
t res
olut
ion
of 1
8 O
ctob
er 2
011,
a st
eppe
d all
owan
ce (T
HB6
00 fo
r per
sons
age
d 60
-69,
TH
B700
for p
erso
ns a
ged
70-7
9; T
HB8
00 b
aht f
or p
erso
ns a
ged
80-
89,T
HB1
000
baht
for p
erso
ns 9
0 or
old
er) h
as b
een
appr
oved
but
will
not
be i
mpl
emen
ted
until
the A
nnua
l Exp
endi
ture
Bud
get L
aw o
f 20
12 h
as b
een
appr
oved
bec
ause
of
the
flood
crisi
s in t
he la
st qu
arte
r of 2
011.
How
ever
, the a
llow
ance
will
be re
troac
tive t
o Oct
ober
2011
. http
://w
ww.
m-s
ociet
y.go.
th/w
ebbo
ard/
show
.php
?Cat
egor
y=so
cial&
No=
1885
; ac
cess
ed 2
3032
012
Pilla
rs/
Char
acte
ristic
s Sc
hem
eFu
ndin
g/Re
spon
sible
Age
ncy
Parti
cipat
ion
Bene
fit T
ype
Zer
o p
illar
: Non
-co
ntrib
utor
y; un
iver
sal
or m
eans
-test
ed; m
inim
al lev
el of
pro
tect
ion;
“B
asic”
, “So
cial p
ensio
n”,
or so
cial a
ssist
ance
Old
er p
erso
ns a
llow
ance
Gen
eral
reve
nues
(DLA
)U
nive
rsal;
for p
erso
ns a
ged
60 o
r old
er w
ho d
o no
t hav
e ot
her i
ncom
e tra
nsfe
r (6.
8 m
illio
n)A
llow
ance
, TH
B500
ea
ch14
Floo
d/di
sast
er re
lief
(ad
hoc
2011
-12)
Gen
eral
reve
nues
(DLA
, MO
IN; B
MA
A
utho
rity)
Mea
ns-te
sted
Lum
p su
m
Free
tabl
et P
C fo
r stu
dent
sG
ener
al re
venu
es (M
OE
D)
Uni
vers
al (fo
r stu
dent
s in
elem
enta
ry p
ublic
scho
ol)
(1 m
illio
n se
ts)
Tabl
et P
C
Hea
ling
relie
f fo
r pol
itica
l pr
otes
ters
200
5 - 2
010
Gen
eral
reve
nues
(MO
I)M
eans
-test
ed; (
THB2
000
mill
ion)
Lu
mp
sum
Free
scho
olin
g fo
r 15
year
sG
ener
al re
venu
es(M
OE
D)
Uni
vers
al; sc
hool
ing
from
kin
derg
arte
n to
upp
er se
cond
ary
educ
atio
n, v
ocat
iona
l edu
catio
n an
d in
form
al ed
ucat
ion
(8,0
90,2
15 p
upils
)
In k
ind
(free
tuiti
on,
unifo
rm, e
duca
tion
acce
ssor
ies)
One
ID fo
r all
emer
genc
y m
edica
l tre
atm
ent
Gen
eral
reve
nue
(NH
SO)
Uni
vers
al; a
nat
iona
l ID
car
d ca
n be
use
d fo
r rec
eivin
g em
erge
ncy
med
ical t
reat
men
t in
any
hosp
ital w
ith a
n eq
ual
char
ge o
f TH
B10,
500p
er v
isit.
(All
mem
bers
ofN
HSO
, SSO
an
d Ci
vil S
ervi
ce M
edica
l Ben
efits
Sch
eme)
Disa
bilit
y Li
ving
Allo
wan
ceG
ener
al re
venu
es(M
SDH
S)M
eans
-teste
d: d
isabl
ed p
erso
n ha
ving d
isabi
lity I
D w
hose
m
onth
ly in
com
e is l
ess t
han
THB1
243
is en
titled
to T
HB5
00
baht
a m
onth
(835
,062
recip
ients)
Allo
wan
ce

163
Inclu
sive
Dev
elopm
ent i
n Th
ailan
d: A
n A
sses
smen
t16
3
AID
S pa
tient
allo
wan
ceG
ener
al re
venu
es(M
SDH
S)M
eans
-test
ed; A
IDS
patie
nts r
egist
ered
with
the
MSD
HS
get a
llow
ance
ofT
HB5
00 a
mon
th (4
855
recip
ients
)A
llow
ance
Ban-
man
-kon
g H
ousin
g Se
curit
y (s
lum
upg
radi
ng a
nd c
omm
unity
ut
ility
dev
elopm
ent)
Gen
eral
reve
nues
(CO
DI,
MSD
HS)
Mea
ns-te
sted:
land
less h
ome o
wne
rs (1
0% co
ntrib
utio
n to
th
e cos
t); sl
um u
pgra
ding
TH
B25,
000/
unit,
com
mun
ity u
tility
de
velo
pmen
t (sit
e and
serv
ice) T
HB3
0,00
0/co
mm
unity
(old
lan
d), T
HB5
0,00
0/co
mm
unity
(new
land
) (94
,852
uni
ts)
Lum
p su
m
Firs
t hou
se p
rojec
tG
ener
al re
venu
es (M
OF)
Mea
ns-te
sted
15Ta
x de
duct
ion
Firs
t car
Gen
eral
reve
nues
(MO
F)M
eans
-test
ed; a
ged
21 o
r old
er, n
ever
bou
ght a
car
; effe
ctiv
e da
te 1
Oct
ober
201
1-31
Dec
embe
r 201
2 (6
800
units
)Ta
x re
bate
Stud
ent l
oan
Gen
eral
reve
nues
(MO
ED
)Vo
lunt
ary,
mea
ns-te
sted
: fam
ily in
com
e no
t mor
e th
an
THB2
00,0
00 p
er y
ear (
3,56
6,20
3 st
uden
ts )
Lum
p su
m
(acc
ordi
ng to
leve
l of
edu
catio
n)Sc
hool
milk
Gen
eral
reve
nues
(DLA
; BM
A a
utho
rity;
RPF)
U
nive
rsal
(stu
dent
s fro
m k
inde
rgar
ten
to g
rade
6):
(8,1
37,9
20 st
uden
ts)
In k
ind
(milk
)
Scho
ol lu
nch
in p
rimar
y sc
hool
Gen
eral
reve
nues
(Sch
ool
Lunc
h Fo
unda
tion,
MO
ED;
DLA
)
Uni
vers
al (p
rimar
y sc
hool
stud
ents
):In
kin
d (lu
nch)
Wom
en’s
Fund
Gen
eral
reve
nues
(PO
)Vo
lunt
ary,
mea
ns-te
sted
: Tha
i wom
en a
ged
15 o
r old
er, o
r wo
men
’s fo
unda
tion/
asso
ciatio
n op
erat
ing
for n
ot le
ss th
an
6 m
onth
s (st
arts
in 2
012,
no
bene
ficiar
ies)
Soft
loan
(T
HB1
00 m
illio
n/
prov
ince
)
Fir
st p
illar
: Con
tribu
tion
syst
em; p
ublic
ly m
anag
ed
plan
; pub
lic m
anda
ted;
pu
blic
pens
ion
plan
, pu
blicl
y m
anag
ed, d
efine
d be
nefit
or n
otio
nal d
efine
d co
ntrib
utio
n
Form
er g
over
nmen
t pen
sion
(bef
ore
1997
non
-con
tribu
tory
, pu
blicl
y m
anag
ed)
Gen
eral
reve
nues
(MO
F)m
anda
ted;
(c
entra
l civ
il se
rvan
ts 3
1,72
1,77
2; g
over
nmen
t em
ploy
ees
221,
553;
loca
l civ
il se
rvan
ts 2
15,8
73)
Pens
ion
or lu
mp
sum
Socia
l Sec
urity
Sys
tem
(Arti
cle
33) (
SSF
is pu
blicl
y m
anag
ed)
Cont
ribut
ions
(5%
from
em
ploy
ee,5
%fro
m em
ploy
er
and2
.75
% fr
om th
e go
vern
men
t) (S
SO)
man
date
d: (9
,054
,535
insu
red
empl
oyee
s)
7 be
nefit
s inc
ludi
ng
old
age
bene
fit
(lum
p su
m/p
ensio
n)
15
Onl
y ta
xpay
ers,
first
hou
se n
ot m
ore
than
TH
B5 m
illio
n, g
et T
HB0
.3 m
illio
n ta
x de
duct
ion
for 5
yea
rs.
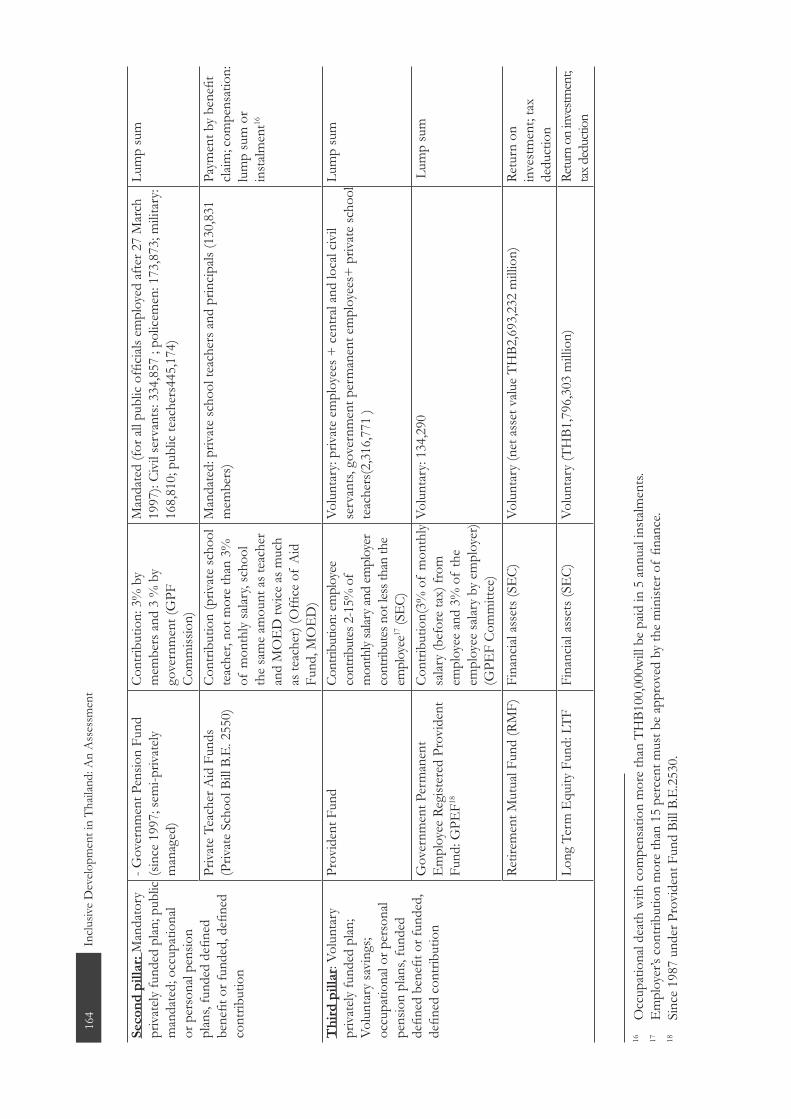
164
Inclu
sive
Dev
elopm
ent i
n Th
ailan
d: A
n A
sses
smen
t
Seco
nd
pill
ar: M
anda
tory
pr
ivat
ely fu
nded
plan
; pub
lic
man
date
d; o
ccup
atio
nal
or p
erso
nal p
ensio
n pl
ans,
fund
ed d
efine
d be
nefit
or f
unde
d, d
efine
d co
ntrib
utio
n
- Gov
ernm
ent P
ensio
n Fu
nd
(sin
ce 1
997;
sem
i-priv
ately
m
anag
ed)
Cont
ribut
ion:
3%
by
mem
bers
and
3 %
by
gove
rnm
ent (
GPF
Co
mm
issio
n)
Man
date
d (fo
r all
publ
ic of
ficial
s em
ploy
ed a
fter 2
7 M
arch
19
97):
Civi
l ser
vant
s: 33
4,85
7 ; p
olice
men
: 173
,873
; mili
tary
: 16
8,81
0; p
ublic
teac
hers
445,
174)
Lum
p su
m
Priv
ate
Teac
her A
id F
unds
(P
rivat
e Sc
hool
Bill
B.E
. 255
0)Co
ntrib
utio
n (p
rivat
e sc
hool
te
ache
r, no
t mor
e th
an 3
%
of m
onth
ly sa
lary,
scho
ol
the
sam
e am
ount
as t
each
er
and
MO
ED
twice
as m
uch
as te
ache
r) (O
ffice
of
Aid
Fu
nd, M
OE
D)
Man
date
d: p
rivat
e sc
hool
teac
hers
and
prin
cipals
(130
,831
m
embe
rs)
Paym
ent b
y be
nefit
cla
im; c
ompe
nsat
ion:
lu
mp
sum
or
inst
almen
t16
Th
ird
pill
ar: V
olun
tary
pr
ivat
ely fu
nded
plan
; Vo
lunt
ary
savi
ngs;
occu
patio
nal o
r per
sona
l pe
nsio
n pl
ans,
fund
ed
defin
ed b
enefi
t or f
unde
d,
defin
ed c
ontri
butio
n
Prov
iden
t Fun
dCo
ntrib
utio
n: em
ploy
ee
cont
ribut
es 2
-15%
of
mon
thly
salar
y and
empl
oyer
co
ntrib
utes
not
less
than
the
empl
oyee
17 (S
EC)
Volu
ntar
y: pr
ivat
e em
ploy
ees +
cen
tral a
nd lo
cal c
ivil
serv
ants,
gov
ernm
ent p
erm
anen
t em
ploy
ees+
priv
ate
scho
ol
teac
hers
(2,3
16,7
71 )
Lum
p su
m
Gov
ernm
ent P
erm
anen
t E
mpl
oyee
Reg
ister
ed P
rovi
dent
Fu
nd: G
PEF18
Cont
ribut
ion(
3% o
f m
onth
ly sa
lary
(bef
ore
tax)
from
em
ploy
ee a
nd 3
% o
f th
e em
ploy
ee sa
lary
by e
mpl
oyer
)(G
PEF
Com
mitt
ee)
Volu
ntar
y: 13
4,29
0 L
ump
sum
Retir
emen
t Mut
ual F
und
(RM
F)Fi
nanc
ial a
sset
s (SE
C)Vo
lunt
ary
(net
ass
et v
alue
THB2
,693
,232
mill
ion)
Retu
rn o
n in
vest
men
t; ta
x de
duct
ion
Long
Ter
m E
quity
Fun
d: L
TFFi
nanc
ial a
sset
s (SE
C)Vo
lunt
ary
(TH
B1,7
96,3
03 m
illio
n)Re
turn
on
inves
tmen
t;tax
ded
uctio
n
16
Occ
upat
iona
l dea
th w
ith c
ompe
nsat
ion
mor
e th
an T
HB1
00,0
00w
ill b
e pa
id in
5 a
nnua
l ins
talm
ents.
17
E
mpl
oyer
’s co
ntrib
utio
n m
ore
than
15
perc
ent m
ust b
e ap
prov
ed b
y th
e m
inist
er o
f fin
ance
.18
Si
nce
1987
und
er P
rovi
dent
Fun
d Bi
ll B.
E.2
530.
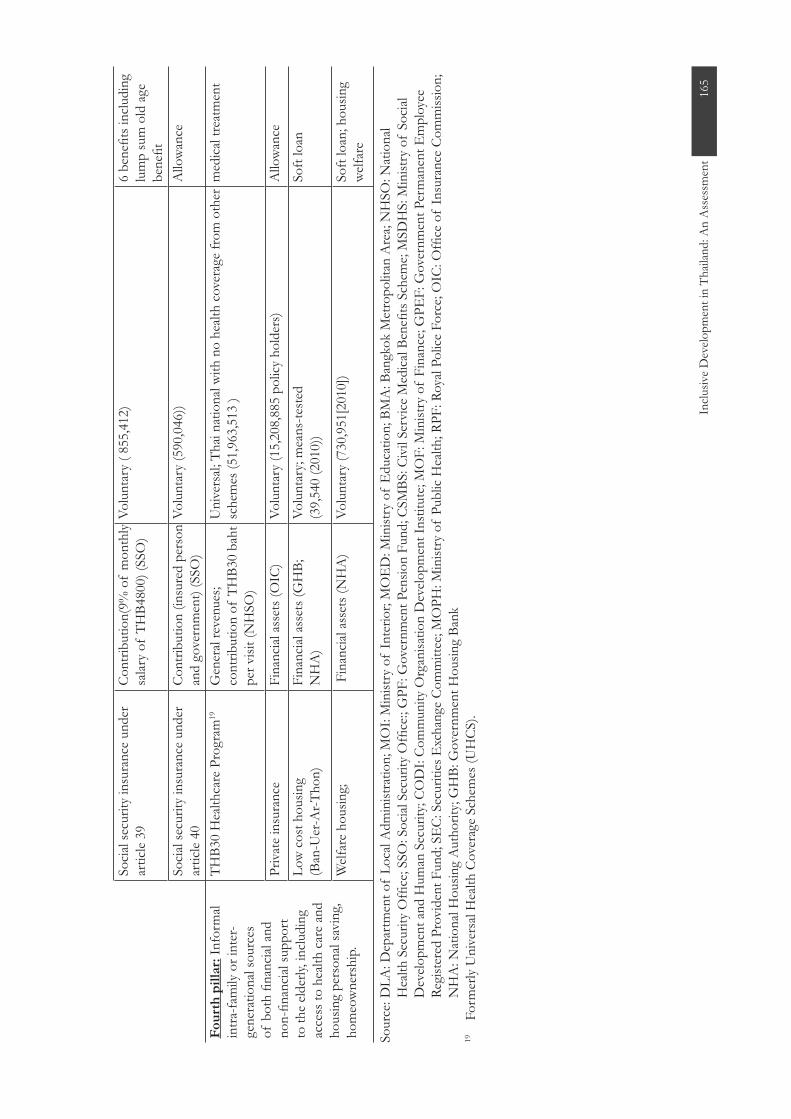
165
Inclu
sive
Dev
elopm
ent i
n Th
ailan
d: A
n A
sses
smen
t16
5
Fou
rth
pill
ar: I
nfor
mal
intra
-fam
ily o
r int
er-
gene
ratio
nal s
ourc
es
of b
oth
finan
cial a
nd
non-
finan
cial s
uppo
rt to
the
elder
ly, in
cludi
ng
acce
ss to
hea
lth c
are
and
hous
ing
pers
onal
savi
ng,
hom
eow
ners
hip.
THB3
0 H
ealth
care
Pro
gram
19G
ener
al re
venu
es;
cont
ribut
ion
of T
HB3
0 ba
ht
per v
isit (
NH
SO)
Uni
vers
al; T
hai n
atio
nal w
ith n
o he
alth
cove
rage
from
oth
er
sche
mes
(51,
963,
513
)m
edica
l tre
atm
ent
Priv
ate
insu
ranc
eFi
nanc
ial a
sset
s (O
IC)
Volu
ntar
y (1
5,20
8,88
5 po
licy
hold
ers)
Allo
wan
ce
Low
cos
t hou
sing
(Ban
-Uer
-Ar-T
hon)
Fina
ncial
ass
ets (
GH
B;
NH
A)
Volu
ntar
y; m
eans
-test
ed(3
9,54
0 (2
010)
)So
ft lo
an
Welf
are
hous
ing;
Fin
ancia
l ass
ets (
NH
A)
Volu
ntar
y (7
30,9
51[2
010]
)So
ft lo
an; h
ousin
g w
elfar
e
Sour
ce: D
LA: D
epar
tmen
t of
Loca
l Adm
inist
ratio
n; M
OI:
Min
istry
of
Inte
rior;
MO
ED
: Min
istry
of
Edu
catio
n; B
MA
: Ban
gkok
Met
ropo
litan
Are
a; N
HSO
: Nat
iona
l H
ealth
Sec
urity
Offi
ce; S
SO: S
ocial
Sec
urity
Offi
ce:;
GPF
: Gov
ernm
ent P
ensio
n Fu
nd; C
SMBS
: Civ
il Se
rvice
Med
ical B
enefi
ts S
chem
e; M
SDH
S: M
inist
ry o
f So
cial
Dev
elopm
ent a
nd H
uman
Sec
urity
; CO
DI:
Com
mun
ity O
rgan
isatio
n D
evelo
pmen
t Ins
titut
e; M
OF:
Min
istry
of
Fina
nce;
GPE
F: G
over
nmen
t Per
man
ent E
mpl
oyee
Re
gist
ered
Pro
vide
nt F
und;
SE
C: S
ecur
ities
Exc
hang
e Co
mm
ittee
; MO
PH: M
inist
ry o
f Pu
blic
Hea
lth; R
PF: R
oyal
Polic
e Fo
rce;
OIC
: Offi
ce o
f In
sura
nce
Com
miss
ion;
N
HA
: Nat
iona
l Hou
sing
Aut
horit
y; G
HB:
Gov
ernm
ent H
ousin
g Ba
nk19
Fo
rmer
ly U
nive
rsal
Hea
lth C
over
age
Sche
mes
(UH
CS).
Socia
l sec
urity
insu
ranc
e un
der
artic
le 39
Cont
ribut
ion(
9% o
f m
onth
ly sa
lary
of T
HB4
800)
(SSO
)Vo
lunt
ary
( 855
,412
)6
bene
fits i
nclu
ding
lu
mp
sum
old
age
be
nefit
Socia
l sec
urity
insu
ranc
e un
der
artic
le 40
Cont
ribut
ion
(insu
red
pers
on
and
gove
rnm
ent)
(SSO
)Vo
lunt
ary
(590
,046
))A
llow
ance

166 Inclusive Development in Thailand: An Assessment
Social Security Fund Benefits in Thailand, 2011
TypeEligibility Requirement
Benefits
Sickness benefits (non-work-related sickness)
Have paid contributions for 3 months of the previous 15 months.
Free in-patient and out-patient care in a registered hospital.Sickness compensation of 50 percent of monthly wages upon
physician’s certification. The maximum compensation is 90 days per request, and 180 days per calendar year. The maximum compensation for chronic disease illness is 365 days.
THB200 reimbursement for dental care (extraction, filling and tooth cleaning), twice a year.
Reimbursement for prostheses and related materials.Maternity benefits
Have paid contributions for 7 of the previous 15 months.
Lump sum payment of THB13,000 per birth.If both husband and wife are insured, the couple cannot claim
maternity benefits more than 4 times. Maternity compensation, 50 percent of 3-month average wages
for 90 days (only for female insured persons).Invalid benefits Have paid
contributions for 3 of the previous 15 months.
A lifetime invalid compensation, 50 percent of monthly wages.In case of receiving medical treatment from private hospital, the
insured person can claim the actual payment but not more than THB2000 per month for out-patient and THB4000 per month for in-patient.
Lump sum of not more than THB5000 per month for ambulance or car transportation.
If the insured person becomes crippled and needs to be rehabilitated at the rehabilitation centre, he/she will receive a rehabilitation fee of THB40,000.
A funeral grant equal to THB40,000 when the beneficiary dies.Compensation equal to 1.5 times the monthly wages payable to
relatives if the dead or invalid persons had paid contributions for 36-119 months, or 5 times the monthly wages if they had paid contributions for 120 months.
Death and survivors’ benefits
Have paid contribution for 1 month out of the previous 6 months.
Lump sum payment of THB40,000for funeral arrangements.Compensation equal to 1.5 times the monthly wages payable to
relatives if the dead insured person had paid contributions for 36-119 months, or 5 times the monthly wages if they had paid contributions for 120 months.
Child allowances
Have paid contributions for 12 of the previous 36 months.
Child allowance of THB400 per child aged 0-6 for a maximum of 2 children.
The child allowance eligibility status is not ended upon the death of an insured person.
Child allowance is valid for legitimate child only from the day he/she was born until 6 years old, not more than 2 children at a time.

167Inclusive Development in Thailand: An Assessment 167
TypeEligibility Requirement
Benefits
Old-age benefits
Have paid contributions for at least 180 months, and had retired at the age of 55 or older.
A pension equal to 20 percent of average of 60 months’ wages.1.5 percentage point increase for every 12 months of additional
contribution.Compensation (10 times the monthly pension) payable to relatives
if the pensioner dies within 60 months of retirement.Lump sum equal to employee’s contribution payable to the retiree
(aged 55 and older) who has been contributing for fewer than 12 months.
Lump sum equal to employee’s and employer’s contribution plus interest accrued on that amount, payable to the retiree who has contributed for more than 12 months but fewer than 180 months.
Lump sum in which the amount depends on the period of contribution and base income, payable to relatives of an insured person who dies before the age of 55.
Unemployment Insurance
Have paid contributions for 6 of the previous 15 months.
For involuntary unemployed, the replacement rate is 50 percent of the highest three-month average wages in the last nine months. The maximum duration to receive the benefit is 180 days in a calendar year.
For those voluntarily unemployed, the replacement rate is 30 percent of the highest three-month average wages in the last nine months. The maximum duration to receive the benefit is 90 days in a calendar year.
Insurance under Article 39
Have been insured under Article 33 and contributed not less than 12 months and left the old job less than 6 months.
Calculation of contribution rate = 9 percent of THB4800; insured person under Article 39 receives the same 6 benefits as under Article 33 except unemployment benefits.
Insurance under Article 40
“Voluntary insurance”, not waged employee under Article 33 or insured under Article 39.
Benefit type 1: Contribution THB100/month (THB70 by the insured and THB30 by the government). Sickness benefit, handicapped benefit and funeral benefit.
Benefit type 2:ContributionTHB150/month (THB100 by the insured and THB50 by the government). Sickness benefit, handicapped benefit, funeral benefit and retirement benefit.
Basic benefits: Sickness benefit: When sick and hospitalised for more than 2
days, compensation of THB200/day for not more than 20days; (condition: have contributed for 3 months within the past 4 using medical card (gold card) under NHSO).
Invalid benefit: Compensation of THB500-1000/month for up to 15 years (condition: have contributed for 6 months at least and certified as being crippled by the medical committee of the SSO).
Funeral benefit: THB20,000 (condition: have contributed for at least 6 months during the 12 month period).
Retirement benefit: Lump sum at age 60.Source: Updated from Chandoevwit 2006 with data from Social Security Office
Chapter 5Inclusive Development
in Vietnam: An Assessmentby Nguyen Thi Kim Dung, Tran Trung Hieu and Do Son Tung

169Inclusive Development in Vietnam: An Assessment 169
1. INTRODUCTION
1.1. Background and Rationale
In Vietnam, Doi Moi (economic reform) has achieved significant economic and social development. Over the last decade, the economy has grown quickly, with annual average gross domestic product increase of around 7.2 percent. Although the rise in food prices and world financial crisis caused the growth rate to decline, it remained at nearly 6.0 percent during 2008-10. GDP in 2010 was USD106 billion, 3.4 times higher than in 2000.Vietnam has moved from a least developed country to the middle income group.
At the same time, the country has made a remarkable improvement to incomes and poverty rates. The poverty rate was reduced from 58.1 percent in 1993 to 13.4 percent in 2008 and 10.7 percent in 2010 by the poverty line applicable for 2006-10.1 Per capita income has steadily increased, reaching USD1000 in 2008 and USD1110 in 2010. Vietnam has well exceeded the Millennium Development Goal of halving the proportion of people living on less than one dollar a day between 1990 and 2015. The country has also witnessed a remarkable improvement in a number of social development indicators, especially in education and health.
However, a large gap remains between urban and rural areas, and there is a high poverty incidence in mountainous areas, especially among ethnic minorities. The highest poverty incidence in 2010 was recorded in the northern midlands and mountain areas (29.4 percent), followed by central highlands (22.2 percent) and north central and central coastal areas (20.4 percent). Moreover, in 2010, the poverty incidence among ethnic minorities was 66.3 percent, much higher than the rate of the largest groups, Kinh and Chinese (12.9 percent). While accounting for one-eighth of the total population, ethnic minorities make up over 50 percent of the poor, especially in terms of food poverty (MPI, 2008). Harsh natural conditions, unpredictable weather, limited access to major social services and lack of market access are among the factors that have negatively impacted ethnic minorities in mountainous and geographically remote communes and villages. These remaining poor increasingly perceive it as difficult to move out of poverty.
Although Vietnam’s inequality levels are generally low compared with many other countries (average Gini coefficient around 0.37), the income disparity continues to widen and can dampen the poverty impact of economic growth or even undermine economic growth itself. Challenges to equitable social and economic development are exacerbated by the global financial crisis, which is straining government spending in key social sectors. Vietnam must meet the challenge of inequality without hindering future growth. The country can do this through efficient fiscal measures, promotion of geographical and regional balance and making growth more pro-poor.
1 This number is 14.2 percent for year 2010 if measured by the new poverty line applied for the period 2011-15 (see section 3.1 for more detail).

170 Inclusive Development in Vietnam: An Assessment
1.2. Objectives of the Study
The overall objective of this study is to assess the current state of inclusive growth in Vietnam in order to build knowledge and understanding and inform public policy on the issues.
The specific objectives include:
Identifying variables to measure the inclusiveness of growth;•
Identifying main obstacles to greater inclusion and poverty reduction.•
1.3. Research Approach and Methodology
1.3.1. Definition of Poverty and Inclusiveness
The traditional definition of poverty in Vietnam is narrowly based on household income or consumption expenditure. In particular, up to 2004, there were two popular methods to measure poverty incidence: one promulgated by the General Statistics Office (GSO) distinguished between “food poverty” and “general poverty”. The food poverty line was calculated as the expenditure required, given Vietnamese food consumption patterns, to deliver 2,100 calories per person per day. The general poverty line was measured as the food poverty line plus a minimum quantum of non-food expenditure. Another measure, applied by the Ministry of Labour, Invalids and Social Affairs (MOLISA) was an income equivalent to VND80,000 per person per month in upland rural areas, VND100,000 in lowland rural areas and VND150,000 in cities and towns for 2001-05. However, in late 2004 the GSO changed its measurement. Persons are now considered poor if their income in a month falls below certain amounts, with a distinction only between rural and urban areas. For 2006-10, the poverty line was set at VND200,000/person/month for rural areas and VND260,000 for urban areas. The corresponding figures for 2011-2015 were VND 400,000 and VND500,000, respectively.
In this report, we want to go beyond the traditional poverty definition to apply the non-monetary or multi-dimensional poverty criteria suggested by the World Bank (Bucknall et al. 2000) and supported by the Ministry of Planning and Investment (MPI) of Vietnam, which include a large number of other “non-income” dimensions:
Lack of opportunity: for instance, opportunity to sustain a livelihood, including • access to land, water, forest products or other natural resources, and to alternative income opportunities.
Lack of capacity: includes health, nutrition, education, hygiene and access to safe • drinking water.
Social exclusion: barriers preventing the poor from fully participating in the social • mainstream, including corruption, lack of access to law- and decision-making and discrimination on the basis of gender, ethnicity or stigma.
Gender discrimination: social norms and traditions reflected in aspects such as • workload, employment, health, domestic violence and access to decision-making and power structures.
171Inclusive Development in Vietnam: An Assessment 171
Lack of good governance: including participation, transparency, accountability, • efficiency and effectiveness.
Vulnerability: to natural disasters or to physical isolation in remote areas (Bucknall, • Kraus & Pillai, 2000).
Because of their strong links to poverty, these dimensions are particularly relevant to the analysis of inclusiveness. Weak governance and capacity have a disproportionate impact on the poor. Improvements in governance, capacity and social inclusion are therefore essential for poverty reduction.
At the same time, acknowledging the Asian Development Bank definition of “inclusive growth”, this report understands inclusiveness as built on two reinforcing concepts. High rates of sustainable growth will create and expand economic opportunities, while broader access to these opportunities will ensure that members of the society can participate and benefit. Growth is inclusive when it is equitable and accompanied by a reduction of poverty.
1.3.2. Scope and Methodology
With that in mind, assessment of economic inclusiveness in Vietnam is based on the analytical framework designed by the Development Analysis Network 9 team, which consists of three core components (Figure 1). The framework implies that inclusive growth is not only about creating and enlarging economic opportunities but also making these opportunities equitably available and enhancing participation in, contribution to and benefit from progress.
The first component, the income dimension, examines the evolution of the poverty profile during the last decade. Using a number of standard measurements such as poverty headcount, poverty severity indices, Gini coefficient and Theil’s indices, current poverty and inequality are examined. These are estimated for sub-groups by ethnicity, industrial sector, gender and region.
Non-income dimensions of poverty and inequality are also examined. The main argument for inclusion of these dimensions in a discussion of poverty is that growth and access to economic opportunities are very often unevenly distributed. Social safety nets and public service delivery are inadequate, and supporting institutions are insufficient. In this section, non-monetary aspects of sustainable and inclusive growth such as education, health, nutrition, gender equity and access to productive employment are investigated, using the most up-to-date data.
The last component tries to index all variables of interest using McKinley’s (2010) index, in which different weights and scores are given to four components significant for inclusive growth.
Data for income and expenditure poverty profiles is collected from two main sources, using the national poverty line and international comparative measures on a time-series basis. The first source is the Vietnam Household Living Standards Surveys (VHLSS). The surveys have been carried out by the GSO every two years to generate poverty estimates for six regions. The second data source is generated by MOLISA, which
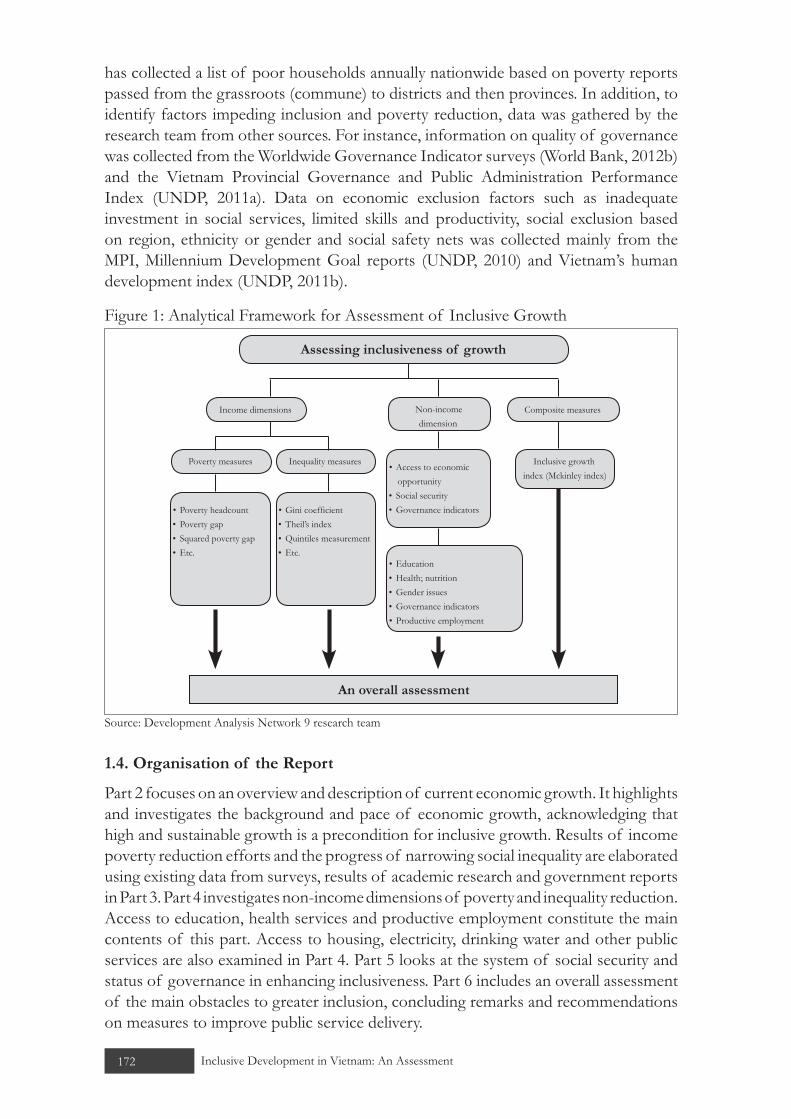
172 Inclusive Development in Vietnam: An Assessment
has collected a list of poor households annually nationwide based on poverty reports passed from the grassroots (commune) to districts and then provinces. In addition, to identify factors impeding inclusion and poverty reduction, data was gathered by the research team from other sources. For instance, information on quality of governance was collected from the Worldwide Governance Indicator surveys (World Bank, 2012b) and the Vietnam Provincial Governance and Public Administration Performance Index (UNDP, 2011a). Data on economic exclusion factors such as inadequate investment in social services, limited skills and productivity, social exclusion based on region, ethnicity or gender and social safety nets was collected mainly from the MPI, Millennium Development Goal reports (UNDP, 2010) and Vietnam’s human development index (UNDP, 2011b).
Figure 1: Analytical Framework for Assessment of Inclusive Growth
An overall assessment
Inequality measures
Gini coefficient• Theil’s index• Quintiles measurement• Etc.•
Poverty headcount• Poverty gap• Squared poverty gap • Etc. •
Access to economic • opportunitySocial security• Governance indicators•
Education • Health; nutrition• Gender issues• Governance indicators• Productive employment•
Inclusive growth index (Mckinley index)
Poverty measures
Income dimensions Non-income dimension
Composite measures
Source: Development Analysis Network 9 research team
1.4. Organisation of the Report
Part 2 focuses on an overview and description of current economic growth. It highlights and investigates the background and pace of economic growth, acknowledging that high and sustainable growth is a precondition for inclusive growth. Results of income poverty reduction efforts and the progress of narrowing social inequality are elaborated using existing data from surveys, results of academic research and government reports in Part 3. Part 4 investigates non-income dimensions of poverty and inequality reduction. Access to education, health services and productive employment constitute the main contents of this part. Access to housing, electricity, drinking water and other public services are also examined in Part 4. Part 5 looks at the system of social security and status of governance in enhancing inclusiveness. Part 6 includes an overall assessment of the main obstacles to greater inclusion, concluding remarks and recommendations on measures to improve public service delivery.

173Inclusive Development in Vietnam: An Assessment 173
2. CURRENT STATE OF ECONOMY
2.1. Rapid Growth
Vietnam has enjoyed rapid economic growth since the gradual implementation of market-oriented economic reforms beginning in 1986. Real annual GDP growth averaged 7.4 percent between 1990 and 2010. Growth rates slowed in response to the Asian financial crisis in the late 1990s, and the global financial crisis in 2008 and 2009, but subsequently returned to higher levels (Figure 2).
While early reform of the partial command economy removed distortions and restored household incentives in agriculture, growth in industry and services has been, and continues to be, largely responsible for the rapid economic growth. This is reflected in the different sectoral growth rates, which have led to a significant change in the structure of GDP. In 1990 agriculture accounted for 32 percent of GDP, industry 25 percent and services 43 percent. In 2010, agriculture accounted for 16 percent, and industry and services for 42 percent each.
In 2010-11, the economy still attained moderate growth. Quarterly year-on-year economic growth tended to increase throughout these years. In 2010, annual GDP growth reached 5.84 percent in the first quarter, 6.44 percent in the second quarter, 7.16 percent in the third quarter and 7.34 percent in the fourth quarter. Overall, GDP rose by 6.78 percent in the same year (CIEM, 2011). These results are partly attributed to measures for macroeconomic stabilisation, development promotion and support for production and business.2
Figure 2: GDP Growth, Aggregate and by Major Sectors, 1990-2010
TotalAgriculture, fisheries, forestryIndustry and constructionServices
1991 1994 1997 2000 2003 2006 2009
16
14
12
10
8
6
4
2
0
Gro
wth
in re
al G
DP
(%)
Source: GSO, various years
2 For example, Resolution 03/NQ-CP of the government dated 15 January 2010 on measures to implement the SEDP and state budget for 2010; Resolution No. 18/NQ-CP, dated 6 April 2010, on measures to ensure macroeconomic stability, prevent high inflation and achieve an economic growth rate of 6.5 percent in 2010.

174 Inclusive Development in Vietnam: An Assessment
Growth in added-value has exceeded population growth by a significant margin; thus GDP per capita has increased from around $402 in 2000 to $1224 in 2010. As a result, Vietnam has been officially recognised as a middle-income country since 2009.
Table 1: GDP per Capita 1990-2010Years 1990 1995 2000 2005 2010
GDP per capita (Constant VND thousand)
1997 2716 3525 4770 6346
GDP per capita (Current USD)
98 288 402 642 1224
Period 1990-95 1995-2000 2000-05 2005-10 1990-2010
Annual average growth rate of GDP per capita (%)
6.35 5.36 6.24 5.88 5.96
Sources: World Development Indicators database 2012, GSO 2012
2.2. Macroeconomic Instability and Protection of the Poor
The global economic crisis and instability in foreign exchange markets, over-reliance on investment-led growth, accession to the World Trade Organisation and an influx of foreign exchange in 2007-08 have posed great challenges to Vietnam’s macroeconomic stability and control of inflation. Various “waves” of high inflation have hit the country since 2008, notably in the first half of 2008 and of 2010. The first four months of 2011 also witnessed a steep rise in inflation and instability in financial markets, with increased prices of food, fuel and overall cost of living that affected families and businesses.
Inflation has a larger impact on the poor and vulnerable than it does on better-off households, because poor households devote a much higher proportion of their expenditure to food and other essential items.3 Inflation also affects the ability of the poor and vulnerable to fund out-of-pocket costs for health care, as limited incomes are stretched to cover other essential items. In urban areas, poor migrant workers, pensioners and those with low wages or informal sector jobs are among the most affected by price increases on a wide range of goods and services including food, electricity, fuel, transportation and housing. Among the rural poor, net food buyers are most affected. Even if some net food producers benefit from higher food prices, these benefits are offset by the rising costs of inputs. Rural households’ income from agriculture does not increase in parallel with rising input costs during periods of higher inflation (VASS, 2011). Rising food prices also impact on food security. This was notable during 2007-08 and the first few months of 2011. Estimates by MPI show that 838,600 agricultural household members experienced hunger in the first two months of 2011, the highest number since 2007 and nearly double the number in the same period of 2010. The long-lasting inflation also negatively affected employment, industrial relations and working conditions. The financial crisis and the period of high inflation during 2008 corresponded with a decrease in secure employment. The proportion of workers on secure contracts declined between the
3 According to the 2008 Vietnam Household Living Standards Survey, the poorest quintile devoted 65 percent of their expenditure to food, compared with 45 percent for the richest quintile.
175Inclusive Development in Vietnam: An Assessment 175
labour force studies in 2007 and 2009, while workers on “oral contracts” or with no contract increased from 42 to almost 45 percent. Since the beginning of 2011, there has been a significant increase in the number of strikes (more than 200 strikes were reported in the first quarter of 2011). Most of these strikes were a consequence of declining real wages caused by rising prices.
In order to re-establish macroeconomic stability, the government promulgated Resolution No. 11/NQ-CP on “Key solutions for inflation control, macroeconomic stabilisation and ensuring social welfare”. The policy, dated 24 February 2011, contains a wide range of bold, mutually reinforcing and consistent monetary and fiscal policy targets, and commits the government to undertake structural measures including reform of state-owned enterprises, improving communication with the market and protecting poor people from future macroeconomic instability. Specific measures such as that of “synchronously deploy social welfare policies under the existing programs, projects, plans”, “focus on assisting poverty reduction at local level, particularly in extremely poor communes, villages” and “fully and timely implement regulations on assistance to…people with particularly difficult living conditions” were promulgated. This was the first time in a long while that issues of social welfare were given a higher priority than short-term economic growth.
Despite initial scepticism, the measures adopted under Resolution No.11 have started to show good results. Inflation has been brought down to a stable single-digit rate. The foreign exchange premium is eliminated, and international reserves are adequate to finance at least 2.5 months of imports. However, reforms of state-owned enterprises have not been fully spelled out, and measures aimed at better communication with the market have been slow and hesitant. Up-to-date information on the effectiveness and impact of the measures to strengthen social welfare of the poor is limited.
Although Vietnam has responded decisively to curb inflation and regain macroeconomic stability, greater efforts to restructure the economy, reform state-owned enterprises and reduce ineffective public expenditure are needed to ensure sustainable macroeconomic balance and continued broad-based socio-economic development.
3. POVERTY REDUCTION AND INEQUALITY
3.1. Income Poverty Reduction
Within more than two decades of economic reforms, poverty reduction has been a long-time target and policy priority in the socio-economic development framework, including (1) production support via preferential loans, land re-allocation to poor and ethnic minority households, agricultural extension, handicraft promotion and labour export; (2) increased access to education, health care, vocational training, housing, drinking water and legal assistance; (3) essential infrastructure development for communes/villages in economically extremely difficult areas. In parallel with economic development, these efforts contributed to bringing more than 43 million people out of poverty during 1993-2008.

176 Inclusive Development in Vietnam: An Assessment
In September 2010, Vietnam announced new official poverty lines for different areas; the rate for urban areas was raised to VND500,000/person/month ($1.61/person/day 2005 PPP), and for rural areas increased to VND400,000/person/month ($1.29/person/day 2005 PPP). Accordingly, the country reported a general poverty rate4 of 14.2 percent for 2010, up around 2 percent from 2008 (due to the newly announced poverty line). After that, the rate went down to 12.6 percent in 2011, reflecting the government’s Socio-Economic Development Plan (SEDP) for 2011-15.
Figure 3: General, Rural and Urban Poverty Rate, 1998-2010
50.0
45.0
40.0
35.0
30.0
25.0
20.0
15.0
10.0
5.0
01998 2002 2004 2006 2008 2010
9.0
44.9
37.4
28.9
18.115.5 13.4 14.2
6.6
35.6
8.6
21.2
7.7
18.0
6.7
16.1
6.9
17.4
Urban Rural General poverty rate
Source: GSO 2012
From 1998 to 2010, poverty fell dramatically, but at uneven rates in different areas. The poor are becoming more concentrated in rural areas, whereas rapid poverty reduction is observed in fast-growing urban areas (around Hanoi and Ho Chi Minh City). Poverty is still predominantly a rural problem; in 2010 more than 90 percent of the poor were found in rural areas, and the share of rural people among the extremely poor was 94 percent (World Bank 2012c: 62).
3.1.1. Depth and Severity
Although the poverty line is a common method of measuring poverty, it ignores the fact that not all poor people are the same. Some have income or consumption very
4 The poverty rate is related to the monthly average income per capita of households. In 1998, the rate was based on a poverty line of VND149,000; in 2002 the number was VND160,000; in 2004, it was VND170,000 for rural areas and VND220,000 for urban areas, in 2006 VND200,000 for rural areas and VND260,000 for urban areas, in 2008 VND290,000 for rural areas and VND370,000 for urban areas, in 2010 VND400,000 for rural areas and VND500,000 for urban areas.
2004: VND170,000 for rural area and VND 220,000- for urban area.2006: VND 200,000 for rural area and VND260,000 for urban area2008: VND290,000 for rural area and VND370,000 for urban area.
In 2010, it is measured by the Governments poverty line for 2011-2015 period as follows:2010: VND400,000 for rural area and VND500,000 for urban are

177Inclusive Development in Vietnam: An Assessment 177
close to the poverty line, while others live in much worse conditions. Therefore, two other indicators are employed to measure the depth and severity of poverty. The poverty gap (depth) measures the average gap between the living standards of the poor and the poverty line. The squared poverty gap (severity) pays more attention to the extremely poor (well below the poverty line).
Overall, Vietnam can boast an impressive achievement in reducing the depth and severity of poverty. Table 2 shows the poverty gap and its severity from 1993 to 2010. The noticeable decline in all of the indices indicates that not only people near the poverty line but also the poorest enjoy a considerably improved standard of living.
Table 2: Depth and Severity of Poverty in Vietnam
Years
WB-GSO poverty line $1.25/day 2005 PPP line $2.00/day 2005 PPP lineDepth
(Poverty Gap, %)
Severity (Squared
Poverty Gap, %)
Depth (Poverty Gap, %)
Severity (Squared
Poverty Gap, %)
Depth (Poverty Gap, %)
Severity (Squared
Poverty Gap, %)
1993 18.5 7.9 23.6 11.0 43.5 25.7
1998 9.5 3.6 15.1 6.0 34.2 18.0
2002 7.0 2.4 11.2 4.1 28.0 14.1
2004 4.7 1.7 5.4 2.0 17.1 7.8
2006 3.8 1.4 4.2 1.5 13.9 6.2
2008 3.5 1.2 2.8 1.0 10.3 4.3
2010 5.9 2.4 0.9 0.3 4.3 1.7Source: World Bank 2012b: 8-9c: 8-9
3.1.2. Regional Poverty Gap
Although disparities exist, a downward trend of poverty is observed in all regions since 1998. The south-east and Red River delta regions performed far better than others, their poverty rates in 2010 being 2.3 and 8.3 percent, respectively, down from about 7.6 percent and 30.7 percent in 1998. The northern midlands and mountain areas were the poorest regions, with about one-third of the population below the poverty line (Figure 4)
Figure 4: Poverty by Geographical Region, 1998-2010
0.0
10.0
20.0
30.0
40.0
50.0
60.0
70.0
1998 2002 2004 2006 2008 2010
Red River Delta
Northern midlands and mountain areas
North Central area and Central coastal area
Central Highlands
South East
Source: GSO 2012

178 Inclusive Development in Vietnam: An Assessment
3.1.3. Poverty by Ethnicity
A decrease of poverty is also observed across ethnic groups. From 1993 to 2008, the poverty rate of both ethnic majority and minorities went down continuously before rising in 2010 due mostly to the modification of the poverty line (Figure 5).
However, the falling poverty rate of ethnic minorities did not narrow the gap between majority and minority groups. On the contrary, the gap seems to be widening, mostly due to unfavourable geographical conditions where ethnic minorities live (mountains or highlands). In these areas, infrastructure and living conditions are usually poor and out of date.
Figure 5: Poverty, by Ethnic Groups, 1993-2010
Pove
rty H
eadc
ount
s (%
)
0
10
20
30
40
50
60
70
80
90
100
1993 1998 2004 2006 2008 2010
Ethnic minority
Ethnic majority
All
Source: World Bank 2012b
Ethnic minorities make up only 15 percent of Vietnam’s population, but they are a much higher share of poor households. In 1993, when poverty was widespread, the share of ethnic minority groups in total poverty was only 20 percent. That increased to 29 percent in 1998 and 47 percent in 2010. Members of ethnic minorities are five times more likely to be poor than members of ethnic majority groups (Table 3).
Table 3: Composition of the Poor, by Ethnic Group, 1993-2010WB-GSO Poverty headcount (%) Composition of poverty (%)
Ethnic
minorityEthnic
majority AllEthnic
minorityEthnic
majority All1993 86.4 53.9 58.1 20 80 1001998 75.2 31.1 37.4 29 71 1002004 60.7 135 19.5 39 61 1002006 52.2 10.2 15.9 44 56 1002008 50.3 9 14.5 46 54 1002010 66.3 12.9 20.7 47 53 100
Source: World Bank 2012b: 22

179Inclusive Development in Vietnam: An Assessment 179
3.2. Income Inequality
Inclusiveness requires not only increased income for the poor, but also more equal distribution of the wealth gained from growth. In this section, measures of inequality are presented.
3.2.1. Gini Coefficient
As seen in the Figure 6, inequality has increased in the last two decades. The greatest increase of inequality occurred in 1993-2002, when the Gini coefficient rose from 0.33 to 0.37. For the last decade, this coefficient has fluctuated around 0.37.
Figure 6: Gini Coefficient for Expenditure, 1993-2010
1993 1998 2002 2004 2006 2008 2010
0.38
0.37
0.36
0.35
0.34
0.33
0.32
0.31
0.3
GINI coefficient
Source: Authors’ calculation based on VLHSS, various years.
3.2.2. Theil Indices
When Theil L and Theil T indices are considered, an upward trend in inequality is not clearly shown (Figure 7). Inequality increased in 1992-2002, from 0.20 to 0.25. Since then those indices have declined. Nevertheless, in 2010, both Theil L and Theil T indices remained slightly higher than they were in 1992.
Figure 7: Theil L and Theil T for Expenditure, 1993-2010
0
0.05
0.1
0.15
0.2
0.25
0.3
1992 1998 2002 2004 2006 2008 2010
Theil L Theil T
Source: Authors’ calculation based on VLHSS, various years

180 Inclusive Development in Vietnam: An Assessment
3.2.3. Income Inequality by Quintiles
As seen in Figure 8, in the last 20 years inequality increased between population quintiles. Although the earnings of all income quintiles grew, there was a difference in the gains of the various quintiles; economic growth was unequally distributed. The ratio between quintile 5 and quintile 1 widened from 8.2 times in 1996 to 9.2 times in 2010; similar trends were recorded for other quintiles.
Figure 8: Inequality between Quintiles (VND/person/month)
0.00
1000.00
2000.00
3000.00
4000.00
1996 1999 2002 2004 2006 2008 2010
Quintile 1�
Quintile 2�
Quintile 3�
Quintile 4�
Quintile 5�
Total
Source: GSO VLHSSs 1996, 1999, 2002, 2004, 2006, 2008, 2010
3.2.4. Theil L Index
Very often, sources of this inequality are believed to be part of the economic transition. With a market orientation, urban people—who are usually more educated and skilled—are paid higher salaries than people from rural areas. However, as Figure 9 shows, inequality in Vietnam also results from within areas rather than between areas; 25 percent of the growth in the Theil L index is from inequality between areas while the rest is from within areas. The VLHSS 2010 shows that the increase in inequality results mainly from within rural areas, where economic growth increases salaries for secondary jobs and non-farm income of rich households.
Figure 9: Decomposition of Theil L Index, 1993-2010
0
0.05
0.1
0.15
0.2
0.25
1992 1998 2002 2004 2006 2008 2010
Theil L
Within group
Between group
Source: Authors’ calculation based on VLHSS, various years
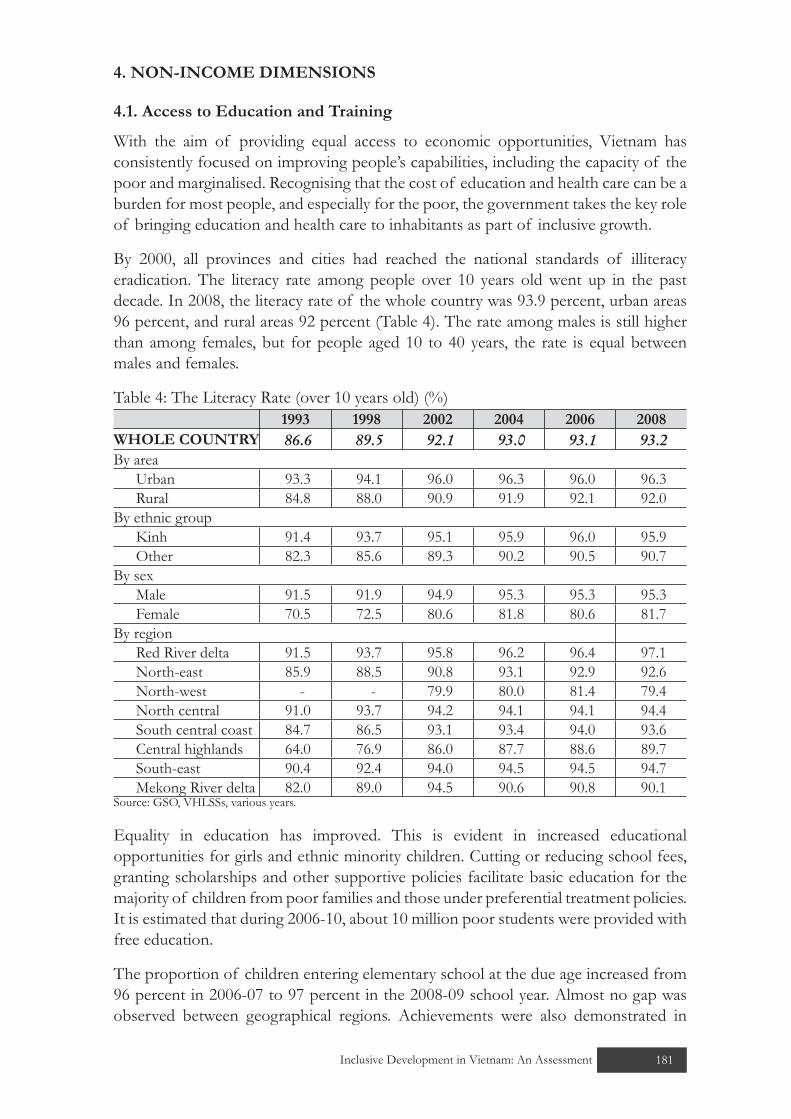
181Inclusive Development in Vietnam: An Assessment 181
4. NON-INCOME DIMENSIONS
4.1. Access to Education and Training
With the aim of providing equal access to economic opportunities, Vietnam has consistently focused on improving people’s capabilities, including the capacity of the poor and marginalised. Recognising that the cost of education and health care can be a burden for most people, and especially for the poor, the government takes the key role of bringing education and health care to inhabitants as part of inclusive growth.
By 2000, all provinces and cities had reached the national standards of illiteracy eradication. The literacy rate among people over 10 years old went up in the past decade. In 2008, the literacy rate of the whole country was 93.9 percent, urban areas 96 percent, and rural areas 92 percent (Table 4). The rate among males is still higher than among females, but for people aged 10 to 40 years, the rate is equal between males and females.
Table 4: The Literacy Rate (over 10 years old) (%)1993 1998 2002 2004 2006 2008
WHOLE COUNTRY 86.6 89.5 92.1 93.0 93.1 93.2By area
Urban 93.3 94.1 96.0 96.3 96.0 96.3Rural 84.8 88.0 90.9 91.9 92.1 92.0
By ethnic groupKinh 91.4 93.7 95.1 95.9 96.0 95.9Other 82.3 85.6 89.3 90.2 90.5 90.7
By sexMale 91.5 91.9 94.9 95.3 95.3 95.3Female 70.5 72.5 80.6 81.8 80.6 81.7
By regionRed River delta 91.5 93.7 95.8 96.2 96.4 97.1North-east 85.9 88.5 90.8 93.1 92.9 92.6North-west - - 79.9 80.0 81.4 79.4North central 91.0 93.7 94.2 94.1 94.1 94.4South central coast 84.7 86.5 93.1 93.4 94.0 93.6Central highlands 64.0 76.9 86.0 87.7 88.6 89.7South-east 90.4 92.4 94.0 94.5 94.5 94.7Mekong River delta 82.0 89.0 94.5 90.6 90.8 90.1
Source: GSO, VHLSSs, various years.
Equality in education has improved. This is evident in increased educational opportunities for girls and ethnic minority children. Cutting or reducing school fees, granting scholarships and other supportive policies facilitate basic education for the majority of children from poor families and those under preferential treatment policies. It is estimated that during 2006-10, about 10 million poor students were provided with free education.
The proportion of children entering elementary school at the due age increased from 96 percent in 2006-07 to 97 percent in the 2008-09 school year. Almost no gap was observed between geographical regions. Achievements were also demonstrated in

182 Inclusive Development in Vietnam: An Assessment
lower secondary school, where the proportion of children attending at their due age increased from 81 percent to 83.1 percent between 2006-07 and 2008-09. The rate increased among rural and urban, the Kinh (majority) and ethnic minority children, boys and girls. Similarly, a sharp increase (from 26.9 percent to 68.1 percent) occurred in the proportion of children attending upper secondary schools between 1993 and 2008. In rural areas and among ethnic minority groups, this rate has increased three times (UNDP, 2010).
Thanks to the high investment in education from the state budget (around 20 percent of the total) and a large contribution from the private sector, Vietnam has developed a large popular network of schools and training institutions. Primary school is available in all communes, lower secondary school at the commune or inter-communal cluster level and upper secondary school in all districts. Vocational training institutions, colleges and universities have been established in most major population regions and localities, even in more underdeveloped regions such as the north-west, central highlands and Mekong River delta. Many mountainous provinces and districts have boarding and semi-boarding schools for children of ethnic minorities. Table 5 shows that the number of schools at all levels has increased substantially in recent years.
Table 5: Number of Schools Years 2005-06 2006-07 2007-08 2008-09 2009-10
Pre-school 10927 11582 11696 12071 12218Primary school 14688 14834 14933 15051 15178Lower secondary school 9383 9635 9781 9902 10044
Upper secondary school 1952 2044 2149 2192 2233
Higher education (college, university) 277 322 369 393 Not yet
availableSource: GSO
Table 6: Schooling, by Level, Area and Income, 2010 (%)Primary Lower secondary Upper secondary
National total 101.2 94.1 71.9
Urban 100.0 96.4 84.4
Rural 101.6 93.3 67.6
Income Groups:Groups 1 (poorest) 102.1 86.7 53.1
Group 2 101.3 93.1 68.5
Group 3 101.1 97.6 74.1
Group 4 100.6 99.7 82.2Group 5 100.0 99.1 90.1Sources: ILSSA, 2012 (calculations based on VHLSS 2010)
However, data on the general rate of schooling decomposed into rural-urban and income groups shows obvious gaps between groups. The rate of general schooling of the poorest quintile (group1) and of rural residents is much lower than that of
183Inclusive Development in Vietnam: An Assessment 183
other groups. This gap becomes larger at higher education levels, especially in upper secondary schools (Table 6).
Average annual spending on education per student from the poorest quintile attending public school is VND1,088,000 -- only 21.3 percent of the amount of the richest group. Although preferential treatment (e.g. fee exemption or direct financial support to ethnic students) can explain the substantial difference, the total of preferential support to the poor amounts to only around 50 percent of total household’s spending on education (ILSSA, 2012).
Moreover, although the millennium goal of universal primary education (by national standards) has been fulfilled, considerable challenges remain. The quality of education remains low and insufficient to meet the country’s new development requirements. Primary school enrolment did not meet the proposed targets. In the 2008-09 school year, 205,587 children (about 3 percent of primary-school-age children) could not go to school. In a number of poorer provinces, such as Quang Nam, Quang Tri and Cao Bang, the enrolment rate remains low (about 92 percent). The primary school completion rate is alarmingly low and differs significantly across regions. While the north central, south central and south-eastern regions have a rate of primary school completion over 90 percent, the north-western and central uplands and the Mekong River delta have completion rates of less than 80 percent. This means that many schoolchildren have to repeat classes or drop schooling at a young age. Dropout of students is a worrying problem. In December 2007, the total number of dropouts among lower secondary school students across the country was 63,729—1.1 percent of the total; the number of dropouts among upper secondary students was 50,309, or 1.66 percent (UNDP, 2010).
Illiteracy eradication for women and men under 40 by 2010 is also a difficult goal when the literacy rate in this age group was only 96 percent in 2008. Although this rate gradually increased, it has done so slowly in recent years. This shows that some people, typically the poor, were unable to attend literacy classes or fell back into illiteracy.
Clearly, disparity still exists in access to education among regions, between rural and urban areas and between ethnic minorities and the majority. This is revealed by a number of indicators. The proportion of children entering school at the right age is still low in some provinces (e.g. Soc Trang, Bac Lieu). The literacy rate in the northern mountainous areas and among ethnic minorities is much lower than in the plains and among Kinh. Household expenditure for children’s education is also lower in rural and mountainous areas.
4.2. Access to Health Care
Health is an important aspect of inclusive growth. Since the poor are highly vulnerable to health problems, growth can be considered as inclusive only if it is able to address inequality in health care.
In Vietnam, life expectancy rose during the last decade from 68.4 to 74.8 years. Infant mortality fell from 34 per 1000 live births in 1993 to 14 in 2010, which is reasonable even by middle-income-country standards. There was also marked improvement in
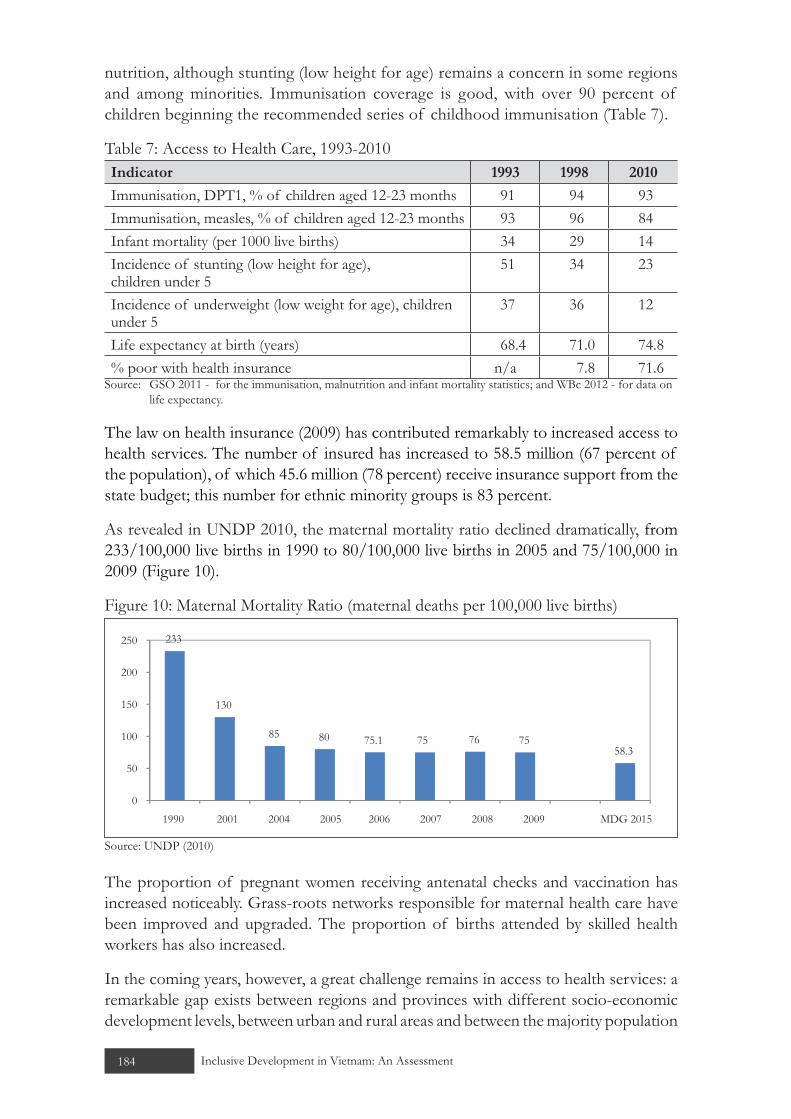
184 Inclusive Development in Vietnam: An Assessment
nutrition, although stunting (low height for age) remains a concern in some regions and among minorities. Immunisation coverage is good, with over 90 percent of children beginning the recommended series of childhood immunisation (Table 7).
Table 7: Access to Health Care, 1993-2010Indicator 1993 1998 2010
Immunisation, DPT1, % of children aged 12-23 months 91 94 93Immunisation, measles, % of children aged 12-23 months 93 96 84Infant mortality (per 1000 live births) 34 29 14Incidence of stunting (low height for age), children under 5
51 34 23
Incidence of underweight (low weight for age), children under 5
37 36 12
Life expectancy at birth (years) 68.4 71.0 74.8% poor with health insurance n/a 7.8 71.6
Source: GSO 2011 - for the immunisation, malnutrition and infant mortality statistics; and WBc 2012 - for data on life expectancy.
The law on health insurance (2009) has contributed remarkably to increased access to health services. The number of insured has increased to 58.5 million (67 percent of the population), of which 45.6 million (78 percent) receive insurance support from the state budget; this number for ethnic minority groups is 83 percent.
As revealed in UNDP 2010, the maternal mortality ratio declined dramatically, from 233/100,000 live births in 1990 to 80/100,000 live births in 2005 and 75/100,000 in 2009 (Figure 10).
Figure 10: Maternal Mortality Ratio (maternal deaths per 100,000 live births)
233
130
85 80 75.1 75 76 7558.3
0
50
100
150
200
250
1990 2001 2004 2005 2006 2007 2008 2009 MDG 2015
Source: UNDP (2010)
The proportion of pregnant women receiving antenatal checks and vaccination has increased noticeably. Grass-roots networks responsible for maternal health care have been improved and upgraded. The proportion of births attended by skilled health workers has also increased.
In the coming years, however, a great challenge remains in access to health services: a remarkable gap exists between regions and provinces with different socio-economic development levels, between urban and rural areas and between the majority population

185Inclusive Development in Vietnam: An Assessment 185
and the minorities living in disadvantaged regions. For example, although the under-one mortality rate in all regions has been reduced over time, the speed of reduction varied greatly (Table 8). Child mortality in mountainous and disadvantaged regions or among poor households has been two to three times the national average. The Red River delta and the south-east, regions with more favourable conditions for development, have the lowest rate of child mortality. In the north-west and central highlands, this number has always been higher and decreased more slowly. The rate has been particualarly high in provinces such as Kontum (48 per 1000), Ha Giang (40.0 per thousand) and Lai Chau (33.0 per thousand) in 2008.
Table 8: Under-One Mortality Rate, by Region (per 1000 live births)2005 2006 2007 2008
Whole country 17.82 16.00 16.00 15.00By regions
Red River Delta 11.50 11.00 10.00 11.00North-East 23.90 24.00 22.00 21.00North-West 33.90 30.00 29.00 21.00North Central 24.90 22.00 20.00 16.00South Central 18.20 18.00 17.00 16.00Central Highlands 28.80 28.00 27.00 23.00South-East 10.60 8.00 10.00 8.00South-West 14.70 11.00 11.00 11.00
Source: UNDP 2010
Similarly, child mortality varies across income groups, and the difference has increased over time. The VHLSS show that child mortality declined in all income groups, but the rate was always lower in high income groups and in urban areas. Figure 11 illustrates the gap between urban and rural areas in 2006.
Another example of disparity in access to essential services is the change in maternal mortality. The Millennium Development Goal study (UNDP 2010) showed that, despite improvement in maternal health, the maternal mortality rate varies greatly between urban and rural areas (Figure 12). While in the urban area only 79 maternal deaths have been counted out of 1000 births, the ratio is much higher (145 cases per 1000 birth) in the countryside. Geographical factors, education of mothers and practices in the mountainous, remote and disadvantaged rural areas are obstacles to the reduction of maternal mortality. Inability to access reproductive health services can also be a cause of differences.
In order to achieve a sustainable reduction of maternal mortality, it is crucial that the gaps between regions, between urban and rural areas and between ethnic groups be narrowed.

186 Inclusive Development in Vietnam: An Assessment
Figure 11: Child Mortality Rate in Urban and Rural Areas, 2006 (per 1000)
0
< 1 year
< 5 years
1-4 years 4
5
9
10
16
12
15 20 25
27
30 35
36
40
Urban Rural
Source: GSO 2006
Figure 12: Maternal Mortality Ratio disparity between Urban and Rural Areas
Mar
tena
l mor
talit
y ra
tion
(%)
0 20
79
806040 100 120 140 160
145
nUrban Rural
Source: UNDP 2010
4.3. Productive Employment
4.3.1. Labour Productivity
Table 9 presents average labour productivity in Vietnam from 2006 to early 2010. In constant 1994 prices, the average annual growth rate of labour productivity in 2006-10 was 4.18 percent. Broad industry (industry and construction) is the sector with the highest labour productivity, followed by services. Vietnam’s agriculture has the lowest labour productivity. Given that the largest share of employment in Vietnam is still in agriculture, forestry and fisheries, with more than 24 million workers in 2010, the low growth of labour productivity is an implicit explanation of the higher poverty rate in this sector. At the same time, industry, which generates the highest share of GDP, experiences almost zero annual increase in productivity. Moreover, the growth rate is declining: in 2006-08, the annual average growth rate of labour productivity was over 5.2 percent, but it slowed to only 2.5 percent in 2009 and 3.9 percent in 2010 (MOLISA 2010).
As labour productivity is crucial to high economic growth, it is also a key to inclusiveness. Low productivity prevents workers from earning more wages and thus impedes poverty reduction.
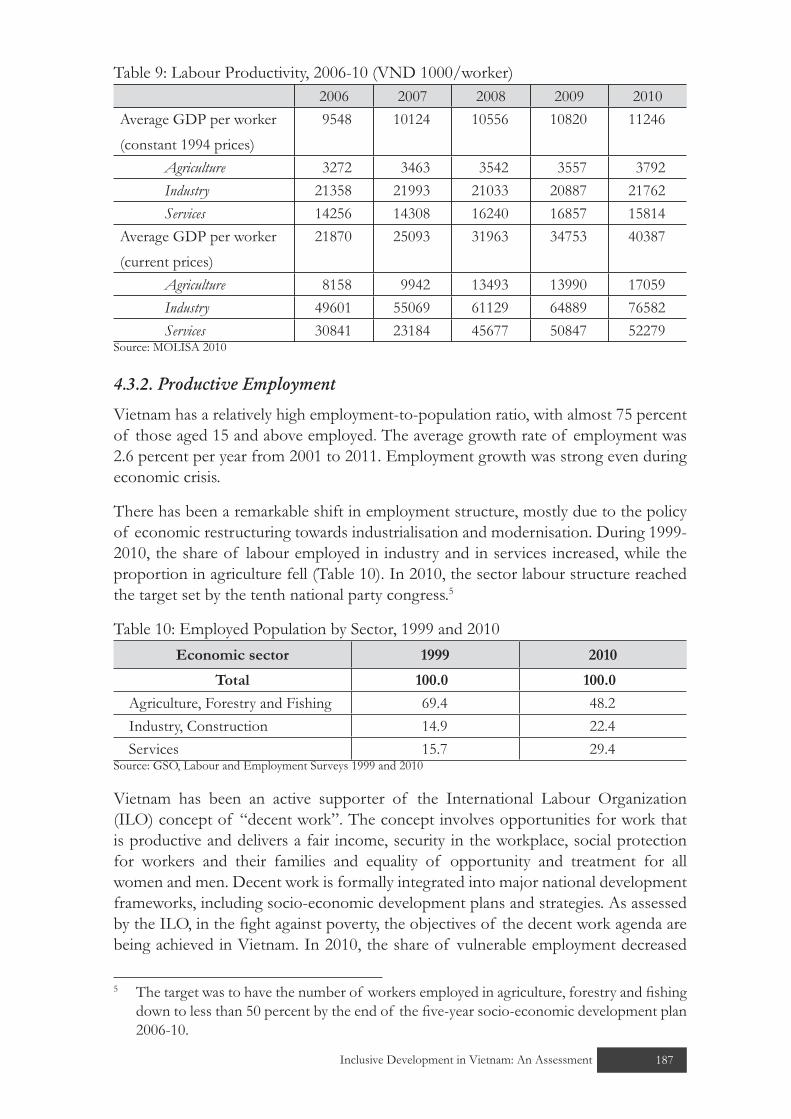
187Inclusive Development in Vietnam: An Assessment 187
Table 9: Labour Productivity, 2006-10 (VND 1000/worker) 2006 2007 2008 2009 2010
Average GDP per worker(constant 1994 prices)
9548 10124 10556 10820 11246
Agriculture 3272 3463 3542 3557 3792Industry 21358 21993 21033 20887 21762Services 14256 14308 16240 16857 15814
Average GDP per worker(current prices)
21870 25093 31963 34753 40387
Agriculture 8158 9942 13493 13990 17059Industry 49601 55069 61129 64889 76582Services 30841 23184 45677 50847 52279
Source: MOLISA 2010
4.3.2. Productive Employment
Vietnam has a relatively high employment-to-population ratio, with almost 75 percent of those aged 15 and above employed. The average growth rate of employment was 2.6 percent per year from 2001 to 2011. Employment growth was strong even during economic crisis.
There has been a remarkable shift in employment structure, mostly due to the policy of economic restructuring towards industrialisation and modernisation. During 1999-2010, the share of labour employed in industry and in services increased, while the proportion in agriculture fell (Table 10). In 2010, the sector labour structure reached the target set by the tenth national party congress.5
Table 10: Employed Population by Sector, 1999 and 2010Economic sector 1999 2010
Total 100.0 100.0
Agriculture, Forestry and Fishing 69.4 48.2Industry, Construction 14.9 22.4Services 15.7 29.4
Source: GSO, Labour and Employment Surveys 1999 and 2010
Vietnam has been an active supporter of the International Labour Organization (ILO) concept of “decent work”. The concept involves opportunities for work that is productive and delivers a fair income, security in the workplace, social protection for workers and their families and equality of opportunity and treatment for all women and men. Decent work is formally integrated into major national development frameworks, including socio-economic development plans and strategies. As assessed by the ILO, in the fight against poverty, the objectives of the decent work agenda are being achieved in Vietnam. In 2010, the share of vulnerable employment decreased
5 The target was to have the number of workers employed in agriculture, forestry and fishing down to less than 50 percent by the end of the five-year socio-economic development plan 2006-10.

188 Inclusive Development in Vietnam: An Assessment
by 4.3 percentage points due to an increase in the proportion of waged and salaried employment (2.9 percentage points) and a decreased (8.2 percentage points) share of self-employment (MOLISA et al 2010).
However, the proportion of waged employment remains small despite the ongoing structural changes. A major part of the labour force continues to work in agriculture and the informal sector. In 2011, around 62 percent of the workforce was in informal employment, while only 35 percent were waged and salaried workers (Table 11). Seven out of the country’s 20 one-digit economic industries (excluding agriculture, forestry and fishing) had a rate of informal employment above 80 percent in 2009. Of waged workers, around 45 percent have an oral or no contract.
Typically, informal workers face difficult working conditions and earn far less than those in the formal sector. They also lack social benefits such as employment insurance and social security, and are not protected by any labour association or union. Informal workers also lack opportunity for training, which often comes with formal employment.
Table 11: Employment Growth and Types, 2001-11 (%)
Employment types2001 2011 Average
growth2001-05
Average growth2006-10
Average growth2001-11
Total employment 100 100 2.7 2.5 2.6
Waged employment 20.7 35.3 8.4 7.7 8.2
Employers 0.3 3.1 10.4 30.9 29.4
Self-employed and family employment
77.6 61.6 1.5 -0.3 0.3
Other 1.4 0.1 - - -Source: MOLISA 2012
The proportion of unskilled employment remains large (39.4 percent in 2010). Only a small part of employment is in sectors requiring high or medium technical qualifications, 5.1 percent and 3.6 percent respectively.
Of nine occupational categories (Table 12), only three involved more female than male workers, namely: personal services, protective and sales workers, middle-level professionals and unskilled workers. These three groups all represent occupations for low-qualified professionals, indicating persisting gender imbalances in Vietnam’s labour market. Women’s productive potential seems to be heavily underutilised.
Despite strong policy commitments, Vietnam faces significant challenges in providing sufficient decent jobs that can help poor and disadvantaged labourers to escape poverty and vulnerability and increase their access to protection and equal social services.

189Inclusive Development in Vietnam: An Assessment 189
Table 12: Structure of Employment, by Occupation and Gender, 1 April 2010Occupations Total Male Female % Female
Total 100.0 100.0 100.0 48.5
1. Leaders/managers 0.9 1.4 0.5 24.0
2. High-level professionals 5.1 5.0 5.3 50.0
3. Mid-level professionals 3.6 3.1 4.1 55.5
4. Clerks 1.4 1.5 1.4 48.1
5. Personal service, protective and sales workers 14.4 10.0 19.0 64.0
6. Skilled agricultural, forestry and fishery workers 15.0 17.5 12.4 40.0
7. Craft and trades workers 13.0 17.8 7.8 29.2
8. Plant and machine operators and assemblers 7.0 8.4 5.5 38.3
9. Unskilled workers 39.4 35.1 44.0 54.1Source: GSO 2010
4.4. Economic Infrastructure
Access of the poor to land, water, basic services and infrastructure is also an important indicator of inclusiveness. In this regard, high commitment and efforts have been made by the government during the last decade. Indeed, UNDP (2009) found that by 2008, 41 poverty reduction policies and projects had been implemented, with either a direct poverty reduction focus or a strong poverty reduction impact (such as the Rural Water Supply and Sanitation National Target Project and Socio-Economic Program for Extremely Difficult Communes in Ethnic Minority and Mountainous Areas [P. 135]). Apart from support to education and health, many of these projects focus on improving access to services and supporting infrastructure construction, operation and maintenance. Training and capacity building are also a large part of these projects and programmes.
As a result, access of the poor to some infrastructure has been noticeably improved. Table 13 shows the current status of infrastructure of “extremely difficult communes”, which were targeted by the P. 135 in 2010. By comparing 2005 and 2010, the table also reveals improvement in access to critical infrastructure in these communes.
In addition to the infrastructure listed in the table, all communes have telephone, postal services, newspapers and public telecommunication services—radio, television and means of broadcasting.

190 Inclusive Development in Vietnam: An Assessment
Table 13: Access to Infrastructure in ‘Extremely Difficult Communes’, 2005 & 2010 (%).2005 2010
Car road to commune centre 93.8 94Small-scale hydropower station 53.7 67.5Commune clinics 98 100Primary school (permanent) 69 83.6Lower secondary school 67 70Marketplace 29 39.7Commune cultural post office 85.3 86Radio station 61 85Cultural community activity house
NA. 84
Electricity 84.6 91.8Clean water 53.3 67.8Source: UNDP 2010
Table 14: Number of Durable Goods Possessed, 2006-10 (per 100 households)Items Year 2006 2008 2010
Car 0.2 0.4 1.3Motorbike 68.6 89.4 96.1Telephone 51.4 107.2 128.4Refrigerator 23 32.1 39.7Video 44.5 53.4 54.2Colour TV 82.0 92.1 85.9Audio set 12.8 14.9 12.6Personal computer 7.7 11.5 17.0Air conditioner 3.7 5.5 9.4Washing machine 9.3 13.3 17.6Water heater 7.6 10.1 13.3
Source: GSO, VHLSS 2006, 2008 and 2010
Nationwide, the number of durable goods possessed by households has increased sharply (Table 14). In 2006, just over half of households had telephones, but by 2010 the number was well over one per household. The number of households possessing personal computers also increased significantly. Increased ownership of more expensive durable goods indicates that households are moving up to improved facilities for transport, communication and information, which can help in overcoming social and information isolation.
While there has been a general increase in all durable goods, the pace of improvement in living conditions is faster in urban areas and in higher income households. VHLSS 2010 shows that the average number of computers possessed by urban households is five times higher than that in the rural areas (5 computers/100 households and 1/100 households, respectively).

191Inclusive Development in Vietnam: An Assessment 191
4.4.1. Access to Housing
Adequate and safe housing for the poor and ethnic minorities is one of the most important issues in inclusive growth. During the last decade, the government has implemented a large number of projects to tackle this problem (such as Programme 134,6 the housing component in the National Target Programme for Poverty Reduction, Programme 167 within Resolution 30a and the component for support to minorities in P. 135-II). The VHLSS show that by 2010, around 50 percent of all households had permanent houses, compared with 7.5 percent having temporary houses and 5.7 percent having only simple and unsafe houses.
However, the number of lower income households living in temporary and simple houses is much higher than the average. While only 1.1 percent of the wealthiest households live in simple and unsafe houses, 13.4 percent of the poorest group do. A big gap also exists between rural and urban areas (Table 15).
Table 15: Housing, by Type, Location and Income, 2010, (%)Overall Permanent Semi-
permanent Temporary Simple
Urban 100 46.1 48.9 3.0 2.0
Group 1 (poorest)
100 31.2 43.5 14.0 11.3
Group 2 100 33.5 52.9 7.7 5.9Group 3 100 38.8 53.7 4.2 3.3Group 4 100 44.4 52.3 2.3 1.0Group 5 100 53.9 44.8 0.9 0.4Rural 100 50.4 32.8 9.5 7.3
Group 1 100 41.1 29.2 16.2 13.5Group 2 100 51.6 29.1 10.7 8.6Group 3 100 54.7 32.6 7.6 5.1Group 4 100 55.5 36.2 5.0 3.3Group 5 100 52.4 42.0 3.6 2.0Whole country
100 49.1 37.7 7.5 5.7
Group 1 100 40.4 30.2 16.0 13.4Group 2 100 48.8 32.7 10.3 8.2Group 3 100 50.6 38.0 6.7 4.7Group 4 100 51.1 42.5 4.0 2.4Group 5 100 53.3 43.6 2.0 1.1
Source: ILSSA (calculation based on VHLSS 2010)
6 P. 134 is a short name for the programme “Policy to provide support in terms of production land, residential land, dwelling houses and drinking water to poor ethnic minority households in mountainous areas” promulgated by the prime minister in Decision No. 134/2004/QD-TTg, dated 20 July 2004.

192 Inclusive Development in Vietnam: An Assessment
4.4.2. Access to Drinking Water
While there has been a big improvement in access to electricity and housing, the supply of drinking water is critical for both the general population and the poor. VHLSS 2010 indicated that about 36.5 percent of poor households in urban areas had access to private or public tap water, while the figure for better-off households was 68.6 percent and for the rich 78.3 percent. In rural areas, only 5.3 percent of poor households had access to tap water, 13.7 percent of better-off and 17.6 percent of rich households.
Around one-fourth of poor households in urban areas and half in rural areas still have to use unsafe sources (such as untreated water from streams or ponds) for drinking (Table 16). This is one of the most important causes of water-borne diseases.
Table 16: Access to Drinking Water, 2010 (%)
TotalPrivate tap
waterPublic tap
water
Water from pumping
well
Water from built well
Other sources
Urban 100 66.5 1.8 15.3 8.2 8.1
Group 1 (poorest) 100 34.8 1.7 16.6 22.5 24.4
Group 2 100 47.0 1.9 18.5 18.8 13.9
Group 3 100 58.4 2.0 18.9 11.4 9.3
Group 4 100 66.6 2.0 16.3 7.8 7.3
Group 5 100 76.6 1.7 12.6 3.7 5.4
Rural 100 9.2 1.3 30.7 23.5 35.3
Group 1 100 4.3 1.0 19.5 26.1 49.1
Group 2 100 8.1 1.4 29.0 26.9 34.6
Group 3 100 9.5 1.2 33.8 23.2 32.3
Group 4 100 12.3 1.4 35.9 20.7 29.7
Group 5 100 16.1 1.5 42.6 16.5 23.3
Whole country
100 26.7 1.4 26.0 18.8 27.1
Group 1 100 6.4 1.1 19.3 25.8 47.4
Group 2 100 13.9 1.5 27.4 25.7 31.5
Group 3 100 22.0 1.4 30.0 20.2 26.4
Group 4 100 33.5 1.6 28.3 15.6 21.0
Group 5 100 52.2 1.6 24.7 8.9 12.6Source: Calculation from VHLSS 2010
Moreover, the study “Poverty in Vietnam” (VASS 2011) indicates that the rural poor in many provinces have little awareness and limited work experience. They also lack cultivable land, often in the form of low quality land or land constantly subject to floods and/or droughts. Lack of other productive assets is also mentioned by the study as an explicit cause of continuing rural poverty.

193Inclusive Development in Vietnam: An Assessment 193
Limited understanding of the Vietnamese language, inability or absence of interest in technical know-how and isolation keep many ethnic minority households poor. Living in remote or isolated areas, ethnic minority groups lack market information and therefore often are controlled by brokers who buy their products at low prices and resell them for considerably more.
5. SOCIAL PROTECTION
5.1. Social Protection System
The social protection system is a set of policies and programmes implemented by the government and civil society. The system is structured on three pillars:
labour market support implemented through both active and negative labour • market policies;
social security, including social insurance and health and employment insurance;•
social assistance, including regular and irregular assistance, poverty reduction, social • services (MOLISA, 2011).
These three components (Figure 13) all aim at enhancing people’s capacity to protect themselves, at reducing poverty and vulnerability and at increasing access to social services. The ultimate goal of the system is to protect against two adverse outcomes: a chronic incapacity to earn a living and to work; and a decline in this capacity caused by unpredictable events (such as the sudden death of a breadwinner), demand or expenditure shocks or bad harvest. The system aims to help people overcome such events if they are unable to cope with them by themselves.
5.1.1. Labour Market Support
Labour market support includes:
Training and retraining of young, poor, rural, informal, disadvantaged and ethnic • minority labourers,7 labourers and youth in areas where agricultural land has been converted to other uses.8
Preferential credit• for labour-intensive enterprises, poor rural households or households with disabled members and students. Preferential credit is provided for enterprises and businesses that create new jobs; rural households in remote and economically disadvantaged regions, especially poor and ethnic minority households, to promote production; graduate students for starting businesses; workers going abroad for temporary jobs.
7 See: Decision N-267/2005/TTg on vocational training for ethnic minority pupils and rural workers.
8 See: Decision No-81/2005/QD-TTg and Directive No-11/2006/CT-TTg on solutions to support vocational training and employment creation for young people in the localities where cultivation land is converted to other uses; Decision No-103/2008/QD-TTg on training and job creation for youth and Decision N.32/2007/TTg promulgating provision of preferential loans for ethnic minority households in economical extremely disadvantaged areas.
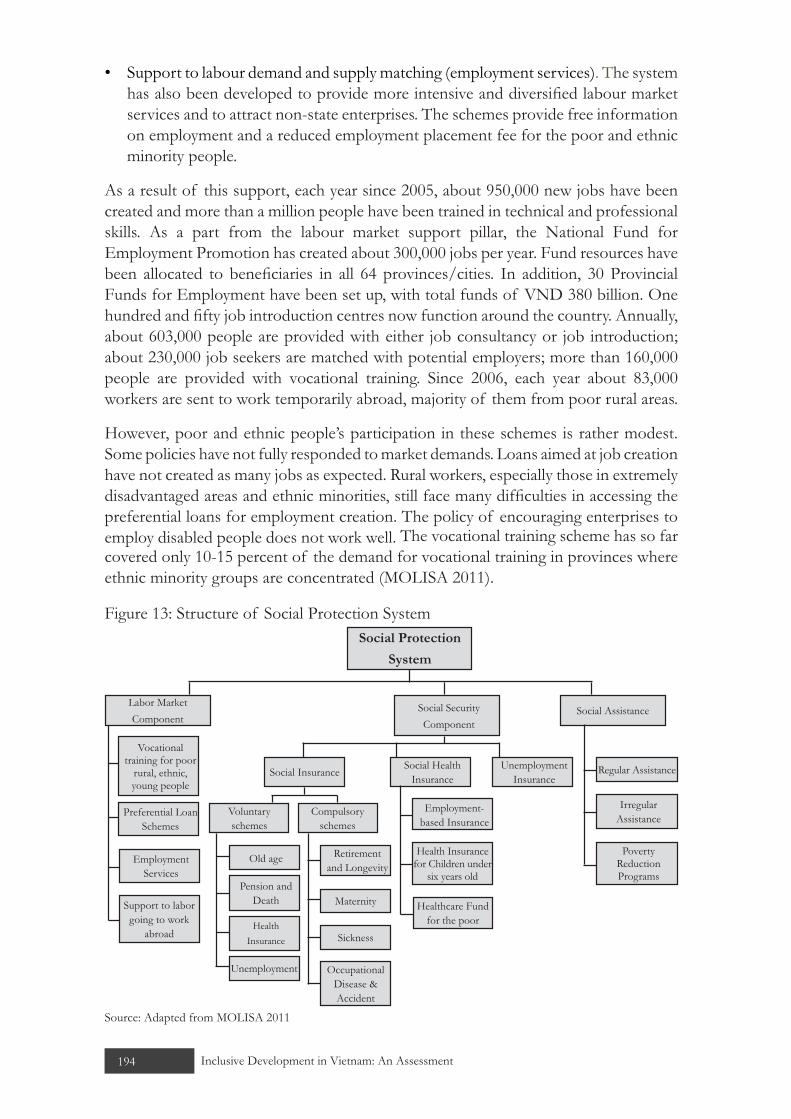
194 Inclusive Development in Vietnam: An Assessment
Support to labour demand and supply matching (employment services)• . The system has also been developed to provide more intensive and diversified labour market services and to attract non-state enterprises. The schemes provide free information on employment and a reduced employment placement fee for the poor and ethnic minority people.
As a result of this support, each year since 2005, about 950,000 new jobs have been created and more than a million people have been trained in technical and professional skills. As a part from the labour market support pillar, the National Fund for Employment Promotion has created about 300,000 jobs per year. Fund resources have been allocated to beneficiaries in all 64 provinces/cities. In addition, 30 Provincial Funds for Employment have been set up, with total funds of VND 380 billion. One hundred and fifty job introduction centres now function around the country. Annually, about 603,000 people are provided with either job consultancy or job introduction; about 230,000 job seekers are matched with potential employers; more than 160,000 people are provided with vocational training. Since 2006, each year about 83,000 workers are sent to work temporarily abroad, majority of them from poor rural areas.
However, poor and ethnic people’s participation in these schemes is rather modest. Some policies have not fully responded to market demands. Loans aimed at job creation have not created as many jobs as expected. Rural workers, especially those in extremely disadvantaged areas and ethnic minorities, still face many difficulties in accessing the preferential loans for employment creation. The policy of encouraging enterprises to employ disabled people does not work well. The vocational training scheme has so far covered only 10-15 percent of the demand for vocational training in provinces where ethnic minority groups are concentrated (MOLISA 2011).
Figure 13: Structure of Social Protection System
Labor Market Component
Voluntary schemes
Social Insurance Social Health Insurance
Unemployment Insurance
Compulsory schemes
Social Security Component
Social Assistance
Social Protection
System
Vocational training for poor
rural, ethnic, young people
Preferential Loan Schemes
Employment Services
Support to labor going to work
abroad
Retirement and Longevity
Maternity
Sickness
Occupational Disease & Accident
Old age
Pension and Death
Health Insurance
Unemployment
Employment-based Insurance
Health Insurance for Children under
six years old
Healthcare Fund for the poor
Regular Assistance
Irregular Assistance
Poverty Reduction Programs
Source: Adapted from MOLISA 2011

195Inclusive Development in Vietnam: An Assessment 195
5.1.2. Social Security Component
This component of the social protection system includes: (1) social insurance schemes (compulsory and voluntary), (2) health insurance and (3) newly established unemployment insurance.
(1) Social Insurance
Regulations on social insurance were first promulgated in 1961 for state employees and the armed forces. In 1995 the Labour Code was adopted, its Chapter XII addressing the key principles of social insurance. In 2003, Decree 01/2003/ND-CP modified a number of regulations on social insurance and expanded the target to all workers engaged in a labour contract of three months or more, regardless of number of labourers in enterprises. The Law on Social Insurance, adopted in 2007, made compulsory insurance for sickness, maternity, occupational disease, retirement and longevity. Voluntary social insurance schemes were expanded with pension and death benefits for those not subject to compulsory insurance, and unemployment insurance for those in labour contracts of 12 months or more.
Table 17: Social Insurance Participants and Beneficiaries, 1996-2008Year(1)
Number of participants
(1000 persons)(2)
Labour force (1000 persons)
(3)
Participation rate (%)(2) : (3)
Number of beneficiaries
(1000 persons)(4)
Ratio contributors/ beneficiaries
(2) : (4)1996 3231 35,866 9.0 1769 1.81997 3532 36,896 9.7 1758 2.01998 3765 37,207 10.1 1752 2.11999 3860 37,583 10.3 1754 2.22000 4128 37,610 11.0 1761 2.32001 4376 38,563 11.3 1778 2.52002 4445 39,508 11.3 1801 2.52003 4987 40,574 12.3 1840 2.72004 5820 41,586 14.0 1890 3.12005 6190 42,527 14.6 1967 3.12006 6749 43,339 15.6 2058 3.32007 8179 44,174 18.5 2132 3.82008 8539 44,961 19.0 2205 3.9
Source: Giang T.L 2010
The coverage of social insurance has been extended rapidly in recent years. In 1996, the number of participants in social insurance was around 3.2 million. By April 2008, this had increased to more than 8.5 million (Table 17). The expansion was due to increasing participation from the private sector. In addition, after a year of operation of voluntary insurance, there were about 6900 participants. Revenue for the social insurance fund rapidly increased from VND 6,248 billion in 2001 to more than VND 29,329 billion in 2008. Total benefits paid to participants (including pension, death and maternity benefits) were nearly VND1,856 billion in 2001 and increased to VND20,000 billion in 2008. The number of contributors has grown faster than the number of

196 Inclusive Development in Vietnam: An Assessment
beneficiaries, increasing the ratio between contributors and beneficiaries from 1.8 in 1996 to almost 4 in 2008.
However, challenges have been observed. First, the coverage rate has been persistently low. The participation rate was only 19 percent of the total labour force in 2008. More importantly, coverage of informal sector workers via the voluntary scheme has been negligible. There is a wide participation gap between rural and urban, poor and non-poor and ethnic minorities and the majority. The World Bank (2008) indicates that social insurance benefits, especially pensions, are not pro-poor since almost half of pension spending goes to the two richest quintiles. Only 2 percent goes to the poorest. Giang and Pfaw (2009) show that only 35 percent of old persons receive social protection benefits, and most of them are from urban areas. This implies that a great number of vulnerable people from informal and rural sectors are not covered by the current insurance schemes.
(2) Social Health Insurance
Social health insurance is made up of compulsory and voluntary schemes. Initially, compulsory health insurance included only employees of state-owned enterprises, staff of socio-economic organisations, civil servants, pensioners, early retirees (due to loss of work capability), the war veterans and their family members. Since 2005, the scheme has been extended to include three different programmes: employment-based health insurance, health care funds for the poor and free health insurance for children under 6 years old.
As a result, the number of participants in health insurance increased 10 times from 1993 to 2008 (Table 18).
Rural participants account for less than 20 percent. More than 15.8 million poor have been provided with free health insurance, of whom 93 percent come from rural areas. Around 7.5 million students and school pupils are covered by health insurance, those from rural areas accounting for nearly 40 percent. Nearly 3.2 million people have joined voluntary health insurance, of whom 66 percent are from rural areas (MOLISA 2011).
Table 18: Social Health Insurance Coverage, 1993-2008Year Participants
(million persons)
Coverage rate (% of total population)
Compulsory scheme(million persons)
Voluntary scheme(million persons)
1993 3.8 5.4 3.5 0.31998 9.7 12.5 6.1 3.62003 16.0 20.0 11.1 4.92004 19.0 23.1 13.6 6.42005 23.5 28.4 14.0 9.52006 34.5 41.0 25.0 9.52007 36.6 43.0 25.6 11.02008 41.0 47.2 30.0 11.0
Source: Giang T.L. (2010)

197Inclusive Development in Vietnam: An Assessment 197
The Health Care Fund for the Poor was established in 2002. The fund provides free health care to: poor households as identified by the national poverty line; ethnic minority people living in border and mountainous provinces; all households in communes officially defined as “economically extremely disadvantaged”. Adoption of the law on health insurance (2009) indicates a strong commitment to provide all or part of the cost of health insurance for the poor, the near poor, ethnic minorities and people who are the targets of preferential social benefits, social relief.9
However, the proportion of compulsory and voluntary health insurance members from rural areas remains low because of their small and unpredictable incomes. In addition, the total expenditure for health treatment is much higher than the part covered by health insurance. Not many people are interested in participating in voluntary health insurance due to their low awareness of the benefits (Castel P & Martin R, 2004).
(3) Unemployment InsuranceThe unemployment insurance scheme was started very recently, in January 2009. Due to the impact of the world economic crisis, the government decided to delay the payment of contributions to the last half of 2009. Up to now, only public institutions and organisations of the state sector have registered and contributed to unemployment insurance; businesses and enterprises are still outside. The rural population is not required to have unemployment insurance.
5.1.3. Social Assistance System The social assistance system has three main sub-components: (1) regular assistance to people aged 85 and over, the disabled, the mentally ill, single parents, orphans and others; (2) irregular social assistance and aid, for example, to victims of natural disasters and epidemic diseases and a Tet (lunar new year) allowance to the poorest households; (3) recently promulgated poverty reduction programmes or projects.
(1) Regular Social AssistanceThe coverage of regular social assistance has recently been expanded. In 2005, there were 416,000 beneficiaries, in 2008 more than one million, according to the Bureau of Social Protection, MOLISA. People aged 85 years and over accounted for 43.1 percent; people with disabilities made up 24.5 percent; lone older people accounted for 9.6 percent; more than 8.6 percent were mentally ill; 7.6 percent were single parents.
Total spending on regular social assistance reached nearly VND910 billion in 2007 and about VND1700 billion in 2008. Beneficiaries are supported in buying a health insurance
9 According to the law on health insurance, health insurance is paid for by the state budget for: commune staff who have retired and receive a monthly allowance; war veterans; people who directly participated in the resistance during the American war under the direction of government; members of the National Assembly; present members of people’s councils; people who are targeted for permanent social relief; poor ethnic minorities who live in areas with extreme socio-economic difficulties; families of national devotees (young people participating in the national salvation movement during the war time); families of armed forces officers; children under 6 years old. The groups that are partly supported are near poor, pupils, students and members of households engaged in agriculture, forestry and fishing with living standards below the minimum.

198 Inclusive Development in Vietnam: An Assessment
card. Exemptions and reduction of school fees are applicable in lower secondary schools. People with disabilities, children in especially difficult circumstances and the poor are supported in vocational training. In addition, many social and charity funds have been established: “Fund of Day for the Poor”, “Golden Heart Fund”, “Agent Orange Victims Fund”, Vietnam Red Cross Fund and Old Age Fund. Hundreds of billions of VND are mobilised annually for this purpose. For instance, the Fund for Child Protection alone mobilised nearly VND50 billion in 2007.
However, the coverage is still low, current beneficiaries accounting for only about 1.23 percent of the total population, a very low level compared with other countries. The baseline level for calculating the social allowance is still low, equivalent to only 18.6 percent of the minimum wage and 32.5 percent of the poverty line.
(2) Irregular Social Assistance Schemes (Emergency Relief)
Natural disasters, epidemic diseases and unexpected socio-economic shocks cause huge livelihood damage to the poor. Each year there are hundreds of dead, thousands of houses destroyed or swept away, millions of people short of food. Total losses caused by disasters annually amount to several thousand billion VND.
Emergency relief is provided as cash or in kind to disaster victims who are unable to ensure minimum living standards by themselves. MOLISA reported in 2009 that the number of people in need of social aid reached 1.13 million. Aid grants to these beneficiaries ranged from VND120,000-400,000/month (around 74 percent of the minimum wage at that time).
However, the level of emergency relief is still limited, compensating only 10 percent of damage and not satisfying even minimum needs of affected households. The management of emergency relief is still insufficient, leading to different assistance levels being provided to beneficiaries affected by the same kind of disaster. In some cases, the assistance is not provided on time.
Financial resources for these purposes (two-thirds of the total) come mainly from the state budget (UNDP 2008). Other funding sources such as international NGOs, civil society organisations or individuals are very modest in size and impact.
(3) Poverty Reduction Programmes and Projects
The improvements in income enhancement and poverty reduction, described above, can be attributed to some extent to government policies and programmes to support poor individuals, households, communes and districts. These include:
support for health, education, vocational training and legal advocacy;•
preferential credits for poor households; productive land for poor ethnic minority • households; agricultural, forestry and aquaculture extension and support for the development of production and trade; housing and water for poor households;
physical infrastructure for poor communes and villages in mountainous areas, • coastal areas, islands and communes with difficulties; and promoting temporary labour emigration.

199Inclusive Development in Vietnam: An Assessment 199
The aim is to accelerate poverty reduction, prevent people from falling back into poverty, encourage poor households in escaping poverty, improve living and productive conditions in poor communes and communes in economically extremely difficult regions and to narrow the income and living standard gaps between urban and rural areas and between rich and poor households. During 2006-08, preferential loans were provided to nearly 4.2 million households; nearly 2.1 million were provided with business development advice or technology transfer and guidance; vocational training costs were exempted or reduced for 60,000 poor people; 30,000 people were supported in vocational training each year; school fees and other schooling contributions were exempted and reduced for about 7.8 million poor pupils; 99.54 percent of the poor were granted health insurance cards in 2008; and new houses were built for 340,000 poor households.
However, some policies and programmes were not suitable for geographical and cultural characteristics of different population and ethnic groups. The poorest households have not benefited equally from the policies because of the regulations on eligibility. Only about 14 percent of the poor who have benefited from programmes were able to escape poverty with that social assistance. At present, about 12.5 percent of rural households and 22.3 percent of ethnic minority households live in temporary houses; 11.7 percent of communes do not have preschools; many schoolrooms in remote areas are temporary structures. There is a shortage of doctors and teachers for rural areas and remote and mountainous regions. Only 8.7 percent of rural households and 2.9 percent of ethnic minority households have clean water (from a tap); the rest use water from natural sources.
5.2. Government Expenditure on Social Protection
Although an estimated 71 percent of the poor receive some form of social protection, well above the 56 percent average for Asia (UNDP 2011), Vietnam invests around 4.1 percent of its GDP in social protection, less than many other countries in the region.
The finances for social protection come from two main sources: state national and sub-national budgets, and contributions by participants. In 2004-08, the total state budget allocation for social protection was VND146 thousand billion or VND29.2 thousand billion per year, accounting for 10 percent of the state budget, equivalent to 3.2 percent GDP.
In 2010, total public expenditure for social protection programmes was VND140.100 billion or 7.6 percent of GDP, of which expenditure from the state budget was VND 63,000 billion, accounting for 10.2 percent of total state budget expenditure and 3.4 percent of GDP.
It is important to notice that the fiscal system in Vietnam has been increasingly decentralized and devolved to the sub-national levels. A large majority of health and education spending now takes place at local (provincial and district) levels of administration. While the decentralisation may help to channel resources to where they are most needed, it increasingly leads to variable provincial spending and to the difficulty for central government to ensure that resources are spent efficiently. Variable public spending on health and education at provincial level is one of the factors
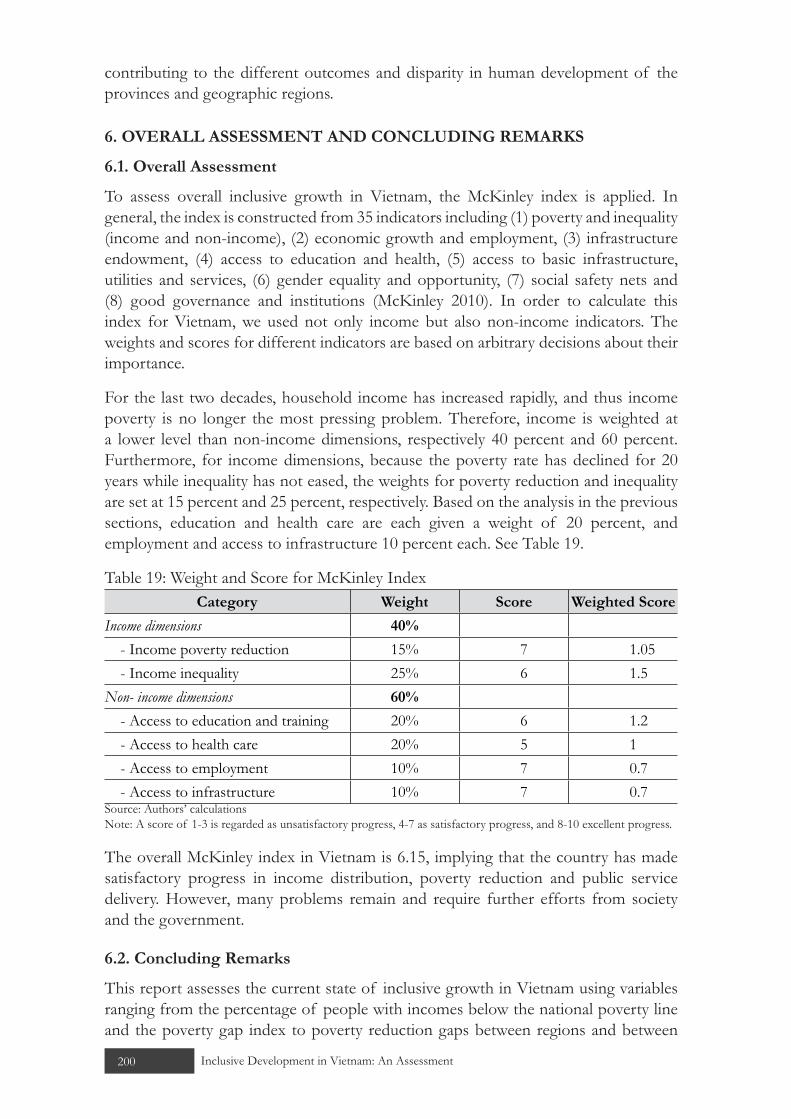
200 Inclusive Development in Vietnam: An Assessment
contributing to the different outcomes and disparity in human development of the provinces and geographic regions.
6. OVERALL ASSESSMENT AND CONCLUDING REMARKS
6.1. Overall Assessment
To assess overall inclusive growth in Vietnam, the McKinley index is applied. In general, the index is constructed from 35 indicators including (1) poverty and inequality (income and non-income), (2) economic growth and employment, (3) infrastructure endowment, (4) access to education and health, (5) access to basic infrastructure, utilities and services, (6) gender equality and opportunity, (7) social safety nets and (8) good governance and institutions (McKinley 2010). In order to calculate this index for Vietnam, we used not only income but also non-income indicators. The weights and scores for different indicators are based on arbitrary decisions about their importance.
For the last two decades, household income has increased rapidly, and thus income poverty is no longer the most pressing problem. Therefore, income is weighted at a lower level than non-income dimensions, respectively 40 percent and 60 percent. Furthermore, for income dimensions, because the poverty rate has declined for 20 years while inequality has not eased, the weights for poverty reduction and inequality are set at 15 percent and 25 percent, respectively. Based on the analysis in the previous sections, education and health care are each given a weight of 20 percent, and employment and access to infrastructure 10 percent each. See Table 19.
Table 19: Weight and Score for McKinley IndexCategory Weight Score Weighted Score
Income dimensions 40%
- Income poverty reduction 15% 7 1.05 - Income inequality 25% 6 1.5Non- income dimensions 60%
- Access to education and training 20% 6 1.2 - Access to health care 20% 5 1 - Access to employment 10% 7 0.7 - Access to infrastructure 10% 7 0.7Source: Authors’ calculations Note: A score of 1-3 is regarded as unsatisfactory progress, 4-7 as satisfactory progress, and 8-10 excellent progress.
The overall McKinley index in Vietnam is 6.15, implying that the country has made satisfactory progress in income distribution, poverty reduction and public service delivery. However, many problems remain and require further efforts from society and the government.
6.2. Concluding Remarks
This report assesses the current state of inclusive growth in Vietnam using variables ranging from the percentage of people with incomes below the national poverty line and the poverty gap index to poverty reduction gaps between regions and between
201Inclusive Development in Vietnam: An Assessment 201
ethnic groups. The report uses the concept of multi-dimensional poverty to explore changes in income, living standards, life expectancy and access to basic social services and infrastructure, with a main focus on 2000-10. Key findings are:
From 2000 to 2010, economic growth made a great contribution to improved living • standards and poverty reduction.
The income poverty rate declined from 37.4 percent in 1998 to 10.7 percent in • 2010.
The Gini coefficient increased, but only slightly, from nearly 0.33 in 1993 to around • 0.37 in 2010, while an upward trend of inequality is not clear from the Theil L and Theil T indices.
Equitable access to health and education services has increased.• A large number of people have been supported in buying health insurance, and others have benefited from fee remission for medical examination and treatment. A significant number of the poor have been granted preferential credit. Increased access to basic social services not only enhances people’s capacity and choices but also helps households escape poverty.
Access to education and training services has improved. The literacy rate among • people over 10 years old went up remarkably. The rate of children entering elementary school at the due age has also increased.
Access to health services has increased. Life expectancy has risen and infant • mortality has fallen impressively. The number of people having access to health services increased significantly.
The employment structure has shifted, the proportion of labour in industry • increasing from 14.9 percent to 22.4 percent.
Access to economic infrastructure has noticeably improved, particularly for the • poor. Every commune has a local clinic. Primary and lower secondary schools are available in 84 percent and 70 percent of communes, respectively. Around 92 percent of extreme difficulty communes have electricity. Clean water is provided to more than 67 percent of communes.
However, improvement has been slower in other social development indicators: •
Economic growth has not always translated into improved living standards for • all; people in urban areas have gained more than those in the countryside. Poverty remains a significant problem in rural areas. The poverty rate is highest in the northern mountain areas, along the border with China and Laos, in the interior of the central coast and in the northern part of the central highlands. The rate is intermediate in the Red River and Mekong deltas, and lowest in large urban areas, particularly Hanoi and Ho Chi Minh City, and in the south-east region.
The falling poverty rate did not narrow the gap between the ethnic majority and • minorities; on the contrary, the gap seems to be widening. Ethnic minorities made up nearly half of the poor in the country, and they are five times more likely to be poor than the majority.

202 Inclusive Development in Vietnam: An Assessment
A disparity in access to health and education persists. P• oor households have benefited from the lower cost of public education, but subsidies and benefits for the poor and disadvantaged appear to be not yet sufficient to ensure universal access to social services. Moreover, the quality of health and education services has been undermined by increasing commercialisation of public services and over-reliance on user fees. While it is recognised that equitable provision to all people of quality, affordable basic social services, especially education and health, has a great potential to improve the inclusiveness of socio-economic development, this potential is not yet fully and effectively exploited.
Social safety nets and other publicly provided protection are limited. More than • one-fourth of the poor population do not have a health insurance card. Granting of health insurance cards to all poor and near-poor, and even to some non-poor households with below-average income, is needed to reach the goal of “universal health insurance” stipulated by the health insurance law.
Despite great efforts towards improvement, Vietnam still faces numerous problems • of poor governance: limitations of voice, poor accountability and widely perceived corruption become more critical, particularly in light of decentralisation of funding and management of the social services.
Inadequate investment, poor governance and delivery of social services, especially • education and health, contribute not only to limited labour skills and low productivity but also to blocking the objective of “decent work” for all. This is a challenge to development goals because it prevents greater inclusiveness.
Housing for the poor has been basically solved, but a number of the poor still live • in simple dwellings. Therefore, the policy should move from “ensuring housing for the poor” to “ensuring secured housing for the poor”. To reach this target, a higher priority should be given to increased investment in housing for poor and low-income households in both rural and urban areas.
Although access to electricity has substantially increased, around 3.6 percent of • poor and near-poor households still cannot fully access this essential service. More effort and preferential assistance are needed from local authorities and public suppliers to help this small group avoid economic exclusion.
Despite great efforts, drinking water supply has been inadequate to cover basic • demand. The poor in the remote countryside or mountainous areas have very poor access to clean drinking water. More investment in this service is needed.
The above implies that in Vietnam economic growth alone does not necessarily lead to greater inclusiveness. In order to achieve its broader economic and social development goals, Vietnam will need to accelerate improvement in education and health, as well as to increase access to other basic social services. The requirement is more critical because some regions and groups are already at high risk of being left further behind, undermining the country’s efforts and progress towards rapid and inclusive socio-economic development.

203Inclusive Development in Vietnam: An Assessment 203
REFERENCES
Bucknall, Julia, Christiane Kraus, and Poonam Pillai (2000), Poverty and Environment, Draft for discussion (Washington D.C:WB)
Castel, Paulette and Martin Rama (2005), Comments on the New Social Insurance Law”, mimeo. Hanoi: World Bank Vietnam.
Central Institute for Economic Management (CIEM) (2011), Vietnam economy in 2010. A research final report for submission to MPI. (Hanoi:CIEM)
Giang Long Thanh & Wade Dondal Pfaw (2009), The vulnerability of the elderly to poverty: determinants and policy implication for Vietnam. Asian Economic Journal, Vol. 2: 125-151.
Giang Long Thanh (2010), Chapter 10: Social protection in Vietnam: current state and challenge” in Mukul G. Asher, Oum Sothea and Friska Porulian (eds.) “ Social protection in East Asia: current state and challenges”, ERIA research project report 2009-9. Jakarta: ERIA pp: 292-315
Government of Vietnam (2011), Resolution No. 11/2011/ND-CP “Key solutions for inflation control, macro-economic stabilization, and ensuring social welfare”. Hanoi, 24 February.
Government of Vietnam (2007), Resolution No. 67/2007/ND-CP “Policy on support to population groups targeted by social assistance system”. Hanoi, 13 April
Government Office of Vietnam (2005), Decision N.26/2005/TTg on vocational training for ethnic minority pupils and rural workers.
General Statistics Office (GSO) (2010). Results of the Vietnam Household Living Standards Survey (VHLSS). Hanoi: Statistical Publishing House.
General Statistics Office (GSO) (2010). Report on Vietnam the 2010 Labour Force Survey. Hanoi: Statistical publishing house, 9-2011.
General Statistics Office (GSO) (2011), Vietnam Multiple Indicator Cluster Survey 2011 (MICS 2011). Final report 2011. (Hanoi: GSO).
GSO (General Statistics Office of Vietnam, 2012), General poverty rate by residence and by region. [http://www.gso.gov.vn/default_en.aspx?tabid=474&idmid=3&ItemID=12651, accessed 31 October 2012.]
McKinley, Terry (2010), Inclusive growth criteria and indicators: an inclusive growth index for diagnosis of country progress, ADB Sustainable development working paper No.14.
Ministry of Labour, Invalids and Social Affairs (MOLISA) (2011), Vietnam’s social protection strategy for the period 2011-2020. Final policy proposal report for submission to the Vietnamese Government (Hanoi: MOLISA).
Institute of Labour Science and Social Affaire (ILSSA, 2010), “Wage trends in Vietnam, 2006-2010”. Final research report (Hanoi: MOLISA)
Institute of Labour Science and Social Affaire (ILSSA, 2012), “Labour and Social Trends 2001-2011”. Final research report (Hanoi: MOLISA)
Ministry of Labour, Invalids and Social Affairs (MOLISA) , European Union (EU) & International Labour Organization (ILO, 2010). Vietnam’s Employment Trend 2010 (Hanoi: MOLISA).

204 Inclusive Development in Vietnam: An Assessment
Ministry of Planning and Investment (MPI) (2008), “Relationship between rapid economic growth and sustainable, quality development in Vietnam”. Final research report (Hanoi: MPI).
UNDP (2009), “A mapping exercise: Poverty reduction programs and policies in Vietnam” (Hanoi: UNDP)
UNDP (2010), Vietnam on the road to realizing the millennium development goals (Vietnam MDG report 2010) (Hanoi: UNDP)
UNDP (2011), The Vietnam provincial governance and public administration performance index (PAPI) 2011 (Hanoi: UNDP)
UNDP (2011), Vietnam Human Development report 2011: Social Services for Human Development (Hanoi: UNDP)
UNDP (2008), Result-based mid-term review of the SEDP 2006-2010 (Hanoi: MPI-UNDP)
Vietnam Academy of Social Sciences (VASS) (2011), Poverty reduction in Vietnam: achievements and challenges (Hanoi: VASS)
World Bank (2008), Vietnam Development report 2008: Social protection, a joint donor report to the Vietnam Consultative meeting in Hanoi, December 6-7, 2007 (Hanoi: WB)
World Bank (2012a), Worldwide Governance Indicators 2012. The Worldwide Governance Indicator (WGI) project (Washington D.C: WB)
World Bank (2012b), Revisiting Vietnam’s remarkable record on poverty reduction: Progress and new challenges (Hanoi: WB)
World Bank (2012c), World Development database. (Washington D.C: WB)

Chapter 6Inclusive Development in Yunnan Province of China: An Assessment
by Xiong Bin and Wen Shuhui
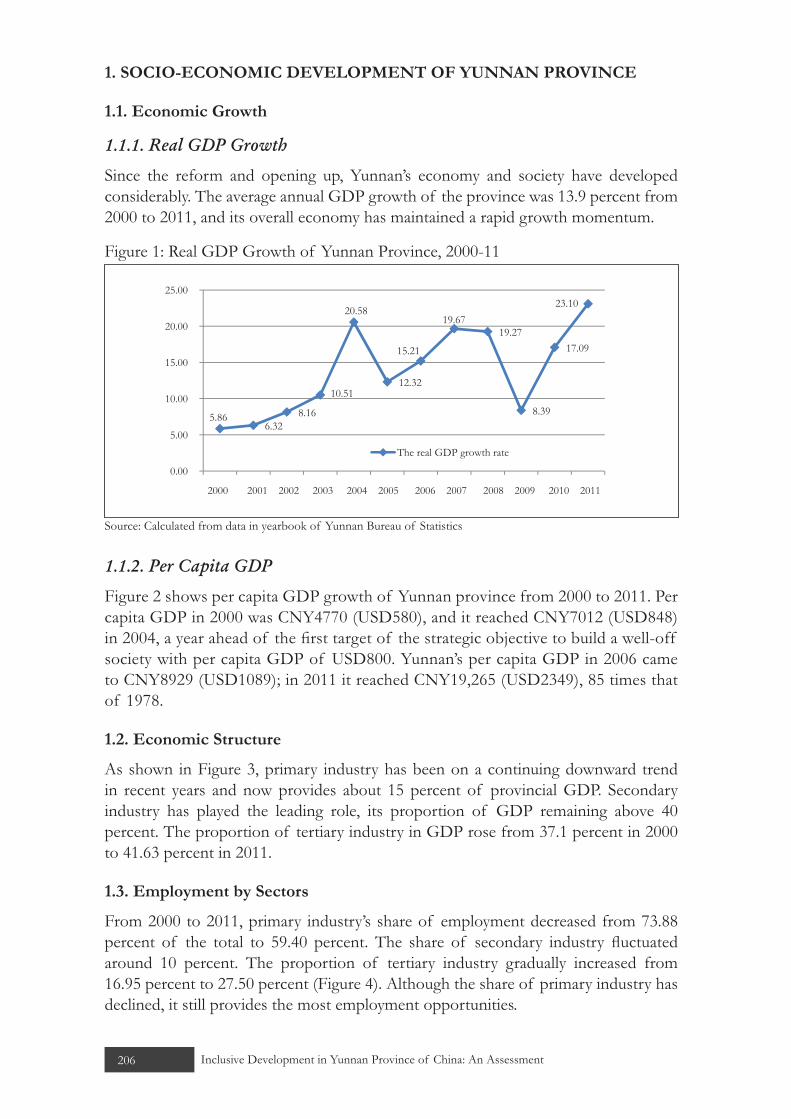
206 Inclusive Development in Yunnan Province of China: An Assessment
1. SOCIO-ECONOMIC DEVELOPMENT OF YUNNAN PROVINCE
1.1. Economic Growth
1.1.1. Real GDP Growth
Since the reform and opening up, Yunnan’s economy and society have developed considerably. The average annual GDP growth of the province was 13.9 percent from 2000 to 2011, and its overall economy has maintained a rapid growth momentum.
Figure 1: Real GDP Growth of Yunnan Province, 2000-11
5.86 6.32
8.16
10.51
20.58
12.32
15.21
19.67 19.27
8.39
17.09
23.10
0.00
5.00
10.00
15.00
20.00
25.00
2000 2001 2002 2003 2004 2005 2006 2007 2008 2009 2010 2011
The real GDP growth rate
Source: Calculated from data in yearbook of Yunnan Bureau of Statistics
1.1.2. Per Capita GDP
Figure 2 shows per capita GDP growth of Yunnan province from 2000 to 2011. Per capita GDP in 2000 was CNY4770 (USD580), and it reached CNY7012 (USD848) in 2004, a year ahead of the first target of the strategic objective to build a well-off society with per capita GDP of USD800. Yunnan’s per capita GDP in 2006 came to CNY8929 (USD1089); in 2011 it reached CNY19,265 (USD2349), 85 times that of 1978.
1.2. Economic Structure
As shown in Figure 3, primary industry has been on a continuing downward trend in recent years and now provides about 15 percent of provincial GDP. Secondary industry has played the leading role, its proportion of GDP remaining above 40 percent. The proportion of tertiary industry in GDP rose from 37.1 percent in 2000 to 41.63 percent in 2011.
1.3. Employment by Sectors
From 2000 to 2011, primary industry’s share of employment decreased from 73.88 percent of the total to 59.40 percent. The share of secondary industry fluctuated around 10 percent. The proportion of tertiary industry gradually increased from 16.95 percent to 27.50 percent (Figure 4). Although the share of primary industry has declined, it still provides the most employment opportunities.

207Inclusive Development in Yunnan Province of China: An Assessment 207
Figure 2: Per Capita GDP of Yunnan Province, 2000-11
4770
5015
5366
5870
7012
7809
8929
10609
12570
13539
15752
19265
0 5000 10000 15000 20000 25000
2000
2001
2002
2003
2004
2005
2006
2007
2008
2009
2010
2011
Source: Yearbook of Yunnan Bureau of Statistics
Figure 3: Shares of Real GDP in Yunnan Province
0.00%
10.00%
20.00%
30.00%
40.00%
50.00%
2000 2001 2002 2003 2004 2005 2006 2007 2008 2009 2010 2011
Share of primary industry in real GDP
Share of secondary industry in real GDP
Share of tertiary industry in real GDP
Source: Yunnan Bureau of Statistics
Figure 4: Sectoral Shares of Employment in Yunnan Province, 2001-11 (%)
0
10
20
30
40
50
60
70
80
2000 2001 2002 2003 2004 2005 2006 2007 2008 2009 2010 2011
Primary industry Secondary industry Tertiary industry
Source: Yunnan Bureau of Statistics
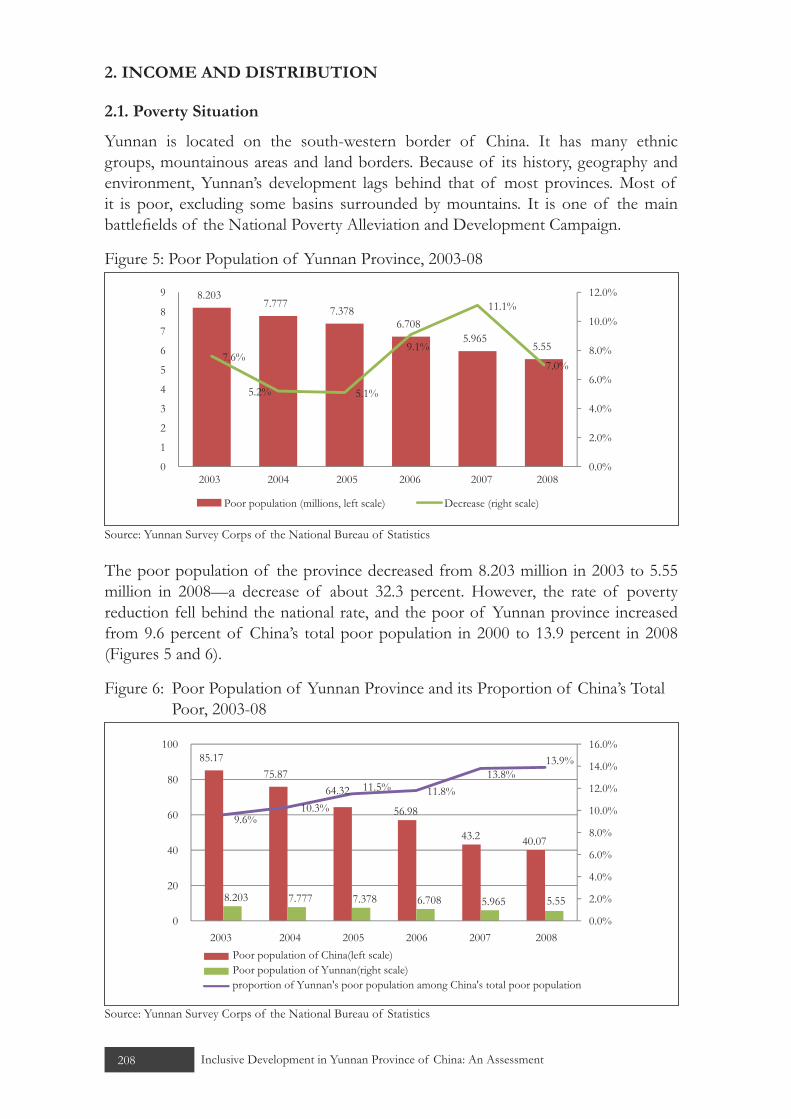
208 Inclusive Development in Yunnan Province of China: An Assessment
2. INCOME AND DISTRIBUTION
2.1. Poverty Situation
Yunnan is located on the south-western border of China. It has many ethnic groups, mountainous areas and land borders. Because of its history, geography and environment, Yunnan’s development lags behind that of most provinces. Most of it is poor, excluding some basins surrounded by mountains. It is one of the main battlefields of the National Poverty Alleviation and Development Campaign.
Figure 5: Poor Population of Yunnan Province, 2003-08
8.2037.777
7.3786.708
5.9655.55
7.6%
5.2% 5.1%
9.1%
11.1%
7.0%
0.0%
2.0%
4.0%
6.0%
8.0%
10.0%
12.0%
0
1
2
3
4
5
6
7
8
9
2003 2004 2005 2006 2007 2008
Poor population (millions, left scale) Decrease (right scale)
Source: Yunnan Survey Corps of the National Bureau of Statistics
The poor population of the province decreased from 8.203 million in 2003 to 5.55 million in 2008—a decrease of about 32.3 percent. However, the rate of poverty reduction fell behind the national rate, and the poor of Yunnan province increased from 9.6 percent of China’s total poor population in 2000 to 13.9 percent in 2008 (Figures 5 and 6).
Figure 6: Poor Population of Yunnan Province and its Proportion of China’s Total Poor, 2003-08
85.1775.87
64.32
56.98
43.2 40.07
8.203 7.777 7.378 6.708 5.965 5.55
9.6%10.3%
11.5% 11.8%13.8%
13.9%
0.0%
2.0%
4.0%
6.0%
8.0%
10.0%
12.0%
14.0%
16.0%
0
20
40
60
80
100
2003 2004 2005 2006 2007 2008Poor population of China(left scale)Poor population of Yunnan(right scale)proportion of Yunnan's poor population among China's total poor population
Source: Yunnan Survey Corps of the National Bureau of Statistics
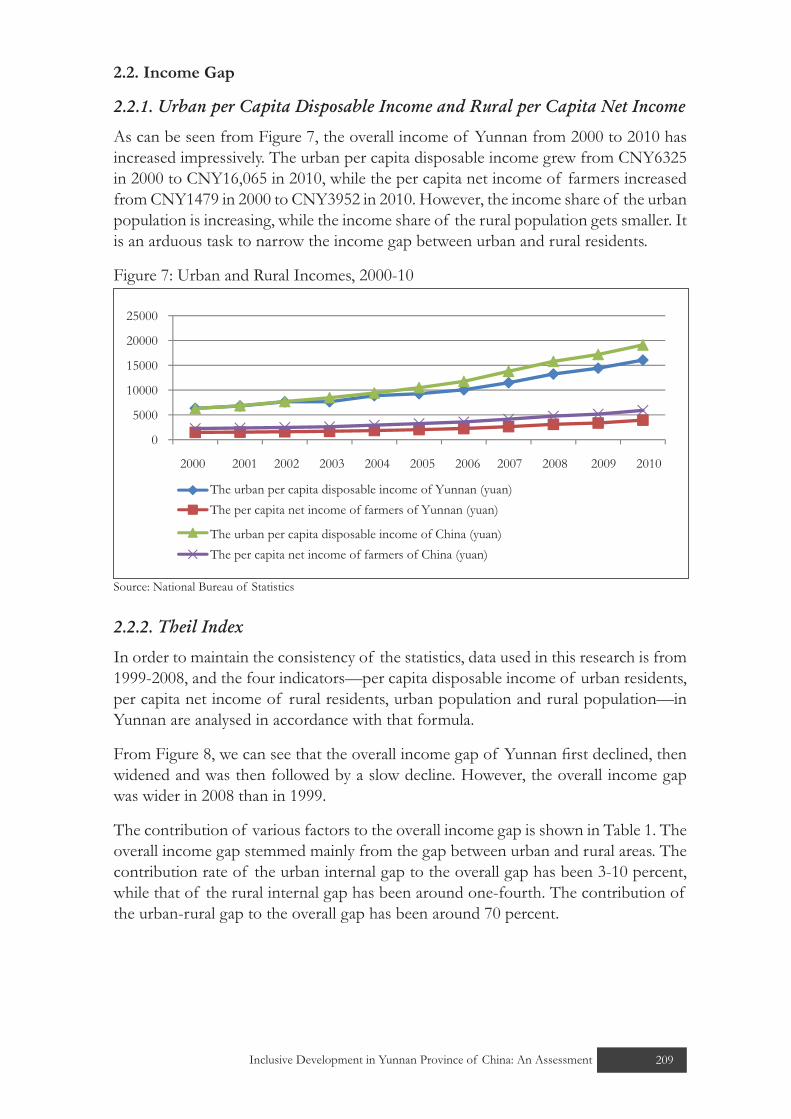
209Inclusive Development in Yunnan Province of China: An Assessment 209
2.2. Income Gap
2.2.1. Urban per Capita Disposable Income and Rural per Capita Net Income
As can be seen from Figure 7, the overall income of Yunnan from 2000 to 2010 has increased impressively. The urban per capita disposable income grew from CNY6325 in 2000 to CNY16,065 in 2010, while the per capita net income of farmers increased from CNY1479 in 2000 to CNY3952 in 2010. However, the income share of the urban population is increasing, while the income share of the rural population gets smaller. It is an arduous task to narrow the income gap between urban and rural residents.
Figure 7: Urban and Rural Incomes, 2000-10
0
5000
10000
15000
20000
25000
2000 2001 2002 2003 2004 2005 2006 2007 2008 2009 2010
The per capita net income of farmers of China (yuan)The urban per capita disposable income of China (yuan)
The urban per capita disposable income of Yunnan (yuan)The per capita net income of farmers of Yunnan (yuan)
Source: National Bureau of Statistics
2.2.2. Theil Index
In order to maintain the consistency of the statistics, data used in this research is from 1999-2008, and the four indicators—per capita disposable income of urban residents, per capita net income of rural residents, urban population and rural population—in Yunnan are analysed in accordance with that formula.
From Figure 8, we can see that the overall income gap of Yunnan first declined, then widened and was then followed by a slow decline. However, the overall income gap was wider in 2008 than in 1999.
The contribution of various factors to the overall income gap is shown in Table 1. The overall income gap stemmed mainly from the gap between urban and rural areas. The contribution rate of the urban internal gap to the overall gap has been 3-10 percent, while that of the rural internal gap has been around one-fourth. The contribution of the urban-rural gap to the overall gap has been around 70 percent.

210 Inclusive Development in Yunnan Province of China: An Assessment
Figure 8: Theil Index of Income Gap of Yunnan Province, 1999-2008
0.0000 �
0.0500 �
0.1000 �
0.1500 �
0.2000 �
1999 2000 2001 2002 2003 2004 2005 2006 2007 2008
Theil index within the rural area
Theil index within the urban area Theil index between the urban area and the rural area
Overall Theil index� �
Source: Bao Shunwen & Yao Jianfeng. The urban-rural income gap analysis based on the decomposition of Theil index: Taking Yunnan province as an example. Economic Review 2010(9).
Table 1: Theil Index and Its Components for per Capita Income of Households in Yunnan Province, 1999-2008
Year Theil index Components of Theil index (%)Rural areas Urban
areasUrban-rural
Yunnan Rural areas Urban areas
Urban-rural
Yunnan
1999 0.0391 0.0088 0.0988 0.1467 26.64 6.01 67.35 100
2000 0.0351 0.0041 0.0980 0.1372 25.61 2.96 71.43 100
2001 0.0374 0.0078 0.1088 0.1540 24.29 5.05 70.67 100
2002 0.0422 0.0091 0.1129 0.1642 25.72 5.55 68.73 100
2003 0.0410 0.0095 0.1138 0.1643 24.97 5.80 69.22 100
2004 0.0408 0.0148 0.1240 0.1796 22.73 8.22 69.04 100
2005 0.0406 0.0143 0.1167 0.1715 23.66 8.33 68.01 100
2006 0.0410 0.0137 0.1153 0.1700 24.12 8.05 67.83 100
2007 0.0414 0.0158 0.1123 0.1695 24.41 9.32 66.27 100
2008 0.0367 0.0168 0.1099 0.1633 22.46 10.26 67.28 100Source: Same as Figure 8
3. SOCIAL SECURITY, HEALTH CARE, EDUCATION AND CREDIT
3.1. Social Security
The social security expenditure of Yunnan soared from CNY1.589 billion in 2000 to CNY38.65 billion in 2011. Social security expenditure increased from 0.79 percent of Yunnan’s GDP in 2000 to 4.35 percent in 2011. About 348,200 people were covered by the minimum living allowance in 2001, and about 106,800 received the state pension and various other grants. From 2009 to 2011, 931,100 people were eligible for the minimum living guarantee for urban residents; 40.337 million people were entitled to the minimum living guarantee for rural residents. More and more people have enjoyed the benefits delivered by social and economic development.

211Inclusive Development in Yunnan Province of China: An Assessment 211
Social welfare is developing as well. In 2001, there were 18,800 beds in all kinds of welfare institutions (including old people’s homes) in Yunnan, and 9694 people stayed there. By the end of 2011, there were 49,600 beds of all types in social welfare institutions, and 38,000 people of various kinds were cared for during the year. In 2011, there were 772 children’s welfare institutes at the prefecture (city) level and 19 protection centres for the homeless and minors. There were 572 community facilities of various kinds: 75 community service centres and 497 community service stations.
In 2001, 1,907,300 workers participated in unemployment insurance in Yunnan, and 77,200 received CNY195 monthly insurance payments. In 2010, 2,096,100 workers participated in unemployment insurance and the next year 2,167,500.
These data shows great progress in the social security system. Financial expenditure has become more prominent in safeguarding the people’s livelihoods, which have improved. However, the social security system of Yunnan rural areas is not complete, and its protection is mainly in the form of rural social relief, social preference and compensation, “five guarantees” (food, housing, clothing, health care and burial expenses) for rural residents and a new cooperative medical insurance system in rural areas that is promoted in a few places. Its subjects are basically “the household of five guarantees”, people with disabilities, the elderly and orphans. Consequently, most people in rural areas are not entitled to this social security.
Figure 9: Social Security Expenditure in Yunnan Province, 2000-11 (% of GDP)
0.79%
1.23% 1.11% 1.65%
1.08%0.84%
0.86%
3.57% 3.95%
4.93%
4.22% 4.35%
0.00%
1.00%
2.00%
3.00%
4.00%
5.00%
6.00%
2000 2001 2002 2003 2004 2005 2006 2007 2008 2009 2010 2011
Source: Yearbook of Yunnan Bureau of Statistics
3.2. Health Care
The provincial government makes great efforts to ensure that everybody has access to basic health care service and people’s health is continuously improved. This is an important indicator of improved life quality. Since 2000, the number of medical technical personnel in health care institutions per 1000 people and the number of medical beds per 10,000 people showed almost the same growth trend (Figure 10). Especially since 2000, per person health care resources have been significantly improved. By 2011, the number of health technicians per 1000 people reached 3.22. The number of medical beds per 10,000 people rose from around 15 in 2000 to 27 in 2011.

212 Inclusive Development in Yunnan Province of China: An Assessment
Figure 10: Medical Care in Yunnan Province, 2000-11
2.93 2.892.56 2.55 2.58 2.66 2.71 2.74 2.78
2.943.08
3.22
0
5
10
15
20
25
30
0
0.5
1
1.5
2
2.5
3
3.5
2000 2001 2002 2003 2004 2005 2006 2007 2008 2009 2010 2011
Number of medical beds per 10,000 people (right scale)
Number of medical technical personnel per 1000 people (left scale)
Source: Yunnan Bureau of Statistics
3.3 Education
In recent years, full enrolment of school-age children in Yunnan has been basically achieved. With nine-year compulsory education, the net enrolment of primary school-age children in the province in 2000 reached 99 percent and reached 99.61 percent in 2011 (Figure 11). The gross enrolment rate of senior middle school in 2000 was 24.93 percent; in 2011, this rate increased to 85 percent. Since the college expansion plan in 1999, the gross enrolment rate in higher education and the number of students at the college have increased impressively. The number of college students for every 10,000 people in 1978 was 5.14; it reached 152.0 in 2011. The average schooling of the population increased from 6.3 years in 2009 to 7 years in 2011. The average schooling of people of the main labour force was 9.5 years, and the average schooling of the incoming labour force 12.5 years. Great achievements have been made in vocational education, adult literacy and minority education.
According to the census, among the population over 15 years old in 2010, there were 2.769 million illiterate people in Yunnan province. Compared with the national census in 2000, the illiteracy rate for Yunnan dropped from 11.39 percent to 6.03 percent (Figure 12). The decline of the illiteracy rate indicated the significant progress that Yunnan province has made in universalising nine-year compulsory education, promoting higher education development and eliminating illiteracy among young and middle-aged people. However, in comparison with developed areas, Yunnan still has a long way to go to enhance its education quality and education level. In particular, the education environment in poor mountainous areas is backward, and the drop-out rate for ethnic minority children is still seriously high.

213Inclusive Development in Yunnan Province of China: An Assessment 213
Figure 11: Enrolment Rate for School-Aged Children in Yunnan Province, 2000-11 (%)
9999.4
99.6
96.196.2
96.396.6
97.6
98.3 98.3
99.799.61
94
95
96
97
98
99
100
2000 2001 2002 2003 2004 2005 2006 2007 2008 2009 2010 2011
Source: Yunnan Bureau of Statistics
Figure 12: Illiteracy in Yunnan Province, 1964-2010
9.69910.251
9.406
4.842
2.769
47.3
31.5
25.4
11.4
6
0
5
10
15
20
25
30
35
40
45
50
0
2
4
6
8
10
12
1964 1982 1990 2000 2010
Illiterate population (left scale) Illiteracy rate (%, right scale)
Source: Yunnan Bureau of Statistics
3.4. Credit
The credit balance of Yunnan has steadily risen since 2005 (Figure 12). The loan amount stood at CNY1.211459 trillion in 2011, six times that of 2000. This shows that financial support for corporations and individuals has increased greatly. In 2011, agriculture and small and medium-sized enterprises accounted for 7.1 percent and 28.4 percent respectively of all new RMB loans. The provincial government has issued 10 regulations on promoting innovation in rural financial products and services, reform and development of the insurance industry, construction of the rural credit system, equity investment and fund development, and so on, which have improved the institutional environment for the financial development of the province. The rapid growth of the loan portfolios of financial institutions has provided strong financial support for the development of Yunnan’s economy and society.

214 Inclusive Development in Yunnan Province of China: An Assessment
Figure 13: Loan Balance in Yunnan Province, 2000-11
1986.53 3987.58
12114.59
0
2000
4000
6000
8000
10000
12000
14000
2000 2001 2002 2003 2004 2005 2006 2007 2008 2009 2010 2011
The financial loan balance (CNY billion)
Source: Yunnan Bureau of Statistics
4. OVERALL ASSESSMENT OF INCLUSIVE GROWTH
4.1. McKinley Index
The measure of inclusive growth proposed by McKinley (2010) – the McKinley index is used to assess Yunnan’s actual conditions. The weights and scores of its first grade, second grade and third grade indicators are shown in Table 2.
Scores from 1 to 3 mean unsatisfactory progress, from 4 to 7 satisfactory progress, from 8 to 10 outstanding progress. Yunnan’s McKinley index of 3.845, is much closer to a “satisfactory” score of 4 than it is to an “unsatisfactory” score of 3. It shows that the provincial government has not made sufficient progress in poverty reduction, income distribution social security or the supply of public goods.
Table 2: Inclusive Growth Indicators for Yunnan Province
First grade indicators Second grade indicators Third grade indicators Scores
Income (40%)
Income distribution(15%)*3.6=0.54
Poverty population ratio 60% 4
Poverty rate 40% 3
Economic growth(10%)*3.8=0.38
Actual GDP growth rate 20% 4
Per capita GDP growth rate 20% 3
Three sectors’ contribution 30% 4
Employed people in three sectors by year end 30% 4
Income gap and inequality in distribution(15%)*3.5=0.525
Theil index 50% 4
Income gap of urban-rural residents 50% 3

215Inclusive Development in Yunnan Province of China: An Assessment 215
Non-income (60%)
Finance (15%)*4.3=0.645
Total amount of loans 40% 4
Loans to SME 30% 4
Loan balance of rural financial institutions 30%
5
Education (15%)*4.2=0.63
Average years of schooling 25% 4
Net enrolment rate of pre-school children 20% 5
Enrolment rate of various schools 20% 4
Illiteracy rate 35% 4
Health (20%)*4=0.8
Health technicians per 1000 persons 50%
4
Medical facilities per 1000 persons 50% 4
Social security(10%)*3.25=0.325
Social security expenditure as share of GDP 25%
4
Beneficiaries of social security among the target population 25%
3
Assistance rate of the minimum living standard 25%
3
Assistance rate of unemployment 25% 3Total score: 3.845

216 Inclusive Development in Yunnan Province of China: An Assessment
4.2. CONCLUSION
In the past decade, the Yunnan provincial government has made great efforts to reduce poverty, improve income distribution, optimise social security, increase the supply of public goods and provide financial support. It can celebrate some achievements, but there is still some room for improvement.
Poverty alleviation and development have achieved certain results. With economic development, the poor population of Yunnan will continue to decline, but the rate of poverty reduction still lags behind the national rate, and the share of its poor population among China’s poor population is increasing. The income of urban and rural residents has increased to different degrees, and the income gap between urban and rural residents is still the primary factor in overall income differences and is still expanding. Great progress has been made in Yunnan’s health care reform. Per capita health care resources have improved significantly, and health facilities are being improved. Full education coverage of school-age children has been basically achieved. However, the education quality and education level of Yunnan still lag behind developed areas, and its illiteracy rate is higher than China’s overall rate. Loans to private enterprises and rural financial institutions are increasing steadily. With the improvement of China’s social security system, the financial expenditure of Yunnan in safeguarding the livelihood of its people will become more prominent, the proportion of social security expenditure in GDP will continue to rise, and social welfare will make further progress. However, the rate of receipt of social security in Yunnan is much lower than the overall rate of China. The final McKinley index score is 3.845, indicating that Yunnan’s inclusive growth has not made obvious progress, and has some room for improvement. In the future, more progress should be made in improving income distribution, reducing the income gap within regions and between urban and rural areas, optimising social security and promoting financial support to rural areas, agriculture, farmers and the private sector.

217Inclusive Development in China: An Assessment 217
Chapter 7Inclusive Development
in China: An Assessmentby Xiong Bin, Wen Shuhui and Jiang Yapeng
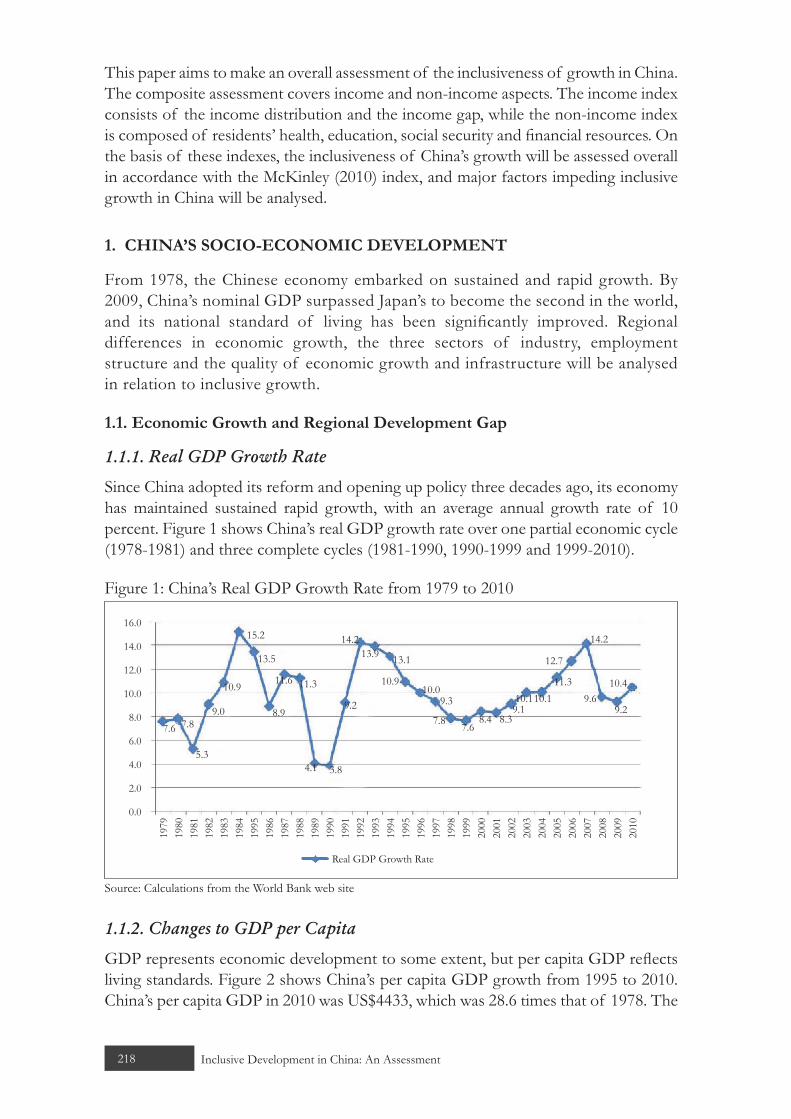
218 Inclusive Development in China: An Assessment
This paper aims to make an overall assessment of the inclusiveness of growth in China. The composite assessment covers income and non-income aspects. The income index consists of the income distribution and the income gap, while the non-income index is composed of residents’ health, education, social security and financial resources. On the basis of these indexes, the inclusiveness of China’s growth will be assessed overall in accordance with the McKinley (2010) index, and major factors impeding inclusive growth in China will be analysed.
1. CHINA’S SOCIO-ECONOMIC DEVELOPMENT
From 1978, the Chinese economy embarked on sustained and rapid growth. By 2009, China’s nominal GDP surpassed Japan’s to become the second in the world, and its national standard of living has been significantly improved. Regional differences in economic growth, the three sectors of industry, employment structure and the quality of economic growth and infrastructure will be analysed in relation to inclusive growth.
1.1. Economic Growth and Regional Development Gap
1.1.1. Real GDP Growth Rate
Since China adopted its reform and opening up policy three decades ago, its economy has maintained sustained rapid growth, with an average annual growth rate of 10 percent. Figure 1 shows China’s real GDP growth rate over one partial economic cycle (1978-1981) and three complete cycles (1981-1990, 1990-1999 and 1999-2010).
Figure 1: China’s Real GDP Growth Rate from 1979 to 2010
1979
1980
1981
1982
1983
1984
1995
1986
1987
1988
1989
1990
1991
1992
1993
1994
1995
1996
1997
1998
1999
2000
2001
2002
2003
2004
2005
2006
2007
2008
2009
2010
0.0
2.0
4.0
6.0
8.0
10.0
12.0
14.0
16.0
7.6 7.8
5.3
9.0
10.9
8.9
11.6 11.3
4.1 3.8
9.2
14.2
13.1
10.910.0
9.3
7.8 7.68.38.4
9.110.110.1
11.3
12.7
14.2
10.4
9.29.6
13.9
15.2
13.5
Real GDP Growth Rate
Source: Calculations from the World Bank web site
1.1.2. Changes to GDP per Capita
GDP represents economic development to some extent, but per capita GDP reflects living standards. Figure 2 shows China’s per capita GDP growth from 1995 to 2010. China’s per capita GDP in 2010 was US$4433, which was 28.6 times that of 1978. The

219Inclusive Development in China: An Assessment 219
World Bank uses per capita GDP as the criterion for countries’ economic development,1 and China has been included in the “upper-middle income countries” since 2003.
Figure 2: China’s GDP per Capita from 1995 to 2010 (USD)
2010200920082007200620052004200320022001200019991998199719961995
0 1000 2000 3000 4000 5000
604703
Per Capita GDP
774821865949
10421135
12741490
17312069
26513414
37494433
Source: World Bank
Figure 3: World Rankings of China’s Nominal GDP and GDP per Capita 16
14
12
10
8
6
4
2
0
140
120
100
80
60
40
20
0
year
14
78
1960 1970 1980 1990 2001 2002 2003 2004 2005 2006 2007 2008 2009 2010
13
7
108294
105
6 6
75
132
GDP (left scale) Per capita GDP (right scale)
76
131
109
54
3
112 110 104
32
106 99
2
95
Source: World Bank
Figure 3 shows that the ranking of China’s nominal GDP became second in the world in 2009, but its per capita GDP has been hovering around 100th in the world rankings. China’s per capita GDP in 2011 was USD5429.61, ranking 98th. This reveals that the spending power, quality of life, affluence and ability to survive risks of Chinese residents are still at a relatively low level, and there is much room for improvement.
1 World Bank criteria in 2008: GDP per capita less than $975—low income; GDP per capita between $976 and $3855—lower middle income; GDP per capita between $3855 and $11905—upper middle income; GDP per capita more than $11905—high income.

220 Inclusive Development in China: An Assessment
1.1.3. Regional Economic Development Differences
1.1.3.1. Comparative Analysis of Real GDP Growth in Eastern, Central and Western Regions
Figure 4 shows the real GDP growth rate of China’s eastern, central and western regions from 1996 to 2010.2 At the forefront of the reform and opening up of China, eastern China led the central and western regions in real GDP growth before 2007, but the international financial crisis in 2008 caused the real GDP growth rate of the eastern region to suffer heavy losses and drop significantly behind the central and western regions. After China implemented the Western Development Strategy in 1999, the real GDP growth rate of the western region increased year after year, from 6 percent in 1999 to 14 percent in 2010. As time goes by, the strategy will have a profound impact on the economic development of the western region and China at large.
Figure 4: Real GDP Growth Rates of China’s Eastern, Central and Western Areas, 1996 to 2010
0
5
10
15
20
25
1996 1997 1998 1999 2000 2001 2002 2003 2004 2005 2006 2007 2008 2009 2010
Real GDP Growth Rate of Eastern Area Real GDP Growth Rate of Central Area
Real GDP Growth Rate of Western Area
Source: China National Bureau of Statistics
1.1.3.2. Comparative Analysis of Real GDP per Capita Growth in Eastern, Central and Western Regions
Real per capita GDP of the western region was initially lower than that of the eastern region, but equal to that of the central region. In 2005, the western region overtook the central region and has remained ahead of it in real per capita GDP, which came to more than CNY10,200 in 2010, CNY2000 higher than the central region. This is mainly because the number of people leaving the western region for work increased significantly from 2005 and was also due to the achievements of the Western Development Strategy.
2 The eastern region includes Beijing, Tianjin, Hebei, Liaoning, Shanghai, Jiangsu, Zhejiang, Fujian, Shandong, Guangdong and Hainan; the central region includes Shanxi, Jilin, Heilongjiang, Anhui, Jiangxi, Henan, Hubei and Hunan; the western region includes Sichuan, Chongqing, Guizhou, Yunnan, Tibet, Shaanxi, Gansu, Qinghai, Ningxia, Xinjiang, Guangxi and Inner Mongolia (The 11th Five-year Program for National Economic and Social Development).

221Inclusive Development in China: An Assessment 221
Figure 5: Real GDP per Capita in the Eastern, Central and Western Regions, 1995-2010
0
0.5
1
1.5
2
1995 1996 1997 1998 1999 2000 2001 2002 2003 2004 2005 2006 2007 2008 2009 2010
Per Capita GDP of Eastern Area (10,000 Yuan)
Per Capita GDP of Central Area (10,000 Yuan)
Per Capita GDP of Western Area (10,000 Yuan)
Source: China National Bureau of Statistics
1.2. Structure of Production
In Figure 6, the three branches of industry have obviously ranked “two, three, one”. Secondary industry has been dominant, with a real GDP proportion around 40 -50 percent; the proportion of primary industry has steadily declined in recent years to around 10 percent; the proportion of tertiary industry climbed from 33.72 percent in 1993 to 43.14 percent in 2010. Overall, China is moving from the middle industrialisation stage into the late industrialisation stage.
Figure 6: Shares of Three Sectors in Real GDP
0.0%
10.0%
20.0%
30.0%
40.0%
50.0%
60.0%
1993
1994
1995
1996
1997
1998
1999
2010
2009
2008
2007
2006
2005
2004
2003
2002
2001
2000
Primary Industry as Percentage of Real GDP
Secondary Industry as Percentage of Real GDP
Tertiary Industry as Percentage of Real GDP
Source: China National Bureau of Statistics
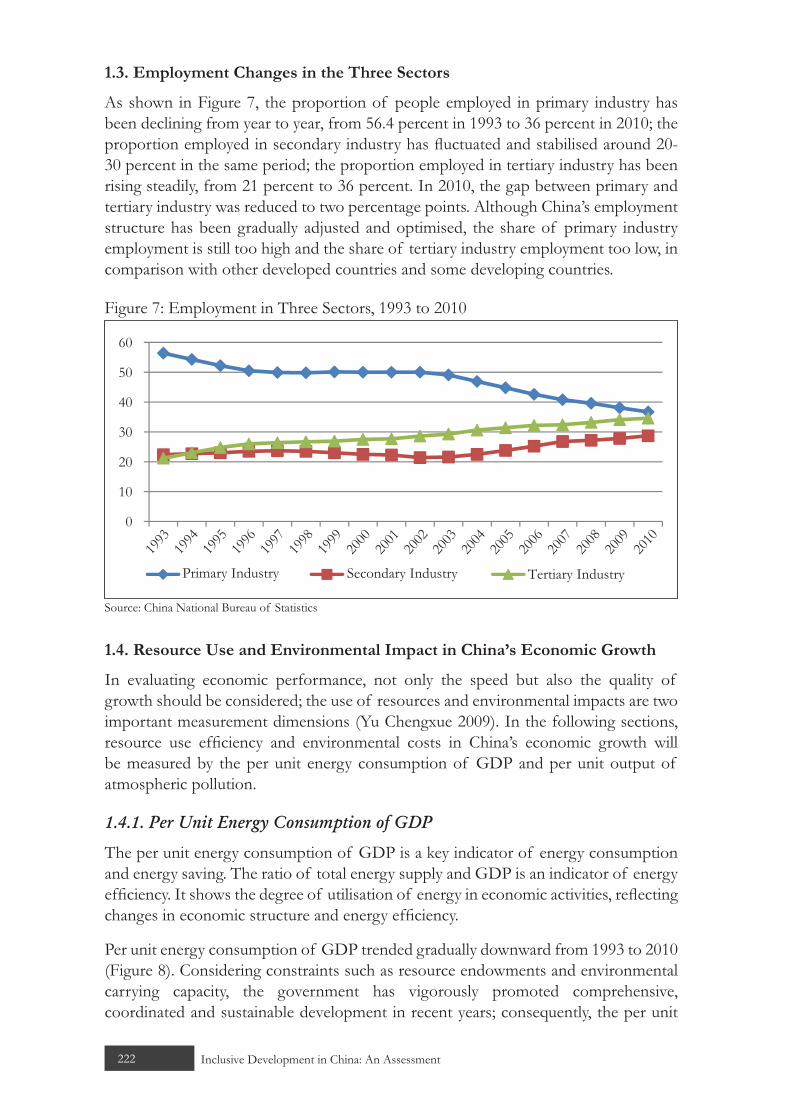
222 Inclusive Development in China: An Assessment
1.3. Employment Changes in the Three Sectors
As shown in Figure 7, the proportion of people employed in primary industry has been declining from year to year, from 56.4 percent in 1993 to 36 percent in 2010; the proportion employed in secondary industry has fluctuated and stabilised around 20-30 percent in the same period; the proportion employed in tertiary industry has been rising steadily, from 21 percent to 36 percent. In 2010, the gap between primary and tertiary industry was reduced to two percentage points. Although China’s employment structure has been gradually adjusted and optimised, the share of primary industry employment is still too high and the share of tertiary industry employment too low, in comparison with other developed countries and some developing countries.
Figure 7: Employment in Three Sectors, 1993 to 2010
0
10
20
30
40
50
60
1993
1994
1995
1996
1997
1998
1999
2010
2009
2008
2007
2006
2005
2004
2003
2002
2001
2000
Primary Industry Secondary Industry Tertiary Industry
Source: China National Bureau of Statistics
1.4. Resource Use and Environmental Impact in China’s Economic Growth
In evaluating economic performance, not only the speed but also the quality of growth should be considered; the use of resources and environmental impacts are two important measurement dimensions (Yu Chengxue 2009). In the following sections, resource use efficiency and environmental costs in China’s economic growth will be measured by the per unit energy consumption of GDP and per unit output of atmospheric pollution.
1.4.1. Per Unit Energy Consumption of GDP
The per unit energy consumption of GDP is a key indicator of energy consumption and energy saving. The ratio of total energy supply and GDP is an indicator of energy efficiency. It shows the degree of utilisation of energy in economic activities, reflecting changes in economic structure and energy efficiency.
Per unit energy consumption of GDP trended gradually downward from 1993 to 2010 (Figure 8). Considering constraints such as resource endowments and environmental carrying capacity, the government has vigorously promoted comprehensive, coordinated and sustainable development in recent years; consequently, the per unit

223Inclusive Development in China: An Assessment 223
energy consumption of GDP dropped from 3.3 (tons of standard coal/CNY10,000) in 1993 to 0.8 in 2010. These are good results from the elimination of overcapacity and energy saving technology.
Figure 8: Per Unit Energy Consumption of GDP in China, 1993-2010
3.3
2.5
2.2 1.9
1.7 1.6 1.6 1.5 1.4 1.3 1.4 1.3 1.3 1.2 1.1 0.9 0.9 0.8
0.0
0.5
1.0
1.5
2.0
2.5
3.0
3.5
1993
1994
1995
1996
1997
1998
1999
2010
2009
2008
2007
2006
2005
2004
2003
2002
2001
2000
Source: China National Bureau of Statistics
1.4.2. Per Unit Output of Atmospheric Pollution
The gauge of industrial waste gas emission (100 million standard cubic metres) is adopted to analyse per unit output of atmospheric pollution. In Figure 9, per unit output of atmospheric pollution generally trends downward from 2003 to 2010. Work on environmental protection was intensified in 2006. Consequently, output of atmospheric pollution dropped from 1.53 (100 million standard cubic metres/CNY100 million) in 2006 to 1.28 in 2009, which implies that the output of atmospheric pollution per production unit has been controlled.
Figure 9: Per Unit Output of Atmospheric Pollution, 2003 to 2010
1.46
1.49
1.45
1.53
1.46
1.29
1.281.29
1.15
1.2
1.25
1.3
1.35
1.4
1.45
1.5
1.55
2003 2004 2005 2006 2007 2008 2009 2010
Atmospheric pollution of per unit output (100 million standard cubic metres/100 million yuan)
Source: China National Bureau of Statistics

224 Inclusive Development in China: An Assessment
1.5. Urban and Rural Infrastructure Development
China has a vast territory, and its infrastructure construction has achieved remarkable results since reform and opening up. However, there are still significant differences in infrastructure between urban and rural areas. Electricity consumption and communication conditions in urban and rural areas will be analysed here.
1.5.1. Electricity Consumption in Urban and Rural Areas
China’s per capita electricity consumption is still low. Taking 2006 as an example, China’s per capita domestic power consumption was only 246 kwh, roughly equivalent to one-twentieth of the United States or one-tenth of Japan. Electricity demand will continue to grow steadily in coming years. As shown in Figure 10, electricity consumption has been rising since 1999. By 2010, the electricity consumption in urban areas reached 3.5291 trillion kwh, while that in rural areas was 663.2 billion kwh. Evidently, electricity consumption in urban households is much higher than in rural households.
Figure 10: Electricity consumption of China’s urban and rural areas from 1999 to 2010
2173
2421
2611
2993
3433
3933
4376
4896
5510
5713
6104
6632 10132
11051
12023
1333815599
1803820565
2369227202
2882830928
35291
0
5000
10000
15000
20000
25000
30000
35000
40000
1999 2000 2001 2002 2003 2004 2005 2006 2007 2008 2009 2010
Rural Electricity Consumption (100 million kwh) Urban Electricity Consumption (100 million kwh)
Source: China National Bureau of Statistics
1.5.2. Communications in Urban and Rural Areas
With the accelerated construction of the postal and telecommunications industry of China and of urban and rural infrastructure, the number of mobile phones in China has multiplied from 84.5 million in 2000 to 294.34 million in 2010, and per capita mobile phones have increased from 0.07 in 2000 to 0.64 units per person in 2010, and possession is increasing from year to year. As shown in Figure 11, mobile phone use in urban and rural areas is gradually rising, while fixed-line telephones have gradually decreased. In 2010, the number of mobile phones per rural resident was 2.2 times the number of fixed-line phones, and the number of mobile phones per urban resident was 2.3 times the number of fixed telephones.

225Inclusive Development in China: An Assessment 225
Figure 11: Phone Use in Urban and Rural Areas
19.5
0
50
100
150
200
87
2000 2005Number of Mobile phone Per 100 Urban HouseholdsNumber of Mobile phone Per 100 Rural Households
Number of Fixed line Telephones Per 100 Urban HouseholdsNumber of Fixed line Telephones Per 100 Rural Households
137
94.4
181.04
115.24
2009 2010
188.86
136.54
80.9460.76
26.3850.24 58.37
81.8662.68
4.32
Source: China National Bureau of Statistics
2. PRO-POOR INCOME GROWTH AND DISTRIBUTION
2.1. The Poor Population
Each country decides its poverty standard according to its actual levels of economic growth and consumption. When measuring China’s poverty, there are two commonly used standards: “one dollar per day”, an international standard used by the World Bank; and the rural poverty standard publicised by the National Bureau of Statistics (also known as the government’s poverty standard).
2.1.1. International Poverty Standard
The current international poverty standard as proposed by the World Bank is based on the US dollar in 1985 and its purchasing power in developing countries. The poverty standard is one dollar per day per person. In recent years, with the devaluation of the dollar and the rise in prices of internationally traded products, the World Bank has recalculated its poverty standard according to USD1.25 in 2005 dollars (Conceicao et al. 2000).
2.1.2. Government’s Poverty Standard
In forming its poverty standard, the government took into account the international poverty standard, the poverty standards of other countries and China’s actual situation, especially the change in price levels. At the end of 2008, it was announced that the poverty standard would be increased (mainly according to the change in the consumer price index) and that the absolute poverty standard would be combined with the low income standard. Thus the policy that treated absolute poor populations and low-income populations differently was formally abolished. The new standard regarded the population having a net annual income lower than CNY1196 per person as the target for poverty reduction. Those meeting this criterion numbered 40,070,000 in 2008. The poverty standard was increased to CNY1274 in 2010 according to changes in the consumer price index.

226 Inclusive Development in China: An Assessment
2.1.3. Poverty on the International Standard
The population in poverty is calculated as the population whose daily income is less than USD1.25/person and USD2/person at purchasing power parity. It can be seen from Table 1 that the population in poverty has decreased from 60.18 percent in 1990 to 13.06 percent in 2008 based on the USD1.25 standard, and the average annual reduction is 2.62 percent. The population in poverty according to the USD2 standard has dropped from 84.64 percent to 29.79 percent, an average annual reduction of 3.16 percent.
Table 1: China’s Poor Population
YearPercentage of the Population in
Poverty, according to the USD1.25 Standard (PPP)
Percentage of the Population in Poverty, according to the USD2
Standard (PPP)1990 60.18 84.641992 63.8 82.191993 53.69 78.61994 59.78 77.821995 54.05 74.131996 36.37 65.061997 47.84 70.781998 47.97 69.571999 35.63 61.442002 28.36 51.152005 16.25 36.942008 13.06 29.79
Source: World Bank
2.1.4. Poverty Status Quo on China’s Poverty Standard
The results of a survey of 68,000 rural residents in 31 provinces (autonomous regions and municipalities directly under the central government) conducted by the China Statistics Bureau found that the poor population in China in 2010 was 26,880,000, which was 9,090,000 fewer than the previous year. This reduction of 25.3 percent was 15.1 percentage points better than in 2009. The poverty rate is 2.8 percent, 1 percent lower than the previous year.
Table 2 shows the number of the poor population and the poverty rate based on the absolute poverty standard. The figures show that poverty alleviation projects have been historic achievements since the implementation of the reform and opening policy. The number of people in absolute poverty, lacking basic food and clothing, dropped from 250 million in 1978 to 32.09 million in 2000, and the poverty rate was reduced rapidly from 30.7 percent to 3.5 percent. Thus, the government announced that China has solved the basic food and clothing problems in rural regions.

227Inclusive Development in China: An Assessment 227
Figure 12 illustrates the number of poor and the poverty rate 2003-10. The poor population included the absolute poor and the low income populations for this period. The poor population dropped from 85.17 million in 2003 to 26.88 million in 2010. The average decrease in the poor population per year was 8.33 million, an annual reduction of 9.85 percent. The reduction of the poverty rate from 6.6 percent to 2.0 percent clearly illustrates that poverty, as determined by the current standard, has been alleviated.
Table 2: Poverty Situation of Rural Households in China
Year Poverty Standard (CNY/person/day)
Poverty Population (10,000 people) Poverty Rate (%)
1978 100 25000 30.71984 200 12800 15.11985 206 12500 14.81986 213 13100 15.51987 227 12200 14.31988 236 9600 11.11989 259 10200 11.61990 300 8500 9.41991 304 9400 10.41992 317 8000 8.81994 440 7000 7.71995 530 6540 7.11997 640 4962 5.41998 635 4210 4.61999 625 3412 3.72000 625 3209 3.52001 630 2927 3.22002 627 2820 3.02003 637 2900 3.12004 668 2610 2.82005 683 2365 2.52006 693 2148 2.32007 785 1479 1.62008 1196 4007 4.22009 1196 3597 3.82010 1274 2688 2.8
Source: 2011 China Statistical AbstractNotes: 1. The statistics are based on the absolute poverty standard. 2. Since 2008, statistics on the poor population have been based on a revised rural poverty standard, in
which the low income population is included in the poor population. Therefore, statistics since 2008 cannot be directly compared with historical statistics.

228 Inclusive Development in China: An Assessment
The poverty standard of the government is much lower than the international standard. This explains why the poverty rate calculated according to the poverty standard of the government is much lower than that calculated according to the poverty standard of the World Bank.
Figure 12: Poor Population and Poverty Rate
0100020003000400050006000700080009000 8517
7587
2003
Poor Population (10,000 persons)
6432
2004 2005
5698
4320
2006
4007
3.3%3.0%
20082007 2009 2010
Poverty Rate
3597
26882.7%
2.0%
0.0%
1.0%
2.0%
3.0%
4.0%
5.0%
6.0%
7.0%
4.9%
5.8%
6.6%
4.3%
Source: China National Bureau of Statistics
Even though China raised its poverty standard at the end of 2008, the standard was still lower than the USD1.25/person/day used by the World Bank. However, we should look at this difference rationally. The poverty standard of the World Bank mainly serves for making comparisons between different countries. The formulation of a poverty alleviation standard is not a purely statistical issue but a pragmatic decision.
2.2. Income Differences and Unequal Distribution
2.2.1. Gini Coefficient
The Gini coefficient is the internationally recognised index of household income differences (or the degree of distribution inequality). The coefficient can be any value between 0 and 1. The smaller the coefficient is, the higher the degree of equality is and the smaller the difference between the rich and the poor. The bigger the Gini coefficient, the lower is the degree of distribution equality and the greater the difference between rich and the poor.

229Inclusive Development in China: An Assessment 229
Figure 13: Gini Coefficient (Income)
0.45
0.44
0.43
0.42
0.41
0.4
0.39
0.38
0.372000 2001 2002 2003 2004 2005 2006 2007 2008 2009 2010
0.395
0.405
0.425
0.436 0.4340.4340.438 0.4390.439 0.4380.438
GiNi Coefficient
Source: Tian Weimin 2012
From Figure 13, it is clear that the income difference between rich and poor is becoming greater. According to the International standard, if the Gini coefficient is lower than 0.2, household incomes are extremely equal, if the figure is 0.4-0.5, it implies great differences, 0.6 and above means that there is a wide difference. Figure 13 shows that the Gini coefficient in China suggests quite a large income difference among citizens.
2.2.2. The Theil Index
2.2.2.1. Research Methodology
The Theil Index is used to calculate income inequality based on the concept of entropy in information theory. This index is frequently utilised to measure personal or regional income difference. The advantage of the index is that it can be used to measure the contribution of between-region inequality and within-region inequality to total inequality. Therefore, it is widely resorted to in the empirical research. The commonly used formula for the Theil Index is:
(1)
where n is the number of individuals in the population yp is the income of the person indexed by p and μy is the population’s average income. yp/ μy is the ratio of the individual’s income to average income. If members of a population can be classified into mutually exclusive and completely exhaustive groups, then Theil’s T statistic for the population (T) is made up of two components, the between group component (T’g) and the within group component (Twg) and the equation would be:
T = Tg’ + Tg
w (2)
The equation for between-group inequality of the Theil Index is:
230 Inclusive Development in China: An Assessment
(3)
Now i indexes not an individual but a group, with ni representing the number of individuals in group i, Yi the total income in group i, n the total number of individuals and Y the total income (Conceicao et al. 2000). If the proportion of the income of a region to that of the total regions equals the individual proportion of the number of individuals in the total regions, i.e., Yi/Y = ni/n, then log [(Yi/Y)/(ni/n)] = 0, which shows that the Theil index is zero and that there is absolute economic development equality in that region. When income share is big, while the individual share is small, it indicates that the total regional income concentrates in a few individuals. At this time, the economic development gap is greater and the Theil index is close to one. Generally speaking, the greater the Theil index is, the greater the economic development difference.
There is yet another level to explore: the within-group component of overall inequality, Tg
w which is given by a weighted average of the Theil indexes for each group, the weights being each group’s income shares:
(4)
In equation (4), Ti refers to the unweighted Theil index of each group, namely, the T index in equation (1).
In order to study the contribution of between-group inequality and within-group inequality to overall economic inequality, the between-group contribution rate and the within-group contribution rate are defined as:
Between-group contribution rate = between-group inequality / T (5)
Within-group contribution rate = within-group inequality / T (6)
2.2.2.2. Source of the Statistics
This article calculates China’s income inequality from urban and rural perspectives, and regional perspective. (1) Thirty-one provincial administrative regions serve as the basic units, which are subdivided into urban and rural groups. The disposable income per person of urban households and the net income per person of rural households are used as the index. (2) Three groups are based on regions: eastern, central and western. The basic units of the three regions are the provinces included in each. In this case, the calculation is based on GDP per capita in every region, which is used to analyse regional income inequality. This article takes inflation into consideration and makes use of a GDP deflator to transform nominal value into real value. Thus it is the real values of income per person and GDP per capita that are calculated and analysed. The time sequence between 2000 and 2010 is used to reflect the changes in China’s urban and rural income inequality as well as different regions’ income inequality. All the statistics are from the China Statistical Yearbook.

231Inclusive Development in China: An Assessment 231
2.2.2.3. Results and Discussion
(1) Degree of Urban-Rural Income Inequality
Figure 14 describes the general situation of urban-rural income inequality in China between 2000 and 2010 using the Theil index. It can be seen that overall income inequality has widened since 2000. The Theil index of total income fell in 2008, reflecting a slight narrowing of total-income inequality. The Theil index of ‘between urban and rural’ was similar to the overall index. This reflects the focus of the government to reduce the urban-rural income inequality. In contrast, the Theil indexes of rural regions and urban regions are quite small and have remained rather stable, meaning that there is less income inequality within urban and rural regions. Both indexes showed a small decrease in 2010.
Figure 14: 2000-10 Theil Indexes of China, Rural Region, Urban Region and Urban-Rural Region
00.020.040.060.080.1
0.120.140.160.180.2
2000 2001 2002 2003 2004 2005 2006 2007 2008 2009 2010
Rural Region Urban Region
Between Rural and Urban Region China
Source: Calculated from China Statistical Yearbook
Table 3 shows that the major household income inequality is between-group inequality, i.e. between urban and rural residents. From 2000 to 2010, the contribution of income inequality between urban and rural residents to overall inequality was always about 70 percent. The main reason is that the Chinese dual urban and rural registration system leads to government work being focused in cities. In 2003, the central government began to put “agriculture, rural regions and peasants” as the major work of the party and the country. Since then, a number of policies have increased the income of rural residents. Therefore, the income inequality between urban and rural regions showed a small reduction in 2005, and the contribution to overall income inequality also went down. Nevertheless, the contribution since 2008 has reached as high as 74 percent, so inequality between urban and rural regions is still the major part of overall income inequality. Figure 15 shows that income inequality between urban and rural residents has not narrowed. Since 2007, the income per capita of urban residents has continued to be around 3.3 times that of rural residents. Urban households take more and more

232 Inclusive Development in China: An Assessment
income share while rural households have a smaller and smaller share. This shows that reducing income inequality between urban and rural regions is an arduous task.
In addition, the within-group income inequality of urban regions is greater than that of rural regions. The main reasons are that favourable geographic locations and higher industrial levels have spurred the development of urban regions, and the development is not spread evenly over all the inhabitants of a region. Meanwhile, the contribution of within-group income inequality of both urban and rural regions to overall income inequality has presented a downward trend in recent years.
Table 3: Theil Index of 2000-10 Urban and Rural Household Income per Person and its Composition
Year
Theil Index Composition of Theil Index (%)
Urban Region
Rural Region
Between Urban
and Rural region
China Urban Region
Rural Region
Between Urban
and Rural Region
China
2000 0.0221 0.0256 0.1043 0.1519 14.52 16.83 68.65 100
2001 0.0224 0.0264 0.1120 0.1609 13.95 16.40 69.65 100
2002 0.0222 0.0227 0.1184 0.1633 13.62 13.91 72.47 100
2003 0.0216 0.0245 0.1252 0.1714 12.60 14.32 73.08 100
2004 0.0204 0.0253 0.1247 0.1704 11.96 14.85 73.19 100
2005 0.0224 0.0263 0.1241 0.1728 12.95 15.22 71.83 100
2006 0.0227 0.0268 0.1264 0.1759 12.90 15.26 71.84 100
2007 0.0210 0.0238 0.1274 0.1722 12.21 13.81 73.98 100
2008 0.0199 0.0231 0.1263 0.1694 11.76 13.66 74.58 100
2009 0.0200 0.0231 0.1275 0.1706 11.75 13.51 74.74 100
2010 0.0196 0.0227 0.1208 0.1631 12.01 13.95 74.04 100Source: Calculated from China Statistical Yearbook
(2) Analysis of Regional Income Inequality of Eastern, Central and Western China
It can be seen from Table 4 and Figure 16 that the income difference within eastern China is much bigger than in the other regions. However, the income inequality in eastern China has been falling since 2000. As a result, the Theil index of GDP per capita in eastern China is 0.0201, a reduction of 57 percent compared with 2000 (0.0465 in 2000). There are two reasons for this. The first is the enacting of Notice Concerning Several Policies and Measures on Carrying out the Development of China’s Vast Western Regions (Guo Fa [2000] No 33) by the State Council, which signifies the government’s formal proposal of the Western Development Strategy and its determination to improve the economy of central and western China in order to narrow the development gap between the regions. The second reason is that the fast growth of the provinces and cities in eastern China is close to saturation and within-group economic strength differences are gradually decreasing with time. Central China also shows a decrease in income inequality. In contrast, the Theil

233Inclusive Development in China: An Assessment 233
index of western China has been going up since 2002 and reached 0.0174 in 2010, 2.9 times the 2000 figure.
Figure 15: Incomes of Urban and Rural Residents (CNY/year)
0
5000
10000
15000
20000
2500019
7819
8019
8519
9019
9119
9219
9319
9419
9519
9619
9719
9819
9920
0020
0120
0220
0320
0420
0520
0620
0720
0820
0920
10
Net Income Per Person of Rural Households Disposable Income Per Person of Urban Households
Source: China National Bureau of Statistics
Table 4: Theil Index of 2000-10 GDP Per Capita and Its Composition in the Three Regions
YearTheil Index Composition of Theil Index (%)
Eastern China
Central China
Western China
Between Regions China Eastern
ChinaCentral China
Western China
Between Regions China
2000 0.0465 0.0129 0.0060 0.1132 0.1786 26.05 7.21 3.35 63.39 100
2001 0.0443 0.0134 0.0060 0.1103 0.1740 25.44 7.71 3.46 63.39 100
2002 0.0424 0.0131 0.0062 0.1087 0.1704 24.86 7.69 3.67 63.79 100
2003 0.0410 0.0132 0.0072 0.1086 0.1700 24.11 7.76 4.25 63.88 100
2004 0.0391 0.0134 0.0076 0.1036 0.1637 23.88 8.21 4.64 63.27 100
2005 0.0394 0.0116 0.0089 0.1028 0.1627 24.20 7.15 5.44 63.21 100
2006 0.0361 0.0117 0.0101 0.0975 0.1555 23.24 7.55 6.49 62.72 100
2007 0.0326 0.0120 0.0108 0.0920 0.1474 22.15 8.13 7.32 62.40 100
2008 0.0274 0.0125 0.0127 0.0801 0.1327 20.67 9.45 9.53 60.35 100
2009 0.0248 0.0121 0.0169 0.0705 0.1244 19.98 9.71 13.60 56.71 100
2010 0.0201 0.0122 0.0174 0.0597 0.1094 18.40 11.14 15.92 54.55 100Source: Calculated from China Statistical Yearbook
The contribution of between-region income inequality to overall income inequality exceeded 60 percent during 2000-08, making it the primary factor in China’s income inequality. The average contribution of within-region income inequality of eastern China to overall inequality during 2000-10 was 23 percent, making it the second most important factor in overall income inequality. During the 11 years, the contribution of western China to overall inequality fluctuated but was gradually upward.

234 Inclusive Development in China: An Assessment
Figure 16: 2000-10 Theil Index in Eastern, Central and Western China and Between Regions
0
0.02
0.04
0.06
0.08
0.1
0.12
2000 2001 2002 2003 2004 2005 2006 2007 2008 2009 2010
Eastern China Central China
Western China Between-Regions
Source: Calculated from China Statistical Yearbook
2.2.3. Quintiles Measure
The quintiles measure identifies the proportion of the total income of the country received by the poorest 20 percent of the population. The China Statistical Yearbook demonstrates that the poorest 20 percent of the population are in rural regions. Therefore, this article selected the low-income rural households (20 percent of the rural population) and part of the population of middle-low income rural households as the poorest 20 percent of the population. The statistics of the China Statistical Yearbook have been used to calculate the proportion of the income of the poorest 20 percent of the population in China’s total income. The results are shown in Table 5.
Table 5: Proportion of Total Income Received by Poorest 20% of Population
Year %2000 5.72582001 5.26152002 5.02252003 4.74252004 4.92902005 4.62142006 4.56872007 4.47432008 4.41782009 4.24362010 4.3945
Source: China Statistical Yearbook

235Inclusive Development in China: An Assessment 235
The proportion of income received by the poorest 20 percent of the population decreased from 5.7258 percent in 2000 to 4.3845 percent in 2010. This shows that inequality between the rich and the poor is expanding and China’s poorest population is becoming relatively poorer.
Figure 17: Proportion of Total Income Received by Poorest 20% of Population
0.06
0.05
0.05
0.05
0.05
0.05
0.05
0.04
0.04
0.04
0.04
0
0.01
0.02
0.03
0.04
0.05
0.06
0.07
2000 2001 2002 2003 2004 2005 2006 2007 2008 2009 2010
Source: China Statistical Yearbook
3. SOCIAL SECURITY, HEALTH, EDUCATION AND FINANCIAL SUPPORT
3.1. Current Situation of Social Security
China’s expenditure on social security soared from 0.8 percent of GDP in 1990 to 10.4 percent in 2010. The covered population rose from 10.9 percent in 1994 to 18.2 percent in 2003. However, since 2003, the proportion of beneficiaries declined, to 15.3 percent in 2010.
The gap in coverage of minimum living standard assistance between urban and rural areas is shrinking. In the dual urban-rural household registration system, the social assistance system, which has minimum living standards assistance as its core, has undergone dual development, and prominent differences exist in resource allocation, management systems, scope, levels of assistance and methods. These differences became a major obstacle to coordinating the social assistance system in urban and rural areas. In the last decade or so, this urban-rural gap has narrowed significantly.
The proportion of the population receiving minimum living standard assistance in cities declined from 59.1 percent in 1999 to 6.6 percent in 2010, mainly because the economy has been growing rapidly, employment is stable, incomes continue to increase and a large number of people are above the minimum living standard. On the other hand, with the aim of building a harmonious society, the coverage in rural areas rose rapidly, from 18.3 percent in 2003 to 60.5 percent in 2006, and this system has been converted from temporary relief to standardised and institutionalised relief. However,

236 Inclusive Development in China: An Assessment
the present system lags behind the increase in rural population, and minimum living standard assistance in rural areas started to decline from 2007, reaching 11.8 percent in 2010.
The number receiving unemployment assistance has been low for a long time. In 1994, the unemployment assistance rate was 2.5 percent. After increases and then changes in policy, the rate in 1998 was 2.0 percent. In January 1999, the State Council promulgated regulations on unemployment insurance. As a result, the unemployment insurance system entered a new period of development and the number receiving assistance increased significantly, to 7.1 percent in 2004. Additionally, policies were readjusted in 2003, and a reemployment project helped many unemployed people to become employed again. Hence, unemployment assistance decreased to 3.2 percent in 2010.
The above data indicates that the social security system is constantly being improved, and the coverage gap in minimum living standard assistance between urban and rural areas is narrowing. However, low coverage of unemployment assistance has remained unresolved for a long time.
3.2. Health
Significant progress has been made in medical resource allocation. The representative indicator is the number of health technicians per 1000 people (Figure 18). The number of medical beds per 1000 people has grown similarly since 1978. Medical beds per 1000 people had been fluctuating at around 2.5 beds from 1990 to 2006 but rose to 3.57 by 2010. Particularly since 2000, great progress has been made in health care reform, focusing on the level of coverage, and per person health care resources have significantly improved.
Figure 18: Medical Personnel in Institutions per 1000 People
2.24
2.57 2.85
3.283.45
3.593.64
3.64
3.633.62
3.41
3.48
3.53
3.573.66
3.763.92
4.154.37
0
0.5
1
1.5
2
2.5
3
3.5
4
4.5
5
1975
1978
1980
1985
1990
1995
1998
1999
2000
2001
2002
2003
2004
2005
2006
2007
2008
2009
2010
Source: China National Bureau of Statistics

237Inclusive Development in China: An Assessment 237
The medical situation in rural areas has shown impressive improvement, health technicians per 1000 people increasing from 1.63 in the early stages of reform to 3.04 in 2010. But structural problems in rural areas still exist, and the gap between urban and rural areas is still large. In 2010, health technicians per 1000 urban people reached 7.62, while the ratio for rural areas was only 3.04. Therefore, future health care policy should continue to focus on the new rural medical cooperation.
The mortality rate of infants and children has been significantly reduced over the past 20 years (Figure 19). The mortality rate of children less than five years old dropped from 61.0 per thousand in 1991 to 16.4 per thousand in 2010. From the graph it can be seen that a gap between urban and rural areas, caused by dietary patterns and the allocation of medical resources, still prevails. Fortunately, the urban-rural gap for infant and child mortality has gradually narrowed in recent years.
Figure 19: Under-Five Child Mortality Rate (per 1000 live births)
0
10
20
30
40
50
60
70
80
1991
1992
1993
1994
1995
1996
1997
1998
1999
2000
2001
2002
2003
2004
2005
2006
2007
2008
2009
2010
Total Urban Areas� Rural Areas
Source: China National Bureau of Statistics
3.3. Education
Since the reform and opening up, significant improvement has been made in the elimination of illiteracy and in education resource allocation, with the average years of schooling in 2010 reaching 9.80 years, 7.5 times higher than the figure in the early years of the reform. The illiteracy rate dropped from 17.82 percent in 1996 to 15.14 percent in 1999 and 6.72 percent in 2000. Two years later, the high cost of education in rural areas and the increased migration of workers to cities made the illiteracy rate rebound to 11.63 percent. From 2003 to 2010, the rate went as low as 4.08 percent, a quarter of the world average.
In the last 20 years, education for all school-age children has been basically achieved. In 1990, the net enrolment rate of school-age children was 97.8 percent. From 1990, reforms in education steadily raised this proportion, to 99.7 percent in 2010. The concept of gender equality in education gradually gained recognition. In 2006, the net

238 Inclusive Development in China: An Assessment
enrolment rate of girls overtook that of boys for the first time, and gender differences have basically been eliminated.
But the greatly varying rate of admission into higher schools deserves further attention. Under the impetus of the nine-year compulsory education policy, the rate of primary school students’ admission into junior high schools rose from 74.6 percent in 1990 to 98.7 percent in 2010. The rate of junior high school students’ admission into senior high schools rose from 40.6 percent in 1990 to 87.5 percent in 2010. But the high school enrolment rate had significant fluctuations; there were two peaks and valleys. The first peak was the increase from 27.3 percent in 1990 to 51.0 percent in 1996, and then the rate quickly fell to 46.1 percent in 1998. The second peak was the increase to 83.5 percent in 2002, but the rate then decreased to 70.3 percent in 2007; subsequently, it climbed to 8 . percent in 2010.
Significant fluctuations in the rate of admission into higher schools reflect two problems. On the one hand, some people think education means only reading and writing, so they are unwilling to invest further in education. On the other hand, the urban-rural wealth gap continues to expand. In primary and junior high schools, the majority of school-age children are supported by the national nine-year compulsory education policy. However, senior high schools do not provide enough subsidies for students, and some are forced by the cost of living to drop out and go to work in labour-intensive industries.
3.4. Governance
Governance involves five aspects, namely transparency, responsibility, the rule of law, responsiveness and efficient management.
Since 1978, the government has come to realise the urgency of improving transparency, which is closely related to the continuity of the reform and opening up and the stability and harmony of society.
On responsibility, the government has specified that its role is to “represent the fundamental interests of the overwhelming majority of the Chinese people”. The government has established a system of publicising major social affairs and government affairs that are closely related to the interests of the grassroots. For example, the news spokesperson system has been set up from central to local governments at all levels; another example is the widely established hearing system for public affairs. Also, the government performance evaluation system has been established to safeguard the interests of the people and evaluate the government’s performance. In their annual performance evaluations, local governments are scored on their management and service by the recipients.
The government has clearly formulated a national strategy to rule the country by law and to establish a socialist country. Rule by law in China has already been basically realised, and practical action has been taken to develop the government’s ability to rule by law, especially laws protecting citizens’ legitimate private property, the administrative licence law and the property law formulated in recent years. However, the rule of law is not just laws, rules and regulations. More important is the spirit of the rule of law

239Inclusive Development in China: An Assessment 239
and the core of the rule of law conveyed by people’s behaviour and social habits, which are shaped by the culture of the law. The government is becoming more mature in constructing and optimising the legal system.
For responsiveness, the government has set up a public opinion communication system and an expert consulting system. Especially with the deepened reform and opening up and the establishment and improvement of the socialist market economy, the government put forward the ruling philosophy of “Love the people, benefit the people, use power for the people” and took “people’s satisfaction and consent” as the starting point of its work. Therefore, the government could respond to opinions and suggestions in practice by solving conflicts and problems. For example, the government has devoted special attention to disadvantaged groups, such as to helping migrant workers to get paid, providing minimum living guarantees and creating a “Green Pass” for poor students to enter universities.
Table 6: Transparency International Corruption Perceptions Index Rating of China
Year Corruption Perceptions Index World Ranking2003 3.4 662004 3.4 712005 3.2 782006 3.3 702007 3.5 722008 3.6 722009 3.6 792010 3.5 782011 3.6 75
Source: Transparency International
The government’s ability to manage efficiently still encounters problems because management costs are high and not in proportion to management income. Government departments are overstaffed, and management costs are higher than in developed countries.
Changes in the government’s governance can be represented by the Corruption Perceptions Index released by Transparency International. China’s rating in the index has improved since 1995, when it was 2.5 (on a scale of 0-10).
4. COMPREHENSIVE ASSESSMENT OF CHINA’S INCLUSIVE GROWTH
4.1. Construction and Calculations of the McKinley Index
According to the measure of inclusive growth by McKinley (2010), the McKinley index is constructed in line with China’s actual conditions, and the weights and corresponding scores of its first grade indicators, second grade indicators and third grade indicators are shown in the following table.

240 Inclusive Development in China: An Assessment
Table 7: Weights and Scores for Indicators of the McKinley Index
China’s inclusive growth indexesFirst grade indicators
Second grade indicators
Third grade indicators Scores
Income (40%)
Income distribution(15%)*4.6=0.69
Poverty population ratio 60% 5Poverty rate 40% 4
Economic growth (10%)*4.8=0.48
Actual GDP growth rate 20% 5Per capita GDP growth rate 20% 4Tertiary industry contribution rate 30% 5Employed workers in tertiary industry at year end 30% 5
Income gap and inequality in distribution (15%)*3.2=0.48
Gini coefficient 10% 3Theil index 1= 20% 3Quintile measure 25% 3Income gap of urban residents 25% 3Regional gap in residents’ income (eastern, central and western) 20% 4
Non-income (60%)
Education (20%)*4.35=0.87
Average schooling years 25% 4Net enrolment rate of pre-school children 10% 5
Enrolment rate of various schools 15% 4Illiteracy rate 25% 5School enrolment rate of girls 25% 4
Health (25%)*4.7=1.175
Health technicians per 1000 persons 30% 5Medical facilities per 1000 persons 30% 4Mortality rate for infants and children 40% 5
Social Security (15%)*3.8=0.57
Expenditure on social security as share of GDP 20% 4
Beneficiaries of social security among target population 20% 3
Minimum living standard assistance rate 20% 4
Unemployment assistance rate 20% 4 Corruption Perceptions Index 20% 4
Scores from 1 to 3 mean unsatisfactory progress, from 4 to 7 satisfactory progress, from 8 to 10 outstanding progress. China’s overall McKinley index is 4.265, which corresponds to satisfactory progress and shows that the government has made great progress in poverty reduction, income distribution, social security and the supply of public goods.

241Inclusive Development in China: An Assessment 241
4.2. Factors Impeding Inclusive Growth
First, farmers account for just over 50 percent of the total population of China. Since the poverty-stricken population is mainly from rural areas, rural poverty alleviation policies could temporarily improve the situation. However, to completely alleviate poverty in rural areas calls for a huge investment of personnel and resources, and the implementation and effect of such policies require time.
Second, per capita income is not equally distributed, and the gap between rich and poor is growing. The original intention of reform and opening up was to enable some people to become rich at first, and then let these people lead the rest of the population along a road to greater wealth. But the efforts to help the rest of the population become richer still need a long time to be effective. Different people have varying levels of knowledge, which affects their employment opportunities and income. The economy in areas with rapid economic growth is developing faster and faster, while areas where economic growth is not as robust need to adopt advanced technology and need new skills. All of these factors have caused the widening gap between rich and poor.
Third, the urban-rural income gap, which is the main income disparity in China, is widening. The dual household registration system promoted faster development of urban areas and gave them unparalleled advantages in introducing advanced technology and skills, but the infrastructure in rural areas was poor and the starting point of development was low. With rapid economic development, the gap between urban and rural areas will become increasingly evident.
Fourth, economic differences appear among regions. The eastern region has a unique geographical advantage. Although the government has formulated policies and measures to reduce regional disparities, constrained by actual conditions, local customs and thought adherence, leapfrog development will take a longer time and the gap among regions will widen.
Fifth, residents of urban and rural areas have a different understanding of education. Rural citizens are relatively conservative, and their understanding of education is not profound; consequently, the educated proportion of the population is not as high as in urban areas. In addition, driven by the economic pressures, many rural residents prematurely enter the market for manual labour, which widens the income gap separating them from educated people.
Sixth, more efforts need to be made in social security. China is a populous country, and rural residents are the majority of its population. Given the difficulties of social security work, many people do not enjoy the fruits of reform and opening up and social progress. Because, with the deepening of reform, the employment structure has been greatly changed and the unemployment rate has risen, the improvement of unemployment assistance requires a significant investment of capital.

242 Inclusive Development in China: An Assessment
4.3. Conclusion
In the past three decades, the Chinese government has made great efforts to reduce poverty, improve income distribution, optimise social security and increase the supply of public goods, with remarkable success. Improvements are not obvious on the income gap, uneven distribution among regions and between urban and rural areas. The government is developing measures to narrow the income gap between urban and rural areas and to achieve common prosperity. Significant improvement has been made in per capita health care resources. Education for school-age children has basically achieved full coverage and gender differences in education have basically been eliminated. The share of social security in GDP continues to rise. The final score of the McKinley index score is 4.265, indicating that China’s inclusive growth has achieved satisfactory progress, with room for further improvement. In the future, more progress needs to be made in improving income distribution, reducing the income gap among regions and between urban and rural areas, optimising social security and providing financial support to rural areas, agriculture, farmers and the private sector.
REFERENCES
China Statistical Yearbook, China National Bureau of Statistics, 1978-2011Conceicao, Pedro, James K. Galbraith and Peter Bradford, The Theil Index in Sequences
of Nested and Hierarchic Grouping Structures: Implications for the Measurement of Inequality through Time with Data Aggregated at Different Levels of Industrial Classification, UTIP Working Paper, 2000 Vol 5.
Li Yang, Tao Xiangwei & Li Qi, An Analysis of the Theil Index of Regional Economic Inequality in Henan Province. Journal of Henan Agricultural University, 2009 Vol 1. McKinley, Terry, Inclusive Growth Criteria and Indicators: An Inclusive Growth Index for Diagnosis of Country Progress, Asian Development Bank,2010
Tian Weimin, “Calculation and the Changing Trend of China’s Gini Coefficient”, the Humanities, 2012 Vol 2.
Yu Chengxue, A Study of the Multi-indicator Measure of Theil Index of China’s Regional Economic Inequality, Eastern China Economic Management, 2009Vol 7.

LIST OF GMS -DAN PUBLICATIONS
GMS -DAN 1: Impact of the Asian Financial Crisis On the Southeast Asian Transitional Economies (1999)
GMS-DAN 2: Labour Markets in Transitional Economies in Southeast Asia and Thailand: A Study in Four Countries (2001)
GMS-DAN 3: Off-farm and Non-farm Employment in Southeast Asian Transitional Economies and Thailand (2003)
GMS-DAN 4: The Cross Border Economies of Cambodia, Laos, Thailand and Vietnam (2005)
GMS-DAN 5: Pro-Poor Tourism in the Greater Mekong SubRegion (2007)
GMS-DAN 6: Cost and Benefits of Cross-Country Labour Migration in the GMS (2012)
GMS-DAN 7: Agricultural Trade in the Greater Mekong SubRegion (2012)
GMS-DAN 8: Assessing China’s Impact on Poverty Reduction In the Greater Mekong Subregion (2013)

THE GREATER MEKONG SUBREGION DEVELOPMENT ANALYSIS
NETWORK (GMS-DAN) is a collaborative development research
network of leading research institutes in Cambodia, Laos, Thailand,
Vietnam and Yunnan province of China. GMS-DAN was established in
1997-8. GMS-DAN has been undertaking collaborative work to address
major GMS development issues and to provide useful information to
policy makers and other stakeholders in the development of the GMS.
GMS-DAN is coordinated by the Cambodia Development Resource
Institute (CDRI). GMS-DAN has received generous financial support
for research and publications from the Rockefeller Foundation and
International Development Research Centre of Canada (IDRC).
INC
LU
SIV
E D
EV
EL
OP
ME
NT
IN
TH
E G
RE
AT
ER
ME
KO
NG
SU
BR
EG
ION
: A
N A
SS
ES
SM
EN
T