Embed Size (px)
Citation preview

Physics
Physics Research Publications
Purdue University Year
Inclusive pi(0), eta, and direct photon
production at high transverse momentum
in p plus p and d plus Au collisions at
root s(NN)=200 GeVB. I. Abelev, M. M. Aggarwal, Z. Ahammed, A. V. Alakhverdyants, B. D.Anderson, D. Arkhipkin, G. S. Averichev, J. Balewski, O. Barannikova, L. S.Barnby, S. Baumgart, D. R. Beavis, R. Bellwied, F. Benedosso, M. J. Betan-court, R. R. Betts, A. Bhasin, A. K. Bhati, H. Bichsel, J. Bielcik, J. Bielcikova,B. Biritz, L. C. Bland, B. E. Bonner, J. Bouchet, E. Braidot, A. V. Brandin, A.Bridgeman, E. Bruna, S. Bueltmann, I. Bunzarov, T. P. Burton, X. Z. Cai, H.Caines, M. C. D. Sanchez, O. Catu, D. Cebra, R. Cendejas, M. C. Cervantes,Z. Chajecki, P. Chaloupka, S. Chattopadhyay, H. F. Chen, J. H. Chen, J. Y.Chen, J. Cheng, M. Cherney, A. Chikanian, K. E. Choi, W. Christie, P. Chung,R. F. Clarke, M. J. M. Codrington, R. Corliss, J. G. Cramer, H. J. Crawford,D. Das, S. Dash, A. D. Leyva, L. C. De Silva, R. R. Debbe, T. G. Dedovich,M. DePhillips, A. A. Derevschikov, R. D. de Souza, L. Didenko, P. Djawotho,S. M. Dogra, X. Dong, J. L. Drachenberg, J. E. Draper, J. C. Dunlop, M. R. D.Mazumdar, L. G. Efimov, E. Elhalhuli, M. Elnimr, J. Engelage, G. Eppley, B.Erazmus, M. Estienne, L. Eun, P. Fachini, R. Fatemi, J. Fedorisin, R. G. Fer-sch, P. Filip, E. Finch, V. Fine, Y. Fisyak, C. A. Gagliardi, D. R. Gangadharan,M. S. Ganti, E. J. Garcia-Solis, A. Geromitsos, F. Geurts, V. Ghazikhanian,P. Ghosh, Y. N. Gorbunov, A. Gordon, O. Grebenyuk, D. Grosnick, B. Grube,S. M. Guertin, A. Gupta, N. Gupta, W. Guryn, B. Haag, T. J. Hallman, A.Hamed, L. X. Han, J. W. Harris, J. P. Hays-Wehle, M. Heinz, S. Heppelmann,A. Hirsch, E. Hjort, A. M. Hoffman, G. W. Hoffmann, D. J. Hofman, R. S.Hollis, H. Z. Huang, T. J. Humanic, L. Huo, G. Igo, A. Iordanova, P. Jacobs,W. W. Jacobs, P. Jakl, C. Jena, F. Jin, C. L. Jones, P. G. Jones, J. Joseph, E.G. Judd, S. Kabana, K. Kajimoto, K. Kang, J. Kapitan, K. Kauder, D. Keane,A. Kechechyan, D. Kettler, D. P. Kikola, J. Kiryluk, A. Kisiel, S. R. Klein, A.G. Knospe, A. Kocoloski, D. D. Koetke, T. Kollegger, J. Konzer, M. Kopytine,I. Koralt, W. Korsch, L. Kotchenda, V. Kouchpil, P. Kravtsov, K. Krueger, M.
Krus, L. Kumar, P. Kurnadi, M. A. C. Lamont, J. M. Landgraf, S. LaPointe, J.Lauret, A. Lebedev, R. Lednicky, C. H. Lee, J. H. Lee, W. Leight, M. J. LeVine,C. Li, L. Li, N. Li, W. Li, X. Li, Y. Li, Z. Li, G. Lin, S. J. Lindenbaum, M. A.Lisa, F. Liu, H. Liu, J. Liu, T. Ljubicic, W. J. Llope, R. S. Longacre, W. A.Love, Y. Lu, G. L. Ma, Y. G. Ma, D. P. Mahapatra, R. Majka, O. I. Mall, L.K. Mangotra, R. Manweiler, S. Margetis, C. Markert, H. Masui, H. S. Matis,Y. A. Matulenko, D. McDonald, T. S. McShane, A. Meschanin, R. Milner, N.G. Minaev, S. Mioduszewski, A. Mischke, M. K. Mitrovski, B. Mohanty, M.M. Mondal, D. A. Morozov, M. G. Munhoz, B. K. Nandi, C. Nattrass, T. K.Nayak, J. M. Nelson, P. K. Netrakanti, M. J. Ng, L. V. Nogach, S. B. Nuru-shev, G. Odyniec, A. Ogawa, H. Okada, V. Okorokov, D. Olson, M. Pachr, B.S. Page, S. K. Pal, Y. Pandit, Y. Panebratsev, T. Pawlak, T. Peitzmann, V.Perevoztchikov, C. Perkins, W. Peryt, S. C. Phatak, P. Pile, M. Planinic, M. A.Ploskon, J. Pluta, D. Plyku, N. Poljak, A. M. Poskanzer, Bvks Potukuchi, C.B. Powell, D. Prindle, C. Pruneau, N. K. Pruthi, P. R. Pujahari, J. Putschke,R. Raniwala, S. Raniwala, R. L. Ray, R. Redwine, R. Reed, J. M. Rehberg, H.G. Ritter, J. B. Roberts, O. V. Rogachevskiy, J. L. Romero, A. Rose, C. Roy,L. Ruan, M. J. Russcher, R. Sahoo, S. Sakai, I. Sakrejda, T. Sakuma, S. Salur,J. Sandweiss, E. Sangaline, J. Schambach, R. P. Scharenberg, N. Schmitz, T.R. Schuster, J. Seele, J. Seger, I. Selyuzhenkov, P. Seyboth, E. Shahaliev, M.Shao, M. Sharma, S. S. Shi, E. P. Sichtermann, F. Simon, R. N. Singaraju, M.J. Skoby, N. Smirnov, P. Sorensen, J. Sowinski, H. M. Spinka, B. Srivastava,T. D. S. Stanislaus, D. Staszak, J. R. Stevens, R. Stock, M. Strikhanov, B.Stringfellow, A. A. P. Suaide, M. C. Suarez, N. L. Subba, M. Sumbera, X. M.Sun, Y. Sun, Z. Sun, B. Surrow, T. J. M. Symons, A. S. de Toledo, J. Takahashi,A. H. Tang, Z. Tang, L. H. Tarini, T. Tarnowsky, D. Thein, J. H. Thomas, J.Tian, A. R. Timmins, S. Timoshenko, D. Tlusty, M. Tokarev, T. A. Trainor, V.N. Tram, S. Trentalange, R. E. Tribble, O. D. Tsai, J. Ulery, T. Ullrich, D. G.Underwood, G. Van Buren, G. van Nieuwenhuizen, J. A. Vanfossen, R. Varma,G. M. S. Vasconcelos, A. N. Vasiliev, F. Videbaek, Y. P. Viyogi, S. Vokal, S. A.Voloshin, M. Wada, M. Walker, F. Wang, G. Wang, H. Wang, J. S. Wang, Q.Wang, X. Wang, X. L. Wang, Y. Wang, G. Webb, J. C. Webb, G. D. Westfall,C. Whitten, H. Wieman, E. Wingfield, S. W. Wissink, R. Witt, Y. Wu, W. Xie,N. Xu, Q. H. Xu, W. Xu, Y. Xu, Z. Xu, L. Xue, Y. Yang, P. Yepes, K. Yip, I.K. Yoo, Q. Yue, M. Zawisza, H. Zbroszczyk, W. Zhan, S. Zhang, W. M. Zhang,X. P. Zhang, Y. Zhang, Z. P. Zhang, J. Zhao, C. Zhong, J. Zhou, W. Zhou, X.Zhu, Y. H. Zhu, R. Zoulkarneev, and Y. Zoulkarneeva
This paper is posted at Purdue e-Pubs.
http://docs.lib.purdue.edu/physics articles/1139

PHYSICAL REVIEW C 81, 064904 (2010)
Inclusive π0, η, and direct photon production at high transverse momentum in p + pand d + Au collisions at
√sN N = 200 GeV
B. I. Abelev,8 M. M. Aggarwal,30 Z. Ahammed,47 A. V. Alakhverdyants,17 B. D. Anderson,18 D. Arkhipkin,3 G. S. Averichev,17
J. Balewski,22 O. Barannikova,8 L. S. Barnby,2 S. Baumgart,52 D. R. Beavis,3 R. Bellwied,50 F. Benedosso,27
M. J. Betancourt,22 R. R. Betts,8 A. Bhasin,16 A. K. Bhati,30 H. Bichsel,49 J. Bielcik,10 J. Bielcikova,11 B. Biritz,6 L. C. Bland,3
B. E. Bonner,36 J. Bouchet,18 E. Braidot,27 A. V. Brandin,25 A. Bridgeman,1 E. Bruna,52 S. Bueltmann,29 I. Bunzarov,17
T. P. Burton,2 X. Z. Cai,40 H. Caines,52 M. Calderon de la Barca Sanchez,5 O. Catu,52 D. Cebra,5 R. Cendejas,6
M. C. Cervantes,42 Z. Chajecki,28 P. Chaloupka,11 S. Chattopadhyay,47 H. F. Chen,38 J. H. Chen,40 J. Y. Chen,51 J. Cheng,44
M. Cherney,9 A. Chikanian,52 K. E. Choi,34 W. Christie,3 P. Chung,11 R. F. Clarke,42 M. J. M. Codrington,42 R. Corliss,22
J. G. Cramer,49 H. J. Crawford,4 D. Das,5 S. Dash,13 A. Davila Leyva,43 L. C. De Silva,50 R. R. Debbe,3 T. G. Dedovich,17
M. DePhillips,3 A. A. Derevschikov,32 R. Derradi de Souza,7 L. Didenko,3 P. Djawotho,42 S. M. Dogra,16 X. Dong,21
J. L. Drachenberg,42 J. E. Draper,5 J. C. Dunlop,3 M. R. Dutta Mazumdar,47 L. G. Efimov,17 E. Elhalhuli,2 M. Elnimr,50
J. Engelage,4 G. Eppley,36 B. Erazmus,41 M. Estienne,41 L. Eun,31 P. Fachini,3 R. Fatemi,19 J. Fedorisin,17 R. G. Fersch,19
P. Filip,17 E. Finch,52 V. Fine,3 Y. Fisyak,3 C. A. Gagliardi,42 D. R. Gangadharan,6 M. S. Ganti,47 E. J. Garcia-Solis,8
A. Geromitsos,41 F. Geurts,36 V. Ghazikhanian,6 P. Ghosh,47 Y. N. Gorbunov,9 A. Gordon,3 O. Grebenyuk,21 D. Grosnick,46
B. Grube,34 S. M. Guertin,6 A. Gupta,16 N. Gupta,16 W. Guryn,3 B. Haag,5 T. J. Hallman,3 A. Hamed,42 L.-X. Han,40
J. W. Harris,52 J. P. Hays-Wehle,22 M. Heinz,52 S. Heppelmann,31 A. Hirsch,33 E. Hjort,21 A. M. Hoffman,22 G. W. Hoffmann,43
D. J. Hofman,8 R. S. Hollis,8 H. Z. Huang,8 T. J. Humanic,28 L. Huo,42 G. Igo,6 A. Iordanova,8 P. Jacobs,21 W. W. Jacobs,15
P. Jakl,11 C. Jena,13 F. Jin,40 C. L. Jones,22 P. G. Jones,2 J. Joseph,18 E. G. Judd,4 S. Kabana,41 K. Kajimoto,43 K. Kang,44
J. Kapitan,11 K. Kauder,8 D. Keane,18 A. Kechechyan,17 D. Kettler,49 D. P. Kikola,21 J. Kiryluk,21 A. Kisiel,48 S. R. Klein,21
A. G. Knospe,52 A. Kocoloski,22 D. D. Koetke,46 T. Kollegger,12 J. Konzer,33 M. Kopytine,18 I. Koralt,29 W. Korsch,19
L. Kotchenda,25 V. Kouchpil,11 P. Kravtsov,25 K. Krueger,1 M. Krus,10 L. Kumar,30 P. Kurnadi,6 M. A. C. Lamont,3
J. M. Landgraf,3 S. LaPointe,50 J. Lauret,3 A. Lebedev,3 R. Lednicky,17 C.-H. Lee,34 J. H. Lee,3 W. Leight,22 M. J. LeVine,3
C. Li,38 L. Li,43 N. Li,51 W. Li,40 X. Li,33 X. Li,39 Y. Li,44 Z. Li,51 G. Lin,52 S. J. Lindenbaum,26,* M. A. Lisa,28 F. Liu,51
H. Liu,5 J. Liu,36 T. Ljubicic,3 W. J. Llope,36 R. S. Longacre,3 W. A. Love,3 Y. Lu,38 G. L. Ma,40 Y. G. Ma,40 D. P. Mahapatra,13
R. Majka,52 O. I. Mall,5 L. K. Mangotra,16 R. Manweiler,46 S. Margetis,18 C. Markert,43 H. Masui,21 H. S. Matis,21
Yu. A. Matulenko,32 D. McDonald,36 T. S. McShane,9 A. Meschanin,32 R. Milner,22 N. G. Minaev,32 S. Mioduszewski,42
A. Mischke,27 M. K. Mitrovski,12 B. Mohanty,47 M. M. Mondal,47 D. A. Morozov,32 M. G. Munhoz,37 B. K. Nandi,14
C. Nattrass,52 T. K. Nayak,47 J. M. Nelson,2 P. K. Netrakanti,33 M. J. Ng,4 L. V. Nogach,32 S. B. Nurushev,32 G. Odyniec,21
A. Ogawa,3 H. Okada,3 V. Okorokov,25 D. Olson,21 M. Pachr,10 B. S. Page,15 S. K. Pal,47 Y. Pandit,18 Y. Panebratsev,17
T. Pawlak,48 T. Peitzmann,27 V. Perevoztchikov,3 C. Perkins,4 W. Peryt,48 S. C. Phatak,13 P. Pile,3 M. Planinic,53
M. A. Ploskon,21 J. Pluta,48 D. Plyku,29 N. Poljak,53 A. M. Poskanzer,21 B. V. K. S. Potukuchi,16 C. B. Powell,21 D. Prindle,49
C. Pruneau,50 N. K. Pruthi,30 P. R. Pujahari,14 J. Putschke,52 R. Raniwala,35 S. Raniwala,35 R. L. Ray,43 R. Redwine,22
R. Reed,5 J. M. Rehberg,12 H. G. Ritter,21 J. B. Roberts,36 O. V. Rogachevskiy,17 J. L. Romero,5 A. Rose,21 C. Roy,41 L. Ruan,3
M. J. Russcher,27 R. Sahoo,41 S. Sakai,6 I. Sakrejda,21 T. Sakuma,22 S. Salur,5 J. Sandweiss,52 E. Sangaline,5 J. Schambach,43
R. P. Scharenberg,33 N. Schmitz,23 T. R. Schuster,12 J. Seele,22 J. Seger,9 I. Selyuzhenkov,15 P. Seyboth,23 E. Shahaliev,17
M. Shao,38 M. Sharma,50 S. S. Shi,51 E. P. Sichtermann,21 F. Simon,23 R. N. Singaraju,47 M. J. Skoby,33 N. Smirnov,52
P. Sorensen,3 J. Sowinski,15 H. M. Spinka,1 B. Srivastava,33 T. D. S. Stanislaus,46 D. Staszak,6 J. R. Stevens,15 R. Stock,12
M. Strikhanov,25 B. Stringfellow,33 A. A. P. Suaide,37 M. C. Suarez,8 N. L. Subba,18 M. Sumbera,11 X. M. Sun,21 Y. Sun,38
Z. Sun,20 B. Surrow,22 T. J. M. Symons,21 A. Szanto de Toledo,37 J. Takahashi,7 A. H. Tang,3 Z. Tang,38 L. H. Tarini,50
T. Tarnowsky,24 D. Thein,43 J. H. Thomas,21 J. Tian,40 A. R. Timmins,50 S. Timoshenko,25 D. Tlusty,11 M. Tokarev,17
T. A. Trainor,49 V. N. Tram,21 S. Trentalange,6 R. E. Tribble,42 O. D. Tsai,6 J. Ulery,33 T. Ullrich,3 D. G. Underwood,1
G. Van Buren,3 G. van Nieuwenhuizen,22 J. A. Vanfossen Jr.,18 R. Varma,14 G. M. S. Vasconcelos,7 A. N. Vasiliev,32
F. Videbaek,3 Y. P. Viyogi,47 S. Vokal,17 S. A. Voloshin,50 M. Wada,43 M. Walker,22 F. Wang,33 G. Wang,6 H. Wang,24
J. S. Wang,20 Q. Wang,33 X. Wang,44 X. L. Wang,38 Y. Wang,44 G. Webb,19 J. C. Webb,46 G. D. Westfall,24 C. Whitten Jr.,6
H. Wieman,21 E. Wingfield,43 S. W. Wissink,15 R. Witt,45 Y. Wu,51 W. Xie,33 N. Xu,21 Q. H. Xu,39 W. Xu,6 Y. Xu,38 Z. Xu,3
L. Xue,40 Y. Yang,20 P. Yepes,36 K. Yip,3 I.-K. Yoo,34 Q. Yue,44 M. Zawisza,48 H. Zbroszczyk,48 W. Zhan,20 S. Zhang,40
W. M. Zhang,18 X. P. Zhang,21 Y. Zhang,21 Z. P. Zhang,38 J. Zhao,40 C. Zhong,40 J. Zhou,36 W. Zhou,39 X. Zhu,44 Y. H. Zhu,40
R. Zoulkarneev,17 and Y. Zoulkarneeva17
(STAR Collaboration)1Argonne National Laboratory, Argonne, Illinois 60439, USA
2University of Birmingham, Birmingham, United Kingdom3Brookhaven National Laboratory, Upton, New York 11973, USA
4University of California, Berkeley, California 94720, USA5University of California, Davis, California 95616, USA
6University of California, Los Angeles, California 90095, USA7Universidade Estadual de Campinas, Sao Paulo, Brazil
0556-2813/2010/81(6)/064904(26) 064904-1 ©2010 The American Physical Society

B. I. ABELEV et al. PHYSICAL REVIEW C 81, 064904 (2010)
8University of Illinois at Chicago, Chicago, Illinois 60607, USA9Creighton University, Omaha, Nebraska 68178, USA
10Czech Technical University in Prague, FNSPE, Prague CZ-115 19, Czech Republic11Nuclear Physics Institute AS CR, 250 68 Rez/Prague, Czech Republic
12University of Frankfurt, Frankfurt, Germany13Institute of Physics, Bhubaneswar 751005, India
14Indian Institute of Technology, Mumbai, India15Indiana University, Bloomington, Indiana 47408, USA
16University of Jammu, Jammu 180001, India17Joint Institute for Nuclear Research, Dubna RU-141 980, Russia
18Kent State University, Kent, Ohio 44242, USA19University of Kentucky, Lexington, Kentucky, 40506-0055, USA
20Institute of Modern Physics, Lanzhou, China21Lawrence Berkeley National Laboratory, Berkeley, California 94720, USA
22Massachusetts Institute of Technology, Cambridge, Massachusetts 02139-4307, USA23Max-Planck-Institut fur Physik, Munich, Germany
24Michigan State University, East Lansing, Michigan 48824, USA25Moscow Engineering Physics Institute, Moscow, Russia
26City College of New York, New York City, New York 10031, USA27NIKHEF and Utrecht University, Amsterdam, The Netherlands
28Ohio State University, Columbus, Ohio 43210, USA29Old Dominion University, Norfolk, Virginia 23529, USA
30Panjab University, Chandigarh 160014, India31Pennsylvania State University, University Park, Pennsylvania 16802, USA
32Institute of High Energy Physics, Protvino, Russia33Purdue University, West Lafayette, Indiana 47907, USA
34Pusan National University, Pusan, Republic of Korea35University of Rajasthan, Jaipur 302004, India36Rice University, Houston, Texas 77251, USA
37Universidade de Sao Paulo, Sao Paulo, Brazil38University of Science & Technology of China, Hefei 230026, China
39Shandong University, Jinan, Shandong 250100, China40Shanghai Institute of Applied Physics, Shanghai 201800, China
41SUBATECH, Nantes, France42Texas A&M University, College Station, Texas 77843, USA
43University of Texas, Austin, Texas 78712, USA44Tsinghua University, Beijing 100084, China
45United States Naval Academy, Annapolis, Maryland 21402, USA46Valparaiso University, Valparaiso, Indiana 46383, USA
47Variable Energy Cyclotron Centre, Kolkata 700064, India48Warsaw University of Technology, Warsaw, Poland
49University of Washington, Seattle, Washington 98195, USA50Wayne State University, Detroit, Michigan 48201, USA
51Institute of Particle Physics, CCNU (HZNU), Wuhan 430079, China52Yale University, New Haven, Connecticut 06520, USA
53University of Zagreb, Zagreb HR-10002, Croatia(Received 18 December 2009; published 15 June 2010)
We report a measurement of high-pT inclusive π 0, η, and direct photon production in p + p and d + Aucollisions at
√sNN = 200 GeV at midrapidity (0 < η < 1). Photons from the decay π0 → γ γ were detected
in the barrel electromagnetic calorimeter of the STAR experiment at the Relativistic Heavy Ion Collider. Theη → γ γ decay was also observed and constituted the first η measurement by STAR. The first direct photoncross-section measurement by STAR is also presented; the signal was extracted statistically by subtracting theπ 0, η, and ω(782) decay background from the inclusive photon distribution observed in the calorimeter. Theanalysis is described in detail, and the results are found to be in good agreement with earlier measurements andwith next-to-leading-order perturbative QCD calculations.
DOI: 10.1103/PhysRevC.81.064904 PACS number(s): 13.85.Ni, 13.85.Qk, 13.87.Fh, 25.75.−q
064904-2

INCLUSIVE π 0, η, AND DIRECT PHOTON . . . PHYSICAL REVIEW C 81, 064904 (2010)
I. INTRODUCTION
The high center-of-mass energy (√
sNN = 200 GeV) of theRelativistic Heavy Ion Collider (RHIC) opens up the hardscattering regime, which is accessed by measuring particleproduction at high transverse momentum pT . The high-pT
particles (pT � 3 GeV/c) originate from the fragmentation ofpartons that have scattered in the early stage of the collisions.Hence, in heavy-ion collisions the high-pT particles can beused to probe the produced medium of strongly interactingmatter. A significant suppression of high-pT hadron produc-tion relative to a simple binary collision scaling from p + p
has been observed at RHIC in central Au + Au collisions [1].Furthermore, it was found that jetlike correlations opposite totrigger jets are suppressed and that the azimuthal anisotropyin hadron emission persists out to very high pT [2–4]. Incontrast, no suppression effects were seen in d + Au collisions[5–8], which has led to the conclusion that the observationsmade in Au + Au are attributable to the high-density mediumproduced in such collisions and not to initial-state effects. Themost probable explanation to date is that the suppression isattributable to parton energy loss from induced gluon radiation(jet quenching) in the extremely hot and dense medium [9].To quantitatively understand this behavior and, in particular,to separate hot from cold nuclear-matter effects, such as theCronin effect [10] and parton shadowing and antishadowing[11–13], precise measurements of identified hadrons at highpT in p + p and d + Au collisions are required [14].
Prompt photons have long been proposed as a powerful toolfor studying the jet quenching via photon-jet correlations [15].In the dominant hard photon production processes (quark-gluon Compton scattering and quark-antiquark annihilation),the outgoing photon balances the momentum of its partnerparton and has large enough mean free path to escape thecollision system, providing a calibrated probe for studyingthe energy loss and mean free path of the parton in themedium. In addition, prompt photons constitute a backgroundfor measuring the medium-induced production of photons inresponse to the energy deposited by that parton [16].
The thermal photon spectrum is directly related to thetemperature of the hot and dense medium created in the heavy-ion collision, provided that it is in thermal equilibrium [17].The measurement of such a spectrum requires a knowledgeof the prompt photon background, which can be measuredin p + p and d + Au systems that share multiple sourcesof photons with heavy-ion collisions but are not expected toproduce an extended thermal system.
The measurements of π0’s and direct photons in p + p
collisions are also of specific interest for studies of the protonspin structure (see, e.g., Ref. [18]), which are under wayat RHIC. A main objective of the RHIC spin program isto constrain the polarization of the gluons inside the proton[�G(x)]. The unpolarized cross sections provide a test ofthe next-to-leading-order perturbative QCD (NLO pQCD)framework, which is used to interpret the measured spin-dependent observables.
*Deceased.
In this article, we present the first results for the high-pT π0,η, and direct photon production in p + p and d + Au collisionsat
√sNN = 200 GeV in the pseudorapidity range 0 < η < 1,
measured by the STAR experiment at RHIC (except thecross section for π0 production in p + p collisions, firstpresented in Ref. [19]). The STAR barrel electromagneticcalorimeter was used to detect high-pT π0 and η mesonsvia their γ γ decays. The direct photon signal was extractedstatistically by subtracting the π0, η, and ω(782) decaybackground from the inclusive photon distribution observedin the calorimeter. The presented data constitute a necessarybaseline for the measurements of π0, η, and direct photonproduction in heavy-ion collisions at RHIC. Inclusive π0
production was previously measured in STAR for low pT atmidrapidity in Au + Au collisions at
√sNN = 130 GeV [20]
and 200 GeV [21], and at the forward rapidities in p + p andd + Au collisions at
√sNN = 200 GeV [22]. STAR has also
measured the production of other identified particles, suchas π±, K±, p/p, and hadronic resonances [14,23–25]. ThePHENIX experiment at RHIC has also measured the π0, η,and direct photon production at
√sNN = 200 GeV in a variety
of collision systems, including p + p and d + Au [6,26–29].The article is organized as follows. In Sec. II, we describe
the detectors that were used in this analysis. In Sec. III, wedescribe the data-processing chain used to reconstruct photoncandidates in the raw data. Sections IV and V show how thesephoton candidates were used to calculate the yields of π0 and η
and direct photons, respectively. Finally, in Sec. VI, we presentthe results and compare our data to the theoretical calculationsand to the measurements by other experiments.
II. EXPERIMENTAL SETUP
The STAR detector (solenoidal tracker at RHIC) [30] wasdesigned primarily for measurements of hadron production inheavy-ion and proton-proton collisions over a large solid angle.For this purpose, tracking detectors with large acceptance andhigh granularity were placed inside a large-volume solenoidalmagnetic field (0.5 T). The detector subsystems relevant for thepresent analysis are briefly described in the following sections.
A. Time projection chamber
The time projection chamber (TPC) [31] is the centraltracking device in STAR. It allows one to track chargedparticles, measure their momenta, and identify the particlespecies by measuring the ionization energy loss dE/dx.
The TPC barrel measures 4.2 m in length and has an innerradius of 0.5 m and an outer radius of 2 m. The TPC acceptancecovers ±1.8 units in pseudorapidity and full azimuth. Particlemomentum is measured in the range 0.1–30 GeV/c. In thisanalysis, TPC tracks were used to reconstruct the interactionvertex and to identify the energy deposits of charged particlesin the calorimeter.
B. Forward TPC modules
Two forward time projection chambers (FTPCs) [32] extendthe STAR tracking capability to the pseudorapidity range2.5 < |η| < 4. Each FTPC is a cylindrical volume with a
064904-3

B. I. ABELEV et al. PHYSICAL REVIEW C 81, 064904 (2010)
diameter of 75 cm and a length of 120 cm, with radial drift fieldand pad readout chambers mounted on the outer cylindricalsurface. Two such detectors were installed partially insidethe main TPC, on both sides of the interaction point. In thisanalysis, the forward charged-track multiplicity recorded inthe FTPC in the gold beam direction served as a measure ofthe centrality in d + Au collisions.
C. Barrel electromagnetic calorimeter
A barrel electromagnetic calorimeter (BEMC) [33] was in-crementally added to the STAR setup in 2001–2005 to measurethe energy deposited by high-pT photons and electrons and toprovide a trigger signal. The calorimeter is located inside themagnet coil and surrounds the TPC, covering a pseudorapidityrange |η| < 1 and full azimuth.
The full calorimeter consists of two contiguous half barrels,located east and west of the nominal interaction point, eachof which is azimuthally segmented into 60 modules. Eachmodule is approximately 26 cm wide and covers 6◦ (105 mrad)in azimuth and one unit in pseudorapidity. The active depthis 23.5 cm, to which 6.6 cm of structural elements are addedat the outer radius. Results presented in this article used onlythe west calorimeter half barrel (0 < η < 1), which was fullyinstalled and calibrated in 2003–2005.
The modules are segmented into 40 projective towers oflead-scintillator stacks, 2 in the ϕ and 20 in the η direction.A tower covers 0.05 rad in �ϕ and 0.05 units in �η. Eachcalorimeter half barrel is thus segmented into a total of 2400towers. Each tower consists of a stack of 20 layers of leadand 21 layers of scintillator. All these layers are 5 mm thick,except the first two scintillator layers, which are 6 mm thick. Aseparate readout of these two layers provides the calorimeterpreshower signal, which was not used in this analysis. Ashower maximum detector (see the following section) ispositioned behind the fifth scintillator layer. The whole stack isheld together by mechanical compression and friction betweenlayers. From layer-by-layer tests of the BEMC optical system,together with an analysis of cosmic ray and beam test data, thenominal energy resolution of the calorimeter is estimated tobe δE/E = 14%/
√E(GeV) ⊕ 1.5% [33].
D. Shower maximum detector
The shower maximum detector (SMD) is a multiwireproportional counter with strip readout. It is located at a depthof approximately 5.6 radiation lengths at η = 0, increasingto 7.9 radiation lengths at η = 1, including all materialimmediately in front of the calorimeter. The purpose of theSMD is to improve the spatial resolution of the calorimeter andto measure the shower profile. This is necessary because thetransverse dimension of each tower (≈10 × 10 cm2) is muchlarger than the lateral spread of an electromagnetic shower. Theimproved resolution is essential for separating the two photonshowers originating from the decay of high-momentum π0 andη mesons.
Independent cathode planes with strips along the η andϕ directions allow the reconstruction of two projections of a
shower. The coverage is �η × �ϕ = 0.0064 × 0.1 rad for theη strips and 0.1 × 0.0064 rad for the ϕ strips, with each groupof 2 × 2 towers covering 15 strips in each SMD plane behindit. In total, the SMD contains 36 000 strips.
E. Trigger detectors
In addition to the STAR barrel detectors, sampling hadroniccalorimeters were placed at a distance of 18 m from theinteraction point on both sides of the experimental hall. Inheavy-ion collisions, these zero-degree calorimeters (ZDCs)[34,35] measure the total energy of the unbound neutronsemitted from the nuclear fragments after a collision. Thecharged fragments of the collision are bent away by the RHICdipole magnets upstream of the ZDCs. For the d + Au dataused in this analysis, the ZDC provided a collision trigger byrequiring the detection of at least one neutron in the gold beamdirection.
To provide a collision trigger in p + p collisions, beam-beam counters (BBCs) [36,37] were mounted around the beampipe beyond both pole tips of the STAR magnet at a distanceof 3.7 m from the interaction point. The detector consists oftwo sets of small and large hexagonal scintillator tiles arrangedinto a ring that covers pseudorapidities between 2.1 and 5.0.The minimum bias trigger required a coincidence of signalsin at least one of the 18 small BBC tiles on each side of theinteraction region.
The two BBCs record timing signals that can be usedto determine the time of flight for the forward fragments.The difference between these two flight times provides ameasurement of the z position of the interaction vertex (zvert)to an accuracy of about 40 cm [38]. Events with largevalues of the time-of-flight difference, which indicate thepassage of beam background, were rejected at the trigger level.The BBCs also served to measure the beam luminosity inp + p runs.
III. DATA RECONSTRUCTION
A. Datasets and statistics
The data used in this analysis were taken in the d + Aurun of 2003 and in the p + p run of 2005, both at
√sNN =
200 GeV. The integrated luminosity was 0.66 pb−1 for thep + p data and the equivalent nucleon-nucleon luminositywas 0.22 pb−1 for the d + Au data. The following triggerconditions were used.
1. Minimum bias (MinBias) trigger in d + Au collisions
This condition required the presence of at least one neutronsignal in the ZDC in the gold beam direction. As determinedfrom detailed simulations of the ZDC acceptance [5], thistrigger captured (95 ± 3)% of the total d + Au hadronic crosssection of σd+Au
hadr = 2.21 ± 0.09b.
064904-4

INCLUSIVE π 0, η, AND DIRECT PHOTON . . . PHYSICAL REVIEW C 81, 064904 (2010)
2. MinBias trigger in p + p collisions
This condition required the coincidence of signals from twoBBC tiles on opposing sides of the interaction point. Due tothe dual-arm configuration, this trigger was sensitive to thenonsingly diffractive (NSD) cross section, which is a sumof the nondiffractive and doubly diffractive cross sections.The total inelastic cross section is a sum of the NSD andsingly diffractive cross sections. A MinBias cross section ofσBBC = 26.1 ± 0.2 (stat.) ± 1.8 (syst.) mb was independentlymeasured via van der Meer scans in dedicated acceleratorruns [39]. This trigger captured (87 ± 8)% of the p + p NSDcross section, as was determined from a detailed simulation ofthe BBC acceptance [1]. Correcting the BBC cross section forthe acceptance, we obtained the NSD cross section σ
p+p
NSD =30.0 ± 3.5 mb.
3. HighTower trigger
This condition required a transverse energy deposit ET
above a predefined threshold in at least one calorimetertower, in addition to satisfying the MinBias condition. Thistrigger enriched the recorded dataset with events that hada large ET . Two different thresholds were applied, definingthe HighTower-1 and HighTower-2 datasets. The nominalvalues of these thresholds were set to 2.6 and 3.5 GeV inp + p and to 2.5 and 4.5 GeV in d + Au runs. Prior to eachrun, all towers were equalized to give the uniform transverseenergy response by adjusting the high-voltage settings of theindividual photomultipliers.
4. HighTower software filter
The HighTower-triggered data were additionally filteredusing a software implementation of the HighTower trigger. Inthis filter, the highest tower ADC value found in the eventwas required to exceed the same HighTower-1 (HighTower-2)threshold as the one that was used during the run. This filterwas needed to remove events that were falsely triggered dueto the presence of noisy channels (hot towers). Such channelswere identified off line in a separate analysis and recorded in adatabase. In addition, the highest calibrated transverse energyof a tower in the event was required to exceed slightly higherthresholds (ET + 0.5 GeV) than those used during the run, toaccount for possible inaccuracy of the online calibration ofthe towers. This software filter also served to make the triggerefficiency for the Monte Carlo detector simulation and for thereal data as close as possible.
B. Beam background rejection
During the data taking in 2003–2005, interactions of beamions with material approximately 40 m upstream from theinteraction region gave rise to particles that traversed thedetector almost parallel to the beam direction. This source ofbackground was eliminated by installing additional shieldingin the RHIC tunnel for the subsequent runs.
)TPCp+BEMCE(/BEMCE0 0.2 0.4 0.6 0.8 1
Eve
nts
0.5
1.0
1.5
2.0 2Au HighTower-+d(a)
Beam bg cut
310
)TPCp+BEMCE(/BEMCE0 0.2 0.4 0.6 0.8 1
10
20
30 2 HighTower-p+p(b)
310
FIG. 1. (a) Distribution of r = EBEMC/(EBEMC + pTPC) ind + Au events, which shows beam background at r > 0.8. The curvecorresponds to a second-order polynomial fit, constrained to passthrough zero at r = 1, used to estimate the false rejection rate.(b) Distribution of r in p + p events.
To identify events containing such background tracks, theratio
r = EBEMC
EBEMC + pTPC(1)
was calculated, where EBEMC is the total transverse energyrecorded in the BEMC and pTPC is the transverse momentumsum of all charged tracks reconstructed in the TPC. In eventscontaining background, r was large (close to 1) becausephotons from these background events deposited a largeamount of energy in the calorimeter, while the accompanyingcharged tracks were not reconstructed in the TPC, because theydid not point to the vertex. Figure 1 shows the distributionsof r for the d + Au and p + p data. The peak near unityin panel (a) indicates the presence of beam background ind + Au collisions. Events with r > 0.8 were removed from thed + Au analysis. This cut rejected 3.4% of MinBias and 13%of HighTower-2 events. From a polynomial fit to the d + Audistribution in the region r = 0.6–0.8 [curve in Fig. 1(a)], thefalse rejection rate was estimated to be 3.6% in the d + AuHighTower-2 data and less than 1% in the other datasets.By studying this rejection rate as a function of EBEMC, weestimated the potential distortion of the π0, η, and photonspectra due to the removal of these events to be below 1% inall datasets.
Figure 1(b) shows the distribution of r for the HighTowerp + p data. The background was negligible because of theBBC coincidence requirement in the trigger and the timing cuton the BBC vertex position. Therefore, no cut on r was appliedto the p + p data.
The residual beam background contamination in thed + Au MinBias trigger was estimated from an analysis ofthe empty RHIC bunches to be (5 ± 1)% [14]. To estimatethe residual background in our data, we analyzed a sample of3 × 105 MinBias triggers from unpaired RHIC bunches. Theseevents were passed through the same reconstruction procedureas other data. We observed that ≈10% of the fake triggerspassed all cuts and that none of these contained a reconstructedπ0. The residual beam background contamination in theπ0 yield was thus estimated to be 0.1 × 5% = 0.5% andconsidered to be negligible.
064904-5

B. I. ABELEV et al. PHYSICAL REVIEW C 81, 064904 (2010)
FTPCN0 5 10 15 20 25 30 35 40 45
Eve
nts
10
210
310
410
510
610
most peripheral00%1−40%
midcentral0%4−20%
most central0%2− 0%
Au+d MinBias1HighTower-2HighTower-
FIG. 2. Centrality selection in the d + Au data based on the FTPCmultiplicity NFTPC. Three centrality classes were defined, containing0%–20% most central, 20%–40% midcentral, and 40%–100% mostperipheral events, respectively.
C. Determination of centralities
To measure the centrality in d + Au collisions, we usedthe correlation between the impact parameter of the collisionand the charged-track multiplicity in the forward direction.This correlation was established from a Monte Carlo Glaubersimulation [40–42] using, as an input, the Woods-Saxonnuclear-matter density for the gold ion [43] and the Hulthenwave function of the deuteron [44]. In this simulation, theinelastic cross section for a nucleon-nucleon collision wastaken to be σNN
inel = 42 mb. The produced particles werepropagated through a full GEANT [45] simulation of the STARdetector. Both the charged-track multiplicity and the numberof nucleon-nucleon collisions simulated by the event generatorwere recorded.
For the event-by-event centrality determination, we mea-sured the multiplicity of tracks reconstructed in the FTPCmodule in the gold beam direction (NFTPC). Centrality binswere defined following the scheme used in other STARpublications [5]. The following quality cuts were applied tothe reconstructed tracks: (i) at least six hits were requiredon the track; (ii) pT < 3 GeV/c, which guaranteed thatthe track was fully contained in the FTPC acceptance; and(iii) distance of closest approach to the vertex had to be lessthan 3 cm. The multiplicity distributions obtained from thed + Au data are shown in Fig. 2 for the MinBias, HighTower-1,and HighTower-2 triggers.
Based on NFTPC, the events were separated into threecentrality classes: 0%–20% most central, 20%–40% midcen-tral, and 40%–100% most peripheral, as indicated by thevertical lines in Fig. 2. Table I lists the NFTPC ranges andthe corresponding mean numbers of binary collisions (〈Ncoll〉)obtained from the Glauber model for each centrality class. Thesystematic uncertainties on 〈Ncoll〉 were estimated by varyingthe Glauber model parameters.
D. Vertex finding efficiency
In p + p data, a vertex was reconstructed based on thetracking information for 65% of the MinBias events. For the
TABLE I. Centrality classes defined for the d + Au data and thecorresponding 〈Ncoll〉 values [5]. The errors given for 〈Ncoll〉 indicatethe systematic uncertainty.
Centrality class NFTPC range 〈Ncoll〉d + Au MinBias – 7.5 ± 0.40%–20% Most central �17 15.0 ± 1.120%–40% Midcentral 10–16 10.2 ± 1.040%–100% Most peripheral <10 4.0 ± 0.3p + p – 1
remaining events, the vertex position in z was determined usingthe time information from the BBCs.
In the d + Au HighTower data, the charged-track multiplic-ities were large enough to always have a reconstructed vertex.However, a vertex was missing in about 7% of the MinBiasevents and cannot be recovered from BBC information becausethe BBC was not included in the d + Au MinBias trigger.Events without a vertex have low charged-track multiplicity,and the contribution from these events to the π0 yield above1 GeV was assumed to be negligible [46]. Therefore, acorrection for vertex inefficiency was applied as a constantnormalization factor to the yield and its uncertainty contributedto the total normalization uncertainty of the measured crosssections.
The vertex reconstruction efficiency in triggered d + AuMinBias events was εvert = 0.93 ± 0.01 [5]. However, thisefficiency depends on the collision centrality, and we assumedthat it was 100% for central events. Scaling the efficiency inthe preceding by the ratio of peripheral to total number ofd + Au events, we obtained an efficiency correction factor of0.88 ± 0.02 for the sample of peripheral events.
Events with |zvert| > 60 cm were rejected in the analysisbecause the amount of material traversed by a particle increasesdramatically at large values of |zvert|. As a consequence, theTPC tracking efficiency is reduced for vertices located far fromthe center of the detector.
E. Energy calibration of the calorimeter
In the first step of the calorimeter calibration, the gains of theindividual towers were matched to achieve an overall uniformresponse of the detector. For this purpose, minimum ionizingparticles (MIPs) were used, by selecting the TPC tracks ofsufficiently large momentum (greater than ≈1 GeV/c). Thesetracks were extrapolated to the BEMC and the response spectrawere accumulated, provided that the track extrapolation wascontained within one tower and that the track was isolated. Ford + Au data, the isolation criterion meant that no other trackswere found in a 3 × 3 patch around the tower; for p + p
data, these neighboring towers were required to have no signalabove noise. The peak positions of such MIP signals wereused to calculate the tower-by-tower gain corrections neededto equalize the detector response [47].
In the second step, the energy scale was determined bycomparing the momenta p of identified electrons in the TPCwith the energies E recorded in the BEMC using the relation
064904-6

INCLUSIVE π 0, η, AND DIRECT PHOTON . . . PHYSICAL REVIEW C 81, 064904 (2010)
)c (E/p0 0.5 1 1.5 2
Cou
nts
0100200300400500600700 > 2 GeV/cpClean electron sample,
)c 0.003 ±Gaussian fit (mean at 0.996
FIG. 3. Electron energy measured in the BEMC after calibration,divided by the momentum measured in the TPC, in the p + p data.The solid line is a Gaussian fit, which shows that the peak is centeredat unity.
E = p for ultrarelativistic electrons. Figure 3 shows thedistribution of E/p for a selected sample of at least 90%pure electrons in the p + p data at p > 2 GeV/c, after thecalibration has been performed. The Gaussian fit to the centralpart of the electron peak demonstrates that the mean hasbeen placed at unity. From a variation of the peak positionwith p, the systematic uncertainty of the electron calibrationwas conservatively estimated to be 5%. Within the presentstatistics, that calibration covers the momentum range only upto p = 6 GeV/c. Because the peak position is close to unityat p > 3.5 GeV/c, we assume that the assigned systematicuncertainty covers possible nonlinearities at higher photonmomenta p � 15 GeV/c probed in the present measurements.
This calibration method takes advantage of the wellunderstood TPC detector for the precise measurement of theelectron track momentum in a wide range. A disadvantage isthat it takes large statistics to calibrate the high-energy partof the spectrum. For this reason, only one global calibrationconstant was obtained. It was found that the current calibrationis less reliable at the edges of the half barrel. Therefore, thesignals from the two η rings at each side were removed fromthe analysis.
The absolute energy calibration of the SMD was determinedusing the beam test data to an accuracy of about 20%. Thisanalysis is not very sensitive to the absolute energy scale ofthe SMD, because the main energy mesurement was done withthe towers.
F. Particle reconstruction in the BEMC
The first step in the photon reconstruction was to findclusters of energy deposits in the calorimeter by groupingadjacent hits that were likely to have originated from a singleincident particle. The cluster-finding algorithm was applied tothe signals from BEMC towers and from each of the two SMDlayers.
The clustering started from the most energetic hit (seed) ina module and added neighboring hits of decreasing energy tothe cluster, until either a predefined maximal cluster size or alower hit energy threshold was reached. The algorithm thenproceeded to process the next seed. The threshold values arelisted in Table II. By construction, the clusters were confinedwithin a module and could not be shared by adjacent modules.
TABLE II. Cluster finder threshold values used in the analysis.Eseed, Eadd, and Emin are the minimal energies for the seed hits, regularhits, and entire clusters, respectively. Nmax is the maximal cluster size.
Detector Eseed (GeV) Eadd (GeV) Emin(GeV) Nmax
Towers 0.35 0.035 0.02 4SMD 0.2 0.0005 0.1 5
However, the likelihood of shower sharing between modulesis considered to be low, because the modules are physicallyseparated by ≈12-mm-wide air gaps. The η-ϕ position of eachcluster was calculated as the energy-weighted mean of theindividual hit positions within the cluster.
After the tower and SMD clusters were found, they werecombined into BEMC points, which closely corresponded tothe impact points and energy deposits of particles that traversedthe calorimeter. The procedure for forming the BEMC pointsis described in detail in Ref. [38]. The SMD information wasessential because the minimal opening angle of the decayphotons decreases with increasing energy of the parent π0.The spatial resolution of the BEMC towers alone is notsufficient to efficiently resolve the decay photons of π0’s withp > 5 GeV/c. For this reason, only the BEMC points thatcontained tower, SMD-η, and SMD-ϕ clusters were kept forthe further analysis of the HighTower data. In the analysis ofMinBias data, used to obtain the π0 signal at pT < 4 GeV/c,all reconstructed BEMC points were used, even when they didnot contain SMD clusters.
The SMD efficiency decreases rapidly and its energy reso-lution becomes poor with decreasing energy of the traversingparticle, leading to significant fluctuations in the strip readoutfor E � 2 GeV. Therefore, in the HighTower-1 data the SMDclusters were accepted only when they contained signals fromat least two strips. This cut rejected a large fraction of thedistorted and falsely split SMD clusters and reduced a possibleeffect of poor SMD response simulation at low energies.
G. Charged particle veto using TPC
A charged particle veto (CPV) cut was applied to rejectthe charged hadrons that were detected in the calorimeter. Acharged hadron was recognized as a BEMC cluster with a TPCtrack pointing to it. The cluster was rejected if the distance D
between the BEMC point and the closest TPC track in the η-ϕcoordinates was
D =√
(�η)2 + (�ϕ)2 < 0.04. (2)
When a track was projected to the calorimeter surface, at aradius R = 220 cm, this cut corresponded to a linear separationRD ≈ 10 cm in the pseudorapidity range of this measurement.The efficiency of this cut was 35% in the MinBias data and 71%in the HighTower-1 and HighTower-2 data in all p + p andd + Au datasets. The BEMC points remaining after this cutwere considered to be photon candidates and were combinedinto pairs, defining the set of π0 candidates.
This veto introduced a false rejection of photon clusters if anunrelated charged particle happened to hit the calorimeter close
064904-7

B. I. ABELEV et al. PHYSICAL REVIEW C 81, 064904 (2010)
2)ϕ∆ (+2)η∆(√=D
0 0.05 0.1 0.15 0.2 0.25 0.3 0.35 0.4
Cou
nts
210
310
Distance cut
FIG. 4. Distribution of the distances D between BEMC pointsand their closest tracks, obtained from p + p HighTower-1 data inthe bin 4 < pT < 5 GeV/c. The curve shows a fit to Eq. (3); thevertical line indicates the CPV cut.
to the cluster. Figure 4 shows the distribution of D observedin the p + p data. In this plot, one distinguishes the peakof real charged particles at small distances, superimposed ona random component seen as a shoulder at larger distances.Assuming a uniform distribution of track projections in η
and ϕ around the BEMC point, the radial distribution isgiven by
f (D) = De−Dρ. (3)
Here ρ is the charged track density in the vicinity of the photon.This parameter was obtained from a simultaneous fit to thedata in all bins of the event multiplicity M measured in theTPC, assuming a linear dependence on M , ρ = a + bM . Theparametrization given by Eq. (3) describes well the randomcomponent, as shown by the curve in Fig. 4. The relativenumber of random coincidences that were falsely rejected wasobtained by integrating the fitted curve up to the distance cutand weighting with the multiplicity distribution observed ineach pT bin. The resulting correction factor was επ
cpv = 0.94 ±0.02 for the p + p data and 0.89 ± 0.02 for the d + Au data.
In the direct photon analysis, the purity of the photoncandidate sample was more important than in the π0 analysis;therefore, a stronger cut RD < 15 cm was used. The correctionfactors were calculated to be ε
γcpv = 0.95 ± 0.02 for p + p
and 0.93 ± 0.02 for d + Au data. The residual contaminationby charged particles (C±) was estimated from the integratedexcess of the D distribution over the fit to the randomassociations in the interval 15 < RD < 25 cm and was lessthan 5% for all pT bins.
The uncertainties of these corrections contributed to a pT -independent systematic uncertainty of the π0, η, and directphoton yields.
H. Photon conversions
A separate study was done to determine the degree to whichthe GEANT geometry described the distribution of materialin the real STAR detector, and the corresponding correctionfactors closs were extracted to account for any differences.
The photon conversion probability Pconv as a function ofthe depth d traversed in a material is given by
Pconv = 1 − exp (−d/d0), (4)
where d0 is the mean free path of the photon in that material.The probablity that a π0 was not detected because at least oneof its decay photons has converted is
P πloss = 2Pconv(1 − Pconv) + P 2
conv. (5)
The π0 losses due to conversions were in principle takeninto account in the simulations mentioned in the sectionsthat follow because the material traversed by the photons wasincluded in the GEANT model of the detector. However, it wasobserved that the simulation failed to reproduce the numberof photon conversions in the inner tracking system (SVT,SSD) and in the TPC inner field cage (IFC), all of whichhave a very complicated geometry of silicon sensors, readoutelectronics, and support structures [20,21,48]. The numberof conversions in the simulated SVT, SSD, and IFC wereunderestimated by factors of κ = 2, 2, and 1.2, respectively,compared to that in the real data [49]. In simulations, thephoton conversion probability in these detectors was in therange Pconv = 0.3%–3.3%. To account for the missing materialin the GEANT model, the photon spectra were corrected byfactors c
γ
loss = (1 − ∑Pconv)/(1 − ∑
κPconv), with the valuesof 1.06 ± 0.02 and 1.03 ± 0.02 for the p + p and d + Audata, respectively. Using Eq. (5), this corresponds to correctionfactors of cπ
loss = 1.12 ± 0.03 (p + p) and 1.07 ± 0.03 (d +Au) for the π0 spectra. Because the photon attenuation lengthin most absorbers rapidly approaches a constant for energieslarger than ≈100 MeV, the correction factors were assumed tobe independent of the photon pT .
IV. NEUTRAL PION AND η MESON ANALYSIS
The π0 and η were identified by their decays
π0 → γ γ and η → γ γ.
These decay modes have branching ratios of 0.988 and0.392, respectively [50]. The π0 lifetime is τ = 8.4 × 10⁻¹⁷s,corresponding to a decay length cτ = 0.025 µm. The η
lifetime is even shorter (7 × 10⁻¹⁹s). Therefore, we assumedthat the decay photons originated from the primary vertex. Foreach event, the invariant mass
mγγ =√
2E1E2(1 − cos ψ) (6)
was calculated for all pairs of photons detected in the BEMC.Here E1 and E2 are the energies of the decay photons and ψ isthe opening angle in the laboratory system. The reconstructedmasses were accumulated in invariant mass spectra, where theπ0 and the η showed up as peaks around their nominal masses(mπ0 = 0.135 GeV/c2 and mη = 0.547 GeV/c2). These peakswere superimposed on a broad distribution of combinatorialbackground, which originated from photon pairs that were notproduced by the decay of a single parent particle.
064904-8
INCLUSIVE π 0, η, AND DIRECT PHOTON . . . PHYSICAL REVIEW C 81, 064904 (2010)
)2E+11E(/|2E−1
1E|= γγZ0 0.2 0.4 0.6 0.8 1
tota
l/
Cou
nts
0.00
0.05
0.10
0.15
0.20MinBias
1HighTower-2HighTower-
Simulation
Asymmetry cutp+p
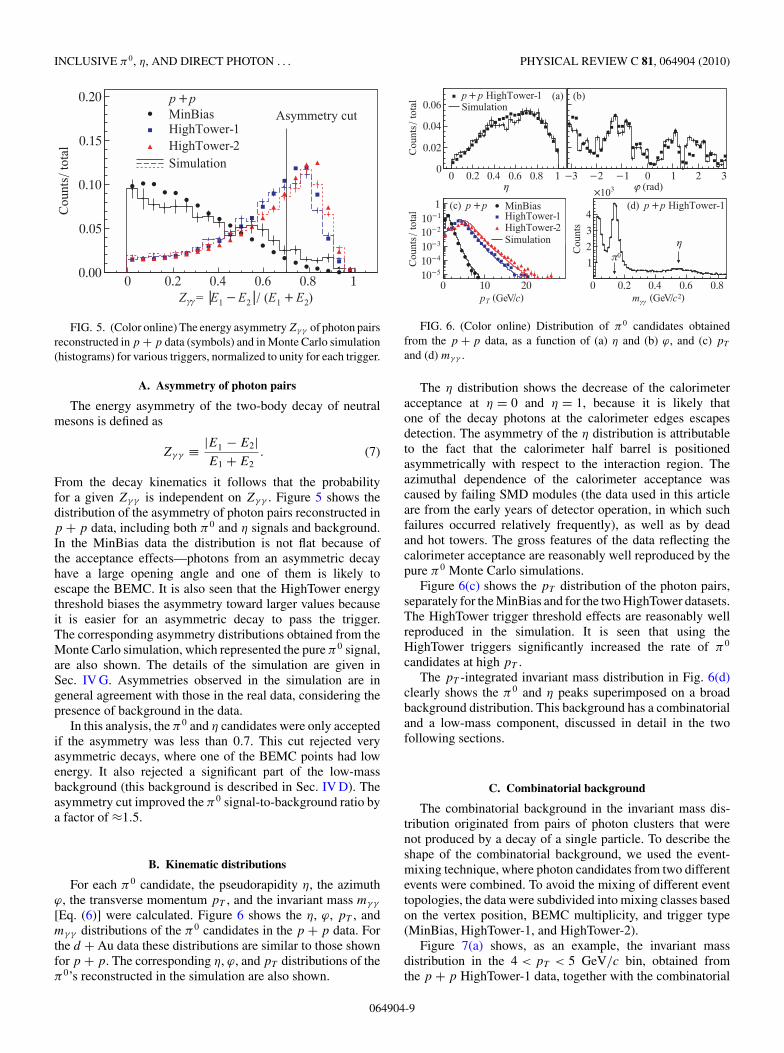
FIG. 5. (Color online) The energy asymmetry Zγγ of photon pairsreconstructed in p + p data (symbols) and in Monte Carlo simulation(histograms) for various triggers, normalized to unity for each trigger.
A. Asymmetry of photon pairs
The energy asymmetry of the two-body decay of neutralmesons is defined as
Zγγ ≡ |E1 − E2|E1 + E2
. (7)
From the decay kinematics it follows that the probabilityfor a given Zγγ is independent on Zγγ . Figure 5 shows thedistribution of the asymmetry of photon pairs reconstructed inp + p data, including both π0 and η signals and background.In the MinBias data the distribution is not flat because ofthe acceptance effects—photons from an asymmetric decayhave a large opening angle and one of them is likely toescape the BEMC. It is also seen that the HighTower energythreshold biases the asymmetry toward larger values becauseit is easier for an asymmetric decay to pass the trigger.The corresponding asymmetry distributions obtained from theMonte Carlo simulation, which represented the pure π0 signal,are also shown. The details of the simulation are given inSec. IV G. Asymmetries observed in the simulation are ingeneral agreement with those in the real data, considering thepresence of background in the data.
In this analysis, the π0 and η candidates were only acceptedif the asymmetry was less than 0.7. This cut rejected veryasymmetric decays, where one of the BEMC points had lowenergy. It also rejected a significant part of the low-massbackground (this background is described in Sec. IV D). Theasymmetry cut improved the π0 signal-to-background ratio bya factor of ≈1.5.
B. Kinematic distributions
For each π0 candidate, the pseudorapidity η, the azimuthϕ, the transverse momentum pT , and the invariant mass mγγ
[Eq. (6)] were calculated. Figure 6 shows the η, ϕ, pT , andmγγ distributions of the π0 candidates in the p + p data. Forthe d + Au data these distributions are similar to those shownfor p + p. The corresponding η, ϕ, and pT distributions of theπ0’s reconstructed in the simulation are also shown.
η0 0.2 0.4 0.6 0.8 1
tota
l/
Cou
nts
0
0.02
0.04
0.061 HighTower-p+p
Simulation(a)
(rad)ϕ−3 −2 −1 0 1 2 3
(b)
310×
)c/VGe(Tp0 10 20
tota
l/
Cou
nts
−510
−410
−310
−210
−1101 MinBias
1HighTower-2HighTower-
Simulation
p+p(c)
)2c/VGe(m0 0.2 0.4 0.6 0.8
Cou
nts
1
2
3
41 HighTower-p+p(d)
0π
γγ
η
FIG. 6. (Color online) Distribution of π 0 candidates obtainedfrom the p + p data, as a function of (a) η and (b) ϕ, and (c) pT
and (d) mγγ .
The η distribution shows the decrease of the calorimeteracceptance at η = 0 and η = 1, because it is likely thatone of the decay photons at the calorimeter edges escapesdetection. The asymmetry of the η distribution is attributableto the fact that the calorimeter half barrel is positionedasymmetrically with respect to the interaction region. Theazimuthal dependence of the calorimeter acceptance wascaused by failing SMD modules (the data used in this articleare from the early years of detector operation, in which suchfailures occurred relatively frequently), as well as by deadand hot towers. The gross features of the data reflecting thecalorimeter acceptance are reasonably well reproduced by thepure π0 Monte Carlo simulations.
Figure 6(c) shows the pT distribution of the photon pairs,separately for the MinBias and for the two HighTower datasets.The HighTower trigger threshold effects are reasonably wellreproduced in the simulation. It is seen that using theHighTower triggers significantly increased the rate of π0
candidates at high pT .The pT -integrated invariant mass distribution in Fig. 6(d)
clearly shows the π0 and η peaks superimposed on a broadbackground distribution. This background has a combinatorialand a low-mass component, discussed in detail in the twofollowing sections.
C. Combinatorial background
The combinatorial background in the invariant mass dis-tribution originated from pairs of photon clusters that werenot produced by a decay of a single particle. To describe theshape of the combinatorial background, we used the event-mixing technique, where photon candidates from two differentevents were combined. To avoid the mixing of different eventtopologies, the data were subdivided into mixing classes basedon the vertex position, BEMC multiplicity, and trigger type(MinBias, HighTower-1, and HighTower-2).
Figure 7(a) shows, as an example, the invariant massdistribution in the 4 < pT < 5 GeV/c bin, obtained fromthe p + p HighTower-1 data, together with the combinatorial
064904-9

B. I. ABELEV et al. PHYSICAL REVIEW C 81, 064904 (2010)C
ount
s
0
200
400
600
800
1000 1 HighTower-p+pc/V< 5 GeTp4 <
(a) Event mixing
Same-event pairsMixed-event backgroundNormalization region
Cou
nts
0
200
400
600
800
1000
(b) Jet-aligned mixing
)2V/cGe(γγm0.2 0.4 0.6 0.8 1
Cou
nts
0
200
400
600
800
1000
(c) Combinatorial backgroundsubtracted
FIG. 7. The same-event invariant mass distribution (crosses) andcombinatorial background (histogram) observed in one pT bin of thep + p data. Background estimated (a) from random event mixingand (b) from a linear combination of random and jet-aligned mixing;(c) background-subtracted distribution. The shaded areas indicate theregions where the mixed-event background was normalized to thesame-event distributions.
background obtained from the event mixing. The mixed-event background distribution was normalized to the same-event distribution in the invariant mass region 0.9 < mγγ <
1.2 GeV/c2.There is still some residual background in the interval
0.2 < mγγ < 0.4 GeV/c2. This background is attributable tocorrelation structures (jet structures) in the event, which are notpresent in the sample of mixed events. To preserve jet-inducedcorrelations, the jet axes in both events were aligned beforemixing [38], as described later in this article.
To determine the η-ϕ position of the most energetic jet inevery event, the cone algorithm was used [51]. The mixed-event π0 candidates were constructed by taking two photonsfrom different events, where one of the events was displacedin η and ϕ by �η = η2 − η1 and �ϕ = ϕ2 − ϕ1, respectively.Here η1,2 and ϕ1,2 are the jet orientations in the two events.
Figure 8 shows a schematic view of two superimposedevents where the jet axes are aligned. To minimize acceptancedistortions, the events were divided into ten mixing classes in
(1)
(2)ϕ∆
η∆π−=ϕ
0=ϕ
π+=ϕ
0=η 1=η
FIG. 8. A schematic view of two superimposed events, where thejet axes are aligned to preserve the jet-induced correlations in themixed event.
the jet η coordinate. By mixing only events in the same class,the shift �η was limited to 0.1. Because the calorimeter has acylindrical shape, the shift in ϕ did not induce any significantacceptance distortion.
A side effect of this procedure was that correlationswere induced if there was no real jet structure, because thejet-finding algorithm then simply picked the most energetictrack in the event. To reduce possible bias introduced bysuch correlations, the combinatorial background was taken tobe fully random for pT < 1.2 GeV/c and fully jet-alignedfor pT > 10 GeV/c. Between these values, the randomcomponent decreased linearly with increasing pT . We assigneda systematic uncertainty of 10% to the random backgroundfraction, which resulted in a systematic uncertainty of 5% ofthe π0 and 3.5% of the η yields.
Figure 7(b) shows the same invariant mass spectrum asthat shown in Fig. 7(a), with the background estimated bythe combined random and jet-aligned event mixing. Themixed-event background was normalized to the same-eventdistribution in the ranges 0.3 < mγγ < 0.4 and 0.9 < mγγ <
1.2 GeV/c2. By changing the subtracted background withinits normalization uncertainty, we obtained another componentof a systematic error of the π0 and η yields, which was foundto increase with increasing pT from 0.5% to 3% for the π0
and from 10% to 50% for the η.Figure 7(c) shows the background-subtracted distribution.
It is seen that there is still a residual background componentat invariant mass mγγ < 0.1 GeV/c2. The origin of thisbackground is described in the next section.
D. Low-mass background
Random fluctuations in the SMD signals occasionallygenerate a double-peaked hit structure, in which case theclustering algorithm incorrectly splits the cluster. Theserandom fluctuations enhance the yield of pairs with minimalangular separation and thus contribute to the lowest diphotoninvariant mass region, as can be seen in Fig. 7(c). However, ata given small opening angle, the invariant mass increases withincreasing energy of the parent particle, so that the low-massbackground distribution extends to larger values of mγγ withincreasing photon pT .
064904-10

INCLUSIVE π 0, η, AND DIRECT PHOTON . . . PHYSICAL REVIEW C 81, 064904 (2010)
)2V/cGe(γγm0 0.05 0.1 0.15 0.2 0.25 0.3 0.35 0.4
)2 c
1−
VP
roba
bili
ty d
ensi
ty (
Ge
0.00
0.05
0.10
0.15
0.20
0.25
0.30V/cGe < 2 Tp1 < V/cGe < 8 Tp7 < V/c< 16 GeTp15 <
window0π
FIG. 9. The simulated low-mass background distributions fromerroneous splitting of single photons in three bins of the reconstructedpair pT . The distributions extend to larger invariant masses withincreasing pT and move into the π 0 region (shown for pT =15 GeV/c).
The shape of the low-mass background was obtained froma simulation as follows. Single photons were generated withflat distributions in −π < ϕ < + π , −0.2 < η < 1.2, and0 < pT < 25 GeV/c. These photons were tracked througha detailed description of the STAR geometry with the GEANT
program. A detailed simulation of the electromagnetic showerdevelopment in the calorimeter was used to generate realisticsignals in the towers and in the SMD. The simulated signalswere processed by the same reconstruction chain as thereal data. Photons with more than one reconstructed clusterwere observed, and mγγ and pT of such cluster pairs werecalculated. The mγγ histograms were accumulated, with eachentry weighted by the pT spectrum of photons in the real data,corrected for the photon detection efficiency.
Figure 9 shows the low-mass background distributions inthree bins of the reconstructed pair pT . It is seen that thedistributions indeed move to larger invariant masses withincreasing pT and extend far into the π0 window at high pT .For this reason, it was not possible to estimate the amount ofthis background from a phenomenological fit to the data, andwe had to rely on the Monte Carlo simulation to subtract thisbackground component.
The second significant source of BEMC clusters thatpassed the CPV cut was the neutral hadrons produced in thecollisions, mostly antineutrons above 2 GeV/c. To accountfor the additional low-mass background from these hadrons,simulations of antineutrons were performed in the same wayas those of photons, and the reconstructed invariant massdistribution was added according to the realistic proportionn/γincl, where the antineutron yield was estimated as describedin Sec. V B.
The low-mass background was normalized by matchingthe observed pT spectrum of the clusters between simulationand data. This removal procedure worked well, and Fig. 10shows the invariant mass spectra and the low-mass backgroundcomponent, and the final background-subtracted spectrum forthe p + p HighTower-1 data. The normalization uncertainty
Cou
nts
0
200
400
600
800
10001 HighTower-p+p
V/c< 5 GeTp4 < (a)
subtractedCombinatorial background
Low-mass background
)2V/cGe(γγm0.2 0.4 0.6 0.8 1
Cou
nts
-200
0
200
400
600
800
1000
Combinatorial and low-massbackground subtracted
(b)
FIG. 10. The invariant mass distribution observed in one pT binof the p + p data (a) before and (b) after the low-mass backgroundsubtraction.
of the low-mass background contributes to the systematicuncertainty of the π0 cross section and reaches 15% at thehigh-pT end of the spectrum.
E. Peak position and width
Figure 11(a) shows the background-subtracted mγγ dis-tribution in the region 4 < pT < 5 GeV/c obtained fromthe p + p HighTower-1 data (symbols), together with thecorresponding distribution from the detector simulation (his-togram). To compare the real and simulated mγγ distributionsfor all bins in pT and for all datasets, we estimated theposition and width of the peaks using Gaussian fits in thepeak region. Figure 11(b) shows the peak positions obtainedfrom the fit to the p + p data. It is seen that the peak positionshifts toward higher masses with increasing pT . This shift is amanifestation of the bin migration effect that originates fromstatistical fluctuations in the calorimeter response. Due to thesteeply falling pT spectrum, the energy resolution causes a netmigration toward larger pT . Because larger values of pT implylarger values of mγγ , the migration effect biases the invariantmass peak toward larger values.
An additional peak shift at the largest values of pT iscaused by the SMD strip granularity, which imposes a lowerlimit on the opening angle of the reconstructed photon pairs.The minimal SMD cluster separation in each dimension thatcan be resolved by the cluster finder is 1.5 strips, and mostclusters contain at least two or three strips. Therefore, thepair reconstruction is less efficient for the symmetric decayswith the smallest opening angles at pT � 10 GeV/c. Thisleads to an increased average opening angle and mγγ of thereconstructed photon pairs from π0 decays.
064904-11

B. I. ABELEV et al. PHYSICAL REVIEW C 81, 064904 (2010)
)2c/VGe(γγm0.05 0.1 0.15 0.2 0.25 0.3
max
/C
ount
s
0
0.2
0.4
0.6
0.8
10π p+p
1HighTower-c/V< 5 GeTp4 <
(a)
)2c/
VG
e(
Pos
itio
n
0.13
0.14
0.15
0.16
0.17
0.18 (b)
0πm
MinBias1HighTower-2HighTower-
DataMC
)c/VGe(Tp0 2 4 6 8 10 12 14 16
)2 c/V
Ge
(W
idth
0.01
0.02
0.03
0.040.05 (c)
FIG. 11. (Color online) (a) Invariant mass spectrum of π0’sreconstructed in the simulation (histogram) in comparison to thep + p HighTower-1 data (symbols) in the 4 < pT < 5 GeV/c bin.(b) Peak position and (c) width in the real data (solid symbols) and inthe simulation (open symbols). The horizontal line in panel (b) showsthe true π 0 mass.
The peak position observed in the data is larger thanthat found in the simulations by (3.5 ± 0.6)%, on average.This difference could be caused by the global energy scaleof the BEMC towers being off by a similar amount. Wealready accounted for this possibility by assigning a systematicuncertainty of 5% to the BEMC calibration constants (seeSec. III E).
Figure 11(c) compares the π0 peak width in the data andin the simulation, and it is seen that the peak width in the datais larger than that in the simulation by (25 ± 2)%, on average.This is a sufficiently good agreement for this analysis, becausethe π0 and η yields were counted in the mass windows thatwere adjusted in each pT bin to cover the entire signal peak.
The peak shape of the η meson, as well as its position andwidth, are shown in Fig. 12, as a function of the reconstructedpT . The peak position in the data is larger than in the
)2c/VGe(γγm0.4 0.5 0.6 0.7 0.8
max
/C
ount
s
0
0.2
0.4
0.6
0.8
1η p+p
1HighTower-c/V< 5 GeTp4 <
(a)
)2 c/V
Ge
(P
osit
ion
0.45
0.50
0.55
0.60
0.65
0.70
0.75 (b)
ηm
MinBias1HighTower-2HighTower-
DataMC
)c/VGe(Tp0 2 4 6 8 10 12 14 16
)2 c/V
Ge
(W
idth
0.020.040.060.080.100.120.14 (c)
FIG. 12. (Color online) (a) Invariant mass spectrum of η mesonsreconstructed in the simulation (histogram) in comparison to thep + p HighTower-1 data (symbols) in the 4 < pT < 5 GeV/c bin.(b) Peak position and (c) width in the real data (solid symbols) and inthe simulation (open symbols). The horizontal line in panel (b) showsthe true η mass.
simulations by (5.1 ± 1.2)%, and the width by (34 ± 11)%, onaverage. The difference in the peak position is similar to thepreceding π0 case, which supports the possibility of both beingcaused by a small systematic offset in the BEMC calibration.The observed level of agreement between data and simulationsis considered to be sufficient for this analysis.
F. Invariant yield extraction
The invariant yield of the π0 and η mesons per MinBiascollision, as a function of pT , is given by
Ed3N
dp3= d3N
pT dpT dydϕ= d2N
2πpT dpT dy, (8)
where in the last equality integration over the full 2π azimuthalcoverage of the STAR detector is performed. Using the
064904-12

INCLUSIVE π 0, η, AND DIRECT PHOTON . . . PHYSICAL REVIEW C 81, 064904 (2010)
experimentally measured quantities, the invariant yield wascalculated as
Ed3N
dp3= 1
2πpT NtrigKtrig
Y
�pT �y
εvertcπloss
επaccε
πcpv
1
Bγ γ
, (9)
where
(i) Y is the raw yield measured in the bin centered at pT
and y;(ii) �pT is the width of the pT bin for which the yield was
calculated;(iii) �y is the rapidity range of the measurement; in this
analysis �y = 1 for all data points, except for the η
yields at pT < 3 GeV/c, where the correction for thedifference between rapidity and pseudorapidity reached7%;
(iv) Ntrig is the number of triggers recorded;(v) Ktrig is the trigger scale factor; Ktrig ≡ 1 for the MinBias
events and >1 for the HighTower events; the productNtrigKtrig is the equivalent number of MinBias eventsthat produced the yield Y ;
(vi) εvert is the vertex finding efficiency in MinBias events;(vii) cπ
loss is the correction for the missing material in thesimulation;
(viii) επacc is the BEMC acceptance and efficiency correction
factor;(ix) επ
cpv is a correction for random TPC vetoes;(x) Bγ γ = �γγ /� is the branching ratio of the diphoton
decay channel (0.988 for π0 and 0.392 for η [50]).
The raw π0 and η yields were counted in the pT -dependentmγγ windows that contained the peaks. The low-mass borderof the π0 peak region was taken to be a linear function of pT ,common for all datasets and triggers. This cut was optimizedto capture most of the yield and as little low-mass backgroundas possible. The high-mass border also linearly increased withpT to cover the asymmetric right tail of the peak. Similarly,the η peak region was a pT -dependent window that capturedmost of the signal. For completeness, we give the followingparametrization of the π0 and η windows:
75 + 1.7pT < mγγ (π0) < 250 + 3.3pT MeV/c2,(10)
350 + 3.3pT < mγγ (η) < 750 MeV/c2,
where pT is measured in GeV/c. The stability of the yieldswas determined by varying the vertex position cut, the energyasymmetry cut, and the yield integration windows. From theobserved variations, a point-to-point systematic error of 5%was assigned to the π0 and η yields.
Within each trigger in the p + p data, the π0 signalsignificance decreased from ≈34 to ≈6 standard deviationswith increasing pT , because of the corresponding reduction instatistics. In the d + Au data, the same trends were observed,but the significance was lower than in the p + p data by afactor of 1.9, on average, which is mainly caused by thelower integrated nucleon-nucleon luminosity in these data. Thesignificance of the η signal was between 18 and 2.5 standarddeviations in the p + p data and between 5.5 and 1.0 standarddeviations in the d + Au data.
G. Acceptance and efficiency correction
To calculate the detector acceptance and reconstructionefficiency correction factor επ
acc, a Monte Carlo simulation ofthe detector was used. The π0 decay photons were trackedthrough the STAR detector geometry using GEANT. Thesimulated signals were passed through the same analysis chainas the real data.
The π0’s were generated in the pseudorapidity region−0.3 < η < + 1.3, which is sufficiently large to account foredge effects caused by the calorimeter acceptance limits of 0 <
η < 1. The azimuth was generated flat in −π < ϕ < + π . ThepT distribution was taken to be uniform up to 25 GeV/c, whichamply covers the measured pion pT range of up to 17 GeV/c.The vertex distribution of the generated pions was taken tobe Gaussian in z with a spread of σ = 60 cm and centered atz = 0.
The generated π0’s were allowed to decay into twophotons, π0 → γ γ . The GEANT simulation accounted for allinteractions of the decay photons with the detector, such asconversion into e+e− and showering in the calorimeter or inthe material in front of it.
To reproduce a realistic energy resolution of the calorimeter,an additional smearing had to be applied to the energy depositscalculated by GEANT. In all simulations, a spread of 5% wasused to reproduce the p + p data and 10% for the d + Au data.
To reproduce the pT spectrum of pions in the data, eachMonte Carlo event was weighted by a pT -dependent function.This weighting technique allowed us to sample the entire pT
range with good statistical power, while reproducing the binmigration effect caused by the finite detector energy resolution.An NLO pQCD calculation [52] provided the initial weightfunction, which was subsequently adjusted in an iterativeprocedure.
The time dependence of the calorimeter acceptance duringdata taking was recorded in database tables that were usedin the analysis. To reproduce this time dependence in thesimulation, the generated events were assigned time stampsthat followed the timeline of the real data taking. In this way,the geometrical acceptance of the calorimeter (mean fractionof good towers) was reproduced in the Monte Carlo with aprecision of ≈0.5%.
In the analysis of real data, we used vertices reconstructedfrom TPC tracks and those derived from BBC time-of-flightmeasurements. The former have submillimeter resolution,whereas the latter have a precision of only ≈40 cm. To accountfor the BBC vertex resolution, 35% of the generated pions inthe p + p MinBias data had their point of origin artificiallysmeared in the z direction. No such smearing was applied tothe other simulated data, where BBC vertex was not used.
The acceptance and efficiency correction factor was cal-culated from the simulation as the ratio of the raw π0 yieldreconstructed in a pT bin to the number of simulated pions withthe true pT generated in that bin. This was done separately foreach trigger, using the same π0 reconstruction cuts as was donein the real data analysis. In particular, the reconstructed valueof pseudorapidity was required to fall in the range 0 < η < 1in both the data and the simulation, while in the latter thegenerated value of η was also required to fall in this range.
064904-13

B. I. ABELEV et al. PHYSICAL REVIEW C 81, 064904 (2010)ac
cε
0.1
0.2
0.3
0.4 0π(a) p+pMinBias
1HighTower-2HighTower-
)c/VGe(Tp0 2 4 6 8 10 12 14 16
acc
ε
0
0.1
0.2
0.3
0.4 η(b)
FIG. 13. (Color online) Acceptance and efficiency correctionfactor εacc for (a) π 0 and (b) η calculated from the Monte Carlosimulation for the p + p data.
As an example, Fig. 13 shows the π0 and η correction factorsfor the three triggers in p + p data.
The difference between the MinBias and HighTowercorrection factors was caused by the SMD requirement in theHighTower data, which was absent in the MinBias data. Theabsence of the SMD information reduced the π0 reconstructionefficiency in the MinBias data at pT > 3 GeV/c, where thedecay photons were separated by less than two towers. The η
reconstruction is only affected by this at larger values of pT .The effect of the SMD quality requirement of having at
least two adjacent strips in a cluster is illustrated in Fig. 14,which shows the correction factor calculated for the p + p
HighTower-1 data with (solid symbols) and without (opensymbols) the SMD quality requirement. This requirementreduced the number of accepted π0 candidates by ≈45%.This explains the difference between the HighTower-1 andHighTower-2 (no SMD quality cut) correction factors at highpT seen in Fig. 13.
The current simulation framework poorly reproduces theshower shapes in the SMD at the low incident photon energies.To account for residual bias after applying the SMD qualitycut, we assigned a systematic uncertainty to the HighTower-1cross section, which decreases from 15% at pT = 4 GeV/c tozero at pT = 7 GeV/c.
To determine a dependence of the acceptance correctionon the track multiplicity M , and thus on the centrality, weanalyzed a sample of generated π0’s embedded into real
)c/VGe(Tp0 2 4 6 8 10 12 14 16
acc
ε
0
0.1
0.2
0.3 0π 1 HighTower-p+p cutBSMDRelaxed
FIG. 14. Acceptance and efficiency correction factor εacc for thep + p HighTower-1 data, with the standard set of cuts (solid symbols)and with the SMD quality cut removed (open symbols).
d + Au events. No significant centrality dependence wasfound. Therefore, the same correction factors were appliedto the different centrality classes in the d + Au data. Thedependence of the efficiency on the locally higher multiplicityin jets was investigated in a PYTHIA [53] simulation, and nosignificant difference in the efficiency was observed relative toa single-particle simulation.
H. HighTower trigger normalization
We have shown in Fig. 6 the pT distribution of π0 candi-dates for the p + p MinBias, HighTower-1, and HighTower-2data. To normalize the HighTower spectra to those of theMinBias, pT -independent scale factors were applied. Thesescale factors were estimated as the ratio of observed MinBiasto HighTower event rates,
Ktrig = ∑NMBSMB/
∑NHTSHT. (11)
Here NMB and NHT are the numbers of MinBias and High-Tower triggers that passed the selection cuts, SMB and SHT arethe online prescale factors adjusted on a run-by-run basis toaccomodate the DAQ bandwidth, and the sums are taken overall runs where both the MinBias and the HighTower triggerswere active. We obtained the values Ktrig = 4.67 × 10³ and1.96 × 104 for the p + p HighTower-1 and HighTower-2triggers, respectively, and Ktrig = 2.87 × 10³ and 2.86 × 10⁴
for the d + Au triggers.To check the scale factors, the HighTower software filter,
which simulated the hardware trigger, was applied to theMinBias data. The scale factors were obtained as the ratio ofthe total number of MinBias events to the number that passedthe filter. To obtain a more precise HighTower-1/HighTower-2relative normalization factor, the software filter was appliedto the HighTower-1 data. The results from the two methodsagreed within 3% for HighTower-1 data and within 5% forHighTower-2 data. These numbers were taken as the system-atic uncertainties of the HighTower normalization factors.
The difference between vertex finding efficiencies in Min-Bias and HighTower data was effectively absorbed in the scalefactor Ktrig. Therefore, the vertex-finding efficiency correctionwas applied to the scaled HighTower data, as well as to theMinBias data.
I. Bin-centering scale factors
To assign the yield measured in a pT bin to a single pT
value, the procedure from Ref. [54] was applied. The variationof the yield within a bin was approximated by the functionf (pT ) = A exp(−BpT ). The measured yield in the bin wasassigned to the momentum p∗
T calculated from the equation
f (p∗T ) = 1
�pT
∫�pT
f (pT ) dpT . (12)
The procedure was repeated, taking p∗T as the abscissa, until
the p∗T values were stable (typically after three iterations).
To facilitate the comparison of results from the variousdatasets, the yields were scaled to the bin centers by the ratioKbin = f (p∗
T )/f (pT ), where pT is the center of the bin. The
064904-14

INCLUSIVE π 0, η, AND DIRECT PHOTON . . . PHYSICAL REVIEW C 81, 064904 (2010))
3 c2
−V
(G
e3 p
dN3
dE
−1010
−910
−810
−710
−610
−510
−410
−310
−210
−110
1 MinBiasp+p
1 HighTower-p+p2 HighTower-p+p
p+pFit to Au MinBias+d
1Au HighTower-+d2Au HighTower-+d
Au+dFit to
0π(a)
fit
/D
ata
1
2
3
4 p+p(b)
)c/VGe(Tp0 2 4 6 8 10 12 14 16
fit
/D
ata
1
2
3
4 Au+d(c)
FIG. 15. (Color online) (a) Invariant yield of π 0 per MinBiasp + p and d + Au collision. Curves are the power law fits givenin the text. Invariant yield divided by the fit to the (b) p + p and(c) d + Au data. The error bars are statistical and brackets in thelower panels are the systematic uncertainties.
statistical and systematic errors were also scaled by the samefactor.
To estimate a systematic uncertainty introduced by thisprocedure, we changed the functional form of f (pT ) either toa local power law in each bin or to a global power law in thefull pT range. The observed variation in Kbin was below 1.5%in most pT bins.
J. Fully corrected yields
The fully corrected π0 and η invariant yields per MinBiasevent [Eq. (9)] are shown in the top panels of Figs. 15 and 16,respectively. The curves represent power law fits to the data ofthe form
Ed3N
dp3= A
(1 + pT /p0)n. (13)
The ratios between the data and the fits are shown inpanels (b) and (c) in both figures. The brackets in the lowerpanels are the systematic uncertainties (see Sec. IV K), whichare partially correlated between different trigger datasets.The agreement between the data taken with the different
)3 c
2−
V
(Ge
3 pd
N3d
E
−1010
−910
−810
−710
−610
−510
−410
−310
−210
−110
1 MinBiasp+p
1 HighTower-p+p2 HighTower-p+p
p+pFit to Au MinBias+d
1Au HighTower-+d2Au HighTower-+d
Au+dFit to
η(a)
fit
/D
ata
1
2
3
4 p+p(b)
)c/VGe(Tp0 2 4 6 8 10 12 14 16
fit
/D
ata
2
4
6 Au+d(c)
FIG. 16. (Color online) (a) Invariant yield of η per MinBias p + p
and d + Au collision. Curves are the power law fits given in the text.Invariant yield divided by the fit to the (b) p + p and (c) d + Au data.The error bars are statistical and brackets in the lower panels are thesystematic uncertainties.
triggers is satisfactory, although a small systematic differencebetween the d + Au HighTower-1 and HighTower-2 yields(1.9 standard deviations, on average) was observed.
For the calculation of the final cross sections and their ratios,the data from three triggers were merged. The HighTower-1data were used in the MinBias-HighTower-1 overlap bins,because the MinBias data in those bins almost entirelyrepresent a subset of HighTower-1 events, selected by anonline prescale factor SMB. Similarly, the HighTower-2 datawere used in the HighTower-1-HighTower-2 overlap bins.
K. Summary of systematic uncertainties
The uncertainty of the calorimeter tower calibration wasthe dominant source of systematic uncertainty in this analysis.The uncertainty of the uncorrected yield Y (pT ) was estimatedfrom
δY (pT ) =∣∣∣∣dY (pT )
dpT
∣∣∣∣ δpT , (14)
where δpT was taken to be 5% in the d + Au and p + p data(as derived from the electron calibration; see Sec. III E). This
064904-15

B. I. ABELEV et al. PHYSICAL REVIEW C 81, 064904 (2010)
TABLE III. Systematic error contributions. The classifications A, B, C, and N are defined in the text. The errorcontributions to the π 0 cross section, the η/π 0 ratio, RCP , RdA, and the inclusive photon yield are indicated in therespective columns.
Source Type Value at low (high) pT (%) Ed3σ/dp3 η/π 0 RCP RdA γincl
Combinatorial background A 0.5 (3) + + + +Mixed-event background C 5 + +Low-mass background C 1 (15) + +Random vetoes N 2 + + + +HighTower normalization B 3 (5) + + + +Analysis cuts A 5 + + + +Conversion correction B 3 for π 0 and η, 2 for γincl + + +Tower energy scale B 15 (35) in p + p, 10 (40) in d + Au + + +SMD simulation C 15 (0) at pT = 4(7) GeV/c +SMD energy scale B 3.5 (1) at pT = 4(11) GeV/c + +Bin centering C 1.5 +Vertex finding efficiency N 1 in d + Au MinBias + + + +MinBias cross section N 11.5 in p + p, 5.2 in d + Au + + +Glauber model 〈Ncoll〉 N 5.3 in d + Au MinBias, 10.5 in RCP + +
pT -dependent systematic uncertainty was, on average, 25% inboth p + p and d + Au data.
Another strongly pT -dependent term in Eq. (9) is theacceptance and efficiency correction factor εacc, obtained fromthe Monte Carlo simulation. However, this term contributedmuch less to the cross-section uncertainty, because the simu-lations used the inverse of real calibration constants to convertthe GEANT energy deposit in each tower to the ADC value.Therefore, the energies later reconstructed from the ADCvalues with the same constants were not sensitive to theirfluctuations. This factor was sensitive to the tower calibrationonly through the HighTower threshold values and contributeda systematic uncertainty of 5% in the p + p data and 8% inthe d + Au data, on average, correlated with the uncorrectedyield uncertainty estimated previously.
The uncertainty of the SMD energy scale entered theanalysis mainly due to threshold effects in the clustering, wherethe loss of a soft photon from the asymmetrically decayed π0
may change the reconstruction efficiency. This analysis doesnot depend on the absolute energy calibration of the SMDbecause the main energy measurement was obtained fromthe towers. Instead, we estimated the possible disagreementbetween the SMD scale in the data and in Monte Carlosimulation to be below 20%. The resulting variation of εacc
from this source was 3.5% in the HighTower data at the pionpT = 4 GeV/c and less than 1% above 11 GeV/c.
All systematic error contributions are summarized inTable III and classified into the following categories:
A, point-by-point systematic uncertainty;B, pT -correlated systematic uncertainty, but uncorrelatedbetween p + p and d + Au datasets;C, pT -correlated systematic uncertainty, also correlatedbetween p + p and d + Au datasets;N, normalization uncertainty, uncorrelated between p + p
and d + Au datasets.
Table III also lists which measurement is affected by a givensource of systematic error.
V. DIRECT PHOTON ANALYSIS
The traditional approach to measuring direct photon pro-duction in hadronic collisions uses isolation criteria. Photonsfrom decays of highly energetic hadrons should be accompa-nied by other jet fragments. Therefore, one can reject thoseby requiring less than a certain amount of background energyin a cone around a photon candidate [55]. However, promptphoton production beyond leading order in pQCD cannot beseparated unambiguously from photons from fragmentationprocesses, although the framework for applying isolationcuts in pQCD calculations is established and theoreticalinterpretation of experimental results is possible. In addition,the use of isolation cuts in the high-multiplicity environmentof heavy-ion collisions is not straightforward.
Because the present analysis is intended to provide a base-line measurement for heavy-ion collisions, we have chosen touse the method of statistical subtraction to obtain direct photonyields. For this method, one obtains inclusive photon spectra,which, in addition to the direct contribution, contain a largebackground of decay photons, dominantly from π0 decays. Anaccurate measurement of π0 and heavier hadrons provides thenecessary input to subtract the decay background. This methodhas been successfully used in heavy-ion reactions [56,57];however, it does not provide event-by-event direct photonidentification.
The sample of photon candidates served as the maininput to the direct photon analysis, as in the case of thereconstruction of the π0 spectrum, described in the previoussections. After subtracting the contamination by chargedparticles and neutral hadrons, the raw inclusive photon samplewas corrected to account for the limited acceptance and thefinite detector resolution. In parallel, the total yield of photonsfrom π0, η, and ω(782) decays was simulated, assuming a phe-nomenological scaling law (mT scaling) for the η and ω(782)spectra.
To exploit the fact that the inclusive photon and decayphoton yields have many correlated uncertainties, we studied
064904-16

INCLUSIVE π 0, η, AND DIRECT PHOTON . . . PHYSICAL REVIEW C 81, 064904 (2010)
the direct photon yield via the double ratio
Rγ ≡ γincl/π0
γdecay/π0, (15)
where the numerator equals the point-to-point ratio of themeasured spectra of inclusive photons and π0’s, as a functionof pT , and the denominator is the simulated backgroundcontribution from decay processes divided by the parametrizedπ0 yield. It follows that
Rγ = 1 + γdir
γdecay, (16)
which serves as an indicator of a direct photon signal γdir
(Rγ > 1). The absolute direct photon yields can subsequentlybe determined as
γdir = (1 − R−1
γ
)γincl, (17)
where the systematic uncertainties, which canceled in thedouble ratio, have to be included again.
A. Inclusive photons
The reconstruction of the inclusive photon spectrum was inmany ways similar to that of the π0. The uncorrected photonspectrum was extracted from the same data sample usingidentical event and photon candidate cuts. However, in theπ0 analysis there were no rigorous constraints on the purity ofthe photon candidates, because remaining contributions fromcharged particles and neutral hadrons were identified afterwardas the combinatorial background in the mass distributions.In contrast, the uncorrected inclusive photon yield Yincl wasobtained from an explicit subtraction of such backgrounds,
Yincl = (1 − C0) (1 − C±) Ycand, (18)
where the correction terms C0 and C± represent the fractionalcontamination by neutral hadrons and charged particles,respectively. The charged-particle contamination C± wasestimated in Sec. III G and found to be smaller than 5%.
The invariant yield of inclusive photons was calculated,similarly to that of π0’s in Eq. (9), as
Ed3N
dp3= 1
2πpT NtrigKtrig
Yincl
�pT �y
εvertcγ
loss
εγaccε
γcpv
. (19)
Here εγacc is the single photon acceptance and efficiency
correction factor, discussed in Sec. V C.
B. Neutral hadron background
The term C0 in Eq. (18) was defined as the number ofreconstructed showers generated by neutral hadrons relative tothe total number of showers in the photon candidate sample.The STAR detector has no means of directly identifyingneutrons and antineutrons. Therefore, this contamination wassimulated using the measured (anti)proton spectra as input.
The largest source of neutral contamination was the n anni-hilation in the calorimeter, for example n + p → 2π+π−π0.This initiates a shower that does not necessarily develop in theincident direction of n. Moreover, the available energy for the
reaction products includes twice the rest mass of a nucleon(≈2 GeV).
STAR has measured the p and p production in p + p andd + Au collisions [24]. The reported yields, however, werenot corrected for the � and � feed-down, which is expected tohave a contribution of δ� ≈ 20% [23]. Therefore, the n yieldwas estimated as
Y (n) = (1 − δ�) Y (p) + δ�
B(� → nπ0)
B(� → pπ−)Y (p), (20)
where the branching ratios are B(� → nπ0) = 0.358 andB(� → pπ−) = 0.639 [50].
To study the contamination of the photon candidatespectrum, approximately 3 × 10⁶ n’s were generated with anexponentially falling pT spectrum. This provided sufficientstatistics at low pT , where the n’s constituted a significantsource of contamination. The FLUKA program [58] was usedto describe the particle transport and the interactions in thedetector material. The parametrizations of the p and p yieldswere not only used to assign a weight to the Monte Carloevents, but also to determine the absolute contamination ofthe photon sample. The latter was divided by the number ofreconstructed photon candidates to calculate the term C0.
The final contamination factor C0 in the p + p data isshown in Fig. 17. In a limited pT range, C0 appears to belarger than unity, which is not possible unless the associatedsystematic uncertainties are extremely large. The violation ofthis bound, as well as observed discrepancies between the threetriggers, indicate the large uncertainty of the n simulation.
Two natural limits to the contamination were considered:(i) the hard upper limit C0 � 1, which is not realistic becauseit implies that the inclusive photon yield is zero, and (ii) thelimit implied by the assumption that the direct photon signal iszero around the annihilation peak (≈2 GeV/c). In both cases, ascaling factor for C0 was derived and subsequently applied tothe HighTower-2 data, as shown in Fig. 17. For the furtheranalysis, we have chosen the second estimate, calculatedassuming that only background photons were detected inthe range 1 < pT < 4 GeV/c, as the upper limit of theneutral hadron contamination C0. This upper limit was found
MinBias1HighTower-2HighTower-
Upper limit (HT2)Hard limit (HT2)
p+p
)c/VGe(Tp
0 1 2 3 4 5 6 7 8 9
0 C
00.20.40.60.8
11.21.4
FIG. 17. (Color online) Relative neutral hadron contribution tothe photon candidate yields, C0. The filled area is the upper limit forthe p + p HighTower-2 data sample; the dashed curve is the upperlimit in the extreme scenario where all photon candidates were aresult of showering n’s.
064904-17

B. I. ABELEV et al. PHYSICAL REVIEW C 81, 064904 (2010)
to be negligible in the range of the present direct photonmeasurement, pT > 6 GeV/c.
The n and K0L interactions with the BEMC resulted in
the smaller contamination than that of the n’s at all valuesof pT .
C. Photon reconstruction efficiency
We have calculated the photon acceptance and efficiencycorrection factor ε
γacc separately for events containing π0 decay
photons and for events containing only a single photon. Thelatter factor was applied to the fraction of the photon yieldfrom all sources other than the π0 decay.
To determine the acceptance correction εγacc for the π0 decay
photons, we used a GEANT-based Monte Carlo simulation ofthe STAR detector. The Monte Carlo events were weightedin such a way that the measured π0 yield was reproduced.This is important because the photon acceptance depends onthe degree of cluster merging. This, in turn, depends on theopening angle of the decay photons and thus on the momentumof the parent π0. Furthermore, the simulation included all thepossible losses of photon candidates listed in Sec. IV, exceptthose associated with the invariant mass window and withthe cut on the energy asymmetry Zγγ . One important effectaffects the showers initiated by daughters of a high-pT π0.Because there was no requirement on the relation betweenthe reconstructed pT and the Monte Carlo input pT , thecorrection implicitly accounted for events in which one ofthe two decay photons remained unidentified and the totalenergy was assigned to a single cluster. Such merging ofphoton showers constituted the main difference between thereconstruction efficiencies of π0 decay products and singlephotons.
Similarly to the preceding, the εγacc factor for single
photons was determined using a Monte Carlo sample of≈1 × 10⁶ events. Each event contained a single photon,uniformly distributed in azimuthal angle −π < ϕ < + π ,pseudorapidity −0.3 < η < + 1.2, and transverse momentum0 < pT < 20 GeV/c. Events were weighted with a functiondetermined from the spectrum of photons from decayinghadrons other than the π0, as well as from that of the directphotons. However, we demonstrate in Sec. V E that the shapeof the decay photon spectrum and the measured π0 spectrumwere very similar, at least for the pT range of this analysis.Although the direct photon spectrum was expected to exhibita slightly different pT dependence, varying the input spectrumcorrespondingly did not yield quantitatively different results.
Finally, we have implemented a correction to the measuredphoton yields as follows. The yield of photons that originatedfrom the decay π0 → γ γ was determined from the measuredπ0 spectrum. This part of Yincl was corrected with the ε
γacc
factor calculated for the π0 decay photons. The remainingpart of Yincl was assumed to consist of single photons thatwere not correlated with the other photon candidates in theevent and was corrected with the single-photon ε
γacc factor.
This assumption was based on the observation that thereconstruction efficiency for photons from the decay η → γ γ ,which is the second-largest source of decay photons (≈15%),was equal to that of single photons, because the opening angle
γ acc
ε
0.20.40.60.8
11.21.4 decay photons0π(a)
p+p
MinBias1HighTower-2HighTower-
)c/VGe(Tp0 2 4 6 8 10 12 14
γ acc
ε
00.10.20.30.40.50.60.7 (b) Single photons
FIG. 18. (Color online) (a) Acceptance and efficiency factor εγacc
for photons exclusively from the decay π 0 → γ γ . The observed riseof the efficiency at high pT is caused by the merging of the π 0 decaydaughters. (b) The εγ
acc factor for single photons, used to correct thefraction of the photon sample that exceeded the simulated π0 decaycontribution.
between the two daughter photons is large enough that bothare never incident on the same calorimeter tower.
Figure 18 shows the acceptance and reconstruction effi-ciency ε
γacc for the π0 decay photons and for single photons
for the p + p MinBias, HighTower-1, and HighTower-2 data.The two HighTower results were found to be very similar inthe low-pT region, where the angular separation of the decayphotons was still large, compared to the size of a BEMC tower.However, at higher pT the two photons are difficult to separate,particularly in the cases of the most symmetric decays. Whentwo photons were merged, the remaining photon candidate waserroneously assigned the energy sum of both showers. This ledto significantly larger reconstruction efficiency, compared tothat for single photons. Eventually, at the largest pT valuesconsidered in this analysis, the decay photon efficiency evenexceeded unity.
D. Fully corrected inclusive yields
The inclusive photon yield Yincl was derived by subtractingthe charged and neutral backgrounds from the yield of rawphoton candidates [Eq. (18)]. The contamination by chargedparticles was subtracted according to the procedure explainedin Sec. III G, but the neutral hadron correction proved tobe difficult. Although an upper limit for the contaminationfraction C0 was derived in Sec. V B, we did not find any meansof reducing the associated systematic uncertainty on C0 toa level where a meaningful subtraction could be performedfor MinBias data. In the HighTower data, the upper limiton the contamination fraction vanishes at higher values ofpT . Therefore, our final results were obtained in the range6 < pT < 15 GeV/c, and the photon candidates obtained fromthe MinBias data were discarded.
064904-18
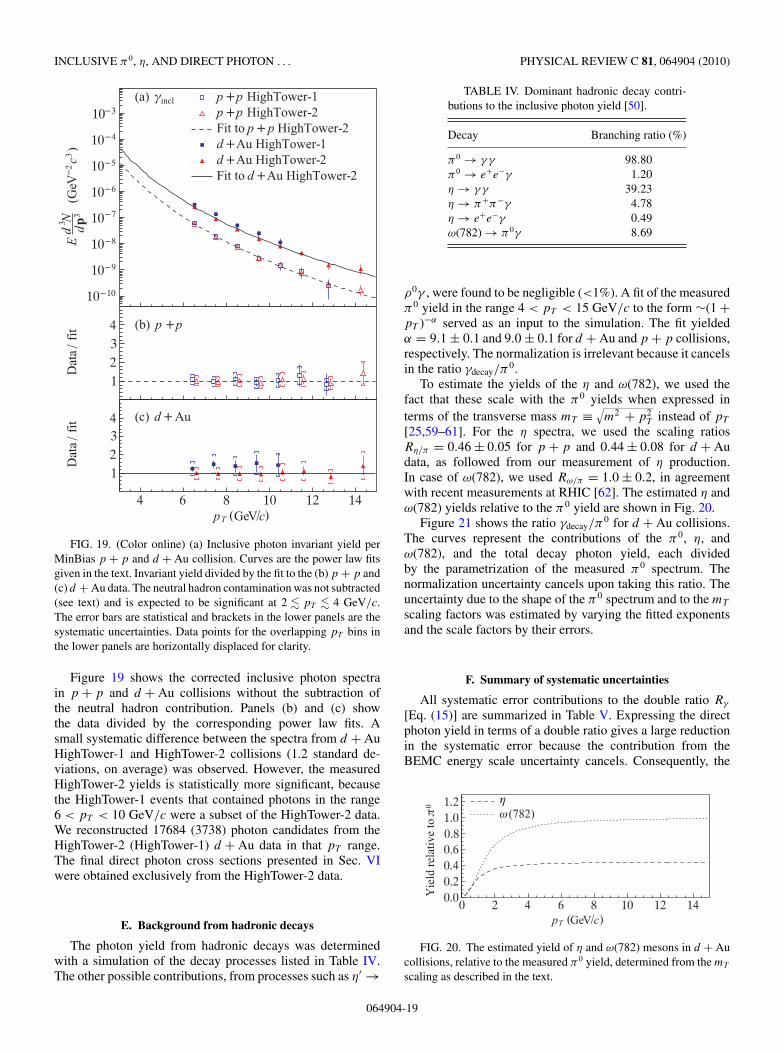
INCLUSIVE π 0, η, AND DIRECT PHOTON . . . PHYSICAL REVIEW C 81, 064904 (2010))
3 c2
−V
(G
e3
pd
N3d
E
−1010
−910
−810
−710
−610
−510
−410
−3101 HighTower-p+p2 HighTower-p+p
2 HighTower-p+pFit to 1Au HighTower-+d2Au HighTower-+d
2Au HighTower-+dFit to
inclγ(a)
fit
/D
ata
123
4 p+p(b)
)c/VGe(Tp4 6 8 10 12 14
fit
/D
ata
1
234 Au+d(c)
FIG. 19. (Color online) (a) Inclusive photon invariant yield perMinBias p + p and d + Au collision. Curves are the power law fitsgiven in the text. Invariant yield divided by the fit to the (b) p + p and(c) d + Au data. The neutral hadron contamination was not subtracted(see text) and is expected to be significant at 2 � pT � 4 GeV/c.The error bars are statistical and brackets in the lower panels are thesystematic uncertainties. Data points for the overlapping pT bins inthe lower panels are horizontally displaced for clarity.
Figure 19 shows the corrected inclusive photon spectrain p + p and d + Au collisions without the subtraction ofthe neutral hadron contribution. Panels (b) and (c) showthe data divided by the corresponding power law fits. Asmall systematic difference between the spectra from d + AuHighTower-1 and HighTower-2 collisions (1.2 standard de-viations, on average) was observed. However, the measuredHighTower-2 yields is statistically more significant, becausethe HighTower-1 events that contained photons in the range6 < pT < 10 GeV/c were a subset of the HighTower-2 data.We reconstructed 17684 (3738) photon candidates from theHighTower-2 (HighTower-1) d + Au data in that pT range.The final direct photon cross sections presented in Sec. VIwere obtained exclusively from the HighTower-2 data.
E. Background from hadronic decays
The photon yield from hadronic decays was determinedwith a simulation of the decay processes listed in Table IV.The other possible contributions, from processes such as η′ →
TABLE IV. Dominant hadronic decay contri-butions to the inclusive photon yield [50].
Decay Branching ratio (%)
π 0 → γ γ 98.80π 0 → e+e−γ 1.20η → γ γ 39.23η → π+π−γ 4.78η → e+e−γ 0.49ω(782) → π 0γ 8.69
ρ0γ , were found to be negligible (<1%). A fit of the measuredπ0 yield in the range 4 < pT < 15 GeV/c to the form ∼(1 +pT )−α served as an input to the simulation. The fit yieldedα = 9.1 ± 0.1 and 9.0 ± 0.1 for d + Au and p + p collisions,respectively. The normalization is irrelevant because it cancelsin the ratio γdecay/π
0.To estimate the yields of the η and ω(782), we used the
fact that these scale with the π0 yields when expressed interms of the transverse mass mT ≡
√m2 + p2
T instead of pT
[25,59–61]. For the η spectra, we used the scaling ratiosRη/π = 0.46 ± 0.05 for p + p and 0.44 ± 0.08 for d + Audata, as followed from our measurement of η production.In case of ω(782), we used Rω/π = 1.0 ± 0.2, in agreementwith recent measurements at RHIC [62]. The estimated η andω(782) yields relative to the π0 yield are shown in Fig. 20.
Figure 21 shows the ratio γdecay/π0 for d + Au collisions.
The curves represent the contributions of the π0, η, andω(782), and the total decay photon yield, each dividedby the parametrization of the measured π0 spectrum. Thenormalization uncertainty cancels upon taking this ratio. Theuncertainty due to the shape of the π0 spectrum and to the mT
scaling factors was estimated by varying the fitted exponentsand the scale factors by their errors.
F. Summary of systematic uncertainties
All systematic error contributions to the double ratio Rγ
[Eq. (15)] are summarized in Table V. Expressing the directphoton yield in terms of a double ratio gives a large reductionin the systematic error because the contribution from theBEMC energy scale uncertainty cancels. Consequently, the
)c/VGe(Tp0 2 4 6 8 10 12 14
0π
Yie
ld r
elat
ive
to
0.00.20.40.60.81.01.2 η
(782)ω
FIG. 20. The estimated yield of η and ω(782) mesons in d + Aucollisions, relative to the measured π 0 yield, determined from the mT
scaling as described in the text.
064904-19

B. I. ABELEV et al. PHYSICAL REVIEW C 81, 064904 (2010)
)c/VGe(Tp0 2 4 6 8 10 12 14
0π/
deca
yγ
−210
−110
1
10
Total0π
η(782)ω
FIG. 21. The simulated number of photons per input pionγdecay/π
0 from hadronic decays in d + Au collisions as a functionof pT . The included decay processes are listed in Table IV. Thevertical line indicates the lower limit of the pT range that was used tofit the π 0 spectrum. The value of γdecay/π
0 below pT = 4 GeV/c is,therefore, less accurate; however, it was not used for further analysis(see text).
largest sources of uncertainty are those associated with the π0
yield extraction and with the SMD energy scale. The latterleads to the Rγ variation of 12%, independent of pT forpT > 6 GeV/c.
The beam background observed in the d + Au data hasa larger effect on single-photon analysis than on the π0
reconstruction because the background-induced showers inthe BEMC could not be distinguished from genuine photonsoriginating from the event vertex. Therefore, we varied thecutoff value for the electromagnetic energy fraction r in anevent [Eq. (1)] in the range r = 0.7–0.9. This propagated into1%–3% point-to-point systematic error of Rγ .
VI. RESULTS AND DISCUSSION
A. Cross section for neutral pion production
The invariant differential cross section for π0 and η
production in inelastic p + p interactions is given by
Ed3σ
p+p
inel
dp3= E
d3σp+p
NSD
dp3= σ
p+p
NSDd2N
2πpT dpT dy. (21)
It has been shown that the singly diffractive contribution tothe inelastic cross section is negligible at pT > 1 GeV/c [23].Therefore, we can assume that the differential inelastic cross
TABLE V. Systematic error contributions for the double ratio Rγ .The classifications A and B are defined in Sec. V.
Source Type Value at low (high) pT (%)
π 0 yield extraction A 7.1Beam background A 1 (3) in d + AuTower energy scale B 3Tower gain spread B 1SMD energy scale B 12SMD gain spread B 1η/π 0 B 2π 0 yield fit B 1.5
)3 c
2−
VG
e
(mb
3 pd
σ3d
E
−910
−810
−710
−610
−510
−410
−310
−210
−1101
10
210
p+pAu+d
QCD pNLO
0π
(a)
theo
ry/
Dat
a 1
2
scale uncertaintyQCDpp+p(b)
)c/VGe(Tp0 2 4 6 8 10 12 14 16
theo
ry/
Dat
a 1
2
Au+d(c)
FIG. 22. (a) Cross section for inclusive π 0 production in p +p and d + Au collisions at
√sNN = 200 GeV, divided by the
corresponding NLO pQCD calculations [52] for (b) p + p and(c) d + Au collisions. The error bars are statistical and shadedbands are pT -correlated systematic uncertainties. Normalizationuncertainties are indicated by shaded bands around unity in the lowerpanels.
section is equal to the differential NSD cross section in ourpT range. The total NSD cross section in p + p collisions wasfound to be σ
p+p
NSD = 30.0 ± 3.5 mb, and the total hadroniccross section in d + Au collisions was found to be σd+Au
hadr =2.21 ± 0.09b (see Sec. III A).
The measured cross sections for π0 production in the p + p
(presented in Ref. [19] and included here for completeness) andd + Au collisions are shown in Fig. 22. The cross sections arecompared to the NLO pQCD calculations [52]. The CTEQ6Mparton densities [63] and the KKP fragmentation functions [64]were used in the p + p calculation. The d + Au calculationused the nuclear parton distributions for gold [65–67], inaddition. The factorization scale µ was set equal to pT andwas varied by a factor of two to estimate the scale uncertainty,indicated by the dashed curves in Figs. 22(a) and 22(b).These panels show the ratio of the measured cross sections tothe corresponding QCD predictions. The error bars shownin the plot are the statistical uncertainties and the shadedbands are the systematic uncertainties. The normalizationuncertainties are indicated by shaded bands around unity onthe right-hand side of each ratio plot. The measured π0 cross
064904-20
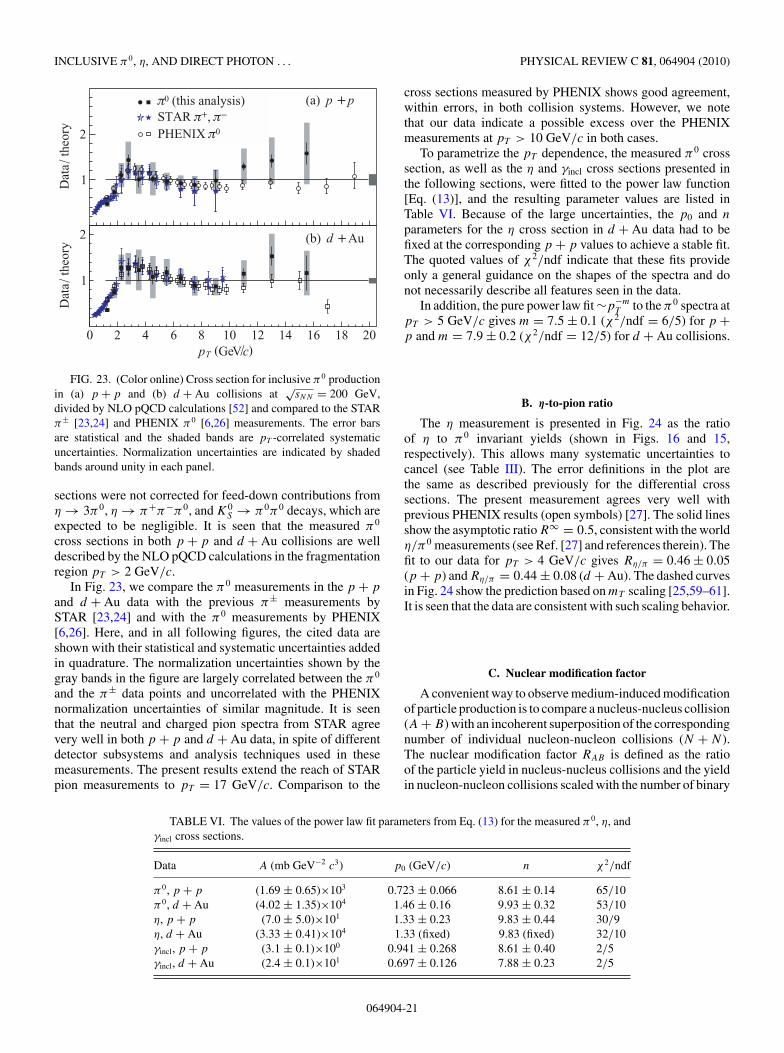
INCLUSIVE π 0, η, AND DIRECT PHOTON . . . PHYSICAL REVIEW C 81, 064904 (2010)th
eory
/D
ata
1
2
(this analysis)0π−π, +πSTAR
0πPHENIX
p+p(a)
)c/VGe(Tp0 2 4 6 8 10 12 14 16 18 20
theo
ry/
Dat
a 1
2 Au+d(b)
FIG. 23. (Color online) Cross section for inclusive π0 productionin (a) p + p and (b) d + Au collisions at
√sNN = 200 GeV,
divided by NLO pQCD calculations [52] and compared to the STARπ± [23,24] and PHENIX π 0 [6,26] measurements. The error barsare statistical and the shaded bands are pT -correlated systematicuncertainties. Normalization uncertainties are indicated by shadedbands around unity in each panel.
sections were not corrected for feed-down contributions fromη → 3π0, η → π+π−π0, and K0
S → π0π0 decays, which areexpected to be negligible. It is seen that the measured π0
cross sections in both p + p and d + Au collisions are welldescribed by the NLO pQCD calculations in the fragmentationregion pT > 2 GeV/c.
In Fig. 23, we compare the π0 measurements in the p + p
and d + Au data with the previous π± measurements bySTAR [23,24] and with the π0 measurements by PHENIX[6,26]. Here, and in all following figures, the cited data areshown with their statistical and systematic uncertainties addedin quadrature. The normalization uncertainties shown by thegray bands in the figure are largely correlated between the π0
and the π± data points and uncorrelated with the PHENIXnormalization uncertainties of similar magnitude. It is seenthat the neutral and charged pion spectra from STAR agreevery well in both p + p and d + Au data, in spite of differentdetector subsystems and analysis techniques used in thesemeasurements. The present results extend the reach of STARpion measurements to pT = 17 GeV/c. Comparison to the
cross sections measured by PHENIX shows good agreement,within errors, in both collision systems. However, we notethat our data indicate a possible excess over the PHENIXmeasurements at pT > 10 GeV/c in both cases.
To parametrize the pT dependence, the measured π0 crosssection, as well as the η and γincl cross sections presented inthe following sections, were fitted to the power law function[Eq. (13)], and the resulting parameter values are listed inTable VI. Because of the large uncertainties, the p0 and n
parameters for the η cross section in d + Au data had to befixed at the corresponding p + p values to achieve a stable fit.The quoted values of χ2/ndf indicate that these fits provideonly a general guidance on the shapes of the spectra and donot necessarily describe all features seen in the data.
In addition, the pure power law fit ∼p−mT to the π0 spectra at
pT > 5 GeV/c gives m = 7.5 ± 0.1 (χ2/ndf = 6/5) for p +p and m = 7.9 ± 0.2 (χ2/ndf = 12/5) for d + Au collisions.
B. η-to-pion ratio
The η measurement is presented in Fig. 24 as the ratioof η to π0 invariant yields (shown in Figs. 16 and 15,respectively). This allows many systematic uncertainties tocancel (see Table III). The error definitions in the plot arethe same as described previously for the differential crosssections. The present measurement agrees very well withprevious PHENIX results (open symbols) [27]. The solid linesshow the asymptotic ratio R∞ = 0.5, consistent with the worldη/π0 measurements (see Ref. [27] and references therein). Thefit to our data for pT > 4 GeV/c gives Rη/π = 0.46 ± 0.05(p + p) and Rη/π = 0.44 ± 0.08 (d + Au). The dashed curvesin Fig. 24 show the prediction based on mT scaling [25,59–61].It is seen that the data are consistent with such scaling behavior.
C. Nuclear modification factor
A convenient way to observe medium-induced modificationof particle production is to compare a nucleus-nucleus collision(A + B) with an incoherent superposition of the correspondingnumber of individual nucleon-nucleon collisions (N + N ).The nuclear modification factor RAB is defined as the ratioof the particle yield in nucleus-nucleus collisions and the yieldin nucleon-nucleon collisions scaled with the number of binary
TABLE VI. The values of the power law fit parameters from Eq. (13) for the measured π 0, η, andγincl cross sections.
Data A (mb GeV−2 c3) p0 (GeV/c) n χ 2/ndf
π 0, p + p (1.69 ± 0.65)×103 0.723 ± 0.066 8.61 ± 0.14 65/10π 0, d + Au (4.02 ± 1.35)×104 1.46 ± 0.16 9.93 ± 0.32 53/10η, p + p (7.0 ± 5.0)×101 1.33 ± 0.23 9.83 ± 0.44 30/9η, d + Au (3.33 ± 0.41)×104 1.33 (fixed) 9.83 (fixed) 32/10γincl, p + p (3.1 ± 0.1)×100 0.941 ± 0.268 8.61 ± 0.40 2/5γincl, d + Au (2.4 ± 0.1)×101 0.697 ± 0.126 7.88 ± 0.23 2/5
064904-21

B. I. ABELEV et al. PHYSICAL REVIEW C 81, 064904 (2010)π/η
R
0.2
0.4
0.6
0.8
1
1.2
1.4 (this analysis)p+pp+pPHENIX
0.5=∞RAsymptotic scalingTm
(a)
)c/VGe(Tp0 2 4 6 8 10 12 14 16
π/ηR
0
0.2
0.4
0.6
0.8
1
1.2
1.4 Au (this analysis)+dAu+dPHENIX
(b)
FIG. 24. The η/π 0 ratio measured in (a) p + p and (b) d +Au collisions at
√sNN = 200 GeV, compared to the PHENIX
measurements [27] and the mT scaling predictions. The error barsare statistical and the shaded bands are pT -correlated systematicuncertainties.
collisions Ncoll,
RAB ≡ d2NAB/dpT dy
〈TAB〉d2σp+p/dpT dy. (22)
Here 〈TAB〉 is the nuclear overlap function, which is relatedto the number of inelastic N + N collisions in one A + B
collision through
〈TAB〉σNNinel = 〈Ncoll〉. (23)
In the absence of medium effects, the nuclear modificationfactor is unity, whereas RAB < 1 indicates a suppression ofparticle production in heavy-ion collisions, compared to anincoherent sum of nucleon-nucleon collisions.
We calculated the RdA ratio [Eqs. (22) and (23)] as
RdA = σNNinel d2NdA/dpT dy
〈Ncoll〉d2σp+p/dpT dy, (24)
where the nucleon-nucleon inelastic cross section was taken tobe σNN
inel = 42 mb and 〈Ncoll〉 = 7.5 ± 0.4 was calculated fromthe Glauber model (see Sec. III C).
The nuclear modification factors for π0 and η are shownin Fig. 25. The definition of the errors is the same as givenfor the differential cross sections in Sec. IV J. Figure 25 alsoshows the RdA for π± measured by STAR [23,24]. A goodagreement between neutral and charged pion measurementsby STAR is observed. Our π0 and η data also agree reasonablywell with the corresponding PHENIX measurements [27,28].In peripheral d + Au collisions, the number of participantnucleons is small and the creation of a dense medium is notexpected. This suggests that, instead of p + p interactions,peripheral collisions can be used as a reference. This was done
dAR
0.5
1
1.5
2
2.5 (this analysis)0π
2/)−π++π (STAR0πPHENIX
(a)
)c/VGe(Tp0 2 4 6 8 10 12 14 16
dAR
0
1
2
3
4 (this analysis)ηηPHENIX
(b)
FIG. 25. (Color online) Nuclear modification factor RdA for (a)π 0 and (b) η, compared to the STAR π± [23,24] and PHENIX π 0
measurements [27,28]. The error bars are statistical and the shadedbands are pT -correlated systematic uncertainties. Normalizationuncertainties are indicated by shaded bands around unity in eachpanel.
through the ratio of particle production in 0%–20% central (C)and 40%–100% peripheral (P ) events,
RCP = 〈Ncoll〉P〈Ncoll〉C
d2NC/dpT dy
d2NP /dpT dy. (25)
The advantage of this measure is that no p + p referencedata are needed. The disadvantage is that a stronger modeldependence is introduced due to the uncertainty in 〈Ncoll〉.Figure 26 shows the RCP ratio for π0 compared to the STARπ± data [24]. It is seen that the agreement between theneutral and the charged pion measurements is very good. Theratio stays constant at a value consistent with unity beyondpT = 8 GeV/c and, therefore, does not support a possibledecrease of the ratio at high pT , which was suggested by theπ± measurement.
)c/VGe(Tp0 2 4 6 8 10 12 14 16
CP
R
0
0.5
1
1.5
2 (this analysis)0π−π, +πSTAR
FIG. 26. (Color online) Nuclear modification factor RCP mea-sured in d + Au collisions, compared to STAR π± measurement [24].The error bars are statistical and the shaded bands are pT -correlatedsystematic uncertainties. Common normalization uncertainty is indi-cated by a shaded band around unity.
064904-22

INCLUSIVE π 0, η, AND DIRECT PHOTON . . . PHYSICAL REVIEW C 81, 064904 (2010)
D. Direct photons
The double ratio Rγ [Eq. (15)] measured in p + p and d +Au collisions is shown in Fig. 27. The shaded band near Rγ =0 indicates our estimate of the upper limit of the remainingneutral hadron contamination. The curves correspond to NLOpQCD calculations [68], which were further evaluated as
Rγ |theor = 1 + (γdir/π0)NLO
(γdecay/π0)simu, (26)
where the numerator is the ratio of the NLO pQCD directphoton and π0 cross sections. The denominator is given bythe number of decay photons per π0, as determined by thesimulation described in Sec. V E.
The NLO pQCD calculation used the CTEQ6M [63] partondensities and the GRV [69] parton-to-photon fragmentationfunctions as an input. The scale dependence of this calculation,indicated by the dashed curves in the figure, was obtainedby changing the scale µ in the calculation of prompt photonproduction, while keeping the scale corresponding to the π0
cross section fixed at µ = pT . In addition, we have variedthe factorization scale for both cross sections simultaneously.The observed variation was quantitatively similar, although inthe opposite direction. Because the measured π0 spectrumfavors the result of the pQCD calculation with µ = pT , wehave used this value for all three curves.
Although Fig. 27 demonstrates that the measured valuesof Rγ are consistent with the calculated direct photon signal,the interpretation in this context has its limitations. First, thecurves do not follow directly from the theory but depend on oursimulation of the decay photon yields, as shown by Eq. (26). Inaddition, the NLO pQCD cross section for π0 production is lessaccurately constrained than that for prompt photon production.
γR
0.00.51.01.52.02.53.0
0CUpper limit (a)
p+pQCD pNLO scale uncertaintyQCDp
)c/VGe(Tp4 6 8 10 12 14
γR
0.00.51.01.52.02.53.0
0CUpper limit (b)
Au+d
FIG. 27. The direct photon yield in (a) p + p and (b) d + Aucollisions at
√sNN = 200 GeV, expressed in terms of the double
ratio Rγ . The error bars are statistical and the shaded bands arepT -correlated systematic uncertainties. The curves correspond toNLO pQCD calculations of the differential cross sections for directphoton [68] and π 0 [52] production in p + p collisions for differentfactorization scales µ (the upper pQCD curve corresponds to µ =pT /2). The upper limit of the fractional neutral hadron contaminationC0 is shown as the shaded band at Rγ = 0.
)c/VGe(Tp4 6 8 10 12 14 16
)3 c
2−
VG
e
(mb
3 pd
σ3d
E
−1010
−910
−810
−710
−610
−510
−410
−310
−210
−110
1 p+pAu+d
QCD pNLO scale uncertaintyQCDp
p+pPHENIX
dirγ
FIG. 28. The differential cross section for direct photon pro-duction at midrapidity in p + p and d + Au collisions at
√sNN =
200 GeV, compared to the PHENIX measurement [29] and the NLOpQCD calculation [68], which was scaled with 〈TdA〉 [Eq. (23)] in thecase of d + Au collisions. The error bars are statistical and the theshaded bands are pT -correlated systematic uncertainties. The arrowscorrespond to the 95% confidence limits, as defined in the text.
To allow for a more solid comparison to theoretical predictions,as well as to other experimental data, we have converted Rγ
to an absolute cross section [Eq. (17)].The calculation of absolute direct photon yields required
that the systematic errors associated with inclusive photonyields, which canceled in the ratio Rγ , were included again.We derived the 95% confidence limits for the cross section inthe pT bins where Rγ did not correspond to a significant directphoton signal, assuming that the statistical and systematicerrors both followed a Gaussian distribution and using thefact that Rγ � 1 by definition.
Figure 28 shows the invariant cross section for directphoton production in p + p and d + Au collisions. Thenormalization uncertainties are not explicitly given in thefigure. The NLO pQCD cross section for direct photonproduction in p + p collisions was scaled with the nuclearthickness function 〈TdA〉[Eq. (23)] to account for the numberof binary collisions in the d + Au system. The precision of thepresented measurement is limited by systematic uncertaintiesfor pT � 9 GeV/c and by statistical uncertainties for larger pT
values. Nevertheless, our results are compatible with the NLOpQCD calculations. Our data are also in a good agreement withthe direct photon cross section in p + p collisions measuredby PHENIX [29].
Earlier measurements of direct photon production inproton-nucleus collisions have been performed by the E706experiment [70] by scattering protons on a fixed berylliumtarget, with proton beam energies of 530 and 800 GeV. Thosedata show a strong discrepancy with pQCD calculations,which was attributed to multiple soft gluon radiation andphenomenologically described as an additional transverseimpulse kT to the incoming partons [70]. It has also beenargued that this discrepancy might be attributable to nuclearmodifications present even in the light berillium nucleus used
064904-23

B. I. ABELEV et al. PHYSICAL REVIEW C 81, 064904 (2010))
3 c2
−V
Ge
(m
b 3 p
dσ3
dE
AB1
−1210
−1110
−1010
−910
−810
−710
−610
−510
−410
−310
−210
−1101
10
210
310
(this analysis)V 200 Ge=−−−
NNs√Au +dSTAR
V 38.8 Ge=−−−NNs√Be +p706 E
V 31.6 Ge=−−−NNs√Be +p706 E
V 38.8 Ge=−−−NNs√p+p706 E
V 31.6 Ge=−−−NNs√p+p706 E
2)/Tp=µ (INCNLO
X+dirγ→B+A
(a)
Tx−110 1
theo
ry/
Dat
a
0
1
2
3
4
5
(b)
FIG. 29. (Color online) (a) The cross sections per nucleon fordirect photon production in d + Au collisions, compared to themeasurements in p + p and p + A collisions by the E706 experiment[70] at the comparable nucleon-nucleon center-of-mass energies. Thetheoretical curves were calculated with the INCNLO program [72]with µ = pT /2. All data have statistical and systematic uncertaintiessummed in quadrature. The vertical arrows indicate our estimate of the95% confidence level. (b) The ratio of the data and the correspondingcalculations.
[71], although the p + p data by E706 show similar behaviorat the same
√sNN . It is, therefore, of interest to compare our
d + Au results to those of E706, as shown in Fig. 29 as afunction of xT ≡ 2pT /
√s, which is a suitable variable for
comparing data taken with different beam energies. Whereasthe ratio data/theory from Ref. [70] shows an increase of upto a factor of 4 toward low xT , our results at still lower xT
constrain such a potential deviation from theory to less thana factor of 2. It should be noted, however, that the data havebeen taken at significantly different
√s.
We have included both prompt and fragmentation com-ponents in the pQCD calculations because our measurementwas based on an inclusive sample of photons. The theoreticalcalculation of these two components is shown in Fig. 30. A firstmeasurement of the contribution from fragmentation photonsto the total direct photon cross section in p + p collisions atRHIC was reported in Ref. [29].
The interest in disentangling photons from the fragmenta-tion process and from the initial hard scattering is twofold.First, it has been observed that the hot and dense medium
)c/VGe(Tp0 2 4 6 8 10 12 14
tot
σ/Xσ
0
0.2
0.4
0.6
0.8
1
)z(q/γD diagramsNLO+LO
FIG. 30. The relative contribution of the fragmentation (Dγ/q )and the pQCD hard scattering processes to the total direct photoncross section [68]. Both contributions are shown as a function of thepT of the produced photon.
produced in central heavy-ion collisions at RHIC causesa suppression of particle yields, which has been attributedto induced gluon radiation from a parton traversing themedium. The same mechanism could lead to a suppression offragmentation photons, although an enhancement of directlyproduced photons has been proposed as well [73]. Second,a measurement of the identified prompt photons in p + p
collisions is of interest for the RHIC spin program, a large partof which is devoted to constraining the gluon spin contributionto the spin of proton. The isolation criterion selects thequark-gluon Compton process and, therefore, enhances thesensitivity of the cross section to the gluon content ofthe proton.
E. Summary
The present π0 spectrum complements that of the π±,which was measured by STAR in the transverse momentumrange 0.35 < pT < 10 GeV/c, and extends up to pT =17 GeV/c. There is a good agreement between the neutraland the charged pion cross sections in STAR, even thoughvery different methods and detector subsystems were used.The π0 cross section also agrees well with the measurementsof PHENIX and with the theoretical NLO pQCD calculations.
This article presents the first measurements of η mesonproduction by STAR, which are in agreement with thePHENIX measurements and with the mT scaling assumption.
We present the measurements of the nuclear modificationfactor RdA, where the π0 production in d + Au collisions iscompared to that in p + p, and RCP , the comparison betweencentral and peripheral d + Au collisions. Both results areconsistent with unity at high pT , are in a good agreementwith the π± measurements, previously made by STAR, andsignificantly extend the pT range for light meson productionmeasurements.
This article also reports the first measurement of directphoton production by STAR. A direct photon signal consistentwith NLO pQCD calculation has been observed at high pT forboth systems. No strong modification of photon production ind + Au collisions was observed.
The results will provide an important baseline for futureAu + Au measurements in STAR.
064904-24

INCLUSIVE π 0, η, AND DIRECT PHOTON . . . PHYSICAL REVIEW C 81, 064904 (2010)
ACKNOWLEDGMENTS
We thank the RHIC Operations Group and RCF at BNL,the NERSC Center at LBNL and the Open Science Gridconsortium for providing resources and support. This workwas supported in part by the Offices of NP and HEP within theUS DOE Office of Science, the US NSF, the Sloan Foundation,the DFG cluster of excellence “Origin and Structure of theUniverse”; CNRS/IN2P3, STFC and EPSRC of the United
Kingdom; FAPESP CNPq of Brazil; Ministry of Educationand Science of the Russian Federation; NNSFC, CAS, MoST,and MoE of China; GA and MSMT of the Czech Republic;FOM and NWO of the Netherlands; DAE, DST, and CSIR ofIndia; the Polish Ministry of Science and Higher Education;Korea Research Foundation; Ministry of Science, Educationand Sports of the Republic of Croatia; Russian Ministry ofScience and Tech and RosAtom of Russia.
[1] J. Adams et al. (STAR Collaboration), Phys. Rev. Lett. 91,172302 (2003).
[2] C. Adler et al. (STAR Collaboration), Phys. Rev. Lett. 90,082302 (2003).
[3] C. Adler et al. (STAR Collaboration), Phys. Rev. Lett. 90,032301 (2003).
[4] J. Adams et al. (STAR Collaboration), Phys. Rev. Lett. 93,252301 (2004).
[5] J. Adams et al. (STAR Collaboration), Phys. Rev. Lett. 91,072304 (2003).
[6] S. Adler et al. (PHENIX Collaboration), Phys. Rev. Lett. 91,072303 (2003).
[7] B. B. Back et al. (PHOBOS Collaboration), Phys. Rev. Lett. 91,072302 (2003).
[8] I. Arsene et al. (BRAHMS Collaboration), Phys. Rev. Lett. 91,072305 (2003).
[9] M. Gyulassy, I. Vitev, X.-N. Wang, and B.-W. Zhang, in Quark-Gluon Plasma, edited by R. C. Hwa and X.-N. Wang (WorldScientific Publishing Company Inc., 2004), p. 123.
[10] J. Cronin et al., Phys. Rev. D 11, 3105 (1975).[11] S. Y. Li and X.-N. Wang, Phys. Lett. B 527, 85 (2002).[12] K. J. Eskola, V. J. Kolhinen, and C. A. Salgado, Eur. Phys. J. C
9, 61 (1999).[13] D. de Florian and R. Sassot, Phys. Rev. D 69, 074028 (2004).[14] B. Abelev et al. (STAR Collaboration), Phys. Rev. C 76, 054903
(2007).[15] X.-N. Wang, Z. Huang, and I. Sarcevic, Phys. Rev. Lett. 77, 231
(1996).[16] R. J. Fries, B. Muller, and D. K. Srivastava, Phys. Rev. Lett. 90,
132301 (2003).[17] T. Peitzmann and M. H. Thoma, Phys. Rep. 364, 175
(2002).[18] G. Bunce, N. Saito, J. Soffer, and W. Vogelsang, Annu. Rev.
Nucl. Part. Sci. 50, 525 (2000).[19] B. Abelev et al. (STAR Collaboration), Phys. Rev. D 80, 111108
(2009).[20] J. Adams et al. (STAR Collaboration), Phys. Rev. C 70, 044902
(2004).[21] B. I. Abelev et al. (STAR Collaboration), Phys. Rev. C 80,
044905 (2009).[22] J. Adams et al. (STAR Collaboration), Phys. Rev. Lett. 97,
152302 (2006).[23] J. Adams et al. (STAR Collaboration), Phys. Lett. B 616, 8
(2005).[24] J. Adams et al. (STAR Collaboration), Phys. Lett. B 637, 161
(2006).[25] B. I. Abelev et al. (STAR Collaboration), Phys. Rev. C 78,
044906 (2008).[26] A. Adare et al. (PHENIX Collaboration), Phys. Rev. D 76,
051106 (2007).
[27] S. Adler et al. (PHENIX Collaboration), Phys. Rev. C 75, 024909(2007).
[28] S. Adler et al. (PHENIX Collaboration), Phys. Rev. Lett. 98,172302 (2007).
[29] S. Adler et al. (PHENIX Collaboration), Phys. Rev. Lett. 98,012002 (2007).
[30] K. Ackermann et al. (STAR Collaboration), Nucl. Instrum.Methods A 499, 624 (2003).
[31] M. Anderson et al. (STAR Collaboration), Nucl. Instrum.Methods A 499, 659 (2003).
[32] K. Ackermann et al. (STAR Collaboration), Nucl. Instrum.Methods A 499, 713 (2003).
[33] M. Beddo et al. (STAR Collaboration), Nucl. Instrum. MethodsA 499, 725 (2003).
[34] M. Bai et al., Nucl. Instrum. Methods A 499, 372 (2003).[35] C. Adler et al., Nucl. Instrum. Methods A 470, 488 (2001).[36] J. Kiryluk (STAR Collaboration), AIP Conf. Proc. 675, 424
(2003).[37] J. Kiryluk (STAR Collaboration), 16th International Spin
Physics Symposium Proceedings (World Scientific PublishingCompany Inc., 2005), p. 718.
[38] O. Grebenyuk, Ph.D. thesis, Utrecht University, 2007.[39] A. Drees and Z. Xu, Proceedings of the Particle Accelerator
Conference (IEEE, Chicago, 2001), p. 3120.[40] M. L. Miller, K. Reygers, S. J. Sanders, and P. Steinberg, Annu.
Rev. Nucl. Part. Sci. 57, 205 (2007).[41] C. Adler et al. (STAR Collaboration), Phys. Rev. Lett. 89,
202301 (2002).[42] B. I. Abelev et al. (STAR Collaboration), Phys. Rev. C 79,
034909 (2009).[43] A. Baltz et al., Nucl. Instrum. Methods A 417, 1 (1998).[44] L. Hulthen and M. Sugawara, in Handbuch der Physik (Springer-
Verlag, Berlin, 1957), Vol. 39.[45] R. Brun, R. Hagelberg, M. Hansroul, and J. Lassalle, Technical
Report CERN-DD-78-2-REV, CERN, 1978.[46] J. Adams et al. (STAR Collaboration), Phys. Rev. Lett. 92,
112301 (2004).[47] T. Cormier, A. Pavlinov, M. Rykov, V. Rykov, and
K. Shestermanov, Nucl. Instrum. Methods A 483, 734 (2002).[48] A. Wetzler, Ph.D. thesis, J. W. Goethe-University, 2006.[49] M. Russcher, Ph.D. thesis, Utrecht University, 2008.[50] C. Amsler et al. (Particle Data Group), Phys. Lett. B 667, 1
(2008).[51] B. Abelev et al. (STAR Collaboration), Phys. Rev. Lett. 97,
252001 (2006).[52] B. Jager, A. Schafer, M. Stratmann, and W. Vogelsang, Phys.
Rev. D 67, 054005 (2003).[53] T. Sjostrand, P. Eden, C. Friberg, L. Lonnblad, G. Miu,
S. Mrenna, and E. Norrbin, Comput. Phys. Commun. 135, 238(2001).
064904-25
B. I. ABELEV et al. PHYSICAL REVIEW C 81, 064904 (2010)
[54] G. D. Lafferty and T. R. Wyatt, Nucl. Instrum. Methods A 355,541 (1995).
[55] P. Aurenche, J. P. Guillet, E. Pilon, M. Werlen, and M. Fontannaz,Phys. Rev. D 73, 094007 (2006).
[56] M. M. Aggarwal et al. (WA98 Collaboration), Phys. Rev. Lett.85, 3595 (2000).
[57] S. Adler et al. (PHENIX Collaboration), Phys. Rev. Lett. 94,232301 (2005).
[58] A. Fasso et al., Computing in High Energy and Nuclear PhysicsConference Proceeding (La Jolla, CA, 2003), p. MOMT005.
[59] M. Bourquin and J.-M. Gaillard, Nucl. Phys. B 114, 334 (1976).[60] J. Schaffner-Bielich, D. Kharzeev, L. McLerran, and
R. Venugopalan, Nucl. Phys. A 705, 494 (2002).[61] B. I. Abelev et al. (STAR Collaboration), Phys. Rev. C 75,
064901 (2007).[62] S. Adler et al. (PHENIX Collaboration), Phys. Rev. C 75, 051902
(2007).[63] J. Pumplin et al., J. High Energy Phys. 07 (2002) 012.
[64] B. Kniehl, G. Kramer, and B. Potter, Nucl. Phys. B 582, 514(2000).
[65] L. Frankfurt and M. Strikman, Eur. Phys. J. A 5, 293(1999).
[66] L. Frankfurt, V. Guzey, M. McDermott, and M. Strikman,J. High Energy Phys. 02 (2002) 027.
[67] L. Frankfurt, V. Guzey, and M. Strikman, Phys. Rev. D 71,054001 (2005).
[68] L. E. Gordon and W. Vogelsang, Phys. Rev. D 48, 3136(1993).
[69] M. Gluck, E. Reya, and A. Vogt, Phys. Rev. D 48, 116 (1993).[70] L. Apanasevich et al. (E706 Collaboration), Phys. Rev. D 70,
092009 (2004).[71] G. Papp, P. Levai, and G. Fai, Phys. Rev. C 61, 021902 (1999).[72] P. Aurenche, M. Fontannaz, J. P. Guillet, B. Kniehl, E. Pilon,
and M. Werlen, Eur. Phys. J. C 9, 107 (1999).[73] R. J. Fries, B. Muller, and D. K. Srivastava, Phys. Rev. Lett. 90,
132301 (2003).
064904-26