Embed Size (px)
Citation preview

RE S E AR C H RE P O R T
Inclusive Recovery in US Cities Erika Poethig Solomon Greene Christina Stacy Tanaya Srini
Brady Meixell
with Steven Brown and Diana Elliott
April 2018
R E S E A R C H T O A C T I O N L A B

AB O U T T H E U R BA N I N S T I T U TE
The nonprofit Urban Institute is a leading research organization dedicated to developing evidence-based insights
that improve people’s lives and strengthen communities. For 50 years, Urban has been the trusted source for
rigorous analysis of complex social and economic issues; strategic advice to policymakers, philanthropists, and
practitioners; and new, promising ideas that expand opportunities for all. Our work inspires effective decisions that
advance fairness and enhance the well-being of people and places.
Copyright © April 2018. Urban Institute. Permission is granted for reproduction of this file, with attribution to the
Urban Institute. Cover image by Shutterstock.
Contents Acknowledgments v
Introduction 1
Part 1. Analysis of Inclusive Recovery in Cities 5
Measuring Inclusive Recovery 5
Indices and Indicators 6
Geography and Time Period 7
Index Creation and City Classifications 8
Interpreting Results 10
Findings 10
General Trends across the Full Sample 10
Analysis of Recovered Cities 13
Post-Recession Analysis 20
Part 2. Lessons Learned and Implications for Practice 23
Adopt a Shared Vision 24
Inspire and Sustain Bold Public Leadership 25
Recruit Partners from across Sectors 26
Build Voice and Power 28
Leverage Assets and Intrinsic Advantages 30
Think and Act Regionally 32
Reframe Inclusion as Integral to Growth 33
Adopt Policies and Programs that Support Inclusion 34
Education Policy 34
Housing Policy 35
Economic Development Policy 36
Fiscal Policy 37
Conclusion 39
Appendix A. Indicator Calculations and Selection 41
Appendix B. Top 10 and Bottom 10 Cities by Index 51
Appendix C. Case Studies 52
Notes 96
References 103

About the Authors 108
Statement of Independence 110

A C K N O W L E D G M E N T S V
Acknowledgments This report was funded by The Kresge Foundation. We are grateful to them and to all our funders, who
make it possible for Urban to advance its mission.
The views expressed are those of the authors and should not be attributed to the Urban Institute,
its trustees, or its funders. Funders do not determine research findings or the insights and
recommendations of Urban experts. Further information on the Urban Institute’s funding principles is
available at urban.org/fundingprinciples.
We are very grateful to the local leaders and experts from Columbus, Ohio; Louisville, Kentucky;
Lowell, Massachusetts; and Midland, Texas who traveled to Washington, DC, to participate in a two-day
roundtable discussion on our research and share their insights and perspectives: Lynnette Cook, Ned
Hill, Amy Klaben, Carla Williams-Scott, Joseph Reagan, Sadiqa Reynolds, David Tandy, Kevin Coughlin,
Colleen Dawicki, Robin Toof, David Diaz, John B. Love III, Emily Ryder Perlmeter, and Luis D. Sanchez.
Other local leaders and experts from these cities also generously agreed to participate in phone
conversations: Lavea Brachman, Bill LaFayette, Ed Manassah, Jerry Abramson, Lauren Heberle, Joshua
Poe, and Prabal Chakrabarti. Several national experts also participated in our convening and offered
invaluable insights: Leon T. Andrews Jr., Alan Berube, Steven Bosacker, Mark Funkhouser, Jessie
Grogan, Alicia Kitsuse, Christy McFarland, Sarah Treuhaft, and Veronika Zubo. We are also grateful to
our internal advisory committee at the Urban Institute for early feedback: Rolf Pendall, Brett Theodos,
Tracy Gordon, Joseph Schilling, and Harvey Galper. We are particularly grateful to Steven Bosacker,
who served as an external reviewer and offered detailed comments that greatly improved this report.
Elizabeth Forney provided outstanding editorial support. Any errors or oversights remain our sole
responsibility.

Introduction A decade after the start of the Great Recession, economic recovery in the US has been
uneven—not only across cities and regions, but also within them. In many cities that
have witnessed significant economic growth, income inequalities are widening, housing
costs are consuming an ever-larger share of family incomes, and homelessness is on the
rise (Glyn and Fox 2017; Joint Center for Housing Studies of Harvard University 2017).1
In some of these cities, local leaders are prioritizing policies that harness growth for
broadly shared benefit, including easing housing affordability pressures, preventing
displacement and strengthening safety nets.2 In cities that have been left behind by the
national recovery or continue to lose ground, local leaders are increasingly linking
economic development to inclusion goals to ensure that all residents can contribute to
turning around the local economy and share the benefits when economic fortunes shift
(Funders Network for Smart Growth and Livable Communities et al. 2017; Mallach and
Brachman 2013). Across all types of cities, local leaders are beginning to recognize that
economic growth does not automatically lead to inclusion; rather intentional strategies
are needed (Einstein at al. 2017; Pacetti 2014).
A new body of research on inclusive growth has emerged to help build the evidence base for local
policies and tools that city leaders can use to harness economic growth for shared prosperity (Ali and
Son 2007; Benner and Pastor 2015; De Souza Briggs, Pendall, and Rubin 2015; McKinley 2010;
PolicyLink and PERE 2016; Shearer et al. 2017). But the inclusive growth lens can obscure differences
across local contexts and market conditions. Cities today are at different stages and trajectories of
economic health. Much of the inclusive growth literature focuses on cities with strong or swiftly
improving economies. But how transferable are strategies in these markets to places currently
experiencing economic distress?
When city leaders are navigating an economic recovery, they have a robust (if still evolving) body of
research to turn to when developing their economic development strategies (Feyrer, Sacerdote, and
Stern 2007; Gray and Scardamalia 2014; Hill et al. 2012; Kodrzycki and Muñoz 2010; Wolman, Ford,
and Hill 1994). But measures of inclusion are largely absent from this literature. Where they do appear,
they test whether inclusion can drive or sustain an economic recovery, not result from it (Wolman et al.
2017). It is still not clear if economic recovery leads to greater inclusion and, if so, under what
circumstances.

2 I N C L U S I V E R E C O V E R Y I N U S C I T I E S
In this report, we begin to fill these knowledge gaps. To do so, we conduct the first empirical analysis
of how economic health and inclusion interact in US cities over several decades. We report on trends in
economic health and inclusion across a large sample of cities, as well as within a smaller subset of cities
that have experienced an economic recovery. Because we are interested in better understanding not
only whether but also how an economic recovery can support inclusive outcomes, we delve deeper into
four cities that outperformed their peers on inclusion measures during their recovery. Through
discussions with individuals, an in-person convening, and review of literature, we identify a set of key
lessons and common “building blocks” that can help support progress on inclusion during a city’s
economic recovery.
Because inclusive recovery has not been a focus of prior literature, before measuring it, we offer the
following definition for an inclusive recovery: An inclusive recovery occurs when a place overcomes
economic distress in a way that provides the opportunity for all residents—especially historically excluded
populations—to benefit from and contribute to economic prosperity. We developed this definition in
consultation with local leaders in economically recovered cities to ensure its relevance to ongoing
debates on the ground about how to not only activate an inclusive recovery, but also sustain its gains.
The components of this definition correspond directly to the measurement principles we use for our
quantitative analysis (described in more detail in Part I). We begin by measuring dynamic trends in a
city’s economic health over several decades to determine if and when a place has overcome economic
distress. Next, we measure economic inclusion broadly by combining indicators that capture income
segregation and housing affordability—or a resident’s ability to benefit from economic growth—with
indicators that capture a resident’s ability to contribute to economic growth, such as educational
attainment and job quality. Finally, we assess the inclusion of historically excluded populations by
measuring disparities between white residents and people of color on indicators similar to those used to
measure economic inclusion. This allows us to understand how race and ethnicity affect a resident’s
ability to benefit from and contribute to economic growth.
Our overall inclusion index combines the economic inclusion and racial inclusion indices for a
composite view of inclusion in a city, but the two are also analyzed separately. We distinguish between
economic inclusion and racial inclusion because it is common for cities to experience economic growth
while leaving certain groups behind: this is especially true for communities of color, given the
longstanding history of race-based discrimination and segregation in this country (Greene, Austin
Turner, and Gourevitch 2017; Kijakazi et al. 2016). We pay special attention to those cases in which
economic inclusion and racial inclusion diverge, as these examples may offer important insights into

I N C L U S I V E R E C O V E R Y I N U S C I T I E S 3
whether achieving inclusion is contingent on the deliberate use of targeted policy actions that address
group-based discrimination or structural barriers.
Our research speaks to a broader range of cities and examines inclusive recovery over a longer
period and for a larger number of cities than previous work. Our analysis considers changes in economic
health across more than three decades, during which many of today’s economic powerhouses faced
stark downturns and recovered using a diverse set of strategies with varying degrees of intentionality.
Some of these cities even managed to pair their economic comebacks with improved dimensions of
inclusion, and they offer a wealth of experiences and lessons learned from which other cities in the
process of navigating an economic recovery can benefit.
Most analyses of inclusion and growth focus on metropolitan regions, so city leaders are often left
without information on how to create and implement policies over which they have direct control. We
undertake our analysis at the city rather than metropolitan or regional level because cities often control
key policies and deliver key services that are fundamental to achieving inclusive outcomes. Community
groups and employers are organized at the city level and often enjoy more direct influence over the day-
to-day lives of residents.
An inclusive recovery occurs when a place overcomes economic distress in a way that
provides the opportunity for all residents—especially historically excluded populations—to
benefit from and contribute to economic prosperity.
In Part I, we describe the methods used to measure inclusive recovery in cities and the findings from
across all cities in the sample, as well as the recovered cities. On average and across the full sample,
economically healthy cities tend to be more inclusive than distressed ones. However, an economic
recovery, in which cities move from economic distress to health, does not guarantee gains in inclusion.
Though cities that recover economically tend to improve on overall inclusion during their recovery,
there is wide variation of this inclusion. More than half of the cities that experienced an economic
recovery lost ground on either racial or economic inclusion during their recovery. This suggests that
cities can harness economic recovery to improve inclusion, but either intentional strategies or other
preconditions may need to be met to realize these gains.

4 I N C L U S I V E R E C O V E R Y I N U S C I T I E S
In Part II, we share lessons learned from case studies of four cities that outperformed their peers on
both racial and economic inclusion during their recovery. These are places that successfully harnessed
their recovery to improve inclusion outcomes, even if they have much work left to do. We extract from
these case studies eight “building blocks” for inclusive recovery. Though no single combination of these
building blocks holds the key to an inclusive recovery, they each point to the importance of creating
open and inclusive decisionmaking processes and adopting intentional strategies to do better with and
for populations often left out of traditional economic development models.
We conclude by suggesting a path forward that includes evaluating policies and practices adopted
in more recent years to support inclusive growth and recovery and monitoring progress on inclusion
outcomes to sustain progress over time. We need to better understand what public and private leaders
in distressed cities can do to lay the foundation for inclusion as they navigate an economic recovery. It is
not clear that their solution set is the same as cities that have never experienced economic distress or
are currently thriving economically. There may be distinct challenges, such as less public revenue to
reinvest in human capital. But there may also be distinct opportunities, such as low-cost land that can be
acquired to preserve affordability. New knowledge is needed to help local leaders build inclusion into
their recovery strategies and institutionalize them moving forward.
When cities are waging comebacks from economic hardship, many decisions must be made
regarding where to allocate resources and how best to deploy them. These inflection points are
opportunities to promote greater inclusion. They spark local conversations about a city’s future and
demand bold, coordinated action. If these conversations include diverse communities and stakeholders
and actions are aimed at harnessing growth for inclusion, all residents can share in future growth.
Cities can harness economic recovery to improve inclusion, but either intentional strategies
or other preconditions may need to be met to realize these gains.
I N C L U S I V E R E C O V E R Y I N U S C I T I E S 5
Part 1. Analysis of Inclusive
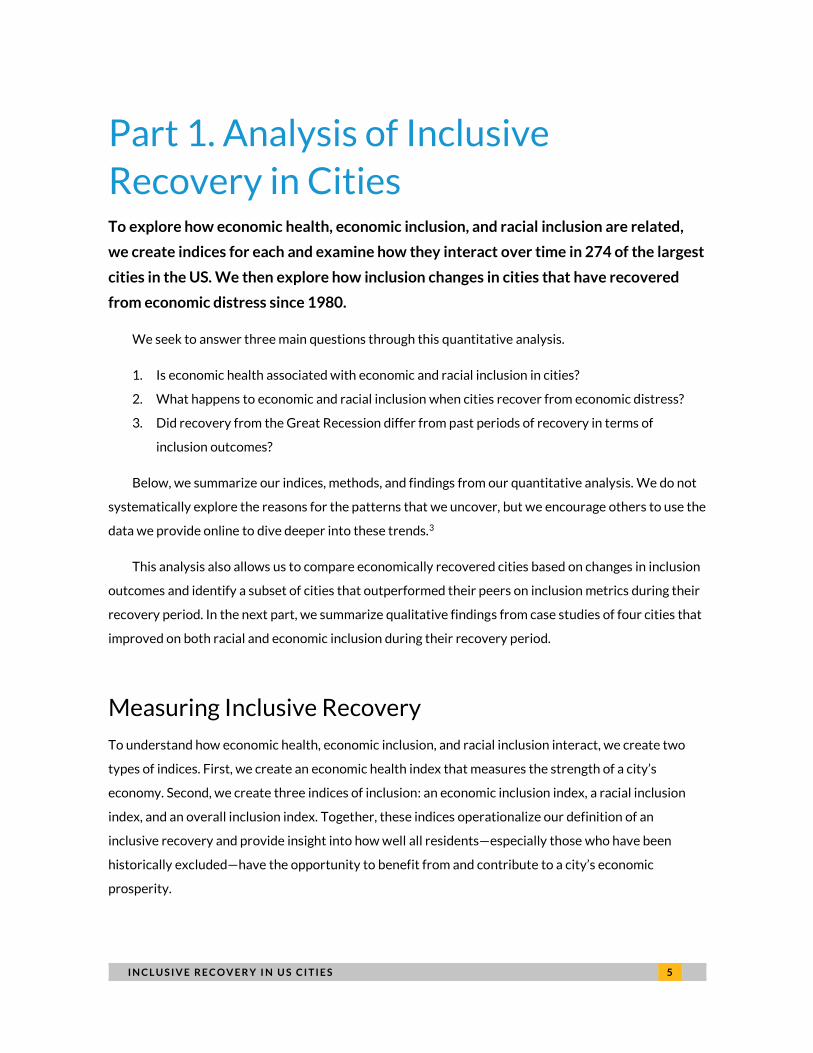
Recovery in Cities To explore how economic health, economic inclusion, and racial inclusion are related,
we create indices for each and examine how they interact over time in 274 of the largest
cities in the US. We then explore how inclusion changes in cities that have recovered
from economic distress since 1980.
We seek to answer three main questions through this quantitative analysis.
1. Is economic health associated with economic and racial inclusion in cities?
2. What happens to economic and racial inclusion when cities recover from economic distress?
3. Did recovery from the Great Recession differ from past periods of recovery in terms of
inclusion outcomes?
Below, we summarize our indices, methods, and findings from our quantitative analysis. We do not
systematically explore the reasons for the patterns that we uncover, but we encourage others to use the
data we provide online to dive deeper into these trends.3
This analysis also allows us to compare economically recovered cities based on changes in inclusion
outcomes and identify a subset of cities that outperformed their peers on inclusion metrics during their
recovery period. In the next part, we summarize qualitative findings from case studies of four cities that
improved on both racial and economic inclusion during their recovery period.
Measuring Inclusive Recovery
To understand how economic health, economic inclusion, and racial inclusion interact, we create two
types of indices. First, we create an economic health index that measures the strength of a city’s
economy. Second, we create three indices of inclusion: an economic inclusion index, a racial inclusion
index, and an overall inclusion index. Together, these indices operationalize our definition of an
inclusive recovery and provide insight into how well all residents—especially those who have been
historically excluded—have the opportunity to benefit from and contribute to a city’s economic
prosperity.
6 I N C L U S I V E R E C O V E R Y I N U S C I T I E S
Each variable in these indices was selected based on a review of the research literature and
available data (see appendix A for a detailed literature review of the selected measures). We include
only measures for which data are available back to 1980 at the city level for all cities in the US.4 This
limits the available indicators but allows us to look at relative measures over a longer historical time
frame and across a large sample of cities. We also include indicators in our inclusion indices that reflect
policy areas over which city leaders have some control (e.g., housing, job quality, education) so that the
indices can directly inform local policy change. Each indicator is weighted equally in the indices. The
indices and indicators are detailed below.
Indices and Indicators
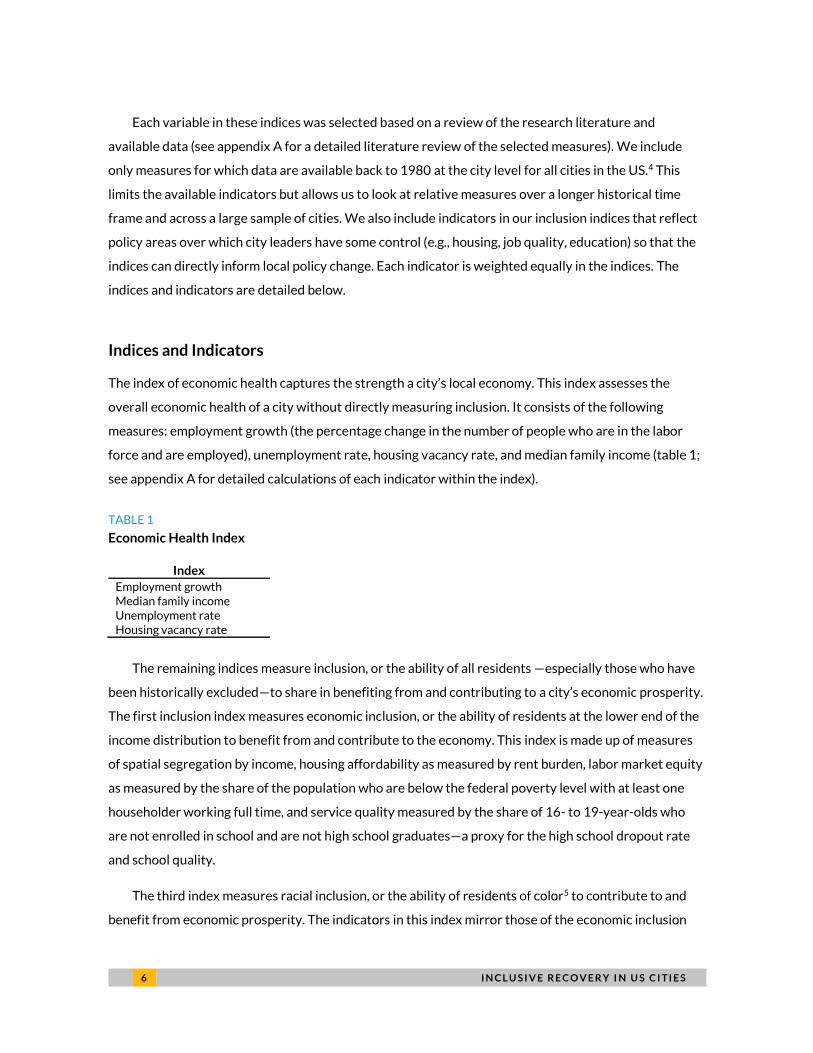
The index of economic health captures the strength a city’s local economy. This index assesses the
overall economic health of a city without directly measuring inclusion. It consists of the following
measures: employment growth (the percentage change in the number of people who are in the labor
force and are employed), unemployment rate, housing vacancy rate, and median family income (table 1;
see appendix A for detailed calculations of each indicator within the index).
TABLE 1
Economic Health Index
Index
Employment growth Median family income Unemployment rate Housing vacancy rate
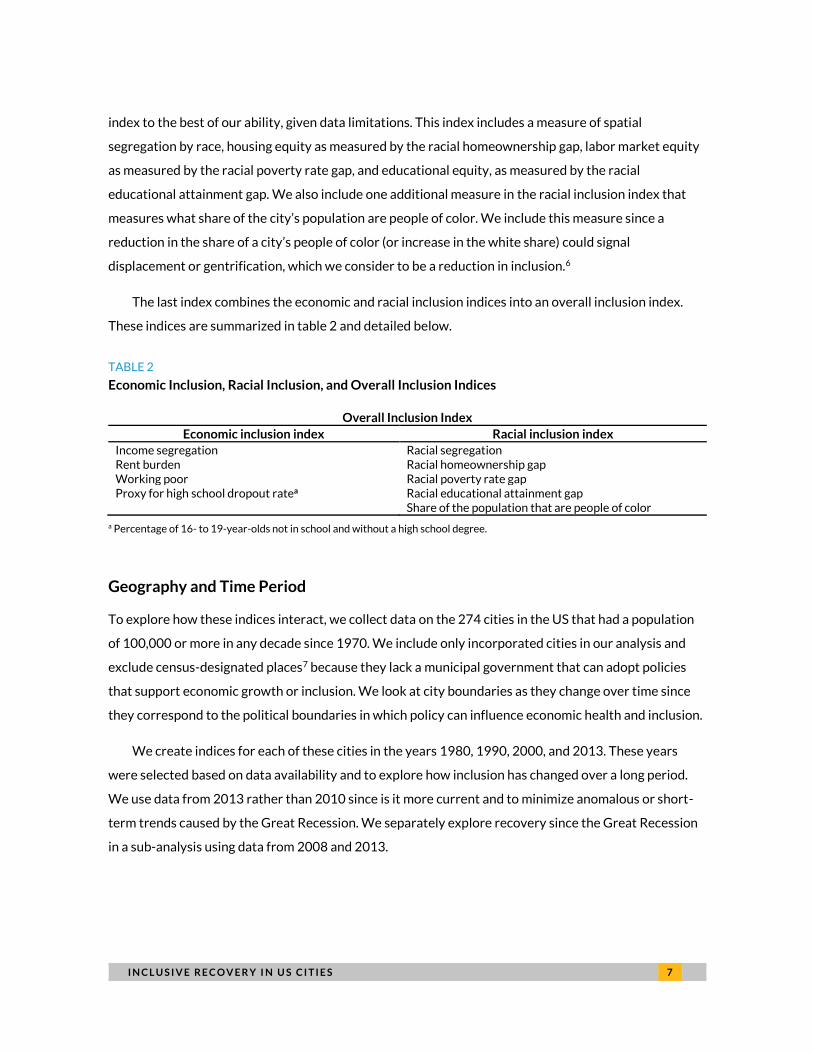
The remaining indices measure inclusion, or the ability of all residents —especially those who have
been historically excluded—to share in benefiting from and contributing to a city’s economic prosperity.
The first inclusion index measures economic inclusion, or the ability of residents at the lower end of the
income distribution to benefit from and contribute to the economy. This index is made up of measures
of spatial segregation by income, housing affordability as measured by rent burden, labor market equity
as measured by the share of the population who are below the federal poverty level with at least one
householder working full time, and service quality measured by the share of 16- to 19-year-olds who
are not enrolled in school and are not high school graduates—a proxy for the high school dropout rate
and school quality.
The third index measures racial inclusion, or the ability of residents of color5 to contribute to and
benefit from economic prosperity. The indicators in this index mirror those of the economic inclusion
I N C L U S I V E R E C O V E R Y I N U S C I T I E S 7
index to the best of our ability, given data limitations. This index includes a measure of spatial
segregation by race, housing equity as measured by the racial homeownership gap, labor market equity
as measured by the racial poverty rate gap, and educational equity, as measured by the racial
educational attainment gap. We also include one additional measure in the racial inclusion index that
measures what share of the city’s population are people of color. We include this measure since a
reduction in the share of a city’s people of color (or increase in the white share) could signal
displacement or gentrification, which we consider to be a reduction in inclusion.6
The last index combines the economic and racial inclusion indices into an overall inclusion index.
These indices are summarized in table 2 and detailed below.
TABLE 2
Economic Inclusion, Racial Inclusion, and Overall Inclusion Indices
Overall Inclusion Index
Economic inclusion index Racial inclusion index
Income segregation Racial segregation Rent burden Racial homeownership gap Working poor Racial poverty rate gap Proxy for high school dropout ratea Racial educational attainment gap Share of the population that are people of color
a Percentage of 16- to 19-year-olds not in school and without a high school degree.
Geography and Time Period
To explore how these indices interact, we collect data on the 274 cities in the US that had a population
of 100,000 or more in any decade since 1970. We include only incorporated cities in our analysis and
exclude census-designated places7 because they lack a municipal government that can adopt policies
that support economic growth or inclusion. We look at city boundaries as they change over time since
they correspond to the political boundaries in which policy can influence economic health and inclusion.
We create indices for each of these cities in the years 1980, 1990, 2000, and 2013. These years
were selected based on data availability and to explore how inclusion has changed over a long period.
We use data from 2013 rather than 2010 since is it more current and to minimize anomalous or short-
term trends caused by the Great Recession. We separately explore recovery since the Great Recession
in a sub-analysis using data from 2008 and 2013.
8 I N C L U S I V E R E C O V E R Y I N U S C I T I E S
Index Creation and City Classifications
To calculate indices of economic health and inclusion at the city level in each study year, we first take
each of the indicators listed above and turn them into z-scores where the mean is zero and the standard
deviation is one in each year. This standardizes the values across measures so that they are comparable.
We then sum up the z-scores for the indicators within each index and divide by the number of indicators
in that index. This process gives each city an index score, or an average z-score for each index, which is
relative to the other cities in the sample. We then rank cities based on each index score. We do not
employ weights in the construction of these indices; that is, every indicator is treated as an equal input
into its respective index.
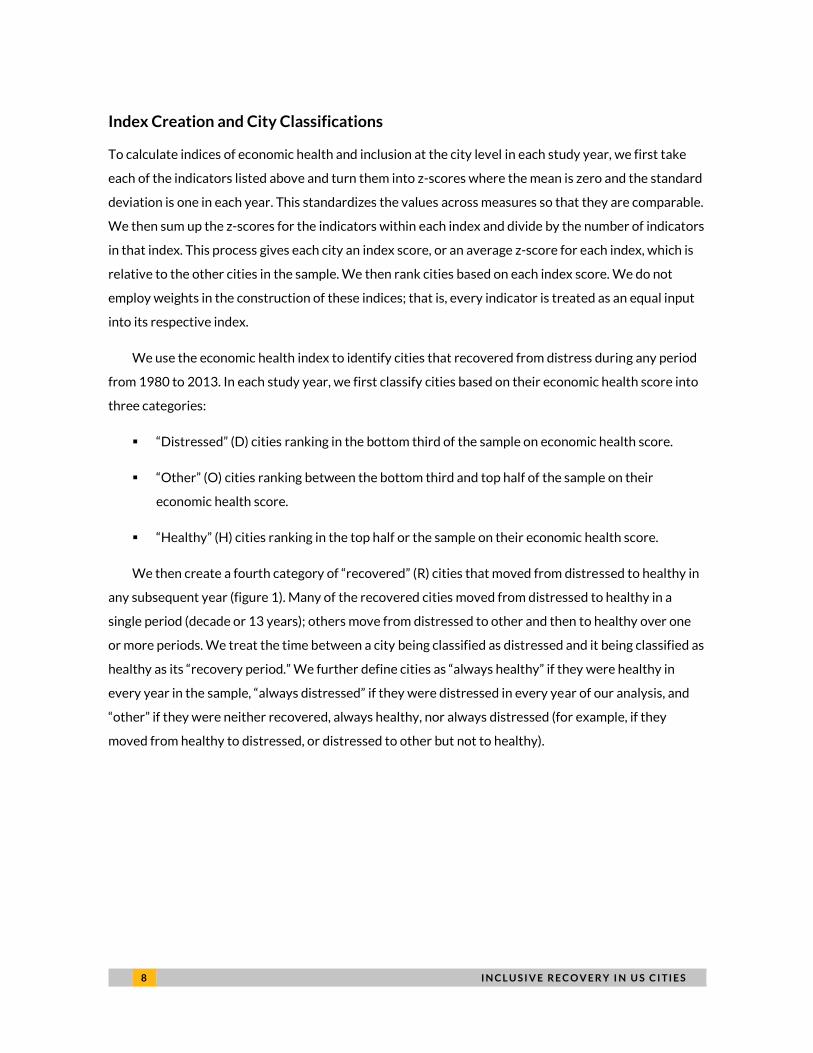
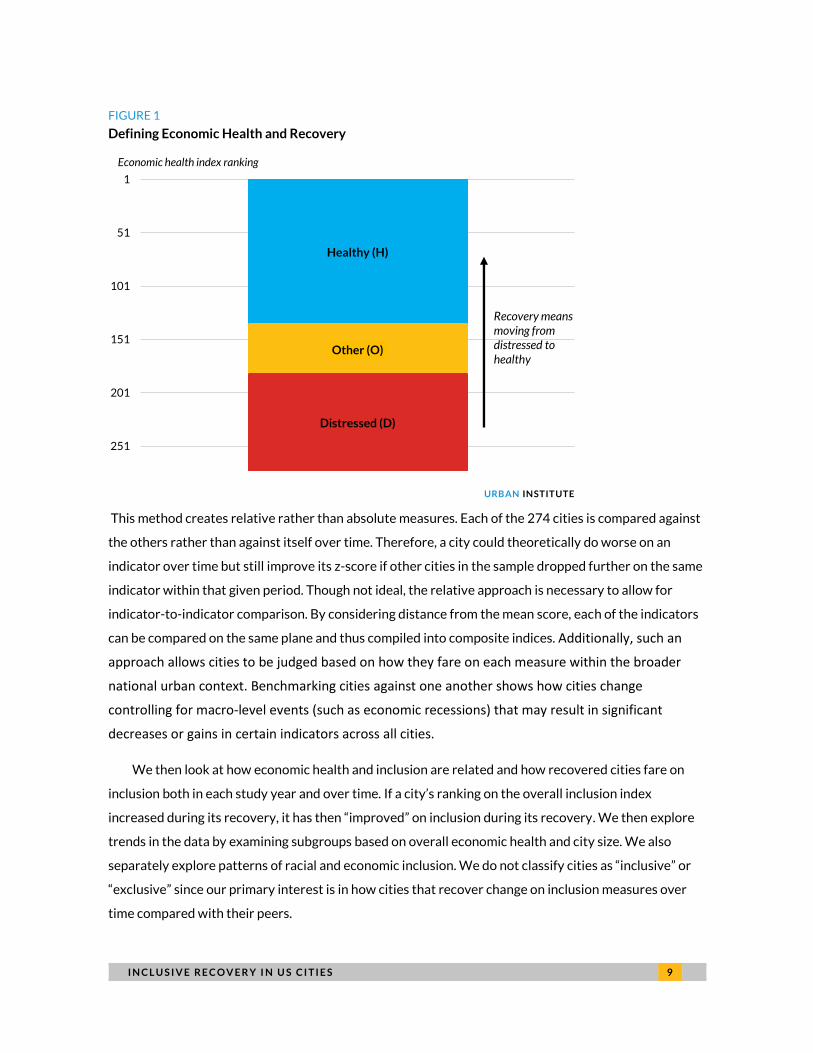
We use the economic health index to identify cities that recovered from distress during any period
from 1980 to 2013. In each study year, we first classify cities based on their economic health score into
three categories:
▪ “Distressed” (D) cities ranking in the bottom third of the sample on economic health score.
▪ “Other” (O) cities ranking between the bottom third and top half of the sample on their
economic health score.
▪ “Healthy” (H) cities ranking in the top half or the sample on their economic health score.
We then create a fourth category of “recovered” (R) cities that moved from distressed to healthy in
any subsequent year (figure 1). Many of the recovered cities moved from distressed to healthy in a
single period (decade or 13 years); others move from distressed to other and then to healthy over one
or more periods. We treat the time between a city being classified as distressed and it being classified as
healthy as its “recovery period.” We further define cities as “always healthy” if they were healthy in
every year in the sample, “always distressed” if they were distressed in every year of our analysis, and
“other” if they were neither recovered, always healthy, nor always distressed (for example, if they
moved from healthy to distressed, or distressed to other but not to healthy).
I N C L U S I V E R E C O V E R Y I N U S C I T I E S 9
FIGURE 1
Defining Economic Health and Recovery
URBAN INSTITUTE
This method creates relative rather than absolute measures. Each of the 274 cities is compared against
the others rather than against itself over time. Therefore, a city could theoretically do worse on an
indicator over time but still improve its z-score if other cities in the sample dropped further on the same
indicator within that given period. Though not ideal, the relative approach is necessary to allow for
indicator-to-indicator comparison. By considering distance from the mean score, each of the indicators
can be compared on the same plane and thus compiled into composite indices. Additionally, such an
approach allows cities to be judged based on how they fare on each measure within the broader
national urban context. Benchmarking cities against one another shows how cities change
controlling for macro-level events (such as economic recessions) that may result in significant
decreases or gains in certain indicators across all cities.
We then look at how economic health and inclusion are related and how recovered cities fare on
inclusion both in each study year and over time. If a city’s ranking on the overall inclusion index
increased during its recovery, it has then “improved” on inclusion during its recovery. We then explore
trends in the data by examining subgroups based on overall economic health and city size. We also
separately explore patterns of racial and economic inclusion. We do not classify cities as “inclusive” or
“exclusive” since our primary interest is in how cities that recover change on inclusion measures over
time compared with their peers.
Healthy (H)
Other (O)
Distressed (D)
1
51
101
151
201
251
Economic health index ranking
Recovery means moving from distressed to healthy
1 0 I N C L U S I V E R E C O V E R Y I N U S C I T I E S
Since the periods between each data point are long (10 or 13 years), the type of distress and
recovery that we capture is long term in nature. Our historical analysis is not likely to capture how cities
respond to short-term shocks. To learn more about recovery and inclusion in the face of a short-term
shock, we look at changes in inclusion for economically recovered cities between 2008 and 2013, a
period in which cities across the US were recovering from the financial crisis and Great Recession.
Interpreting Results
In the following sections, we present results using city rankings on a scale of 1 to 274. A city ranked 1
means that it scored highest on that index in a particular year. For the economic health index, this
means that the city was the most economically “healthy” in that year; for the inclusion indices, this
means that the city was the most “inclusive” in that year. A city ranked 274 means that it has the lowest
score on that index in that year or is the least economically healthy or inclusive. We also look at changes
in rankings and sort cities based on these changes, so that a city that moves up in ranking the most is
listed as the first city and a city that moves down in ranking the most is listed as the last city in the list.
We also use correlations to show the relationships between the indices and other characteristics
that might not be apparent from comparing rankings in tables. However, these correlations should not
be interpreted as causal effects—there are myriad of variables that influence these relationships and
causation may flow in both directions.
Findings
We first examine inclusion levels for the entire sample of 274 cities from 1980 through 2013. We then
narrow this sample down to a subset of 41 recovered cities and examine how inclusion changed during
their recoveries. Finally, we analyze cities that recovered between 2008 and 2013 to better understand
the post–Great Recession period. In each case, we analyze trends across the economic health, economic
inclusion, racial inclusion, and overall inclusion indices.
General Trends across the Full Sample
ECONOMICALLY HEALTHY CITIES TEND TO BE MORE INCLUSIVE THAN DISTRESSED ONES
In general, when looking across all 274 cities, healthy cities tend to have higher rankings on economic,
racial, and overall inclusion compared with their distressed counterparts. For example, all the cities that
I N C L U S I V E R E C O V E R Y I N U S C I T I E S 1 1
ranked in the top 10 on overall inclusion in 2013 were economically healthy in all years in our study (see
appendix B). This is not the case in every instance, however, and there are several cities that perform
poorly on economic health but receive high scores on the economic and racial inclusion indices, and vice
versa. For example, Killeen, Texas, was economically distressed throughout all periods in our study but
had high overall inclusion rankings of 40, 12, and 10 in 1990, 2000, and 2013, respectively. Conversely,
St. Paul, Minnesota, a city that was economically healthy in every study year, ranked poorly on overall
inclusion over the same years, with rankings of 221, 197, and 257, respectively.8 Despite these counter
examples, healthy cities tended to exhibit greater levels of inclusion.
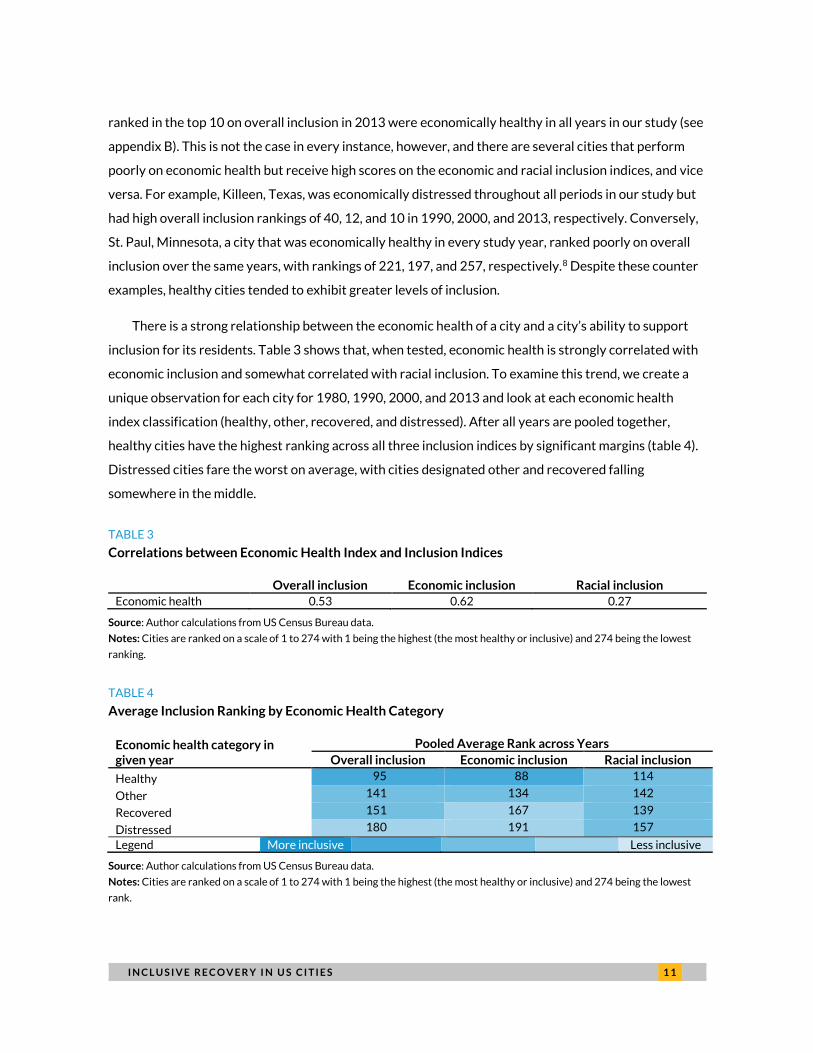
There is a strong relationship between the economic health of a city and a city’s ability to support
inclusion for its residents. Table 3 shows that, when tested, economic health is strongly correlated with
economic inclusion and somewhat correlated with racial inclusion. To examine this trend, we create a
unique observation for each city for 1980, 1990, 2000, and 2013 and look at each economic health
index classification (healthy, other, recovered, and distressed). After all years are pooled together,
healthy cities have the highest ranking across all three inclusion indices by significant margins (table 4).
Distressed cities fare the worst on average, with cities designated other and recovered falling
somewhere in the middle.
TABLE 3
Correlations between Economic Health Index and Inclusion Indices
Overall inclusion Economic inclusion Racial inclusion
Economic health 0.53 0.62 0.27
Source: Author calculations from US Census Bureau data.
Notes: Cities are ranked on a scale of 1 to 274 with 1 being the highest (the most healthy or inclusive) and 274 being the lowest
ranking.
TABLE 4
Average Inclusion Ranking by Economic Health Category
Economic health category in given year
Pooled Average Rank across Years
Overall inclusion Economic inclusion Racial inclusion
Healthy 95 88 114
Other 141 134 142
Recovered 151 167 139
Distressed 180 191 157
Legend More inclusive Less inclusive
Source: Author calculations from US Census Bureau data.
Notes: Cities are ranked on a scale of 1 to 274 with 1 being the highest (the most healthy or inclusive) and 274 being the lowest
rank.

1 2 I N C L U S I V E R E C O V E R Y I N U S C I T I E S
SMALLER CITIES TEND TO BE MORE INCLUSIVE THAN LARGER ONES
Smaller cities are, on average, more inclusive across all the inclusion indices, with an average overall
inclusion ranking for small cities of 127 compared with168 and 182 for medium and large cities
respectively (table 5).9 The correlation analysis affirmed this trend, with slight negative correlations
existing between population and both economic and overall inclusion (table 6).
TABLE 5
Average Inclusion Ranking by City Size
City size
Pooled Average Ranking across Years
Overall inclusion ranking
Economic inclusion ranking
Racial inclusion ranking
Small (<250,000) 127 131 126 Medium (250,000–750,000) 168 160 167 Large (>750,000) 182 153 200
Legend More inclusive Less inclusive
Source: Author calculations from US Census Bureau data.
TABLE 6
Correlations between City Size and Inclusion Indices
Overall inclusion Economic inclusion Racial inclusion
Population -0.17 -0.18 -0.10
Source: Author calculations from US Census Bureau data.
ECONOMIC INCLUSION AND RACIAL INCLUSION DO NOT ALWAYS TREND TOGETHER
Cities that rank highly on economic inclusion do not always rank highly on racial inclusion. As seen in
table 7, the correlation between the two is positive but weak—many cities in our sample fare well on one
and poorly on the other. For instance, in 2013, Sioux Falls, SD, ranked 38th on economic inclusion but
274th on racial inclusion, and Camden, NJ, ranked 271st on economic inclusion but 13th on racial
inclusion. In fact, in that same year, over half of the cities in our sample had economic inclusion rankings
that were more than 50 points different from their racial inclusion ranking. This highlights the
importance of monitoring racial inclusion in addition to economic inclusion.
TABLE 7
Correlation between Racial and Economic Inclusion Indices
Economic inclusion
Racial inclusion 0.35
Source: Author calculations from US Census Bureau data.
I N C L U S I V E R E C O V E R Y I N U S C I T I E S 1 3
There is a strong relationship between the economic health of a city and a city’s ability to
support inclusion for its residents.
Analysis of Recovered Cities
To understand how economic recovery and inclusion relate, we next examine the subset of cities that
recovered economically in any 10-year (or 13-year for 1990 to 2013) period between 1980 and 2013.
Of the 274 cities in the sample, 41 moved from the economically distressed category to healthy within
this time period (figure 2). In this analysis, these are “recovered cities”.10 Throughout this section, we
look at how recovered cities’ rankings on economic, racial, and overall inclusion change over the course
of their economic recovery (see also box 1).

1 4 I N C L U S I V E R E C O V E R Y I N U S C I T I E S
FIGURE 2
Map of Recovered Cities
Source: Author calculations from US Census Bureau data. URBAN INSTITUTE
I N C L U S I V E R E C O V E R Y I N U S C I T I E S 1 5
CITIES TEND TO IMPROVE ON OVERALL INCLUSION DURING ECONOMIC
RECOVERY PERIODS
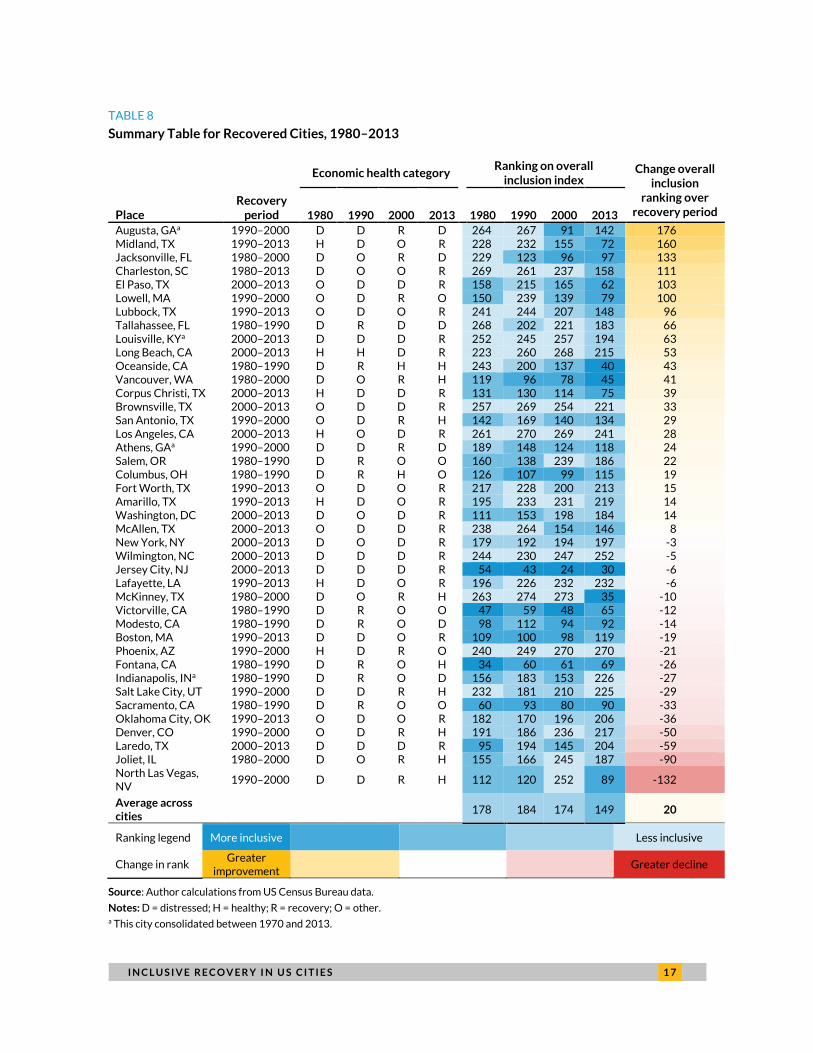
The cities that recovered from economic distress between 1980 and 2013 varied widely in terms of
their levels of inclusion, but, on average, they improved on overall inclusion during their recovery. Table
8 shows the economic health status for these cities in each year, as well as their overall inclusion index
rankings. The cities are sorted by their change in overall inclusion ranking during their recovery.
As the table shows, Midland, Texas, recovered from distress between 1990 and 2013. It also had
the second largest increase in overall inclusion during this period, jumping 160 rankings. On average,
cities improved 20 rankings on overall inclusion during their recovery.
However, there is wide variation in changes on overall inclusion during recovery. Eighteen of the 41
recovered cities slipped on overall inclusion rankings during their recovery. North Las Vegas, for
example, recovered from economic distress between 1990 and 2000, but it dropped 132 rankings
during this period.
A city’s starting point on overall inclusion before its recovery may impact its ability to improve on
inclusion, and cities that started their recovery period with low rankings on inclusion tended to gain the
most during their recovery. For instance, the 11 recovered cities exhibiting the greatest improvement
on overall inclusion ranking were all in the bottom half for overall inclusion before their recovery. A
correlation analysis confirms this trend, showing a negative relationship between a city’s ranking on
overall inclusion in its final year of distress and subsequent change on inclusion during its recovery
(table 9). These results are intuitive—a city that performs poorly on inclusion metrics when it is
economically distressed has the most to gain during its recovery.
However, there were also examples of these results diverging. Vancouver, Washington, and Corpus
Christi, Texas, ranked in the top half of cities for inclusion at the start of their recovery and still saw
significant improvement by the end of their recovery (Vancouver rose 41 rankings and Corpus Christi
39). Further, for cities that declined on overall inclusion over their recovery, starting points ranged from
an overall inclusion ranking of 24 (Jersey City, New Jersey) to 263 (McKinney, Texas). Though it may be
easier for recovering cities with lower levels of inclusion initially to make rapid gains, the data show that
any city can be susceptible to losing ground no matter its starting point.
As mentioned, in this study, we follow city boundaries as they change over time. Over the span of
analysis, some cities experienced changes to their boundaries by way of annexation, consolidations,
mergers, and (less often) detachments. City-county mergers generally represent the most dramatic of
such cases. In three instances—Athens-Clarke County, Georgia; Augusta-Richmond County, Georgia;

1 6 I N C L U S I V E R E C O V E R Y I N U S C I T I E S
and Louisville-Jefferson County, KY—cities merged with their surrounding county within the period of
economic growth that vaulted them from distressed to healthy and resulted in their designation as a
recovered city. Consequently, improvements on any of the indicators or indices may reflect changing
boundaries rather than actual gains for the city’s residents. Augusta appears to be an example of the
former as it moved from distressed to healthy in the aftermath of its merger, only to fall back into the
distressed category in the following decade. Conversely, in the case of Louisville, a robustness check
determined that gains in inclusion in large part reflect true improvement (see Louisville case study in
appendix C).
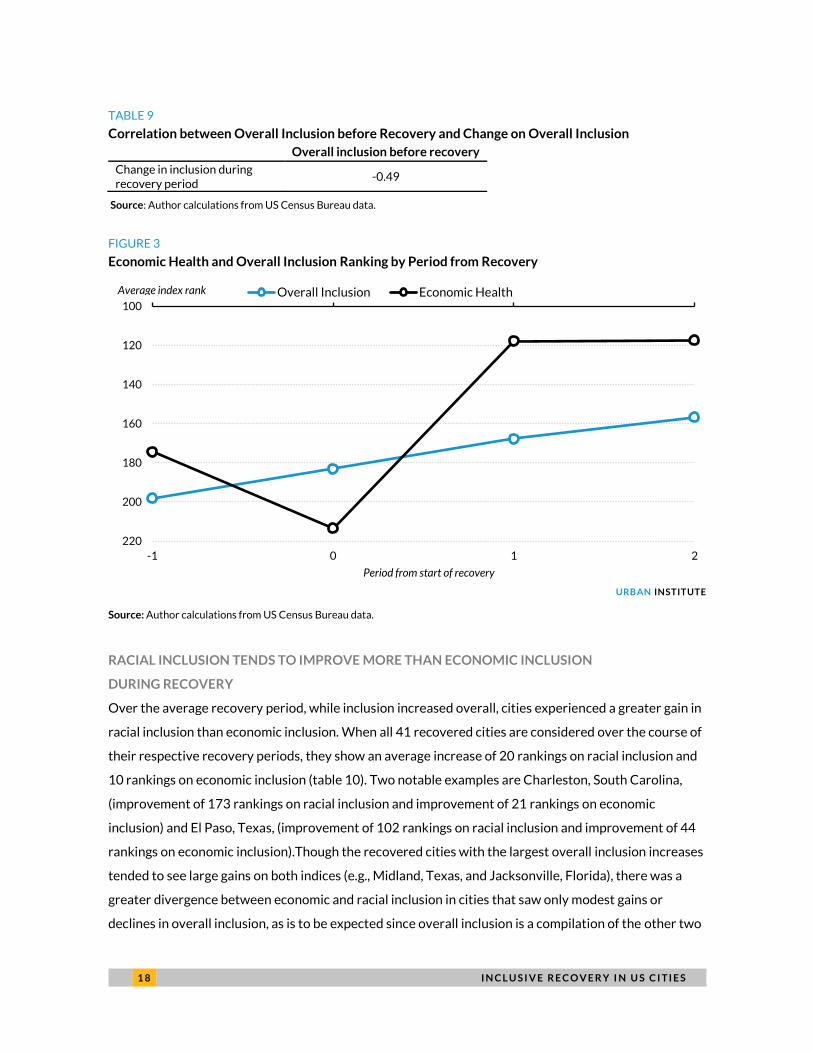
Average index rankings across the recovered cities show that overall inclusion gradually improved
in the lead-up to these cities’ recovery periods and continued through the recovery and after. Gains in
economic health, on average, tended to hold even two periods after the start of recovery (figure 3).
I N C L U S I V E R E C O V E R Y I N U S C I T I E S 1 7
TABLE 8
Summary Table for Recovered Cities, 1980–2013
Place Recovery
period
Economic health category Ranking on overall
inclusion index Change overall
inclusion ranking over
recovery period 1980 1990 2000 2013 1980 1990 2000 2013
Augusta, GAa 1990–2000 D D R D 264 267 91 142 176 Midland, TX 1990–2013 H D O R 228 232 155 72 160 Jacksonville, FL 1980–2000 D O R D 229 123 96 97 133 Charleston, SC 1980–2013 D O O R 269 261 237 158 111 El Paso, TX 2000–2013 O D D R 158 215 165 62 103 Lowell, MA 1990–2000 O D R O 150 239 139 79 100 Lubbock, TX 1990–2013 O D O R 241 244 207 148 96 Tallahassee, FL 1980–1990 D R D D 268 202 221 183 66 Louisville, KYa 2000–2013 D D D R 252 245 257 194 63 Long Beach, CA 2000–2013 H H D R 223 260 268 215 53 Oceanside, CA 1980–1990 D R H H 243 200 137 40 43 Vancouver, WA 1980–2000 D O R H 119 96 78 45 41 Corpus Christi, TX 2000–2013 H D D R 131 130 114 75 39 Brownsville, TX 2000–2013 O D D R 257 269 254 221 33 San Antonio, TX 1990–2000 O D R H 142 169 140 134 29 Los Angeles, CA 2000–2013 H O D R 261 270 269 241 28 Athens, GAa 1990–2000 D D R D 189 148 124 118 24 Salem, OR 1980–1990 D R O O 160 138 239 186 22 Columbus, OH 1980–1990 D R H O 126 107 99 115 19 Fort Worth, TX 1990–2013 O D O R 217 228 200 213 15 Amarillo, TX 1990–2013 H D O R 195 233 231 219 14 Washington, DC 2000–2013 D O D R 111 153 198 184 14 McAllen, TX 2000–2013 O D D R 238 264 154 146 8 New York, NY 2000–2013 D O D R 179 192 194 197 -3 Wilmington, NC 2000–2013 D D D R 244 230 247 252 -5 Jersey City, NJ 2000–2013 D D D R 54 43 24 30 -6 Lafayette, LA 1990–2013 H D O R 196 226 232 232 -6 McKinney, TX 1980–2000 D O R H 263 274 273 35 -10 Victorville, CA 1980–1990 D R O O 47 59 48 65 -12 Modesto, CA 1980–1990 D R O D 98 112 94 92 -14 Boston, MA 1990–2013 D D O R 109 100 98 119 -19 Phoenix, AZ 1990–2000 H D R O 240 249 270 270 -21 Fontana, CA 1980–1990 D R O H 34 60 61 69 -26 Indianapolis, INa 1980–1990 D R O D 156 183 153 226 -27 Salt Lake City, UT 1990–2000 D D R H 232 181 210 225 -29 Sacramento, CA 1980–1990 D R O O 60 93 80 90 -33 Oklahoma City, OK 1990–2013 O D O R 182 170 196 206 -36 Denver, CO 1990–2000 O D R H 191 186 236 217 -50 Laredo, TX 2000–2013 D D D R 95 194 145 204 -59 Joliet, IL 1980–2000 D O R H 155 166 245 187 -90 North Las Vegas, NV
1990–2000 D D R H 112 120 252 89 -132
Average across cities
178 184 174 149 20
Ranking legend More inclusive Less inclusive
Change in rank Greater
improvement Greater decline
Source: Author calculations from US Census Bureau data.
Notes: D = distressed; H = healthy; R = recovery; O = other. a This city consolidated between 1970 and 2013.
1 8 I N C L U S I V E R E C O V E R Y I N U S C I T I E S
TABLE 9
Correlation between Overall Inclusion before Recovery and Change on Overall Inclusion
Overall inclusion before recovery
Change in inclusion during recovery period
-0.49
Source: Author calculations from US Census Bureau data.
FIGURE 3
Economic Health and Overall Inclusion Ranking by Period from Recovery
URBAN INSTITUTE
Source: Author calculations from US Census Bureau data.
RACIAL INCLUSION TENDS TO IMPROVE MORE THAN ECONOMIC INCLUSION
DURING RECOVERY
Over the average recovery period, while inclusion increased overall, cities experienced a greater gain in
racial inclusion than economic inclusion. When all 41 recovered cities are considered over the course of
their respective recovery periods, they show an average increase of 20 rankings on racial inclusion and
10 rankings on economic inclusion (table 10). Two notable examples are Charleston, South Carolina,
(improvement of 173 rankings on racial inclusion and improvement of 21 rankings on economic
inclusion) and El Paso, Texas, (improvement of 102 rankings on racial inclusion and improvement of 44
rankings on economic inclusion).Though the recovered cities with the largest overall inclusion increases
tended to see large gains on both indices (e.g., Midland, Texas, and Jacksonville, Florida), there was a
greater divergence between economic and racial inclusion in cities that saw only modest gains or
declines in overall inclusion, as is to be expected since overall inclusion is a compilation of the other two
100
120
140
160
180
200
220
-1 0 1 2
Overall Inclusion Economic Health
Period from start of recovery
Average index rank

I N C L U S I V E R E C O V E R Y I N U S C I T I E S 1 9
indices. For instance, Wilmington, North Carolina, rose 13 spots on racial inclusion and dropped 27
rankings on economic inclusion during its recovery. Notably, more than half of the 41 recovered cities
experienced a decline in either racial or economic inclusion during their recovery.
TABLE 10 Change in Inclusion Ranking during Period of Recovery
Change in rank Greater
improvement Greater decline
Source: Author calculations from US Census Bureau data. a This city consolidated between 1970 and 2013.
Place Recovery
period
Change in Ranking over Recovery Period
Overall inclusion index
Economic inclusion index
Racial inclusion index
Augusta, GAa 1990–2000 176 176 114 Midland, TX 1990–2013 160 118 96 Jacksonville, FL 1980–2000 133 100 105 Charleston, SC 1980–2013 111 21 173 El Paso, TX 2000–2013 103 44 102 Lowell, MA 1990–2000 100 75 31 Lubbock, TX 1990–2013 96 106 50 Tallahassee, FL 1980–1990 66 74 39 Louisville, KYa 2000–2013 63 23 102 Long Beach, CA 2000–2013 53 53 45 Oceanside, CA 1980–1990 43 -7 47 Vancouver, WA 1980–2000 41 49 19 Corpus Christi, TX 2000–2013 39 23 66 Brownsville, TX 2000–2013 33 19 11 San Antonio, TX 1990–2000 29 23 21 Los Angeles, CA 2000–2013 28 64 15 Athens, GAa 1990–2000 24 24 6 Salem, OR 1980–1990 22 -34 74 Columbus, OH 1980–1990 19 20 13 Fort Worth, TX 1990–2013 15 0 12 Amarillo, TX 1990–2013 14 16 -7 Washington, DC 2000–2013 14 35 -7 McAllen, TX 2000–2013 8 34 -14 New York, NY 2000–2013 -3 13 -6 Wilmington, NC 2000–2013 -5 -27 13 Lafayette, LA 1990–2013 -6 7 -22 Jersey City, NJ 2000–2013 -6 -3 -29 McKinney, TX 1980–2000 -10 -111 11 Victorville, CA 1980–1990 -12 12 -60 Modesto, CA 1980–1990 -14 -50 53 Boston, MA 1990–2013 -19 -42 8 Phoenix, AZ 1990–2000 -21 -38 -33 Fontana, CA 1980–1990 -26 -118 7 Indianapolis, INa 1980–1990 -27 8 -45 Salt Lake City, UT 1990–2000 -29 -35 -4 Sacramento, CA 1980–1990 -33 -12 -39 Oklahoma City, OK 1990–2013 -36 -60 2 Denver, CO 1990–2000 -50 -2 -44 Laredo, TX 2000–2013 -59 -34 1 Joliet, IL 1980–2000 -90 5 -124 North Las Vegas, NV 1990–2000 -132 -152 -5 Average across cities 20 10 20

2 0 I N C L U S I V E R E C O V E R Y I N U S C I T I E S
SMALLER AND MEDIUM CITIES THAT RECOVER TEND TO GAIN MORE GROUND ON INCLUSION
THAN LARGER CITIES
Over the average recovery period, smaller and medium-sized cities tended to make the largest gains in
inclusion, comparative to larger cities. For overall inclusion, the 24 small recovered cities within the
sample rose an average 21 rankings during their recovery, as did the 13 medium recovered cities.
Conversely, large cities rose only 4, on average.
These changes also vary between economic and racial inclusion. On average, small and medium
cities made the largest gains in economic inclusion during recovery, but the gains they made on racial
inclusion were more modest. In contrast, the four large cities in the sample decreased one ranking on
economic inclusion, on average, and had the largest average increase on racial inclusion ranking during
their recovery (table 11).
TABLE 11
Average Change in Inclusion Ranking during Period of Recovery, by City Size
City size
Number of cities across
years
Pooled Change in Ranking during Recovery Period
Overall inclusion index ranking
Economic inclusion index ranking
Racial inclusion index ranking
Small (<250,000) 24 21 15 12 Medium (250,000–749,999)
13 21 25 15
Large (>750,000) 4 8 -1 16
Change in rank Greater
improvement Greater decline
Source: Author calculations from US Census Bureau data.
Post-Recession Analysis
In the above analysis, we examine recovery over a long period (at least 10 years), which includes slower
gains that cities make after a prolonged period of economic distress. To explore how inclusion changes
as cities recover from a short-term shock, we examine the relationship between recovery and inclusion
for cities for the years 2008 to 2013, in the wake of the financial crisis and Great Recession. We include
in this analysis cities that were classified as distressed in 2008 but moved to healthy by 2013. We also
include cities that were distressed at any point before 2008, were classified as other in 2008, and
moved to healthy by 2013.11
I N C L U S I V E R E C O V E R Y I N U S C I T I E S 2 1
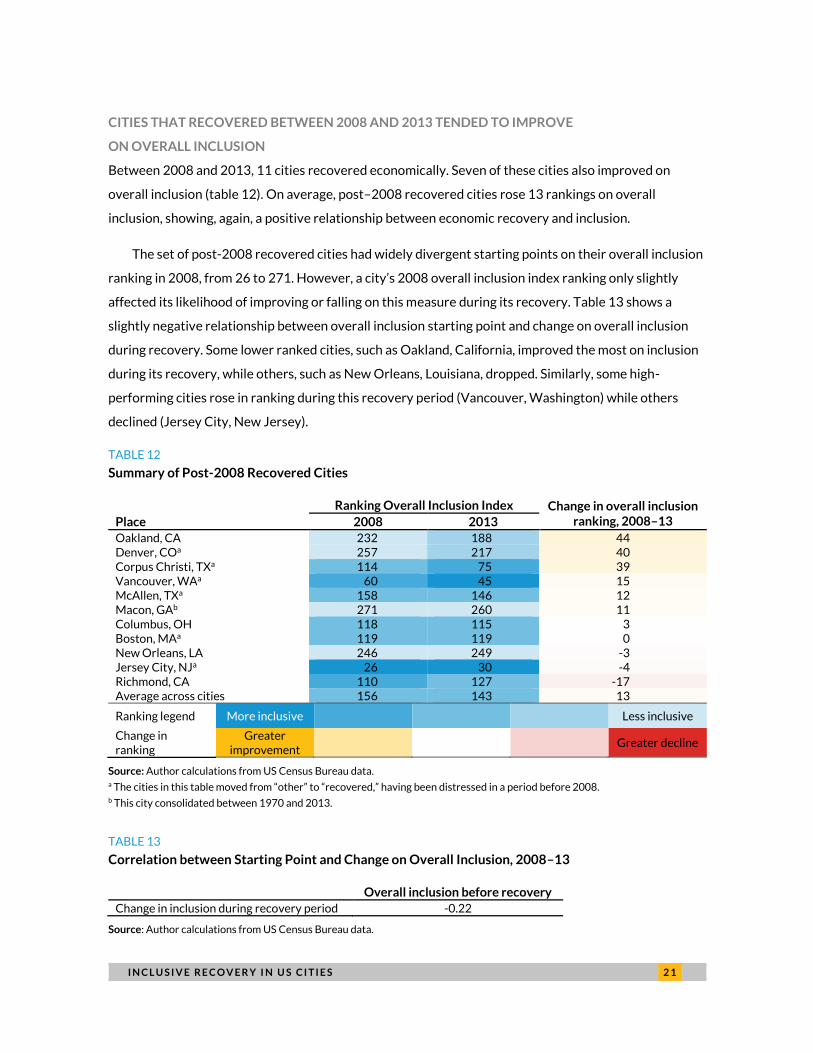
CITIES THAT RECOVERED BETWEEN 2008 AND 2013 TENDED TO IMPROVE
ON OVERALL INCLUSION
Between 2008 and 2013, 11 cities recovered economically. Seven of these cities also improved on
overall inclusion (table 12). On average, post–2008 recovered cities rose 13 rankings on overall
inclusion, showing, again, a positive relationship between economic recovery and inclusion.
The set of post-2008 recovered cities had widely divergent starting points on their overall inclusion
ranking in 2008, from 26 to 271. However, a city’s 2008 overall inclusion index ranking only slightly
affected its likelihood of improving or falling on this measure during its recovery. Table 13 shows a
slightly negative relationship between overall inclusion starting point and change on overall inclusion
during recovery. Some lower ranked cities, such as Oakland, California, improved the most on inclusion
during its recovery, while others, such as New Orleans, Louisiana, dropped. Similarly, some high-
performing cities rose in ranking during this recovery period (Vancouver, Washington) while others
declined (Jersey City, New Jersey).
TABLE 12
Summary of Post-2008 Recovered Cities
Place
Ranking Overall Inclusion Index Change in overall inclusion ranking, 2008–13 2008 2013
Oakland, CA 232 188 44 Denver, COa 257 217 40 Corpus Christi, TXa 114 75 39 Vancouver, WAa 60 45 15 McAllen, TXa 158 146 12 Macon, GAb 271 260 11 Columbus, OH 118 115 3 Boston, MAa 119 119 0 New Orleans, LA 246 249 -3 Jersey City, NJa 26 30 -4 Richmond, CA 110 127 -17 Average across cities 156 143 13
Ranking legend More inclusive Less inclusive
Change in ranking
Greater improvement
Greater decline
Source: Author calculations from US Census Bureau data. a The cities in this table moved from “other” to “recovered,” having been distressed in a period before 2008. b This city consolidated between 1970 and 2013.
TABLE 13
Correlation between Starting Point and Change on Overall Inclusion, 2008–13
Overall inclusion before recovery
Change in inclusion during recovery period -0.22
Source: Author calculations from US Census Bureau data.

2 2 I N C L U S I V E R E C O V E R Y I N U S C I T I E S
CITIES THAT RECOVERED BETWEEN 2008 AND 2013 TENDED TO IMPROVE MORE
ON ECONOMIC INCLUSION THAN RACIAL INCLUSION
Across the sample of post-2008 recovered cities, gains to inclusion primarily occurred through
increased economic rather than racial inclusion. The average change in inclusion was an increase of 15
rankings on economic inclusion but an increase of only 1 on racial inclusion. In fact, every city that
increased in overall inclusion ranking had a larger increase in economic inclusion than in racial inclusion.
Boston, the one city in the sample that maintained the same ranking on overall inclusion between 2008
and 2013, gained 11 rankings on economic inclusion but fell 29 rankings on racial inclusion (table 14).
TABLE 14
Change in Inclusion Ranking during the 2008–13 Recovery Period
Place Overall inclusion index Economic inclusion index Racial inclusion index
Oakland, CA 44 37 3 Denver, COa 40 33 21 Corpus Christi, TXa 39 61 21 Vancouver, WAa 15 10 9 McAllen, TXa 12 13 6 Macon, GAb 11 26 9 Columbus, OH 3 12 4 Boston, MAa 0 11 -29 New Orleans, LA -3 -2 -17 Jersey City, NJa -4 -23 -3 Richmond, CA -17 -14 -16 Average across cities 13 15 1
Change in rank Greater
improvement Greater decline
Source: Author calculations from US Census Bureau data. a The cities in this table moved from “other” to “recovered,” having been distressed in a period before 2008. b This city consolidated between 1970 and 2013.
BOX 1
Inclusive Recoveries Are Not Guaranteed
These results show that cities can improve on inclusion during an economic recovery, but it is by no
means guaranteed. Although the average change in inclusion for recovered cities in the sample during
their recoveries was positive, almost half of them lost ground on overall inclusion and more than half
lost ground on either economic or racial inclusion. In the next section, we provide lessons learned from
four cities in the sample that improved on both racial and economic inclusion during their recovery. We
hope these lessons can help other cities plan their recovery in such a way that increases inclusion in
addition to economic health.

I N C L U S I V E R E C O V E R Y I N U S C I T I E S 2 3
Part 2. Lessons Learned and
Implications for Practice In the previous section, we demonstrated that some cities improve in racial and
economic inclusion during an economic recovery while other cities decline or improve
on one but not the other. Though the data cannot fully explain these divergent paths, a
few exemplary cities—selected for case studies because they outperformed their peers
on all inclusion metrics during their economic recovery—offer insights. In this section,
we draw on these case studies as well as research literature to suggest ways in which
cities can recover from economic distress in a more inclusive manner.
The four cities that we examined as part of our case studies were Columbus, Ohio; Louisville,
Kentucky; Lowell, Massachusetts; and Midland, Texas. Each city tells a different story about what
contributes to an inclusive recovery. Each recovered during different periods between 1980 and 2013,
and, during their recovery periods, they improved on both economic and racial inclusion relative to the
other cities in the sample. Appendix C provides a fuller picture of how these improvements fit within the
city’s political, economic and cultural contexts. In this section, we elevate lessons from a combination of
conversations with local leaders, desk research, and a two-day convening in which we gathered national
and local experts from city government, community groups, philanthropy, and research (see appendix
D).
Though there is no single model for success that arose from these case studies and all of the cities
we studied have room to improve on all aspects of inclusion, they each provide valuable insights on
inclusive growth. We identify the following common elements of an inclusive recovery and important
implications for practice:
Adopt a shared vision.
Inspire and sustain bold public leadership.
Recruit partners from across sectors.
Build voice and power.
Leverage assets and intrinsic advantages.

2 4 I N C L U S I V E R E C O V E R Y I N U S C I T I E S
Think and act regionally.
Reframe racial and economic inclusion as integral to growth.
Adopt policies and programs to support inclusion.
The first three implications are common characteristics of efforts to build economic resilience and
recovery. City economies can recover without moving the dial on inclusion. Improving racial and
economic inclusion during an economic recovery requires intentional efforts to elevate the voice of
residents, policies that remove barriers and close gaps, and new narratives that bind growth and
inclusion together. Though each American city has a unique economic, social, and political context in
which policies and practices may fail or flourish, the following insights provide suggestions for
integrating principles of inclusive recovery in a variety of cities and contexts.
Adopt a Shared Vision
Creating space early on to adopt a shared vision for an inclusive recovery can drive future progress. In
many of our case study cities, leaders acknowledged the importance of having a widely accepted vision
for their city’s recovery that includes inclusion goals. Though these visions can come in many forms—
some are established via a formal plan and others arise from resident or community groups—buy-in
from multiple local actors is critical. Columbus and Lowell provide examples of the important
foundational role planning can play in driving overall inclusion, even when these plans do not contain
inclusion as an explicit goal.
In Columbus, comprehensive planning has a long history, including a citywide plan in the 1970s that
created and integrated 40 neighborhood-specific plans. This occurred in the period leading up to the
city’s economic recovery in the 1980s. By the 1980s, Columbus “saw a renewed interest in
comprehensive planning” as development decisions became too difficult to make on an ad-hoc basis
since the city had become so large (City of Columbus 1993, 2). This brought area commissions, civic
associations, and businesses together to promote land-use planning. In the mid-1980s, the city began
developing the Columbus Comprehensive Plan, the most important element of this process being a
Community Involvement Program. This program was designed to offer every segment of the Columbus
community a chance to participate in the plan’s development. A community advisory committee was
created, made up of representatives of area commissions, neighborhood business associations, civic
councils, and other interested citizens who initiated and reviewed work from a neighborhood
perspective.
I N C L U S I V E R E C O V E R Y I N U S C I T I E S 2 5
The business community in Columbus also showed a strong commitment to comprehensive
planning, which persists to this day, especially for the downtown region. According to one local expert,
the business community (with support from then mayor Michael B. Coleman) contributed to reducing
crime in the Short North area and better connecting the central business district with the economic hub
around Ohio State University.12
In Lowell, the establishment of a nonprofit economic development organization in 1980 called The
Lowell Plan helped coordinate planning efforts and create a neutral ground where public and private
leaders could speak candidly and collaborate on priority issues. The Lowell Plan convened city leaders in
business, government, education, and community development to strategize about urban revitalization
and goals for the future. Through the Plan, the City undertook feasibility studies, from which they
created community amenities, such as sports stadiums, as well as a successful marketing plan to
increase Lowell’s reputation as a destination city.13 Although the organization was not representative of
the community and the Plan did not explicitly adopt inclusion goals, it spurred small business growth,
including the creation of the Small Business Assistance Center that has supported the establishment of
over 400 immigrant- and minority-owned small businesses. The Lowell Plan still operates today and
includes a civic engagement program for residents, planning for downtown’s future, and continued
marketing campaigns.14
These examples suggest approaches that could be replicated elsewhere. In Columbus, the planning
process before and during its recovery was driven by strong collaboration with the business and civic
communities. In Lowell, the creation of an organization that created a platform for communitywide
discussion may have helped to pave the path toward racial and economic inclusion. These types of
planning processes could be taken one step further by more explicitly ensuring that those creating the
plans represent the community as a whole and that the process itself is inclusive of all community
members (Metzger 1996).
Inspire and Sustain Bold Public Leadership
Bold leadership is essential to generating and sustaining inclusive recovery strategies. Leadership can
take many forms, often sparked by committed public officials who then work in tandem with or are
succeeded by other dedicated stakeholders in the community who carry the vision forward.
In Lowell, it took the bold vision of Lowell native and then congressman Paul Tsongas to “resurrect”
the postindustrial city; he is credited with making Lowell a destination city in its own right—distinct
2 6 I N C L U S I V E R E C O V E R Y I N U S C I T I E S
from Boston—with various attractions, including a national historic park, a minor-league baseball team,
and new schools, businesses, and jobs.15 Other political leaders also helped to move racial inclusion
forward in Lowell, such as then governor Dukakis who adopted a state law that made all state agency
services available and accessible to Massachusetts’ growing refugee population. This policy, which
arose out of the leadership of Kitty Dukakis, “played an important role in the process of Cambodian
immigration to Lowell and demonstrated the influence that an individual and their actions have had in
the development and growth of a Cambodian community” (Foster 2012, 33).
Similarly, in Columbus, Maynard “Jack" Sensenbrenner served three terms as mayor from the mid-
1950s to early 1970s. Though his time preceded the city’s recovery (from 1980 to 1990),
Sensenbrenner’s administration more than doubled the size of Columbus by annexing inhabited and
uninhabited unincorporated land in surrounding Franklin County, which laid the groundwork for later
population and economic growth. In the new millennium, Mayor Coleman served a record-breaking four
terms as the first African American mayor beginning in 1999 and guided Columbus’s growth through
two national recessions. 16 He also adopted a neighborhood approach to development that has helped to
revitalize and reconnect some of the city’s poorer neighborhoods to its economic hubs.17 Mayor
Coleman’s charisma and leadership carried a vision of overall inclusion through his own term and laid
the groundwork for the work to continue.
Whether a city has a strong mayor or strong city manager may not matter for a city’s approach to
inclusive recovery. Examples of strong leadership can be found in either form of city government (Svara
and Watson 2010). The strength, quality, and vision of the leadership is more important than form.
Further, as these examples illustrate, political leadership (such as mayors or Congressional
representatives) are important in the process, but they are just one form of leadership that carries the
vision forward. Other civic leadership is often an important driver for economic growth and helps to
ensure that it is built on a foundation of inclusion (Liu 2016). Having engaged community members and
constituent organizations at the table helps to sustain the vision that overall inclusion and growth can
happen together.
Recruit Partners from across Sectors
Diverse partners are instrumental in carrying inclusion forward. Representatives from our case study
cities recognized that gains in both racial and economic inclusion were driven not only by strong public-
sector leadership but also because of active and long-term engagement with partners from across
I N C L U S I V E R E C O V E R Y I N U S C I T I E S 2 7
sectors. Partners such as resident groups, the media, civil rights organizations, and business leaders all
help to implement shared visions of inclusive growth.
In Columbus, the Columbus Partnership launched in 2002 to bring together over 60 CEOs to
strategize and work toward sustained economic growth and community development in the city. The
Partnership’s stated goals include “catalyzing civic improvement” by engaging with projects and
organizations that typically struggle with capacity and funding, such as those in the arts, culture,
education, or community development areas (Corrigan et al. 2005). During Columbus’s recovery during
the 1980s and 1990s, business leaders came together to revitalize High Street near downtown and
improve the city’s housing stock. This coalition of leaders helped lay the foundation for the
Partnership.18 Today, the Partnership collaborates with city government, anchor institutions like the
Ohio State University, and philanthropic groups on a range of projects focused on economic and racial
inclusion, including programs to improve public education and increase access to college.19
In some cities, unlikely partners like the local media are crucial for carrying a vision of inclusion
forward. In Louisville, the Courier Journal helped elevate a public debate about the city-county merger
on its editorial page and champion its potential to drive inclusive outcomes. Newspapers help shape
local policy agendas by raising certain issues to prominence, evaluating the impact of key developments,
and holding public officials and institutions accountable (Mead 1994). Media and other independent
local institutions can also help sustain public commitment to implement inclusive growth plans through
changes in political leadership.
In Louisville, civil rights and equity-oriented organizations also helped hold city leaders accountable
and guide some of the capital investments that came out of the merger to be more inclusive. The
Louisville Urban League, a civil rights organization, deployed an apprenticeship program for minorities
working on a bridge revitalization project to better physically connect the city and county.20 The
organization’s commitment to promoting minority-hiring standards continues today, and the practices it
promoted for the construction of a new arena downtown are held up as an example for the state of
Kentucky that “minority inclusion does work.”21
In Lowell, nonprofit organizations including the Cambodian Mutual Assistance Association have
been instrumental in carrying a vision of racial and economic inclusion forward. This association is
owned by the members of the Cambodian community of Lowell and works to improve the quality of life
for Cambodian Americans and other minorities and economically disadvantaged people in Lowell
through educational, cultural, economic and social programs. This group has helped to make Lowell
inclusive of its Cambodian population and give them a voice in city decisionmaking.

2 8 I N C L U S I V E R E C O V E R Y I N U S C I T I E S
The research literature reinforces the importance of cross-sector engagement in fostering inclusive
growth in cities. Single-sector approaches to addressing new and evolving urban problems are not
always successful, especially when these decisions involve only the city government, in part because of
mistrust of government actors.22 Cross-sector collaborations can result in more informed
decisionmaking and make a greater impact because they address diverse interests (Intersector Project
2016). To the extent that cross-sector partnerships incorporate residents’ voices, a vision for the city
can better reflect diverse interests and help to keep public and private actors accountable.23
Research suggests that collaboration can also unlock new resources for implementation. For
example, public-private partnerships have gained popularity to fund both public infrastructure projects
and social service programs (Corrigan et al. 2005). Particularly in cities facing fiscal austerity, public-
private partnerships can provide resources to spur economic and community development and leverage
limited public funds.24 This partnership tool can help business communities use their private capital to
facilitate work on challenges such as prekindergarten–12 education, the skills gap, entrepreneurship,
and infrastructure investments (Mills 2015). In such partnerships, adopting a shared vision for inclusion
is crucial to ensuring that development projects inspire community improvements beyond economic
growth by also investing in residents’ potential. They may be challenging to establish and sustain, but by
having multiple actors involved—government entities to prioritize goals, nonprofit and philanthropic
partners to intermediate finances and capacity, and private actors to leverage funds and build external
relationships—such partnerships achieve faster progress and greater impact for cities.
Partners such as resident groups, the media, civil rights organizations, and business leaders
all help to implement shared visions of inclusive growth.
Build Voice and Power
Building voice and power within communities that have been traditionally underrepresented and
disenfranchised drives inclusive outcomes. Inclusive growth is predicated upon building power among
historically excluded groups and disinvested communities. It is imperative for diverse stakeholders to
be brought to the table to sustain a broadly conceived vision for a city’s recovery.

I N C L U S I V E R E C O V E R Y I N U S C I T I E S 2 9
Louisville’s merger with Jefferson County illustrates how building and sustaining power for
excluded communities is essential. At the outset of the city-county merger discussions, there was a fear
that African Americans would be underrepresented in the city’s new political structures, having
previously been the majority in the city’s governing body (Wachter 2013). Pressure from the NAACP
and other civil rights organizations resulted in an agreement to redraw council district lines after the
merger. The University of Kentucky’s department of geography helped redraw council district lines
after the merger to create majority African American districts in the city and respond to concerns of
reduced African American representation (Hagan 2009). Now, the racial makeup of representatives in
the merged government closely approximates Louisville’s population—the city’s share of African
American representatives and its share of African American residents both hover around 23 percent.25
By being mindful of the risk that such a merger could pose to hard-fought wins for the African American
community in terms of representation, the architects of the merger were able to build a system that
maintained African American representation. Another effect of the merger was deepened local
accountability through an increase in the number of council districts so that councilmembers went from
representing more than 200,000 residents to between 25,000 and 30,000 residents.
In Lowell, efforts to build power and voice have focused on the integration of the city’s Cambodian
immigrant population, which is the second largest in the country. This integration effort has been led by
the Cambodian Mutual Assistance Association, which was founded in 1984 as a resettlement agency for
Cambodian refugees but now provides a broad range of services for immigrants from multiple
countries. The Association promotes civic engagement through a variety of programs, including its
citizenship preparation classes and voter registration and turnout drives.26 Even with these efforts to
improve civil engagement among immigrants in the city, Lowell’s political leadership remains mostly
white and does not reflect the city’s diversity. All council members in Lowell are elected at large, which
dilutes the voting power of wards with high shares of immigrants and people of color. But efforts by the
Association and others are heartening: Rady Mom was elected to the state legislature in 2014 and was
the first Cambodian-American to serve in such a role anywhere in the country.27
Scholars who argue that building voice and power across communities of color and immigrants is
essential for sustaining economic growth substantiate the need to build voice and power within
communities as an important element of racial inclusion (PolicyLink and Marguerite Foundation 2016).
When there is an imbalance in power between native-born white residents and immigrants, the agency
of immigrants is constrained in both political and economic spheres (Hochschild et al. 2013). The
disenfranchisement of immigrants can limit the economic success of cities. But creating a welcoming
environment for immigrants can stem population decline in cities with stagnant or declining economies,

3 0 I N C L U S I V E R E C O V E R Y I N U S C I T I E S
help revitalize distressed neighborhoods, and support innovation, as Cambodians in Lowell and Somalis
in Columbus demonstrate (Ruther, Tesfai, and Madden 2016; Tobocman 2014). Immigrants are also
crucial for labor market participation and are linked to future economic growth,28 suggesting that
forward-looking cities, as illustrated in Lowell, would be wise to attract immigrants and to actively
engage with them as community members.
Likewise, ensuring that communities of color are represented in planning and political processes is
crucial for the future success of cities. An important goal for cities is “descriptive representation,” or
ensuring that city leadership aligns with the demographics of the residents. As seen through the
cautionary tale of Ferguson, Missouri, where primarily white leadership held power over a majority
African American town, having fair representation helps with political engagement and ensures that the
government best understands the needs of the community to address social issues in a more
collaborative rather than contentious way (Shanton 2014).
Leverage Assets and Intrinsic Advantages
Each city has something distinct to offer; taking stock of existing community assets and leveraging
them can support an inclusive recovery. Cities often possess unique attributes that can drive inclusive
growth. These assets might be physical, such as a city’s environmental endowments or features of the
built environment, or they may be tied to the people who live there and their untapped human capital
potential.
For Lowell, this meant redeploying the run-down textile mills, which were abandoned in the first
half of the 20th century, for the community’s benefit.29 Instead of tearing down these historic buildings,
the city chose to invest in establishing a National Historic Park combined with residential units, office
space, and a pedestrian path to the Lowell Riverwalk.30 These amenities helped Lowell become a
regional tourism destination, and the mixed-use complexes, including arts space, also served residents’
needs. Lowell’s other resource, the Merrimack River, has also been used to support an inclusive
recovery: the city’s significant southeast Asian immigrant population hosts a festival on the river
annually to celebrate Lowell’s water resources. This festival is now in its 20th year and draws over
60,000 visitors from around the country to Lowell, thus bolstering its economic growth via tourism
while celebrating the rich cultures of its many immigrants.31
Midland’s natural endowment—its location on the Permian Basin, which produces more barrels of
oil than any other petroleum-producing basin in the country32—has reinvigorated its economy and
I N C L U S I V E R E C O V E R Y I N U S C I T I E S 3 1
created high-paying jobs for low-skilled workers and healthy tax revenues. Midland leaders have taken
some steps toward further leveraging this natural endowment to promote overall inclusion by investing
in education to attract long-term residents and address its human capital shortage.33 To do so, local
foundations came together to leverage their collective resources to establish a free tuition program for
students graduating from the Midland Independent School District to attend University of Texas of the
Permian Basin or Midland College. Called the Midland Legacy Scholarship, the tuition fund reinvests
boom-time bounties to ensuring that more of Midland’s high school graduates attend college.34
However, an important next step for Midland and other communities with tremendous stores of natural
resources is to consider additional ways to reinvest these assets into future value for the community
and next generation of residents (Barbier 2002). This would help to ensure stability for the city’s future
inclusion when oil extraction winds down. The Eagle Ford shale area, which is 400 miles to the east of
the Permian Basin, is a cautionary tale of the boom-to-bust cycle of oil extraction. Oil and natural gas is
incredibly volatile, and when it disappears or becomes too costly to extract, the residents who remain
face a challenging economy and livelihood with few other opportunities left behind.35
The academic literature underscores the importance of communities leveraging existing assets to
build a sustainable economic future (Liu 2016).36 In some communities, existing assets may take the
form of infrastructure and location, the diversity and drive of the residents, or the natural resources or
environment upon which it sits. Lowell has demonstrated its appreciation of both its infrastructure and
population as an asset for economic development. For example, the creative placemaking literature
documents the connections between fostering an arts and cultural cluster, as Lowell did in its former
mills, with improvements in quality of life and economic development achieved by attracting tourists, a
strong workforce, and businesses (Dwyer and Beavers 2011; Markusen and Gadwa 2010). Research
supports Lowell’s view of their immigrant communities as an asset for economic growth. High numbers
of foreign-born residents in a city are associated with greater productivity for US born residents in
those communities (Ottaviano and Peri 2006).
Ensuring that communities of color are represented in planning and political processes is
crucial for the future success of cities
Anchor institutions, such as the University of Massachusetts-Lowell and Ohio State University, are
important employers for the community as well as natural partners for city leadership to carry out
3 2 I N C L U S I V E R E C O V E R Y I N U S C I T I E S
community and economic development visions (Kleiman et al. 2015). However, anchor institutions can
also cause the displacement of residents if anchor-based development does not have sufficient
community involvement (Silverman, Lewis, and Patterson 2014). A few of our case study cities have
strong anchor institutions that played a role in the planning and development processes in these cities.
But many other cities with anchor institutions did not see commensurate gains in inclusion. This
suggests that it is not just the existence of an anchor that is important, but the level with which that
anchor involves the wider community in decisionmaking.
Think and Act Regionally
Cities can forge connections to the surrounding regions to secure broadly shared prosperity. Cities’
prosperity and overall inclusion are often linked to the areas around them. Job and housing markets spill
across jurisdictional lines and residents often live, work, and access services outside their city. For
people of color, the experience of fragmented and isolated governments is made significantly worse by
persisting segregation and issues of affordability; in such circumstances, excessive commute times, food
deserts, and poor schools are common (Sadler and Highsmith 2016).37 Fragmented regions, with
multiple governments working in isolation, can slow economic growth, lead to fiscal disparities, and
impede service delivery (OECD 2015; Silverman, Lewis, and Patterson 2014). Though regional action is
not an easy proposition, it is an important component of inclusive recovery in cities. For the case study
cities, regional partnerships, formal or informal, were critical for success. These partnerships involved
deliberate and concerted efforts to strengthen the city’s role in the region across a range of issues,
including economic development, political representation, and education.
Louisville’s merger in 2003 is a prime example of formal regional action and successfully heightened
the city’s position within the region (Brookings Institution Center on Urban and Metropolitan Policy
2002).38 The merger catapulted Louisville from the 65th to 23rd largest city in the nation, which
increased the city’s stature in the state (Foster 2001). The merger supported economic growth too, as
the city and county could present a united front in courting franchises and other business headquarters.
Louisville also used their merger as an opportunity to support regional inclusion through capital
investments that connect neighborhoods across the region and create jobs for residents. For example,
an overhaul of the bridge connecting Jefferson County to East Louisville utilized minority-hiring
standards and apprenticeship programs.39
Lowell’s proximity to the greater Boston metro region offers an example of informal regional
thinking that can yield positive economic outcomes. This proximity promoted a connection to the strong
I N C L U S I V E R E C O V E R Y I N U S C I T I E S 3 3
labor market of the Boston area while allowing the city to develop its own identity. Lowell’s identity as a
city with “strong civic infrastructure” was cited as a key factor that drew regional investment there and
continues to be important today. For example, Lowell was recently awarded a significant grant from the
Federal Reserve Bank of Boston designed to promote cross-sector collaboration to tackle
multigenerational poverty in one of its poorest neighborhoods.40 Additionally, because of their
proximity to Boston, Lowell residents benefit from many employment opportunities in the tech and
health sectors. Consequently, the city has focused on building out transportation options between
Lowell and Boston to strengthen these connections and foster opportunities for its residents.41
In the end, there is no right way to build a regional vision or collective consensus and governance.
Context matters. Whether and how a city pursues a formal or informal approach to working regionally
will depend on a variety of political, economic, and cultural factors (Pain 2008). Regardless of approach,
sustained discourse and planning around a host of social issues and policy concerns that benefit the
collective rather than the needs of a few can contribute to enhanced economic growth for all in that
region (Benner and Pastor 2015).
Reframe Inclusion as Integral to Growth
When cities embrace principles of economic and racial inclusion as part of their growth strategies,
progress in both areas is heightened. Economic recovery and inclusion, both economically and racially,
do not have to operate in separate realms. Framing inclusion as part and parcel with growth prioritizes
investments that serve both and create more impact.
Two examples illustrate this reframing nicely. Lowell’s Southeast Asian Water Festival, staged by a
collaboration of various Southeast Asian immigrants residing in the city bolsters the civic pride of
immigrants and residents. It also spurs economic activity by attracting tourists to the area, further
underscoring the external value of immigrant cultures. Louisville has found that its historic efforts to
desegregate the public schools and maintain diversity have also been positive for its recovery.42 By
maintaining diverse schools, Louisville has been able to maintain its tax base, as residents are not
hollowing out the city by relocating for schools. At the same time, the policy helps to better integrate
residents socially. Such social cohesion has positive effects on crime alleviation that in turn creates a
better business environment (Hirschfield and Bowers 1997).
Research shows that the economic future of cities rests squarely on the quality of its human capital
and increasing workers’ productivity (Berry and Glaeser 2005). Recent research demonstrates negative
3 4 I N C L U S I V E R E C O V E R Y I N U S C I T I E S
links between structural economic and racial isolation and regional economic mobility (Chetty et al.
2014; Sharkey 2013). Some have even argued that diversity of population and an area’s acceptance and
tolerance of others is a catalyzing factor that drives economic development and growth.43 For example,
a recent Urban Institute study region found that if Chicago could reduce its level of economic
segregation to the average level of the 100 largest commuting zones, African American per capita
incomes would increase 12.4 percent, educational attainment rates for both African American and
white residents would increase 2 percent each, and the city’s homicide rate would drop 30 percent (Acs
et al. 2017).
Adopt Policies and Programs that Support Inclusion
Deliberately crafting policies and programs that promote racial and economic inclusion contributes
to long-term progress. The literature suggests several ways in which policies and programs can be
building blocks for inclusion. Through our case studies, we explore how the following four general
areas—education, housing, economic development, and fiscal policy—can lay a potential policy
foundation for inclusive recovery.
Education Policy
Louisville has made tremendous strides in school integration since 1975, when the US Supreme Court
ordered the city’s school district to integrate schools, initially through busing. The battle has been long
and hard fought but has led to important progress. Today, the school district is one of the most
integrated in the nation and the educational achievement gap between whites and people of color is
among the lowest in our sample of cities.44 The city’s longstanding commitment to school integration
has also strengthened social capital in the city and has contributed to collaboration across racial and
ethnic groups in other realms like economic development.45 More recently, local foundations in
Louisville came together to launch “55,000 Degrees,” a college attainment program aimed at adding
40,000 bachelor’s degrees and 15,000 associate’s degrees to its labor pool by 2020 in an effort to
increase regional economic and labor force competitiveness.
Midland also offers a college attainment program in which any student graduating from Midland
Independent School District receives free tuition at Midland College and at UT Permian Basin.46 This
ambitious effort is supported by the city’s foundations, which reinvest money from the city’s oil boom
toward the area’s human capital development. Although not specific to Midland, the Texas Permanent

I N C L U S I V E R E C O V E R Y I N U S C I T I E S 3 5
Fund is also another example of a program that can promote inclusion across all students. The Texas
Permanent Fund is a trust started in 1854 that preserves a share of the proceeds of natural resource
extraction and land usage in an endowment for the benefit of the state’s public schools.47
Though state and federal policies can set many of the educational standards that local areas follow,
cities have strategies and policy levers that they can pull to help reinvest and level the playing field.
Strategies that cities can employ to close the education achievement gaps include preparing teachers
for increasingly diverse classrooms, increasing the share of teachers of color, boosting funding and
directing it to poorer students, and focusing immediately on closing the reading achievement gap
(Gallagher and Chingos 2017). Most cities’ public-school budgets remain strongly tied to state and
federal funds and revenue from local property taxes (Leachman et al. 2016). But, creative solutions, like
public-private partnerships, can generate funds to provide services to the benefit of disadvantaged
students in schools that lack generous funding streams.48
Housing Policy
The availability of affordable, high-quality, and well-located housing is a crucial factor in fostering
inclusive communities. Both Columbus and Midland continue to face rising housing costs as their
recoveries progress, and both have called on community groups to help solve this problem. These
groups include nonprofit cross-sector collaborations and affordable housing providers in both cities.
The Columbus-area group Move to PROSPER, a collaboration between The Ohio State University and
community partners, provides rental relocation opportunities for low-income families with children to
move to high-opportunity neighborhoods.49 Rebuilding Together brings community volunteers in
Midland together to fix the homes of low-income residents who cannot afford the improvements on
their own.50 In Midland, the volatility of the oil market makes both the price and availability of housing
especially erratic (Office of Policy Development and Research 2015), so insulating their lowest-income
residents from these fluctuations is especially important through either local programs or state and
federal assistance.51
Other cities experiencing economic recovery in more recent years have experimented with
innovative models to preserve affordable housing while land is still relatively cheap. For example, many
cities have adopted Community Land Trusts (CLTs) to ensure permanent affordability of housing units,
especially when market conditions begin to change and displacement of long-term residents is a
concern. Though none of our case studies currently have CLTs, adjacent cities in all four states are
experimenting with this model, which could be applied to low-income, yet rapidly gentrifying

3 6 I N C L U S I V E R E C O V E R Y I N U S C I T I E S
neighborhoods to preserve permanent affordability for low-to-middle income residents who can find
themselves priced out of the real estate market. Though CLTs are but one tool in the housing policy
toolbox to ensure affordability, they offer an example of how cities could promote programs and
policies to ensure they remain inclusive.
The availability of affordable, high-quality, and well-located housing is a crucial factor in
fostering inclusive communities.
Economic Development Policy
In some cities, economic development policies are developed in conjunction with inclusionary practices
addressing racial and economic disparities, and, in other cities, renewed economic success for some
underscores that not all residents were full participants in the recovery. Lowell is an example of how
economic development policies and inclusion may be woven together. Lowell understood that the
Cambodian immigrants who settled there in the 1980s offered considerable economic potential to the
city and invested in the community, including English as a Second Language training and funding and
technical capacity assistance for nonprofits. Recognizing the importance of tourism as an economic
booster, the city supported the community’s development of the Southeast Asian Water Festival in
1997, which now draws tens of thousands of tourists every year.52 Efforts for inclusion of the
Cambodian immigrant population into economic development planning continue today. Recently, the
city, prompted by the Cambodian community, invested in creating a “Little Cambodia” district as a place
where small businesses can flourish and food tourism is a draw.53 There are lessons in valuing
immigrants’ unique perspectives and contributions for other communities who are seeking to boost
their economies to create welcoming policies and programs.54
Louisville’s economic development policies evolved from a more singular focus on renewing the
economy to incorporating more explicit racial equity and inclusion policies. Louisville transformed itself
into a high-performing city through dedicated economic development efforts in the 1980s and 1990s.
These efforts started to meet the needs of existing corporations (e.g., GE and UPS), and developed to
expand its manufacturing and innovation base and draw new business (like Yum! Foods). Later, efforts
included incubating small businesses and entrepreneurs and growing the human capital skills of the
city’s and region’s labor force. Though the push for greater economic equity for the city’s African
I N C L U S I V E R E C O V E R Y I N U S C I T I E S 3 7
American residents has always existed, the momentum of recent economic development efforts helped.
For example, when UPS invested heavily and redeveloped its WorldPort in Louisville in the late 1990s
and early 2000s, a share of contracts were reserved for African American businesses. Recent efforts to
boost human capital skills in Louisville, notably through college degree attainment through the 55,000
Degrees initiative, have an explicit target of 15,000 African American residents receiving a college
degree by 2020 to improve labor market outcomes.55 This meets a larger economic development goal of
a highly educated workforce that can draw new industry and incubate new business, something that will
likely be a key factor among cities that thrive in the coming decades (Berube and Holmes 2016; Dirks,
Gurdgiev and Keeling 2010).
Fiscal Policy
Smart fiscal policies can be an important lever in promoting an inclusive recovery. In Columbus, one of
the most powerful fiscal policy levers for inclusive recovery has been the use of the Community
Redevelopment Area (CRA) program and associated tax incentives. In the 1970s and 1980s,
redevelopment of the Short North neighborhood was sparked by individual investors. Developer
Sanborn Wood was credited for seeing potential in the neighborhood decades ago and using federal
historic rehabilitation tax credits to purchase and rehabilitate properties, which, in conjunction with
artists moving there, began to draw people to the area.56 From the 1990s to the present, the city
capitalized on Ohio’s CRA program and started designating various neighborhoods, including the Short
North, as eligible for multiyear property tax incentives to residents and businesses in exchange for
investments and rehabilitation (Kenyon et al. 2017). Through this form of fiscal policy—tax incentives
for reinvestment in distressed neighborhoods—the momentum of early investors in various downtown
neighborhoods has become institutionalized through CRA incentives. In fact, the Short North
neighborhood has become so successful that some now suggest that the CRA and associated tax
abatements only benefit wealthier residents and developers, to the detriment of inclusion.57 The CRA
continues to be an important fiscal policy lever to revitalize other historically disinvested
neighborhoods, even if it is no longer needed in the Short North.
Another strategy in Columbus was the utilization of water and sewer lines to annex adjacent
outlying communities. By combining a freeze on service extensions so that unincorporated areas had to
petition the city for annexation with offering service contracts to municipalities in surrounding Franklin
County, Columbus doubled its land area in only a few years (Benner and Pastor 2012). The city also
included growth corridors in these annexation deals so that the central city could expand, which kept

3 8 I N C L U S I V E R E C O V E R Y I N U S C I T I E S
more jobs in the city. Its annexation policy allowed the city to combat white flight out of the city to
exclusive suburbs and preserve tax revenues from those upper- and middle-income families.
In Louisville, fiscal policy was a driving motivation for the merger of the city with Jefferson County
(Wachter 2013). In the decade following the merger, government expenditures declined slightly and
stabilized over time because of fewer government employees and streamlined departments.
Furthermore, in keeping with their promise during the campaign for the merger that neither city nor
county residents would face tax hikes once the government was consolidated, property tax rates
declined for residents overall (Wachter 2013). The merger also contained government costs during an
era where other cities have increased expenditures and have raised revenue through increased fees for
services (McFarland and Pagano 2017). By changing the population size and composition through the
merger, Louisville also indirectly changed its fiscal base. Its new fiscal base draws upon residents that
have comparatively more resources and thus enables the city to leverage more or the same amount of
revenue while keeping the tax rates in check. This is important for more disadvantaged residents who
tend to use more city services and may otherwise be burdened when cities increase taxes and fees to
cover services. Achieving an equitable balance is a fundamental issue for cities’ fiscal soundness
because they also need to keep their more advantaged residents.58 Thus, an indirect benefit of the
merger for Louisville’s fiscal policy is that it changed the demographics of its tax base and inadvertently
created more equilibrium between the demand for city services and the revenue generated from
residents.
I N C L U S I V E R E C O V E R Y I N U S C I T I E S 3 9
Conclusion To shed light on what it takes to recover from economic distress in more inclusive ways,
this research identifies cities that diverged from their peers and harnessed their
economic recovery to support more broadly shared prosperity. During this period, few
cities demonstrated strong intentions to build more inclusive economies, and yet we
find that more than half of the cities that experienced an economic recovery made
measurable progress on inclusion. Today, there is much more national and local interest
in blending economic growth with economic and racial inclusion goals. Shared
prosperity and inclusive economic development are elevated as goals in mayoral races
but also within the business community at the local and regional levels.
This research provides a long view of what it takes to move the dial on racial and economic
inclusion. The lessons learned validate the importance of building voice and power into economic
recovery efforts, allocating resources more fairly, and designing policies that remove structural barriers
to opportunity. Today there are new tools to support cities that have elevated inclusion as a goal and
new networks of city leaders that are advancing these practices and policies. Yet more needs to be done
to understand the impact of new practices, policies, and approaches to supporting inclusive growth and
recovery in cities across the country.
This research challenges assumptions about which cities have been building more inclusive
recoveries. Wolman, Hill, and Furdell (2004) illustrate that cities can influence the perceptions of their
economic recoveries through media and other strategies, but “rhetoric does not often meet reality”
when the data are analyzed. Representatives from our case study cities were surprised that they had
made progress on racial and economic inclusion relative to their peers. It was not necessarily the story
that they had been telling about their individual cities. This observation underscores the importance of
monitoring inclusion measures as policies and processes of growth are adopted. Evidence suggests that
monitoring data and indicators on a real-time basis can help to improve city outcomes (Allwinkle and
Cruickshank 2011; Hancke, de Carvalho e Silva, and Hancke Jr. 2013; Townsend 2013). Measures that
are made public allow for public oversight and accountability.59 Selecting inclusion metrics to monitor
over time would help city leaders and their partners understand inclusion goals and keep them in mind
as priorities shift. And, these inclusion metrics should be selected in collaboration with the community.
An inclusive process of choosing inclusion metrics ensures that they are measuring the correct
outcomes and that community members feel ownership over their success.

4 0 I N C L U S I V E R E C O V E R Y I N U S C I T I E S
The lessons learned validate the importance of building voice and power into economic
recovery efforts, allocating resources more fairly, and designing policies that remove
structural barriers to opportunity.
Looking ahead, cities that integrate ways to monitor the impact of their economic and racial
inclusion efforts will accelerate their progress and contribute to a broader field of urban practice. As
this research illustrates, not all cities have made intentional progress, and, for some cities, economic
conditions changed and prosperity was more widely shared. However, sustaining this progress toward
more shared prosperity requires intentional effort, transparency, and policies.
A P P E N D I X A 4 1
Appendix A. Indicator Calculations
and Selection In this appendix, we detail our indicator calculations and selection and discuss the literature on which
these selections were made. Table A.1 displays each indicator, its definition, calculation, what it is
designed to measure, examples of its use in previous literature, and how to interpret it. We then go
through each index and describe each measure and why it was selected. Except racial segregation, all of
the indices are calculated using data from the US Census Bureau’s 1980 Decennial Census, 1990
Decennial Census, 2000 Decennial Census, 2006–10 American Community Survey, and 2011–15
American Community Survey. These data were obtained through the online portal NHGIS (IPUMS
NHGIS, University of Minnesota, www.nhgis.org).
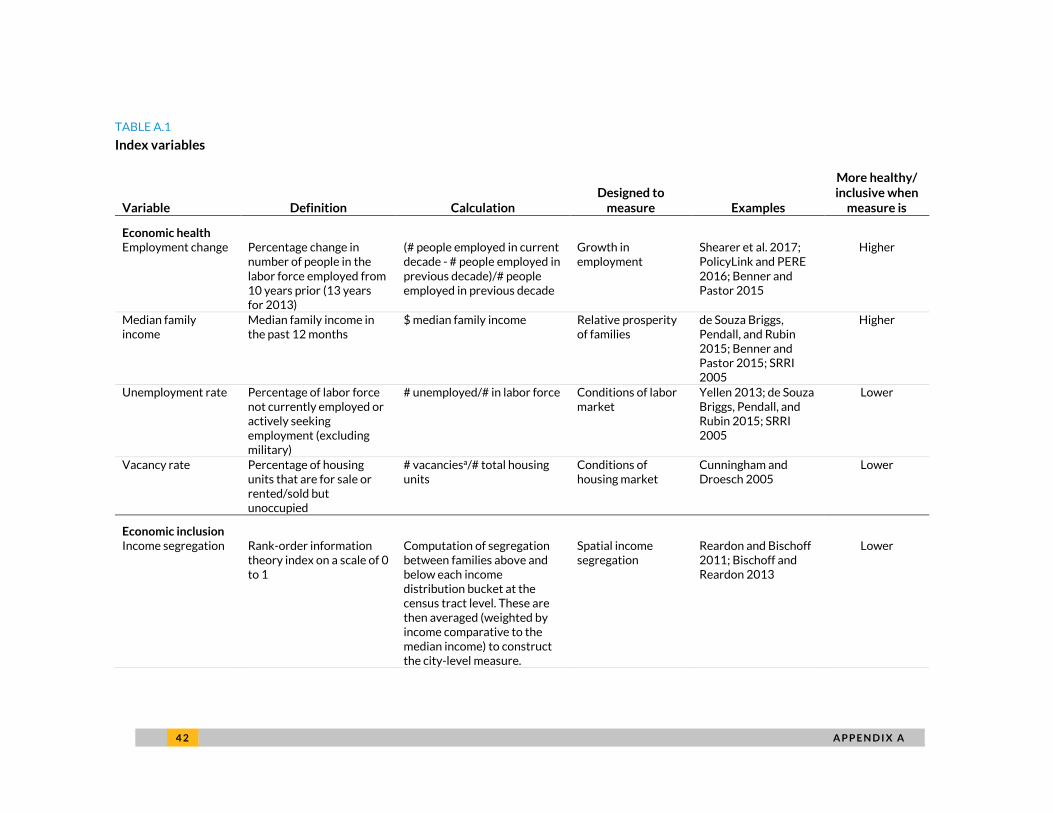
4 2 A P P E N D I X A
TABLE A.1
Index variables
Variable Definition Calculation Designed to
measure Examples
More healthy/ inclusive when
measure is
Economic health Employment change Percentage change in
number of people in the labor force employed from 10 years prior (13 years for 2013)
(# people employed in current decade - # people employed in previous decade)/# people employed in previous decade
Growth in employment
Shearer et al. 2017; PolicyLink and PERE 2016; Benner and Pastor 2015
Higher
Median family income
Median family income in the past 12 months
$ median family income Relative prosperity of families
de Souza Briggs, Pendall, and Rubin 2015; Benner and Pastor 2015; SRRI 2005
Higher
Unemployment rate Percentage of labor force not currently employed or actively seeking employment (excluding military)
# unemployed/# in labor force Conditions of labor market
Yellen 2013; de Souza Briggs, Pendall, and Rubin 2015; SRRI 2005
Lower
Vacancy rate Percentage of housing units that are for sale or rented/sold but unoccupied
# vacanciesa/# total housing units
Conditions of housing market
Cunningham and Droesch 2005
Lower
Economic inclusion Income segregation Rank-order information
theory index on a scale of 0 to 1
Computation of segregation between families above and below each income distribution bucket at the census tract level. These are then averaged (weighted by income comparative to the median income) to construct the city-level measure.
Spatial income segregation
Reardon and Bischoff 2011; Bischoff and Reardon 2013
Lower
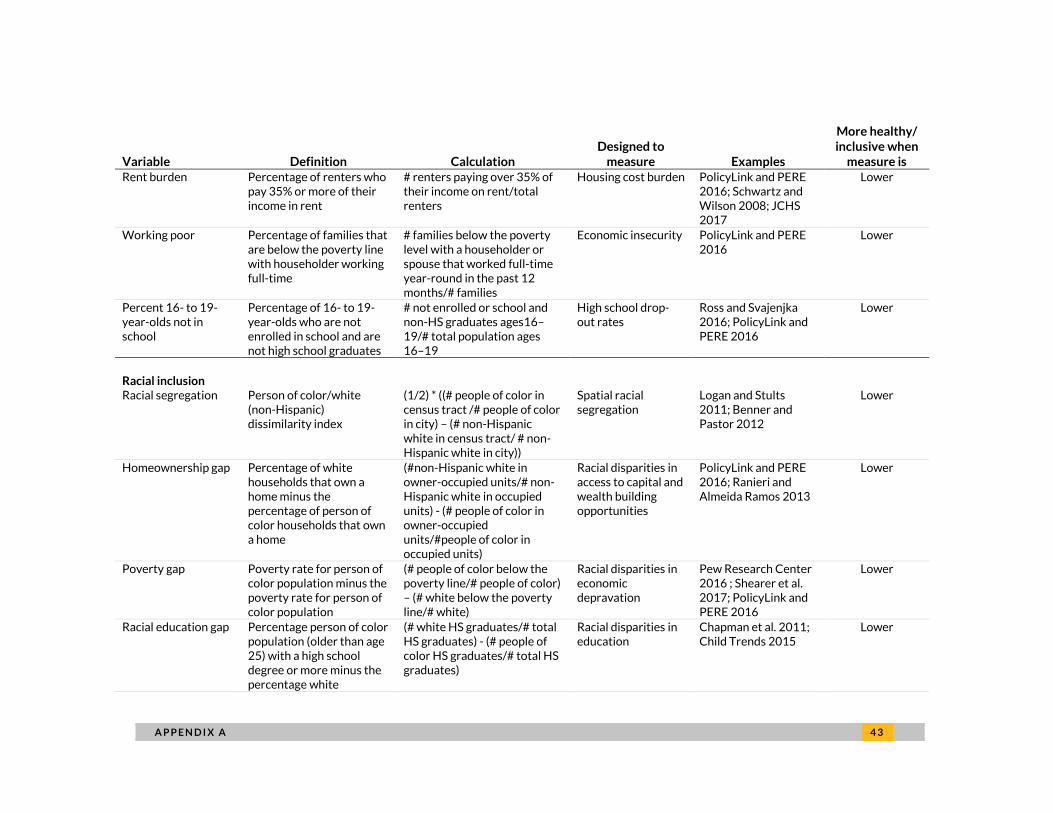
A P P E N D I X A 4 3
Variable Definition Calculation Designed to
measure Examples
More healthy/ inclusive when
measure is Rent burden Percentage of renters who
pay 35% or more of their income in rent
# renters paying over 35% of their income on rent/total renters
Housing cost burden PolicyLink and PERE 2016; Schwartz and Wilson 2008; JCHS 2017
Lower
Working poor Percentage of families that are below the poverty line with householder working full-time
# families below the poverty level with a householder or spouse that worked full-time year-round in the past 12 months/# families
Economic insecurity PolicyLink and PERE 2016
Lower
Percent 16- to 19-year-olds not in school
Percentage of 16- to 19-year-olds who are not enrolled in school and are not high school graduates
# not enrolled or school and non-HS graduates ages16–19/# total population ages 16–19
High school drop-out rates
Ross and Svajenjka 2016; PolicyLink and PERE 2016
Lower
Racial inclusion
Racial segregation Person of color/white (non-Hispanic) dissimilarity index
(1/2) * ((# people of color in census tract /# people of color in city) – (# non-Hispanic white in census tract/ # non-Hispanic white in city))
Spatial racial segregation
Logan and Stults 2011; Benner and Pastor 2012
Lower
Homeownership gap Percentage of white households that own a home minus the percentage of person of color households that own a home
(#non-Hispanic white in owner-occupied units/# non-Hispanic white in occupied units) - (# people of color in owner-occupied units/#people of color in occupied units)
Racial disparities in access to capital and wealth building opportunities
PolicyLink and PERE 2016; Ranieri and Almeida Ramos 2013
Lower
Poverty gap Poverty rate for person of color population minus the poverty rate for person of color population
(# people of color below the poverty line/# people of color) – (# white below the poverty line/# white)
Racial disparities in economic depravation
Pew Research Center 2016 ; Shearer et al. 2017; PolicyLink and PERE 2016
Lower
Racial education gap Percentage person of color population (older than age 25) with a high school degree or more minus the percentage white
(# white HS graduates/# total HS graduates) - (# people of color HS graduates/# total HS graduates)
Racial disparities in education
Chapman et al. 2011; Child Trends 2015
Lower
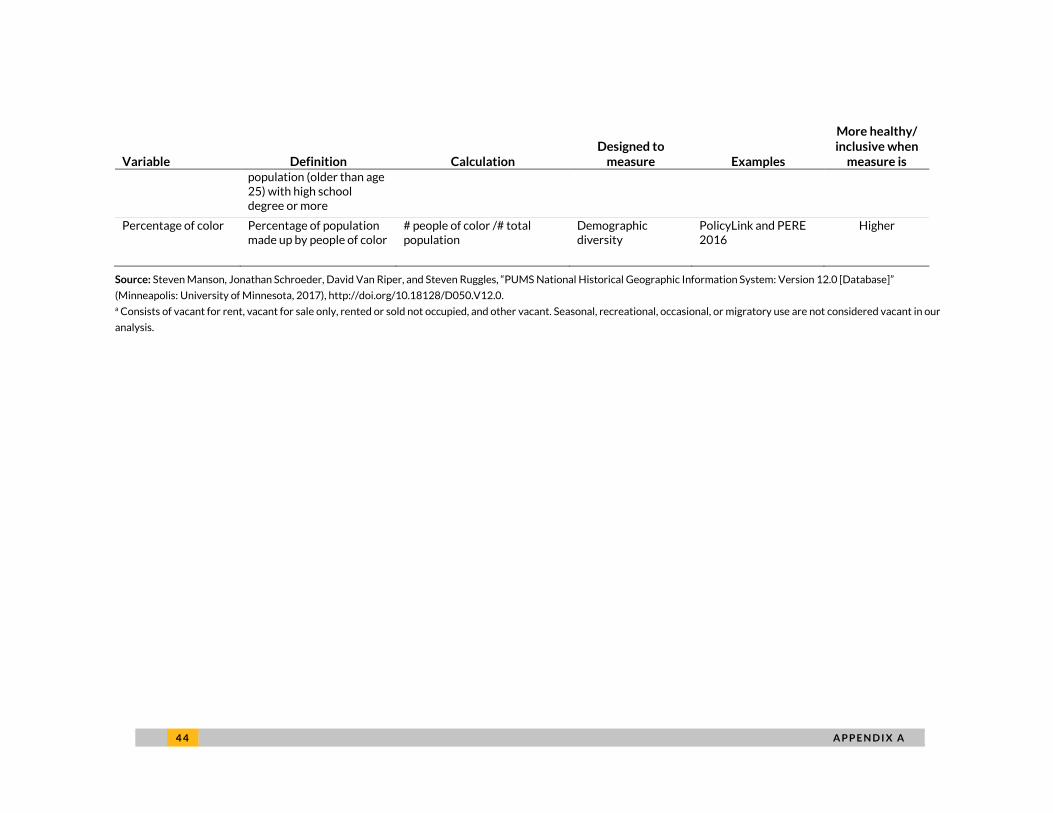
4 4 A P P E N D I X A
Variable Definition Calculation Designed to
measure Examples
More healthy/ inclusive when
measure is population (older than age 25) with high school degree or more
Percentage of color Percentage of population made up by people of color
# people of color /# total population
Demographic diversity
PolicyLink and PERE 2016
Higher
Source: Steven Manson, Jonathan Schroeder, David Van Riper, and Steven Ruggles, “PUMS National Historical Geographic Information System: Version 12.0 [Database]”
(Minneapolis: University of Minnesota, 2017), http://doi.org/10.18128/D050.V12.0. a Consists of vacant for rent, vacant for sale only, rented or sold not occupied, and other vacant. Seasonal, recreational, occasional, or migratory use are not considered vacant in our
analysis.
A P P E N D I X A 4 5
Economic Health
The research literature tends to converge on a limited set of indicators to measure economic health in
cities that focus on employment (labor force participation rate [OECD 2016]), unemployment rate
(PolicyLink and PERE 2016), change in the number of jobs; income or wages (aggregate [PolicyLink and
PERE 2016], per capita [PolicyLink and PERE 2016] or median [PolicyLink and PERE 2016]); or
productivity (gross metropolitan product [Shearer et al. 2017], aggregate or per capita).60 Some
studies—particularly ones focusing on a specific region—also include customized indicators that use
locally available data to measure the quality of the business environment, such as the number of loans
to small businesses or number of new businesses opening per quarter (de Souza Briggs, Pendall, and
Rubin 2015), and innovation, such as venture capital investments or patents issued per capita (Benner
and Pastor 2016a).
Because of availability and applicability across geographies, we chose not to incorporate these
more bespoke indicators. To avoid issues of endogeneity, we also selected inclusion-neutral inputs to
growth; that is, we aimed to separate measures of inclusion as much as possible from pure growth
measures.
Change in employment over time is a standard measure for job growth in a specified area. Benner
and Pastor (2015) use change in employment as a defining economic indicator to show the existence of
regional economic differences and as a component of their growth index. Shearer et al. (2017) also
include change in employment within their index monitoring economic growth. PolicyLink’s and PERE’s
National Equity Atlas (2016 tracks job growth over time, as well.
We use median family income as an indication of families’ relative prosperity within each city.
Benner and Pastor (2015) also utilized median household income as their static economic well-being
metric. Sacramento Regional Research Institute (2005) similarly included median household income in
their analysis of prosperity within Sacramento.
We elected to use family rather than household income (here, as with our income segregation
measure) as the family is, generally speaking, the typical economic unit. Whereas family financial
decisions are made jointly and level of income can better gauge their economic outlook, households
group individuals to a greater extent who do not share joint finances.
Finally, our last measure of economic health is unemployment rate. A highly salient metric, Federal
Reserve Chairwoman Janet Yellen (2013) has cited unemployment rate as the “best single indicator of
4 6 A P P E N D I X A
labor market conditions.” Unemployment is widely addressed in analyses throughout the literature
measuring economic growth (de Souza Briggs, Pendall, and Rubin 2015; SRRI 2005; PolicyLink and
PERE 2016).
We included vacancy rate to capture local housing market conditions. Vacancy rate is used rather
than monthly rent or home sales value as it tends to be the first input to shift in a changing market.61 A
low vacancy rate corresponds to a housing market in high demand. Vacancy rate can also signal
desirability of a location (Cunningham and Droesch 2005).62
Economic Inclusion
The research literature reveals greater divergence on how to measure economic inclusion than
economic health. Because definitions of inclusive economies generally correspond to a specific
conceptual orientation to the work, indicators chosen to measure economic inclusion vary widely.
Earlier studies can be roughly divided into those that focus on fairness and inclusivity in inputs and
those that focus on inclusive outcomes. Because of data limitations, we were not able to focus on inputs
to inclusivity, such as political participation (Benner and Pastor 2016a) and access to health care
(Lawson et al. 2017) and instead focus on outcomes.
In terms of outcomes, earlier definitions emphasize labor market participation and growth
(Spaulding and Johnson 2016)63 instead of economic security and the strength of safety nets.64 In our
effort to separate dimensions of economic health from inclusion, for the former we opted, to the extent
possible, for indicators that track economic growth in local economies.
We do not include poverty rates or income inequality in the economic inclusion index. We exclude
measures such as the percentage of the population in poverty in this index, since a lower poverty rate
may indicate that lower-income residents are being displaced from the city rather than included in its
recovery. To the extent possible, we aim to avoid the scenario in which a city’s index score improves by
displacing low-income and other marginalized populations in our analysis.
Although many point to income inequality as a measure of inclusion, we do not include common
measures of income inequality like the Gini index in our index because a city can be inclusive while
having higher income inequality and vice versa. For example, one city may have low income inequality
because its residents are all relatively poor while having low levels of inclusion because the city is failing
to deliver adequate services or connect residents to jobs. Another city may have high income inequality
A P P E N D I X A 4 7
even though its lower-income residents are able to benefit from economic growth, access needed
services, and achieve upward mobility over time (Stacy, Srini, and Meixell, forthcoming).
In sum, the economic inclusion index prioritizes outcomes and attempts to capture general
economic inclusion without benefiting cities that displace or otherwise disadvantage lower-income
residents. In compiling our economic and racial inclusion indices, we sought to examine parallel aspects
of inclusion across each. With both a racial and economic lens, we addressed spatial segregation,
housing, educational attainment, and poverty in our inclusive analysis.
Our economic inclusion index was constructed to analyze the extent to which a city’s economic
output benefitted all its residents, across the income distribution. Toward this goal, we included four
measures: income segregation, percentage rent-burdened population, percent 16- to 19-year-olds not
in school, and percentage of working poor.
We chose to measure income segregation via the rank-order information theory index developed
by Reardon and Bischoff (2011). This specific metric compares variations in family incomes across
census tracts within each city to determine the extent to which that city is segregated by income. Such
an approach considers segregation at every level of income distribution and easily allows for geographic
and temporal comparison.
Rent burden is a common measure for housing affordability (JCHS 2017; Schwartz and Wilson
2008).65 Though studies differ on the percentage of income above which to consider a household rent
burdened, we selected 35 percent because of data constraints. An often-cited alternative cutoff is 30
percent; but 35 percent was the 1980 decennial census’ lowest cutoff and is what we use here.
Working poor, a measure also reported in the National Equity Atlas (PolicyLink and PERE 2016) is a
metric used to capture economic insecurity and poor job quality (Bane and Ellwood 1991; Levitan,
Gallo, and Shapiro 1993; Wicks-Lim 2012). Working poor is our preferred metric rather than poverty
rate, which many studies use (Benner and Pastor 2015; de Souza Briggs, et al. 2015; Shearer et al.
2017). Especially at the city level, an emphasis on poverty rates could falsely reward municipalities that
undertake policies which push their poor residents into suburban jurisdictions. By focusing instead on
percent working poor within each city, we instead consider the level to which low-income families can
achieve a base level of quality of life.
In our analysis, the percentage 16- to 19-year-olds not in school and not graduated from high school
is a proxy for high school dropout rate. This measure is meant to capture city-level service provision (i.e.,
whether the city is delivering high-quality education to all of its residents at the school level rather than
4 8 A P P E N D I X A
student level). School-level factors, moreover, have been found to have the greatest impact on dropout
rates (Goldschmidt and Wang 1999). This is similar to measures of disconnected youth used in other
studies (Ross and Svajenjka 2016; see also PolicyLink and PERE 2016, which use ages 16–24).
Disconnected youth differs in that it counts residents neither in school nor working. We elected to
instead utilize a proxy for high school dropout rate, as unemployed youth have the potential to be a
factor of broader economic health in a locality rather than its levels of inclusion.
Racial Inclusion
A further distinction in the literature is exhibited in studies that emphasize narrowing general economic
inequalities66 versus those that focus on disparities by race and ethnicity, immigration status, gender, or
other group identity (de Souza Briggs, Pendall, and Rubin 2015)—often referred to collectively as
“vulnerable” or “marginalized” groups. Studies that focus on economic inequality usually use measures
of poverty or income inequality (Benner and Pastor 2016b).
To capture group-based disparities, we create an additional index of inclusion to measure the racial
dimensions of disparities. Though gender, national origin, and other identities figure prominently into
the inclusion calculus, we decided to focus on racial disparities considering the role that place has
played in their creation and continuation (Greene, Austin Turner, and Gourevitch 2017) and because
racial disparities are particularly pronounced in the US (Fong 1996; Johnston, Poulsen, and Forrest
2007). However, future studies could investigate the effects of these other identity-based disparities.
We chose to create our disparity measures for non-Hispanic whites versus all other people of color
rather than just one race to be inclusive of different types of cities. In some cities, Hispanics outnumber
African American residents and face barriers to inclusion that would be missed if we only examined
racial disparities between non-Hispanic whites and African American residents. Similarly, in some cities,
subpopulations of Asians outnumber other populations of color and face their own unique barriers to
inclusion, like in Lowell where Cambodian refugees are a large segment of the population. Using this
more inclusive measure of racial disparity helps to pick up these concerns in our indices. Trade-offs
exist, however, when, for instance, a city has a large population of people of color from a group who has
been less historically marginalized than other populations, and the city therefore shows smaller racial
disparities just by the nature of the population. If, for instance, barriers to inclusion are greater for
African American populations than they are for Asian populations, then cities with large Asian
populations are going to appear to be more racially inclusive just by nature of their racial mix. However,

A P P E N D I X A 4 9
we believe that the benefits of including measures of disparities for all people of color outweigh this
potential negative.
To create these measures of racial disparity, we create parallel measures to the economic inclusion
index to measure the difference in outcomes between white residents and residents of color in a city.
However, the same measures available for the population as a whole are not always disaggregated by
race. For instance, although rent burden is available for residents of a city as a whole, it is not available
for non-Hispanic white and people of color residents separately, so we could not include the gap in rent
burden as a measure in our racial inclusion index. Instead, we include a measure for the homeownership
gap between races, which captures some of the racial differences in housing access and affordability.
This is also the case for our education indicator and job-quality indicator. For the former, we substitute
dropout rates with graduation rates to approximate similar dimensions of educational attainment.
Because working poor measures are not available with race or ethnicity breakdowns, we opted to use
the gap in poverty rate. We also include a measure to account for the share of the city’s population that
are people of color, so that less diverse cities are not favored in the rankings and to capture trends over
time that may be contributing to declining (increasing) diversity.
To address racial inclusion, we utilized a racial segregation metric and a series of racial person of
color versus white gaps to capture similar areas as addressed in our economic inclusion index. In
addition, we included percentage of color to factor in the diversity of each city evaluated. This indicator
is especially important in measuring changes in inclusion over time, as a declining share of a city’s
population who are people of color suggests that changes are leading to displacement. Across all racial
inclusion indicators, we compare the opportunities afforded non-Hispanic white residents with those
afforded residents of color.
For our racial segregation measure, we utilized a non-Hispanic white/person of color residential
dissimilarity, measuring the extent to which people of color and non-Hispanic white residents are
equally distributed across census tracts within each city (Logan and Stults 2011). Data were obtained
from Brown University’s American Community Project.67
Homeownership gap was selected over a rent-burden measure considering that disparate
homeownership levels significantly contribute to the wealth gap (Rothstein 2017) between non-
Hispanic white and populations of color. Homeownership gap was included in the National Equity Atlas
(PolicyLink and PERE 2016) and considered by Ranieri and Almeida Ramos’ (2013) analysis of inclusive
growth.

5 0 A P P E N D I X A
Unlike in our economic inclusion index, we had to use poverty rate (rather than working poor) as a
measure because of data constraints. Both Shearer et al. (2017) and the National Equity Atlas
(PolicyLink and PERE 2016) also break down poverty rate by race. Pew Research Center (2016)
demonstrates the saliency of the racial poverty gap at national level.
A key measure in the literature on racial disparities in education is the racial gap on “status dropout
rate” (the percentage of 15- to 24-year-olds not enrolled in high school and without a high school
credential) (Chapman et al. 2011; Child Trends 2015). Because of lack of data availability reaching back
to 1980, we had to instead use a non-Hispanic white/person of color gap on the percentage of residents
older than age 25 with a high school degree or more to try to capture this dynamic. This is an imperfect
measure and includes residents who move into the city despite being educated in a different
jurisdiction’s school system.

A P P E N D I X B 5 1
Appendix B. Top 10 and Bottom 10
Cities by Index In this appendix, we list the cities from our entire 274 city sample that fared the best and worst on our
economic, racial, and overall inclusion indices in 2013. Next to each city is a parenthetical denoting its
classification on our economic health index over our 1980–2013 study period.
TABLE B.1
Top and Bottom 10 Cities, by Index
Rank Economic inclusion index Racial inclusion index Overall inclusion index
Top 10 1 Livonia, MI (H) Miramar, FL (H) Fremont, CA (H) 2 Fremont, CA (H) Daly City, CA (H) Daly City, CA (H) 3 Bellevue, WA (H) Fremont, CA (H) Torrance, CA (H) 4 Naperville, IL (H) Glendale, CA (H) Santa Clara, CA (H) 5 Sunnyvale, CA (H) West Covina, CA (H) Elk Grove, CA (H) 6 Torrance, CA (H) Killeen, TX (D) West Covina, CA (H) 7 Cambridge, MA (H) Pembroke Pines, FL (H) Sunnyvale, CA (H) 8 Overland Park, KS (H) Hialeah, FL (O) Bellevue, WA (H) 9 Santa Clara, CA (H) Elk Grove, CA (H) Carlsbad, CA (H) 10 Carlsbad, CA (H) Norwalk, CA (H) Naperville, IL (H)
Bottom 10 265 Jackson, MS (D) Huntsville, AL (O) Miami, FL (O) 266 Memphis, TN (D) Wilmington, NC (R) Evansville, IN (D) 267 San Bernardino, CA (D) Scranton, PA (D) Grand Rapids, MI (D) 268 Fresno, CA (D) Grand Rapids, MI (D) Atlanta, GA (D) 269 Detroit, MI (D) Fort Wayne, IN (O) Winston-Salem, NC (D) 270 Shreveport, LA (D) Duluth, MN (H) Phoenix, AZ (O) 271 Camden, NJ (D) Omaha, NE (H) South Bend, IN (D) 272 Dallas, TX (O) St. Paul, MN (H) Houston, TX (O) 273 Laredo, TX (R) Minneapolis, MN (H) Shreveport, LA (D) 274 Miami, FL (O) Sioux Falls, SD (H) Dallas, TX (O)
Notes: “H” = healthy in 1980, 1990, 2000, 2013; “D” = distressed in all four years; “R” = recovered economically at some point in
this time span; “O” = a mix of healthy, distressed, or in between years, but experienced no economic recovery within this timespan.
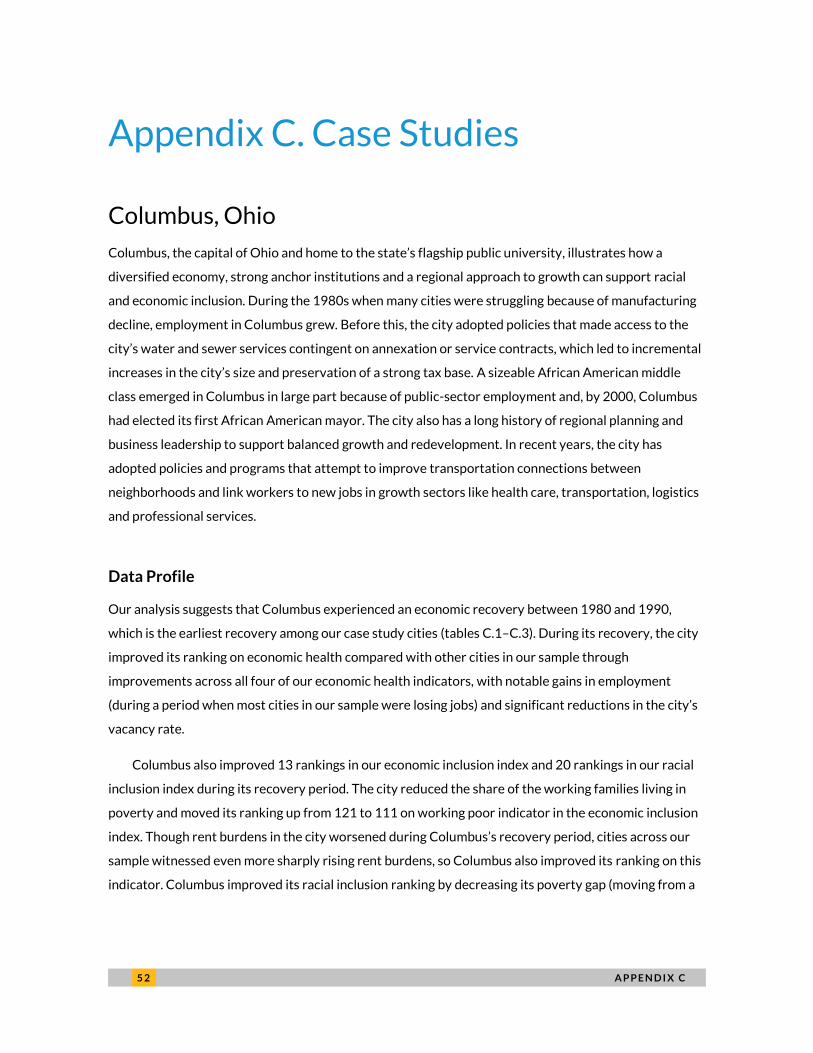
5 2 A P P E N D I X C
Appendix C. Case Studies
Columbus, Ohio
Columbus, the capital of Ohio and home to the state’s flagship public university, illustrates how a
diversified economy, strong anchor institutions and a regional approach to growth can support racial
and economic inclusion. During the 1980s when many cities were struggling because of manufacturing
decline, employment in Columbus grew. Before this, the city adopted policies that made access to the
city’s water and sewer services contingent on annexation or service contracts, which led to incremental
increases in the city’s size and preservation of a strong tax base. A sizeable African American middle
class emerged in Columbus in large part because of public-sector employment and, by 2000, Columbus
had elected its first African American mayor. The city also has a long history of regional planning and
business leadership to support balanced growth and redevelopment. In recent years, the city has
adopted policies and programs that attempt to improve transportation connections between
neighborhoods and link workers to new jobs in growth sectors like health care, transportation, logistics
and professional services.
Data Profile
Our analysis suggests that Columbus experienced an economic recovery between 1980 and 1990,
which is the earliest recovery among our case study cities (tables C.1–C.3). During its recovery, the city
improved its ranking on economic health compared with other cities in our sample through
improvements across all four of our economic health indicators, with notable gains in employment
(during a period when most cities in our sample were losing jobs) and significant reductions in the city’s
vacancy rate.
Columbus also improved 13 rankings in our economic inclusion index and 20 rankings in our racial
inclusion index during its recovery period. The city reduced the share of the working families living in
poverty and moved its ranking up from 121 to 111 on working poor indicator in the economic inclusion
index. Though rent burdens in the city worsened during Columbus’s recovery period, cities across our
sample witnessed even more sharply rising rent burdens, so Columbus also improved its ranking on this
indicator. Columbus improved its racial inclusion ranking by decreasing its poverty gap (moving from a

A P P E N D I X C 5 3
ranking of 170 to 124). It also achieved modest declines in racial segregation during its recovery—a
trend that steadily continued in subsequent periods.
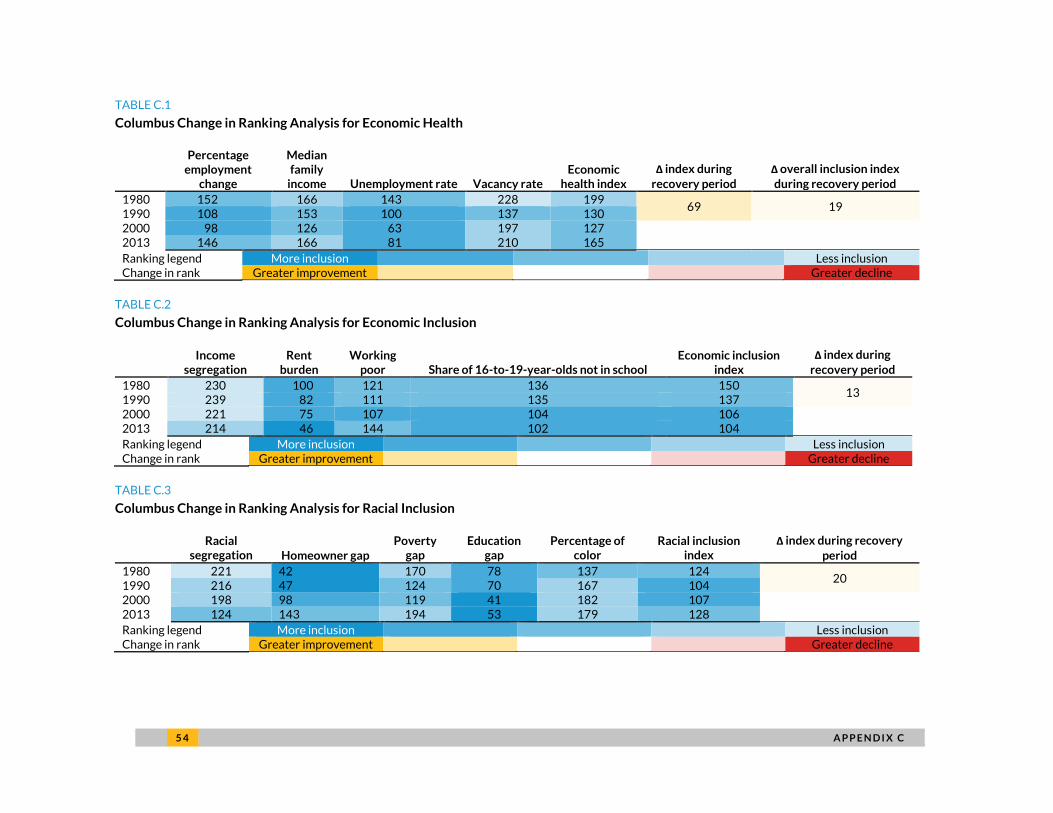
5 4 A P P E N D I X C
TABLE C.1
Columbus Change in Ranking Analysis for Economic Health
Percentage employment
change
Median family
income Unemployment rate Vacancy rate Economic
health index
Δ index during
recovery period
Δ overall inclusion index
during recovery period
1980 152 166 143 228 199 69 19
1990 108 153 100 137 130 2000 98 126 63 197 127
2013 146 166 81 210 165
Ranking legend More inclusion Less inclusion Change in rank Greater improvement Greater decline
TABLE C.2
Columbus Change in Ranking Analysis for Economic Inclusion
Income segregation
Rent burden
Working poor Share of 16-to-19-year-olds not in school
Economic inclusion index
Δ index during
recovery period
1980 230 100 121 136 150 13
1990 239 82 111 135 137 2000 221 75 107 104 106
2013 214 46 144 102 104
Ranking legend More inclusion Less inclusion Change in rank Greater improvement Greater decline
TABLE C.3
Columbus Change in Ranking Analysis for Racial Inclusion
Racial segregation Homeowner gap
Poverty gap
Education gap
Percentage of color
Racial inclusion index
Δ index during recovery
period
1980 221 42 170 78 137 124 20
1990 216 47 124 70 167 104 2000 198 98 119 41 182 107
2013 124 143 194 53 179 128
Ranking legend More inclusion Less inclusion Change in rank Greater improvement Greater decline
A P P E N D I X C 5 5
Drivers of Inclusive Recovery
ECONOMIC HEALTH
Columbus experienced economic growth during the 1980s, bucking trends across our sample during
this decade, when most cities were losing jobs and witnessing rising unemployment and housing
vacancy rates (figure C.1). Experts and historical accounts attribute this to Columbus’s diversified
economy, its status as a state capital, and the presence of anchor employers, such as universities,
hospitals, and government agencies, that could not easily relocate from the city. These anchors buffered
Columbus’s workforce during declines in the manufacturing sector, which negatively affected Ohio’s
other largest cities and the wider Midwestern region during the period but could not have the same
effect on Columbus given that it never had a strong manufacturing base.68 Columbus also established
itself as a center for industries like logistics, insurance, and finance.69 Most notably, its strong fashion
and retail presence with entrepreneurs like Les Wexner (of The Limited brands) growing businesses in
the Columbus area during the 1980s (today Columbus is the fourth-largest fashion industry employer in
the country) likely contributed positively to its economic resilience.70

5 6 A P P E N D I X C
FIGURE C.1
Columbus Economic Health Indicators that Drove Recovery
Employment change
Vacancy rate
Source: Urban Institute analysis of US Census Bureau data, Decennial Census (1980, 1990, and 2000) and American Community
Survey (2011–15).
0%
5%
10%
15%
20%
25%
30%
35%
40%
45%
50%
1980 1990 2000 2010 2020
Columbus Mean across citiesPercent change from earlier period
0%
2%
4%
6%
8%
10%
12%
14%
1980 1990 2000 2010 2020
Columbus Mean across cities
A P P E N D I X C 5 7
Columbus also managed to reduce vacancy rates while other many cities suffered from widespread
vacancy and abandonment. Several factors likely contributed to this: Columbus’s population grew
significantly and the city annexed communities in Franklin County with low vacancy rates (although at a
slower rate than previous decades). While many neighborhoods in Columbus continued to suffer from
disinvestment, the neighborhoods surrounding downtown Columbus experienced a construction boom
that included both residential and commercial properties in the 1980s.71
ECONOMIC INCLUSION
Columbus’s gains in its economic inclusion ranking during its recovery were modest and driven by
tempered growth in rent burdens and reducing the share of working families living in poverty (figure
C.2). Rent burdens in Columbus increased in the 1980s but at a slower rate than other cities. This was
likely because of rising incomes during the period accompanied by an extensive revitalization effort in
the historic neighborhoods surrounding downtown that enhanced the desirability of these areas, thus
decreasing vacancy rates.72 Columbus’s reduction in the percentage of its working poor population is
likely driven by job growth during this period and the predominance of public-sector jobs that tend to
offer higher wages.
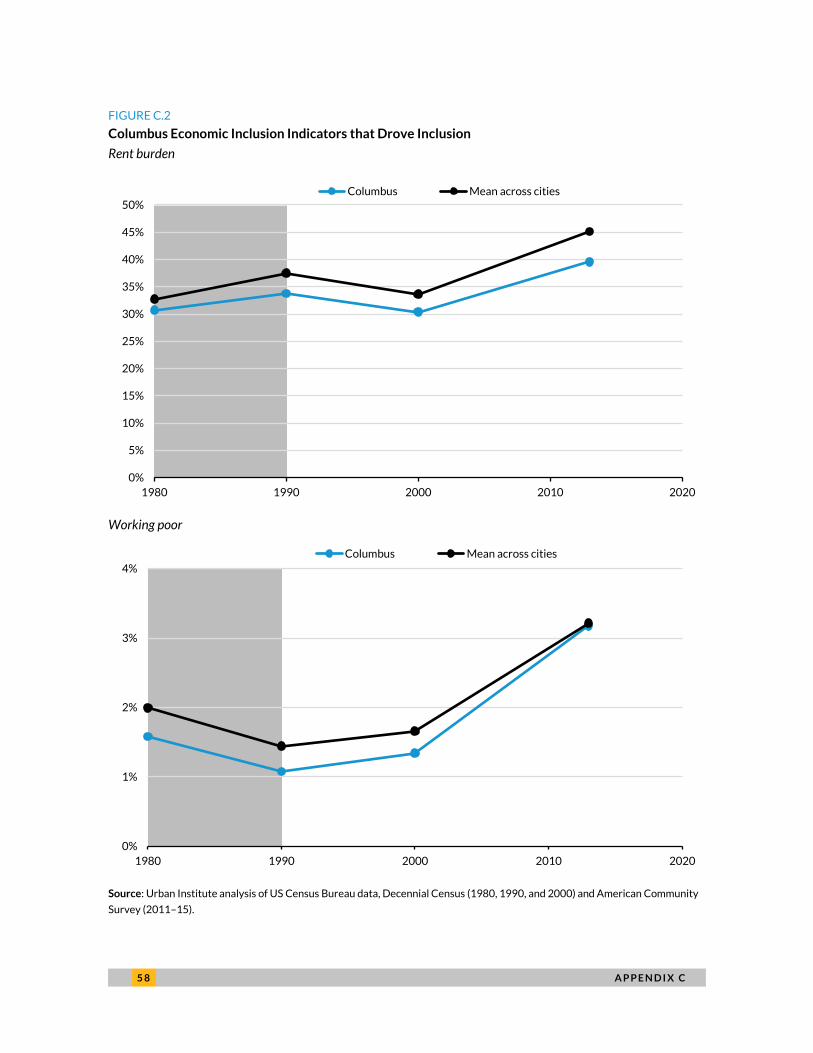
5 8 A P P E N D I X C
FIGURE C.2
Columbus Economic Inclusion Indicators that Drove Inclusion
Rent burden
Working poor
Source: Urban Institute analysis of US Census Bureau data, Decennial Census (1980, 1990, and 2000) and American Community
Survey (2011–15).
0%
5%
10%
15%
20%
25%
30%
35%
40%
45%
50%
1980 1990 2000 2010 2020
Columbus Mean across cities
0%
1%
2%
3%
4%
1980 1990 2000 2010 2020
Columbus Mean across cities

A P P E N D I X C 5 9
RACIAL INCLUSION
Columbus made more significant gains in its racial inclusion ranking during its recovery, driven by a
reduced gap between poverty rates for the city’s white population and people of color and declining
racial segregation (figure C.3). The reduced racial gap in poverty rates was the result of very modest
increases in poverty rates for white individuals accompanied by more significant decreases in poverty
for people of color between 1980 and 1990. These trends contrast with those for other cities in our
sample during this period when, on average, the gap in poverty rates between whites and people of
color was widening.73 Columbus also has a long history of African American church leaders and
community development organizations that have focused on improving education, housing conditions,
and economic opportunities in African American neighborhoods (Benner and Pastor 2012).
Columbus’s reduced racial segregation during this period is likely driven by a combination of
factors. New public housing built in Columbus in the 1980s was more dispersed than existing projects in
the city (Holloway et al. 1998) In 1979, a federal court ordered Columbus to desegregate schools, which
led to a massive busing program in the 1980s. The desegregation order and busing program initially
contributed to white flight from the city; however, because Columbus continued to annex suburban
communities (without annexing school districts), the city’s racial composition remained intact (Jacobs
1998).74 Additionally, the previously disinvested areas around downtown, like German Village, Merion
Village, and Victorian Village, became newly attractive to white families as the neighborhoods were
revitalized.75
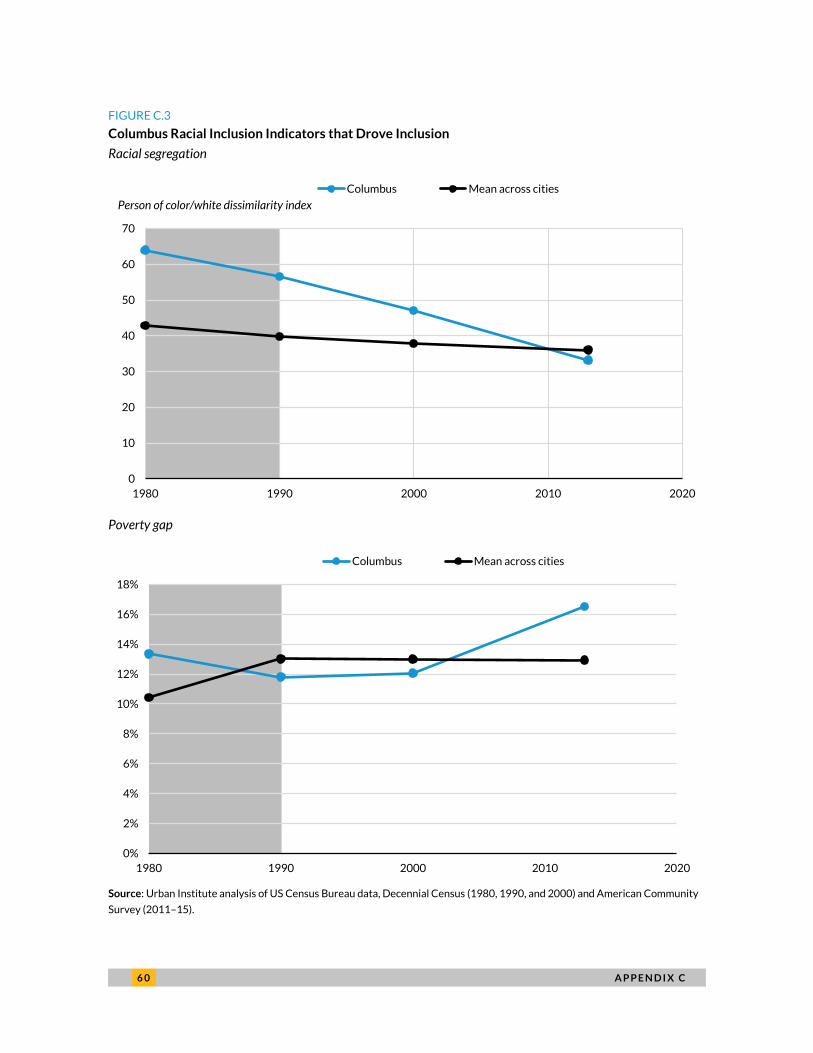
6 0 A P P E N D I X C
FIGURE C.3
Columbus Racial Inclusion Indicators that Drove Inclusion
Racial segregation
Poverty gap
Source: Urban Institute analysis of US Census Bureau data, Decennial Census (1980, 1990, and 2000) and American Community
Survey (2011–15).
0
10
20
30
40
50
60
70
1980 1990 2000 2010 2020
Columbus Mean across cities
Person of color/white dissimilarity index
0%
2%
4%
6%
8%
10%
12%
14%
16%
18%
1980 1990 2000 2010 2020
Columbus Mean across cities
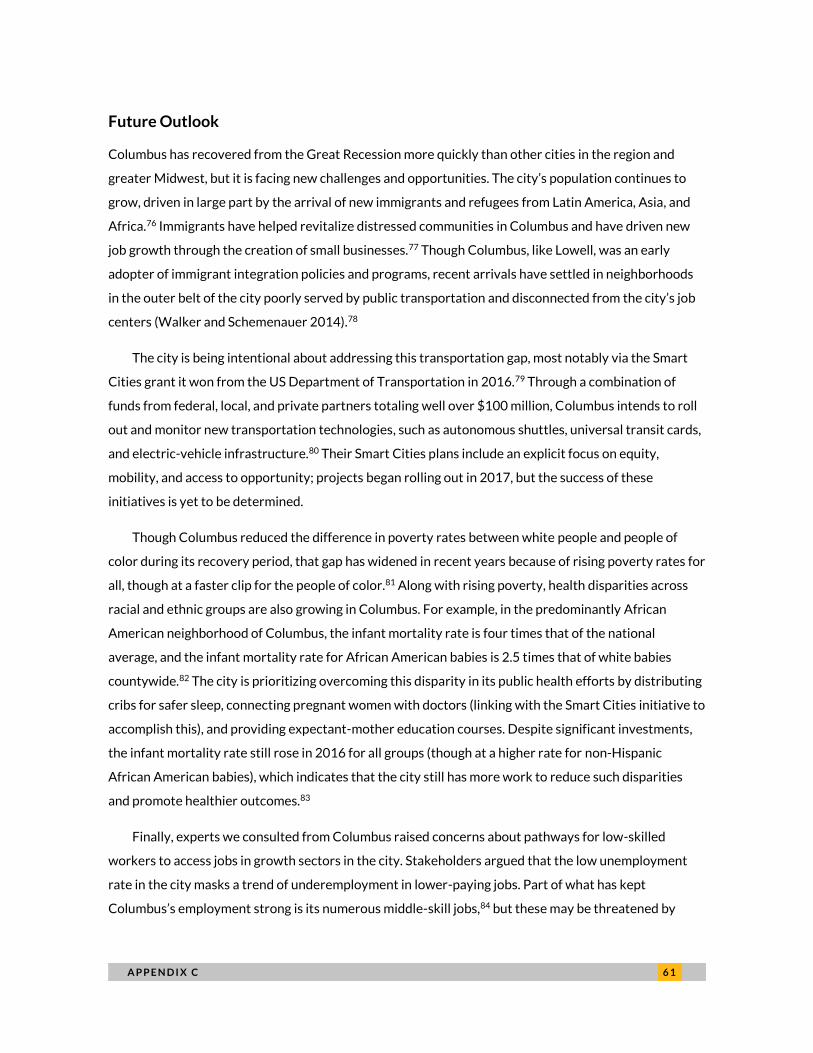
A P P E N D I X C 6 1
Future Outlook
Columbus has recovered from the Great Recession more quickly than other cities in the region and
greater Midwest, but it is facing new challenges and opportunities. The city’s population continues to
grow, driven in large part by the arrival of new immigrants and refugees from Latin America, Asia, and
Africa.76 Immigrants have helped revitalize distressed communities in Columbus and have driven new
job growth through the creation of small businesses.77 Though Columbus, like Lowell, was an early
adopter of immigrant integration policies and programs, recent arrivals have settled in neighborhoods
in the outer belt of the city poorly served by public transportation and disconnected from the city’s job
centers (Walker and Schemenauer 2014).78
The city is being intentional about addressing this transportation gap, most notably via the Smart
Cities grant it won from the US Department of Transportation in 2016.79 Through a combination of
funds from federal, local, and private partners totaling well over $100 million, Columbus intends to roll
out and monitor new transportation technologies, such as autonomous shuttles, universal transit cards,
and electric-vehicle infrastructure.80 Their Smart Cities plans include an explicit focus on equity,
mobility, and access to opportunity; projects began rolling out in 2017, but the success of these
initiatives is yet to be determined.
Though Columbus reduced the difference in poverty rates between white people and people of
color during its recovery period, that gap has widened in recent years because of rising poverty rates for
all, though at a faster clip for the people of color.81 Along with rising poverty, health disparities across
racial and ethnic groups are also growing in Columbus. For example, in the predominantly African
American neighborhood of Columbus, the infant mortality rate is four times that of the national
average, and the infant mortality rate for African American babies is 2.5 times that of white babies
countywide.82 The city is prioritizing overcoming this disparity in its public health efforts by distributing
cribs for safer sleep, connecting pregnant women with doctors (linking with the Smart Cities initiative to
accomplish this), and providing expectant-mother education courses. Despite significant investments,
the infant mortality rate still rose in 2016 for all groups (though at a higher rate for non-Hispanic
African American babies), which indicates that the city still has more work to reduce such disparities
and promote healthier outcomes.83
Finally, experts we consulted from Columbus raised concerns about pathways for low-skilled
workers to access jobs in growth sectors in the city. Stakeholders argued that the low unemployment
rate in the city masks a trend of underemployment in lower-paying jobs. Part of what has kept
Columbus’s employment strong is its numerous middle-skill jobs,84 but these may be threatened by

6 2 A P P E N D I X C
automation (e.g., higher-paid semi-skill jobs like trucking could be obsolete within the decade in the face
of new technologies).85 Moving forward, civic leaders in Columbus will need to create opportunities for
apprenticeships and other technical trainings to shift the skill base of Columbus’s labor force to reflect
the changing, increasingly automated, economy.
Louisville, Kentucky
Louisville, with a population of 609,863 in 2013, is the largest city in the state of Kentucky and is
located on the Ohio River, bordering Indiana. Louisville supports a diverse economy. Several Fortune
500 companies with specialties in health care and food and beverage are headquartered there,
including Humana and Yum! Brands. The city is also home to the University of Louisville and is the
worldwide transit hub for UPS. Notably, the local school district is well known for their long-standing
desegregation efforts, dating back to the 1970s. The district defended their integration efforts in front
of the Supreme Court, and even after their racial weighting system was ruled unconstitutional in 2007,
the district continued their school desegregation, basing it on socioeconomic status, neighborhood, and
several other factors.86 In 2003, the city of Louisville merged with the surrounding Jefferson County,
creating the Louisville/Jefferson County consolidated metro government. The consolidated metro is
governed by a mayor-council, with the mayor elected by the metrowide vote and each of the 26
councilors elected by their representative district.
Data Profile
According to our economic health analysis, Louisville experienced an economic recovery between the
years 2000 and 2013. Its improved economic health ranking was achieved through an increase in
median family income (from a ranking of 233 to 126) and an unemployment rate that, while still
increasing, did so at a slower pace than other cities across the country.
Over the course of its recovery period, Louisville improved 63 rankings in our economic inclusion
index and 102 rankings in our racial inclusion index. While income segregation slightly increased over
this period (ranking of 240 to 249), Louisville improved 78 rankings on rent burden, 90 rankings on
percentage of 16 to 19-year-olds not in school, and 91 rankings on percentage working poor over this
period. Rent burden and the percentage of working poor were comparative improvements—both
worsening but faring better than the average of our 274-city sample. The improved racial inclusion

A P P E N D I X C 6 3
ranking occurred through a mix of improvement across racial segregation (form a ranking of 263 to
213), education gap (from a ranking of 57 to 26), and poverty gap (from a ranking of 260 to 210).
LOUISVILLE-SPECIFIC DATA
Because of the consolidation in 2003, our census data before 2003 refers to the city of Louisville, and
our census data after 2003 refers to the consolidated Louisville-Jefferson County metro. In our
analysis, we follow city boundaries as they change over time, which is not uncommon as a result of
annexation, consolidations, mergers, and (less often) detachments. However, because we feature
Louisville as a case study in this research, we conducted robustness checks comparing census data for
Jefferson County in 2000 to the Louisville/Jefferson County metro in 2013 to provide consistent
boundaries during its period of recovery and better understand which changes are driven by the
consolidation. In many cases, the checks revealed similar findings, but we note where the checks
revealed significantly different results.

6 4 A P P E N D I X C
TABLE C.4
Louisville Change in Ranking Analysis for Economic Health
Percentage employment
change
Median family
income Unemployment rate Vacancy
rate Economic
health index
Δ index during
recovery period
Δ overall inclusion index during
recovery period
1980 257 236 249 178 252 1990 247 247 197 180 229 2000 211 233 171 207 217
213 63 2013 2 126 142 186 4
Ranking legend More inclusion Less inclusion Change in rank Greater improvement Greater decline
TABLE C.5
Louisville Change in Ranking Analysis for Economic Inclusion
Income segregation
Rent burden
Working poor Share of 16-to-19-year-olds not in school
Economic inclusion index
Δ index during
recovery period
1980 242 83 195 251 230 1990 254 102 217 165 215 2000 240 131 192 203 220
102 2013 249 53 101 112 118
Ranking legend More inclusion Less inclusion Change in rank Greater improvement Greater decline
TABLE C.6
Louisville Change in Ranking Analysis for Racial Inclusion
Racial segregation
Homeowner gap
Poverty gap
Education gap
Percentage of color Racial inclusion index
Δ index during recovery
period
1980 271 132 241 55 179 229
1990 266 174 235 84 141 242
2000 263 220 260 57 160 256 23
2013 213 259 210 26 216 233
Ranking legend More inclusion Less inclusion Change in rank Greater improvement Greater decline
A P P E N D I X C 6 5
Drivers of Inclusive Recovery
ECONOMIC HEALTH
Our main analysis shows a sizeable increase in Louisville’s employment between 2000 and 2013, which
was the main driver of Louisville’s economic recovery in this period and contributed to it jumping from
near the bottom to the top of our sample on overall economic health (figure C.4). However, our
robustness check revealed that the remarkable employment growth (and ranking change on this
indicator) between 2000 and 2013 was primarily because of the consolidation with Jefferson County.
The city added a large number of employed individuals primarily by adding more territory and people.
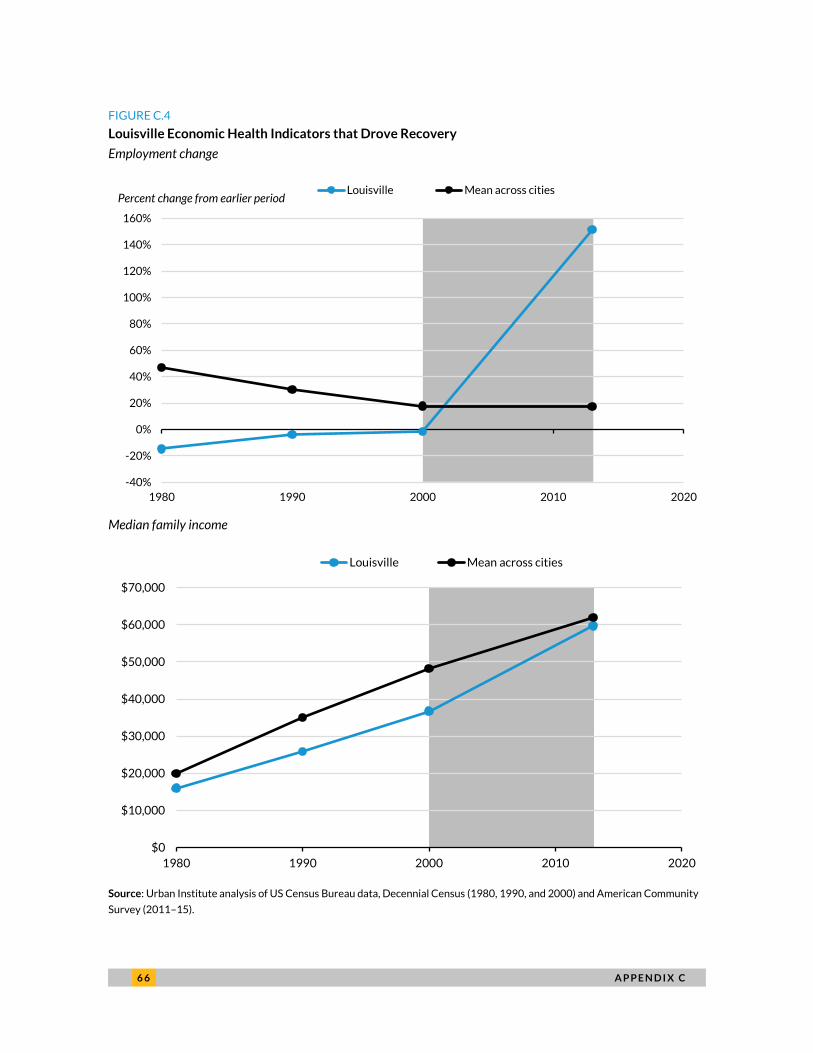
6 6 A P P E N D I X C
FIGURE C.4
Louisville Economic Health Indicators that Drove Recovery
Employment change
Median family income
Source: Urban Institute analysis of US Census Bureau data, Decennial Census (1980, 1990, and 2000) and American Community
Survey (2011–15).
-40%
-20%
0%
20%
40%
60%
80%
100%
120%
140%
160%
1980 1990 2000 2010 2020
Louisville Mean across citiesPercent change from earlier period
$0
$10,000
$20,000
$30,000
$40,000
$50,000
$60,000
$70,000
1980 1990 2000 2010 2020
Louisville Mean across cities
A P P E N D I X C 6 7
The robustness check suggest that Louisville’s economic growth during the recovery period was
much less pronounced than it appears in our main analysis, and it may not have improved enough on its
economic health ranking to be considered economically recovered by 2013.87 However, our checks also
reveal that even when we hold the city’s boundaries constant (using the boundaries for the current
consolidated Louisville-Jefferson County metro in both 2000 and 2013), Louisville witnessed significant
employment growth and rising median incomes between 2000 and 2013—on both these indicators,
Louisville improved not only its raw scores but also its ranking across our sample of cities. Our post-
Recession analysis also shows that Louisville witnessed significant employment growth, reduced
unemployment and rising median incomes between 2008 and 2013, a period during which boundaries
did not change for the city.
Even with the complexities surrounding its economic recovery, Louisville merits its own case study
due to its strong improvements in both racial and economic inclusion, which we observe even after
holding boundaries constant since 2000 (discussed below). Louisville is also leading with intentional
strategies to become less segregated and more inclusive. Aside from the school district integration
(which continued after consolidation), the city also explicitly took neighborhood identity and
neighborhood demographics into consideration when drawing the new boundaries for the unified
Louisville/Jefferson County Metro council. The city brought in the University of Louisville to conduct a
study and propose the boundaries, rather than having the new district lines being driven by political
consideration.
The consolidation could have proceeded in a way that consolidated political power in a way that
diluted the influence of the people of color who primarily lived in Louisville city, but instead, the
consolidation led to greater inclusion for residents across the Louisville/Jefferson metro, which is an
outcome worth further consideration.
ECONOMIC INCLUSION
Louisville made great strides in improving economic inclusion between 2000 and 2013, driven in large
part by slower growth in both the share of renters who were cost burdened and the share of working
families living below the poverty level than other cities in our sample (figure C.5). During this period,
Louisville also reduced the share of teenagers dropping out of high school.
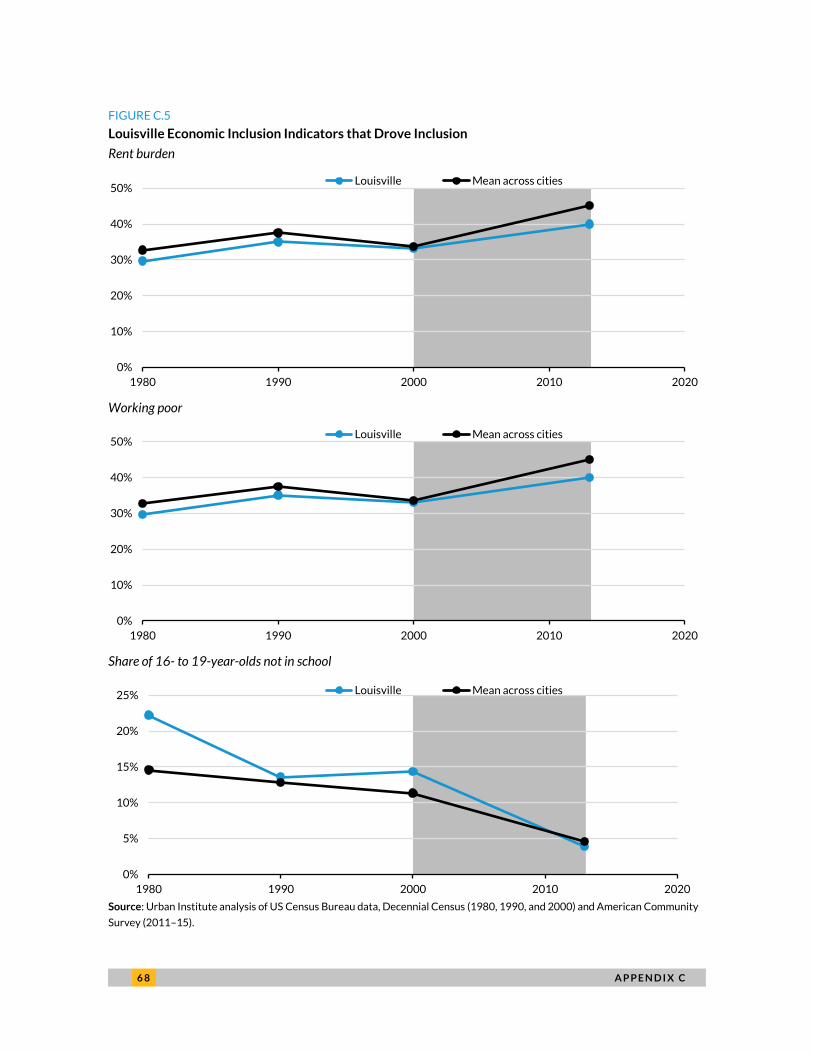
6 8 A P P E N D I X C
FIGURE C.5
Louisville Economic Inclusion Indicators that Drove Inclusion
Rent burden
Working poor
Share of 16- to 19-year-olds not in school
Source: Urban Institute analysis of US Census Bureau data, Decennial Census (1980, 1990, and 2000) and American Community
Survey (2011–15).
0%
10%
20%
30%
40%
50%
1980 1990 2000 2010 2020
Louisville Mean across cities
0%
10%
20%
30%
40%
50%
1980 1990 2000 2010 2020
Louisville Mean across cities
0%
5%
10%
15%
20%
25%
1980 1990 2000 2010 2020
Louisville Mean across cities
A P P E N D I X C 6 9
Rent burdens in Louisville increased more slowly than cities across our sample, and it improved 78
rankings on this indicator between 2000 and 2013. Even in 2000, the average rent burden was low
enough to place it in the top half of cities. Though Louisville is among the more affordable cities in the
country, the city still took steps to decrease rental burdens and increase the amount and mix of
affordable housing.88 During this period, the city received two HOPE VI grants to redevelop two
housing development sites containing over 1,000 affordable units into redeveloped, mixed-income,
mixed-use sites. Though after 2013, the city also recently received a Choice Neighborhood
implementation grant of nearly $30 million to build more affordable and mixed-income development in
the Russell neighborhood. Consistently winning these federal grants shows an organized commitment
to community development and building affordable housing.
Louisville also reduced high school dropout rates between 2000 and 2013 and did so more
dramatically than other cities in our sample. As a result, it jumped 91 rankings on this indicator.
Louisville has invested heavily in their school system, working to keep schools integrated both before
and after the consolidation and before and after the Supreme Court decision. In 2009 and 2010, the
city, civic and business leaders, and Jefferson County Public Schools (JCPS) came together to create
two new programs to improve and advance educational outcomes. The first initiative, Grade Level
Reading Louisville, created in 2009 has the goal of getting all students in the school district proficient at
reading at grade level. In 2010, the city and business leaders created 55,000 Degrees, a program aimed
at increasing the number of Louisville residents with bachelor’s degrees by 40,000 and the number of
people with associate’s degrees by 15,000.89 These initiatives work toward better educational
outcomes while students are in school and encourage college attendance for people who do complete
high school.
RACIAL INCLUSION
Louisville saw modest gains in racial inclusion during its recovery period, and some of these gains were
driven primarily by the consolidation and redrawing of political boundaries (figure C.6).

7 0 A P P E N D I X C
FIGURE C.6
Louisville Racial Inclusion Indicators that Drove Inclusion
Racial segregation
Racial education gap
Poverty gap
Source: Urban Institute analysis of US Census Bureau data, Decennial Census (1980, 1990, and 2000) and American Community
Survey (2011–15).
0
10
20
30
40
50
60
70
80
90
1980 1990 2000 2010 2020
Louisville Mean across citiesPerson of color/white dissimilarity index
0%
5%
10%
15%
20%
1980 1990 2000 2010 2020
Louisville Mean across cities
0%
5%
10%
15%
20%
25%
1980 1990 2000 2010 2020
Louisville Mean across cities
A P P E N D I X C 7 1
The racial education gap for adults in Louisville decreased between 2000 and 2013 in Louisville,
resulting in a 31-ranking improvement. Louisville’s investments in integrated education were already
reflected in the relatively high ranking among cities in 2000, yet the city still improved. The continued
decrease in the racial educational attainment is likely because of the sustained commitment to an
integrated school district, through multiple challenges during the increased inclusion period. The
55,000 Degrees program also includes several initiative specifically designed to increase diversity
among people obtaining higher education. 15,000 Degrees seeks to ensure that 15,000 degrees of the
larger 55,000 degree goal are obtained by African American people in the Louisville-Jefferson County
metro.90 The Hispanic/Latino Initiative at the University of Louisville seeks to increase Latino
enrollment and retention at the University of Louisville through scholarships and targeted support.
The racial poverty gap fell during the inclusion period, moving Louisville up 50 ranks. The decrease
in the poverty gap was driven by several other factors mentioned here, such as the investments in
education, which likely led to improved access to jobs. Additionally, the city invested significantly in
economic development throughout the city, including the areas around downtown and the waterfront,
such as building the Yum! Center. The development led to increased investments in previously
neglected, predominantly African American parts of the city.91
Finally, the analyses show Louisville increasing 50 rankings on racial segregation over the period
between 2000 and 2013, suggesting that the city became less segregated. The robustness check
comparing the city and county in 2000 to the consolidating jurisdiction in 2013 shows that racial
segregation with constant boundaries remained nearly unchanged, with the dissimarility index
increasing less than 1 percent over that time period.
Future Outlook
Though Louisville became both a more economically and racially inclusive city between 2000 and 2013,
the city can still make strides in regards to economic recovery and health. In our original analyses, we
found that employment growth resulting from adding the workers in Jefferson County led to an
economic recovery. Though the robustness checks complicate those findings, the underlying result is
one still worth considering. Increasing the workforce is a pathway and driver to economic recovery and
continued economic health. The merged Louisville/Jefferson County added workers over the period,
and the metro is explicitly planning to add more through the 55,000 Degrees initiative.92 Merging city
and county governments can also be a benefit through improved coordination and cooperation among
7 2 A P P E N D I X C
local officials. Given the complications of a merger, it may not be a solution for many jurisdictions, but
the results so far in this suggest the merger only stands to benefit the metro economically.
The city also made significant strides in becoming both a more economically and racially inclusive
place over the period. Notably, the metro made more gains in economic than racial inclusion. The
metro’s economic inclusion gains through declines in rent burden, percentage of youth not in school,
and in the working poor suggest that economic development in the metro and the noted efforts of the
school district are beneficial to wide swaths of the population. However, though there were gains in
racial inclusion, Louisville could still gain further ground. The metro is still relatively racially segregated
and still has a wide racial gap in homeownership. Additional efforts to add more affordable housing and
make homeownership more accessible to people across the metro could lead to continued racial
inclusion in Louisville and continue to bolster its progress as an economically healthy and inclusive city.
Lowell, Massachusetts
Lowell is a city of 109,349 (as of 2013), located approximately 30 miles northeast of Boston. Lowell’s
economy was driven by textile manufacturing until the mid-20th century, In the 1980s, the city was part
of the “Massachusetts Miracle” tech boom, hosting the international headquarters of Wang
Laboratories, until their bankruptcy and eventual sale and closure in the 1990s. Now, the city is home to
the Lowell National Historical Park and its colleges integrated and became a part of the UMass system.
The city is governed by a city council (elected by citywide vote), with the mayor as the head of the city
council. The council appoints a city manager, who is the city executive tasked with day-to-day operation
of the city.
Data Profile
According to our economic health analysis, Lowell experienced an economic recovery between the
years 1990 and 2000 (tables C.7–C.9). Its improved economic health ranking was achieved driven
primarily by lowered vacancy rates (moving from ranking 159 to 77) and unemployment rates (249 to
139).
Over the course of its recovery period, Lowell vaulted 31 rankings in our economic inclusion index
and 75 rankings in our racial inclusion index. The increase in economic inclusion index ranking occurred
because of a large decrease in percentage of the population rent burdened (from a ranking of 193 to a
ranking of 63). In this 10-year span, Lowell achieved higher rankings in all five of our racial inclusion

A P P E N D I X C 7 3
indicators. The most marked improvement occurred on poverty gap with Lowell moving from 252 to
166 among our cities on this metric.

7 4 A P P E N D I X C
TABLE C.7
Lowell Change in Economic Health
Percentage employment
change
Median family
income Unemployment rate Vacancy
rate Economic
health index
Δ index during
recovery period
Δ overall inclusion index
during recovery period
1980 195 186 73 117 142
1990 171 113 249 159 204 85 100
2000 169 146 138 77 119 2013 168 145 202 102 162
Ranking legend More inclusion Less inclusion Change in rank Greater improvement Greater decline
TABLE C.8
Lowell Change in Economic Inclusion
Income segregation
Rent burden
Working poor Share of 16-to-19-year-olds not in school
Economic inclusion index
Δ index during
recovery period
1980 60 110 77 137 53 1990 74 193 48 203 123
31 2000 79 63 118 217 92 2013 45 125 47 188 73
Ranking legend More inclusion Less inclusion Change in rank Greater improvement Greater decline
TABLE C.9
Lowell Change in Racial Inclusion
Racial segregation Homeowner gap
Poverty gap
Education gap
Percentage of color
Racial inclusion index
Δ index during recovery
period
1980 142 264 129 127 241 234
1990 133 267 252 188 181 267 75
2000 105 248 166 153 167 192 2013 46 169 105 159 145 103
Ranking legend More inclusion Less inclusion Change in rank Greater improvement Greater decline
A P P E N D I X C 7 5
Drivers of Inclusive Recovery
ECONOMIC HEALTH
Computer component manufacturing and software engineering were major drivers of economic success
in the 1970s and 1980s, driven primarily by Wang Laboratories, whose international headquarters
were located in Lowell (figure C.7). At their peak the mid-1980s, Wang employed over 10,000 people in
Lowell, over 10 percent of their workforce. However, during the late 1980s and early 1990s, Wang’s
business suffered, and eventually filed for bankruptcy in 1992, which had a profound impact on Lowell’s
economy.
Despite the impact of Wang’s loss, the city maintained a base of skilled labor, a national historic
park, and UMass Lowell. Efforts from the Lowell Development and Financial Corporation provided low-
cost business development loans and The Lowell Plan worked to redevelop the remaining mills and
office space left by Wang to be converted into housing and workspace and offices for new businesses.
At the same time, many of the refugees and immigrants who had come to the city in the 1980s were
settling into the city making inroads into the local labor market and seeing success with their own small
businesses.
These changes help explain some of the factors our research found to be key drivers of economic
recovery between 1990 and 2000. Lowell’s unemployment rate fell sharply during that time, and
relative to other cities, moved up 111 ranks. Part of the reason is that Lowell was recovering from
Wang’s loss, but adding new employers, such as at UMass Lowell, a new campus for Middlesex
Community College, and adding other technology focused businesses, such as MACOM, a company that
develops radio and microwave technology. The vacancy rate also fell during the period of recovery,
driven primarily by the influx of immigration over the decade. By 2000, 22 percent of Lowell’s
population was foreign born. Though the early wave of Cambodian immigrants during the 1980s set the
stage for the influx, over 40 percent of the foreign-born population (primarily from Asian and Latin
America) arrived in Lowell arrived in the 1990s (Lotspeich et al. 2003).
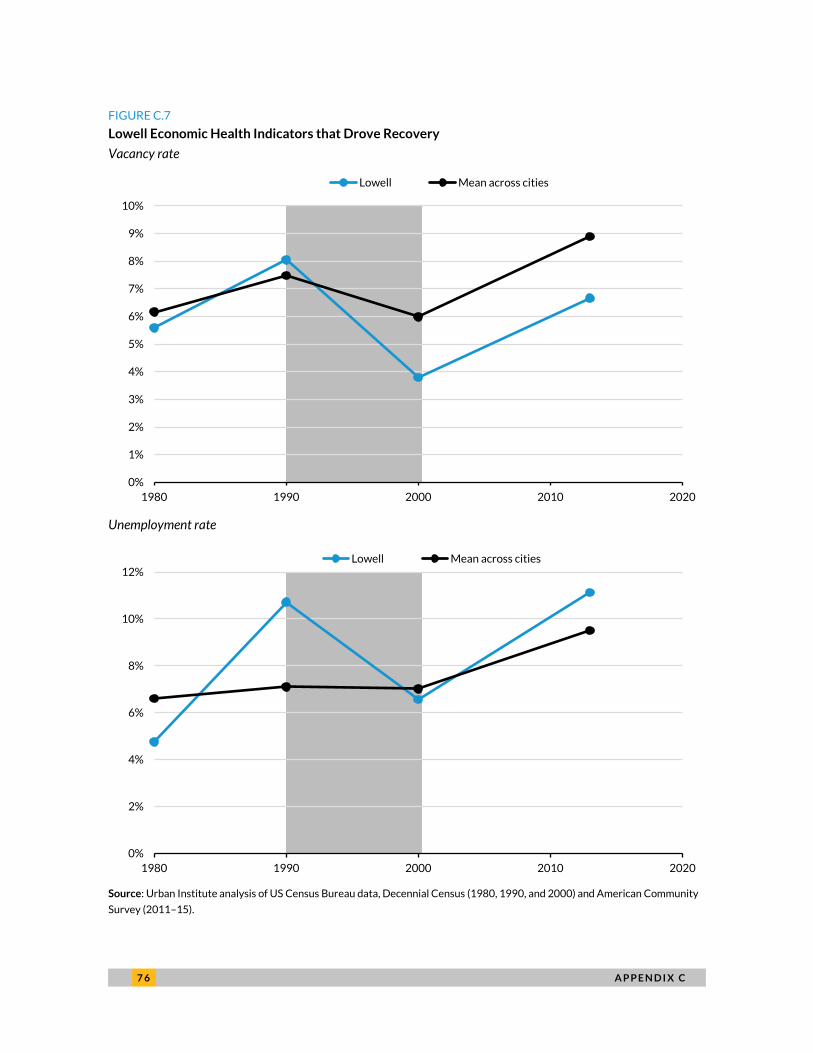
7 6 A P P E N D I X C
FIGURE C.7
Lowell Economic Health Indicators that Drove Recovery
Vacancy rate
Unemployment rate
Source: Urban Institute analysis of US Census Bureau data, Decennial Census (1980, 1990, and 2000) and American Community
Survey (2011–15).
0%
1%
2%
3%
4%
5%
6%
7%
8%
9%
10%
1980 1990 2000 2010 2020
Lowell Mean across cities
0%
2%
4%
6%
8%
10%
12%
1980 1990 2000 2010 2020
Lowell Mean across cities

A P P E N D I X C 7 7
ECONOMIC INCLUSION
For economic inclusion, the key driver of inclusive recovery was the large relative ranking increase in
rent burden between 1990 and 2000 (figure C.8). Lowell undertook several steps between the late
1970s and the early 1990s that helped housing become more affordable. Most importantly, in 1978,
Lowell established the Lowell National Historical Park, which preserved the city’s historic mills for
future development. The historic mills provided ready-made infrastructure that could be turned into
housing and offices, efforts that were spearheaded by the Lowell Development Financial Corporation
and The Lowell Plan in the early 1990s. Additionally, large major employers moved into the city in the
1990s, with the University of Massachusetts converting the University of Lowell into UMass Lowell and
building the Tsongas Arena and Middlesex Community College establishing a campus in Lowell. Though
there was no major push to build more affordable housing in Lowell during the 1990s, other changes
around the supply of housing and the employment of residents helped drive changes to make housing
more accessible during their period of recovery.
FIGURE C.8
Lowell Economic Inclusion Indicator that Drove Inclusion
Rent Burden
Source: Urban Institute analysis of US Census Bureau data, Decennial Census (1980, 1990, and 2000) and American Community
Survey (2011–15).
0%
5%
10%
15%
20%
25%
30%
35%
40%
45%
50%
1980 1990 2000 2010 2020
Lowell Mean across cities

7 8 A P P E N D I X C
RACIAL INCLUSION
Lowell improved on all five of our indicators for racial inclusion. The percentage of people of color
increased in ranking not just between 1990 and 2000, but over the entire observation period. Lowell is
home to a large refugee and immigrant population and hosts the second-largest Cambodian population
in the United States after Long Beach, California. Cambodians first arrived as refugees in the 1970s and
1980s after the Cambodian-Vietnamese War. Not only did many in the first wave settle and raise
families, many friends and relatives followed in the subsequent years. In addition to the Cambodian
population, Lowell has a sizeable Latino population, including large numbers of Puerto Rican, Brazilian,
and Columbian residents.
FIGURE C.9
Lowell Racial Inclusion Indicators that Drove Inclusion
Racial segregation
Racial education gap
0
10
20
30
40
50
1980 1990 2000 2010 2020
Lowell Mean across citiesPerson of color/white dissimilarity index
0%
5%
10%
15%
20%
25%
1980 1990 2000 2010 2020
Lowell Mean across cities

A P P E N D I X C 7 9
Homeownership gap
Nonwhite percentage
Poverty gap
Source: Urban Institute analysis of US Census Bureau data, Decennial Census (1980, 1990, and 2000) and American Community
Survey (2011–15).
0%
5%
10%
15%
20%
25%
30%
35%
1980 1990 2000 2010 2020
Lowell Mean across cities
0%
10%
20%
30%
40%
50%
60%
1980 1990 2000 2010 2020
Lowell Mean across cities
0%
5%
10%
15%
20%
25%
30%
1980 1990 2000 2010 2020
Lowell Mean across cities
8 0 A P P E N D I X C
Notably, as the person-of-color population increased, relative residential segregation in Lowell
decreased. Though it is possible that the growing number of residents of color could move into already
segregated sections of town, potentially increasing segregation, the opposite trend is at work in Lowell.
Immigrant incorporation is a key aspect to inclusive recovery here. Both residents and community
organizations have worked actively to incorporate immigrants and their descendants into the culture of
the city. In the 1990s, the city implemented community policing strategies to make engagement more
inclusive and culturally sensitive. In 1997, residents and community activists established the Lowell
Southeast Asian Water Festival, which is a cultural festival that honors the traditional water
celebrations throughout Southeast Asia. Now, the Water Festival is one of the city’s most celebrated
annual events and brings tourists from all over to participate in the event.
Instead of segregation, Lowell has excelled in various ways of incorporating both people and culture
into the city. However, despite the progress, Cambodians are still not well represented in the city
council or throughout city government, which holds citywide elections as opposed to elections by wards
or neighborhoods.
The racial homeownership gap in Lowell fell by 19 rankings between 1990 and 2000. Though at the
moment, Lowell’s homeownership gap was on the higher end of our sample of cities, this change is a sign
of progress (which continues on after the period of recovery). In additional to increased employment
opportunities in the 1990s, one nonprofit - the Merrimack Valley Housing Partnership (MVHP)–
worked during this time period to provide home buying training and down payment assistance to first
time home buyers. MVHP also partnered with the Cambodian Mutual Assistance Association of Lowell
to specialize and target this training to the Cambodian population of Lowell.
Future Outlook
The city of Lowell is working to maintain the progress they made in the 1990s. Lowell maintains a
diverse economy, serving as the headquarters for another high-tech equipment manufacturer, with
Lowell General Hospital and UMass Lowell serving as other major employers. The city was recently
awarded an implementation grant through the Working Cities Challenge, a collaboration between the
Boston Fed and Living Cities to help create and maintain economic resurgence through civic
infrastructure in mid-sized New England cities. The city has seen some positive, but limited,
improvement in ethnic representation. Cambodian politicians represent Lowell at both the city and
state level. On January 1st, 2018, Vesna Nuon, a previous Cambodian councilor, was reelected to serve
on the City Council.93 Rady Mom was also recently elected to the Massachusetts House of
A P P E N D I X C 8 1
Representatives, representing the 18th Middlesex District, which covers part of Lowell. Mom is the first
Cambodian-American to be elected to the Massachusetts Legislature. Finally, the Lowell Development
and Financial Corporation and The Lowell Plan—two organizations influential in the recovery of the
1990s, continue to be active in the city.
Midland, Texas
Midland is a city in and the county seat of Midland County in West Texas. It is one of the fastest-
growing cities in the country and, as of 2016, it had a population of over 134,000, up from just over
111,000 in 2010. Its economic revitalization is rooted in the oil and natural gas boom in the Permian
Basin. The city’s economic success has been tethered to cyclic oil prices in recent decades. The most
severe bust in recent memory occurred in 1986 when oil prices dropped by a third and Midland County
lost 5 percent of its population. As oil prices rebounded, so did Midland’s economy.94 In recent years,
Midland’s Permian Basin oil fields have proven more resourced and resilient post-bust than their
neighbors, such as Eagle Ford.95
The economic opportunities created by the most recent boom have been broadly shared in
Midland—the rising tide of crude oil has “lifted all boats” by sheer force of the market. The
unemployment rate in Midland has been among the lowest in the country in recent years and housing
and construction are expanding rapidly to meet the demands of the growing labor market. New wealth
has led to a rise in philanthropic giving and strengthened private community foundations in the city and
region—the number of private foundations and charities in Midland County has grown from 97 in 1990
to 255 in 2013.96 The city is governed by a city council (four district members and two at-large
members), with a separately elected mayor who serves as the head of the city council. The council
appoints a city manager, who is tasked with day-to-day operation of the city.
Data Profile
According to our analysis, Midland experienced an economic recovery between 1990 and 2013 (table
C.10–C.13). During this period, it improved its ranking on economic health compared with other cities
in our sample through substantial improvements across all four of our economic health indicators. By
2013, it had the lowest unemployment rate of any city in our sample.
Between 1990 and 2013, Midland vaulted 96 rankings in our economic inclusion index and 118
rankings in our racial inclusion index. Midland’s improvement in economic inclusion during its recovery
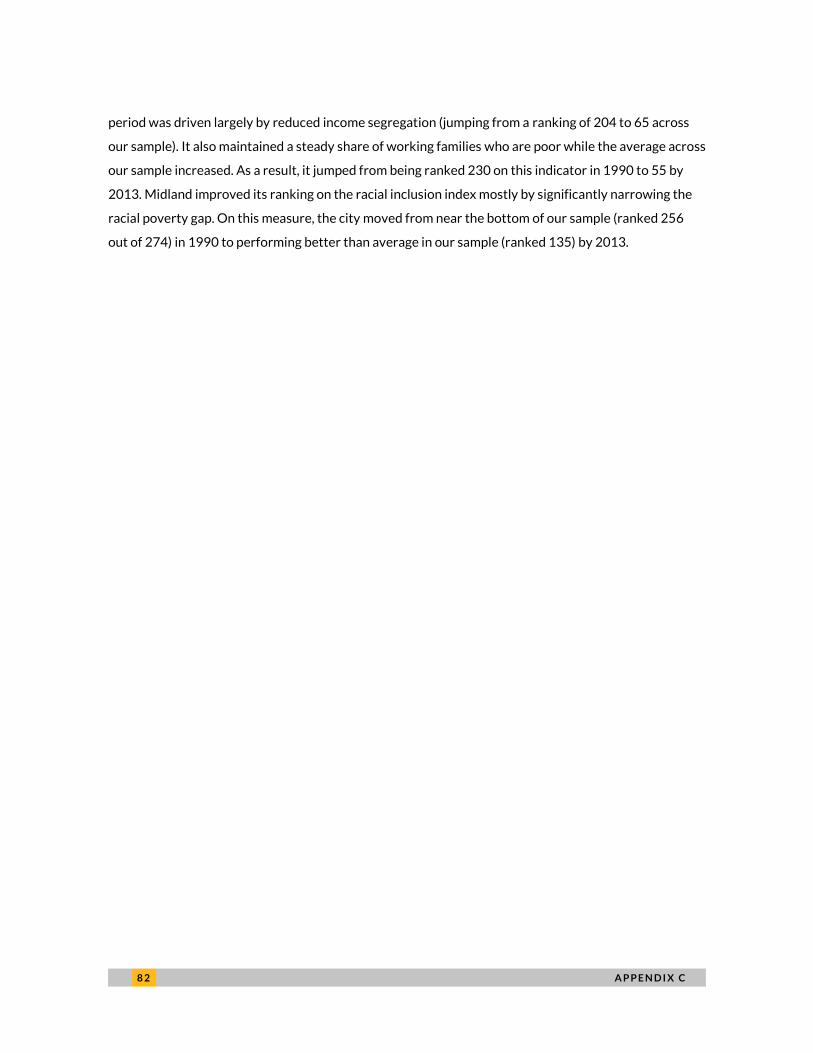
8 2 A P P E N D I X C
period was driven largely by reduced income segregation (jumping from a ranking of 204 to 65 across
our sample). It also maintained a steady share of working families who are poor while the average across
our sample increased. As a result, it jumped from being ranked 230 on this indicator in 1990 to 55 by
2013. Midland improved its ranking on the racial inclusion index mostly by significantly narrowing the
racial poverty gap. On this measure, the city moved from near the bottom of our sample (ranked 256
out of 274) in 1990 to performing better than average in our sample (ranked 135) by 2013.
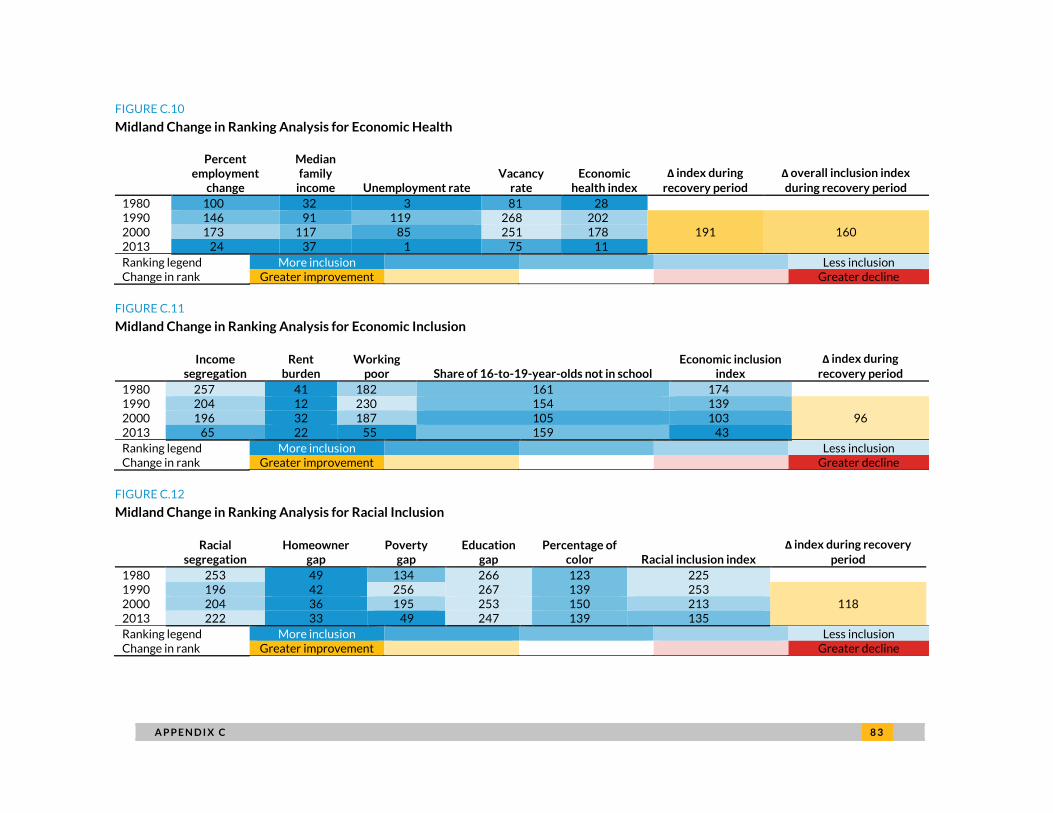
A P P E N D I X C 8 3
FIGURE C.10
Midland Change in Ranking Analysis for Economic Health
Percent employment
change
Median family
income Unemployment rate Vacancy
rate Economic
health index
Δ index during
recovery period
Δ overall inclusion index
during recovery period
1980 100 32 3 81 28 1990 146 91 119 268 202
191 160 2000 173 117 85 251 178 2013 24 37 1 75 11
Ranking legend More inclusion Less inclusion Change in rank Greater improvement Greater decline
FIGURE C.11
Midland Change in Ranking Analysis for Economic Inclusion
Income segregation
Rent burden
Working poor Share of 16-to-19-year-olds not in school
Economic inclusion index
Δ index during
recovery period
1980 257 41 182 161 174
1990 204 12 230 154 139 96 2000 196 32 187 105 103
2013 65 22 55 159 43
Ranking legend More inclusion Less inclusion Change in rank Greater improvement Greater decline
FIGURE C.12
Midland Change in Ranking Analysis for Racial Inclusion
Racial segregation
Homeowner gap
Poverty gap
Education gap
Percentage of color Racial inclusion index
Δ index during recovery
period
1980 253 49 134 266 123 225
1990 196 42 256 267 139 253 118 2000 204 36 195 253 150 213
2013 222 33 49 247 139 135
Ranking legend More inclusion Less inclusion Change in rank Greater improvement Greater decline

8 4 A P P E N D I X C
Drivers of Inclusive Recovery
ECONOMIC HEALTH
Midland’s economic recovery was driven by the boom in the oil and natural gas industry in the Permian
Basin (figure C.10). As new technologies allowed more resources to be extracted from the Permian
Basin, Midland’s economy skyrocketed. A sharp increase in the number of jobs since 2000 drove
unemployment to a national low of 2.4 percent and pulled the city’s median family income to over
$80,000 by 2013. Demand for even unskilled labor is so great that an oil field laborer with only a high
school degree can earn as much as $70,000 annually. Service-sector employers, such as restaurants and
retail, have in some cases increased wages to $16/hour and started offering benefits, such as free meals,
otherwise unable to retain employees.97 Construction companies, meanwhile, have reported significant
employee lost to oil-related industry, sometimes to such an extent that up to six months can be added to
project completion time.98
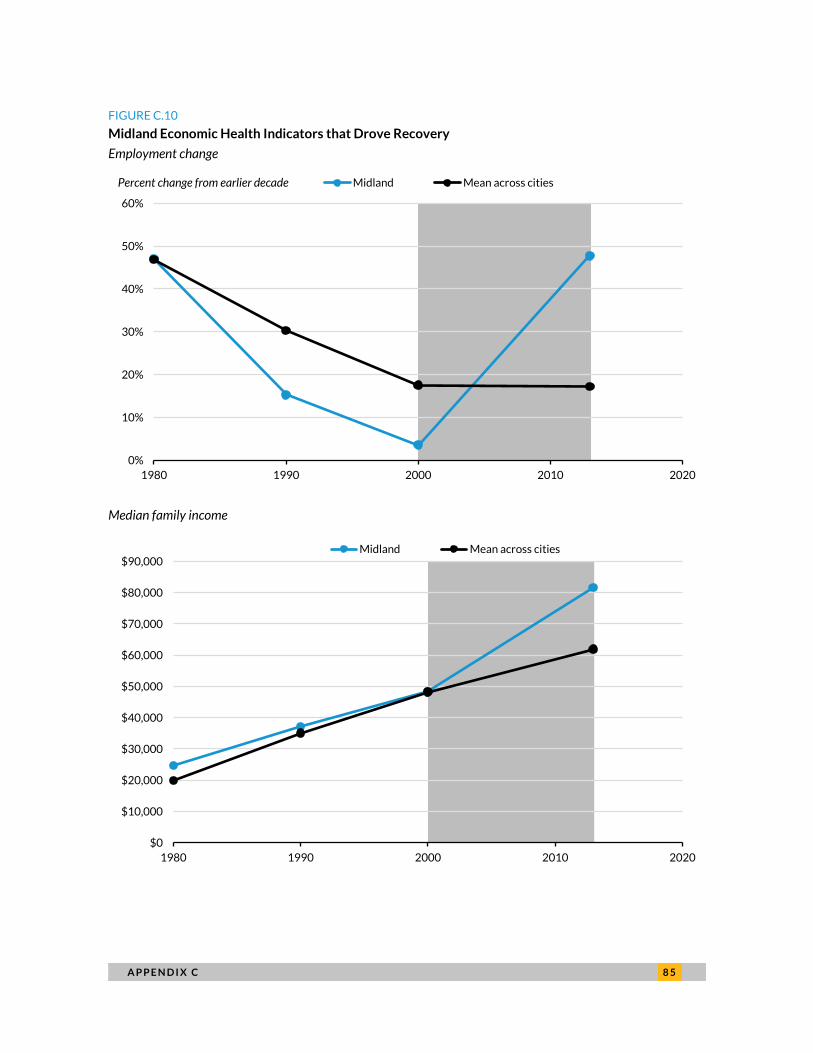
A P P E N D I X C 8 5
FIGURE C.10
Midland Economic Health Indicators that Drove Recovery
Employment change
Median family income
0%
10%
20%
30%
40%
50%
60%
1980 1990 2000 2010 2020
Midland Mean across citiesPercent change from earlier decade
$0
$10,000
$20,000
$30,000
$40,000
$50,000
$60,000
$70,000
$80,000
$90,000
1980 1990 2000 2010 2020
Midland Mean across cities

8 6 A P P E N D I X C
Vacancy rate
Unemployment rate
Source: Urban Institute analysis of US Census Bureau data, Decennial Census (1980, 1990, and 2000) and American Community
Survey (2011–15).
0%
2%
4%
6%
8%
10%
12%
14%
16%
1980 1990 2000 2010 2020
Midland Mean across cities
0%
1%
2%
3%
4%
5%
6%
7%
8%
9%
10%
1980 1990 2000 2010 2020
Midland Mean across cities
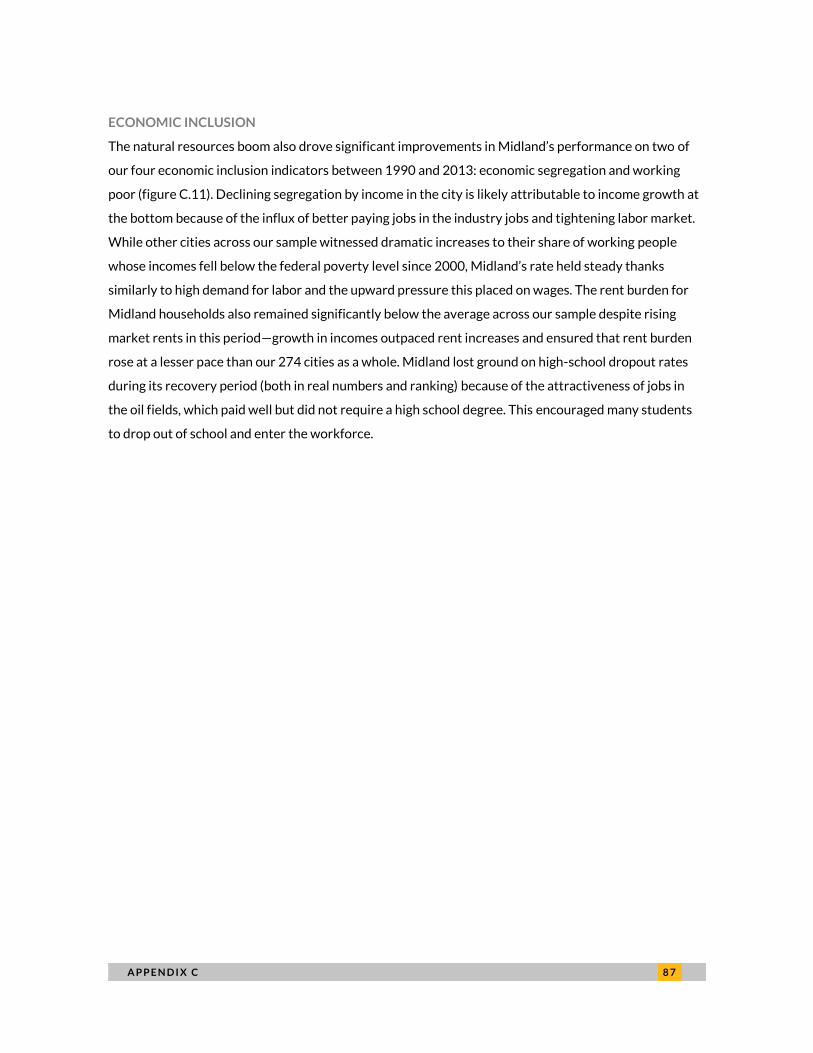
A P P E N D I X C 8 7
ECONOMIC INCLUSION
The natural resources boom also drove significant improvements in Midland’s performance on two of
our four economic inclusion indicators between 1990 and 2013: economic segregation and working
poor (figure C.11). Declining segregation by income in the city is likely attributable to income growth at
the bottom because of the influx of better paying jobs in the industry jobs and tightening labor market.
While other cities across our sample witnessed dramatic increases to their share of working people
whose incomes fell below the federal poverty level since 2000, Midland’s rate held steady thanks
similarly to high demand for labor and the upward pressure this placed on wages. The rent burden for
Midland households also remained significantly below the average across our sample despite rising
market rents in this period—growth in incomes outpaced rent increases and ensured that rent burden
rose at a lesser pace than our 274 cities as a whole. Midland lost ground on high-school dropout rates
during its recovery period (both in real numbers and ranking) because of the attractiveness of jobs in
the oil fields, which paid well but did not require a high school degree. This encouraged many students
to drop out of school and enter the workforce.
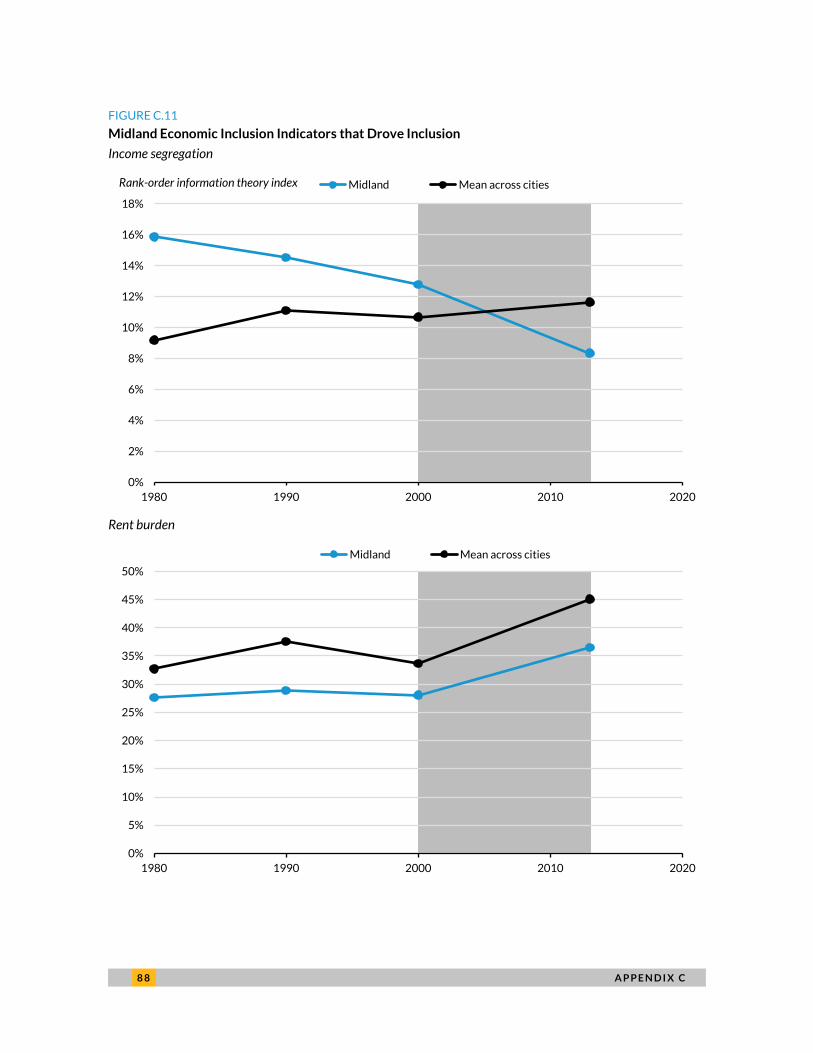
8 8 A P P E N D I X C
FIGURE C.11
Midland Economic Inclusion Indicators that Drove Inclusion
Income segregation
Rent burden
0%
2%
4%
6%
8%
10%
12%
14%
16%
18%
1980 1990 2000 2010 2020
Midland Mean across citiesRank-order information theory index
0%
5%
10%
15%
20%
25%
30%
35%
40%
45%
50%
1980 1990 2000 2010 2020
Midland Mean across cities
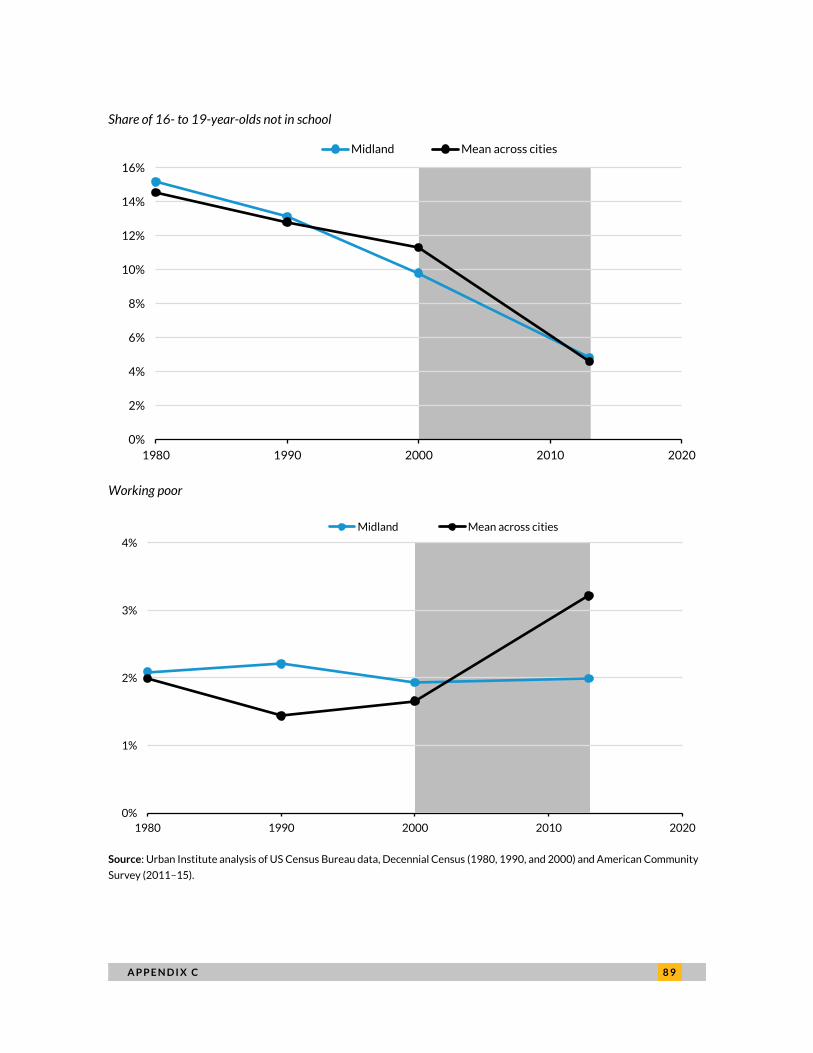
A P P E N D I X C 8 9
Share of 16- to 19-year-olds not in school
Working poor
Source: Urban Institute analysis of US Census Bureau data, Decennial Census (1980, 1990, and 2000) and American Community
Survey (2011–15).
0%
2%
4%
6%
8%
10%
12%
14%
16%
1980 1990 2000 2010 2020
Midland Mean across cities
0%
1%
2%
3%
4%
1980 1990 2000 2010 2020
Midland Mean across cities
9 0 A P P E N D I X C
RACIAL INCLUSION
Midland also made gains on our racial inclusion index. Competition among employers led to rising wages
and reduced the percentage of people of color living below the poverty level and significantly reduced
the racial poverty gap. Midland has also made modest progress in reducing the gap in educational
attainment between white people and people of color since 1990, however it remains significantly
below the average across our sample on this measure. The University of Texas at the Permian Basin
established the Falcon Promise Program in 2009, covering all tuition and mandatory fees of a four-year
degree for students from any family making $45,000 per year or less.99 Though this program expanded
access to four-year secondary education regardless of income, their effects may yet to show in our data,
as the first class receiving this only just graduated in our final year of analysis, 2013. A similar program,
started in 1986, pays tuition for any Midland County high school graduate with a GPA above a 2.75 and
participates in 40 hours of community service to attend the local community college, Midland
College.100
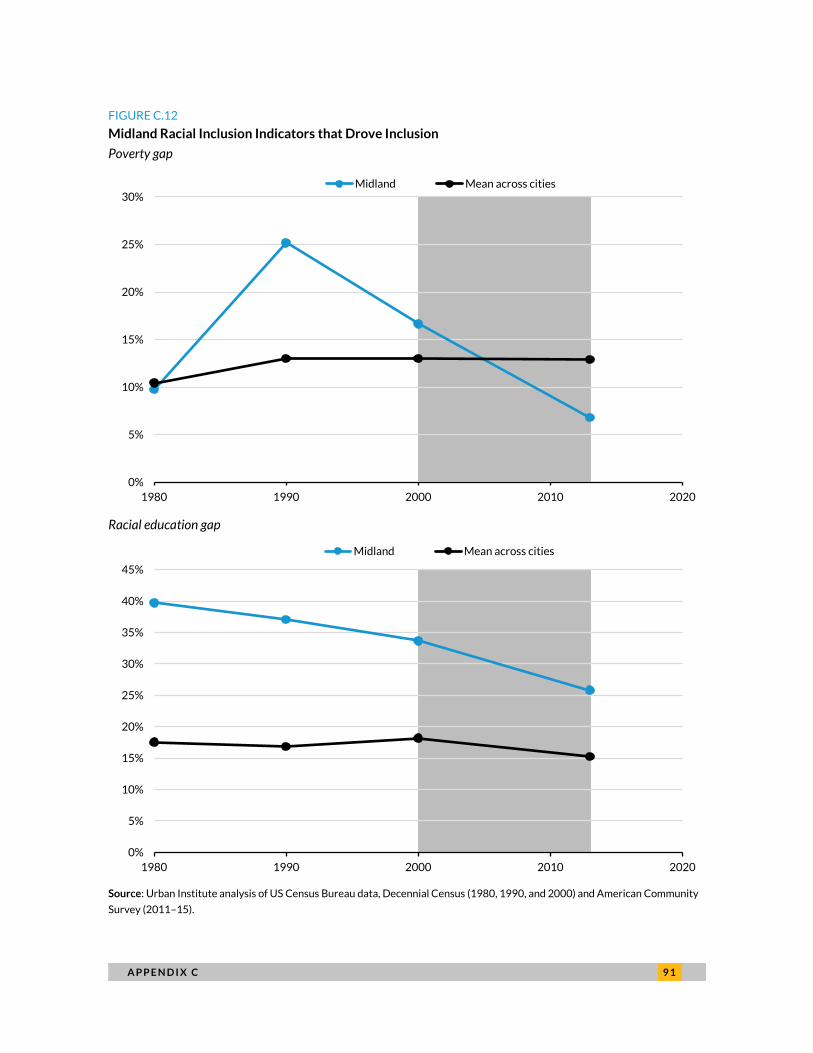
A P P E N D I X C 9 1
FIGURE C.12
Midland Racial Inclusion Indicators that Drove Inclusion
Poverty gap
Racial education gap
Source: Urban Institute analysis of US Census Bureau data, Decennial Census (1980, 1990, and 2000) and American Community
Survey (2011–15).
0%
5%
10%
15%
20%
25%
30%
1980 1990 2000 2010 2020
Midland Mean across cities
0%
5%
10%
15%
20%
25%
30%
35%
40%
45%
1980 1990 2000 2010 2020
Midland Mean across cities

9 2 A P P E N D I X C
Future Outlook
Since the discovery of oil in the Permian Basin in 1923, Midland and its surrounding region has
experienced economic boom and bust cycles in relation to the global price of oil and natural gas. In fact,
just beyond the scope of our data, 2015 saw a troubling near-bust shake the region as oil fell from
$100/barrel to a precipitous $30/barrel—7 percent of residents lost their jobs as a result (compared
with 9 percent of those in nearby Odessa). However, instead of seeing massive population loss and
destitution as in past busts, the large labor shortages in other sectors kept down unemployment long
enough for oil prices to rebound and the Permian Basin to again drive the region’s growth.101
Despite recent resilience, the region must be prepared to buoy itself with a diversified economy in
the event of longer-term oil market collapse in the future. Since Midland’s improvements on economic
and racial inclusion rely on low levels of unemployment and rising wages driven by oil and natural gas
extraction, it is vital that Midland take advantage of its prosperity to build resilient and inclusive
systems going forward.
Specifically, Midland must grapple with two key issues—education and housing—if it is to sustain
progress on racial and economic inclusion. The city’s schools are perennially ranked amongst the worst
in the state by the Texas Education Agency.102 In 2016, civic, business, philanthropic, and educational
leaders in Midland came together to launch Educate Midland, a collective impact initiative that focuses
on improving educational outcomes for all Midland students and attract quality teachers to the city’s
public schools.103 If Midland is able to ensure a strong workforce and ensure that its residents are
prepared to weather economic downturns in the future, it will need to continue to reinvest in human
capital.
Housing in Midland has also become less affordable in recent years. If population growth continues
at the current pace, the cost of housing could price out the regions’ low-skilled workers and less
economically advantaged. Though homeownership is still relatively affordable with a median home
price of $193,000 in 2017 (rising wages that have somewhat offset higher prices), the rental housing
market is precipitous, with average apartment rent increasing nearly 15 percent in the past 6 months
alone.104 Now might be the opportune time for investment in and preservation of affordable housing
stock.
Drawing upon its current economic prosperity and strong local foundations, Midland has a window of
opportunity to reinvest profits from natural resource extraction in its own future. After achieving large
gains in racial and economic inclusion alike without clear design or intention, Midland now has

A P P E N D I X C 9 3
enormous potential to purposefully build upon these successes and ensure an even brighter future for
all residents.

9 4 A P P E N D I X D
Appendix D. Convening Participants
ListLeon T. Andrews Jr. Director, race, equity, and leadership National League of Cities
Alan Berube Senior fellow and deputy director Brookings Institution Metropolitan Policy Program
Steven Bosacker Principal, public sector and partnerships Living Cities
Steven Brown Research associate Urban Institute
Carol Coletta Senior fellow, American cities practice Kresge Foundation
Lynnette Cook Executive director Community Research Partners
Kevin Coughlin Deputy director, department of planning & development City of Lowell
Colleen Dawicki Senior community development analyst Federal Reserve Bank of Boston
David Diaz Executive director Midland Community Development Corporation
Mark Funkhouser Publisher Governing Magazine (Former mayor of Kansas City, MO)
Solomon Greene Senior fellow Urban Institute
Jessie Grogan Program manager, urban development programs Lincoln Institute for Land Policy
Ned Hill Professor of public affairs and city and regional planning Ohio State University
Alicia Kitsuse Program director for older industrial cities The Funders Network for Smart Growth and Livable Communities
Amy Klaban Principal, strategic opportunities and project facilitator Move to Prosper
John B. Love III Councilman City of Midland
Christy McFarland Research director National League of Cities
Brady Meixell Research assistant Urban Institute
Erika C. Poethig Vice president and chief innovation officer and Institute fellow Urban Institute
Joseph Reagan Former President & CEO Greater Louisville Inc.

A P P E N D I X D 9 5
Sadiqa Reynolds President and CEO Louisville Urban League
Chantel Rush Program officer, American cities practice Kresge Foundation
Emily Ryder Perlmeter Community development analyst Federal Reserve Bank of Dallas
Luis D. Sanchez County commissioner Midland County
Ariel Simon Vice president and chief program and strategy officer Kresge Foundation
Tanaya Srini Research analyst Urban Institute
Christina Stacy Senior associate Urban institute
David Tandy Counsel Bingham Greenebaum Doll LLP (Former president, Louisville Metro Council)
Robin Toof Co-director, center for community research and engagement University of Massachusetts Lowell
Sarah Treuhaft Senior director PolicyLink
Carla Williams-Scott Director of department of neighborhoods City of Columbus
Veronika Zubo National event director Governing Magazine
9 6 N O T E S
Notes1 Alan Berube, “City and Metropolitan Income Inequality Data Reveal Ups and Downs through 2016,” Brookings
Institution, February 5, 2018. https://www.brookings.edu/research/city-and-metropolitan-income-inequality-
data-reveal-ups-and-downs-through-2016/.
2 “All-In Cities Policy Toolkit,” PolicyLink, accessed April 5, 2018, http://allincities.org/toolkit; Jessica Mendoza,
“Taxing the rich: how Seattle leads a ‘go-local’ trend in liberal politics, Christian Science Monitor,” August 2,
2017, https://www.csmonitor.com/USA/Society/2017/0802/Taxing-the-rich-how-Seattle-leads-a-go-local-
trend-in-liberal-politics.
3 Erika Poethig, Solomon Greene, Christina Stacy, Tanaya Srini, and Brady Meixell, “Measuring Inclusion in
America’s Cities,” Urban Institute, April 2018, https://apps.urban.org/features/inclusion.
4 Data were required back to 1970 for the employment growth measure in the economic health index since it
captures change over time.
5 In our analyses we define people of color as any person identifying in US Census Bureau records as black or
African American, American Indian and Alaska Native, Native Hawaiian and other Pacific Islander, other race
two or more races, or Hispanic or Latino white. Because of the lack of data in 1980, the number of Hispanic or
Latino whites in our racial education gap measure had to be imputed assuming equal distribution as in the overall
population for percentage of non-Hispanic or Latino whites in that year.
6 For similar reasons, we do not include poverty rate in our measure of economic inclusion. A low or declining
poverty rate in a city could suggest that very low–income households are either excluded or being displaced
from a city.
7 A census-designated place is an area grouped solely for statistical purposes and not under the purview of a self-
governing body. Thus, places such as, Honolulu, HI, are not included in this analysis.
8 For a full listing of cities and their inclusion scores, see Poethig et al., “Measuring Inclusion in America’s Cities,”
https://apps.urban.org/features/inclusion.
9 In assigning cities to a size category, we use the population in any observation year; therefore, cities can move
between categories if they gain (or lose) population across years.
10 We define a city’s “recovery period” as spanning from its last period of economic distress to its first period of
economic health.
11 In our sample, only Denver, Colorado, and Vancouver, Washington, were distressed at some point before 2008,
were classified as other in 2008, and moved to healthy by 2013. Both cities also experienced significant
improvements in their economic health after 2008, jumping 117 rankings (Denver) and 43 rankings (Vancouver)
on our economic health index between 2008 and 2013.
12 Discussion with Ned Hill, March 14, 2017.
13 Robin Toof, “Lowell City Presentation” Inclusive Recovery in US Cities convening, June 1, 2017.
14 For more information on the Lowell Plan, see http://www.lowellplan.org/.
15 Sara Rimer, “Hometown Recalls Paul Tsongas as Hero Who Inspired Renewal and Pride,” New York Times January
23, 1997, http://www.nytimes.com/1997/01/23/us/hometown-recalls-paul-tsongas-as-hero-who-inspired-
renewal-and-pride.html?mcubz=3.
16 Lucas Sullivan, ”Coleman’s 16-Year Legacy as Columbus Mayor,” Columbus Dispatch December 27, 2015,
http://www.dispatch.com/content/stories/local/2015/12/27/a-16-year-legacy.html.
N O T E S 9 7
17 Sullivan, “Coleman’s 16-Year Legacy as Columbus Mayor.”
18 See “Columbus’ Evolution, Decade by Colorful Decade,” Columbus Dispatch, February 10, 2012,
http://www.dispatch.com/article/20120209/NEWS/302099726; see also City of Columbus, 1993.
19 “Columbus Partnership Gains National Reputation,” Columbus CEO, June 1, 2015,
http://www.columbusceo.com/content/stories/2015/06/columbus-partnership-gains-national-reputation.html.
20 Discussion with Jerry Abramson, March 23, 2017.
21 Tabnie Dozier, “Urban League Restoring Pipeline for Minority Employment,” WHAS11 News, May 31, 2016,
http://www.whas11.com/news/local/urban-league-restoring-pipeline-for-minority-employment/225030344.
22 “Cross-sector Collaboration Is a Critical Tool for City Leaders,” National League of Cities, March 2, 2017,
http://www.nlc.org/article/cross-sector-collaboration-is-a-critical-tool-for-city-leaders.
23 “About the Intersector Project,” Intersector Project, accessed February 9, 2018,
http://intersector.com/about/the-intersector-project/.
24 Juan Sebastian Arias, “3 Ways that Cross-Sector Collaboration Helps Facilitate Community Investment,” Living
Cities (blog), December 13, 2013, https://www.livingcities.org/blog/402-3-ways-that-cross-sector-
collaboration-helps-facilitate-community-investment.
25 Our 2013 data indicate this share as 22.6 percent. See also Wachter, 2013.
26 “CMAA Programs,” Cambodian Mutual Assistance Association of Lowell, accessed February 9, 2018,
http://www.cmaalowell.org/wp/?page_id=1066; and conversation with Souvanna Pouv, March 17, 2017.
27 Ted Seifer, “Why Whites Control Lowell City Government,” ComonWealth Magazine, April 11, 2016,
https://commonwealthmagazine.org/politics/why-whites-control-lowell-city-government/.
28Jeffrey S. Passel and D’Vera Cohn, “Immigration Projected to Drive Growth in U.S. Working-Age Population
through at Least 2035,” Fact Tank (blog), Pew Research Center, March 8, 2017,
http://www.pewresearch.org/fact-tank/2017/03/08/immigration-projected-to-drive-growth-in-u-s-working-
age-population-through-at-least-2035/.
29 “What Works: A Mixed-Use Development of a Former Textile Mill in Lawrence, MA,” ICIC, accessed February 9,
2018, http://icic.org/public-private-partnerships/works-mixed-use-development-former-textile-mill-lawrence-
ma/.
30 “Lowell Waterways Redevelopment Rove,” National Park Service, last updated June 5, 2013,
https://www.nps.gov/lowe/planyourvisit/redevelopment-rove.htm.
31 “See the Lowell Southeast Asian Water Festival, website, http://lowellwaterfestival.org/; Robin Toof, “Lowell
City Presentation” Inclusive Recovery in US Cities convening, June 1, 2017.
32 Alexander Kent, “The 10 Most Oil-Rich States,” USA Today July 18, 2015,
https://www.usatoday.com/story/money/business/2015/07/17/24-7-wall-st-oil-rich-states/30307203/.
33 David Diaz, “Midland City Presentation” Inclusive Recovery in US Cities convening, June 1, 2017.
34 “Legacy Scholarship,” Midland College, accessed February 9, 2018, https://www.midland.edu/enrollment-
aid/paying-college/scholarships/legacy/index.php.
35 Dan Murtaugh, “The Oil Ghost Towns of Texas,” Bloomberg, September 26, 2017,
https://www.bloomberg.com/news/features/2017-09-26/the-oil-ghost-towns-of-texas.
9 8 N O T E S
36 “Inclusive Economic Development: Key Terms and Concepts,” Aspen Institute Economic Opportunities Program,
January 2016, https://assets.aspeninstitute.org/content/uploads/files/content/images/eop/InclEcoDev-
backgrounder.pdf.
37 Rebecca Hendrick and Yu Shi, “Is Local Government Fragmentation Good or Bad for Cities? These Indices Will
Help Inform the Debate,” LSE USCentre (blog), September 7, 2015,
http://blogs.lse.ac.uk/usappblog/2015/09/07/is-local-government-fragmentation-good-or-bad-for-cities-these-
indices-will-help-inform-the-debate/.
38 Bill Toland, “Louisville Becomes Lean, Less Mean after City/County Merger,” Pittsburgh Post-Gazette, September
7, 2003, http://old.post-gazette.com/localnews/20030907louisville0907p3.asp.
39 Discussion with Jerry Abramson, March 23, 2017.
40 “Five Massachusetts Cities Awarded a Total of $2.8 Million in the Boston Fed’s Working Cities Challenge,”
Federal Reserve Bank of Boston, June 1, 2016, https://www.bostonfed.org/news-and-events/press-
releases/2016/five-massachusetts-cities-awarded-a-total-of-2-8-million-in-the-boston-feds-working-cities-
challenge.aspx.
41 Kevin Coughlin, “Lowell City Presentation,” Inclusive Recovery in US Cities convening, June 1, 2017.
42 Alana Semuels, “The City That Believed in Desegregation,” Atlantic, March 27, 2015,
https://www.theatlantic.com/business/archive/2015/03/the-city-that-believed-in-desegregation/388532/.
43 Richard Florida, “How Diversity Leads to Economic Growth,” CityLab, December 12, 2011,
https://www.citylab.com/life/2011/12/diversity-leads-to-economic-growth/687/.
44 Kimberly Quick and Rebecca Damante, “Louisville, Kentucky: A Reflection on School Integration,” Century
Foundation, September 15, 2016, https://tcf.org/content/report/louisville-kentucky-reflection-school-
integration/.
45 Semuels, “The City that Believed in Desegregation,” Atlantic, March 27, 2015.
46 “Legacy Scholarship,” Midland College, accessed October 17, 2017, https://www.midland.edu/enrollment-
aid/paying-college/scholarships/legacy/index.php; “The Falcon Promise,” The University of Texas of the Permian
Basin, accessed October 17, 2017, https://www.utpb.edu/campus-life/financial-aid/types-of-financial-aid/the-
falcon-promise.
47 “Texas Permanent School Fund,” Accessed October 17, 2017, http://tea.texas.gov/psf/.
48 See the example of Jennings, Missouri, public schools, which draw upon local universities, food banks, and
businesses to supplement the services and programs they provide in their high poverty school district. See the
Jennings school district website, http://www.jenningsk12.org/.
49 “About Move to Prosper,” Move to Prosper, accessed February 8, 2018, https://www.movetoprosper.org/the-
project/.
50 “History,” Rebuilding Together, accessed February 9, 2018, https://rebuildingtogether.org/history.
51 “2015–2019 Consolidated Plan for Housing and Community Development.” City of Midland Office of
Community Development. March 6, 2016, http://www.midlandtexas.gov/DocumentCenter/Home/View/1293.
52 See the Lowell Southeast Asian Water Festival, website, http://lowellwaterfestival.org/.
53 Lyle Moran, “Lowell to Create ‘Little Cambodia’ District,” Lowell Sun April 7, 2011,
http://www.lowellsun.com/news/ci_17791809; and Kristi Palma, “Eating in Lowell’s Little Cambodia,”
Boston.com, March 19, 2014, https://www.boston.com/culture/new-england-travel/2014/03/19/eating-in-
lowells-little-cambodia.

N O T E S 9 9
54 Linda Silka. “What Maine Can Learn from How Lowell, Mass., Welcomed Immigrants, Rebuild Its City,” Bangor
Daily News, January 1, 2016, http://bangordailynews.com/2016/01/01/the-point/what-maine-can-learn-from-
how-lowell-mass-welcomed-immigrants-rebuilt-its-city/.
55 “West Louisville Strategies for Success,” LouisvilleKy.gov, accessed February 9, 2018,
https://louisvilleky.gov/government/louisville-forward/west-louisville-strategies-success-0.
56 Alicia Gatson, “Wood’s Transformative Influence Felt throughout Short North,” Urban Land Institute Columbus,
November 2, 2016, http://columbus.uli.org/news/woods-transformative-influence-felt-throughout-short-
north/.
57 Rick Rouan, “Columbus Too Generous with Short North Tax Breaks, Study Says,” Columbus Dispatch, July 20,
2017, http://www.dispatch.com/news/20170720/columbus-too-generous-with-short-north-tax-breaks-study-
says.
58 Mike Maciag, “Demographics Can Spell Trouble for a City’s Finances,” Governing Magazine, September 15, 2016,
http://www.governing.com/topics/finance/gov-census-demographics-cities-fiscal.html.
59 Kyle Scott Clauss, “What Ever Happened to CityScore: Mayor Walsh’s Marquee Metric Is Going National,” Boston
Magazine August 17, 2016, http://www.bostonmagazine.com/news/2016/08/17/boston-cityscore-national/;
“How Cities Score,” Economist, May 23, 2016, https://www.economist.com/news/special-report/21695194-
better-use-data-could-make-cities-more-efficientand-more-democratic-how-cities-score; see also, Boston’s
CityScore tool, https://www.boston.gov/cityscore.
60 Productivity, as measured by GMP (or GMP per capita) is generally only available at the metropolitan scale;
therefore, studies of city- or county-level economic health typically exclude this indicator.
61 See Erin Browne, “Know Your Indicators: Vacancy Measures,” US Department of Housing and Urban
Development, accessed April 2, 2018,
https://www.huduser.gov/portal/pdf/hsg_mrkt/Browne_Vacancy_Rates.pdf.
62 For example, Forbes Magazine uses vacancy rate in their annual index of the best places to rent. See Samantha
Sharf, “Indianapolis Is America’s Best City For Renters In 2017,” Forbes Magazine, March 8, 2017,
https://www.forbes.com/sites/samanthasharf/2017/03/08/indianapolis-is-the-best-city-for-renters-in-
2017/#6a15977f31ac.
63 “Topics,” World Bank, accessed April 2, 2018, http://www.worldbank.org/en/topic.
64 “Challenging Inequality,” Ford Foundation, accessed April 17, 2018,
https://www.fordfoundation.org/work/challenging-inequality/.
65 Rolf Pendall, “Rental Affordability: Multiple Measures for a Complex Concept,” Urban Wire (blog), Urban
Institute, assessed October 27, 2017, https://www.urban.org/urban-wire/rental-affordability-multiple-
measures-complex-concept; “Rental Burdens: Rethinking Affordability Measures,” PD&R Edge, assessed
October 27, 2017, https://www.huduser.gov/portal/pdredge/pdr_edge_featd_article_092214.html.
66 “Inclusive Growth,” OECD, assessed October 27, 2017, http://www.oecd.org/inclusive-growth/.
67 As this analysis only included up until 2010, Urban Institute calculated 2013 figures using Census Bureau ACS
2011–15 five-year estimates.
68Sean Posey, “Ohio’s Cloudy Future: The Decline of the ‘Big Eight’ and the Buckeye State,” The Hampton Institute
blog, August 22, 2013, http://www.hamptoninstitution.org/bigeight.html#.WdJYDluPJQJ.
69 Discussion with Bill LaFayette, December 12, 2017.
1 0 0 N O T E S
70 “We’re Number Three: Columbus’ Flourishing Fashion Industry,” Columbus Monthly, updated March 30, 2016,
http://www.columbusmonthly.com/content/stories/2016/03/were-number-three-columbus-flourishing-
fashion-industry.html.
71 Jennifer Stoffel, “Columbus, Ohio, After 20 Years, downtown Renewal,” New York Times, February 9, 2018,
http://www.nytimes.com/1988/09/18/realestate/focus-columbus-ohio-after-26-years-downtown-
renewal.html.
72 Discussion with Bill LaFayette, December 12, 2017.
73 On average, the full city sample increased its poverty gap 3 percent between 1980 and 1990, but Columbus
decreased it just shy of 2 percent. Its white poverty rate went from 13.2 to 13.7 percent in the decade and its
person of color poverty reduced from ~27 percent to ~26 percent.
74 Columbus’ Evolution, Decade by Colorful Decade,” Columbus Dispatch, February 10, 2012,
http://www.dispatch.com/article/20120209/NEWS/302099726.
75 Discussion with Bill LaFayette, December 12, 2017.
76 Mike Maciag, “Immigrants Establishing Roots in New Gateway Cities,” Governing Magazine, March 2016,
http://www.governing.com/topics/urban/gov-immigrant-friendly-cities.html.
77 June Soh, “Immigrants, Refugees Revive Depressed Neighborhood In Columbus, Ohio,” VOA News, September
14, 2017, https://www.voanews.com/a/immigrants-and-refugees-revive-depressed-neighborhood-in-
columbus-ohio/4028841.html; “Information about New Americans in Central Ohio,” City of Columbus, accessed
April 5, 2018, https://www.columbus.gov/Templates/Detail.aspx?id=2147494142.
78 Lynnette Cook, comments at Inclusive Recovery in U.S. Cities convening, June 1, 2017.
79 “The Winner: Columbus, Ohio,” US Department of Transportation, updated January 3, 2017,
https://www.transportation.gov/smartcity/winner.
80 Laura Bliss, “Columbus Wins the U.S. DOT’S Smart Cities Challenge,” CityLab, June 23, 2016,
https://www.citylab.com/transportation/2016/06/columbus-smart-cities-challenge/488429/.
81 The poverty rate for people of color increased over 8 percentage points between 2000 and 2013 but only about
4 percentage points for non-Hispanic whites during the same period, according to Urban Institute tabulations of
ACS and census data.
82 Bliss, “How Columbus is Using Transit to Reduce Infant Mortality;” “Infant Mortality Reports,” City of Columbus.
accessed April 5, 2018, https://www.columbus.gov/publichealth/programs/Office-of-Epidemiology/Infant-
Mortality-Reports/.
83 JoAnne Viviano and Rick Rouan, “Infant Mortality Rises in franklin County despite Millions Spent,” Columbus
Dispatch, March 5, 2017, http://www.dispatch.com/news/20170305/infant-mortality-rises-in-franklin-county-
despite-millions-spent.
84 “Matching Skilled Workers with Businesses in Need,” JP Morgan Chase & Co., February 9, 2018,
https://www.jpmorganchase.com/corporate/Corporate-Responsibility/columbus-skills-gap-report.htm.
85 Ned Hill, comments at Inclusive Recovery in US Cities convening, June 1, 2017.
86 “Justices Limit the Use of Race in School Plans for Integration,” New York Times, accessed October 23, 2017,
http://www.nytimes.com/2007/06/29/washington/29scotus.html; “The City That Believed in Desegregation,”
Atlantic Magazine, assessed October 23, 2017, https://www.theatlantic.com/business/archive/2015/03/the-city-
that-believed-in-desegregation/388532/.
N O T E S 1 0 1
87 To verify exactly where Louisville would rank would require a reanalysis and re-ranking of all our data holding all
city boundaries constant over time, which is not possible given Census data.
88 “Louisville Ranked a ‘Most Affordable Place to Live’”. Jefferson County PVA. February 9, 2018.
https://jeffersonpva.ky.gov/2015/09/30/louisville-ranked-a-most-affordable-place-to-live/.
89 For more information on 55,000 Degrees, see http://www.55000degrees.org/.
90 For more information on the 15,000 Degrees Initiative, see http://15000degrees.com/.
91 David Tandy, “Louisville-Jefferson County City Presentation,” Inclusive Recovery in US Cities convening, June 1,
2017.
92 See Gittell and Flynn (1995); Associated Press, “Southeast Asian Water Festival Brings Thousands to Lowell,”
Boston Herald, August 19, 2017,
http://www.bostonherald.com/news/local_coverage/2017/08/southeast_asian_water_festival_brings_thousand
s_to_lowell; Lor Chandara, “Lowell’s Cambodian Community Celebrates the Water Festival,” Cambodia Daily,
July 27, 2001, https://www.cambodiadaily.com/archives/lowells-cambodian-community-celebrates-the-water-
festival-24697/.
93 Kevin Coughlin, comments at Inclusive Recovery in U.S. Cities convening, June 1, 2017; Grant Welker, “Rady
Mom Makes History, Becoming First Cambodian Legislator by Taking Lowell Rep Race,” Lowell Sun, November 5,
2014, http://www.lowellsun.com/todaysheadlines/ci_26869561/.
94 “Oil Workers Who Stayed Help Midland Bounce Back,” Houston Chronicle, accessed October 4, 2017,
http://www.houstonchronicle.com/business/article/Oil-workers-who-stayed-help-Midland-bounce-back-
10908957.php?cmpid=premartcl.
95 “The Oil Ghost Towns of Texas,” Bloomberg, accessed October 4, 2017,
https://www.bloomberg.com/news/features/2017-09-26/the-oil-ghost-towns-of-texas
96 Figures based on Urban Institute analysis of NCCS data. “Data Archive,” National Center for Charitable Statistics,
accessed October 4, 2017, http://nccs-data.urban.org/data.php?ds=trend
97 “How Companies Attract the Best Employees—and How Competition Has Skewed the Playing Field,” Midland
Reporter-Telegram, accessed October 4, 2017, http://www.mrt.com/news/article/How-companies-attract-the-
best-employees-and-7406371.php.
98 Les Chrsitie, “6-Figure Oil Jobs Lead to Massive Shortage of Home Builders,” CNN Money, October 22, 2014,
http://money.cnn.com/2014/10/21/real_estate/oil-boom-construction-workers/index.html.
99 For more information on the Falcon Promise Program, see “The Falcon Promise,” University of Texas of the
Permian Basin, accessed April 5, 2018, http://www.utpb.edu/campus-life/financial-aid/types-of-financial-
aid/the-falcon-promise
100 For more information on the Midland Legacy Scholarship Program, see https://www.midland.edu/enrollment-
aid/paying-college/scholarships/legacy/index.php
101 David Hunn, “Oil Workers Who Stayed Help Midland Bounce Back,” Houston Chronicle, February 4, 2017,
http://www.houstonchronicle.com/business/article/Oil-workers-who-stayed-help-Midland-bounce-back-
10908957.php?cmpid=premartcl.
102 “TEA Releases List of Worst Schools in Texas,” NewsWest 9, accessed October 4, 2017,
http://www.newswest9.com/story/11689873/tea-releases-list-of-worst-schools-in-texas
103 For more information on Educate Midland, see “Mission,” Educate Midland, accessed April 5, 2018,
https://educatemidland.org/mission/.

1 0 2 N O T E S
104 “Midland Home Prices & Values,” Zillow, accessed October 4, 2017, https://www.zillow.com/midland-tx/home-
values/; “Rent Trend Data in Midland, Texas,” Rent Jungle, accessed October 4, 2017,
https://www.rentjungle.com/average-rent-in-midland-rent-trends/.

R E F E R E N C E S 1 0 3
References Acs, Gregory, Rolf Pendall, Mark Treskon and Amy Khare. 2017. “The Cost of Segregation: National Trends and the
Case of Chicago, 1990–2010.” Washington, DC: Urban Institute.
Ali, Ifzal, and Hyun Hwa Son. 2007. “Measuring Inclusive Growth.” Asian Development Review 24 (1): 11–31.
Allwinkle, Sam, and Peter Cruickshank. 2011. “Creating Smart-er Cities: An Overview.” Journal of Urban Technology
2: 1–16.
Bane, Mary Jo, and David T. Ellwood. 1991. “Is American Business Working for the Poor?” Harvard Business Review:
58–66.
Barbier, Edward. 2002. “The Role of Natural Resources in Economic Development.” Adelaide: University of
Adelaide Center for International Economic Studies.
Bischoff, Kendra, and Sean F. Reardon. 2013. “Residential Segregation by Income.” Providence, RI: Russell Sage
Foundation and Brown University.
Benner, Chris, and Manuel Pastor. 2016a. Equity, Growth, and Community: What the Nation Can Learn from America’s
Metro Areas. California: University of California Press.
Benner, Chris, and Manuel Pastor. 2016b. “Inclusive Economy Indicators: Framework and Indicator
Recommendations.” Los Angeles, CA: University of Southern California.
Benner, Chris, and Manuel Pastor. 2015. “Where to Go, What to Ask: Selecting and Designing the Case Studies.” In
Equity, Growth, and Community: What the Nation Can Learn from America's Metro Areas. Oakland, CA: University of
California Press.
Benner, Chris, and Manuel Pastor. 2012. Just Growth: Inclusion and Prosperity in America’s Metropolitan Regions. New
York: Routledge.
Berry, Christopher R., and Edward Glaeser. 2005. “The Divergence of Human Capital Levels Across Cities.” NBER
Working Paper Series no. 11617. Cambridge: National Bureau of Economic Research.
Berube, Alan, and Natalie Holmes. 2016. “The Metro Talent Competition: Attracting and Growing Highly Educated
Workers.” Washington, DC: Brookings Institution.
Brookings Institution Center on Urban and Metropolitan Policy. 2002. Beyond Merger: A Competitive Vision for the
Regional City of Louisville. Washington, DC: Brookings Institution.
Casey, Sadler Richard, and Highsmith Andrew R. 2016. “Rethinking Tiebout: The Contribution of Political
Fragmentation and Racial/Economic Segregation to the Flint Water Crisis.” Environmental Justice 9 (5): 143–51.
https://doi.org/10.1089/env.2016.0015.
Chapman, Chris, Jennifer Laird, Nicole Ifill, and Angelina Kewal Ramani. 2011. Trends in High School Dropout and
Completion Rates in the United States: 1972–2009. Washington, DC: US Department of Education.
Chetty, Raj, Nathaniel Hendren, Patrick Kline, and Emmanuel Saez. 2014. “Where Is the Land of Opportunity? The
Geography of Intergenerational Mobility in the United States.” Quarterly Journal of Economics 129 (4): 1,553–
623.
Child Trends. 2015. “High School Dropout Rates: Indicators of Child and Youth Well-Being.” Bethesda, MD: Child
Trends.
City of Columbus. 1993. Columbus Comprehensive Plan. City of Columbus.
1 0 4 R E F E R E N C E S
Corrigan, Mary Beth, Jack Hambene, William Hudnut III, Rachelle L. Levitt, John Stainback, Richard Ward, and
Nocile Witenstein. 2005. “Ten Principles for Successful Public/Private Partnerships.” Washington, DC: Urban
Land Institute.
Cunningham, Mary, and Audrey Droesch. 2005. “Neighborhood Quality and Racial Segregation.” Washington DC:
Urban Institute.
de Souza Briggs, Xavier, Rolf Pendall and Victor Rubin. 2015. “Inclusive Economic Growth in America's Cities:
What's the Playbook and the Score?” Washington, DC: World Bank Group.
Dirks, Susanne, Constantin Gurdgiev, and Mary Keeling. 2010. “Smarter Cities for Smarter Growth: How Cities Can
Optimize Their Systems for the Talent-Based Economy.” New York: IBM Institute for Business Value.
Dwyer, Christine M., and Kelly Ann Beavers. 2011. “Economic Vitality: How the Arts and Culture Sector Catalyzes
Economic Vitality.” Chicago: American Planning Association.
Einstein, Katherine Levine, David M. Glick, and Conor LeBlanc. 2017. 2016 Menino Survey of Mayors. Boston
University Initiative on Cities.
Feyrer, James Donald, Bruce Sacerdote, and Ariel Dora Stern. 2007. “Did the Rust Belt Become Shiny? A Study of
Cities and Counties That Lost Steel and Auto Jobs in the 1980s.” Brookings-Wharton Papers on Urban Affairs: 41–
89.
Fong, Eric. 1996. “A Comparative Perspective on Racial and Residential Segregation: American and Canadian
Experiences.” Sociological Quarterly 37 (2): 199–226.
Foster, Kathryn. 2001. Regionalism on Purpose. Cambridge, MA: Lincoln Land Institute.
Foster, Paul J. 2012. “Cambodia in the Mill City; The Place-Making Influence of an Urban Ethnic Enclave.” MA
thesis, Georgia State University.
Funders Network for Smart Growth and Livable Communities and the Federal Reserve Banks of Atlanta, Boston,
Chicago and New York. 2017. “Looking for Progress in America’s Smaller Legacy Cities: A Report for Place-
Based Funders.” Coral Gables, FL: Funders Network for Smart Growth and Livable Communities and the Federal
Reserve Bank of Chicago.
Gallagher, Megan, and Matthew Chingos. 2017. “Strategies for Supporting Early Reading Proficiency to Close
Achievement Gaps.” Washington DC: Urban Institute.
Goldschmidt, Pete, and Jia Wang. 1999. “When Can Schools Affect Dropout Behavior? A Longitudinal Multilevel
Analysis.” American Educational Research Journal 36 (4): 715–38.
Gittell, Ross J., and Patricia M. Flynn. 1995. “The Lowell High-Tech Success Story: What Went Wrong?” New
England Economic Review March/April: 57–71.
Glynn, Chris, and Emily B. Fox. 2017. “Dynamics of Homelessness in Urban America.” Ithaca, NY: Cornell
University.
Gray, Tom, and Robert Scardamalia. 2014. America’s Top Metros: Who's Leading the Recovery, and Why. New York:
Manhattan Institute Center for State and Local Leadership.
Greene, Solomon, Margery Austin Turner, and Ruth Gourevitch. 2017. “Racial Residential Segregation and
Neighborhood Disparities.” Washington, DC: US Partnership on Mobility from Poverty.
Hagan, Angela Stallings. 2009. “Race and City-County Consolidation: Black Voting Participation and Municipal
Elections.” PhD diss. University of Louisville dissertation.
Hancke, Gerhard P., Bruno de Carvalho e Silva, and Gerhard P. Hancke Jr. 2013. “The Role of Advanced Sensing in
Smart Cities.” Sensors 13 (1): 393–425.
R E F E R E N C E S 1 0 5
Hill, Edward, Harold Wolman, Katherine Kowalczyk, and Travis St. Clair. 2012. “Forces Affecting City Population
Growth or Decline: The Effects of Interregional and Inter-municipal Competition.” Rebuilding America's Legacy
Cities: New Directions for the Industrial Heartland, Alan Mallach, ed., 31–79. New York: American Assembly.
Hirschfield, A., and K.J. Bowers. 1997. “The Effect of Social Cohesion on Recorded Crime in Disadvantaged Areas.”
Urban Studies 34 (8): 1,275–95. https://doi.org/10.1080/0042098975637.
Hochschild, Jennifer, Jacqueline Chattopadhyay, Claudine Gay, and Michael Jones-Correa (eds). 2013. Outsiders No
More: Models of Immigrant Political Incorporation. New York: Oxford University Press.
Holloway, Steven R., Deborah Bryan, Robert Chabot, Donna M. Rogers and James Rulli. 1998. “Exploring the Effect
of Public Housing on the Concentration of Poverty in Columbus, Ohio.” Urban Affairs Review 33 (6): 767–89.
Intersector Project. 2016. “Research to Practice: Does Cross-Sector Collaboration Really Produce Better Results?”
Intersector Project. Brooklyn, NY: Intersector Project.
Jacobs, Gregory S. 1998. Getting Around Brown: Desegregation, Development, and the Columbus Public Schools.
Columbus: Ohio State University Press.
Johnston, Ron, Michael Poulsen, and James Forrest. 2007. “The Geography of Ethnic Residential Segregation: A
Comparative Study of Five Countries.” Annals of the Association of American Geographers 97 (4): 713–38.
JCHS (Joint Center for Housing Studies of Harvard University). 2017. The State of the Nation’s Housing. Cambridge,
MA: Joint Center for Housing Studies of Harvard University.
Kenyon, Daphne A., Adam H. Langley, Bethany P. Paquin, and Robert W. Wassmer. 2017. “Evaluation of Real
Property Tax Abatements in Franklin County, Ohio.” Cambridge, MA: Lincoln Institute of Land Policy.
Kijakazi, Kilolo, Rachel Marie Brooks Atkins, Mark Paul, Anne Price, Darrick Hamilton, William A. Darity Jr. 2016.
The Color of Wealth in the Nation’s Capital. Washington, DC: Urban Institute.
Kleiman, Neil, Liza Getsinger, Nancy Pindus, and Erika Poethig. 2015. Striking a (Local) Grand Bargain. Washington
DC: National Resource Network.
Kodrzycki, Yolanda, and Ana Patricia Muñoz. 2010. Lessons from Resurgent Cities. Federal Reserve Bank of Boston.
Lawson, Victoria, Jocelyn Drummond, Elizabeth DeWolf, Julia Bowling, and Qian Zhang. 2017. “Equality Indicators:
Measuring Change toward Greater Equality in New York City, Annual Report 2017.” New York: Institute for
State and Local Governance.
Leachman, Michael, Nick Albares, Kathleen Masterson, and Marlana Wallace. 2016. “Most States Have Cut School
Funding, and Some Continue Cutting.” Washington, DC: Center on Budget and Policy Priorities.
Levitan, Sar A., Frank Gallo, and Isaac Shapiro. 1993. Working but Poor: America’s Contradiction. Baltimore: Johns
Hopkins University Press.
Liu, Amy. 2016. Remaking Economic Development: The Markets and Civic of Continuous Growth and Prosperity. 2016.
Washington, DC: Brookings Institution.
Logan, John R., and Brian J. Stults. 2011. “The Persistence of Segregation in the Metropolis: New Findings from the
2010 Census.” Providence, RI: Russell Sage Foundation and Brown University.
Lotspeich, Katherine, Michael E. Fix, Dan Perez-Lopez, and Jason Ost. 2003. A Profile of the Foreign-Born in Lowell,
Massachusetts. Washington, DC: Urban Institute.
Mallach, Alan, and Lavea Brachman. 2013. Regenerating America’s Legacy Cities. Cambridge, MA: Lincoln Institute of
Land Policy.
Markusen, Ann, and Anne Gadwan. 2010. “Creative Placemaking.” Washington, DC: National Endowment for the
Arts.
1 0 6 R E F E R E N C E S
McFarland, Christina, and Michael A. Pagano. 2017. City Fiscal Conditions: 2017. Washington, DC: National League
of Cities.
McKinley, Terry. 2010. “Inclusive Growth Criteria and Indicators: An Inclusive Growth Index for Diagnosis of
Country Progress.” Manila: Asian Development Bank
Mead, Timothy D. 1994. “The Daily Newspaper as Political Agenda Setter: The Charlotte Observer and Metropolitan
Reform.” State and Local Government Review 26 (1): 27–37.
Metzger, John T. 1996. “The Theory and Practice of Equity Planning: An Annotated Bibliography.” Journal of
Planning Literature 11 (1): 112–26.
Mills, Karen G. 2015. Growth & Shared Prosperity. Boston: Harvard Business School.
OECD. 2015. The Metropolitan Century: Understanding Urbanisation and its Consequences.Paris: OECD Publishing.
———. 2016. Making Cities Work for All: Data and Actions for Inclusive Growth. Paris: OECD Publishing.
Office of Policy Development and Research. 2015. “Comprehensive Housing Market Analysis: Midland, Texas.”
Washington, DC: US Department of Housing and Urban Development.
Gianmarco I. P. Ottaviano, and Giovanni Peri. 2006. “The Economic Value of Cultural Diversity: Evidence from US
Cities.” Journal of Economic Geography, 6 (1): 9–44. https://doi.org/10.1093/jeg/lbi002.
Pacetti, Emily Garr. 2014. Growth & Opportunity: A Framework for Stronger, More Equitable Local and Regional
Economies.” Cleveland: Fund for Our Economic Future.
Pain, Kathy. 2008. “City-Regions and Economic Development.” In Connecting Cities: City-Regions, 23–47. Barcelona:
Metropolis.
Pew Research Center. 2016. “On Views of Race and Inequality, Blacks and Whites Are Worlds Apart: About Four-
in-Ten Blacks Are Doubtful that the U.S. Will Ever Achieve Racial Equality.” Washington, DC: Pew Research
Center.
PolicyLink and Marguerite Casey Foundation. 2016. “Immigrant Inclusion: Good for Families, Communities, and the
Economy.” Oakland, CA: PolicyLink.
PolicyLink and PERE (USC Program for Environmental and Regional Equity). 2016. The National Equity Atlas.
Ranieri, Rafel, and Raquel Almeida Ramos. 2013. “Inclusive Growth: Building Up a Concept.” Brazil: International
Policy Centre for Inclusive Growth.
Reardon, Sean F., and Kendra Bischoff. 2011. “Growth in the Residential Segregation of Families by Income, 1970–
2009.” Providence, RI: Russell Sage Foundation and Brown University.
Ross, Martha, and Nicole Prchal Svajenka. 2016. “Employment and Disconnection among Teens and Young Adults:
The Role of Place, Race, and Education.” Washington DC, Brookings Institution.
Rothstein, Richard. 2017. The Color of Law: A Forgotten History of How Our Government Segregated America. New
York: Liveright.
Ruther, Matt, Rebecca Tesfai, and Janice Madden. 2016. “Foreign-Born Population Concentration and
Neighbourhood Growth and Development within US Metropolitan Areas.” Urban Studies 55 (4): 826–43.
Sacramento Regional Research Institute. 2005. “2005 Prosperity Index: Measuring the Sacramento Region’s
Competitive Position.” Sacramento Regional Research Institute.
Schwartz, Mary and Ellen Wilson. 2008. “Who Can Afford to Live in a Home? A Look at Data from the 2006
American Community Survey.” Suitland, MD: US Census Bureau.
Shanton, Karen. 2014. “The Problem of African American Underrepresentation in City Councils.” New York:
Demos.

R E F E R E N C E S 1 0 7
Sharkey, Patrick. 2013. Stuck in Place: Urban Neighborhoods and the End of Progress Toward Racial Equality. Chicago:
University of Chicago Press.
Shearer, Chad, Alec Friedhoff, Isha Shah, and Alan Berube. 2017. “MetroMonitor 2017.” Washington, DC:
Brookings.
Silverman, Robert Mark, Jade Lewis, and Kelly L. Patterson. 2014. “William Worthy’s Concept of ‘Institutional Rape’
Revisited: Anchor Institutions and Residential Displacement in Buffalo, NY.” Humanity and Society 38 (2): 158–
81.
Spaulding, Shayne, and Martha C. Johnson. 2016. “Realizing Employment Goals for Youth through Digital Badges:
Lessons and Opportunities from Workforce Development.” Washington, DC: Urban Institute.
SRRI. 2005. “2005 Prosperity Index.” SRRI.
Stacy, Christina, Tanaya Srini, and Brady Meixell. Forthcoming. “Inequality versus Inclusion: How Well Does City-
Level Income Inequality Capture Shared Prosperity?” Working paper. Washington, DC: Urban Institute.
Svara. James H. and Watson, Douglas J. 2010. More than Mayor or Manager: Campaigns to Change Form of
Government in America’s Large Cities. Washington: Georgetown University Press.
Tobocman, Steve. 2014. “Revitalizing Detroit: Is There a Role for Immigration?” Washington, DC: Migration Policy
Institute.
Townsend, Anthony M. 2013. Smart Cities: Big Data, Civic Hackers, and the Quest for a New Utopia. New York: W.W.
Norton & Co.
Wachter, Jeff. 2013. “A 10-Year Perspective of the Merger of Louisville and Jefferson County, KY: Louisville Metro
Vaults From 65th to 18th Largest City in the Nation.” Baltimore: Abell Foundation.
Walker, David M., and Jack Schemenauer. 2014. “Immigrant Social-Economic Landscape Changes and Ethno-Racial
Border Formation in Columbus, Ohio.” Cleveland: Cleveland State University.
Wicks-Lim, Jeannette. 2012. “The Working Poor: A Booming Demographic.” New Labor Forum 21 (3): 16–25.
Wolman, Harold, Howard Wial, Travis St. Clair, and Edward Hill. 2017. Coping with Adversity: Regional Economic
Resilience and Public Policy. Ithaca, NY: Cornell University Press.
Wolman, Harold, Edward Hill, and Kimberly Furdell. 2004. “Evaluating the Success of Urban Success Stories: Is
Reputation a Guide to Best Practice?” Housing Policy Debate 15 (4): 965–97.
Wolman, Harold, Coit Cook Ford III, and Edward Hill. 1994. “Evaluating the Success of Urban Success Stories.”
Urban Studies 31 (6): 835–50.
Yellen, Janet. 2013. “Challenges Confronting Monetary Policy.” Washington, DC: Board of Governors of the
Federal Reserve System.
1 0 8 A B O U T T H E A U T H O R S
About the Authors Erika Poethig is vice president and chief innovation officer at the Urban Institute. She
leads the Research to Action Lab, an innovation hub serving decisionmakers and
creative thinkers eager to effect social change. Before joining Urban, Poethig was
acting assistant secretary for policy, development, and research at the US Department
of Housing and Urban Development.
Solomon Greene is a senior fellow in the Research to Action Lab and the Metropolitan
Housing and Communities Policy Center at the Urban Institute. His research focuses
on how land-use and housing policy can improve access to opportunity for vulnerable
groups and how data and technology can support more inclusive urban development.
Before joining Urban, Greene was a senior adviser at the US Department of Housing
and Urban Development a senior program officer at the Open Society Foundations.
Christina Stacy is a senior research associate in the Metropolitan Housing and
Communities Policy Center at the Urban Institute, where she specializes in urban
economics and applied econometrics. She is also a fellow with the Interdisciplinary
Research Leaders program, led by the University of Minnesota with support from the
Robert Wood Johnson Foundation.
Tanaya Srini is a research analyst in the Metropolitan Housing and Communities Policy
Center at the Urban Institute. She works on place-based research projects focusing on
several domestic and international issues, including school closures, resilience
planning, and public housing service delivery models.
Brady Meixell is a research assistant in the Metropolitan Housing and Communities
Policy Center at the Urban Institute. His research focuses on economic and racial
inequality within cities, expanding access to services for low-income families, and
place-based interventions to address poverty and related issues.

A B O U T T H E A U T H O R S 1 0 9
Steven Kreg Brown is an Urban Institute associate with the Research to Action Lab at
the Urban Institute. He researches programs that promote equality of opportunity
among urban residents, with a focus on housing practices and policies. Before joining
Urban, Brown was an analyst at Abt Associates.
Diana Elliott is a senior research associate in the Center on Labor, Human Services,
and Population, where she studies families’ financial security, economic mobility, and
asset building and debt. She was previously research manager of the Pew Charitable
Trusts’ work on financial security and economic mobility.
ST A T E M E N T O F I N D E P E N D E N C E
The Urban Institute strives to meet the highest standards of integrity and quality in its research and analyses and in
the evidence-based policy recommendations offered by its researchers and experts. We believe that operating
consistent with the values of independence, rigor, and transparency is essential to maintaining those standards. As
an organization, the Urban Institute does not take positions on issues, but it does empower and support its experts
in sharing their own evidence-based views and policy recommendations that have been shaped by scholarship.
Funders do not determine our research findings or the insights and recommendations of our experts. Urban
scholars and experts are expected to be objective and follow the evidence wherever it may lead.
2100 M Street NW
Washington, DC 20037
www.urban.org