Embed Size (px)
Citation preview

242 Journal of Tropical Forest Science 9(2): 242-270 (1996)
INCOME AND DIVERSITY TRADEOFFS FROM MANAGE-DIPTEROCARPS IN MALAYSIAMENT OF MIXED LOWLAND
C. Denise Ingram
USDA Forest Service, Forest Products Laboratory, Madison, WI 53705-2398, United States of America
&
Joseph Buongiorno
Department of Forestry, University of Wisconsin-Madison,United States of America
Received March 1996
1630 Linden Drive, Madison, Wisconsin,
INGRAM, C.D. & BUONGIORNO, J. 1996. Income and diversity tradeoffs frommanagement of mixed lowland dipterocarps in Malaysia. Short-run and long-runeffects of current management regimes in Southeast Asia were evaluated for theireconomic returns and diversity of tree size and species. A two-species (dipterocarp andnon-dipterocarp), seven size-class growth model was constructed to agree in the steady-state with data from old-growth lowland dipterocarp forests in Peninsular Malaysia.Three options for Southeast Asian forest management systems were evaluated andcompared to constrained optimum regimes. The evaluation criteria were the Shannon-Wiener index to measure diversity, minimum number of trees in any species-size class,soil rent, forest value, internal rate of return, and annual yield. Regimes were comparedin the steady-state (long-run) and during convergence (short-run) of stands ofdifferent initial conditions to the steady-state. Regimes that gave the highest economicperformance or maximum diversity in the steady-state also did so during conversion,for stands with either high or low initial basal area. To a great extent, the ability toharvest heavily and early in the conversion period determined the economic perfor-mance of a management regime. Among the regimes studied, a good compromisebetween economics and diversity was to cut mostly 30- to 40-cm trees of dipterocarpsand non-dipterocarps every 10 years. This would maintain some trees in all size andspecies classes. Financial returns would be comparable to those of other investmentsin Malaysia and similar to the highest yield under current management regimes, buttree diversity would be much higher.
Key words: Forest management - Malaysia - dipterocarps - soil rent - diversity -linear programming
INGRAM, C.D. & BUONGIORNO, J. 1996. Pendapatan dan kepelbagaian perdagangandaripada pengurusan dipterokarp pamah campuran di Malaysia. Kesan jangka pendekdan jangka panjang regim pengurusan semasa di Asia Tenggara telah ditaksirkan bagipulangan ekonomi dan kepelbagaian saiz pokok dan spesies sebuah model. Duaspesies (dipterokarpa dan bukan dipterokarpa), tujuh pertumbuhan kelas saiz telahdibina untuk disesuaikan dengan keadaan man tap dengan data daripada hutan pamahdipterokarpa pertumbuhan lama di Semenanjung Malaysia. Tiga pilihan sistempengurusan hutan Asia Tenggara ditaksirkan dan dibandingkan dengan regim opti-mum berkonstren. Indeks Shannon-Wiener merupakan kriteria pentaksiran untuk

Journal of Tropical Forest Science 9(2): 242-270 (1996) 243
mengukur kepelbagaian, bilangan minimum pokok daripada mana-mana kelas saizspesies, sewaan tanah, nilai hutan, kadar pulangan dalaman, dan basil tahunan.Regim-regim dibandingkan ketika keadaan mantap (jangka panjang) dan semasapemusatan (jangka pendek) dirian yang mempunyai keadaan awal yang berbezahinggalah kepada keadaan mantap. Regim yang menunjukkan prestasi ekonomitertinggi atau kepelbagaian maksimum di dalam keadaan mantap juga melakukannyasemasa tempoh perubahan, bagi kedua-dua dirian dengan luas pangkal pemula tinggidan rendah. Sehingga pada satu tahap, keupayaan untuk menebang dengan banyakdan awal semasa tempoh pertukaran menentukan prestasi ekonomi bagi regimpengurusan. Di antara regim yang dikaji, satu kompromi yang baik di antara ekonomidan kepelbagaian ialah untuk menebang kebanyakannya pokok-pokok dipterokarpadan bukan dipterokarpa bersaiz 30 hingga 40 cm setiap tahun. Ini dapat mengekalkansesetengah pokok di dalam semua kelas saiz dan spesies. Pulangan kewangan setandingdengan pulangan pelaburan lain di Malaysia dan sama dengan hasil tertinggi di bawahregim pengurusan semasa tetapi kepelbagaian pokok akan jauh lebih tinggi.
Introduction
One of the many challenges facing stewards of the world’s forests today is to managetheir resources sustainably. Attempts to take on this challenge will encouragecloser scrutiny of forest resource management policies and guidelines. Whetherthe approaches adopted use green certification of wood products, internationalcriteria and indicators of sustainable forest management, or some other programme,sustainability remains centered on the concern for balance between the needs ofpresent and future generations (World Commission on Environment and Develop-ment 1987). Further, there will be an attempt to find a balance among the differentbenefits produced by forests. Thus, the task in tropical and temperate forestmanagement will be to develop methods that address both the ecological andeconomic dimensions of forest resources.
The issue of whether existing natural forest management practices in tropicalcountries are the “best” strategies, if applied fully, becomes important in thisdiscourse, and it needs rigorous quantitative testing. Further, more attention needsto be given to broadening forest management analysis to include non-timber andnon-revenue objectives, including biological diversity. In some cases, the attain-ment of non-revenue goals need not be mutually exclusive of forest productiongoals (Buongiorno et al. 1994).
Selective tropical forest management systems, like their temperate counter-parts, depend critically upon the sustainable relationship between residual stock-ing and growth. The value of perpetually recurring future harvests is directlyaffected by the performance of a stand of trees after logging. Research hassuggested that existing selective systems do not allow sufficient release for tropicalspecies to obtain full growth potential (Miller 1981, Mendoza & Setyarso 1986,Appanah et al. 1990). The same studies indicated that evaluations based on existingmanagement systems may greatly underestimate the economic potential of tropicalforests. This is a critical issue, for the conservation of natural tropical forests may inpart depend on the economics of management.

244 Journal of Tropical Forest Science 9(2): 242-270 (1996)
The objective of this study was to compare some economic and biodiversitytrade offs of existing tropical forest management schemes, thus providing a basisfor selecting optimum management approaches to achieve financial and ecologi-cal goals. This report describes a matrix growth model for lowland dipterocarpforests of Peninsular Malaysia. Different management scenarios, based on existingselective management systems in Southeast Asia, are compared in the steady-state,using this growth model and linear-programming methods. The short-run effectsof converting different stands to sustainable management conditions are exploredas well.
Previous studies
Most forest management systems applied in tropical countries employ a type ofselective harvesting regime derived from systems of improvement fellings inMalaysia or timber stand improvement treatments in North America (Baur 1962).In Malaysia, the Malayan Uniform System (MUS) and the Selective ManagementSystem (SMS) are examples of the evolution of management systems that moveaway from the sheer mining of the tropical forest to its organisation for sustainableperpetual production. Variations of the SMS are by far the most prevalent inSoutheast Asia (e.g. Indonesian Selective Cutting System, or TPI, and SelectiveLogging in the Philippines). Some studies in the last decade have questioned theability of these regimes to sustain current yields in the future.
Appanah et al. (1990) analysed the MUS and SMS of Malaysia with empirical andphysiological process growth models. The results suggested longer rotations wererequired to achieve sustainable, natural dynamics of Malaysian dipterocarp forests.Mendoza and Setyarso (1986) applied linear programming to design alternativemanagement for Indonesia’s tropical forests and questioned the ability of the TPIto provide sustainable yields. They showed that, with their model, it would not bepossible to maintain the TPI prescribed minimum of 25 desirable trees per hectareafter logging. The same study analysed management alternatives in terms of theireffects on diameter distributions and harvest volumes, but not in terms of thecritical economic returns.
Other growth and yield studies have contributed to the understanding oftropical forest dynamics (Caillez 1974, Soemarna 1977, Jonkers 1982, Bustomi &Soemarna 1986, Hutchison 1986, Mendoza & Gumpal 1987, Kingston & Nir 1988,Vanclay 1989, Wan Razali 1989, Manokaran & LaFrankie 1990). Yet, the missinglink between these efforts and forest management planning has been the eco-nomic, and ecological, evaluation of different timber management practices.Methodologies developed for temperate forests provide a starting point for theanalysis of tropical forest systems.
The basic objective most commonly set forth in economic forest managementis to maximise net returns to fixed assets-land or forest. Matrix models, combinedwith linear programming, have been found useful for the analysis of economicobjectives. Buongiorno and Michie (1980), Michie and Buongiorno (1984), andMichie (1985) strengthened the matrix growth approach by making ingrowth a

Journal of Tropical Forest Science 9(2): 242-270 (1996) 245
function of the stand state. This led to the ability to predict the steady-statediameter distribution of a stand, a key concept in dealing with sustainability. As aresult, one could compute both the level of growing stock and the cutting cyclethat would maximise soil rent.
Buongiorno and Lu (1990) concluded that the optimal stocking and cuttingcycle in regulated versus non-regulated forests differed only for extreme values ofthe discount rate and fixed costs. Therefore, the cost of regulation was ignored inthis study. Other applications of matrix growth modeling and optimisation haveaddressed the costs and benefits of intermediate treatments such as loggingdamage on residual stands in East Kalimantan, Indonesia (Sianturi 1990), and therelationship between tree diversity and economic returns in temperate hardwoodsor mixed mountain forests (Buongiorno et al. 1994, 1995). The research reportedhere built on this experience with uneven-aged temperate forests to evaluatetropical forest management regimes.
A steady-state constrained matrix growth modelfor natural forests in Peninsular Malaysia
The growth model assumes that the state of a stand is defined by the number oftrees, of each species if the data are available, in predetermined size classes. Thegrowth of a tree from year t to t l+ 1 is measured by its probability of staying in thesame size class, ai, or moving into the next higher size class, bi+ 1 or dying, m i.Ingrowth is highly variable, but its expected value from t to t + 1 is influenced bythe stand state, in particular its density (Husch et al. 1972, Chapter 16). Ignoringtree species for the moment, for simplicity, the functional form of ingrowth is:
where β0 is the number of recruits independent of stand state and β1 is the effecton ingrowth of the stand density measured as basal area. B i is the basal area of atree in size class i, in which there are xi,t stems. The sign of β0 is positive, while thatof β1 is negative as ingrowth is dampened by increased basal area and thus,competition.
An n-size class growth model is then:
where G is a matrix of parameters that depend on the transition probabilities ai
and bi and the parameters of ingrowth β0 and β1 (Buongiorno & Michie 1980).The column vectors xt , and xt +1 , have entries xi,t and xt,t +1, which represent thenumber of trees in the ith size class, i= (1,2,3, . . . , n ) at year t and t+ 1. The columnvector ht represents the number of trees harvested from each size class in year t

246 Journal of Tropical Forest Science 9(2): 242-270 (1996)
and c is a constant vector= [β0 O...O]'. The general form of this model for standgrowth over p years is
Depending on the detail of the measurements available, different techniquescan be used to estimate the parameters of G and c (Michie & Buongiorno 1984, Lu1992). Yet, these methods failed with the data available for this study. Afterestimating G and c, model (2) with no harvest (ht = 0) yielded a steady-state that wastotally different from the state of undisturbed, old-growth lowland dipterocarpstands (Ingram 1995).
Therefore, a method was sought that would require few data and ensure apredicted steady-state equal to the one observed in climax tropical forests. Inthis approach, mortality and transitional growth rates are assumed independentof basal area. This seemed acceptable according to results of statistical tests withthis dataset (Ingram 1995). Also, the steady-state of a natural forest, xs such thatx t +1= xt= xs, for all t was assumed to be known. Knowledge of the mortality rates andof the steady-state led to the following expressions for the transition probabilities.
With seven size-classes, the probability that a tree stays alive in the largest size-class from t to t +l is
Then, the probability that a live tree in size-class 6 moves to size-class 7 must satisfy
and the probability that a live tree stays in size-class 6 is
By recursion we obtain

Journal of Tropical Forest Science 9(2): 242-270 (1996) 247
Therefore, all of the probabilities, a 1, . . . , a 7 and b2, . . . , b 7, are determined oncem and xs are known. Further, letting Is be the ingrowth in the steady-state, wemust have
and, since from equation (1)
β0 is defined, once a 1, and (β1 are known, by
Last, the parameter β1 can be estimated from a set of stands with observations oningrowth Ij and stand state xi by noting that
which shows that the difference in expected ingrowth between a given stand and thesteady-state stand is directly proportional to the difference in basal area. Equation(14), with an error term, allows estimation of β1, by ordinary least squares, and thenrecovery of β0 from equation (13).
The data to estimate the parameters came from ecological studies of lowlandevergreen rain forests conducted by the Forest Research Institute of Malaysia. Thered meranti-keruing forest type in the study area was located on relatively flat terrainand moderately well- to poorly-drained soils. Study plots were in mature to over-mature stands and representative of virgin forests (Wyatt-Smith 1966). Measure-ments, including the number of trees in 30-cm girth classes, were taken fromseventeen 1/2-acre transects of primary forest, two 1/2-acre transects of disturbedforest, and two 1/2-acre transects of secondary forest. The data were grouped into10-cm dbh classes on a per hectare basis for this analysis. All 21 plots were measuredthree times during the period 1947 to 1959, resulting in a total of 42 observations.
Economic and diversity values of tropical forest stands are affected strongly bytheir species composition, in addition to the diameter distribution. For purposes ofeconomic management, Southeast Asian trees can be categorised roughly asdipterocarps and non-dipterocarps, dipterocarps being the most valuable. Inprinciple, distinguishing between dipterocarps and non-dipterocarps is straight-

248 Journal of Tropical Forest Science 9(2): 242-270 (1996)
forward, within the model structure outlined by equations (1) and (2). The vectorsx and h and the corresponding matrices G and c are simply partitioned betweendipterocarps and non-dipterocarps. However, the Malaysian data did not containinformation on species composition, which had to be inferred from scarce obser-vations in the Philippines and Indonesia (Ingram 1995). Thus, in the followingdiscussion, the diameter distributions by size only are always more reliable thanthose by size and species.
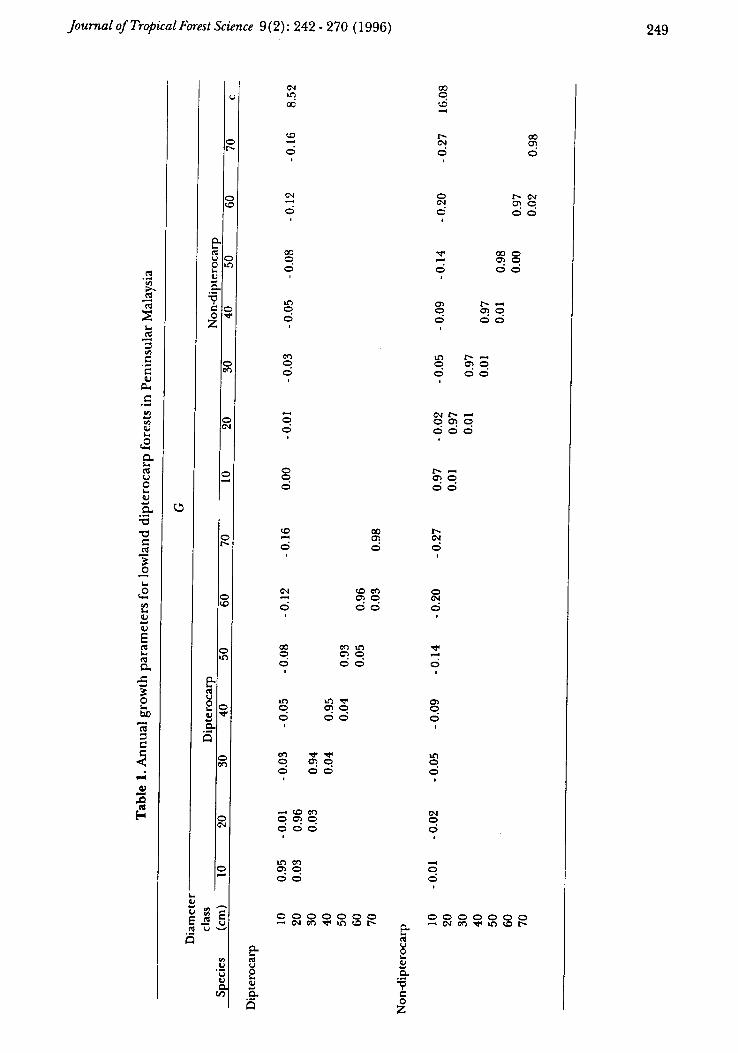
The parameters of the growth model with two species classes and p = 1 year areshown in Table 1. The parameter that measures the effect of stand basal area oningrowth, β1, had the expected negative sign, Which explains the negative param-eters in Table 1, but was not statistically significant for either species. The magni-tudes of the parameters in Table 1 are consistent with those in Wan Razali (1989),who found average annual diameter increments for dipterocarps 27%higher thanfor non-dipterocarps, for trees 10 cm dbh or larger, and ingrowth for non-dipterocarps more than 40% higher than for dipterocarps. Correspondingly, inTable 1 the probabilities of staying in a size-class (main diagonal) are larger for non-dipterocarp trees than for dipterocarps, and the ingrowth constant β0 is also largerfor non-dipterocarps.
Dynamic implications of the growth model
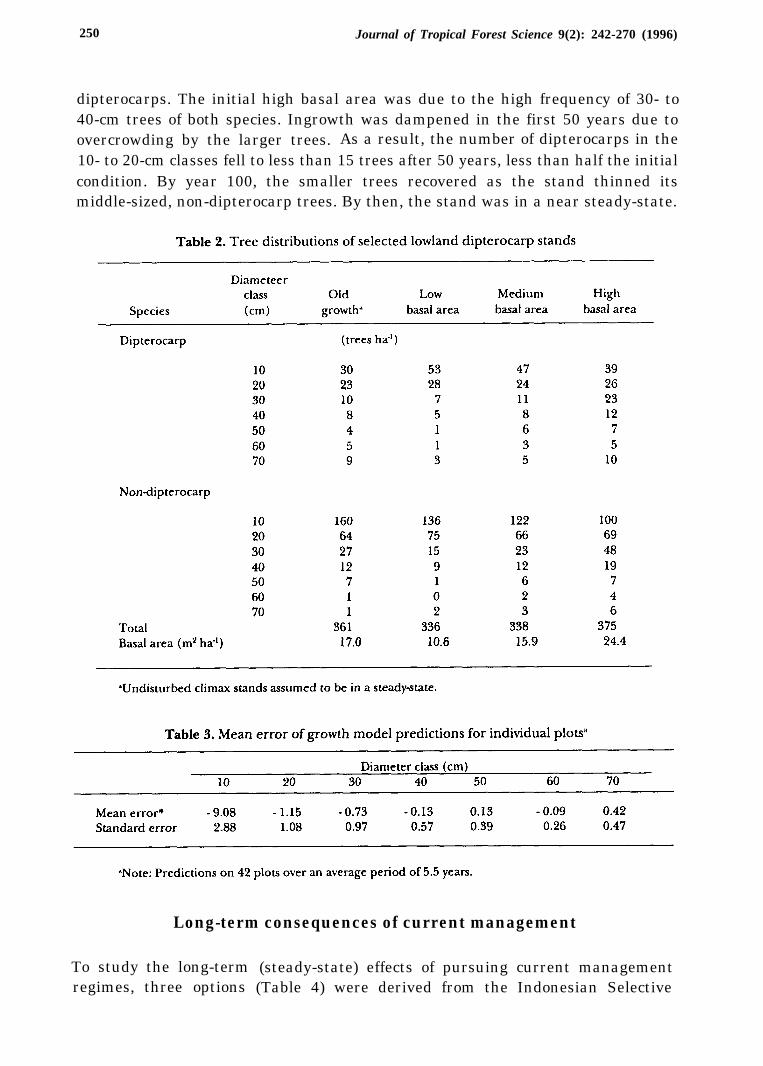
By construction, the model with the parameters in Table 1 predicts a steady-statethat matches that of old, disturbed stands (Table 2, second column). This is a usefulproperty since the model will be used extensively to compare regimes in the steady-state. The model also predicted correctly short-term growth on the plots for whichtwo measurements were available, although it tended to overestimate the numberof trees in the smallest size-class (Table 3). However, it is not easy to infer how themodel predictions converge to that steady-state (climax forest). To explore thesedynamics, three simulations were conducted. They predicted natural (undis-turbed) growth, by applying equation (2) with the parameters in Table 1 to standswith initially low, medium, or high basal area (Table 2).
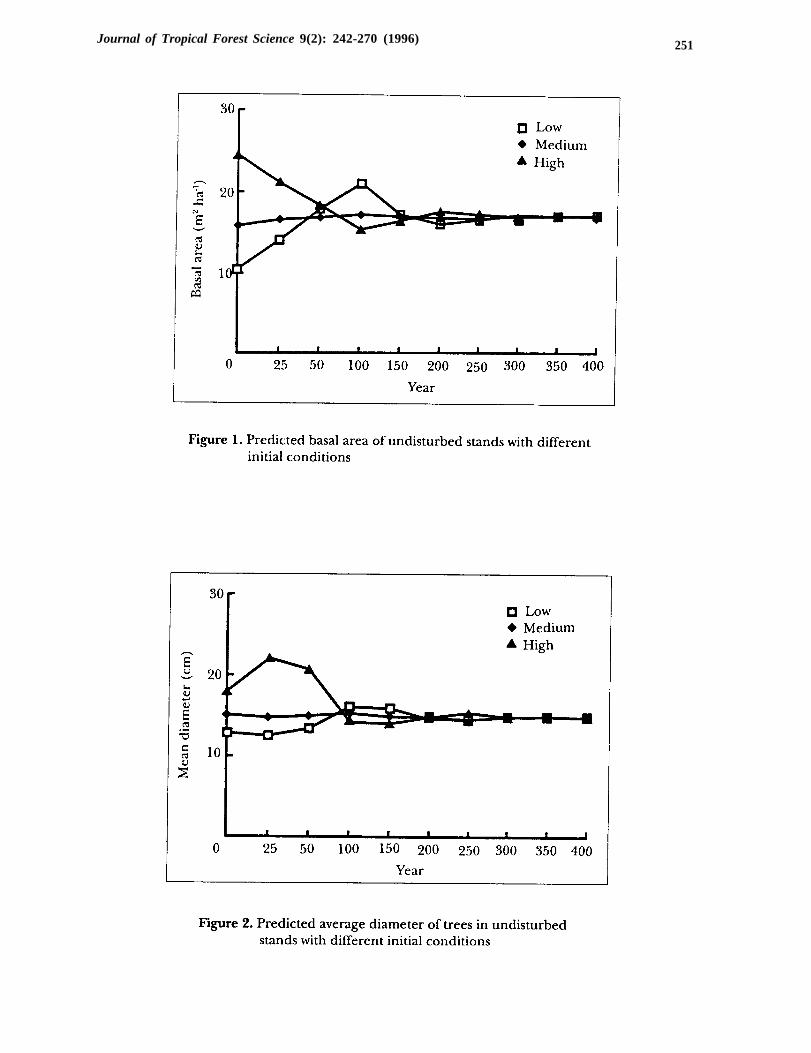
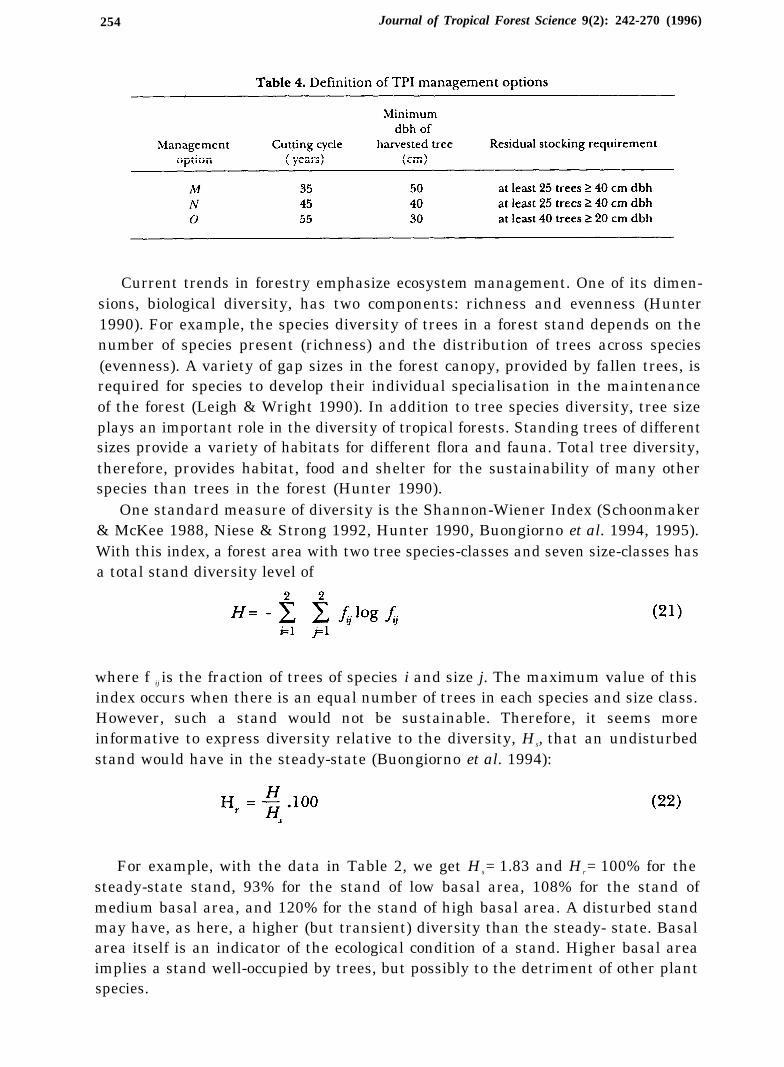
The predicted basal area converged to the steady-state, regardless of initialcondition, and exhibited only small changes before reaching that state (Figure 1).The stands of low and high initial basal area were near the steady-state after 150years. A steady decline in basal area of the high density stand and increases in theaverage tree size (Figure 2) suggested a heavy natural thinning of the smallest treesin the first 25 years. However, average tree size declined in the next 75 years, as totalstand basal area decreased gradually, with the recovery of vigorous growth in thesmallest size-class. The growth dynamics of the stand of low initial basal area wasnearly symmetric to that of the high initial basal area, with smaller changes inaverage tree size during the first 100 years.
Another aspect of stand dynamics is the evolution of species composition.Figure 3 shows the 100-year development of dipterocarps and non-dipterocarps,by size, in the stand of high initial basal area. Throughout the projection period,about two-thirds of the trees were nondipterocarps, but the largest trees were
250 Journal of Tropical Forest Science 9(2): 242-270 (1996)
dipterocarps. The initial high basal area was due to the high frequency of 30- to40-cm trees of both species. Ingrowth was dampened in the first 50 years due toovercrowding by the larger trees. As a result, the number of dipterocarps in the10- to 20-cm classes fell to less than 15 trees after 50 years, less than half the initialcondition. By year 100, the smaller trees recovered as the stand thinned itsmiddle-sized, non-dipterocarp trees. By then, the stand was in a near steady-state.
Long-term consequences of current management
To studyregimes,
the long-termthree options
(steady-state) effects of pursuing current management(Table 4) were derived from the Indonesian Selective
Journal of Tropical Forest Science 9(2): 242-270 (1996) 251

252 Journal of Tropical Forest Science 9(2): 242-270 (1996)

Journal of Tropical Forest Science 9(2): 242-270 (1996) 253
Cutting System1 (Tebang Pilih Indonesia-TPI) (Armitage & Kuswanda 1989). Here,the options are labeled M, N and O. The TPI options are defined broadly by threevariables: cutting cycle, minimum number of trees to remain in the stand afterharvest, and minimum size (diameter) for trees that may be harvested. TPI alsosuggests guidelines for stand improvement and replanting, which vary considerablywith the condition of each stand; however, for simplicity, and to reflect the realitiesof forest management in many tropical forests, these other activities were ignored.In this study, the TPI options were viewed as constraints. Another constraint was thatthe harvest must be sustainable, in perpetuity. Within these constraints it wasassumed that the maximum possible number of trees would be taken. Thus, themathematical interpretation of the TPI management regimes was the solution ofthe following linear programme:
where p is the cutting cycle, k is the diameter of the smallest tree that may beharvested under the TPI guide, and J is the minimum number of trees, withdiameters greater than or equal to l, that must remain in the stand after harvest(Table 4). Equation (16) is the growth equation (3) with the steady-state condition(xt = xt+p). The objective function implies that all trees that may be cut are cut.Economic and diversity criteria were then calculated for the solution of equations(15) through (20).
1lndonesia has modified the TPI and adopted other management regimes, such as the TPTI (Tebang Pilih TanamIndonesia - Indonesian Selective Cutting and Planting System), the THPA (Tebang Habis Permudaan Alam -Clearcutting with Natural Regeneration System), and the THPB (Tebang Habis Permudaan Buatan -Clearcuttingwith Planting System). The TPI system was selected for this analysis because it reflects a range of options thatencompass management in other countries, such as Malaysia.
254 Journal of Tropical Forest Science 9(2): 242-270 (1996)
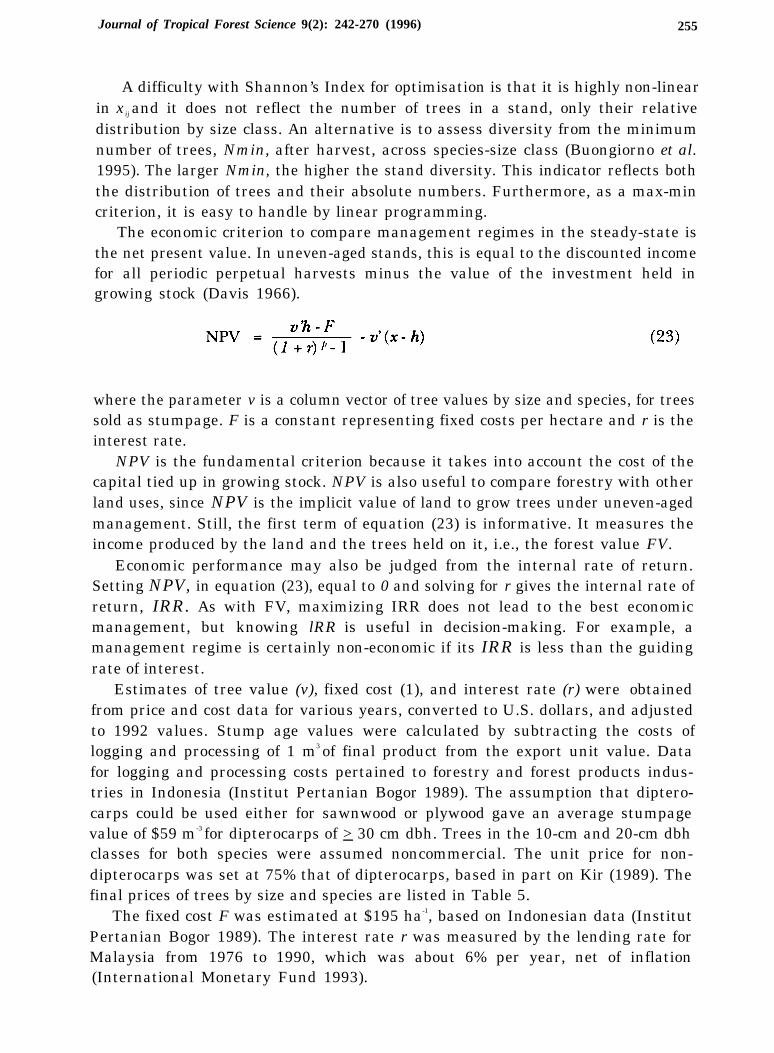
Current trends in forestry emphasize ecosystem management. One of its dimen-sions, biological diversity, has two components: richness and evenness (Hunter1990). For example, the species diversity of trees in a forest stand depends on thenumber of species present (richness) and the distribution of trees across species(evenness). A variety of gap sizes in the forest canopy, provided by fallen trees, isrequired for species to develop their individual specialisation in the maintenanceof the forest (Leigh & Wright 1990). In addition to tree species diversity, tree sizeplays an important role in the diversity of tropical forests. Standing trees of differentsizes provide a variety of habitats for different flora and fauna. Total tree diversity,therefore, provides habitat, food and shelter for the sustainability of many otherspecies than trees in the forest (Hunter 1990).
One standard measure of diversity is the Shannon-Wiener Index (Schoonmaker& McKee 1988, Niese & Strong 1992, Hunter 1990, Buongiorno et al. 1994, 1995).With this index, a forest area with two tree species-classes and seven size-classes hasa total stand diversity level of
where f ij is the fraction of trees of species i and size j. The maximum value of thisindex occurs when there is an equal number of trees in each species and size class.However, such a stand would not be sustainable. Therefore, it seems moreinformative to express diversity relative to the diversity, Hs, that an undisturbedstand would have in the steady-state (Buongiorno et al. 1994):
For example, with the data in Table 2, we get Hs= 1.83 and Hr= 100% for thesteady-state stand, 93% for the stand of low basal area, 108% for the stand ofmedium basal area, and 120% for the stand of high basal area. A disturbed standmay have, as here, a higher (but transient) diversity than the steady- state. Basalarea itself is an indicator of the ecological condition of a stand. Higher basal areaimplies a stand well-occupied by trees, but possibly to the detriment of other plantspecies.
Journal of Tropical Forest Science 9(2): 242-270 (1996) 255
A difficulty with Shannon’s Index for optimisation is that it is highly non-linearin x ij and it does not reflect the number of trees in a stand, only their relativedistribution by size class. An alternative is to assess diversity from the minimumnumber of trees, Nmin, after harvest, across species-size class (Buongiorno et al.1995). The larger Nmin, the higher the stand diversity. This indicator reflects boththe distribution of trees and their absolute numbers. Furthermore, as a max-mincriterion, it is easy to handle by linear programming.
The economic criterion to compare management regimes in the steady-state isthe net present value. In uneven-aged stands, this is equal to the discounted incomefor all periodic perpetual harvests minus the value of the investment held ingrowing stock (Davis 1966).
where the parameter v is a column vector of tree values by size and species, for treessold as stumpage. F is a constant representing fixed costs per hectare and r is theinterest rate.
NPV is the fundamental criterion because it takes into account the cost of thecapital tied up in growing stock. NPV is also useful to compare forestry with otherland uses, since NPV is the implicit value of land to grow trees under uneven-agedmanagement. Still, the first term of equation (23) is informative. It measures theincome produced by the land and the trees held on it, i.e., the forest value FV.
Economic performance may also be judged from the internal rate of return.Setting NPV, in equation (23), equal to 0 and solving for r gives the internal rate ofreturn, IRR. As with FV, maximizing IRR does not lead to the best economicmanagement, but knowing lRR is useful in decision-making. For example, amanagement regime is certainly non-economic if its IRR is less than the guidingrate of interest.
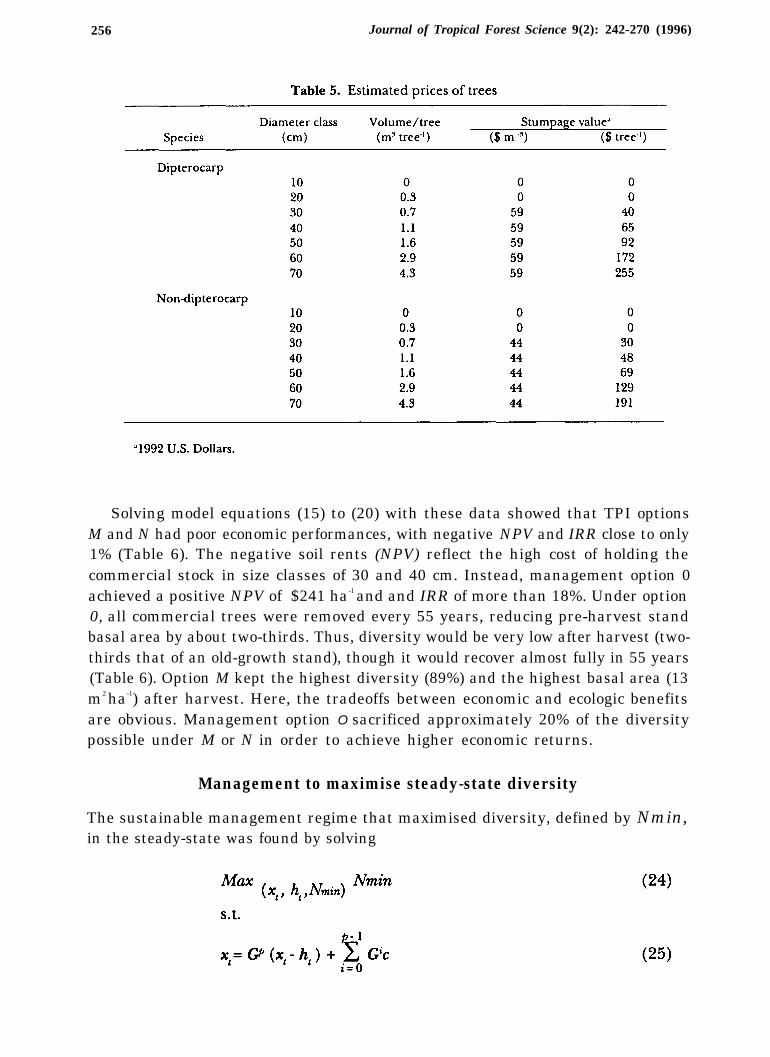
Estimates of tree value (v), fixed cost (1), and interest rate (r) were obtainedfrom price and cost data for various years, converted to U.S. dollars, and adjustedto 1992 values. Stump age values were calculated by subtracting the costs oflogging and processing of 1 m3 of final product from the export unit value. Datafor logging and processing costs pertained to forestry and forest products indus-tries in Indonesia (Institut Pertanian Bogor 1989). The assumption that diptero-carps could be used either for sawnwood or plywood gave an average stumpagevalue of $59 m-3 for dipterocarps of > 30 cm dbh. Trees in the 10-cm and 20-cm dbhclasses for both species were assumed noncommercial. The unit price for non-dipterocarps was set at 75% that of dipterocarps, based in part on Kir (1989). Thefinal prices of trees by size and species are listed in Table 5.
The fixed cost F was estimated at $195 ha-1, based on Indonesian data (InstitutPertanian Bogor 1989). The interest rate r was measured by the lending rate forMalaysia from 1976 to 1990, which was about 6% per year, net of inflation(International Monetary Fund 1993).
256 Journal of Tropical Forest Science 9(2): 242-270 (1996)
Solving model equations (15) to (20) with these data showed that TPI optionsM and N had poor economic performances, with negative NPV and IRR close to only1% (Table 6). The negative soil rents (NPV) reflect the high cost of holding thecommercial stock in size classes of 30 and 40 cm. Instead, management option 0achieved a positive NPV of $241 ha-1 and and IRR of more than 18%. Under option0, all commercial trees were removed every 55 years, reducing pre-harvest standbasal area by about two-thirds. Thus, diversity would be very low after harvest (two-thirds that of an old-growth stand), though it would recover almost fully in 55 years(Table 6). Option M kept the highest diversity (89%) and the highest basal area (13m2 ha-1) after harvest. Here, the tradeoffs between economic and ecologic benefitsare obvious. Management option O sacrificed approximately 20% of the diversitypossible under M or N in order to achieve higher economic returns.
Management to maximise steady-state diversity
The sustainable management regime that maximised diversity, defined by Nmin,in the steady-state was found by solving

Journal of Tropical Forest Science 9(2): 242-270 (1996) 257
where the objective is to maximise the minimum number of trees in any species-size class after harvest, in the steady-state.
The highest Nmin was achieved with a cutting cycle of 5 years (Table 7).Shannon’s diversity index after harvest was 78% of that in old-growth standsbecause the distribution of trees among species would be more uneven than thatin an old-growth stand (Table 2). Although maximizing Nmin left trees in all sizeclasses, Shannon’s index was worse than that under TPI options M and N, which leftno tree of size 50 cm and above (Table 6). This shows the limitations of Shannon’sindex as an index of diversity. Here, Nmin seems to be a better indicator of how richa stand is in trees of all species and sizes. So, maximizing Nmin did lead to a diverse

258 Journal of Tropical Forest Science 9(2): 242-270 (1996)
stand, but economic performance was very poor (worse than any TPI option)because the solutions called for cutting only a few of the smallest dipterocarps of nocommercial value. NPV, FV, and IRR were all negative (Table 7).
To improve economic performance, the next solution maximised diversity(Nmin) with the requirement that the IRR be at least 6%. The objective was toachieve the highest level of diversity in the steady-state and maintain an investmentin trees competitive with the rest of the Malaysian economy. This was obtained byintroducing equation (23) as a constraint in model (24) to (27), with NPV= 0 andr= IRR = 0.06 y-1. With this constraint, the best cutting cycle was longer (10 years),Nmin was reduced by about one-third (although trees still remained in every sizeclass), and Shannon’s index was reduced to 72% of old-growth stands (Table 8).However, economic returns were much improved, leading to a forest value of$10’70 ha-l from 2 m3 ha-1 y-1 of commercial yields (Table 8). Most of the cut was inthe 30-cm diameter class of both species.

Journal of Tropical Forest Science 9(2): 242-270 (1996) 259
Management to maximise steady-state income
The steady-state that maximised net present value, NPV, or soil rent, was found bysolving
(Buongiorno & Michie 1980).

260 Journal of Tropical Forest Science 9(2): 242-270 (1996)
The best steady-state under this strategy (Table 9) was obtained by harvesting all30- and 40-cm trees every 5 years. The NPV of this management was $1433 ha-1, sixtimes that of the best TPI option. The IRR was undefined because the residual stockhad no value. The high fixed cost of harvesting the stand frequently (every 5 years)was offset by the removal of close to 20 trees ha-1 worth $489 at each harvest.Commercial yields of 2.6 m3 ha-l y-1 were gained, again at the expense of diversity,which was only 64% that of an old-growth stand. After harvest, no tree larger than20 cm was left in the stand. Residual basal area was low (10 m2 ha-1), but still higherthan under the most economic TPI option, 0. These results should be viewed withcaution because of the heavy logging damage that might result in stands harvestedso frequently. If the damage costs were included, these attractive economic returnswould be lower (Sianturi 1990).

Journal of Tropcal Forest Science 9(2): 242-270 (1996) 261
Conversion to the steady-state
Up to this point, steady-state analysis was used to find management practices thatachieved sustainable economic and ecological goals. Then, we evaluated the gainsand losses due to converting different stands to the steady-state. First, the TPImanagement options were applied to stands of low and high initial basal areas(Table 2) by harvesting everything within the limits of each option. The conse-quences were described by the diversity of the stand after each harvest and by thepresent value of the income received during and after conversion. Next, regimesdefined by optimal steady-states were evaluated, including the steady-state thatmaximised Nmin, income, and Nmin with an internal rate of return of 6%.
Despite its limitations, the Shannon-Weiner Index, relative to average unmanagedstands, was maintained as an indicator of diversity during conversion to the steady-state, in addition to the minimum number of trees in any species-size class, whichseemed to be a better index of the stand diversity. The income from converting thestand to the steady-state is
where the period of conversion is equal to the length of the cutting cycle, p,times the number of cutting cycles, T. For an initial stand condition, x 0, the netpresent value during the conversion is the sum of the discounted value of allharvests from t = 0, 1, 2, . . . , T- 1, net of costs. Once the stand is in the steady-state,it produces a constant periodic perpetual harvest of which the present value isadded to that of conversion harvests to yield the forest value, FV For a given initialcondition and harvest regime, FV is the forest value at time zero, inclusive of landand initial growing stock.
Conversion with TPI management options
The long-term effects of options M, N and 0 (Table 4) were simulated withstands of low or high initial basal area (Table 2). The simulated management cutall trees in and above the minimum diameter class, as long as the number ofremaining trees met the requirements. If the number of trees exceeded the desirednumber for the residual stand, the higher-valued dipterocarps were cut beforethe non-dipterocarp trees. Stands with too few trees were left uncut until thebeginning of the next cutting cycle.
The results of applying the TPI options, in terms of yield, income, and diversityduring conversion, are shown in Table 10. The conversion to the steady-state tookapproximately 4 to 5 cutting cycles, i.e. 175 to 220 years, for all options. But, theeconomic and ecological consequences differed markedly between options.

262 Journal of Tropical Forest Science 9(2): 242-270 (1996)
Option 0 produced substantially more yield compared to options M and Nduring conversion; the higher yields led to a FV 10 to 17 times greater than M or Nfor stands of low initial basal area. Here, the initial condition of the stand was a majorfactor, as well as the minimum diameter limit. Not only did harvesting occur early,but trees as small as 30 cm in diameter were cut. The high economic returns ofoption 0, however, were gained at the expense of diversity. The average Shannon’sIndex was less than 70% that of an average old-growth stand and about 20% lessthan that under options M or N. Also, the ratio of economic gains under option Oto the gains from M or N dropped to less than 2:1, with a stand of high initial basalarea.
The relative performance of TPI management options for economic or ecologiccriteria was the same in the steady-state (Table 6) as during conversion (Table 10).The TPI option that achieved the highest economic returns in the steady-state,option 0, also led to the highest economic return during conversion. Averageannual yield, Hr, and Nmin were almost the same during conversion as they were inthe steady-state, regardless of the initial state. The best choice of management forecological benefits during conversion, was either M or N, regardless of initial state,which is also coherent with the steady-state results.
Conversion with optimal steady-state cutting guides
The consequences of conversion with cutting guides defined by the steady-statesthat maximised economic returns, diversity, or a combination of the two were alsoinvestigated. The steady-state solution x* and h* defined the stem distribution of

Journal of Tropical Forest Science 9(2): 242-270 (1996) 263
the residual stand, x* - h*, that gave a desired result in perpetuity. The conversionconsisted of cutting back a stand to this level at intervals equal to the best steady-statecutting cycle, p, until the desired steady-state was obtained.
The results are summarised in Table 11. Cutting guides that maximised eco-nomic returns (Table 9), or maintained at least a 6% return on investment (Table8), gave incomes from stands of high initial basal area 3 to 4 times those of standsof low initial basal area. The regime that maximised diversity (Table 7) generateda FV from the stand with high initial basal area 90 times that of the poorly stockedstand. Average yields during conversion were similar to those of the steady-state, forall guides and initial states. For the stand with high initial basal area, choosing TPIoption 0, instead of the one that maximised NPV in the steady-state, led to nearlythe same forest value. But option 0 led to a much lower FV for a stand of low initialbasal area.
The diversity of the stands converted with the optimal steady-state cuttingguides ranged from 64 to 81% according to Hr. These management optionsranked the same regardless of the initial state. Diversity levels measured by Nminranked the same as measured by Hr; therefore, the optimal steady-state regimethat maximised diversity led to the highest diversity during conversion. This wastrue regardless of the initial state.

264 Journal of Tropical Forest Science 9(2): 242-270 (1996)
Journal of Tropical Forest Science 9(2): 242-270 (1996) 265

266 Journal of Tropical Forest Science 9(2): 242-270 (1996)
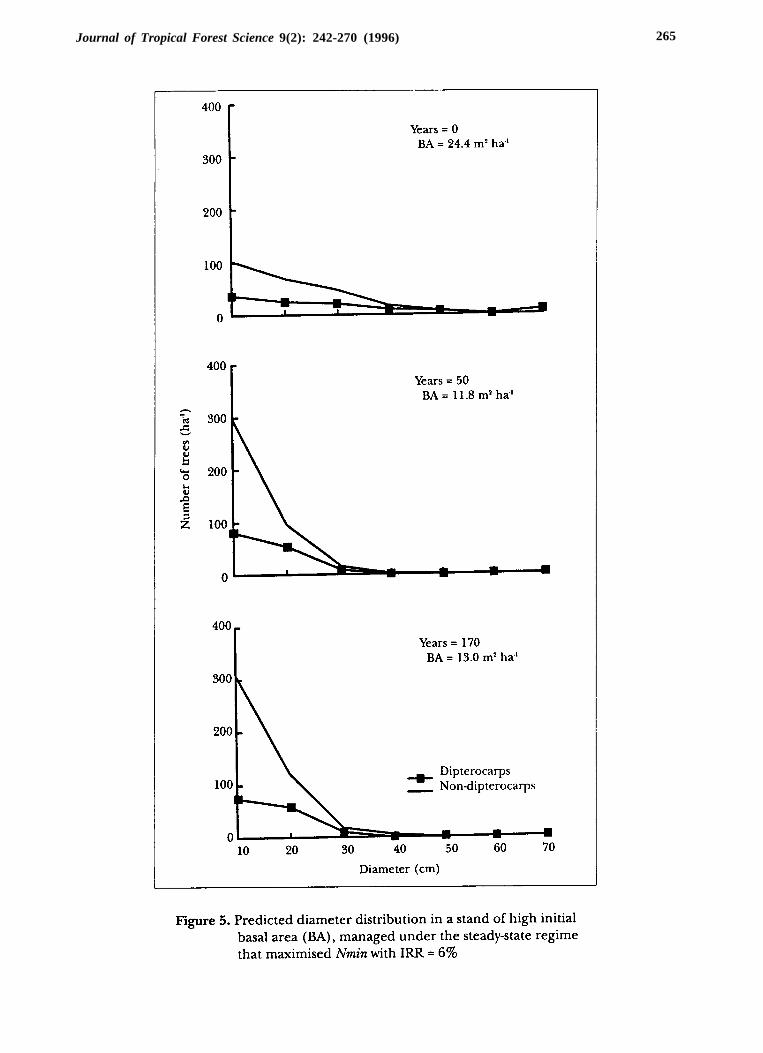
The steady-state regime that maximised diversity with an IRR of 6% also gavegood income and diversity during conversion. Figure 4 shows that in 50 years, theconversion of the stand of low initial basal area was nearly completed under thisregime. After 170 years, total basal area had increased slightly to 13 m2 ha -1,predominantly in the non-dipterocarp species. The stand with high initial basalarea (Figure 5) had its basal area reduced by almost 50% after 4 to 5 harvests beforerecovering to steady-state levels.
The evolution of diversity was similar for stands in different initial states.The difference was mainly the magnitude of diversity reduction. The diversityof the stand with high initial basal area fell from 120 to less than 80%. The standof low basal area lost only about 13% of its diversity during conversion. Hr fluctuatedabout 10% between pre- and post-harvest levels once the stand growth stabilised(Figure 6).
The relative performance of the three steady-state regimes during conversioncoincided with their performance in the steady-state, for both initial states. Theregime that maximised diversity in the steady-state led to the highest diversityduring conversion, as did the regime that maximised economic returns. Themanagement regime that achieved a compromise between economic returnsand ecologic diversity accomplished its objectives in the steady-state and duringconversion.

Journal of Tropical Forest Science 9(2): 242-270 (1996) 267
classified into dipterocarps, non-dipterocarps, and seven size classes. The modelformulation insured that the predicted steady-state would be identical to thatobserved in old-growth stands. Model estimation required one single regression topredict the effect of basal area on ingrowth. Model validation suggested that itpredicted plausible stand dynamics for lowland dipterocarp forests in PeninsularMalaysia.
The growth model was then applied to evaluate the effects of three selectivemanagement options derived from the Indonesian Selective System (TPI) oneconomic returns and diversity of tree sizes and species. Stand diversity was judgedby Shannon’s Index and the minimum number of trees in any species-size class(Nmin). Financial performance was measured by soil rent, forest value, internal rateof return, and annual yield. Performance was evaluated in the steady-state andduring conversion to the steady-state. In the steady-state, two TPI regimes (M andN) led to stands of high diversity compared to old-growth stands, at a highopportunity cost. The light harvest needed to maximise Nmin would be costly, andso little would be gained that no management at all would be the best option toachieve high diversity.
Management that maximised economic returns resulted in average annualyields of almost 3 m3 ha-1 and soil rents in excess of $1400 ha-]. This was much higherthan what would be obtained with the most profitable TPI option, and it would leadto about the same diversity. However, the diversity levels would be much lower thanthose of old-growth stands because no large trees would remain. A good compro-mise solution was found by maximizing Nmin, subject to getting returns on growingstock comparable to those of the rest of the economy in Malaysia (6% per year in1992). Then, steady-state stands would have dipterocarp and non-dipterocarp treesin every size class.
The results of converting current stands to the steady-state with different regimesshowed that the advantages or shortcomings revealed in the steady-state alsoappeared during conversion. For example, the regime that led to the highesteconomic performance in the steady-state did so during conversion, and so did theregime that maximised diversity, regardless of the initial state. However, the initialcondition of the stand was the most influential factor of the economic performanceduring conversion. Given the same cutting guide, the ability to harvest heavily andearly was the difference between an income of a few hundred dollars per hectareand more than several thousand dollars.
If the objective of management is to maintain a high level of diversity, the resultssuggest harvesting every 35 to 45 years leaving at least 25 trees per hectare of size 40to 50 cm dbh, or, better yet, applying a regime that maximises Nmin in the steady-state. To maximise income, it is best, among the guides considered here, to applythe one that maximises NPV in the steady-state, or utilise the most liberal cuttingregime based on the TPI examples. This would generate incomes ranging from$2900 ha-1 to $10600 ha-1, depending on the initial condition of the stand. Itappears possible to generate attractive economic returns and maintain good levelsof diversity when converting a stand to the steady-state, by applying the guide thatmaximises Nmin while returning 6% per year in the steady-state. Regardless of

268 Journal of Tropical Forest Science 9(2): 242-270 (1996)
objectives, choosing a management regime from its steady-state properties leads toresults during conversion that are consistent with those in the steady state.
In summary, existing selective logging systems in Southeast Asia could beimproved. If applied consistently, the TPI guides can maintain a mix of dipterocarp
and non-dipterocarp species in lowland tropical forests. Two options (TPI - M andN) could provide good diversity, but they have little chance to be sustainable in adeveloping economy because their economic returns are very low. Option O hasacceptable economic indices, but poor diversity. These options could be replacedby one of the guides obtained in this study. It has been shown, for example, thatmaximum soil rent (much higher returns than option 0) could be obtained, withhigher diversity. The most attractive guide developed here is the one that maxi-mises the minimum number of trees in any size class, while insuring a rate of returnof 6% per year. Such a return should be enough to keep lowland dipterocarp forestsin their current use.
Ecologic and economic objectives are not incompatible. The difficulty is to findthe proper balance between the two. The methods presented in this paper areuseful in that respect. They give a quantitative measure of the opportunity cost ofdiversity. To improve these management guides, better growth models should bedeveloped with tree data from the specific forest area to be managed, with moredetail in species composition. With a good growth model and adequate economicdata, existing management regimes can be evaluated or alternative regimes can bedefined from the steady-state analysis alone. Though a steady-state solution is notnecessarily optimal during conversion, the results of this paper suggest that, in fact,not much is lost by assuming that it is so. In this way, much is gained in terms ofsimplicity since the steady-state cutting guide remains independent of the standstate.
Acknowledgements
The research leading to this paper was supported in part by the USDA ForestService, Forest Products Laboratory, by McIntire-Stennis grant 2855 and by theSchool of Natural Resources, University of Wisconsin-Madison. We thank the USDAForest Service International Institute of Tropical Forestry in Puerto Rico for dataand the use of their library resources and the Ministry of Forestry, Forest ProductsResearch and Development Center in Bogor, Indonesia for data and the opportu-nity to conduct preliminary simulations of the growth model.
References

Journal of Tropical Forest Science 9(2): 242-270 (1996) 269

270 Journal of Tropical Forest Science 9(2): 242-270 (1996)