Embed Size (px)
Citation preview
Income DistributionIncome Distribution
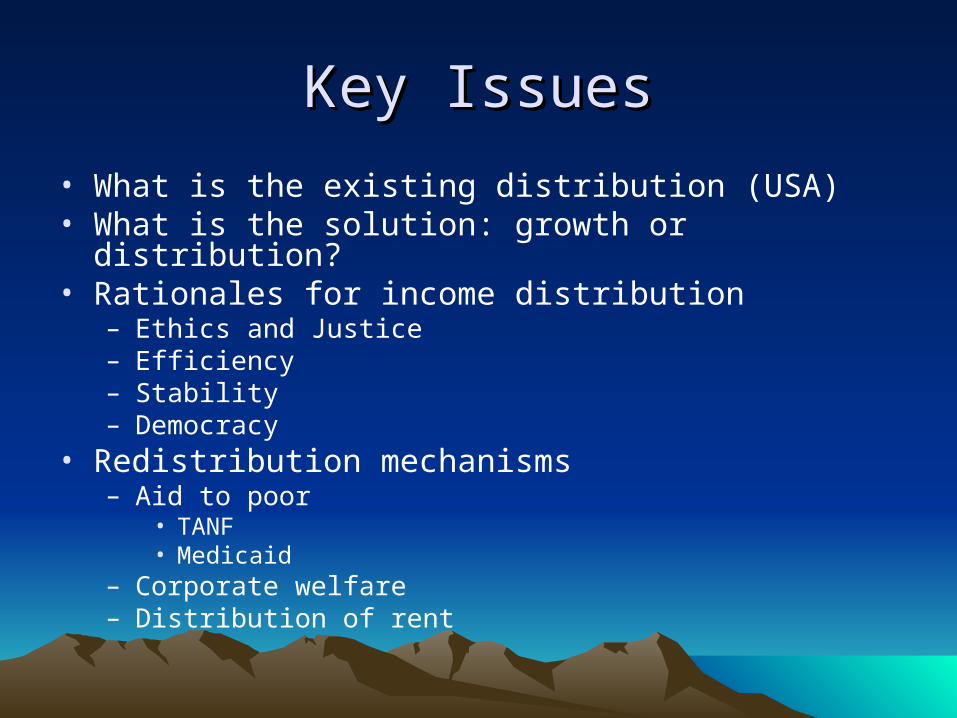
Key IssuesKey Issues
• What is the existing distribution (USA) • What is the solution: growth or distribution?• Rationales for income distribution
– Ethics and Justice– Efficiency– Stability– Democracy
• Redistribution mechanisms– Aid to poor
• TANF• Medicaid
– Corporate welfare– Distribution of rent
What is the existing What is the existing distribution in the USA?distribution in the USA?
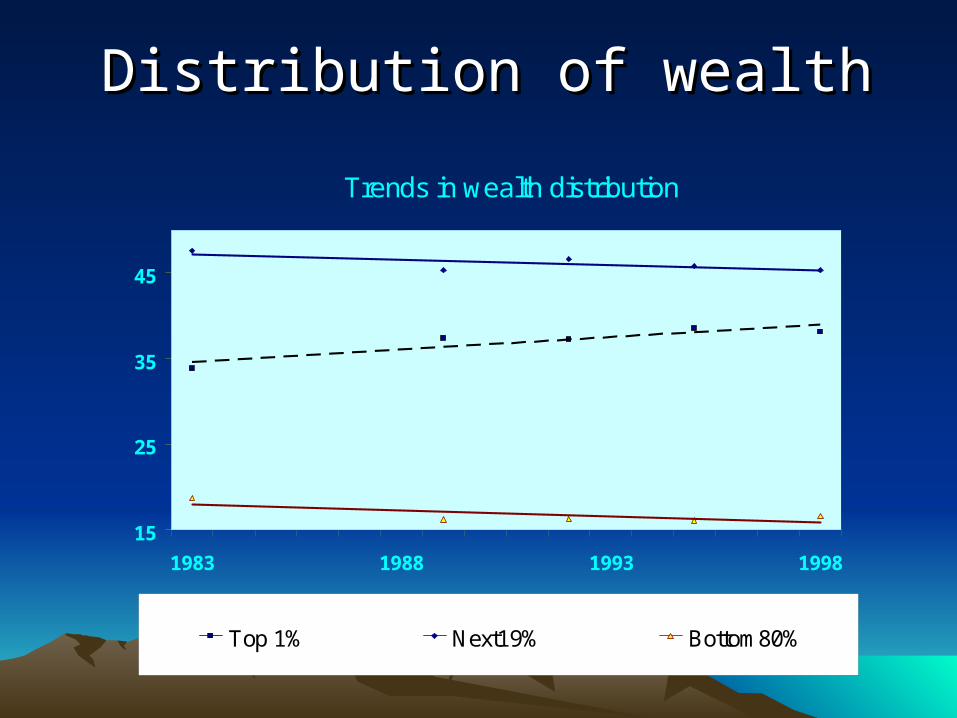
Distribution of wealthDistribution of wealth
Trends in wealth distribution
15
25
35
45
1983 1988 1993 1998
Top 1% Next19% Bottom80%
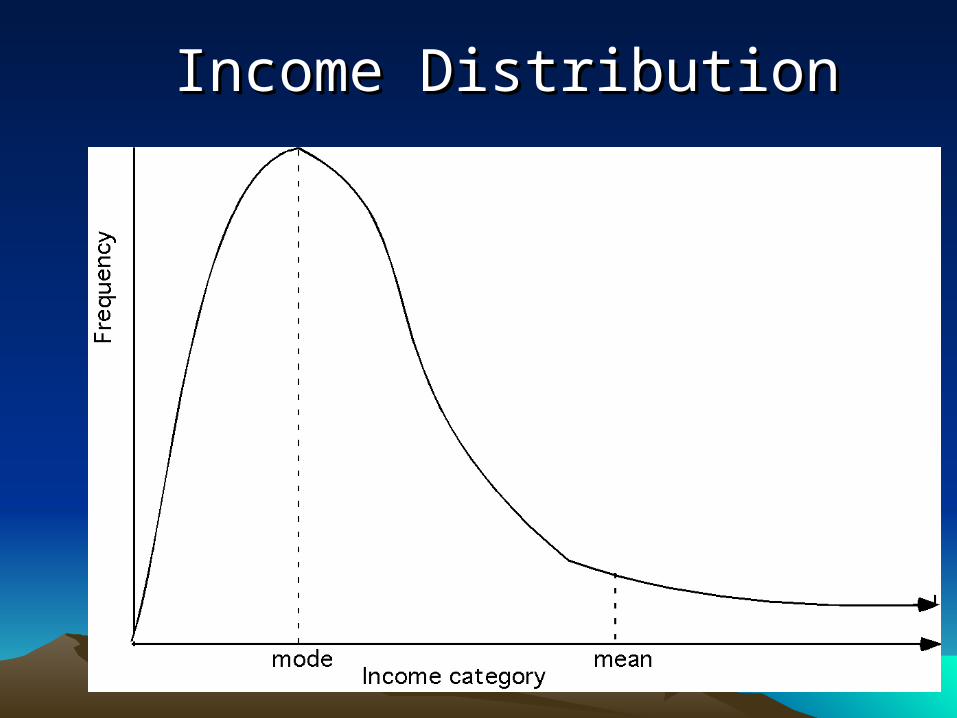
Income DistributionIncome Distribution
The Myth of Upward Mobility?The Myth of Upward Mobility?
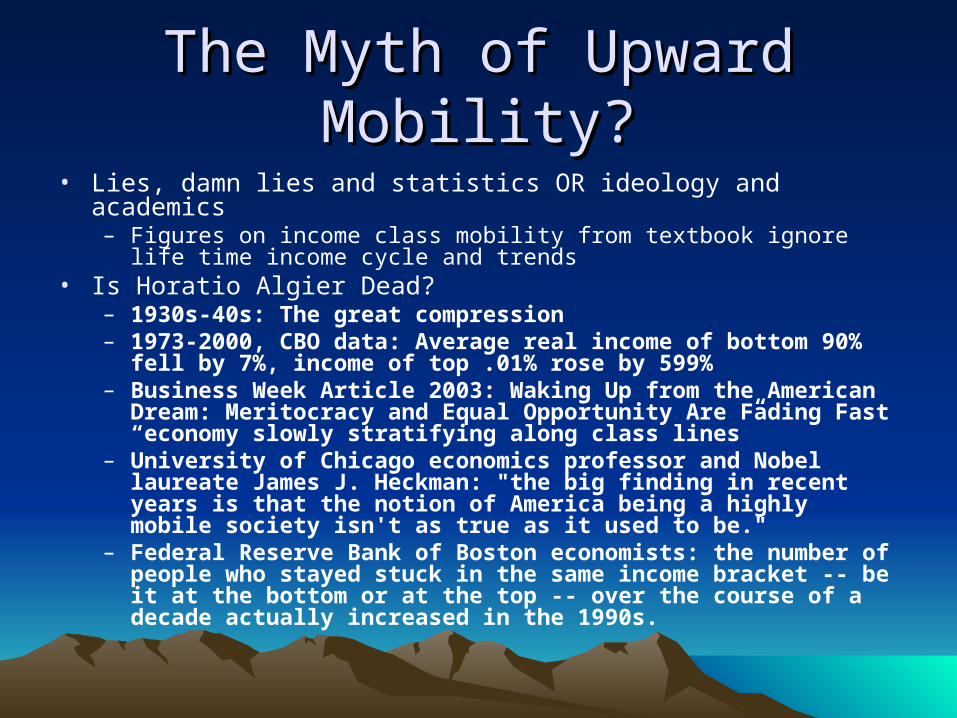
• Lies, damn lies and statistics OR ideology and academics– Figures on income class mobility from textbook ignore life time income
cycle and trends• Is Horatio Algier Dead?
– 1930s-40s: The great compression– 1973-2000, CBO data: Average real income of bottom 90% fell by
7%, income of top .01% rose by 599%– Business Week Article 2003: Waking Up from the American Dream:
Meritocracy and Equal Opportunity Are Fading Fast“economy slowly stratifying along class lines”
– University of Chicago economics professor and Nobel laureate James J. Heckman: "the big finding in recent years is that the notion of America being a highly mobile society isn't as true as it used to be."
– Federal Reserve Bank of Boston economists: the number of people who stayed stuck in the same income bracket -- be it at the bottom or at the top -- over the course of a decade actually increased in the 1990s.
New York Times, June 26, 2003
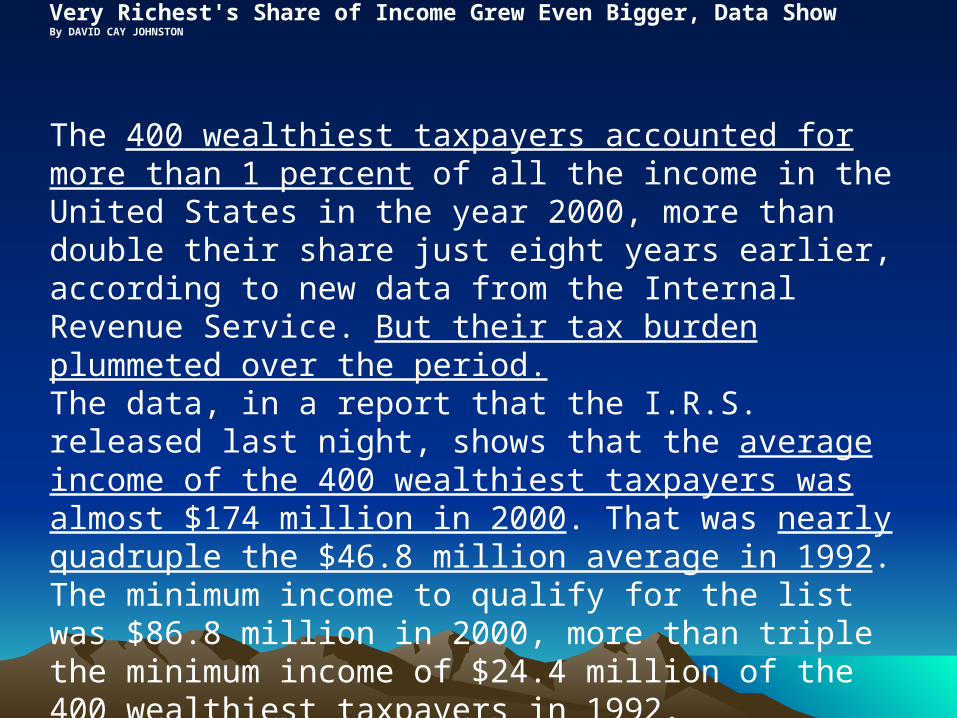
Very Richest's Share of Income Grew Even Bigger, Data ShowBy DAVID CAY JOHNSTON
The 400 wealthiest taxpayers accounted for more than 1 percent of all the income in the United States in the year 2000, more than double their share just eight years earlier, according to new data from the Internal Revenue Service. But their tax burden plummeted over the period.The data, in a report that the I.R.S. released last night, shows that the average income of the 400 wealthiest taxpayers was almost $174 million in 2000. That was nearly quadruple the $46.8 million average in 1992. The minimum income to qualify for the list was $86.8 million in 2000, more than triple the minimum income of $24.4 million of the 400 wealthiest taxpayers in 1992.
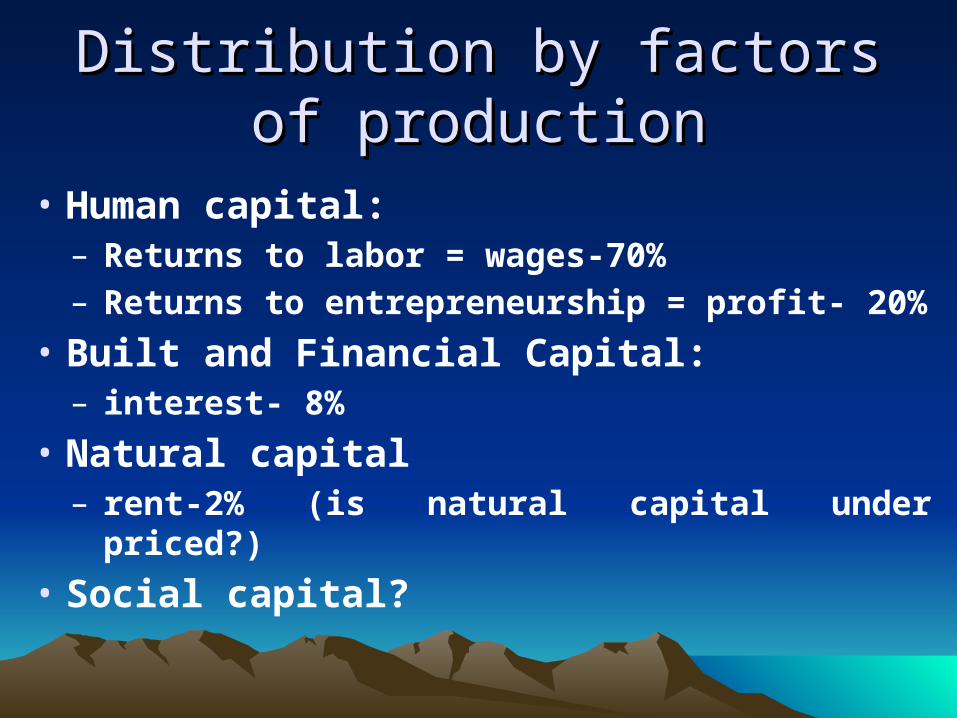
Distribution by factors of Distribution by factors of productionproduction
• Human capital:– Returns to labor = wages-70%– Returns to entrepreneurship = profit- 20%
• Built and Financial Capital:– interest- 8%
• Natural capital – rent-2% (is natural capital under priced?)
• Social capital?
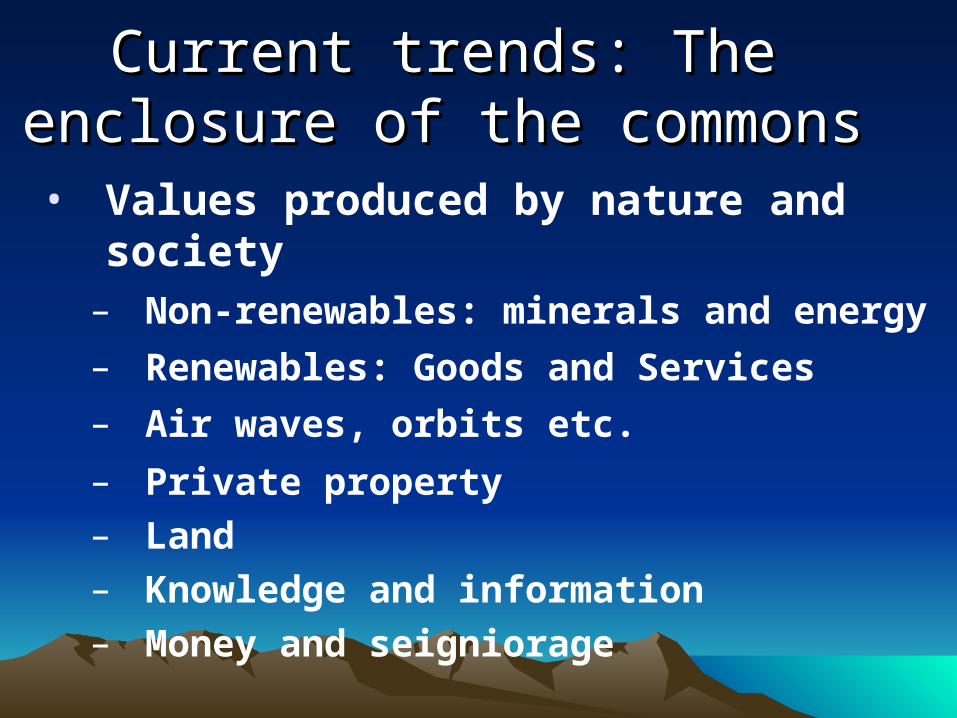
Current trends: The enclosure of Current trends: The enclosure of the commonsthe commons
• Values produced by nature and society– Non-renewables: minerals and energy
– Renewables: Goods and Services
– Air waves, orbits etc.
– Private property– Land– Knowledge and information– Money and seigniorage
Rationales for DistributionRationales for Distribution
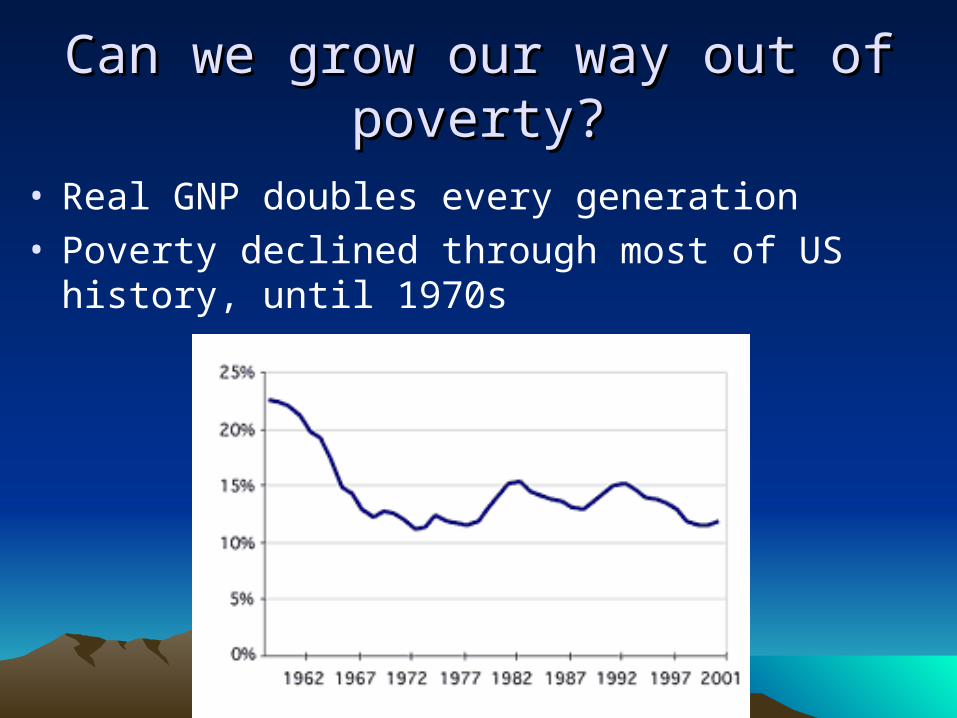
Can we grow our way out of Can we grow our way out of poverty?poverty?
• Real GNP doubles every generation• Poverty declined through most of US history, until
1970s
Ethics and distributionEthics and distribution
• Role of charity in most religions
• Maximin
• Should a nation be judged by the welfare of the richest or the poorest?
Justice and distributionJustice and distribution
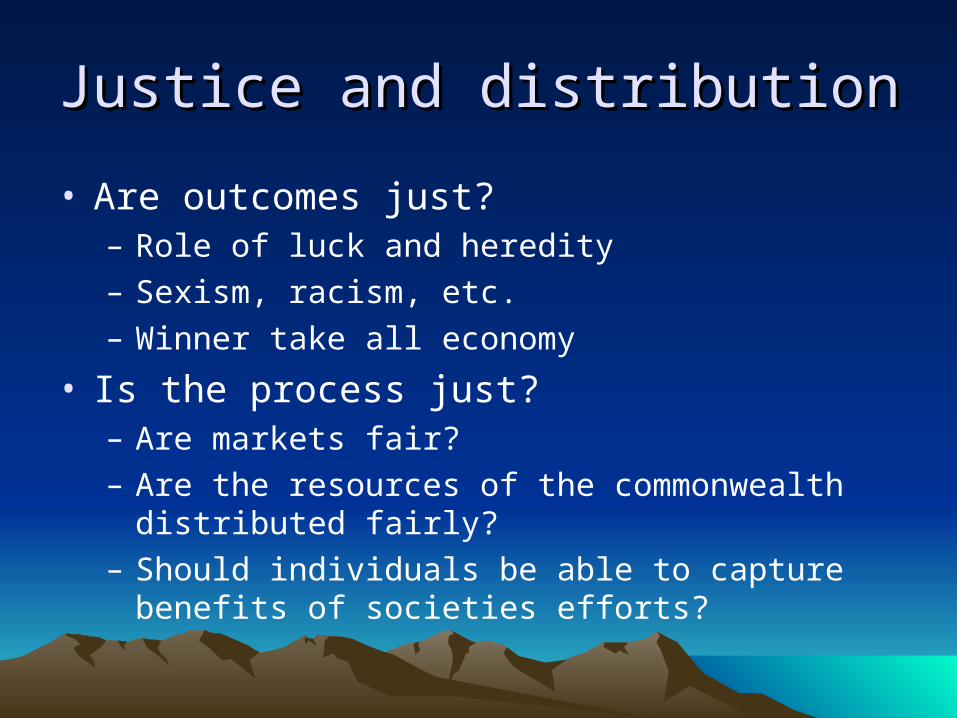
• Are outcomes just?– Role of luck and heredity– Sexism, racism, etc.– Winner take all economy
• Is the process just?– Are markets fair?– Are the resources of the commonwealth distributed
fairly?– Should individuals be able to capture benefits of
societies efforts?
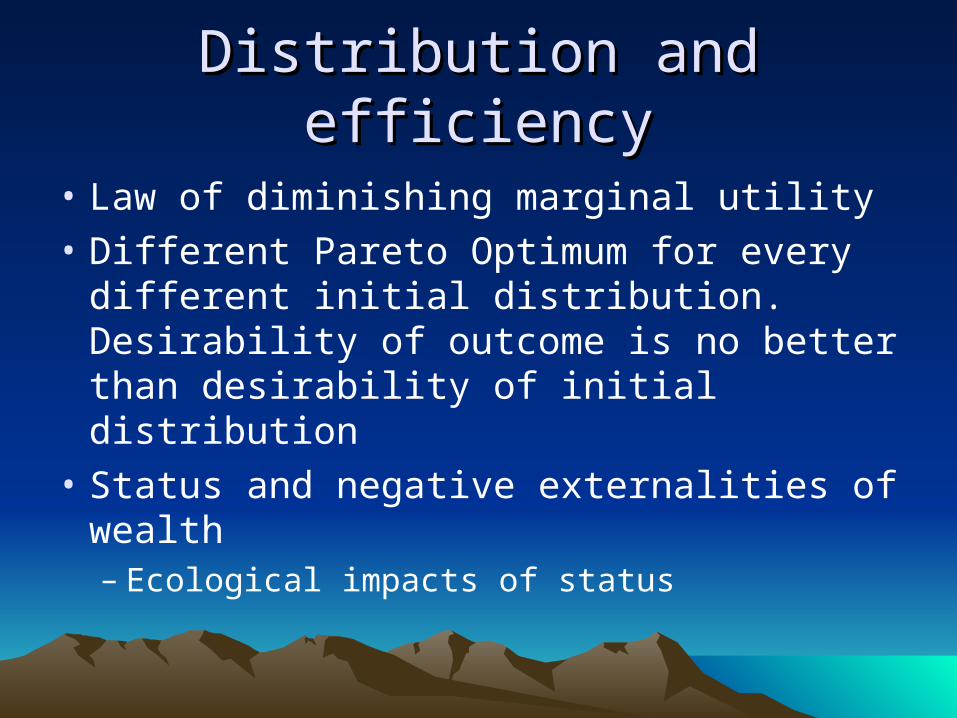
Distribution and efficiencyDistribution and efficiency
• Law of diminishing marginal utility
• Different Pareto Optimum for every different initial distribution. Desirability of outcome is no better than desirability of initial distribution
• Status and negative externalities of wealth– Ecological impacts of status
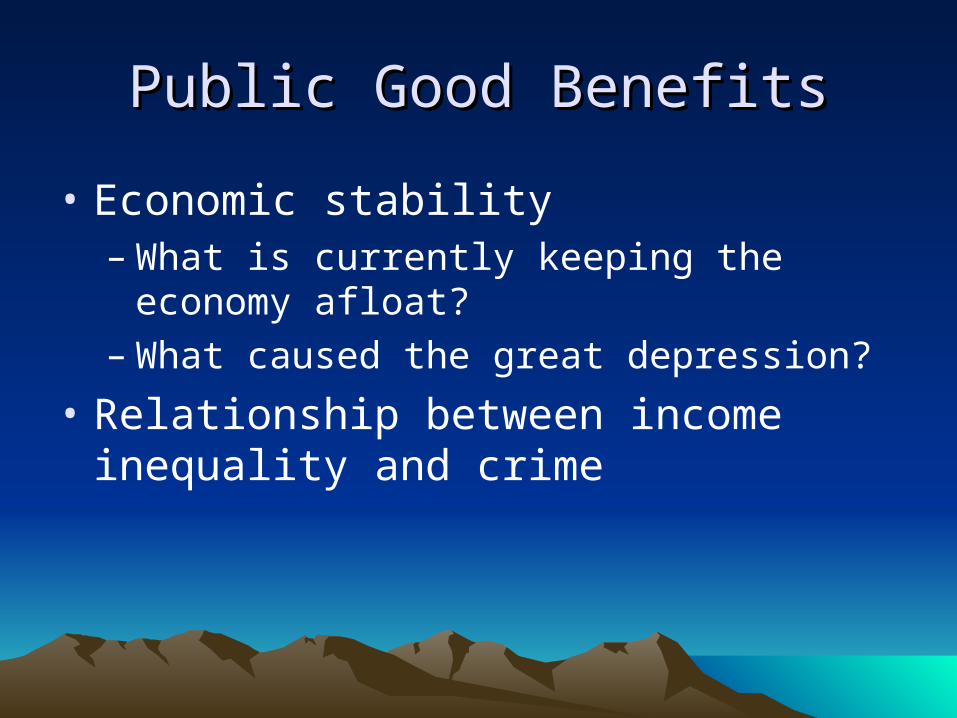
Public Good BenefitsPublic Good Benefits
• Economic stability– What is currently keeping the economy
afloat?– What caused the great depression?
• Relationship between income inequality and crime
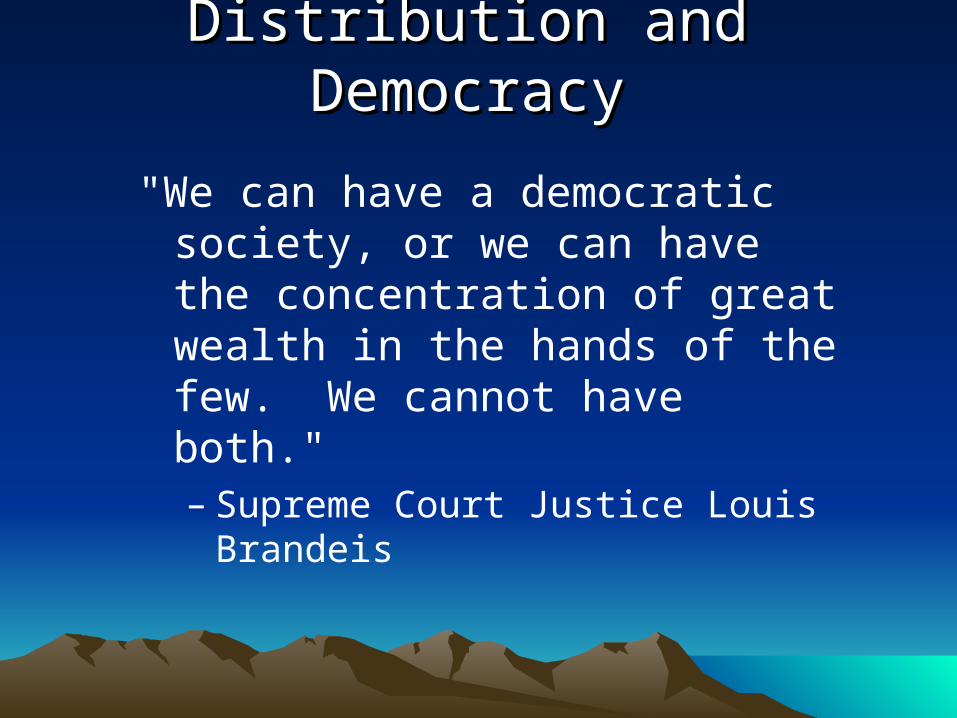
Distribution and DemocracyDistribution and Democracy
"We can have a democratic society, or we can have the concentration of great wealth in the hands of the few. We cannot have both." – Supreme Court Justice Louis
Brandeis
Redistribution Redistribution MechanismsMechanisms
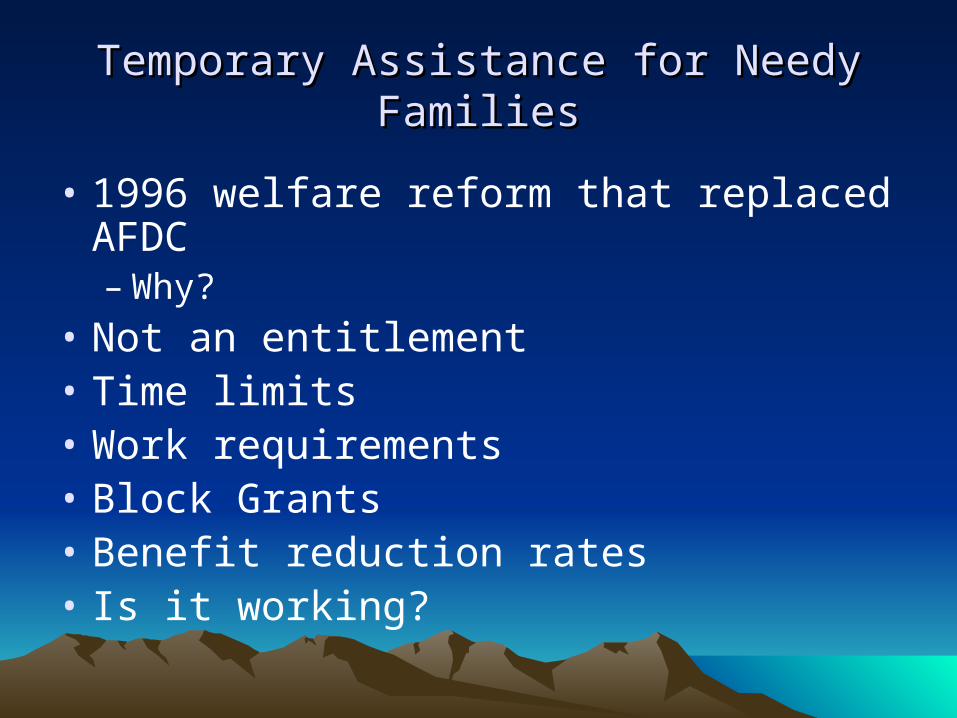
Temporary Assistance for Needy FamiliesTemporary Assistance for Needy Families
• 1996 welfare reform that replaced AFDC– Why?
• Not an entitlement• Time limits• Work requirements• Block Grants• Benefit reduction rates• Is it working?
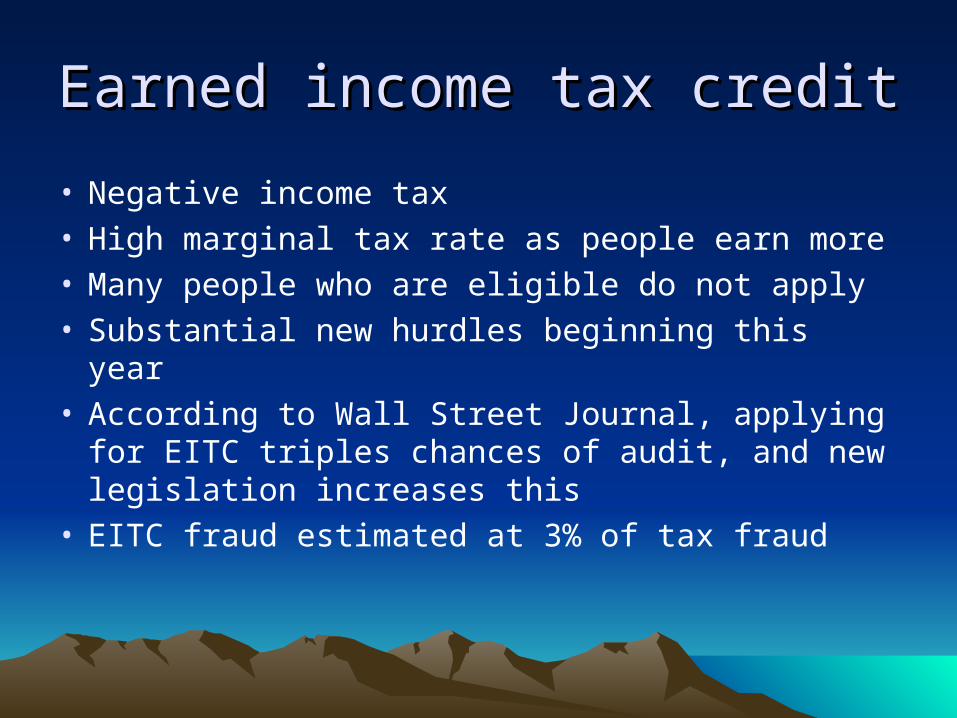
Earned income tax creditEarned income tax credit
• Negative income tax• High marginal tax rate as people earn more• Many people who are eligible do not apply• Substantial new hurdles beginning this year• According to Wall Street Journal, applying for
EITC triples chances of audit, and new legislation increases this
• EITC fraud estimated at 3% of tax fraud
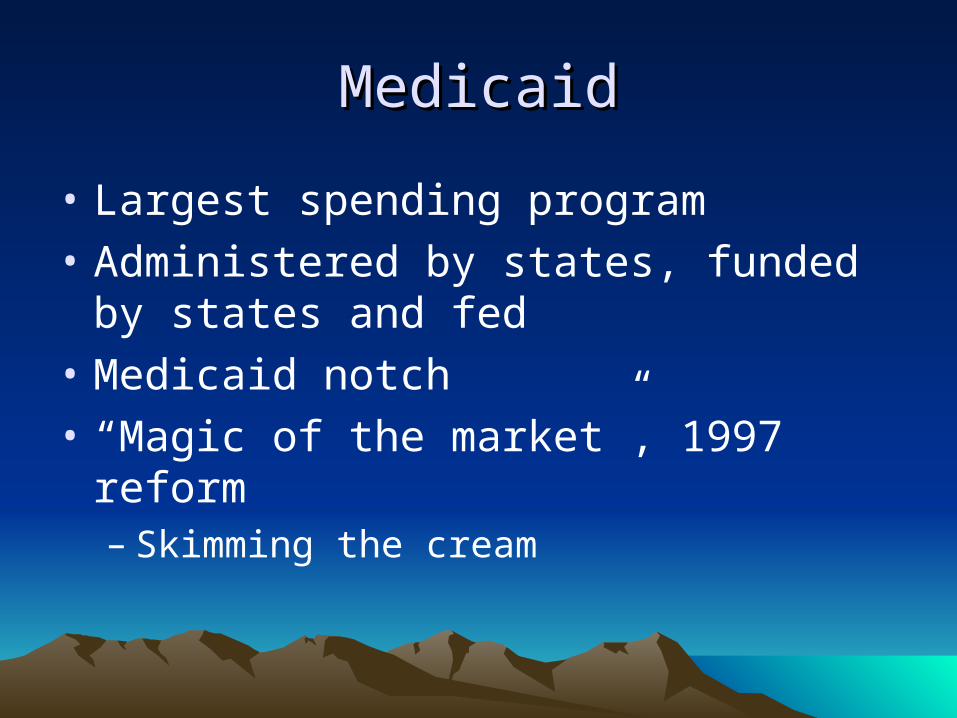
MedicaidMedicaid
• Largest spending program
• Administered by states, funded by states and fed
• Medicaid notch
• “Magic of the market”, 1997 reform– Skimming the cream
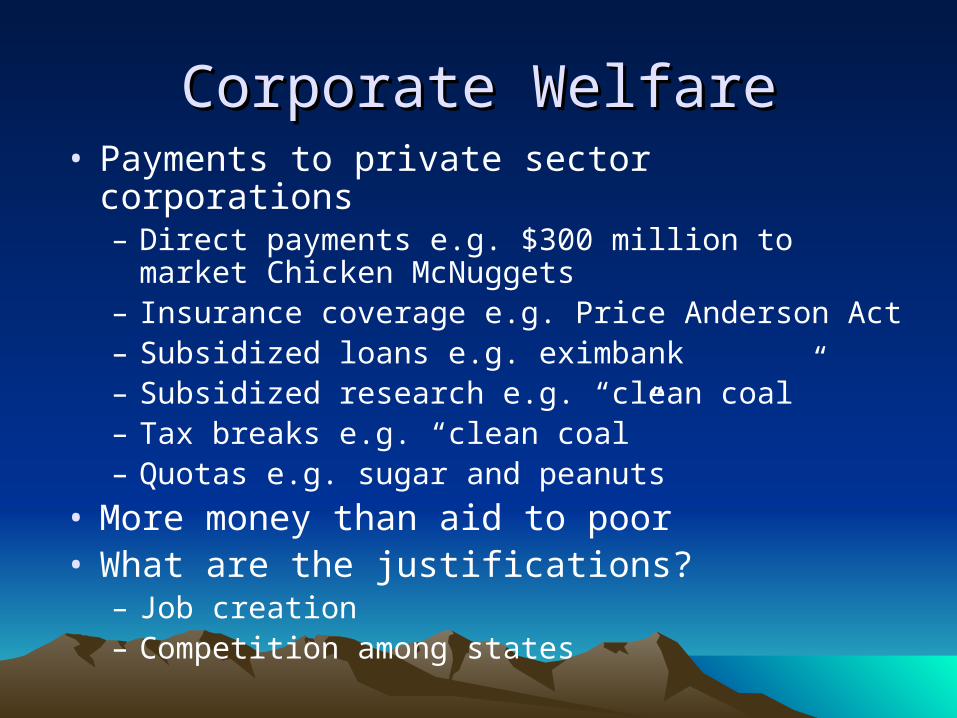
Corporate WelfareCorporate Welfare• Payments to private sector corporations
– Direct payments e.g. $300 million to market Chicken McNuggets
– Insurance coverage e.g. Price Anderson Act– Subsidized loans e.g. eximbank– Subsidized research e.g. “clean coal”– Tax breaks e.g. “clean coal”– Quotas e.g. sugar and peanuts
• More money than aid to poor• What are the justifications?
– Job creation– Competition among states
National ForestsNational Forests
• Historical record
• Tongass article
• Timber Salvage Rider
• Healthy Forests Initiative
Grazing LandsGrazing Lands
• Grazing lands rented at far below market rates
• Arizona fires
• Lump sum payments to end subsidies
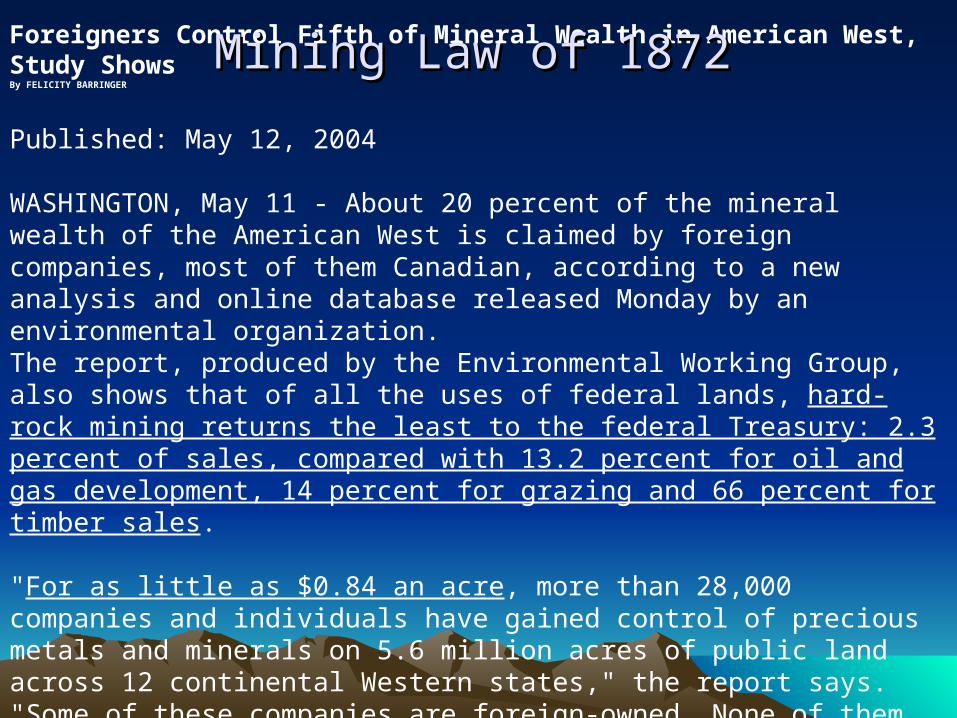
Foreigners Control Fifth of Mineral Wealth in American West, Study ShowsBy FELICITY BARRINGER
Published: May 12, 2004
WASHINGTON, May 11 - About 20 percent of the mineral wealth of the American West is claimed by foreign companies, most of them Canadian, according to a new analysis and online database released Monday by an environmental organization.The report, produced by the Environmental Working Group, also shows that of all the uses of federal lands, hard-rock mining returns the least to the federal Treasury: 2.3 percent of sales, compared with 13.2 percent for oil and gas development, 14 percent for grazing and 66 percent for timber sales.
"For as little as $0.84 an acre, more than 28,000 companies and individuals have gained control of precious metals and minerals on 5.6 million acres of public land across 12 continental Western states," the report says. "Some of these companies are foreign-owned. None of them will pay anything to the federal government for the value of the minerals they extract from public property."
Mining Law of 1872Mining Law of 1872
Agriculture policyAgriculture policy
• CSM: The Heavy Thud of American Cotton“Between 1995 and 2002, for example, a total of $1.68 billion was paid to 285 cotton exporters and millers under one part of the cotton program…. A handful of corporations got an average of $80 million apiece. Allenberg Cotton Co. of Cordova, Tenn., was paid $106.9 million.”
Pollution policyPollution policy
• Mining clean up
• Super fund sites
• CO2 emissions
• SO2 emissions
• Mercury emissions
Georgist Economics: A More Just Georgist Economics: A More Just and Efficient Alternative?and Efficient Alternative?
Basic PrinciplesBasic Principles
• People keep what they earn with the sweat of their brows
• Wealth created by nature and society distributed equally– Public goods replaced with public goods
• Those who benefit most from government services pay the most– One of the most important services of
government is the protection of private property
Natural capital: Natural capital: redistributing Rentredistributing Rent
• Rent= unearned income
• Land
• Non-renewables
• Renewables- natural dividend
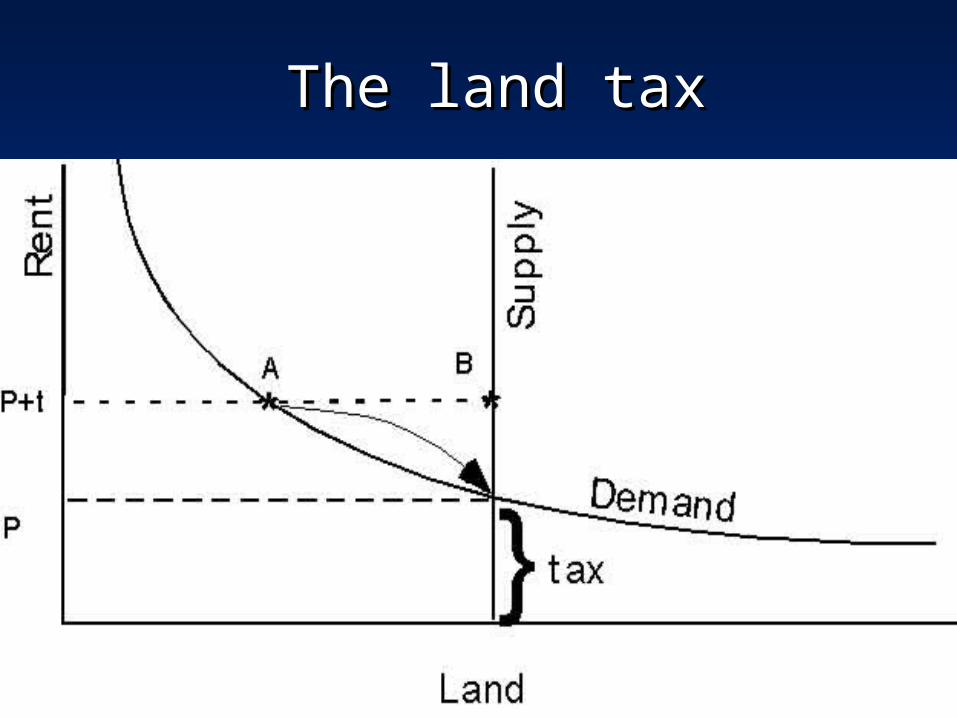
The land taxThe land tax
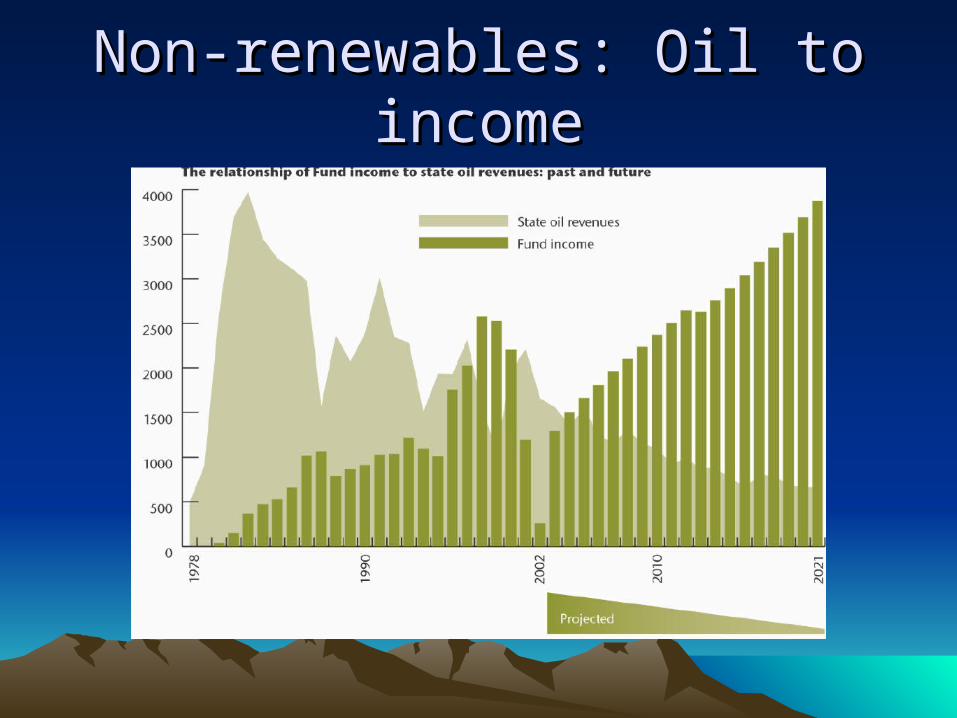
Non-renewables: Oil to incomeNon-renewables: Oil to income
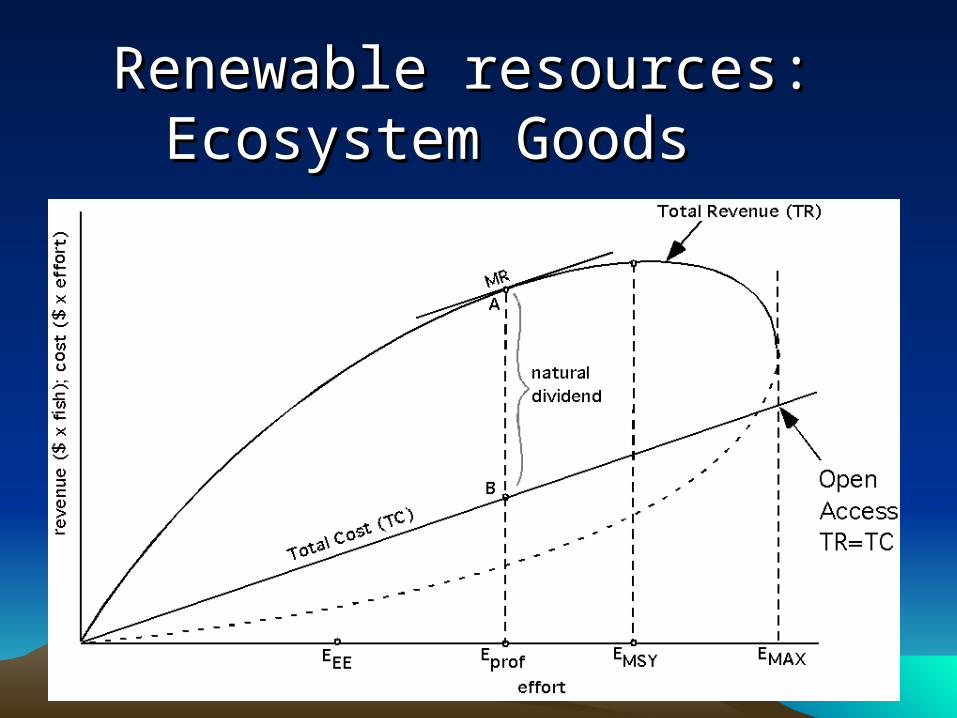
Renewable resources: Renewable resources: Ecosystem Goods Ecosystem Goods
Renewable resources: Renewable resources: ecosystem servicesecosystem services
• Set scale, auction off quotas• Pollution taxes• Taxes on ecological degradation• Who should be compensated?
– Public good replaced with public goods
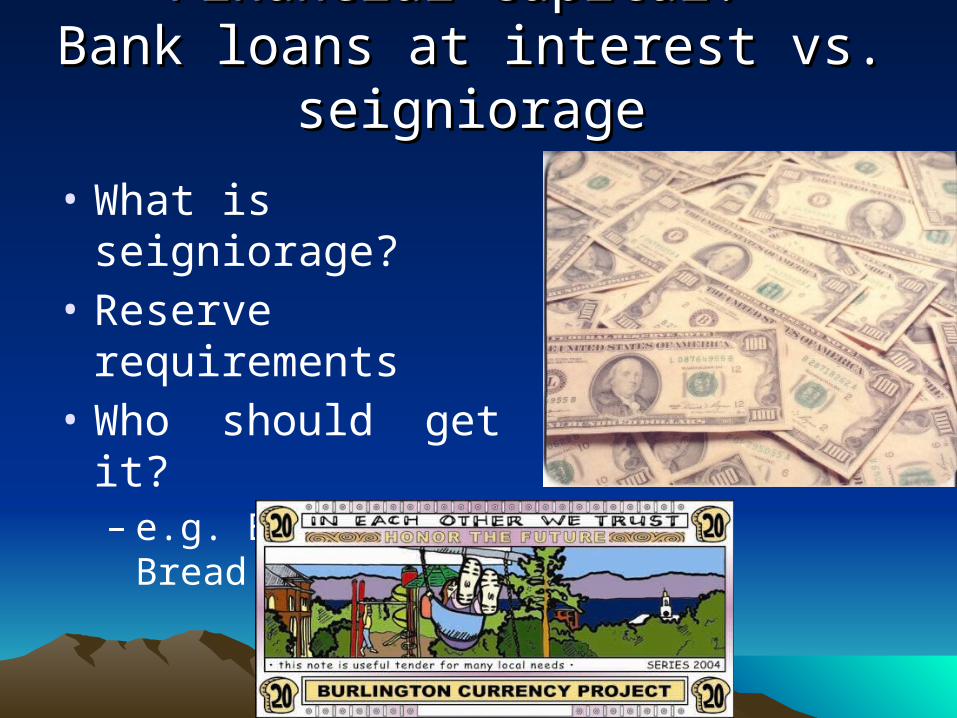
Financial Capital: Financial Capital: Bank loans at interest vs. seigniorageBank loans at interest vs. seigniorage
• What is seigniorage?• Reserve
requirements• Who should get it?
– e.g. Burlington Bread
Built capital: The stock marketBuilt capital: The stock market
• What do owners of stocks produce?
• About 5% of stock purchases provide capital for new investment.
• Peter Barnes estimates about 30% of value of IPO is generated by public sector investments (social capital?)
• ESOPs