Embed Size (px)
Citation preview
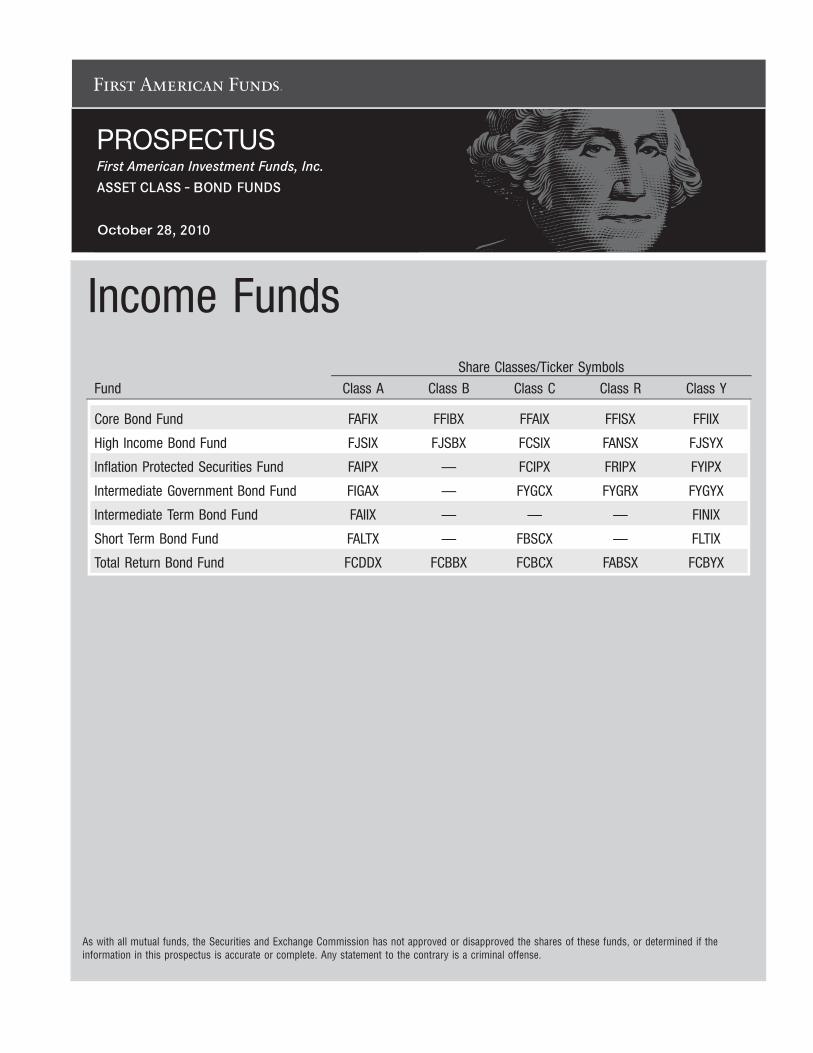
PROSPECTUS
Income Funds
Fund Class A Class B Class C Class R Class Y
Share Classes/Ticker Symbols
Core Bond Fund FAFIX FFIBX FFAIX FFISX FFIIX
High Income Bond Fund FJSIX FJSBX FCSIX FANSX FJSYX
Inflation Protected Securities Fund FAIPX — FCIPX FRIPX FYIPX
Intermediate Government Bond Fund FIGAX — FYGCX FYGRX FYGYX
Intermediate Term Bond Fund FAIIX — — — FINIX
Short Term Bond Fund FALTX — FBSCX — FLTIX
Total Return Bond Fund FCDDX FCBBX FCBCX FABSX FCBYX
As with all mutual funds, the Securities and Exchange Commission has not approved or disapproved the shares of these funds, or determined if theinformation in this prospectus is accurate or complete. Any statement to the contrary is a criminal offense.

Table of
Contents
Fund Summaries 1
Core Bond Fund 1
High Income Bond Fund 5
Inflation Protected Securities Fund 9
Intermediate Government Bond Fund 14
Intermediate Term Bond Fund 18
Short Term Bond Fund 22
Total Return Bond Fund 26
Additional Summary Information 31
More about the Funds 32
Investment Objectives 32
Investment Strategies 32
Investment Risks 33
Disclosure of Portfolio Holdings 35
Fund Management 36
Investment Advisor 36
Portfolio Managers 37
Please find First American Funds’ Privacy Policy inside the back cover of this Prospectus.

Shareholder Information 39
Pricing of Fund Shares 39
Choosing a Share Class 39
Determining Your Share Price 41
Purchasing Fund Shares 44
Redeeming Fund Shares 45
Exchanging Fund Shares 46
Additional Information on Purchasing, Redeeming, and Exchanging Fund Shares 48
Dividends and Distributions 50
Taxes 50
Compensation Paid to Financial Intermediaries 50
Staying Informed 52
Financial Highlights 53
This prospectus and the related Statement of Additional Information (SAI) do not constitute an offer to sell or a solicitation of an offer to buyshares in the funds, nor shall any such shares be offered or sold to any person in any jurisdiction in which an offer, solicitation, purchase, orsale would be unlawful under the securities laws of such jurisdiction.
The funds may be offered only to persons in the United States. This prospectus should not be considered a solicitation or offering of fundshares outside the United States.
Important Notice to Shareholders
On July 29, 2010, FAF Advisors, Inc. (the “advisor”) and its parent company, U.S. Bank National Association, entered into an agreement withNuveen Investments, Inc. (“Nuveen”) and certain Nuveen affiliates, including Nuveen Asset Management (“NAM”), to sell a portion of the advisor’sasset management business (the “Transaction”). Included in the sale will be that part of the advisor’s asset management business that advises thefunds. The sale is subject to the satisfaction of customary conditions, and is currently expected to close by the end of 2010.
In connection with the Transaction, the funds’ board of directors (the “board”) has considered and approved a new investment advisory agreementfor the funds with NAM. The new investment advisory agreement will be submitted to each fund’s shareholders for their approval and, if approved,will take effect upon the closing of the Transaction (or such later time as shareholder approval is obtained). The funds’ board also considered andapproved new distribution agreements with Nuveen Investments, LLC which will take effect upon closing of the Transaction. There will be no changein the funds’ investment objectives or policies as a result of the Transaction.

Fund Summaries
Core Bond FundOn July 29, 2010, FAF Advisors, Inc. (the “advisor”) and its parent company, U.S. Bank National Association, entered into an agreement withNuveen Investments, Inc. (“Nuveen”) and certain Nuveen affiliates, including Nuveen Asset Management (“NAM”), to sell a portion of the advisor’sasset management business (the “Transaction”). Included in the sale will be that part of the advisor’s asset management business that advises thefund. The sale is subject to the satisfaction of customary conditions, and is currently expected to close by the end of 2010.
Investment Objective
Core Bond Fund’s objective is to provide investors with high current income consistent with limited risk to capital.
Fees and Expenses
The following tables describe the fees and expenses that you may pay if you buy and hold shares of the fund. You may qualify for sales chargediscounts on purchases of Class A shares if you and your family invest, or agree to invest in the future, at least $50,000 in First American funds.More information about these and other discounts is available from your financial professional and under “Determining Your Share Price” onpage 41 of the prospectus and “Reducing Class A Sales Charges” on page 84 of the statement of additional information.
Shareholder Fees(fees paid directly from your investment) Class A Class B Class C Class R Class Y
Maximum Sales Charge (Load) Imposed on Purchases(as a percentage of offering price) 4.25% None None None None
Maximum Deferred Sales Charge (Load)(as a percentage of original purchase price or redemption proceeds, whichever is less)1 None 5.00% 1.00% None None
Annual Low Balance Account Fee (for accounts under $1,000) $15 $15 $15 None None
Annual Fund Operat ing Expenses2
(expenses that you pay each year as a percentage of the value of your investment)
Management Fees 0.50% 0.50% 0.50% 0.50% 0.50%
Distribution and/or Service (12b-1) Fees 0.25% 1.00% 1.00% 0.50% None
Other Expenses
Administration Fee 0.22% 0.22% 0.22% 0.22% 0.22%
Miscellaneous 0.05% 0.05% 0.05% 0.05% 0.05%
Acquired Fund Fees and Expenses3 0.01% 0.01% 0.01% 0.01% 0.01%
Total Annual Fund Operating Expenses4 1.03% 1.78% 1.78% 1.28% 0.78%
Example: This example is intended to help you compare the cost of investing in the fund with the cost of investing in other mutual funds. Theexample assumes that you invest $10,000 in the fund for the time periods indicated and then either redeem or do not redeem all of your shares atthe end of those periods. The example also assumes that your investment has a 5% return each year and the fund’s operating expenses remain thesame. Although your actual costs may be higher or lower, based on these assumptions your costs would be:
Class A
Class Bassuming
redemptionat end of
each period
Class Bassuming no
redemptionat end of
each period
Class Cassuming
redemptionat end of
each period
Class Cassuming no
redemptionat end of
each period Class R Class Y
1 year $ 526 $ 681 $ 181 $ 281 $ 181 $ 130 $ 80
3 years $ 739 $ 960 $ 560 $ 560 $ 560 $ 406 $249
5 years $ 969 $1,164 $ 964 $ 964 $ 964 $ 702 $433
10 years $1,631 $1,897 $1,897 $2,095 $2,095 $1,545 $966
1 Class A share investments of $1 million or more on which no front-end sales charge is paid may be subject to a contingent deferred sales charge (CDSC) of up to 1%.The CDSC on Class B shares declines over a six-year period from purchase. The CDSC on Class C shares applies only to redemptions within one year of purchase.
2 Assuming shareholders approve the new advisory agreement with NAM proposed in connection with the Transaction, the fund’s expense structure will change uponclosing of the Transaction. However, the fund’s net expense ratio immediately following the Transaction, after voluntary waivers by NAM and excluding any AcquiredFund Fees and Expenses, is expected to be the same or lower than the annual fund operating expense ratio reflected in footnote 4 below, assuming the fund’s net assetlevel has not fallen below its level as of June 30, 2010, adjusted to take into account any redemptions by the U.S. Bank 401(k) Plan expected to occur prior to closing ofthe Transaction. Further, NAM has agreed to maintain the fund’s current expense cap at least through June 30, 2011. In addition, the fund’s expense ratio immediately
1 Prospectus – First American Income Funds
following the Transaction, before voluntary waivers and excluding any Acquired Fund Fees and Expenses, is expected to be the same or lower than the fund’s total annualfund operating expense ratio reflected in the table, assuming the fund’s net asset level has not fallen below its level as of June 30, 2010, adjusted (as applicable) to takeinto account any expected U.S. Bank 401(k) Plan redemptions. See “Investment Advisor” on page 36 of the prospectus.
3 In addition to the operating expenses that the fund bears directly, the fund’s shareholders indirectly bear the expenses of affiliated and unaffiliated funds in which the fundinvests (the “acquired funds”). Since acquired fund fees and expenses are not directly borne by the fund, they are not reflected in the fund’s financial statements, withthe result that the information presented in the expense table will differ from that presented in the “Financial Highlights” section of the prospectus.
4 The advisor intends to waive fees and reimburse other fund expenses through June 30, 2011 so that total annual fund operating expenses, after waivers andexcluding Acquired Fund Fees and Expenses, do not exceed 0.95%, 1.70%, 1.70%, 1.20%, and 0.70%, respectively, for Class A, Class B, Class C, Class R, and ClassY shares. Fee waivers and expense reimbursements will not be terminated prior to that time without the approval of the fund’s board of directors.
Portfolio Turnover
The fund pays transaction costs, such as commissions, when it buys and sells securities (or “turns over” its portfolio). A higher portfolio turnoverrate may indicate higher transaction costs and may result in higher taxes when fund shares are held in a taxable account. These costs, which arenot reflected in annual fund operating expenses or in the example, affect the fund’s performance. During the most recent fiscal year, the fund’sportfolio turnover rate was 83% of the average value of its portfolio.
Principal Investment Strategies
Under normal market conditions, Core Bond Fund invests primarily (at least 80% of its net assets, plus the amount of any borrowings forinvestment purposes) in debt securities, such as:
• U.S. government securities (securities issued or guaranteed by the U.S. government or its agencies or instrumentalities), including zero couponsecurities.
• residential and commercial mortgage-backed securities.• asset-backed securities.• corporate debt obligations, including obligations issued by special-purpose entities that are backed by corporate debt obligations.
Up to 10% of the fund’s total assets may be invested collectively in the following categories of debt securities:
• securities rated lower than investment grade or unrated securities of comparable quality as determined by the fund’s advisor (securities commonlyreferred to as “high yield” or “junk bonds”). The fund will not invest in securities rated lower than CCC at the time of purchase or in unratedsecurities of equivalent quality.
• non-dollar denominated debt obligations of foreign corporations and governments.• debt obligations issued by governmental and corporate issuers that are located in emerging market countries. A country is considered to have an
“emerging market” if it has a relatively low gross national product per capita compared to the world’s major economies, and the potential forrapid economic growth, provided that no issuer included in the fund’s current benchmark index will be considered to be located in an emergingmarket country.
The fund may invest up to 25% of its total assets in U.S. dollar denominated debt obligations of foreign corporations and governments that are notlocated in emerging market countries.
The fund’s advisor selects securities using a “top-down” approach, which begins with the formulation of the advisor’s general economic outlook.Following this, various sectors and industries are analyzed and selected for investment. Finally, the advisor selects individual securities within thesesectors or industries.
The fund invests primarily in debt securities rated investment grade at the time of purchase by a nationally recognized statistical rating organizationor in unrated securities of comparable quality. As noted above, however, up to 10% of the fund’s total assets may be invested in securities that arerated lower than investment grade at the time of purchase or that are unrated and of comparable quality. Quality determinations regarding unratedsecurities will be made by the fund’s advisor. If the rating of a security is reduced or the credit quality of an unrated security declines afterpurchase, the fund is not required to sell the security, but may consider doing so. At least 65% of the fund’s debt securities must be eitherU.S. government securities or securities that are rated A or better or are unrated and of comparable quality. Unrated securities will not exceed 25%of the fund’s total assets.
Under normal market conditions the fund attempts to maintain a weighted average effective maturity for its portfolio securities of fifteen years orless and an average effective duration of three to eight years. The fund’s weighted average effective maturity and average effective duration aremeasures of how the fund may react to interest rate changes.
To generate additional income, the fund may invest up to 25% of its total assets in dollar roll transactions. In a dollar roll transaction, the fund sellsmortgage-backed securities for delivery in the current month while contracting with the same party to repurchase similar securities at a future date.
2 Prospectus – First American Income Funds
Fund Summaries
Core Bond Fund continued

The fund may utilize the following derivatives: options; futures contracts; options on futures contracts; interest rate caps, collars, and floors; foreigncurrency contracts; options on foreign currencies; swap agreements, including swap agreements on interest rates, currency rates, security indexesand specific securities, and credit default swap agreements; and options on the foregoing types of swap agreements. The fund may enter intostandardized derivatives contracts traded on domestic or foreign securities exchanges, boards of trade, or similar entities, and non-standardizedderivatives contracts traded in the over-the-counter (“OTC”) market. The fund may use these derivatives in an attempt to manage market risk,currency risk, credit risk and yield curve risk, to manage the effective maturity or duration of securities in the fund’s portfolio or for speculativepurposes in an effort to increase the fund’s yield or to enhance returns. The fund may also use derivatives to gain exposure to non-dollardenominated securities markets to the extent it does not do so through direct investments. The use of a derivative is speculative if the fund isprimarily seeking to enhance returns, rather than offset the risk of other positions. The fund may not use any derivative to gain exposure to asecurity or type of security that it would be prohibited by its investment restrictions from purchasing directly.
Principal Risks
The price and yield of this fund will change daily due to changes in interest rates and other factors, which means you could lose money. Aninvestment in the fund is not a deposit of U.S. Bank National Association and is not insured or guaranteed by the Federal Deposit InsuranceCorporation or any other governmental agency. The principal risks of investing in this fund are described below:
Active Management Risk — Because the fund is actively managed, the fund could underperform its benchmark or other mutual funds with similarinvestment objectives.
Call Risk — If an issuer calls higher-yielding bonds held by the fund, performance could be adversely impacted.
Credit Risk — The issuer of a debt security could suffer adverse changes in financial condition that result in a payment default or a downgrade ofthe security. Parties to contracts with the fund could default on their obligations.
Derivatives Risk — The use of derivative instruments involves additional risks and transaction costs which could leave the fund in a worse positionthan if it had not used these instruments. Derivatives may entail investment exposures that are greater than their cost would suggest. As a result, asmall investment in derivatives could have a large impact on performance. When the fund invests in a derivative for speculative purposes, the fundwill be fully exposed to the risks of loss of that derivative, which may sometimes be greater than the derivative’s cost.
Dollar Roll Transaction Risk — The use of dollar rolls can increase the volatility of the fund’s share price, and it may have an adverse impact onperformance unless the advisor correctly predicts mortgage prepayments and interest rates.
Emerging Markets Risk — Investments in emerging markets are subject to special political, economic, and market risks that can make the fund’semerging market investments more volatile and less liquid than investments in developed markets.
Foreign Security Risk — Securities of foreign issuers, even when dollar denominated and publicly traded in the United States, may involve risks notassociated with the securities of domestic issuers.
High-Yield Securities Risk — High-yield securities generally are less liquid, have more volatile prices, and have greater credit risk than investmentgrade securities.
Income Risk — The fund’s income could decline during periods of falling interest rates.
Interest Rate Risk — Interest rate increases can cause the value of debt securities to decrease.
International Investing Risk — Investing in non-dollar denominated foreign securities involves risk not typically associated with U.S. investing, suchas currency risk, risks of trading in foreign securities markets, and political and economic risks.
Liquidity Risk — Trading opportunities are more limited for debt securities that have received ratings below investment grade.
Mortgage- and Asset-Backed Securities Risk — These securities generally can be prepaid at any time. Prepayments that occur either more quicklyor more slowly than expected can adversely impact the fund.
Fund PerformanceThe following bar chart and table provide some indication of the potential risks of investing in the fund. The fund’s past performance is notnecessarily an indication of how the fund will perform in the future. Updated performance information is available online at firstamericanfunds.comor by calling 800 677-3863.
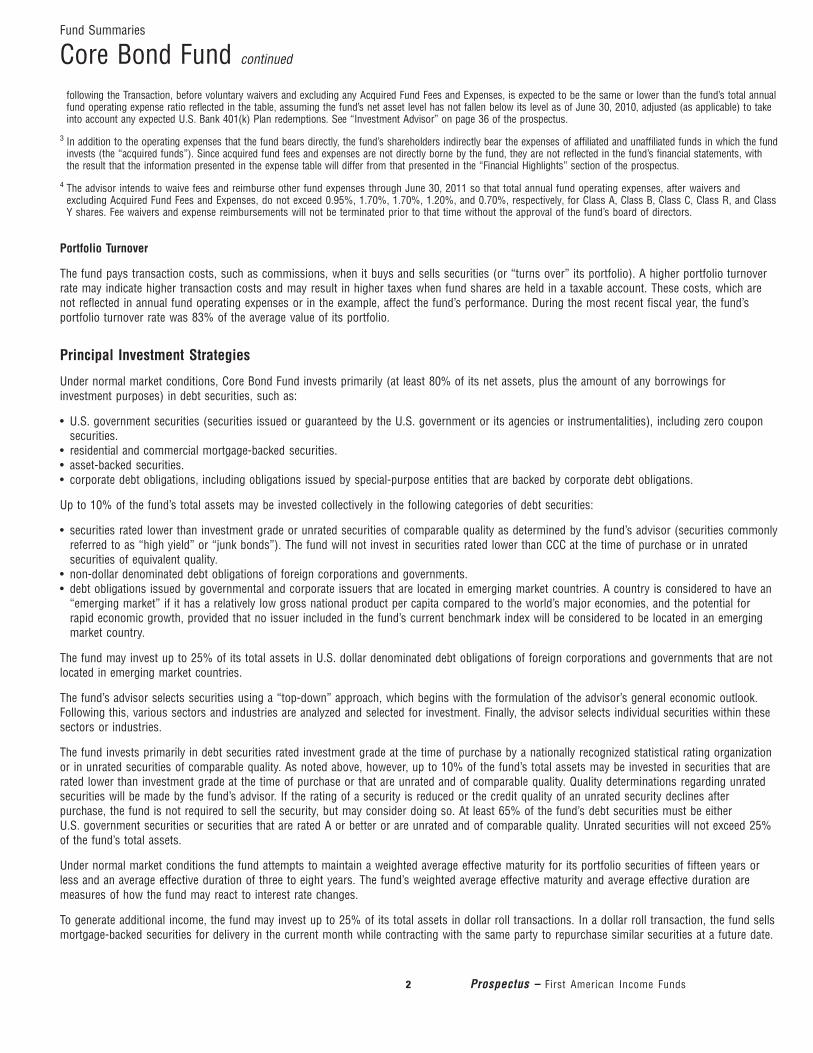
The bar chart shows you the variability of the fund’s performance from year to year for Class A shares. Sales charges are not reflected in the chart;if they were, returns would be lower.
3 Prospectus – First American Income Funds
Fund Summaries
Core Bond Fund continued
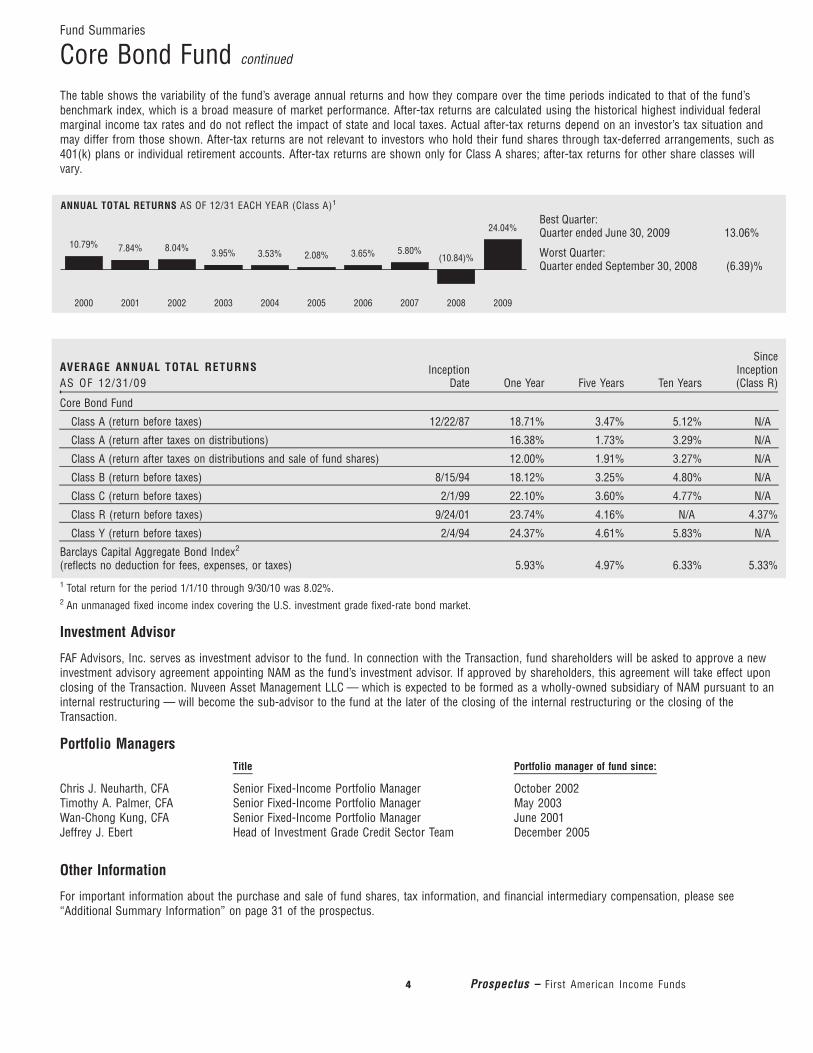
The table shows the variability of the fund’s average annual returns and how they compare over the time periods indicated to that of the fund’sbenchmark index, which is a broad measure of market performance. After-tax returns are calculated using the historical highest individual federalmarginal income tax rates and do not reflect the impact of state and local taxes. Actual after-tax returns depend on an investor’s tax situation andmay differ from those shown. After-tax returns are not relevant to investors who hold their fund shares through tax-deferred arrangements, such as401(k) plans or individual retirement accounts. After-tax returns are shown only for Class A shares; after-tax returns for other share classes willvary.
ANNUAL TOTAL RETURNS AS OF 12/31 EACH YEAR (Class A)1
Best Quarter:Quarter ended June 30, 2009 13.06%
Worst Quarter:Quarter ended September 30, 2008 (6.39)%
10.79% 7.84% 8.04% 3.95% 3.53% 2.08% 3.65% 5.80%(10.84)%
24.04%
2000 2001 2002 2003 2004 2005 2006 2007 2008 2009
AVERAGE ANNUAL TOTAL RETURNSAS OF 12/31/09
InceptionDate One Year Five Years Ten Years
SinceInception(Class R)
Core Bond Fund
Class A (return before taxes) 12/22/87 18.71% 3.47% 5.12% N/A
Class A (return after taxes on distributions) 16.38% 1.73% 3.29% N/A
Class A (return after taxes on distributions and sale of fund shares) 12.00% 1.91% 3.27% N/A
Class B (return before taxes) 8/15/94 18.12% 3.25% 4.80% N/A
Class C (return before taxes) 2/1/99 22.10% 3.60% 4.77% N/A
Class R (return before taxes) 9/24/01 23.74% 4.16% N/A 4.37%
Class Y (return before taxes) 2/4/94 24.37% 4.61% 5.83% N/A
Barclays Capital Aggregate Bond Index2
(reflects no deduction for fees, expenses, or taxes) 5.93% 4.97% 6.33% 5.33%
1 Total return for the period 1/1/10 through 9/30/10 was 8.02%.2 An unmanaged fixed income index covering the U.S. investment grade fixed-rate bond market.
Investment Advisor
FAF Advisors, Inc. serves as investment advisor to the fund. In connection with the Transaction, fund shareholders will be asked to approve a newinvestment advisory agreement appointing NAM as the fund’s investment advisor. If approved by shareholders, this agreement will take effect uponclosing of the Transaction. Nuveen Asset Management LLC — which is expected to be formed as a wholly-owned subsidiary of NAM pursuant to aninternal restructuring — will become the sub-advisor to the fund at the later of the closing of the internal restructuring or the closing of theTransaction.
Portfolio ManagersTitle Portfolio manager of fund since:
Chris J. Neuharth, CFA Senior Fixed-Income Portfolio Manager October 2002Timothy A. Palmer, CFA Senior Fixed-Income Portfolio Manager May 2003Wan-Chong Kung, CFA Senior Fixed-Income Portfolio Manager June 2001Jeffrey J. Ebert Head of Investment Grade Credit Sector Team December 2005
Other Information
For important information about the purchase and sale of fund shares, tax information, and financial intermediary compensation, please see“Additional Summary Information” on page 31 of the prospectus.
4 Prospectus – First American Income Funds
Fund Summaries
Core Bond Fund continued

Fund Summaries
High Income Bond FundOn July 29, 2010, FAF Advisors, Inc. (the “advisor”) and its parent company, U.S. Bank National Association, entered into an agreement withNuveen Investments, Inc. (“Nuveen”) and certain Nuveen affiliates, including Nuveen Asset Management (“NAM”), to sell a portion of the advisor’sasset management business (the “Transaction”). Included in the sale will be that part of the advisor’s asset management business that advises thefund. The sale is subject to the satisfaction of customary conditions, and is currently expected to close by the end of 2010.
Investment Objective
High Income Bond Fund’s objective is to provide investors with a high level of current income.
Fees and Expenses
The following tables describe the fees and expenses that you may pay if you buy and hold shares of the fund. You may qualify for sales chargediscounts on purchases of Class A shares if you and your family invest, or agree to invest in the future, at least $50,000 in First American funds.More information about these and other discounts is available from your financial professional and under “Determining Your Share Price” onpage 41 of the prospectus and “Reducing Class A Sales Charges” on page 84 of the statement of additional information.
Shareholder Fees(fees paid directly from your investment) Class A Class B Class C Class R Class Y
Maximum Sales Charge (Load) Imposed on Purchases(as a percentage of offering price) 4.25% None None None None
Maximum Deferred Sales Charge (Load)(as a percentage of original purchase price or redemption proceeds, whichever is less)1 None 5.00% 1.00% None None
Annual Low Balance Account Fee (for accounts under $1,000) $15 $15 $15 None None
Annual Fund Operat ing Expenses2
(expenses that you pay each year as a percentage of the value of your investment)
Management Fees 0.70% 0.70% 0.70% 0.70% 0.70%
Distribution and/or Service (12b-1) Fees 0.25% 1.00% 1.00% 0.50% None
Other Expenses
Administration Fee 0.22% 0.22% 0.22% 0.22% 0.22%
Miscellaneous 0.12% 0.12% 0.12% 0.12% 0.12%
Acquired Fund Fees and Expenses3 0.04% 0.04% 0.04% 0.04% 0.04%
Total Annual Fund Operating Expenses4 1.33% 2.08% 2.08% 1.58% 1.08%
Example: This example is intended to help you compare the cost of investing in the fund with the cost of investing in other mutual funds. Theexample assumes that you invest $10,000 in the fund for the time periods indicated and then either redeem or do not redeem all of your shares atthe end of those periods. The example also assumes that your investment has a 5% return each year and the fund’s operating expenses remain thesame. Although your actual costs may be higher or lower, based on these assumptions your costs would be:
Class A
Class Bassuming
redemptionat end of
each period
Class Bassuming no
redemptionat end of
each period
Class Cassuming
redemptionat end of
each period
Class Cassuming no
redemptionat end of
each period Class R Class Y
1 year $ 555 $ 711 $ 211 $ 311 $ 211 $ 161 $ 110
3 years $ 829 $1,052 $ 652 $ 652 $ 652 $ 499 $ 343
5 years $1,123 $1,319 $1,119 $1,119 $1,119 $ 860 $ 595
10 years $1,958 $2,219 $2,219 $2,410 $2,410 $1,878 $1,317
1 Class A share investments of $1 million or more on which no front-end sales charge is paid may be subject to a contingent deferred sales charge (CDSC) of up to1%. The CDSC on Class B shares declines over a six-year period from purchase. The CDSC on Class C shares applies only to redemptions within one year ofpurchase.
2 Assuming shareholders approve the new advisory agreement with NAM proposed in connection with the Transaction, the fund’s expense structure will change uponclosing of the Transaction. However, the fund’s net expense ratio immediately following the Transaction, after voluntary waivers by NAM and excluding any AcquiredFund Fees and Expenses, is expected to be the same or lower than the annual fund operating expense ratio reflected in footnote 4 below, assuming the fund’s net assetlevel has not fallen below its level as of June 30, 2010, adjusted to take into account any redemptions by the U.S. Bank 401(k) Plan expected to occur prior to closing of
5 Prospectus – First American Income Funds
the Transaction. Further, NAM has agreed to maintain the fund’s current expense cap at least through June 30, 2011. In addition, the fund’s expense ratio immediatelyfollowing the Transaction, before voluntary waivers and excluding any Acquired Fund Fees and Expenses, is expected to be the same or lower than the fund’s total annualfund operating expense ratio reflected in the table, assuming the fund’s net asset level has not fallen below its level as of June 30, 2010, adjusted (as applicable) to takeinto account any expected U.S. Bank 401(k) Plan redemptions. See “Investment Advisor” on page 36 of the prospectus.
3 In addition to the operating expenses that the fund bears directly, the fund’s shareholders indirectly bear the expenses of affiliated and unaffiliated funds in which thefund invests (the “acquired funds”). Since acquired fund fees and expenses are not directly borne by the fund, they are not reflected in the fund’s financialstatements, with the result that the information presented in the expense table will differ from that presented in the “Financial Highlights” section of the prospectus.
4 The advisor intends to waive fees and reimburse other fund expenses through June 30, 2011 so that total annual fund operating expenses, after waivers andexcluding Acquired Fund Fees and Expenses, do not exceed 1.10%, 1.85%, 1.85%, 1.35%, and 0.85%, respectively, for Class A, Class B, Class C, Class R, and ClassY shares. Fee waivers and expense reimbursements will not be terminated prior to that time without the approval of the fund’s board of directors.
Portfolio Turnover
The fund pays transaction costs, such as commissions, when it buys and sells securities (or “turns over” its portfolio). A higher portfolio turnoverrate may indicate higher transaction costs and may result in higher taxes when fund shares are held in a taxable account. These costs, which arenot reflected in annual fund operating expenses or in the example, affect the fund’s performance. During the most recent fiscal year, the fund’sportfolio turnover rate was 132% of the average value of its portfolio.
Principal Investment Strategies
Under normal market conditions, High Income Bond Fund invests primarily (at least 80% of its net assets, plus the amount of any borrowings forinvestment purposes) in debt securities rated lower than investment grade at the time of purchase or in unrated securities of comparable quality(securities commonly referred to as “high-yield” securities of “junk bonds”). These securities generally provide high income in an effort tocompensate investors for their higher risk of default, which is the failure to make required interest or principal payments. High-yield bond issuersinclude small or relatively new companies lacking the history or capital to merit investment-grade status, former blue chip companies downgradedbecause of financial problems, companies electing to borrow heavily to finance or avoid a takeover or buyout, and firms with heavy debt loads. Thefund may invest in exchange-traded funds, closed-end funds, and other investment companies (“investment companies”).
The fund’s advisor employs a bottom up approach to investing. The advisor devotes more resources to evaluating individual securities rather thanassessing macro-economic trends. Securities are selected using fundamental credit research to identify relative value in the market. Positions aresold in anticipation of credit deterioration or when a security is priced expensively relative to other comparable investments.
There is no minimum rating requirement and no limitation on the average maturity or average effective duration of securities held by the fund.
The fund may invest up to 25% of its total assets in dollar denominated debt obligations of foreign corporations and governments. Up to 20% ofthe fund’s total assets may be invested in dollar denominated debt obligations issued by governmental and corporate issuers that are located inemerging market countries. A country is considered to have an “emerging market” if it has a relatively low gross national product per capitacompared to the world’s major economies, and the potential for rapid economic growth, provided that no issuer included in the fund’s currentbenchmark index will be considered to be located in an emerging market country.
The fund may utilize the following derivatives: options; futures contracts; options on futures contracts; swap agreements, including swapagreements on interest rates, security indexes and specific securities, and credit default swap agreements; and options on the foregoing types ofswap agreements. The fund may enter into standardized derivatives contracts traded on domestic or foreign securities exchanges, boards of trade,or similar entities, and non-standardized derivatives contracts traded in the over-the-counter (“OTC”) market. The fund may use these derivatives inan attempt to manage market risk, credit risk and yield curve risk, to manage the effective maturity or duration of securities in the fund’s portfolioor for speculative purposes in an effort to increase the fund’s yield or to enhance returns. The use of a derivative is speculative if the fund isprimarily seeking to enhance returns, rather than offset the risk of other positions. The fund may not use any derivative to gain exposure to asecurity or type of security that it would be prohibited by its investment restrictions from purchasing directly.
Principal Risks
The price and yield of this fund will change daily due to changes in interest rates and other factors, which means you could lose money. Aninvestment in the fund is not a deposit of U.S. Bank National Association and is not insured or guaranteed by the Federal Deposit InsuranceCorporation or any other governmental agency. The principal risks of investing in this fund are described below:
Active Management Risk — Because the fund is actively managed, the fund could underperform its benchmark or other mutual funds with similarinvestment objectives.
Additional Expenses — When the fund invests in other investment companies, you bear both your proportionate share of fund expenses and,indirectly, the expenses of the other investment companies.
6 Prospectus – First American Income Funds
Fund Summaries
High Income Bond Fund continued

Call Risk — If an issuer calls higher-yielding bonds held by the fund, performance could be adversely impacted.
Credit Risk — The issuer of a debt security could suffer adverse changes in financial condition that result in a payment default or a downgrade ofthe security. Parties to contracts with the fund could default on their obligations.
Derivatives Risk — The use of derivative instruments involves additional risks and transaction costs which could leave the fund in a worse positionthan if it had not used these instruments. Derivatives may entail investment exposures that are greater than their cost would suggest. As a result, asmall investment in derivatives could have a large impact on performance. When the fund invests in a derivative for speculative purposes, the fundwill be fully exposed to the risks of loss of that derivative, which may sometimes be greater than the derivative’s cost.
Emerging Markets Risk — Investments in emerging markets are subject to special political, economic, and market risks that can make the fund’semerging market investments more volatile and less liquid than investments in developed markets.
Foreign Security Risk — Securities of foreign issuers, even when dollar denominated and publicly traded in the United States, may involve risks notassociated with the securities of domestic issuers.
High-Yield Securities Risk — High-yield securities generally are less liquid, have more volatile prices, and have greater credit risk than investmentgrade securities.
Income Risk — The fund’s income could decline during periods of falling interest rates.
Interest Rate Risk — Interest rate increases can cause the value of debt securities to decrease.
Liquidity Risk — Trading opportunities are more limited for debt securities that have received ratings below investment grade.
Fund Performance
The following bar chart and table provide some indication of the potential risks of investing in the fund. The fund’s past performance is notnecessarily an indication of how the fund will perform in the future. Updated performance information is available online at firstamericanfunds.comor by calling 800 677-3863.
The bar chart shows you the variability of the fund’s performance from year to year for Class A shares. Sales charges are not reflected in the chart;if they were, returns would be lower.
The table shows the variability of the fund’s average annual returns and how they compare over the time periods indicated to that of the fund’sbenchmark index, which is a broad measure of market performance. After-tax returns are calculated using the historical highest individual federalmarginal income tax rates and do not reflect the impact of state and local taxes. Actual after-tax returns depend on an investor’s tax situation and maydiffer from those shown. After-tax returns are not relevant to investors who hold their fund shares through tax-deferred arrangements, such as 401(k)plans or individual retirement accounts. After-tax returns are shown only for Class A shares; after-tax returns for other share classes will vary.
21.96%
(19.17)%(1.22)%
24.03%10.30%
2.89%10.46%
1.63%
56.92%
(29.11)%
20042002 2003 2005 2006 2007 2008 2009
Best Quarter:Quarter ended June 30, 2009
Worst Quarter:Quarter ended December 31, 2008
ANNUAL TOTAL RETURNS AS OF 12/31 EACH YEAR (Class A)1,2
7 Prospectus – First American Income Funds
Fund Summaries
High Income Bond Fund continued
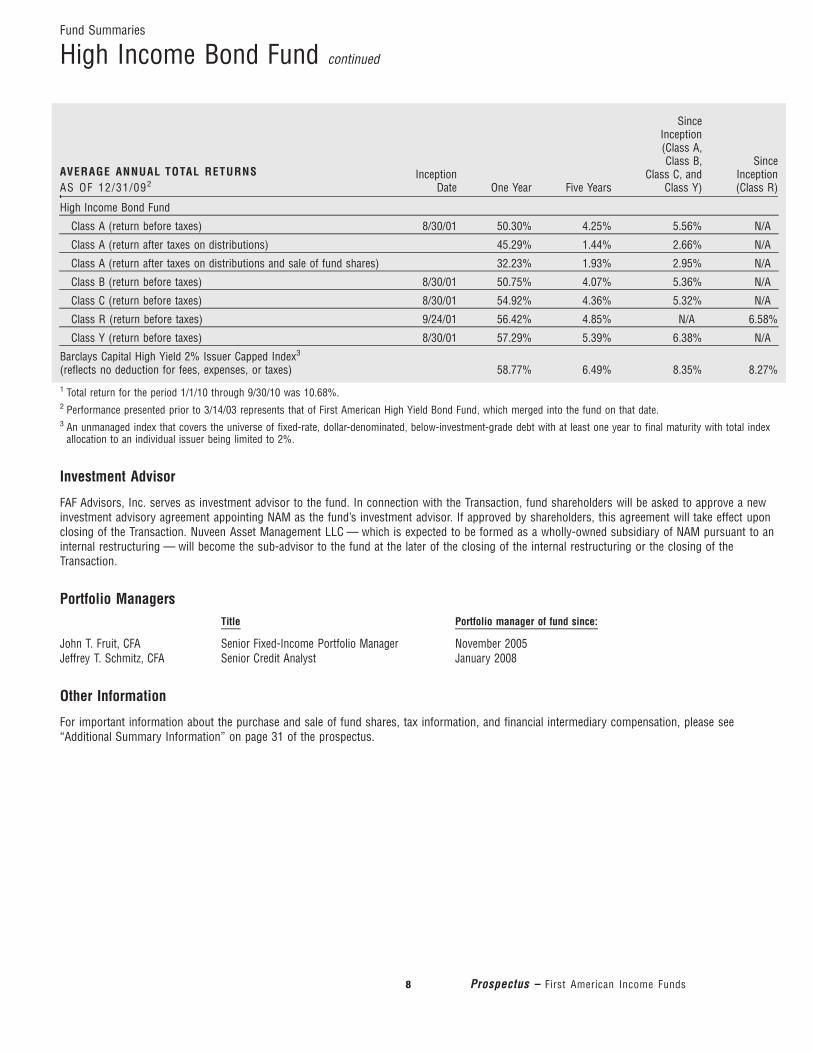
AVERAGE ANNUAL TOTAL RETURNSAS OF 12/31/092
InceptionDate One Year Five Years
SinceInception(Class A,Class B,
Class C, andClass Y)
SinceInception(Class R)
High Income Bond Fund
Class A (return before taxes) 8/30/01 50.30% 4.25% 5.56% N/A
Class A (return after taxes on distributions) 45.29% 1.44% 2.66% N/A
Class A (return after taxes on distributions and sale of fund shares) 32.23% 1.93% 2.95% N/A
Class B (return before taxes) 8/30/01 50.75% 4.07% 5.36% N/A
Class C (return before taxes) 8/30/01 54.92% 4.36% 5.32% N/A
Class R (return before taxes) 9/24/01 56.42% 4.85% N/A 6.58%
Class Y (return before taxes) 8/30/01 57.29% 5.39% 6.38% N/A
Barclays Capital High Yield 2% Issuer Capped Index3
(reflects no deduction for fees, expenses, or taxes) 58.77% 6.49% 8.35% 8.27%
1 Total return for the period 1/1/10 through 9/30/10 was 10.68%.2 Performance presented prior to 3/14/03 represents that of First American High Yield Bond Fund, which merged into the fund on that date.3 An unmanaged index that covers the universe of fixed-rate, dollar-denominated, below-investment-grade debt with at least one year to final maturity with total index
allocation to an individual issuer being limited to 2%.
Investment Advisor
FAF Advisors, Inc. serves as investment advisor to the fund. In connection with the Transaction, fund shareholders will be asked to approve a newinvestment advisory agreement appointing NAM as the fund’s investment advisor. If approved by shareholders, this agreement will take effect uponclosing of the Transaction. Nuveen Asset Management LLC — which is expected to be formed as a wholly-owned subsidiary of NAM pursuant to aninternal restructuring — will become the sub-advisor to the fund at the later of the closing of the internal restructuring or the closing of theTransaction.
Portfolio ManagersTitle Portfolio manager of fund since:
John T. Fruit, CFA Senior Fixed-Income Portfolio Manager November 2005Jeffrey T. Schmitz, CFA Senior Credit Analyst January 2008
Other Information
For important information about the purchase and sale of fund shares, tax information, and financial intermediary compensation, please see“Additional Summary Information” on page 31 of the prospectus.
8 Prospectus – First American Income Funds
Fund Summaries
High Income Bond Fund continued
Fund Summaries
Inflation Protected Securities FundOn July 29, 2010, FAF Advisors, Inc. (the “advisor”) and its parent company, U.S. Bank National Association, entered into an agreement withNuveen Investments, Inc. (“Nuveen”) and certain Nuveen affiliates, including Nuveen Asset Management (“NAM”), to sell a portion of the advisor’sasset management business (the “Transaction”). Included in the sale will be that part of the advisor’s asset management business that advises thefund. The sale is subject to the satisfaction of customary conditions, and is currently expected to close by the end of 2010.
Investment Objective
Inflation Protected Securities Fund’s objective is to provide investors with total return while providing protection against inflation.
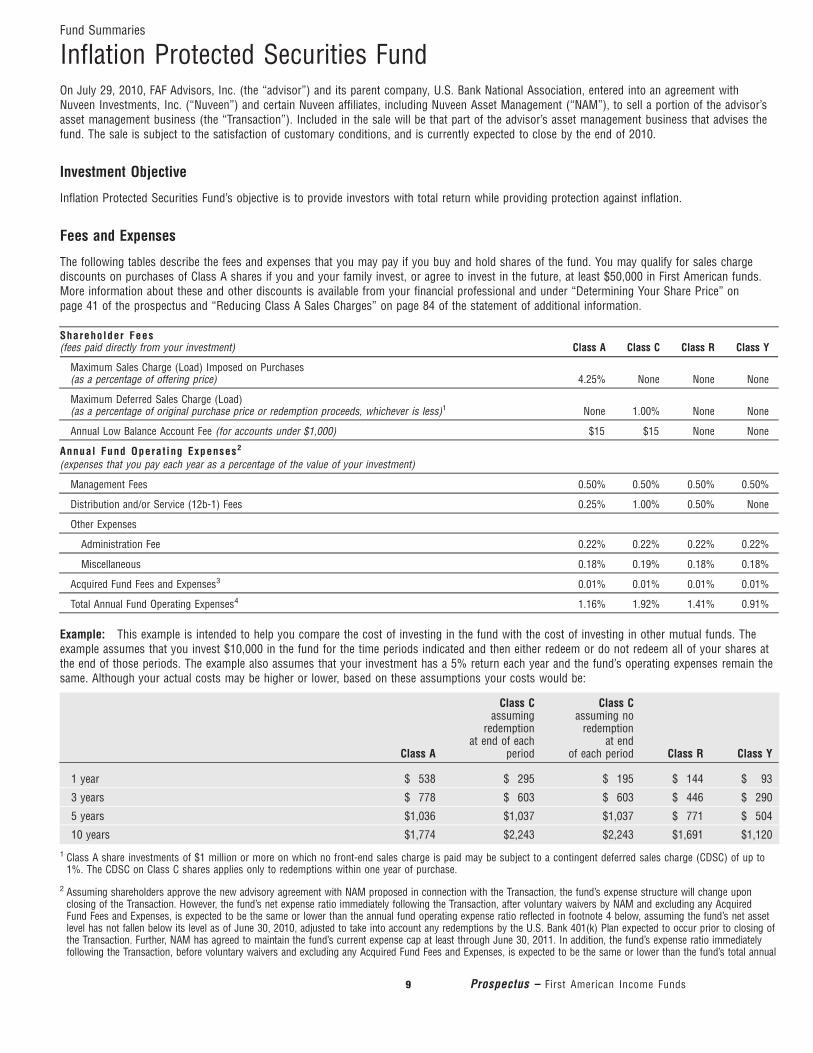
Fees and Expenses
The following tables describe the fees and expenses that you may pay if you buy and hold shares of the fund. You may qualify for sales chargediscounts on purchases of Class A shares if you and your family invest, or agree to invest in the future, at least $50,000 in First American funds.More information about these and other discounts is available from your financial professional and under “Determining Your Share Price” onpage 41 of the prospectus and “Reducing Class A Sales Charges” on page 84 of the statement of additional information.
Shareholder Fees(fees paid directly from your investment) Class A Class C Class R Class Y
Maximum Sales Charge (Load) Imposed on Purchases(as a percentage of offering price) 4.25% None None None
Maximum Deferred Sales Charge (Load)(as a percentage of original purchase price or redemption proceeds, whichever is less)1 None 1.00% None None
Annual Low Balance Account Fee (for accounts under $1,000) $15 $15 None None
Annual Fund Operat ing Expenses2
(expenses that you pay each year as a percentage of the value of your investment)
Management Fees 0.50% 0.50% 0.50% 0.50%
Distribution and/or Service (12b-1) Fees 0.25% 1.00% 0.50% None
Other Expenses
Administration Fee 0.22% 0.22% 0.22% 0.22%
Miscellaneous 0.18% 0.19% 0.18% 0.18%
Acquired Fund Fees and Expenses3 0.01% 0.01% 0.01% 0.01%
Total Annual Fund Operating Expenses4 1.16% 1.92% 1.41% 0.91%
Example: This example is intended to help you compare the cost of investing in the fund with the cost of investing in other mutual funds. Theexample assumes that you invest $10,000 in the fund for the time periods indicated and then either redeem or do not redeem all of your shares atthe end of those periods. The example also assumes that your investment has a 5% return each year and the fund’s operating expenses remain thesame. Although your actual costs may be higher or lower, based on these assumptions your costs would be:
Class A
Class Cassuming
redemptionat end of each
period
Class Cassuming no
redemptionat end
of each period Class R Class Y
1 year $ 538 $ 295 $ 195 $ 144 $ 93
3 years $ 778 $ 603 $ 603 $ 446 $ 290
5 years $1,036 $1,037 $1,037 $ 771 $ 504
10 years $1,774 $2,243 $2,243 $1,691 $1,120
1 Class A share investments of $1 million or more on which no front-end sales charge is paid may be subject to a contingent deferred sales charge (CDSC) of up to1%. The CDSC on Class C shares applies only to redemptions within one year of purchase.
2 Assuming shareholders approve the new advisory agreement with NAM proposed in connection with the Transaction, the fund’s expense structure will change uponclosing of the Transaction. However, the fund’s net expense ratio immediately following the Transaction, after voluntary waivers by NAM and excluding any AcquiredFund Fees and Expenses, is expected to be the same or lower than the annual fund operating expense ratio reflected in footnote 4 below, assuming the fund’s net assetlevel has not fallen below its level as of June 30, 2010, adjusted to take into account any redemptions by the U.S. Bank 401(k) Plan expected to occur prior to closing ofthe Transaction. Further, NAM has agreed to maintain the fund’s current expense cap at least through June 30, 2011. In addition, the fund’s expense ratio immediatelyfollowing the Transaction, before voluntary waivers and excluding any Acquired Fund Fees and Expenses, is expected to be the same or lower than the fund’s total annual
9 Prospectus – First American Income Funds

fund operating expense ratio reflected in the table, assuming the fund’s net asset level has not fallen below its level as of June 30, 2010, adjusted (as applicable) to takeinto account any expected U.S. Bank 401(k) Plan redemptions. See “Investment Advisor” on page 36 of the prospectus.
3 In addition to the operating expenses that the fund bears directly, the fund’s shareholders indirectly bear the expenses of affiliated and unaffiliated funds in which thefund invests (the “acquired funds”). Since acquired fund fees and expenses are not directly borne by the fund, they are not reflected in the fund’s financialstatements, with the result that the information presented in the expense table will differ from that presented in the “Financial Highlights” section of the prospectus.
4 The advisor intends to waive fees and reimburse other fund expenses through June 30, 2011 so that total annual fund operating expenses, after waivers andexcluding Acquired Fund Fees and Expenses, do not exceed 0.85%, 1.60%, 1.10%, and 0.60%, respectively, for Class A, Class C, Class R, and Class Y shares. Feewaivers and expense reimbursements will not be terminated prior to that time without the approval of the fund’s board of directors.
Portfolio Turnover
The fund pays transaction costs, such as commissions, when it buys and sells securities (or “turns over” its portfolio). A higher portfolio turnoverrate may indicate higher transaction costs and may result in higher taxes when fund shares are held in a taxable account. These costs, which arenot reflected in annual fund operating expenses or in the example, affect the fund’s performance. During the most recent fiscal year, the fund’sportfolio turnover rate was 72% of the average value of its portfolio.
Principal Investment Strategies
Under normal market conditions, Inflation Protected Securities Fund invests primarily (at least 80% of its net assets, plus the amount of anyborrowings for investment purposes) in inflation protected debt securities. These securities will be issued by the U.S. and non-U.S. governments,their agencies and instrumentalities, and domestic and foreign corporations. The fund’s investments in U.S. Government inflation protectedsecurities will include U.S. Treasury inflation protected securities as well as inflation protected securities issued by agencies and instrumentalities ofthe U.S. Government. Securities issued by the U.S. Treasury are backed by the full faith and credit of the U.S. Government. Some securities issuedby agencies and instrumentalities of the U.S. Government are supported only by the credit of the issuing agency or instrumentality.
Inflation protected debt securities are designed to provide protection against the negative effects of inflation. Unlike traditional debt securities, whichpay regular fixed interest payments on a fixed principal amount, interest payments on inflation protected debt securities will vary with the rate ofinflation. The U.S. Treasury used the Consumer Price Index for Urban Consumers (CPI-U) as the inflation measure. Inflation protected debtsecurities issued by foreign governments and corporations are generally linked to a non-U.S. inflation rate.
Inflation protected debt securities have two common structures. The U.S. Treasury and some other issuers use a structure that accrues inflation intothe principal value of the bond. If the index measuring the rate of inflation rises, the principal value of the security will increase. Because interestpayments will be calculated with respect to a larger principal amount, interest payments also will increase. Conversely, if the index measuring therate of inflation falls, the principal value of the security will fall and interest payments will decrease. Other issuers adjust the interest rates payableon the security according to the rate of inflation, but the principal amount remains the same.
In the event of sustained deflation, the U.S. Treasury has guaranteed that it will repay at maturity at least the original face value of the inflationprotected securities that it issues. Other inflation protected debt securities that accrue inflation into their principal value may or may not provide asimilar guarantee. For securities that do not provide such a guarantee, the adjusted principal value of the security repaid at maturity may be lessthan the original principal value.
Up to 20% of the fund’s assets may be invested in holdings that are not inflation protected. These holdings may include the following:
• domestic and foreign corporate debt obligations.• securities issued or guaranteed by the U.S. government or its agencies and instrumentalities.• debt obligations of foreign governments.• residential and commercial mortgage-backed securities.• asset-backed securities.• derivative instruments, as discussed below.
When selecting securities for the fund, the fund’s advisor uses a “top-down” approach, looking first at general economic factors and marketconditions. The advisor then selects securities that it believes have strong relative value based on an analysis of a security’s characteristics (such asprincipal value, coupon rate, maturity, duration and yield) in light of these general economic factors and market conditions. The advisor will sellsecurities if the securities no longer meet these criteria, if other investments appear to be a better relative value, to manage the duration of thefund, or to meet redemption requests.
The fund invests primarily in securities rated investment grade at the time of purchase by a nationally recognized statistical rating organization or inunrated securities of comparable quality. However, up to 10% of the fund’s net assets may be invested in securities that are rated lower thaninvestment grade at the time of purchase or that are unrated and of comparable quality (securities commonly referred to as “high-yield” securities
10 Prospectus – First American Income Funds
Fund Summaries
Inflation Protected Securities Fund continued
or “junk bonds”). The fund will not invest in securities rated lower than B at the time of purchase or in unrated securities of equivalent quality.Quality determinations regarding unrated securities will be made by the fund’s advisor.
The fund may invest up to 20% of its net assets in non-dollar denominated securities, and may invest without limitation in U.S. dollar denominatedsecurities of foreign corporations and governments.
The fund may invest in debt securities of any maturity, but expects to maintain, under normal market conditions, a weighted average effectivematurity of between eight and fifteen years and an average effective duration of between four and ten years. The fund’s weighted average effectivematurity and average effective duration are measures of how the fund may react to interest rate changes.
The fund may utilize the following derivatives: options; futures contracts; options on futures contracts; foreign currency contracts; options onforeign currencies; interest rate caps, collars, and floors; index- and other asset-linked notes; swap agreements, including swap agreements oninterest rates, currency rates, security indexes and specific securities, and credit default swap agreements; and options on the foregoing types ofswap agreements. The fund may enter into standardized derivatives contracts traded on domestic or foreign securities exchanges, boards of trade,or similar entities, and non-standardized derivatives contracts traded in the over-the-counter (“OTC”) market. The fund may use these derivatives inan attempt to manage market risk, currency risk, credit risk and yield curve risk, to manage the effective maturity or duration of securities in thefund’s portfolio or for speculative purposes in an effort to increase the fund’s yield or to enhance returns. The fund may also use derivatives to gainexposure to non-dollar denominated securities markets to the extent it does not do so through direct investments. The use of a derivative isspeculative if the fund is primarily seeking to enhance returns, rather than offset the risk of other positions. The fund may not use any derivative togain exposure to a security or type of security that it would be prohibited by its investment restrictions from purchasing directly.
Principal Risks
The price and yield of this fund will change daily due to changes in interest rates, inflation and other factors, which means you could lose money.An investment in the fund is not a deposit of U.S. Bank National Association and is not insured or guaranteed by the Federal Deposit InsuranceCorporation or any other governmental agency. The principal risks of investing in this fund are described below:
Active Management Risk — Because the fund is actively managed, the fund could underperform its benchmark or other mutual funds with similarinvestment objectives.
Call Risk — If an issuer calls higher-yielding bonds held by the fund, performance could be adversely impacted.
Credit Risk — The issuer of a debt security could suffer adverse changes in financial condition that result in a payment default or a downgrade ofthe security. Parties to contracts with the fund could default on their obligations.
Derivatives Risk — The use of derivative instruments involves additional risks and transaction costs which could leave the fund in a worse positionthan if it had not used these instruments. Derivatives may entail investment exposures that are greater than their cost would suggest. As a result, asmall investment in derivatives could have a large impact on performance. When the fund invests in a derivative for speculative purposes, the fundwill be fully exposed to the risks of loss of that derivative, which may sometimes be greater than the derivative’s cost.
Foreign Security Risk — Securities of foreign issuers, even when dollar denominated and publicly traded in the United States, may involve risks notassociated with the securities of domestic issuers.
High-Yield Securities Risk — High-yield securities generally are less liquid, have more volatile prices, and have greater credit risk than investmentgrade securities.
Income Risk — The fund’s income could decline during periods of falling interest rates. In addition, because the interest and/or principal paymentson inflation protected securities are adjusted periodically for changes in inflation, the income distributed by the fund may be irregular. In a period ofsustained deflation, the inflation protected securities held by the fund, and consequently the fund itself, may not pay any income.
Index Methodology Risk — There can be no assurance that the U.S. or any foreign inflation index will accurately measure the real rate of inflation inthe prices of goods and services.
Interest Rate Risk — Interest rate increases can cause the value of debt securities to decrease. Inflation protected securities may react differentlyfrom other debt securities to changes in interest rates. Generally, the value of an inflation protected security is affected by changes in “real” interestrates, which are stated interest rates reduced by the expected impact of inflation. Values of these securities normally fall when real interest ratesrise and rise when real interest rates fall.
International Investing Risk — Investing in non-dollar denominated foreign securities involves risk not typically associated with U.S. investing, suchas currency risk, risks of trading in foreign securities markets, and political and economic risks.
Liquidity Risk — Trading opportunities are more limited for debt securities that have received ratings below investment grade.
11 Prospectus – First American Income Funds
Fund Summaries
Inflation Protected Securities Fund continued
Mortgage- and Asset-Backed Securities Risk — These securities generally can be prepaid at any time. Prepayments that occur either more quicklyor more slowly than expected can adversely impact the fund.
Tax Consequences of Inflation Adjustments — Because inflation adjustments to the principal amount of an inflation protected security will beincluded in the fund’s income, the fund may have to make income distributions to shareholders that exceed the cash it receives.
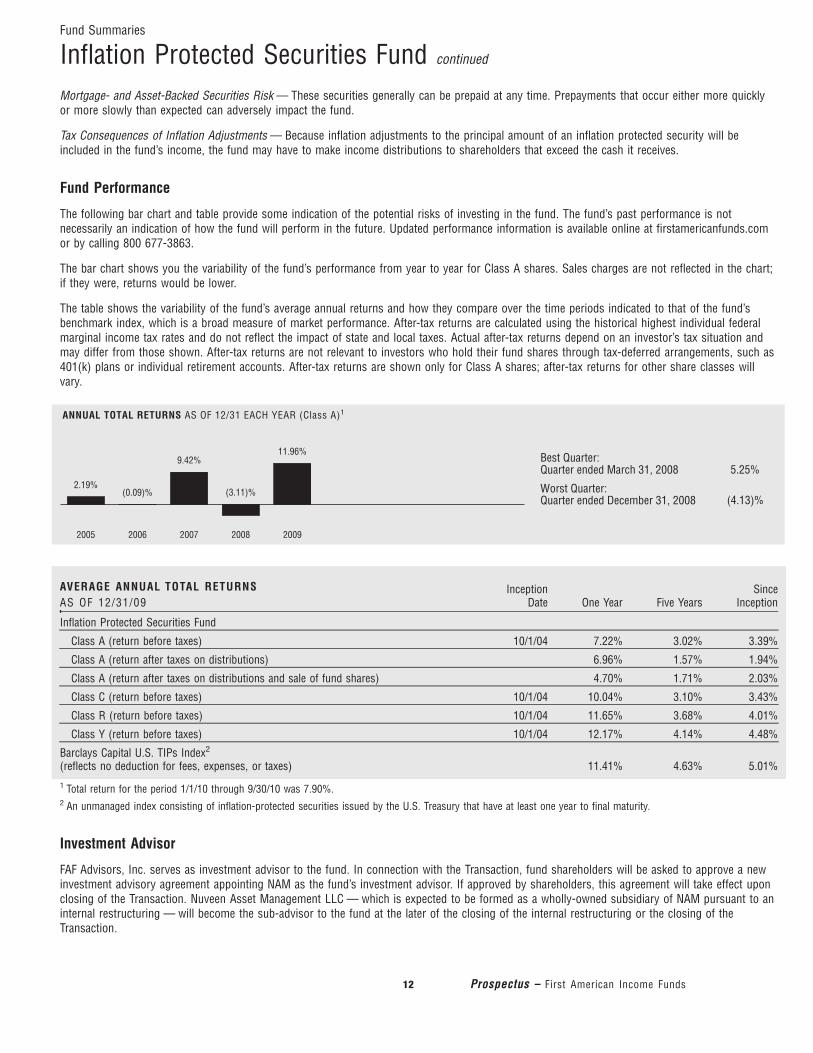
Fund Performance
The following bar chart and table provide some indication of the potential risks of investing in the fund. The fund’s past performance is notnecessarily an indication of how the fund will perform in the future. Updated performance information is available online at firstamericanfunds.comor by calling 800 677-3863.
The bar chart shows you the variability of the fund’s performance from year to year for Class A shares. Sales charges are not reflected in the chart;if they were, returns would be lower.
The table shows the variability of the fund’s average annual returns and how they compare over the time periods indicated to that of the fund’sbenchmark index, which is a broad measure of market performance. After-tax returns are calculated using the historical highest individual federalmarginal income tax rates and do not reflect the impact of state and local taxes. Actual after-tax returns depend on an investor’s tax situation andmay differ from those shown. After-tax returns are not relevant to investors who hold their fund shares through tax-deferred arrangements, such as401(k) plans or individual retirement accounts. After-tax returns are shown only for Class A shares; after-tax returns for other share classes willvary.
5.25%
(4.13)%2.19%
(0.09)%
9.42%
(3.11)%
11.96%
2005 2006 2007 2008 2009
Best Quarter:Quarter ended March 31, 2008
Worst Quarter:Quarter ended December 31, 2008
ANNUAL TOTAL RETURNS AS OF 12/31 EACH YEAR (Class A)1
AVERAGE ANNUAL TOTAL RETURNSAS OF 12/31/09
InceptionDate One Year Five Years
SinceInception
Inflation Protected Securities Fund
Class A (return before taxes) 10/1/04 7.22% 3.02% 3.39%
Class A (return after taxes on distributions) 6.96% 1.57% 1.94%
Class A (return after taxes on distributions and sale of fund shares) 4.70% 1.71% 2.03%
Class C (return before taxes) 10/1/04 10.04% 3.10% 3.43%
Class R (return before taxes) 10/1/04 11.65% 3.68% 4.01%
Class Y (return before taxes) 10/1/04 12.17% 4.14% 4.48%
Barclays Capital U.S. TIPs Index2
(reflects no deduction for fees, expenses, or taxes) 11.41% 4.63% 5.01%
1 Total return for the period 1/1/10 through 9/30/10 was 7.90%.2 An unmanaged index consisting of inflation-protected securities issued by the U.S. Treasury that have at least one year to final maturity.
Investment Advisor
FAF Advisors, Inc. serves as investment advisor to the fund. In connection with the Transaction, fund shareholders will be asked to approve a newinvestment advisory agreement appointing NAM as the fund’s investment advisor. If approved by shareholders, this agreement will take effect uponclosing of the Transaction. Nuveen Asset Management LLC — which is expected to be formed as a wholly-owned subsidiary of NAM pursuant to aninternal restructuring — will become the sub-advisor to the fund at the later of the closing of the internal restructuring or the closing of theTransaction.
12 Prospectus – First American Income Funds
Fund Summaries
Inflation Protected Securities Fund continued

Portfolio ManagersTitle Portfolio manager of fund since:
Wan-Chong Kung, CFA Senior Fixed-Income Portfolio Manager October 2004
Chad W. Kemper Senior Fixed-Income Trader October 2010
Other Information
For important information about the purchase and sale of fund shares, tax information, and financial intermediary compensation, please see“Additional Summary Information” on page 31 of the prospectus.
13 Prospectus – First American Income Funds
Fund Summaries
Inflation Protected Securities Fund continued

Fund Summaries
Intermediate Government Bond FundOn July 29, 2010, FAF Advisors, Inc. (the “advisor”) and its parent company, U.S. Bank National Association, entered into an agreement withNuveen Investments, Inc. (“Nuveen”) and certain Nuveen affiliates, including Nuveen Asset Management (“NAM”), to sell a portion of the advisor’sasset management business (the “Transaction”). Included in the sale will be that part of the advisor’s asset management business that advises thefund. The sale is subject to the satisfaction of customary conditions, and is currently expected to close by the end of 2010.
Investment Objective
Intermediate Government Bond Fund’s objective is to provide investors with current income to the extent consistent with the preservation of capital.
Fees and Expenses
The following tables describe the fees and expenses that you may pay if you buy and hold shares of the fund. You may qualify for sales chargediscounts on purchases of Class A shares if you and your family invest, or agree to invest in the future, at least $50,000 in First American funds.More information about these and other discounts is available from your financial professional and under “Determining Your Share Price” onpage 41 of the prospectus and “Reducing Class A Sales Charges” on page 84 of the statement of additional information.
Shareholder Fees(fees paid directly from your investment) Class A Class C Class R Class Y
Maximum Sales Charge (Load) Imposed on Purchases(as a percentage of offering price) 2.25% None None None
Maximum Deferred Sales Charge (Load)(as a percentage of original purchase price or redemption proceeds, whichever is less)1 None 1.00% None None
Annual Low Balance Account Fee (for accounts under $1,000) $15 $15 None None
Annual Fund Operat ing Expenses2
(expenses that you pay each year as a percentage of the value of your investment)
Management Fees 0.50% 0.50% 0.50% 0.50%
Distribution and/or Service (12b-1) Fees3 0.25% 1.00% 0.50% None
Other Expenses
Administration Fee 0.22% 0.22% 0.22% 0.22%
Miscellaneous 0.22% 0.22% 0.22% 0.22%
Total Annual Fund Operating Expenses4 1.19% 1.94% 1.44% 0.94%
Example: This example is intended to help you compare the cost of investing in the fund with the cost of investing in other mutual funds. Theexample assumes that you invest $10,000 in the fund for the time periods indicated and then either redeem or do not redeem all of your shares atthe end of those periods. The example also assumes that your investment has a 5% return each year and the fund’s operating expenses remain thesame. Although your actual costs may be higher or lower, based on these assumptions your costs would be:
Class A
Class Cassuming
redemption at endof each period
Class Cassuming no
redemption at endof each period Class R Class Y
1 year $ 344 $ 297 $ 197 $ 147 $ 96
3 years $ 594 $ 609 $ 609 $ 456 $ 300
5 years $ 865 $1,047 $1,047 $ 787 $ 520
10 years $1,636 $2,264 $2,264 $1,724 $1,155
1 Class A share investments of $1 million or more on which no front-end sales charge is paid may be subject to a contingent deferred sales charge (CDSC) of up to1%. The CDSC on Class C shares applies only to redemptions within one year of purchase.
2 Assuming shareholders approve the new advisory agreement with NAM proposed in connection with the Transaction, the fund’s expense structure will change uponclosing of the Transaction. However, the fund’s net expense ratio immediately following the Transaction, after voluntary waivers by NAM and excluding any AcquiredFund Fees and Expenses, is expected to be the same or lower than the annual fund operating expense ratio reflected in footnote 4 below, assuming the fund’s netasset level has not fallen below its level as of June 30, 2010, adjusted to take into account any redemptions by the U.S. Bank 401(k) Plan expected to occur prior toclosing of the Transaction. Further, NAM has agreed to maintain the fund’s current expense cap at least through June 30, 2011. In addition, the fund’s expense ratioimmediately following the Transaction, before voluntary waivers and excluding any Acquired Fund Fees and Expenses, is expected to be the same or lower than thefund’s total annual fund operating expense ratio reflected in the table, assuming the fund’s net asset level has not fallen below its level as of June 30, 2010, adjusted(as applicable) to take into account any expected U.S. Bank 401(k) Plan redemptions. See “Investment Advisor” on page 36 of the prospectus.
3 The distributor has agreed to limit its Class A share 12b-1 fees to 0.15% of average daily net assets through June 30, 2011.
14 Prospectus – First American Income Funds
4 The advisor intends to waive fees and reimburse other fund expenses through June 30, 2011 so that total annual fund operating expenses, after waivers andexcluding Acquired Fund Fees and Expenses, do not exceed 0.75%, 1.60%, 1.10%, and 0.60%, respectively, for Class A, Class C, Class R, and Class Y shares. Feewaivers and expense reimbursements will not be terminated prior to that time without the approval of the fund’s board of directors.
Portfolio Turnover
The fund pays transaction costs, such as commissions, when it buys and sells securities (or “turns over” its portfolio). A higher portfolio turnoverrate may indicate higher transaction costs and may result in higher taxes when fund shares are held in a taxable account. These costs, which arenot reflected in annual fund operating expenses or in the example, affect the fund’s performance. During the most recent fiscal year, the fund’sportfolio turnover rate was 105% of the average value of its portfolio.
Principal Investment Strategies
Under normal market conditions, Intermediate Government Bond Fund invests primarily (at least 80% of its net assets, plus the amount of anyborrowings for investment purposes) in U.S. government securities. U.S. government securities are securities issued or guaranteed by theU.S. government or its agencies or instrumentalities, including the following:
• U.S. Treasury obligations.• Mortgage-backed securities issued by the Government National Mortgage Association, the Federal National Mortgage Association (FNMA), and the
Federal Home Loan Mortgage Corporation (FHLMC).• Non-mortgage-related obligations issued or guaranteed by U.S. government agencies or instrumentalities, such as FNMA, FHLMC, Federal Farm
Credit Banks, the Federal Home Loan Bank System, and the Tennessee Valley Authority, including obligations that are issued by private issuersand guaranteed under the Federal Deposit Insurance Corporation (FDIC) Temporary Liquidity Guarantee Program.
U.S. Treasury obligations and some obligations of U.S. government agencies and instrumentalities are supported by the “full faith and credit” of theU.S. government. Other U.S. government securities are backed by the right of the issuer to borrow from the U.S. Treasury. Still others aresupported only by the credit of the issuing agency or instrumentality.
The fund may invest up to 10% of its total assets, collectively, in non-U.S. government debt obligations, including asset-backed securities,residential and commercial mortgage-backed securities, corporate debt obligations, and municipal securities. Such securities will be ratedinvestment grade at the time of purchase or, if unrated, determined to be of comparable quality by the fund’s advisor.
In selecting securities for the fund, the fund’s advisor first determines its economic outlook and the direction in which inflation and interest rates areexpected to move. In selecting individual securities consistent with this outlook, the advisor evaluates factors such as credit quality, yield, maturity,liquidity, and portfolio diversification.
Under normal market conditions the fund attempts to maintain a weighted average effective maturity between three and ten years and an effectiveduration of between two and one-half and seven years. The fund’s weighted average effective maturity and effective duration are measures of howthe fund may react to interest rate changes.
To generate additional income, the fund may invest up to 10% of its total assets in dollar roll transactions. In a dollar roll transaction, the fund sellsmortgage-backed securities for delivery in the current month while contracting with the same party to repurchase similar securities at a future date.
The fund may utilize futures contracts and options on futures contracts, which are derivative instruments. The fund may enter into futures contractsand options thereon that are traded on domestic securities exchanges, boards of trade, or similar entities, or in the over-the-counter market. Thefund may use futures transactions in an attempt to manage market risk, credit risk and yield curve risk, to manage the effective maturity or durationof securities in the fund’s portfolio, or for speculative purposes in an effort to increase the fund’s yield or to enhance returns. The use of a futurescontract or an option on a futures contract is speculative if the fund is primarily seeking to enhance returns, rather than offset the risk of otherpositions. The fund may not use futures or options on futures to gain exposure to a security or type of security that it would be prohibited by itsinvestment restrictions from purchasing directly.
Principal Risks
The price and yield of this fund will change daily due to changes in interest rates and other factors, which means you could lose money. Aninvestment in the fund is not a deposit of U.S. Bank National Association and is not insured or guaranteed by the Federal Deposit InsuranceCorporation or any other governmental agency. The principal risks of investing in this fund are described below:
Active Management Risk — Because the fund is actively managed, the fund could underperform its benchmark or other mutual funds with similarinvestment objectives.
Call Risk — If an issuer calls higher-yielding bonds held by the fund, performance could be adversely impacted.
15 Prospectus – First American Income Funds
Fund Summaries
Intermediate Government Bond Fund continued

Credit Risk — The issuer of a debt security could suffer adverse changes in financial condition that result in a payment default or a downgrade ofthe security. Parties to contracts with the fund could default on their obligations.
Derivatives Risk — The use of derivative instruments involves additional risks and transaction costs which could leave the fund in a worse positionthan if it had not used these instruments. Derivatives may entail investment exposures that are greater than their cost would suggest. As a result, asmall investment in derivatives could have a large impact on performance. When the fund enters into a futures transaction for speculative purposes,the fund will be fully exposed to the risks of loss of that future or option, which may sometimes be greater than its cost.
Dollar Roll Transaction Risk — The use of dollar rolls can increase the volatility of the fund’s share price, and it may have an adverse impact onperformance unless the advisor correctly predicts mortgage prepayments and interest rates.
Income Risk — The fund’s income could decline during periods of falling interest rates.
Interest Rate Risk — Interest rate increases can cause the value of debt securities to decrease.
Mortgage- and Asset-Backed Securities Risk — These securities generally can be prepaid at any time. Prepayments that occur either more quicklyor more slowly than expected can adversely impact the fund.
Fund Performance
The following bar chart and table provide some indication of the potential risks of investing in the fund. The fund’s past performance is notnecessarily an indication of how the fund will perform in the future. Updated performance information is available online at firstamericanfunds.comor by calling 800 677-3863.
The bar chart shows you the variability of the fund’s performance from year to year for Class A shares. Sales charges are not reflected in the chart;if they were, returns would be lower. Class C and Class R shares have not been offered for a full calendar year.
The table shows the variability of the fund’s average annual returns and how they compare over the time periods indicated to that of the fund’sbenchmark index, which is a broad measure of market performance. After-tax returns are calculated using the historical highest individual federalmarginal income tax rates and do not reflect the impact of state and local taxes. Actual after-tax returns depend on an investor’s tax situation andmay differ from those shown. After-tax returns are not relevant to investors who hold their fund shares through tax-deferred arrangements, such as401(k) plans or individual retirement accounts. After-tax returns are shown only for Class A shares; after-tax returns for other share classes willvary.
Effective August 31, 2009, the fund’s investment objective was changed from providing “current income that is exempt from state income tax” toproviding “current income,” in each case to the extent consistent with preservation of capital. As of the same date, the fund’s investment strategieswere significantly broadened, consistent with this new investment objective. As a result, the performance information presented below reflects theperformance of an investment portfolio that will differ materially from the fund’s portfolio going forward.
5.92%
(2.41)%1.55% 1.48% 1.63%
3.18%
7.76%9.29%
(0.38)%
2003 2004 2005 2006 2007 2008 2009
Best Quarter:Quarter ended December 31, 2008
Worst Quarter:Quarter ended June 30, 2004
ANNUAL TOTAL RETURNS AS OF 12/31 EACH YEAR (Class A)1
16 Prospectus – First American Income Funds
Fund Summaries
Intermediate Government Bond Fund continued
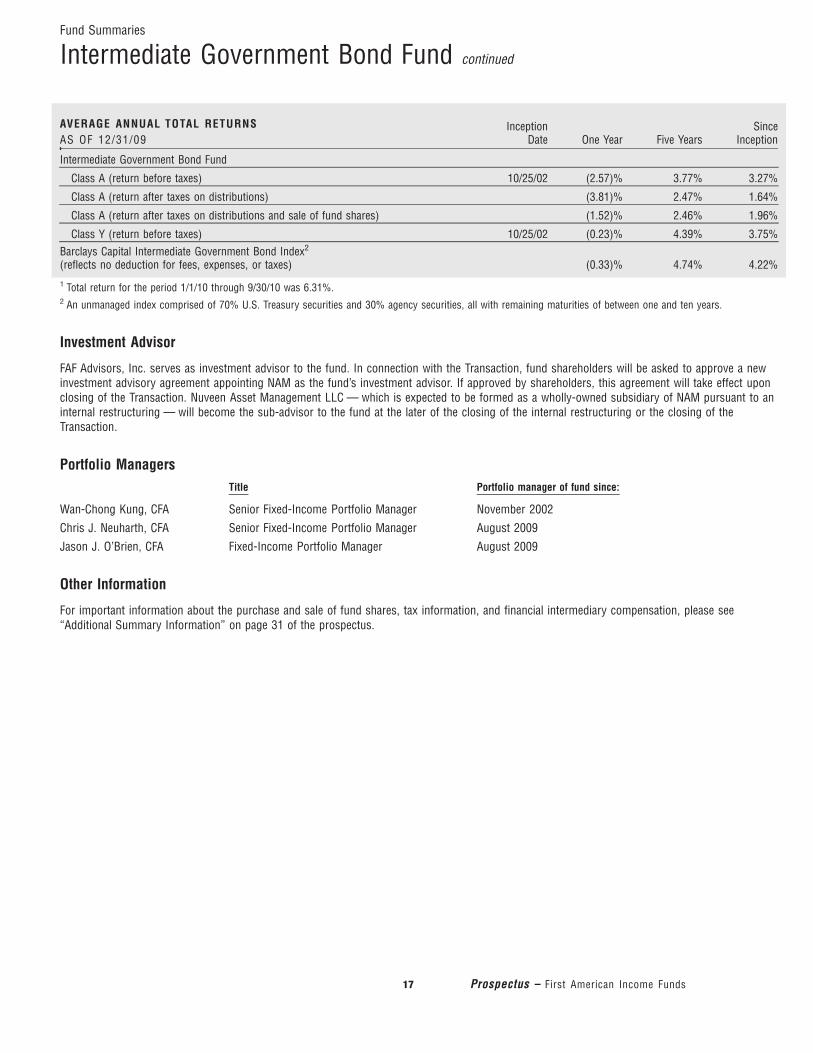
AVERAGE ANNUAL TOTAL RETURNSAS OF 12/31/09
InceptionDate One Year Five Years
SinceInception
Intermediate Government Bond Fund
Class A (return before taxes) 10/25/02 (2.57)% 3.77% 3.27%
Class A (return after taxes on distributions) (3.81)% 2.47% 1.64%
Class A (return after taxes on distributions and sale of fund shares) (1.52)% 2.46% 1.96%
Class Y (return before taxes) 10/25/02 (0.23)% 4.39% 3.75%Barclays Capital Intermediate Government Bond Index2
(reflects no deduction for fees, expenses, or taxes) (0.33)% 4.74% 4.22%
1 Total return for the period 1/1/10 through 9/30/10 was 6.31%.2 An unmanaged index comprised of 70% U.S. Treasury securities and 30% agency securities, all with remaining maturities of between one and ten years.
Investment Advisor
FAF Advisors, Inc. serves as investment advisor to the fund. In connection with the Transaction, fund shareholders will be asked to approve a newinvestment advisory agreement appointing NAM as the fund’s investment advisor. If approved by shareholders, this agreement will take effect uponclosing of the Transaction. Nuveen Asset Management LLC — which is expected to be formed as a wholly-owned subsidiary of NAM pursuant to aninternal restructuring — will become the sub-advisor to the fund at the later of the closing of the internal restructuring or the closing of theTransaction.
Portfolio ManagersTitle Portfolio manager of fund since:
Wan-Chong Kung, CFA Senior Fixed-Income Portfolio Manager November 2002
Chris J. Neuharth, CFA Senior Fixed-Income Portfolio Manager August 2009
Jason J. O’Brien, CFA Fixed-Income Portfolio Manager August 2009
Other Information
For important information about the purchase and sale of fund shares, tax information, and financial intermediary compensation, please see“Additional Summary Information” on page 31 of the prospectus.
17 Prospectus – First American Income Funds
Fund Summaries
Intermediate Government Bond Fund continued

Fund Summaries
Intermediate Term Bond FundOn July 29, 2010, FAF Advisors, Inc. (the “advisor”) and its parent company, U.S. Bank National Association, entered into an agreement withNuveen Investments, Inc. (“Nuveen”) and certain Nuveen affiliates, including Nuveen Asset Management (“NAM”), to sell a portion of the advisor’sasset management business (the “Transaction”). Included in the sale will be that part of the advisor’s asset management business that advises thefund. The sale is subject to the satisfaction of customary conditions, and is currently expected to close by the end of 2010.
Investment Objective
Intermediate Term Bond Fund’s objective is to provide investors with current income to the extent consistent with preservation of capital.
Fees and Expenses
The following tables describe the fees and expenses that you may pay if you buy and hold shares of the fund. You may qualify for sales chargediscounts on purchases of Class A shares if you and your family invest, or agree to invest in the future, at least $50,000 in First American funds.More information about these and other discounts is available from your financial professional and under “Determining Your Share Price” onpage 41 of the prospectus and “Reducing Class A Sales Charges” on page 84 of the statement of additional information.
Shareholder Fees(fees paid directly from your investment) Class A Class Y
Maximum Sales Charge (Load) Imposed on Purchases(as a percentage of offering price) 2.25% None
Maximum Deferred Sales Charge (Load)(as a percentage of original purchase price or redemption proceeds, whichever is less)1 None None
Annual Low Balance Account Fee (for accounts under $1,000) $15 None
Annual Fund Operat ing Expenses2
(expenses that you pay each year as a percentage of the value of your investment)
Management Fees 0.50% 0.50%
Distribution and/or Service (12b-1) Fees3 0.25% None
Other Expenses
Administration Fee 0.22% 0.22%
Miscellaneous 0.04% 0.04%
Acquired Fund Fees and Expenses4 0.01% 0.01%
Total Annual Fund Operating Expenses5 1.02% 0.77%
Example: This example is intended to help you compare the cost of investing in the fund with the cost of investing in other mutual funds. Theexample assumes that you invest $10,000 in the fund for the time periods indicated and then either redeem or do not redeem all of your shares atthe end of those periods. The example also assumes that your investment has a 5% return each year and the fund’s operating expenses remain thesame. Although your actual costs may be higher or lower, based on these assumptions your costs would be:
Class A Class Y
1 year $ 327 $ 79
3 years $ 542 $246
5 years $ 776 $428
10 years $1,445 $954
1 Class A share investments of $1 million or more on which no front-end sales charge is paid may be subject to a contingent deferred sales charge (CDSC) of up to 1%.2 Assuming shareholders approve the new advisory agreement with NAM proposed in connection with the Transaction, the fund’s expense structure will change upon
closing of the Transaction. However, the fund’s net expense ratio immediately following the Transaction, after voluntary waivers by NAM and excluding any AcquiredFund Fees and Expenses, is expected to be the same or lower than the annual fund operating expense ratio reflected in footnote 5 below, assuming the fund’s net assetlevel has not fallen below its level as of June 30, 2010, adjusted to take into account any redemptions by the U.S. Bank 401(k) Plan expected to occur prior to closing ofthe Transaction. Further, NAM has agreed to maintain the fund’s current expense cap at least through June 30, 2011. In addition, the fund’s expense ratio immediatelyfollowing the Transaction, before voluntary waivers and excluding any Acquired Fund Fees and Expenses, is expected to be the same or lower than the fund’s total annualfund operating expense ratio reflected in the table, assuming the fund’s net asset level has not fallen below its level as of June 30, 2010, adjusted (as applicable) to takeinto account any expected U.S. Bank 401(k) Plan redemptions. See “Investment Advisor” on page 36 of the prospectus.
3 The distributor has agreed to limit its Class A share 12b-1 fees to 0.15% of average daily net assets through June 30, 2011.
18 Prospectus – First American Income Funds

4 In addition to the operating expenses that the fund bears directly, the fund’s shareholders indirectly bear the expenses of affiliated and unaffiliated funds in which thefund invests (the “acquired funds”). Since acquired fund fees and expenses are not directly borne by the fund, they are not reflected in the fund’s financialstatements, with the result that the information presented in the expense table will differ from that presented in the “Financial Highlights” section of the prospectus.
5 The advisor intends to waive fees and reimburse other fund expenses through June 30, 2011 so that total annual fund operating expenses, after waivers andexcluding Acquired Fund Fees and Expenses, do not exceed 0.85% and 0.70%, respectively, for Class A and Class Y shares. Fee waivers and expensereimbursements will not be terminated prior to that time without the approval of the fund’s board of directors.
Portfolio Turnover
The fund pays transaction costs, such as commissions, when it buys and sells securities (or “turns over” its portfolio). A higher portfolio turnoverrate may indicate higher transaction costs and may result in higher taxes when fund shares are held in a taxable account. These costs, which arenot reflected in annual fund operating expenses or in the example, affect the fund’s performance. During the most recent fiscal year, the fund’sportfolio turnover rate was 58% of the average value of its portfolio.
Principal Investment Strategies
Under normal market conditions, Intermediate Term Bond Fund invests primarily (at least 80% of its net assets, plus the amount of any borrowingsfor investment purposes) in debt securities, such as:
• U.S. government securities, (securities issued or guaranteed by the U.S. government or its agencies or instrumentalities), including zero couponsecurities.
• residential and commercial mortgage-backed securities.• asset-backed securities.• corporate debt obligations, including obligations issued by special-purpose entities that are backed by corporate debt obligations.
Debt securities in the fund will be rated investment grade at the time of purchase or, if unrated, determined to be of comparable quality by thefund’s advisor. If the rating of a security is reduced or discounted after purchase, the fund is not required to sell the security, buy may considerdoing so. At least 65% of the fund’s debt securities must be either U.S. government securities or securities that are rated A or better or are unratedand of comparable quality as determined by the fund’s advisor. Unrated securities will not exceed 25% of the fund’s total assets.
The fund’s advisor selects securities using a “top-down” approach, which begins with the formulation of the advisor’s general economic outlook.Following this, various sectors and industries are analyzed and selected for investment. Finally, the advisor selects individual securities within thesesectors or industries.
The fund may invest up to 25% of its total assets in U.S. dollar denominated debt obligations of foreign corporations and governments.
Under normal market conditions the fund attempts to maintain a weighted average effective maturity for its portfolio securities of three to ten yearsand an average effective duration of two to six years. The fund’s weighted average effective maturity and effective duration are measures of how thefund may react to interest rate changes.
To generate additional income, the fund may invest up to 25% of its total assets in dollar roll transactions. In a dollar roll transaction, the fund sellsmortgage-backed securities for delivery in the current month while contracting with the same party to repurchase similar securities at a future date.
The fund may utilize the following derivatives: options; futures contracts; options on futures contracts; interest rate caps, collars, and floors; swapagreements, including swap agreements on interest rates, security indexes and specific securities, and credit default swap agreements; and optionson the foregoing types of swap agreements. The fund may enter into standardized derivatives contracts traded on domestic or foreign securitiesexchanges, boards of trade, or similar entities, and non-standardized derivatives contracts traded in the over-the-counter (“OTC”) market. The fundmay use these derivatives in an attempt to manage market risk, credit risk and yield curve risk, to manage the effective maturity or duration ofsecurities in the fund’s portfolio or for speculative purposes in an effort to increase the fund’s yield or to enhance returns. The use of a derivative isspeculative if the fund is primarily seeking to enhance returns, rather than offset the risk of other positions. The fund may not use any derivative togain exposure to a security or type of security that it would be prohibited by its investment restrictions from purchasing directly.
Principal Risks
The price and yield of this fund will change daily due to changes in interest rates and other factors, which means you could lose money. Aninvestment in the fund is not a deposit of U.S. Bank National Association and is not insured or guaranteed by the Federal Deposit InsuranceCorporation or any other governmental agency. The principal risks of investing in this fund are described below:
Active Management Risk — Because the fund is actively managed, the fund could underperform its benchmark or other mutual funds with similarinvestment objectives.
19 Prospectus – First American Income Funds
Fund Summaries
Intermediate Term Bond Fund continued
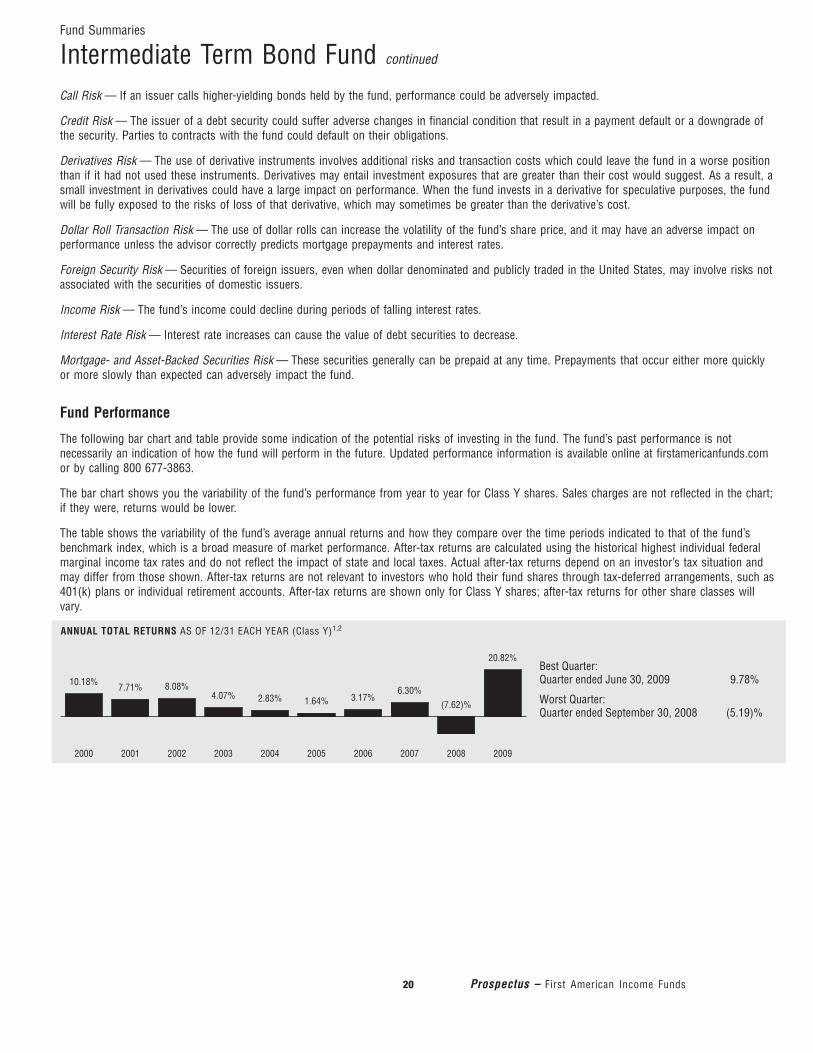
Call Risk — If an issuer calls higher-yielding bonds held by the fund, performance could be adversely impacted.
Credit Risk — The issuer of a debt security could suffer adverse changes in financial condition that result in a payment default or a downgrade ofthe security. Parties to contracts with the fund could default on their obligations.
Derivatives Risk — The use of derivative instruments involves additional risks and transaction costs which could leave the fund in a worse positionthan if it had not used these instruments. Derivatives may entail investment exposures that are greater than their cost would suggest. As a result, asmall investment in derivatives could have a large impact on performance. When the fund invests in a derivative for speculative purposes, the fundwill be fully exposed to the risks of loss of that derivative, which may sometimes be greater than the derivative’s cost.
Dollar Roll Transaction Risk — The use of dollar rolls can increase the volatility of the fund’s share price, and it may have an adverse impact onperformance unless the advisor correctly predicts mortgage prepayments and interest rates.
Foreign Security Risk — Securities of foreign issuers, even when dollar denominated and publicly traded in the United States, may involve risks notassociated with the securities of domestic issuers.
Income Risk — The fund’s income could decline during periods of falling interest rates.
Interest Rate Risk — Interest rate increases can cause the value of debt securities to decrease.
Mortgage- and Asset-Backed Securities Risk — These securities generally can be prepaid at any time. Prepayments that occur either more quicklyor more slowly than expected can adversely impact the fund.
Fund Performance
The following bar chart and table provide some indication of the potential risks of investing in the fund. The fund’s past performance is notnecessarily an indication of how the fund will perform in the future. Updated performance information is available online at firstamericanfunds.comor by calling 800 677-3863.
The bar chart shows you the variability of the fund’s performance from year to year for Class Y shares. Sales charges are not reflected in the chart;if they were, returns would be lower.
The table shows the variability of the fund’s average annual returns and how they compare over the time periods indicated to that of the fund’sbenchmark index, which is a broad measure of market performance. After-tax returns are calculated using the historical highest individual federalmarginal income tax rates and do not reflect the impact of state and local taxes. Actual after-tax returns depend on an investor’s tax situation andmay differ from those shown. After-tax returns are not relevant to investors who hold their fund shares through tax-deferred arrangements, such as401(k) plans or individual retirement accounts. After-tax returns are shown only for Class Y shares; after-tax returns for other share classes willvary.
ANNUAL TOTAL RETURNS AS OF 12/31 EACH YEAR (Class Y)1,2
Best Quarter:Quarter ended June 30, 2009 9.78%
Worst Quarter:Quarter ended September 30, 2008 (5.19)%
10.18% 7.71% 8.08%4.07% 2.83% 1.64% 3.17%
6.30%(7.62)%
20.82%
2000 2001 2002 2003 2004 2005 2006 2007 2008 2009
20 Prospectus – First American Income Funds
Fund Summaries
Intermediate Term Bond Fund continued
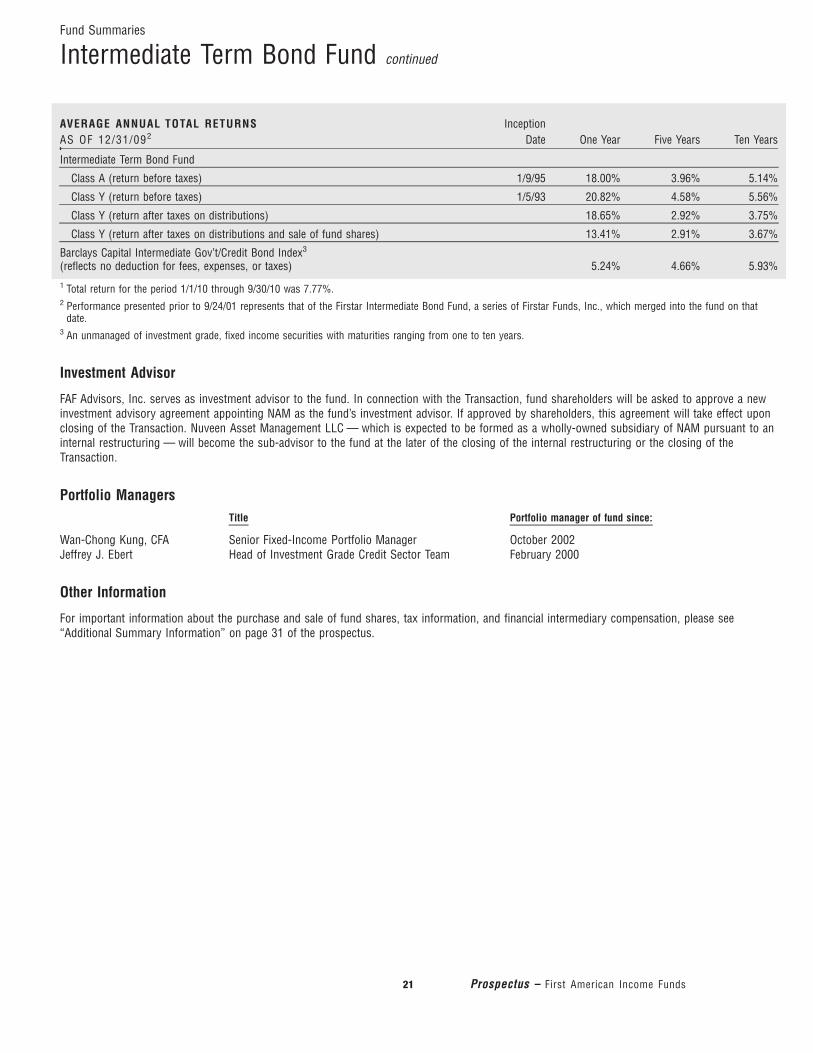
AVERAGE ANNUAL TOTAL RETURNSAS OF 12/31/092
InceptionDate One Year Five Years Ten Years
Intermediate Term Bond Fund
Class A (return before taxes) 1/9/95 18.00% 3.96% 5.14%
Class Y (return before taxes) 1/5/93 20.82% 4.58% 5.56%
Class Y (return after taxes on distributions) 18.65% 2.92% 3.75%
Class Y (return after taxes on distributions and sale of fund shares) 13.41% 2.91% 3.67%
Barclays Capital Intermediate Gov’t/Credit Bond Index3
(reflects no deduction for fees, expenses, or taxes) 5.24% 4.66% 5.93%
1 Total return for the period 1/1/10 through 9/30/10 was 7.77%.2 Performance presented prior to 9/24/01 represents that of the Firstar Intermediate Bond Fund, a series of Firstar Funds, Inc., which merged into the fund on that
date.3 An unmanaged of investment grade, fixed income securities with maturities ranging from one to ten years.
Investment Advisor
FAF Advisors, Inc. serves as investment advisor to the fund. In connection with the Transaction, fund shareholders will be asked to approve a newinvestment advisory agreement appointing NAM as the fund’s investment advisor. If approved by shareholders, this agreement will take effect uponclosing of the Transaction. Nuveen Asset Management LLC — which is expected to be formed as a wholly-owned subsidiary of NAM pursuant to aninternal restructuring — will become the sub-advisor to the fund at the later of the closing of the internal restructuring or the closing of theTransaction.
Portfolio ManagersTitle Portfolio manager of fund since:
Wan-Chong Kung, CFA Senior Fixed-Income Portfolio Manager October 2002Jeffrey J. Ebert Head of Investment Grade Credit Sector Team February 2000
Other Information
For important information about the purchase and sale of fund shares, tax information, and financial intermediary compensation, please see“Additional Summary Information” on page 31 of the prospectus.
21 Prospectus – First American Income Funds
Fund Summaries
Intermediate Term Bond Fund continued

Fund Summaries
Short Term Bond FundOn July 29, 2010, FAF Advisors, Inc. (the “advisor”) and its parent company, U.S. Bank National Association, entered into an agreement withNuveen Investments, Inc. (“Nuveen”) and certain Nuveen affiliates, including Nuveen Asset Management (“NAM”), to sell a portion of the advisor’sasset management business (the “Transaction”). Included in the sale will be that part of the advisor’s asset management business that advises thefund. The sale is subject to the satisfaction of customary conditions, and is currently expected to close by the end of 2010.
Investment Objective
Short Term Bond Fund’s objective is to provide investors with current income while maintaining a high degree of principal stability.
Fees and Expenses
The following tables describe the fees and expenses that you may pay if you buy and hold shares of the fund. You may qualify for sales chargediscounts on purchases of Class A shares if you and your family invest, or agree to invest in the future, at least $50,000 in First American funds.More information about these and other discounts is available from your financial professional and under “Determining Your Share Price” onpage 41 of the prospectus and “Reducing Class A Sales Charges” on page 84 of the statement of additional information.
Shareholder Fees(fees paid directly from your investment) Class A Class C Class Y
Maximum Sales Charge (Load) Imposed on Purchases(as a percentage of offering price) 2.25% None None
Maximum Deferred Sales Charge (Load)(as a percentage of original purchase price or redemption proceeds, whichever is less)1 None 1.00% None
Annual Low Balance Account Fee (for accounts under $1,000) $15 $15 None
Annual Fund Operat ing Expenses2
(expenses that you pay each year as a percentage of the value of your investment)
Management Fees 0.50% 0.50% 0.50%
Distribution and/or Service (12b-1) Fees3 0.25% 1.00% None
Other Expenses
Administration Fee 0.22% 0.22% 0.22%
Miscellaneous 0.07% 0.07% 0.07%
Acquired Fund Fees and Expenses4 0.01% 0.01% 0.01%
Total Annual Fund Operating Expenses5 1.05% 1.80% 0.80%
Example: This example is intended to help you compare the cost of investing in the fund with the cost of investing in other mutual funds. Theexample assumes that you invest $10,000 in the fund for the time periods indicated and then either redeem or do not redeem all of your shares atthe end of those periods. The example also assumes that your investment has a 5% return each year and the fund’s operating expenses remain thesame. Although your actual costs may be higher or lower, based on these assumptions your costs would be:
Class A
Class Cassuming redemption
at end ofeach period
Class Cassuming no
redemptionat end of
each period Class Y
1 year $ 330 $ 283 $ 183 $ 82
3 years $ 552 $ 566 $ 566 $255
5 years $ 791 $ 975 $ 975 $444
10 years $1,479 $2,116 $2,116 $990
1 Class A share investments of $250,000 or more on which no front-end sales charge is paid may be subject to a contingent deferred sales charge (CDSC) of up to0.60%. The CDSC on Class C shares applies only to redemptions within one year of purchase.
2 Assuming shareholders approve the new advisory agreement with NAM proposed in connection with the Transaction, the fund’s expense structure will change uponclosing of the Transaction. However, the fund’s net expense ratio immediately following the Transaction, after voluntary waivers by NAM and excluding any AcquiredFund Fees and Expenses, is expected to be the same or lower than the annual fund operating expense ratio reflected in footnote 5 below, assuming the fund’s netasset level has not fallen below its level as of June 30, 2010, adjusted to take into account any redemptions by the U.S. Bank 401(k) Plan expected to occur prior toclosing of the Transaction. Further, NAM has agreed to maintain the fund’s current expense cap at least through June 30, 2011. In addition, the fund’s expense ratio
22 Prospectus – First American Income Funds

immediately following the Transaction, before voluntary waivers and excluding any Acquired Fund Fees and Expenses, is expected to be the same or lower than thefund’s total annual fund operating expense ratio reflected in the table, assuming the fund’s net asset level has not fallen below its level as of June 30, 2010, adjusted(as applicable) to take into account any expected U.S. Bank 401(k) Plan redemptions. See “Investment Advisor” on page 36 of the prospectus.
3 The distributor has agreed to limit its Class A share 12b-1 fees to 0.15% of average daily net assets through June 30, 2011.4 In addition to the operating expenses that the fund bears directly, the fund’s shareholders indirectly bear the expenses of affiliated and unaffiliated funds in which the
fund invests (the “acquired funds”). Since acquired fund fees and expenses are not directly borne by the fund, they are not reflected in the fund’s financialstatements, with the result that the information presented in the expense table will differ from that presented in the “Financial Highlights” section of the prospectus.
5 The advisor intends to waive fees and reimburse other fund expenses through June 30, 2011 so that total annual fund operating expenses, after waivers andexcluding Acquired Fund Fees and Expenses, do not exceed 0.75%, 1.60%, and 0.60%, respectively, for Class A, Class C, and Class Y shares. Fee waivers andexpense reimbursements will not be terminated prior to that time without the approval of the fund’s board of directors.
Portfolio Turnover
The fund pays transaction costs, such as commissions, when it buys and sells securities (or “turns over” its portfolio). A higher portfolio turnoverrate may indicate higher transaction costs and may result in higher taxes when fund shares are held in a taxable account. These costs, which arenot reflected in annual fund operating expenses or in the example, affect the fund’s performance. During the most recent fiscal year, the fund’sportfolio turnover rate was 44% of the average value of its portfolio.
Principal Investment Strategies
Under normal market conditions, Short Term Bond Fund invests primarily (at least 80% of its net assets, plus the amount of any borrowings forinvestment purposes) in debt securities, such as:
• residential and commercial mortgage-backed securities.• asset-backed securities.• corporate debt obligations, including obligations issued by special-purpose entities that are backed by corporate debt obligations.• U.S. government securities, which are securities issued or guaranteed by the U.S. government or its agencies or instrumentalities.• commercial paper.
Up to 10% of the fund’s total assets may be invested collectively in the following categories of debt securities:
• securities rated lower than investment grade or unrated securities of comparable quality as determined by the fund’s advisor (securities commonlyreferred to as “high yield” or “junk bonds”). The fund will not invest in securities rated lower than CCC at the time of purchase or in unratedsecurities of equivalent quality.
• non-dollar denominated debt obligations of foreign corporations and governments.• debt obligations issued by governmental and corporate issuers that are located in emerging market countries. A country is considered to have an
“emerging market” if it has a relatively low gross national product per capita compared to the world’s major economies, and the potential forrapid economic growth, provided that no issuer included in the fund’s current benchmark index will be considered to be located in an emergingmarket country.
The fund may invest up to 25% of its total assets in U.S. dollar denominated debt obligations of foreign corporations and governments that are notlocated in emerging market countries.
The fund’s advisor selects securities using a “top-down” approach which begins with the formulation of the advisor’s general economic outlook.Following this, various sectors and industries are analyzed and selected for investment. Finally, the advisor selects individual securities within thesesectors or industries.
The fund invests primarily in debt securities rated investment grade at the time of purchase by a nationally recognized statistical rating organizationor in unrated securities of comparable quality. As noted above, however, up to 10% of the fund’s total assets may be invested in securities that arerated lower than investment grade at the time of purchase or that are unrated and of comparable quality. Quality determinations regarding unratedsecurities will be made by the fund’s advisor. If the rating of a security is reduced or the credit quality of an unrated security declines afterpurchase, the fund is not required to sell the security, but may consider doing so. At least 65% of the fund’s debt securities must be eitherU.S. government securities or securities that are rated A or better or are unrated and of comparable quality. Unrated securities will not exceed 25%of the fund’s total assets.
Under normal market conditions the fund attempts to maintain a weighted average effective maturity and an average effective duration for itsportfolio securities of one to three years. The fund’s weighted average effective maturity and effective duration are measures of how the fund mayreact to interest rate changes.
The fund may utilize the following derivatives: options; futures contracts; options on futures contracts; interest rate caps, collars, and floors; foreigncurrency contracts; options on foreign currencies; swap agreements, including swap agreements on interest rates, currency rates, security indexes
23 Prospectus – First American Income Funds
Fund Summaries
Short Term Bond Fund continued

and specific securities, and credit default swap agreements; and options on the foregoing types of swap agreements. The fund may enter intostandardized derivatives contracts traded on domestic or foreign securities exchanges, boards of trade, or similar entities, and non-standardizedderivatives contracts traded in the over-the-counter (“OTC”) market. The fund may use these derivatives in an attempt to manage market risk,currency risk, credit risk and yield curve risk, to manage the effective maturity or duration of securities in the fund’s portfolio or for speculativepurposes in an effort to increase the fund’s yield or to enhance returns. The fund may also use derivatives to gain exposure to non-dollardenominated securities markets to the extent it does not do so through direct investments. The use of a derivative is speculative if the fund isprimarily seeking to enhance returns, rather than offset the risk of other positions. The fund may not use any derivative to gain exposure to asecurity or type of security that it would be prohibited by its investment restrictions from purchasing directly.
Principal Risks
The price and yield of this fund will change daily due to changes in interest rates and other factors, which means you could lose money. Aninvestment in the fund is not a deposit of U.S. Bank National Association and is not insured or guaranteed by the Federal Deposit InsuranceCorporation or any other governmental agency. The principal risks of investing in this fund are described below:
Active Management Risk — Because the fund is actively managed, the fund could underperform its benchmark or other mutual funds with similarinvestment objectives.
Call Risk — If an issuer calls higher-yielding bonds held by the fund, performance could be adversely impacted.
Credit Risk — The issuer of a debt security could suffer adverse changes in financial condition that result in a payment default or a downgrade ofthe security. Parties to contracts with the fund could default on their obligations.
Derivatives Risk — The use of derivative instruments involves additional risks and transaction costs which could leave the fund in a worse positionthan if it had not used these instruments. Derivatives may entail investment exposures that are greater than their cost would suggest. As a result, asmall investment in derivatives could have a large impact on performance. When the fund invests in a derivative for speculative purposes, the fundwill be fully exposed to the risks of loss of that derivative, which may sometimes be greater than the derivative’s cost.
Emerging Markets Risk — Investments in emerging markets are subject to special political, economic, and market risks that can make the fund’semerging market investments more volatile and less liquid than investments in developed markets.
Foreign Security Risk — Securities of foreign issuers, even when dollar denominated and publicly traded in the United States, may involve risks notassociated with the securities of domestic issuers.
High-Yield Securities Risk — High-yield securities generally are less liquid, have more volatile prices, and have greater credit risk than investmentgrade securities.
Income Risk — The fund’s income could decline during periods of falling interest rates.
Interest Rate Risk — Interest rate increases can cause the value of debt securities to decrease.
International Investing Risk — Investing in non-dollar denominated foreign securities involves risk not typically associated with U.S. investing, suchas currency risk, risks of trading in foreign securities markets, and political and economic risks.
Liquidity Risk — Trading opportunities are more limited for debt securities that have received ratings below investment grade.
Mortgage- and Asset-Backed Securities Risk — These securities generally can be prepaid at any time. Prepayments that occur either more quicklyor more slowly than expected can adversely impact the fund.
Fund Performance
The following bar chart and table provide some indication of the potential risks of investing in the fund. The fund’s past performance is notnecessarily an indication of how the fund will perform in the future. Updated performance information is available online at firstamericanfunds.comor by calling 800 677-3863.
The bar chart shows you the variability of the fund’s performance from year to year for Class A shares. Sales charges are not reflected in the chart;if they were, returns would be lower. Class C shares have not been offered for a full calendar year.
The table shows the variability of the fund’s average annual returns and how they compare over the time periods indicated to that of the fund’sbenchmark index, which is a broad measure of market performance. After-tax returns are calculated using the historical highest individual federalmarginal income tax rates and do not reflect the impact of state and local taxes. Actual after-tax returns depend on an investor’s tax situation andmay differ from those shown. After-tax returns are not relevant to investors who hold their fund shares through tax-deferred arrangements, such as
24 Prospectus – First American Income Funds
Fund Summaries
Short Term Bond Fund continued

401(k) plans or individual retirement accounts. After-tax returns are shown only for Class A shares; after-tax returns for other share classes willvary.
ANNUAL TOTAL RETURNS AS OF 12/31 EACH YEAR (Class A)1
Best Quarter:Quarter ended June 30, 2009 5.45%
Worst Quarter:Quarter ended December 31, 2008 (3.37)%
8.17% 7.15% 6.00%1.85% 0.96% 1.43%
3.86% 5.64%
(4.43)%
12.79%
2000 2001 2002 2003 2004 2005 2006 2007 2008 2009
AVERAGE ANNUAL TOTAL RETURNSAS OF 12/31/09
InceptionDate One Year Five Years Ten Years
Short Term Bond Fund
Class A (return before taxes) 12/14/92 10.27% 3.24% 4.01%
Class A (return after taxes on distributions) 8.67% 1.86% 2.49%
Class A (return after taxes on distributions and sale of fund shares) 6.63% 1.94% 2.50%
Class Y (return before taxes) 2/4/94 12.94% 3.89% 4.41%
Barclays Capital 1-3 Year Gov’t/Credit Bond Index2
(reflects no deduction for fees, expenses, or taxes) 3.83% 4.32% 4.86%
1 Total return for the period 1/1/10 through 9/30/10 was 3.09%.2 An unmanaged index of investment grade, fixed income securities with maturities ranging from one to three years.
Investment Advisor
FAF Advisors, Inc. serves as investment advisor to the fund. In connection with the Transaction, fund shareholders will be asked to approve a newinvestment advisory agreement appointing NAM as the fund’s investment advisor. If approved by shareholders, this agreement will take effect uponclosing of the Transaction. Nuveen Asset Management LLC — which is expected to be formed as a wholly-owned subsidiary of NAM pursuant to aninternal restructuring — will become the sub-advisor to the fund at the later of the closing of the internal restructuring or the closing of theTransaction.
Portfolio ManagersTitle Portfolio manager of fund since:
Chris J. Neuharth, CFA Senior Fixed-Income Portfolio Manager March 2004
Brenda A. Briceno, CFA Corporate Trader October 2010
Peter L. Agrimson, CFA Associate Trader October 2010
Other Information
For important information about the purchase and sale of fund shares, tax information, and financial intermediary compensation, please see“Additional Summary Information” on page 31 of the prospectus.
25 Prospectus – First American Income Funds
Fund Summaries
Short Term Bond Fund continued
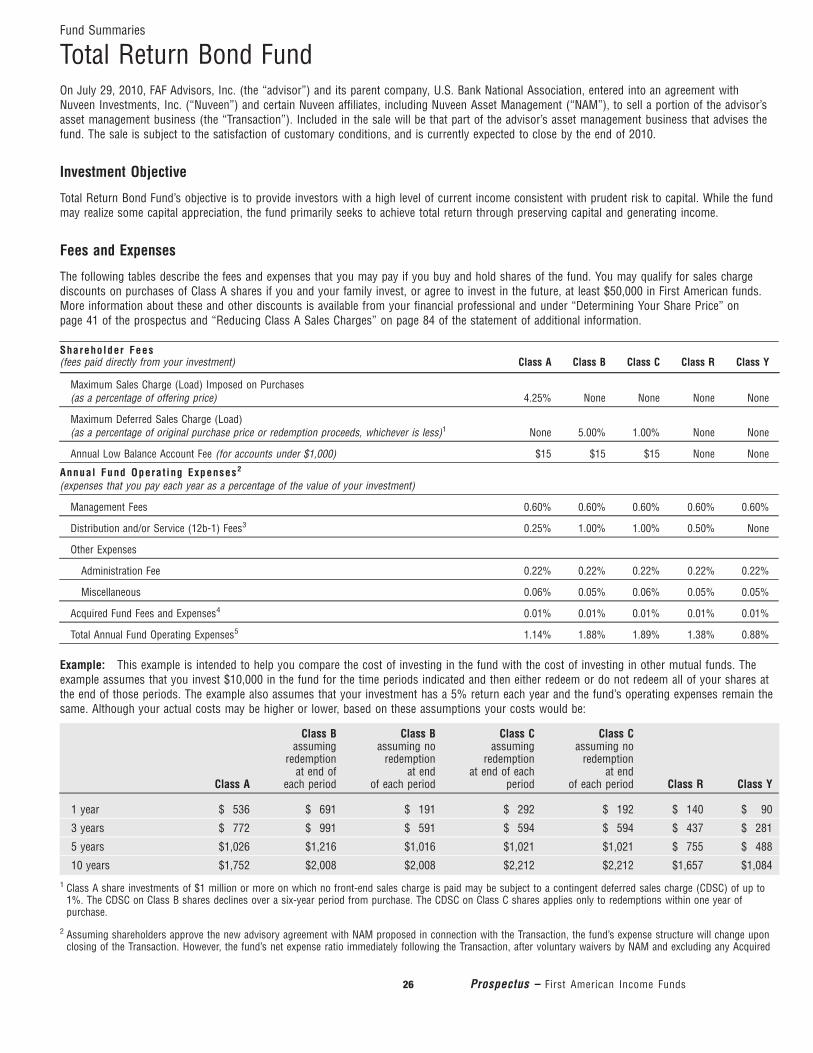
Fund Summaries
Total Return Bond FundOn July 29, 2010, FAF Advisors, Inc. (the “advisor”) and its parent company, U.S. Bank National Association, entered into an agreement withNuveen Investments, Inc. (“Nuveen”) and certain Nuveen affiliates, including Nuveen Asset Management (“NAM”), to sell a portion of the advisor’sasset management business (the “Transaction”). Included in the sale will be that part of the advisor’s asset management business that advises thefund. The sale is subject to the satisfaction of customary conditions, and is currently expected to close by the end of 2010.
Investment Objective
Total Return Bond Fund’s objective is to provide investors with a high level of current income consistent with prudent risk to capital. While the fundmay realize some capital appreciation, the fund primarily seeks to achieve total return through preserving capital and generating income.
Fees and Expenses
The following tables describe the fees and expenses that you may pay if you buy and hold shares of the fund. You may qualify for sales chargediscounts on purchases of Class A shares if you and your family invest, or agree to invest in the future, at least $50,000 in First American funds.More information about these and other discounts is available from your financial professional and under “Determining Your Share Price” onpage 41 of the prospectus and “Reducing Class A Sales Charges” on page 84 of the statement of additional information.
Shareholder Fees(fees paid directly from your investment) Class A Class B Class C Class R Class Y
Maximum Sales Charge (Load) Imposed on Purchases(as a percentage of offering price) 4.25% None None None None
Maximum Deferred Sales Charge (Load)(as a percentage of original purchase price or redemption proceeds, whichever is less)1 None 5.00% 1.00% None None
Annual Low Balance Account Fee (for accounts under $1,000) $15 $15 $15 None None
Annual Fund Operat ing Expenses2
(expenses that you pay each year as a percentage of the value of your investment)
Management Fees 0.60% 0.60% 0.60% 0.60% 0.60%
Distribution and/or Service (12b-1) Fees3 0.25% 1.00% 1.00% 0.50% None
Other Expenses
Administration Fee 0.22% 0.22% 0.22% 0.22% 0.22%
Miscellaneous 0.06% 0.05% 0.06% 0.05% 0.05%
Acquired Fund Fees and Expenses4 0.01% 0.01% 0.01% 0.01% 0.01%
Total Annual Fund Operating Expenses5 1.14% 1.88% 1.89% 1.38% 0.88%
Example: This example is intended to help you compare the cost of investing in the fund with the cost of investing in other mutual funds. Theexample assumes that you invest $10,000 in the fund for the time periods indicated and then either redeem or do not redeem all of your shares atthe end of those periods. The example also assumes that your investment has a 5% return each year and the fund’s operating expenses remain thesame. Although your actual costs may be higher or lower, based on these assumptions your costs would be:
Class A
Class Bassuming
redemptionat end of
each period
Class Bassuming no
redemptionat end
of each period
Class Cassuming
redemptionat end of each
period
Class Cassuming no
redemptionat end
of each period Class R Class Y
1 year $ 536 $ 691 $ 191 $ 292 $ 192 $ 140 $ 90
3 years $ 772 $ 991 $ 591 $ 594 $ 594 $ 437 $ 281
5 years $1,026 $1,216 $1,016 $1,021 $1,021 $ 755 $ 488
10 years $1,752 $2,008 $2,008 $2,212 $2,212 $1,657 $1,084
1 Class A share investments of $1 million or more on which no front-end sales charge is paid may be subject to a contingent deferred sales charge (CDSC) of up to1%. The CDSC on Class B shares declines over a six-year period from purchase. The CDSC on Class C shares applies only to redemptions within one year ofpurchase.
2 Assuming shareholders approve the new advisory agreement with NAM proposed in connection with the Transaction, the fund’s expense structure will change uponclosing of the Transaction. However, the fund’s net expense ratio immediately following the Transaction, after voluntary waivers by NAM and excluding any Acquired
26 Prospectus – First American Income Funds
Fund Fees and Expenses, is expected to be the same or lower than the annual fund operating expense ratio reflected in footnote 5 below, assuming the fund’s netasset level has not fallen below its level as of June 30, 2010, adjusted to take into account any redemptions by the U.S. Bank 401(k) Plan expected to occur prior toclosing of the Transaction. Further, NAM has agreed to maintain the fund’s current expense cap at least through June 30, 2011. In addition, the fund’s expense ratioimmediately following the Transaction, before voluntary waivers and excluding any Acquired Fund Fees and Expenses, is expected to be the same or lower than thefund’s total annual fund operating expense ratio reflected in the table, assuming the fund’s net asset level has not fallen below its level as of June 30, 2010, adjusted(as applicable) to take into account any expected U.S. Bank 401(k) Plan redemptions. See “Investment Advisor” on page 36 of the prospectus.
3 The advisor has contractually agreed to reimburse an amount of Class A share 12b-1 fees equal to 0.11% of average daily net assets through October 31, 2011.
4 In addition to the operating expenses that the fund bears directly, the fund’s shareholders indirectly bear the expenses of affiliated and unaffiliated funds in which thefund invests (the “acquired funds”). Since acquired fund fees and expenses are not directly borne by the fund, they are not reflected in the fund’s financialstatements, with the result that the information presented in the expense table will differ from that presented in the “Financial Highlights” section of the prospectus.
5 The advisor intends to waive fees and reimburse other fund expenses through June 30, 2011 so that total annual fund operating expenses, after waivers andexcluding Acquired Fund Fees and Expenses, do not exceed 0.89%, 1.75%, 1.75%, 1.25%, and 0.75%, respectively, for Class A, Class B, Class C, Class R, andClass Y shares. Fee waivers and expense reimbursements will not be terminated prior to that time without the approval of the fund’s board of directors.
Portfolio Turnover
The fund pays transaction costs, such as commissions, when it buys and sells securities (or “turns over” its portfolio). A higher portfolio turnoverrate may indicate higher transaction costs and may result in higher taxes when fund shares are held in a taxable account. These costs, which arenot reflected in annual fund operating expenses or in the example, affect the fund’s performance. During the most recent fiscal year, the fund’sportfolio turnover rate was 96% of the average value of its portfolio.
Principal Investment Strategies
Under normal market conditions, Total Return Bond Fund invests primarily (at least 80% of its net assets, plus the amount of any borrowings forinvestment purposes) in the following types of debt securities:
• U.S. government securities (securities issued or guaranteed by the U.S. government or its agencies or instrumentalities).• residential and commercial mortgage-backed securities.• asset-backed securities.• domestic and foreign corporate debt obligations, including obligations issued by special-purpose entities that are backed by corporate debt
obligations.• debt obligations of foreign governments.
Up to 30% of the fund’s total assets may be invested collectively in the following categories of debt securities, provided that the fund will not investmore than 20% of its total assets in any single category:
• securities rated lower than investment grade or unrated securities of comparable quality as determined by the fund’s advisor (securities commonlyreferred to as “high yield” or “junk bonds”). The fund will not invest in securities rated lower than CCC at the time of purchase or in unratedsecurities of equivalent quality.
• non-dollar denominated debt obligations of foreign corporations and governments. (The fund may invest without limitation in U.S. dollardenominated securities of foreign issuers that are not located in emerging market countries.)
• debt obligations issued by governmental and corporate issuers that are located in emerging market countries. A country is considered to have an“emerging market” if it has a relatively low gross national product per capita compared to the world’s major economies, and the potential forrapid economic growth, provided that no issuer included in the fund’s current benchmark index will be considered to be located in an emergingmarket country.
The fund’s advisor makes buy, sell, and hold decisions using a “top-down” approach, which begins with the formulation of the advisor’s generaleconomic outlook. Following this, various sectors and industries are analyzed and selected for investment. Finally, the advisor selects individualsecurities within these sectors or industries. The advisor also analyzes expected changes to the yield curve under multiple market conditions to helpdefine maturity and duration selection.
The fund invests primarily in securities rated investment grade at the time of purchase by a nationally recognized statistical rating organization or inunrated securities of comparable quality. As noted above, however, up to 20% of the fund’s total assets may be invested in securities that are ratedlower than investment grade at the time of purchase or that are unrated and of comparable quality. Quality determinations regarding unratedsecurities will be made by the fund’s advisor. Unrated securities will not exceed 25% of the fund’s total assets.
To generate additional income, the fund may invest up to 25% of its total assets in dollar roll transactions. In a dollar roll transaction, the fund sellsmortgage-backed securities for delivery in the current month while contracting with the same party to repurchase similar securities at a future date.
27 Prospectus – First American Income Funds
Fund Summaries
Total Return Bond Fund continued

Under normal market conditions the fund attempts to maintain a weighted average effective maturity for its portfolio securities of fifteen years orless and an average effective duration of three to eight years. The fund’s weighted average effective maturity and average effective duration aremeasures of how the fund may react to interest rate changes.
The fund may utilize the following derivatives: options; futures contracts; options on futures contracts; interest rate caps, collars, and floors; foreigncurrency contracts; options on foreign currencies; swap agreements, including swap agreements on interest rates, currency rates, security indexesand specific securities, and credit default swap agreements; and options on the foregoing types of swap agreements. The fund may enter intostandardized derivatives contracts traded on domestic or foreign securities exchanges, boards of trade, or similar entities, and non-standardizedderivatives contracts traded in the over-the-counter (“OTC”) market. The fund may use these derivatives in an attempt to manage market risk,currency risk, credit risk and yield curve risk, to manage the effective maturity or duration of securities in the fund’s portfolio or for speculativepurposes in an effort to increase the fund’s yield or to enhance returns. The fund may also use derivatives to gain exposure to non-dollardenominated securities markets to the extent it does not do so through direct investments. The use of a derivative is speculative if the fund isprimarily seeking to enhance returns, rather than offset the risk of other positions. The fund may not use any derivative to gain exposure to asecurity or type of security that it would be prohibited by its investment restrictions from purchasing directly.
Principal Risks
The price and yield of this fund will change daily due to changes in interest rates and other factors, which means you could lose money. Aninvestment in the fund is not a deposit of U.S. Bank National Association and is not insured or guaranteed by the Federal Deposit InsuranceCorporation or any other governmental agency. The principal risks of investing in this fund are described below:
Active Management Risk — Because the fund is actively managed, the fund could underperform its benchmark or other mutual funds with similarinvestment objectives.
Call Risk — If an issuer calls higher-yielding bonds held by the fund, performance could be adversely impacted.
Credit Risk — The issuer of a debt security could suffer adverse changes in financial condition that result in a payment default or a downgrade ofthe security. Parties to contracts with the fund could default on their obligations.
Derivatives Risk — The use of derivative instruments involves additional risks and transaction costs which could leave the fund in a worse positionthan if it had not used these instruments. Derivatives may entail investment exposures that are greater than their cost would suggest. As a result, asmall investment in derivatives could have a large impact on performance. When the fund invests in a derivative for speculative purposes, the fundwill be fully exposed to the risks of loss of that derivative, which may sometimes be greater than the derivative’s cost.
Dollar Roll Transaction Risk — The use of dollar rolls can increase the volatility of the fund’s share price, and it may have an adverse impact onperformance unless the advisor correctly predicts mortgage prepayments and interest rates.
Emerging Markets Risk — Investments in emerging markets are subject to special political, economic, and market risks that can make the fund’semerging market investments more volatile and less liquid than investments in developed markets.
Foreign Security Risk — Securities of foreign issuers, even when dollar denominated and publicly traded in the United States, may involve risks notassociated with the securities of domestic issuers.
High-Yield Securities Risk — High-yield securities generally are less liquid, have more volatile prices, and have greater credit risk than investmentgrade securities.
Income Risk — The fund’s income could decline during periods of falling interest rates.
Interest Rate Risk — Interest rate increases can cause the value of debt securities to decrease.
International Investing Risk — Investing in non-dollar denominated foreign securities involves risk not typically associated with U.S. investing, suchas currency risk, risks of trading in foreign securities markets, and political and economic risks.
Liquidity Risk — Trading opportunities are more limited for debt securities that have received ratings below investment grade.
Mortgage- and Asset-Backed Securities Risk — These securities generally can be prepaid at any time. Prepayments that occur either more quicklyor more slowly than expected can adversely impact the fund.
28 Prospectus – First American Income Funds
Fund Summaries
Total Return Bond Fund continued

Fund Performance
The following bar chart and table provide some indication of the potential risks of investing in the fund. The fund’s past performance is notnecessarily an indication of how the fund will perform in the future. Updated performance information is available online at firstamericanfunds.comor by calling 800 677-3863.
The bar chart shows you the variability of the fund’s performance from year to year for Class A shares. Sales charges are not reflected in the chart;if they were, returns would be lower.
The table shows the variability of the fund’s average annual returns and how they compare over the time periods indicated to that of the fund’sbenchmark index, which is a broad measure of market performance. After-tax returns are calculated using the historical highest individual federalmarginal income tax rates and do not reflect the impact of state and local taxes. Actual after-tax returns depend on an investor’s tax situation andmay differ from those shown. After-tax returns are not relevant to investors who hold their fund shares through tax-deferred arrangements, such as401(k) plans or individual retirement accounts. After-tax returns are shown only for Class A shares; after-tax returns for other share classes willvary.
ANNUAL TOTAL RETURNS AS OF 12/31 EACH YEAR (Class A)1
Best Quarter:Quarter ended June 30, 2009 22.45%
Worst Quarter:Quarter ended September 30, 2008 (8.60)%
7.14%5.62% 9.77% 5.54% 2.37% 3.10% 5.89%
(14.81)%
36.40%
2001 2002 2003 2004 2005 2006 2007 2008 2009
AVERAGE ANNUAL TOTAL RETURNSAS OF 12/31/09
InceptionDate One Year Five Years
Since Inception(Class A,
Class B, Class C,and Class Y)
SinceInception(Class R)
Total Return Bond Fund
Class A (return before taxes) 2/1/00 30.65% 4.46% 5.94% N/A
Class A (return after taxes on distributions) 27.68% 2.46% 3.63% N/A
Class A (return after taxes on distributions and sale of fund shares) 19.65% 2.58% 3.64% N/A
Class B (return before taxes) 2/1/00 30.44% 4.25% 5.60% N/A
Class C (return before taxes) 2/1/00 34.50% 4.61% 5.60% N/A
Class R (return before taxes) 9/24/01 35.85% 5.08% N/A 5.65%
Class Y (return before taxes) 2/1/00 36.75% 5.64% 6.65% N/A
Barclays Capital Aggregate Bond Index2
(reflects no deduction for fees, expenses, or taxes) 5.93% 4.97% 6.40% 5.33%
1 Total return for the period 1/1/10 through 9/30/10 was 8.42%.2 An unmanaged fixed income index covering the U.S. investment grade fixed-rate bond market.
Investment Advisor
FAF Advisors, Inc. serves as investment advisor to the fund. In connection with the Transaction, fund shareholders will be asked to approve a newinvestment advisory agreement appointing NAM as the fund’s investment advisor. If approved by shareholders, this agreement will take effect uponclosing of the Transaction. Nuveen Asset Management LLC — which is expected to be formed as a wholly-owned subsidiary of NAM pursuant to aninternal restructuring — will become the sub-advisor to the fund at the later of the closing of the internal restructuring or the closing of theTransaction.
29 Prospectus – First American Income Funds
Fund Summaries
Total Return Bond Fund continued
Portfolio ManagersTitle Portfolio manager of fund since:
Timothy A. Palmer, CFA Senior Fixed-Income Portfolio Manager May 2005Jeffrey J. Ebert Head of Investment Grade Credit Sector Team February 2000Marie A. Newcome, CFA Fixed-Income Portfolio Manager October 2010
Other Information
For important information about the purchase and sale of fund shares, tax information, and financial intermediary compensation, please see“Additional Summary Information” on page 31 of the prospectus.
30 Prospectus – First American Income Funds
Fund Summaries
Total Return Bond Fund continued

Additional Summary Information
Purchase and Sale of Fund Shares
You may purchase or redeem shares of a fund on any day when the New York Stock Exchange (NYSE) is open, except that shares cannot bepurchased by wire transfer on days that federally chartered banks are closed. Purchases, redemptions, and exchanges may be restricted in the eventof an early or unscheduled close of the NYSE, as permitted by the Securities and Exchange Commission (SEC).
You can become a shareholder in any of the funds by making a minimum initial investment of $2,500. The minimum additional investment is $100.The funds reserve the right to waive or lower purchase minimums under certain circumstances and to reject any purchase order.
You can redeem shares through your financial intermediary or by contacting the funds at:
Phone Regular Mail Overnight Express Mail
800-677-3863 First American Funds First American FundsP.O. Box 3011 615 East Michigan StreetMilwaukee, WI 53201-3011 Milwaukee, WI 53202
Tax Information
Dividends and capital gain distributions you receive from a fund are subject to federal income taxes and may also be subject to state and localtaxes.
Payments to Broker-Dealers and Other Financial Intermediaries
If you purchase a fund through a broker-dealer or other financial intermediary (such as a bank), the fund and its related companies may pay theintermediary for the sale of fund shares and related services. These payments may create a conflict of interest by influencing the broker-dealer orother intermediary and your salesperson to recommend the fund over another investment. Ask your salesperson or visit your financialintermediary’s website for more information.
31 Prospectus – First American Income Funds

More about the Funds
Investment ObjectivesThe funds’ objectives, which are described in the “Fund Summaries” section, may be changed without shareholder approval. If a fund’s objectivechanges, you will be notified at least 60 days in advance. Please remember, there is no guarantee that any fund will achieve its objective.
Investment StrategiesThe funds’ principal investment strategies are discussed in the “Fund Summaries” section. These are the strategies that the funds’ investmentadvisor believes are most likely to be important in trying to achieve the funds’ objectives. This section provides information about some additionalstrategies that the funds’ investment advisor uses, or may use, to achieve the funds’ objectives. You should be aware that each fund may also usestrategies and invest in securities that are not described in this prospectus, but that are described in the statement of additional information (SAI).For a copy of the SAI, call Investor Services at 800 677-3863.
The debt obligations in which the funds invest may have variable, floating, or fixed interest rates.
U.S. Government Agency Securities
The U.S. Government agency securities in which the funds may invest include securities issued by the Government National Mortgage Association(GNMA), the Federal National Mortgage Association (FNMA), the Federal Home Loan Mortgage Corporation (FHLMC), the Federal Farm Credit Bank(FFCB), the U.S. Agency for International Development (U.S. AID), the Federal Home Loan Banks (FHLB) and the Tennessee Valley Authority (TVA).Securities issued by GNMA, TVA and U.S. AID are backed by the full faith and credit of the U.S. Government. Securities issued by FNMA andFHLMC are supported by the right to borrow directly from the U.S. Treasury. The other U.S. Government agency and instrumentality securities inwhich the funds invest are backed solely by the credit of the agency or instrumentality issuing the obligations. No assurances can be given that theU.S. Government will provide financial support to these other agencies or instrumentalities because it is not obligated to do so.
Effective Maturity and Effective Duration
Certain funds attempt to maintain a specified weighted average effective maturity and/or average effective duration. Effective maturity differs fromactual stated or final maturity, which may be substantially longer. In calculating effective maturity, the advisor estimates the effect of expectedprincipal payments and call provisions on securities held in the portfolio. Effective maturity provides the advisor with a better estimate of interestrate risk under normal market conditions, but may underestimate interest rate risk in an environment of adverse (rising) interest rates.
Effective duration, another measure of interest rate risk, measures how much the value of a security is expected to change with a given change ininterest rates. The longer a security’s effective duration, the more sensitive its price to changes in interest rates. For example, if interest rates wereto increase by one percentage point, the market value of a bond with an effective duration of five years would decrease by 5%, with all other factorsbeing constant. However, all other factors are rarely constant. Effective duration is based on assumptions and subject to a number of limitations. Itis most useful when interest rate changes are small, rapid, and occur equally in short-term and long-term securities. In addition, it is difficult tocalculate precisely for bonds with prepayment options, such as mortgage- and asset-backed securities, because the calculation requiresassumptions about prepayment rates. For these reasons, the effective durations of funds which invest a significant portion of their assets in thesesecurities can be greatly affected by changes in interest rates.
Ratings
Certain funds have investment strategies requiring them to invest in debt securities that have received a particular rating from a rating service suchas Moody’s or Standard & Poor’s. Any reference in this prospectus to a specific rating encompasses all gradations of that rating. For example, if theprospectus says that a fund may invest in securities rated as low as B, the fund may invest in securities rated B�.
Securities Lending
Each fund may lend securities representing up to one-third of the value of its total assets to broker-dealers, banks, and other institutions togenerate additional income. When a fund loans its portfolio securities, it will receive, at the inception of each loan, cash collateral equal to at least102% of the value of the loaned securities. Under the funds’ securities lending agreement, the securities lending agent will generally bear the riskthat a borrower may default on its obligation to return loaned securities. The funds, however, will be responsible for the risks associated with theinvestment of cash collateral, including any collateral invested in an affiliated money market fund. A fund may lose money on its investment of cashcollateral or may fail to earn sufficient income on its investment to meet its obligations to the borrower.
32 Prospectus – First American Income Funds

Temporary Investments
In an attempt to respond to adverse market, economic, political, or other conditions, each fund may temporarily invest without limit in cash and inU.S. dollar-denominated high-quality money market instruments and other short-term securities, including money market funds advised by thefunds’ advisor. Being invested in these securities may keep a fund from participating in a market upswing and prevent the fund from achieving itsinvestment objectives.
Investment RisksThe principal risks of investing in each fund are identified in the “Fund Summaries” section. These risks are further described below.
Active Management Risk. Each fund is actively managed and its performance therefore will reflect in part the advisor’s ability to makeinvestment decisions which are suited to achieving the fund’s investment objective. Due to its active management, a fund could underperform othermutual funds with similar investment objectives.
Additional Expenses. When a fund invests in other investment companies, you bear both your proportionate share of fund expenses and,indirectly, the expenses of the other investment companies.
Call Risk. Each of the funds may invest in debt securities, which are subject to call risk. Bonds may be redeemed at the option of the issuer,or “called,” before their stated maturity date. In general, an issuer will call its bonds if they can be refinanced by issuing new bonds which bear alower interest rate. Each of the funds is subject to the possibility that during periods of falling interest rates, a bond issuer will call its high-yieldingbonds. A fund would then be forced to invest the unanticipated proceeds at lower interest rates, resulting in a decline in the fund’s income.
Credit Risk. Each fund is subject to the risk that the issuers of debt securities held by a fund will not make payments on the securities. Thereis also the risk that an issuer could suffer adverse changes in financial condition that could lower the credit quality of a security. This could lead togreater volatility in the price of the security and in shares of the fund. Also, a change in the credit quality rating of a bond could affect the bond’sliquidity and make it more difficult for the fund to sell. When a fund purchases unrated securities, it will depend on the advisor’s analysis of creditrisk without the assessment of an independent rating organization, such as Moody’s or Standard & Poor’s.
Intermediate Government Bond Fund invests primarily in U.S. government securities, which have historically involved little risk of loss of principal ifheld to maturity. Nevertheless, certain of these securities are supported only by the credit of the issuer or instrumentality. Intermediate GovernmentBond Fund and Intermediate Term Bond Fund attempt to minimize credit risk by investing in securities considered at least investment grade at thetime of purchase. However, all of these securities, especially those in the lower investment grade rating categories, have credit risk. In adverseeconomic or other circumstances, issuers of these lower rated securities are more likely to have difficulty making principal and interest paymentsthan issuers of higher rated securities.
Derivatives Risk. A small investment in derivatives could have a potentially large impact on a fund’s performance. The use of derivativesinvolves risks different from, or possibly greater than, the risks associated with investing directly in the underlying assets. Derivatives can be highlyvolatile, illiquid and difficult to value, and there is the risk that changes in the value of a derivative held by a fund will not correlate with theunderlying instruments or the fund’s other investments. Derivative instruments also involve the risk that a loss may be sustained as a result of thefailure of the counterparty to the derivative instruments to make required payments or otherwise comply with the derivative instruments’ terms.Certain types of derivatives involve greater risks than the underlying obligations because, in addition to general market risks, they are subject toilliquidity risk, counterparty risk, and credit risk. For example, in a credit default swap, the advisor may not correctly evaluate the creditworthiness ofthe company or companies on which the swap is based. Furthermore, when a fund sells protection in a credit default swap, in addition to beingsubject to investment exposure on its total net assets, the fund is subject to investment exposure on the notional amount of the swap. Somederivatives also involve leverage, which could increase the volatility of these investments as they may fluctuate in value more than the underlyinginstrument.
In order to hedge against adverse movements in currency exchange rates, the funds may enter into forward foreign currency exchange contracts. Ifthe advisor’s or sub-advisor’s forecast of exchange rate movements is incorrect, the fund may realize losses on its foreign currency transactions. Inaddition, the fund’s hedging transactions may prevent the fund from realizing the benefits of a favorable change in the value of foreign currencies.
The funds may enter into over-the-counter (OTC) transactions in derivatives. Transactions in the OTC markets generally are conducted on aprincipal-to-principal basis. The terms and conditions of these instruments generally are not standardized and tend to be more specialized orcomplex, and the instruments may be harder to value. In addition, there may not be a liquid market for OTC derivatives. As a result, it may not bepossible to initiate a transaction or liquidate a position at an advantageous time or price.
Dollar Roll Transaction Risk. In a dollar roll transaction, a fund sells mortgage-backed securities for delivery in the current month whilecontracting with the same party to repurchase similar securities at a future date. Because the fund gives up the right to receive principal andinterest paid on the securities sold, a mortgage dollar roll transaction will diminish the investment performance of a fund unless the difference
33 Prospectus – First American Income Funds
More about the Funds
Investment Strategies continued
between the price received for the securities sold and the price to be paid for the securities to be purchased in the future, plus any fee incomereceived, exceeds any income, principal payments, and appreciation on the securities sold as part of the mortgage dollar roll. Whether mortgagedollar rolls will benefit a fund may depend upon the advisor’s ability to predict mortgage prepayments and interest rates. In addition, the use ofmortgage dollar rolls by a fund increases the amount of the fund’s assets that are subject to market risk, which could increase the volatility of theprice of the fund’s shares.
Emerging Markets Risk. Core Bond Fund, High Income Bond Fund, Short Term Bond Fund, and Total Return Bond Fund may invest inequity securities of emerging markets issuers. The risks of international investing are particularly significant in emerging markets. Investing inemerging markets generally involves exposure to economic structures that are less diverse and mature, and to political systems that are less stable,than those of developed countries. In addition, issuers in emerging markets typically are subject to a greater degree of change in earnings andbusiness prospects than are companies in developed markets.
Foreign Security Risk. Each fund (other than Intermediate Government Bond Fund) may invest in dollar denominated foreign securities.Securities of foreign issuers, even when dollar-denominated and publicly traded in the United States, may involve risks not associated with thesecurities of domestic issuers. For certain foreign countries, political or social instability, or diplomatic developments could adversely affect thesecurities. There is also the risk of loss due to governmental actions such as a change in tax statutes or the modification of individual propertyrights. In addition, individual foreign economies may differ favorably or unfavorably from the U.S. economy.
High-Yield Securities Risk. A significant portion of the portfolio of High Income Bond Fund, and up to 10% of the total assets of CoreBond Fund and Short Term Bond Fund, 10% of the net assets of Inflation Protected Securities Fund, and 20% of the total assets of Total ReturnBond Fund, may consist of lower-rated corporate debt obligations, which are commonly referred to as “high-yield” securities or “junk bonds.”Although these securities usually offer higher yields than investment grade securities, they also involve more risk. High-yield securities may be moresusceptible to real or perceived adverse economic conditions than investment grade securities. In addition, the secondary trading market may beless liquid. High-yield securities generally have more volatile prices and carry more risk to principal than investment grade securities.
Income Risk. Each fund’s income could decline due to falling market interest rates. This is because, in a falling interest rate environment, thefunds generally will have to invest the proceeds from sales of fund shares, as well as the proceeds from maturing portfolio securities (or portfoliosecurities that have been called, see “Call Risk” above, or prepaid, see “Mortgage- and Asset-Backed Securities Risk” below), in lower-yieldingsecurities.
Inflation Protected Securities Fund is subject to the risk that, because the interest and/or principal payments on inflation protected securities areadjusted periodically for changes in inflation, the income distributed by the fund may be irregular. In a period of sustained deflation, the inflationprotected securities held by the fund, and consequently the fund itself, may not pay any income.
Indexing Methodology Risk. Interest payments on inflation protected debt securities will vary with the rate of inflation, as measured by aspecified index. There can be no assurance that the CPI-U (used as the inflation measure by U.S. Treasury inflation protected securities) or anyforeign inflation index will accurately measure the real rate of inflation in the prices of goods and services. Moreover, there can be no assurancethat the rate of inflation in a foreign country will be correlated to the rate of inflation in the United States. If the market perceives that theadjustment mechanism of an inflation protected security does not accurately adjust for inflation, the value of the security could be adverselyaffected. There may be a lag between the time a security is adjusted for inflation and the time interest is paid on that security. This may have anadverse effect on the trading price of the security, particularly during periods of significant, rapid changes in inflation. In addition, to the extent thatinflation has increased during the period of time between the inflation adjustment and the interest payment, the interest payment will not beprotected from the inflation increase.
Interest Rate Risk. Debt securities will fluctuate in value with changes in interest rates. In general, debt securities will increase in valuewhen interest rates fall and decrease in value when interest rates rise. Longer-term debt securities are generally more sensitive to interest ratechanges.
The effect of interest rate changes on the inflation protected securities held by Inflation Protected Securities Fund will be somewhat different.Interest rates have two components: a “real” interest rate and an increment that reflects investor expectations of future inflation. Because interestrates on inflation protected securities are adjusted for inflation, the values of these securities are not materially affected by inflation expectations.Therefore, the values of inflation protected debt securities are expected to change in response to changes in “real” interest rates. Generally, thevalue of an inflation protected debt security will fall when real interest rates rise and rise when real interest rates fall.
34 Prospectus – First American Income Funds
More about the Funds
Investment Risks continued

International Investing Risk. Core Bond Fund, Inflation Protected Securities Fund, Short Term Bond Fund, and Total Return Bond Fundmay invest in securities that trade in markets other than the United States. International investing involves risks not typically associated withU.S. investing. These risks include:
Currency Risk. Because foreign securities often trade in currencies other than the U.S. dollar, changes in currency exchange rates will affect thefund’s net asset value, the value of dividends and interest earned, and gains and losses realized on the sale of securities. A strong U.S. dollarrelative to these other currencies will adversely affect the value of the fund.
Foreign Securities Market Risk. Securities of many non-U.S. companies may be less liquid and their prices more volatile than securities ofcomparable U.S. companies. Securities of companies traded in many countries outside the U.S., particularly emerging markets countries, may besubject to further risks due to the inexperience of local investment professionals and financial institutions, the possibility of permanent or temporarytermination of trading, and greater spreads between bid and asked prices for securities. In addition, non-U.S. stock exchanges and investmentprofessionals are subject to less governmental regulation, and commissions may be higher than in the United States. Also, there may be delays inthe settlement of non-U.S. stock exchange transactions.
Foreign Tax Risk. A fund’s income from foreign issuers may be subject to non-U.S. withholding taxes. In some countries, the fund also may besubject to taxes on trading profits and, on certain securities transactions, transfer or stamp duties tax.
Information Risk. Non-U.S. companies generally are not subject to uniform accounting, auditing, and financial reporting standards or to otherregulatory requirements that apply to U.S. companies. As a result, less information may be available to investors concerning non-U.S. issuers.Accounting and financial reporting standards in emerging markets may be especially lacking.
Investment Restriction Risk. Some countries, particularly emerging markets, restrict to varying degrees foreign investment in their securitiesmarkets. In some circumstances, these restrictions may limit or preclude investment in certain countries or may increase the cost of investing insecurities of particular companies.
Political and Economic Risks. International investing is subject to the risk of political, social, or economic instability in the country of the issuer ofa security, the difficulty of predicting international trade patterns, the possibility of the imposition of exchange controls, expropriation, limits onremoval of currency or other assets, and nationalization of assets.
Liquidity Risk. Core Bond Fund, High Income Bond Fund, Inflation Protected Securities Fund, Short Term Bond Fund, and Total Return BondFund are exposed to liquidity risk because of their investment in high-yield securities. Trading opportunities are more limited for debt securities thathave received ratings below investment grade. These features may make it more difficult to sell or buy a security at a favorable price or time.Consequently, these funds may have to accept a lower price to sell a security, sell other securities to raise cash, or give up an investmentopportunity, any of which could have a negative effect on a fund’s performance. Infrequent trading may also lead to greater price volatility.
Mortgage- and Asset-Backed Securities Risk. Mortgage-backed securities are secured by and payable from pools of mortgageloans. Similarly, asset-backed securities are supported by obligations such as automobile loans, home equity loans, corporate bonds, or commercialloans. These mortgages and other obligations generally can be prepaid at any time without penalty. As a result, mortgage- and asset-backedsecurities are subject to prepayment risk, which is the risk that falling interest rates could cause prepayments of the securities to occur morequickly than expected. This occurs because, as interest rates fall, more homeowners refinance the mortgages underlying mortgage-related securitiesor prepay the debt obligations underlying asset-backed securities. A fund holding these securities must reinvest the prepayments at a time wheninterest rates are falling, reducing the income of the fund. In addition, when interest rates fall, prices on mortgage- and asset-backed securities maynot rise as much as for other types of comparable debt securities because investors may anticipate an increase in prepayments.
Mortgage- and asset-backed securities are also subject to extension risk, which is the risk that rising interest rates could cause mortgages or otherobligations underlying the securities to be prepaid more slowly than expected, resulting in slower prepayments of the securities. This would, ineffect, convert a short- or medium-duration mortgage- or asset-backed security into a longer-duration security, increasing its sensitivity to interestrate changes and causing its price to decline.
Tax Consequence of Inflation Adjustments. Periodic adjustments for inflation to the principal amount of an inflation protectedsecurity will give rise to original issue discount, which will be includable in gross income for Inflation Protected Securities Fund. Because the fund isrequired to distribute its taxable income to avoid corporate level tax, the fund may be required to make annual distributions to shareholders thatexceed the cash it receives, which may require the fund to liquidate certain investments when it is not advantageous to do so.
Disclosure of Portfolio HoldingsA description of the funds’ policies and procedures with respect to the disclosure of the funds’ portfolio securities is available in the funds’ SAI.
35 Prospectus – First American Income Funds
More about the Funds
Investment Risks continued
Fund Management
Investment AdvisorFAF Advisors, Inc.800 Nicollet MallMinneapolis, MN 55402
FAF Advisors provides investment management services to individuals and institutions, including corporations, foundations, pensions, and retirementplans. As of September 30, 2010, FAF Advisors had more than $84 billion in assets under management, including investment company assets ofmore than $67 billion. As investment advisor, FAF Advisors manages the funds’ business and investment activities, subject to the authority of thefunds’ board of directors.
Each fund pays the investment advisor a monthly management fee for providing investment advisory services. The table below reflects managementfees paid to the investment advisor, after taking into account any fee waivers, for the funds’ most recently completed fiscal year.
Management feeas a % of average
daily net assets
Core Bond Fund 0.43%High Income Bond Fund 0.52%Inflation Protected Securities Fund 0.19%Intermediate Government Bond Fund 0.16%Intermediate Term Bond Fund 0.44%Short Term Bond Fund 0.31%Total Return Bond Fund 0.47%
A discussion regarding the basis for the board’s approval of the funds’ investment advisory agreement appears in the funds’ annual report toshareholders for the fiscal year ended June 30, 2010.
In connection with the Transaction, shareholders of each fund will be asked to approve a new investment advisory agreement appointing NAM asthe fund’s investment advisor. If approved by shareholders, this agreement will take effect upon closing of Transaction, which is subject to thesatisfaction of customary conditions and is currently expected to occur by the end of 2010. Nuveen Asset Management LLC — which is expected tobe formed as a wholly-owned subsidiary of NAM pursuant to an internal restructuring — will become the sub-advisor to the funds at the later of theclosing of the internal restructuring or the closing of the Transaction.
Under the proposed investment advisory agreement with NAM (the “Management Agreement”), NAM will receive a management fee for providingboth advisory services and certain administrative services to the funds. Fees payable to NAM under the Management Agreement include breakpointswhich are dependent upon both fund and complex-level assets. Assuming asset levels as of June 30, 2010, adjusted to take into accountredemptions by the U.S. Bank 401(k) Plan out of certain Funds which are expected to occur prior to closing of the Transaction, the management feepayable to NAM by each fund will be lower than the sum of the advisory fee and administration fee currently payable by such fund to the advisor.However, certain services provided to the funds under the current administration agreement will not be provided to the funds under the proposedManagement Agreement and will be delegated to other service providers and paid for by the funds separately from the management fee. Similarly,certain fees paid by the advisor under the current administration agreement will not be paid by NAM under the proposed Management Agreementand will be paid directly by the funds. Immediately following the closing of the Transaction, the net expense ratio of each fund, after voluntarywaivers by NAM and excluding any acquired fund fees and expenses, is expected to be the same or lower than the fund’s net expense ratio, aftervoluntary waivers and excluding any acquired fund fees and expenses, as of June 30, 2010, adjusted (where applicable) to reflect the expecteddecrease in net assets resulting from the U.S. Bank 401(k) Plan redemptions, assuming the fund’s net assets at the time of closing the Transactionare no lower than their adjusted June 30 level. In addition, NAM has committed to maintain all current expense caps through June 30, 2011.
Additional Compensation
FAF Advisors, U.S. Bank National Association (U.S. Bank) and other affiliates of U.S. Bancorp may act as fiduciary with respect to plans subject tothe Employee Retirement Income Security Act of 1974 (ERISA) and other trust and agency accounts that invest in the First American funds. Asdescribed above, FAF Advisors receives compensation for acting as the funds’ investment advisor. FAF Advisors, U.S. Bank and their affiliates alsoreceive compensation from the funds as set forth below.
Administration Services. FAF Advisors and its affiliate, U.S. Bancorp Fund Services, LLC (Fund Services), act as the funds’ administratorand sub-administrator, respectively, providing administration services that include general administrative and accounting services, blue sky servicesand shareholder services. For such services, each fund pays FAF Advisors the fund’s pro rata portion of up to 0.25% of the aggregate average dailynet assets of all open-end funds in the First American family of funds, other than the series of First American Strategy Funds, Inc. FAF Advisorspays Fund Services a portion of its fee, as agreed to from time to time. In addition to these fees, the funds may reimburse FAF Advisors for anyout-of-pocket expenses incurred in providing administration services.
36 Prospectus – First American Income Funds

Custody Services. U.S. Bank provides custody services to each fund. U.S. Bank is paid monthly fees equal, on an annual basis, to 0.005%of each fund’s average daily net assets.
Distribution Services. Quasar Distributors, LLC, an affiliate of FAF Advisors, receives distribution and shareholder servicing fees for actingas the funds’ distributor.
Securities Lending Services. In connection with lending their portfolio securities, the funds pay fees to U.S. Bank of up to 25% of eachfund’s net income from securities lending transactions and U.S. Bank pays half of such fees to FAF Advisors for certain securities lending servicesprovided by FAF Advisors. In addition, collateral for securities on loan will be invested in a money market fund administered by FAF Advisors andFAF Advisors will receive an administration fee equal to 0.02% of such fund’s average daily net assets.
Transfer Agency Services. Fund Services provides transfer agency and dividend disbursing services, as well as certain shareholderservices, to the funds. Fund Services receives fees for transfer agency and dividend disbursing services on a per shareholder account basis, subjectto a minimum fee per share class. In addition, the funds may reimburse Fund Services for any out-of-pocket expenses incurred in providing transferagency services.
Other Compensation. To the extent that fund shares are held through U.S. Bank or its broker-dealer affiliate, U.S. Bancorp Investments,Inc., those entities may receive distribution and/or shareholder servicing fees from the funds’ distributor as well as other payments from the funds’distributor and/or advisor as described below under “Shareholder Information — Compensation Paid to Financial Intermediaries — AdditionalPayments to Financial Intermediaries.”
Portfolio ManagersThe portfolio managers primarily responsible for the funds’ management are:
Core Bond Fund. Chris J. Neuharth, CFA, Senior Fixed-Income Portfolio Manager. Mr. Neuharth has served as the primary portfolio managerof the fund since October 2006 and had previously co-managed the fund since October 2002. Mr. Neuharth entered the financial services industry in1983 and rejoined FAF Advisors in 2000.
Timothy A. Palmer, CFA, Senior Fixed-Income Portfolio Manager. Mr. Palmer has co-managed the fund since May 2003. He entered the financialservices industry in 1986 and joined FAF Advisors in 2003.
Wan-Chong Kung, CFA, Senior Fixed-Income Portfolio Manager. Ms. Kung has co-managed the fund since June 2001. She entered the financialservices industry in 1992 and joined FAF Advisors in 1993.
Jeffrey J. Ebert, CFA, Head of Investment Grade Credit Sector Team. Mr. Ebert has co-managed the fund since December 2005. He entered thefinancial services industry when he joined FAF Advisors in 1991.
High Income Bond Fund. John T. Fruit, CFA, Senior Fixed-Income Portfolio Manager. Mr. Fruit has served as the primary portfoliomanager for the fund since October 2006 and had previously co-managed the fund since November 2005. Mr. Fruit entered the financial servicesindustry in 1988 and joined FAF Advisors in 2001.
Jeffrey T. Schmitz, CFA, Senior Credit Analyst. Mr. Schmitz has co-managed the fund since January 2008. He entered the financial services industryin 1987. Prior to joining FAF Advisors in 2006, Mr. Schmitz worked as a senior credit research analyst at Deephaven Capital Management, as atrading risk manager at Cargill Financial Services, and in various risk oversight roles with the Office of the Comptroller of the Currency.
Inflation Protected Securities Fund. Wan-Chong Kung has served as the primary portfolio manager for the fund since October 2004.Information on Ms. Kung appears above under “Core Bond Fund.”
Chad W. Kemper, Senior Fixed-Income Trader. Mr. Kemper has co-managed the fund since October 2010. He entered the financial services industrywhen he joined FAF Advisors in 1999.
Intermediate Government Bond Fund. Wan-Chong Kung has served as the primary portfolio manager for the fund since November2002. Information on Ms. Kung appears above under “Core Bond Fund.”
Chris J. Neuharth has co-managed the fund since August 2009. Information on Mr. Neuharth appears above under “Core Bond Fund.”
Jason J. O’Brien, CFA, Fixed-Income Portfolio Manager. Mr. O’Brien has co-managed the fund since August 2009. He entered the financial servicesindustry when he joined FAF Advisors in 1993.
Intermediate Term Bond Fund. Wan-Chong Kung has served as the primary portfolio manager for the fund since November 2002.Information on Ms. Kung appears above under “Core Bond Fund.”
37 Prospectus – First American Income Funds
Fund Management
Investment Advisor continued

Jeffrey J. Ebert has co-managed the fund since February 2000. Information on Mr. Ebert appears above under “Core Bond Fund.”
Short Term Bond Fund. Chris J. Neuharth has served as the primary portfolio manager of the fund since March 2004. Information onMr. Neuharth appears above under “Core Bond Fund.”
Brenda A. Briceno, CFA, Corporate Trader. Ms. Briceno has co-managed the fund since October 2010. She entered the financial services industrywhen she joined FAF Advisors in 2004.
Peter L. Agrimson, CFA, Associate Trader. Mr. Agrimson has co-managed the fund since October 2010. He began working in the financial servicesindustry in 2005. Prior to joining the firm in 2009, he served as credit analyst at Long Lake Partners, LLC.
Total Return Bond Fund. Timothy A. Palmer has served as the primary portfolio manager of the fund since May 2005. Information onMr. Palmer appears above under “Core Bond Fund.”
Jeffrey J. Ebert has co-managed the fund since February 2000. Information on Mr. Ebert appears above under “Core Bond Fund.”
Marie A. Newcome, CFA, Fixed-Income Portfolio Manager. Ms. Newcome has co-managed the fund since October 2010. She entered the financialservices industry in 1992 and joined FAF Advisors in 2004.
The SAI provides additional information about the portfolio managers’ compensation, other accounts managed by the portfolio managers, and theportfolio managers’ ownership of securities in the funds.
38 Prospectus – First American Income Funds
Fund Management
Portfolio Managers continued
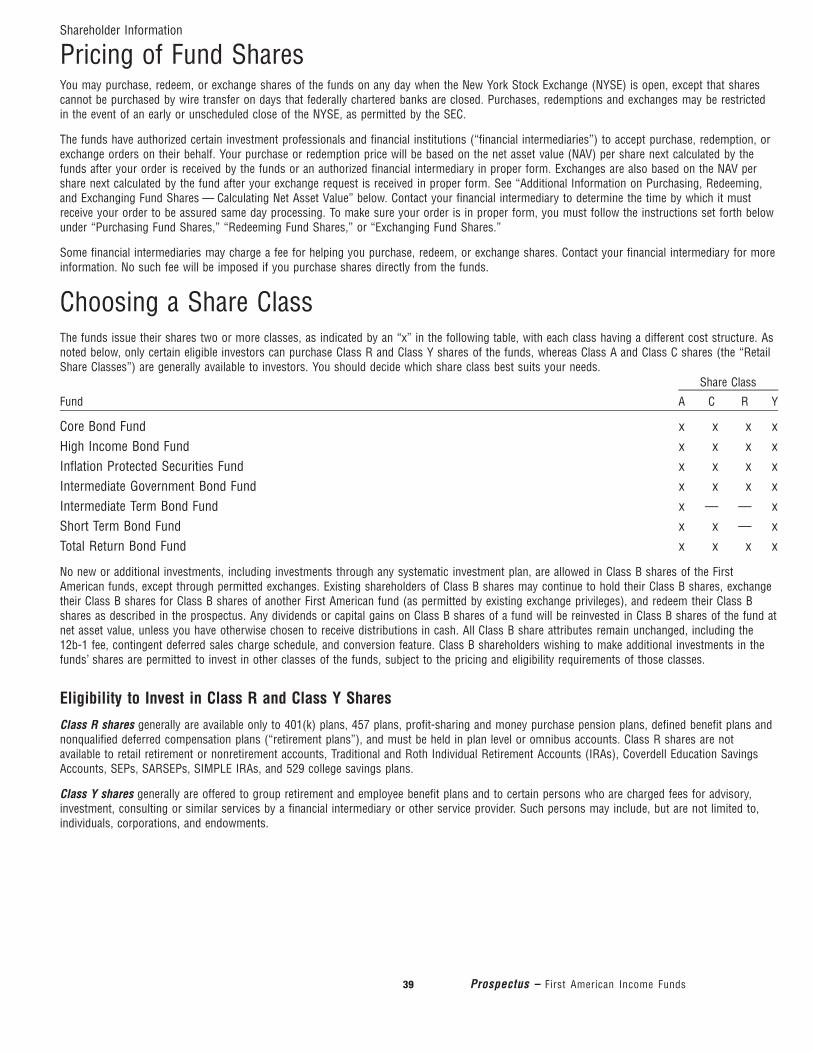
Shareholder Information
Pricing of Fund SharesYou may purchase, redeem, or exchange shares of the funds on any day when the New York Stock Exchange (NYSE) is open, except that sharescannot be purchased by wire transfer on days that federally chartered banks are closed. Purchases, redemptions and exchanges may be restrictedin the event of an early or unscheduled close of the NYSE, as permitted by the SEC.
The funds have authorized certain investment professionals and financial institutions (“financial intermediaries”) to accept purchase, redemption, orexchange orders on their behalf. Your purchase or redemption price will be based on the net asset value (NAV) per share next calculated by thefunds after your order is received by the funds or an authorized financial intermediary in proper form. Exchanges are also based on the NAV pershare next calculated by the fund after your exchange request is received in proper form. See “Additional Information on Purchasing, Redeeming,and Exchanging Fund Shares — Calculating Net Asset Value” below. Contact your financial intermediary to determine the time by which it mustreceive your order to be assured same day processing. To make sure your order is in proper form, you must follow the instructions set forth belowunder “Purchasing Fund Shares,” “Redeeming Fund Shares,” or “Exchanging Fund Shares.”
Some financial intermediaries may charge a fee for helping you purchase, redeem, or exchange shares. Contact your financial intermediary for moreinformation. No such fee will be imposed if you purchase shares directly from the funds.
Choosing a Share ClassThe funds issue their shares two or more classes, as indicated by an “x” in the following table, with each class having a different cost structure. Asnoted below, only certain eligible investors can purchase Class R and Class Y shares of the funds, whereas Class A and Class C shares (the “RetailShare Classes”) are generally available to investors. You should decide which share class best suits your needs.
Fund A C R Y
Share Class
Core Bond Fund x x x xHigh Income Bond Fund x x x xInflation Protected Securities Fund x x x xIntermediate Government Bond Fund x x x xIntermediate Term Bond Fund x — — xShort Term Bond Fund x x — xTotal Return Bond Fund x x x x
No new or additional investments, including investments through any systematic investment plan, are allowed in Class B shares of the FirstAmerican funds, except through permitted exchanges. Existing shareholders of Class B shares may continue to hold their Class B shares, exchangetheir Class B shares for Class B shares of another First American fund (as permitted by existing exchange privileges), and redeem their Class Bshares as described in the prospectus. Any dividends or capital gains on Class B shares of a fund will be reinvested in Class B shares of the fund atnet asset value, unless you have otherwise chosen to receive distributions in cash. All Class B share attributes remain unchanged, including the12b-1 fee, contingent deferred sales charge schedule, and conversion feature. Class B shareholders wishing to make additional investments in thefunds’ shares are permitted to invest in other classes of the funds, subject to the pricing and eligibility requirements of those classes.
Eligibility to Invest in Class R and Class Y Shares
Class R shares generally are available only to 401(k) plans, 457 plans, profit-sharing and money purchase pension plans, defined benefit plans andnonqualified deferred compensation plans (“retirement plans”), and must be held in plan level or omnibus accounts. Class R shares are notavailable to retail retirement or nonretirement accounts, Traditional and Roth Individual Retirement Accounts (IRAs), Coverdell Education SavingsAccounts, SEPs, SARSEPs, SIMPLE IRAs, and 529 college savings plans.
Class Y shares generally are offered to group retirement and employee benefit plans and to certain persons who are charged fees for advisory,investment, consulting or similar services by a financial intermediary or other service provider. Such persons may include, but are not limited to,individuals, corporations, and endowments.
39 Prospectus – First American Income Funds

Class Share Overview
Front-EndSales Charge
(FESC)
Contingent DeferredSales Charge
(CDSC)Annual 12b-1 Fees
(as a % of net assets)
Class A 2.25%-4.25%1 None2 0.25%Class B3 None 5.00%4 1.00%Class C5 None 1.00%6 1.00%Class R None None 0.50%Class Y None None None1 The FESC is reduced for larger purchases. See “Determining Your Share Price — Class A Shares” below.2 Class A share investments of $1 million or more ($250,000 or more for Short Term Bond Fund) on which no FESC is paid may be subject to a CDSC of up to 1%
(up to 0.60% for Short Term Bond Fund).3 Class B shares automatically convert to Class A shares eight years after purchase, which reduces future annual expenses since Class A shares have lower annual
expenses.4 A CDSC of up to 5.00% applies to Class B shares if you redeem shares within six years of purchase. The CDSC declines over the six years as described below under
“Determining Your Share Price — Class B Shares.”5 Class C shares do not convert to Class A shares so they will continue to have higher annual expenses than Class A shares for as long as you hold them.6 A 1% CDSC applies if you redeem your Class C shares within 12 months of purchase.
Among the Retail Share Classes, Class A shares may be a better choice if your investment qualifies for a reduced sales charge. You should notplace Class C share orders that would cause your total investment in First American funds Class A, Class B, and Class C shares (not including FirstAmerican money market funds) to equal or exceed $1 million, using the aggregation principles discussed below under “Determining Your SharePrice — Class A Shares — Reducing Your Sales Charge on Class A Shares.” To the extent operationally possible, these orders will be automaticallyrejected.
Class R or Class Y shares are generally a better choice than a Retail Share Class if you are eligible to purchase these share classes. However, if youintend to hold your shares for a long time, or if you are eligible to invest in Class A shares with a reduced or waived sales charge, Class A may be abetter choice than an investment in Class R shares.
12b-1 Fees
Each fund has adopted a plan pursuant to Rule 12b-1 under the Investment Company Act that allows the fund to pay its distributor an annual feefor the distribution and sale of its shares and/or for services provided to shareholders. The funds do not pay 12b-1 fees on Class Y shares. The12b-1 fees paid by the funds are designated as distribution fees and/or shareholder servicing fees, as described here.
DistributionFee
ShareholderServicing Fee
Annual 12b-1 Fees(as a % of
average daily net assets)
Class A1 None 0.25%Class B 0.75% 0.25%Class C 0.75% 0.25%Class R 0.25% 0.25%Class Y None None1 The distributor has contractually agreed to limit its Class A share 12b-1 fees for Intermediate Government Bond Fund, Intermediate Term Bond Fund, and Short Term
Bond Fund to 0.15% of average daily net assets through October 31, 2011. In addition, the advisor has contractually agreed to reimburse an amount of Class Ashare 12b-1 fees equal to 0.11% of average daily net assets for Total Return Bond Fund.
Because 12b-1 fees are paid out of a fund’s assets on an ongoing basis, over time these fees will increase the cost of your investment and maycost you more than paying other types of sales charges.
40 Prospectus – First American Income Funds
Shareholder Information
Choosing a Share Class continued

Shareholder Information
Determining Your Share PriceBecause the current prospectus and SAI are available on First American Funds’ website free of charge, we do not disclose the following share classinformation separately on the website.
Class A Shares
Your purchase price for Class A shares is typically the net asset value of your shares, plus a front-end sales charge. Sales charges vary dependingon the amount of your purchase. The sales charge you pay may differ slightly from the amount set forth below because of rounding that occurs inthe calculation used to determine your sales charge.
Core Bond FundHigh Income Bond FundInflation Protected Securities FundTotal Return Bond Fund
Purchase AmountAs a % of
Offering PriceAs a % of Net
Amount Invested
Sales Charge
Less than $50,000 4.25% 4.44%$50,000 - $99,999 4.00% 4.17%$100,000 - $249,999 3.50% 3.63%$250,000 - $499,999 2.50% 2.56%$500,000 - $999,999 2.00% 2.04%$1 million and over 0.00% 0.00%
Intermediate Government Bond FundIntermediate Term Bond Fund
Purchase AmountAs a % of
Offering PriceAs a % of Net
Amount Invested
Sales Charge
Less than $50,000 2.25% 2.30%$50,000 - $99,999 2.00% 2.04%$100,000 - $249,999 1.75% 1.78%$250,000 - $499,999 1.25% 1.27%$500,000 - $999,999 1.00% 1.01%$1 million and over 0.00% 0.00%
Short Term Bond Fund
Purchase AmountAs a % of
Offering PriceAs a % of Net
Amount Invested
Sales Charge
Less than $50,000 2.25% 2.30%$50,000 — $99,999 2.00% 2.04%$100,000 — $249,999 1.25% 1.27%$250,000 and over 0.00% 0.00%
Reducing Your Sales Charge on Class A Shares. As shown in the preceding tables, larger purchases of Class A shares reduce thepercentage sales charge you pay. In determining whether you are entitled to pay a reduced sales charge, you may aggregate certain other purchaseswith your current purchase, as follows.
Prior Purchases. Prior purchases of Class A, Class B, and Class C shares of any First American fund (except a money market fund) will befactored into your sales charge calculation. You will receive credit for the current net asset value of the other Class A, Class B, and Class C sharesyou hold at the time of your purchase, including shares held in individual retirement, custodial or personal trust accounts. For example, let’s sayyou’re making a $10,000 investment and you already own other First American fund Class A shares that are currently valued at $45,000. You willreceive credit for the current value of these shares and your sales charge will be based on a total purchase amount of $55,000. If the current net
41 Prospectus – First American Income Funds
asset value of your shares is less than their original purchase price, you may receive credit for their original purchase price instead, but only if youprovide a written request to the funds and provide them with the records necessary to demonstrate the shares’ purchase price.
Purchases by Related Accounts. Concurrent and prior purchases by certain other accounts of Class A, Class B, and Class C shares of any FirstAmerican fund (except a money market fund) also will be combined with your purchase to determine your sales charge. The fund will combinepurchases made by you, your spouse or domestic partner, and your dependent children when it calculates the sales charge, including purchases inindividual retirement, custodial and personal trust accounts.
Letter of Intent. If you plan to make an aggregate investment of $50,000 or more over a 13-month period in Class A or Class C shares of one ormore First American funds, other than the money market funds, you may reduce your sales charge for Class A purchases by signing a non-bindingletter of intent. If you do not fulfill the letter of intent, you must pay the applicable sales charge. In addition, if you reduce your sales charge to zerounder a letter of intent and then sell your Class A shares within 18 months of their purchase, you may be charged a CDSC of up to 1% (up to0.60% for Short Term Bond Fund). See “Class A Share Investments of Over $1 Million” below.
It is your responsibility to determine whether you are entitled to pay a reduced sales charge. The fund is not responsible for making thisdetermination. To receive a reduced sales charge, you must notify the fund at the time of the purchase order that a quantity discount may apply toyour current purchase. If you purchase shares by mail, you must notify the fund in writing. Otherwise, simply inform your financial intermediary, orInvestor Services if you are purchasing shares directly from the funds, and they will notify the fund.
You should provide your financial intermediary with information or records regarding any other accounts in which there are holdings eligible to beaggregated, including:
• All of your accounts at your financial intermediary.• All of your accounts at any other financial intermediary.• All accounts of any related party (such as a spouse or dependent child) held with any financial intermediary.
You should keep the records necessary to demonstrate the purchase price of shares held in these accounts since neither the fund and its transferagent nor your financial intermediary may have this information.
More information on these ways to reduce your sales charge appears in the SAI.
Purchasing Class A Shares Without a Sales Charge. The following persons may purchase a fund’s Class A shares at net assetvalue without a sales charge:
• Directors, full-time employees and retirees of the advisor and its affiliates.• Current and retired officers and directors of the funds.• Full-time employees of any broker-dealer authorized to sell fund shares.• Full-time employees of the fund’s counsel.• Members of the immediate families of any of the foregoing (i.e., a spouse or domestic partner and any dependent children).• Persons who purchase the funds through “one-stop” mutual fund networks through which the funds are made available.• Persons participating in a fee-based program sponsored and maintained by a registered broker-dealer.• Trust companies and bank trust departments acting in a fiduciary, advisory, agency, custodial or similar capacity.• Group retirement and employee benefit plans.
In addition, persons who hold shares of a First American money market fund acquired pursuant to a prior arrangement under which the moneymarket fund had served as a cash investment option for another mutual fund family may exchange those shares (including shares representingreinvested dividends) for Class A shares at net asset value without a sales charge.
You must notify the funds or your financial intermediary if you are eligible to purchase Class A shares without a sales charge.
Reinvesting After a Redemption. If you redeem Class A shares of a First American fund (except money market fund shares on whichyou have not paid a sales charge), you may reinvest in Class A shares of that fund or another First American fund within 180 days without a salescharge. To reinvest in Class A shares at net asset value (without paying a sales charge), you must notify the fund directly in writing or notify yourfinancial intermediary.
Class A Share Investments of Over $1 Million. There is no initial sales charge on Class A share purchases of $250,000 or morefor Short Term Bond Fund and $1 million or more for each other fund (including purchases that reach such levels as a result of aggregating priorpurchases and purchases by related accounts). However, your financial intermediary may receive a commission of up to 1% (up to 0.60% for ShortTerm Bond Fund) on your purchase. If such a commission is paid, you will be assessed a CDSC of up to 1% (up to 0.60% for Short Term BondFund) if you sell your shares within 18 months. The CDSC you pay may differ slightly from this amount because of rounding that occurs in thecalculation used to determine your CDSC. To find out whether you will be assessed a CDSC, ask your financial intermediary.
42 Prospectus – First American Income Funds
Shareholder Information
Determining Your Share Price continued

The CDSC is based on the value of your shares at the time of purchase in the case of a partial redemption. If you redeem all of your shares, theCDSC is based on the value of your shares at the time of purchase or at the time of redemption, whichever is less. The charge does not apply toshares you acquired by reinvesting your dividend or capital gain distributions. To help lower your costs, Class A shares that are not subject to aCDSC will be redeemed first. The CDSC will be waived in the circumstances described below under “Waiving Contingent Deferred Sales Charges.”
Class B Shares
No new or additional investments are allowed in Class B shares of the First American funds, except in connection with permitted exchanges or thereinvestment of dividends or capital gains distributions on Class B shares. See “Choosing a Share Class” above.
Class B shares could previously be purchased at their net asset value — there was no front-end sales charge. However, if you redeem your shareswithin six years of purchase, you will pay a CDSC, as reflected in the following table.
Year Since PurchaseCDSC as a % of theValue of Your Shares
First 5.00%Second 5.00%Third 4.00%Fourth 3.00%Fifth 2.00%Sixth 1.00%Seventh 0.00%Eighth 0.00%
The CDSC you pay may differ slightly from the amount set forth above because of rounding that occurs in the calculation used to determine yourCDSC.
Your CDSC will be based on the value of your shares at the time of purchase or at the time of redemption, whichever is less. The charge does notapply to shares you acquired by reinvesting your dividend or capital gain distributions. To help lower your costs, Class B shares that are not subjectto a CDSC will be redeemed first; other Class B shares will then be redeemed in an order that minimizes your CDSC. The CDSC will be waived in thecircumstances described below under “Waiving Contingent Deferred Sales Charges.”
Your Class B shares and any related shares acquired by reinvesting your dividend or capital gain distributions will automatically convert to Class Ashares eight years after the beginning of the month in which you purchased the shares.
Class C Shares
Your purchase price for Class C shares is their net asset value — there is no front-end sales charge. However, if you redeem your shares within12 months of purchase, you will be assessed a CDSC of 1% of the value of your shares at the time of purchase or at the time of sale, whichever isless. The CDSC you pay may differ slightly from this amount because of rounding that occurs in the calculation used to determine your CDSC. TheCDSC does not apply to shares you acquired by reinvesting your dividend or capital gain distributions. To help lower your costs, Class C shares thatare not subject to a CDSC will be redeemed first. The CDSC will be waived in the circumstances described below under “Waiving ContingentDeferred Sales Charges.”
Unlike Class B shares, Class C shares do not convert to Class A shares after a specified period of time. Therefore, your shares will continue to havehigher annual expenses than Class A shares.
Retirement Plan Availability of Class C Shares. Class C shares are available to individual plans and certain smaller group plans,such as SIMPLE, SEP, and Solo 401(k) plans. Class C shares are not available to certain employer-sponsored plans, such as 401(k), employer-sponsored 403(b), money purchase and profit sharing plans, except for those plans invested in Class C shares of the First American funds prior toJuly 20, 2007.
Waiving Contingent Deferred Sales Charges
CDSCs on Class A, Class B, and Class C share redemptions will be waived for:
• Redemptions following the death or disability (as defined in the Internal Revenue Code) of a shareholder.• Redemptions that equal the minimum required distribution from an IRA or other retirement plan to a shareholder who has reached the age of 701⁄2.
43 Prospectus – First American Income Funds
Shareholder Information
Determining Your Share Price continued

• Redemptions through a systematic withdrawal plan, at a rate of up to 12% a year of your account’s value. The systematic withdrawal limit will bebased on the market value of your account at the time of each withdrawal.
• Redemptions required as a result of over-contribution to an IRA plan.
Class R and Class Y Shares
Your purchase price for Class R and Class Y shares is their net asset value. These share classes do not have a front-end sales charge or a CDSC.
Purchasing Fund SharesTo help the government fight the funding of terrorism and money laundering activities, Federal law requires all financial institutions to obtain, verify,and record information that identifies each person who opens an account. As a result, when you open an account, we will ask for your name,permanent street address, date of birth, and social security or taxpayer identification number. Addresses containing a P.O. Box only will not beaccepted. We may also ask for other identifying documents or information.
Purchasing Class A and Class C Shares
You can become a shareholder in any of the funds by making a minimum initial investment of $2,500. The minimum additional investment is $100.
The funds reserve the right to waive or lower purchase minimums under certain circumstances and to reject any purchase order.
By Phone. You can purchase shares by calling your financial intermediary, if it has a sales agreement with the funds’ distributor. Once theinitial minimum investment has been made, you can also place purchase orders in amounts equal to or greater than the minimum additionalinvestment amount by calling Investor Services at 800 677-3863. Funds will be transferred electronically from your bank account through theAutomated Clearing House (ACH) network. Before making a purchase by electronic funds transfer, you must submit a new account form to thefunds and elect this option. Be sure to include all of your banking information on the form.
By Wire. You can purchase shares by making a wire transfer from your bank. Before making an initial investment by wire, you must submit anew account form to the funds. After receiving your form, a service representative will contact you with your account number and wiringinstructions. Your order will be priced at the next NAV, or public offering price as applicable based on your share class, calculated after the funds’custodian receives your payment by wire. Before making any additional purchases by wire, you should call Investor Services at 800 677-3863. Youcannot purchase shares by wire on days when federally chartered banks are closed.
By Mail. To purchase shares by mail, simply complete and sign a new account form, enclose a check made payable to the fund you wish toinvest in, and mail both to:
Regular U.S. Mail: Overnight Express Mail:
First American Funds First American FundsP.O. Box 3011 615 East Michigan StreetMilwaukee, WI 53201-3011 Milwaukee, WI 53202
After you have established an account, you may continue to purchase shares by mailing your check to First American Funds at the same address.
Please note the following:
• All purchases must be drawn on a bank located within the United States and payable in U.S. dollars to First American Funds.• Cash, money orders, cashier’s checks in amounts less than $10,000, third-party checks, Treasury checks, credit card checks, traveler’s checks,
starter checks, and credit cards will not be accepted. We are unable to accept post dated checks, post dated on-line bill pay checks, or anyconditional order or payment.
• If a check or ACH transaction does not clear your bank, the funds reserve the right to cancel the purchase, and you may be charged a fee of $25per check or transaction. You could be liable for any losses or fees incurred by the fund as a result of your check or ACH transaction failing toclear.
By Systematic Investment Plan. After you have established an account, you may add to your investment on a regular basis:
• by having $100 or more automatically withdrawn from your bank account on a periodic basis and invested in additional shares of the fund, or• through automatic monthly exchanges into the fund from another First American fund of the same class.
You may apply for participation in either of these programs through your financial intermediary or by calling Investor Services at 800 677-3863.
44 Prospectus – First American Income Funds
Shareholder Information
Determining Your Share Price continued

Purchasing Class R Shares
Eligible retirement plans generally may open an account and purchase Class R shares by contacting any financial intermediary or plan administratorauthorized to sell the funds’ shares. Participants in retirement plans generally must contact the plan’s administrator to purchase shares.
Share purchases by eligible retirement plans are generally made by wire transfer. You cannot purchase shares by wire on days when federallychartered banks are closed.
Purchase orders from a retirement plan or participant in the plan must be received by the financial intermediary or plan administrator by the timespecified by that institution to be assured same day processing. In order for shares to be purchased at that day’s price, the funds must receive thepurchase order from the financial intermediary or plan administrator by 3:00 p.m. Central time. It is the responsibility of the financial intermediaryor plan administrator to promptly transmit orders to the funds.
Purchasing Class Y Shares
You may purchase Class Y shares by calling your financial intermediary. When purchasing shares, payment must generally be made by wiretransfer, which can be arranged by your financial intermediary. You cannot purchase shares by wire on days when federally chartered banks areclosed. The funds reserve the right to impose minimum investment amounts on clients of financial intermediaries that charge the funds or theadvisor transaction or recordkeeping fees.
By Systematic Investment Plan. You may add to your investment on a regular, automatic basis through a systematic investment plan.You may apply for participation in this program through your financial intermediary.
Redeeming Fund SharesRedeeming Class A, Class B, and Class C Shares
When you redeem shares, the proceeds are normally sent on the next business day, but in no event more than seven days, after your request isreceived in proper form.
By Phone. If you purchased shares through a financial intermediary, simply call them to redeem your shares.
If you did not purchase shares through a financial intermediary, you may redeem your shares by calling Investor Services at 800 677-3863.Proceeds can be wired to your bank account (if you have previously supplied your bank account information to the fund) or sent to you by check.The funds charge a $15 fee for wire redemptions, but have the right to waive this fee for shares redeemed through certain financial intermediariesand by certain accounts. Proceeds also can be sent directly to your bank or brokerage account via electronic funds transfer if your bank orbrokerage firm is a member of the ACH network. Credit is usually available within two to three business days. The First American funds reserve theright to limit telephone redemptions to $50,000 per account per day.
If you recently purchased your shares by check or through the ACH network, proceeds from the sale of those shares may not be available until yourcheck or ACH payment has cleared, which may take up to 15 calendar days from the date of purchase.
By Mail. To redeem shares by mail, send a written request to your financial intermediary, or to the fund at the following address:
Regular U.S. Mail: Overnight Express Mail:
First American Funds First American FundsP.O. Box 3011 615 East Michigan StreetMilwaukee, WI 53201-3011 Milwaukee, WI 53202
Your request should include the following information:
• name of the fund• account number• dollar amount or number of shares redeemed• name on the account• signatures of all registered account owners
After you have established your account, signatures on a written request must be guaranteed if:
• you would like redemption proceeds to be paid to any person, address, or bank account other than that on record.
45 Prospectus – First American Income Funds
Shareholder Information
Purchasing Fund Shares continued

• you would like the redemption check mailed to an address other than the address on the fund’s records, or you have changed the address on thefund’s records within the last 30 days.
• your redemption request is in excess of $50,000.• bank information related to an automatic investment plan, telephone purchase or telephone redemption has changed.
In addition to the situations described above, the funds reserve the right to require a signature guarantee, or another acceptable form of signatureverification, in other instances based on the circumstances of a particular situation.
A signature guarantee assures that a signature is genuine and protects shareholders from unauthorized account transfers. Banks, savings and loanassociations, trust companies, credit unions, broker-dealers, and member firms of a national securities exchange may guarantee signatures. Callyour financial intermediary to determine if it has this capability. A notary public is not an acceptable signature guarantor.
Proceeds from a written redemption request will be sent to you by check unless another form of payment is requested.
By Wire. You can call or write to have redemption proceeds sent to a bank account. See the policies for redeeming shares by phone or bymail. Before requesting to have redemption proceeds sent to a bank account, please make sure the funds have your bank account information onfile. If the funds do not have this information, you will need to send written instructions with your bank’s name and a voided check or pre-printedsavings account deposit slip. You must provide written instructions signed by all fund and bank account owners, and each individual must havetheir signature guaranteed.
By Systematic Withdrawal Plan. If your account has a value of $5,000 or more, you may redeem a specific dollar amount from youraccount on a regular basis. You may set up a systematic withdrawal when you complete a new account form or by calling your financialintermediary. You should not make systematic withdrawals if you plan to continue investing in a fund, due to sales charges and tax liabilities.
Redeeming Class R Shares
Participants in retirement plans generally must contact the plan’s administrator to redeem Class R shares. Redemption requests from a retirementplan or participant in the plan must be received by the financial intermediary or plan administrator by the time specified by that institution to beassured same day processing. In order for shares to be sold at that day’s price, the funds must receive the redemption request from the financialintermediary or plan administrator by 3:00 p.m. Central time. It is the responsibility of the financial intermediary or plan administrator to promptlytransmit orders to the funds.
If the funds receive a redemption request by 3:00 p.m. Central time, payment of the redemption proceeds will ordinarily be made by wire on thenext business day. It is possible, however, that payment could be delayed by up to seven days.
Redeeming Class Y Shares
You may redeem Class Y shares by calling your financial intermediary. If the fund or an authorized financial intermediary receives your redemptionrequest by 3:00 p.m. Central time, payment of your redemption proceeds will ordinarily be made by wire on the next business day. It is possible,however, that payment could be delayed by up to seven days.
By Systematic Withdrawal Plan. You may redeem a specific dollar amount from your account, on a regular, automatic basis through asystematic withdrawal plan. You may apply for participation in this program through your financial intermediary. You should not make systematicwithdrawals if you plan to continue investing in a fund, due to sales charges and tax liabilities.
Exchanging Fund SharesExchanging Class A, Class B, and Class C Shares
If your investment goals or your financial needs change, you may move from one First American fund to another First American fund. There is nofee to exchange shares. If you want to exchange into a fund you do not currently own, your initial purchase of the fund’s shares, whether byexchange or otherwise, must satisfy the fund’s minimum initial investment requirement.
Generally, you may exchange your shares only for the same class of shares of the other fund, with certain exceptions, including:
• You may exchange your Class A shares for Class Y shares of the same or another First American fund if you subsequently become eligible topurchase Class Y shares.
• If you are no longer eligible to hold Class Y shares, you may exchange your shares for Class A shares at net asset value. Class A shares havehigher expenses than Class Y shares.
46 Prospectus – First American Income Funds
Shareholder Information
Redeeming Fund Shares continued

Exchanges are made based on the net asset value per share of each fund at the time of the exchange. When you exchange your Class A shares ofone of the funds for Class A shares of another First American fund, you do not have to pay a sales charge. When you exchange your Class B orClass C shares for Class B or Class C shares of another First American fund, the time you held the shares of the “old” fund will be added to thetime you hold the shares of the “new” fund for purposes of determining your CDSC or, in the case of Class B shares, calculating when your sharesconvert to Class A shares.
Before exchanging into any fund, be sure to read its prospectus carefully. A fund may change or cancel its exchange policies at any time uponnotice to shareholders, which may be given by means of a new or supplemented prospectus. The funds have the right to limit exchanges that aredeemed to constitute short-term trading. See “Additional Information on Purchasing, Redeeming, and Exchanging Fund Shares — Short-TermTrading of Fund Shares” below.
By Phone. If both funds have identical shareholder registrations, you may exchange shares by calling your financial intermediary or by callingthe funds directly at 800 677-3863.
By Mail. To exchange shares by written request, please follow the procedures under “Redeeming Class A, Class B, and Class C Shares” above.Be sure to include the names of both funds involved in the exchange.
By Systematic Exchange Plan. You may add to your investment on a regular basis through automatic monthly exchanges of one FirstAmerican fund into another First American fund of the same class. You may apply for participation in this program through your financialintermediary or by calling Investor Services at 800 677-3863.
Exchanging Class R Shares
If you are a plan participant and your investment goals or your financial needs change, you may exchange your Class R shares for Class R sharesof another First American fund offered through your retirement plan. Exchanges are made at the net asset value per share of each fund at the timeof the exchange. There is no fee to exchange shares.
To exchange your shares, call your financial intermediary or plan administrator. In order for your shares to be exchanged the same day, you mustcall your financial intermediary or plan administrator by the time specified by that institution and your exchange order must be received by thefunds by 3:00 p.m. Central time. It is the responsibility of your financial intermediary or plan administrator to promptly transmit your exchangeorder to the funds.
Before exchanging into any fund, be sure to read its prospectus carefully. A fund may change or cancel its exchange policies, or the funds offeredthrough your retirement plan may change, at any time. You will be notified of any changes. The funds have the right to limit exchanges that aredeemed to constitute short-term trading. See “Additional Information on Purchasing, Redeeming, and Exchanging Fund Shares — Short-TermTrading of Fund Shares” below.
Exchanging Class Y Shares
If your investment goals or your financial needs change, you may exchange your shares for Class Y shares of another First American fund.Exchanges are made at the net asset value per share of each fund at the time of the exchange. There is no fee to exchange shares. If you are nolonger eligible to purchase Class Y shares, you may exchange your shares for Class A shares at net asset value. Class A shares have higherexpenses than Class Y shares.
To exchange your shares, call your financial intermediary. Before exchanging into any fund, be sure to read its prospectus carefully. A fund maychange or cancel its exchange policies at any time. You will be notified of any changes. The funds have the right to limit exchanges that are deemedto constitute short-term trading. See “Additional Information on Purchasing, Redeeming, and Exchanging Fund Shares — Short-Term Trading ofFund Shares” below.
By Systematic Exchange Plan. You may move from one First American fund to another First American fund of the same class on aregular basis through automatic monthly exchanges. You may apply for participation in this program through your financial intermediary.
47 Prospectus – First American Income Funds
Shareholder Information
Exchanging Fund Shares continued
Shareholder Information
Additional Information on Purchasing, Redeeming, and ExchangingFund SharesCalculating Net Asset Value
The funds generally calculate their NAVs as of 3:00 p.m. Central time every day the New York Stock Exchange is open. The funds do not calculatetheir NAVs on national holidays, or any other days, on which the NYSE is closed for trading.
A fund’s NAV is equal to the market value of its investments and other assets, less any liabilities, divided by the number of fund shares.
Investments and other assets will be valued at their market values. For securities traded on an exchange, we receive the price as reported by theexchange from one or more independent pricing services that have been approved by the funds’ board of directors. These independent pricingservices also provide security valuations for certain other investments not traded on an exchange. If market prices are not readily available for aninvestment or if the advisor believes they are unreliable, fair value prices may be determined in good faith using procedures approved by the funds’board of directors. Under these procedures, fair values are generally determined by a pricing committee appointed by the board of directors. Thetypes of securities for which such fair value pricing might be required include, but are not limited to:
• Securities, including securities traded in foreign markets, where an event occurs after the close of the market in which such security principallytrades, but before NAV is determined, that will affect the value of such security, or the closing value is otherwise deemed unreliable;
• Securities whose trading has been halted or suspended;• Fixed-income securities that have gone into default and for which there is no current market value quotation; and• Securities with limited liquidity, including certain high-yield securities or securities that are restricted as to transfer or resale.
Valuing securities at fair value involves greater reliance on judgment than valuing securities that have readily available market quotations. Fair valuedeterminations can also involve reliance on quantitative models employed by a fair value pricing service. There can be no assurance that a fundcould obtain the fair value assigned to a security if it were to sell the security at approximately the time at which the fund determines its NAV pershare.
Short-Term Trading of Fund Shares
The funds discourage purchases and redemptions of their shares in response to short-term fluctuations in the securities markets. The funds’ boardof directors has adopted policies and procedures designed to detect and deter short-term trading in the funds’ shares that may disadvantage long-term fund shareholders. These policies are described below. The funds will not knowingly accommodate trading in the funds’ shares in violation ofthese policies.
Risks Associated with Short-Term Trading. Short-term trading in a fund’s shares, particularly in larger amounts, may be detrimentalto long-term shareholders of the fund. Depending on various factors, including the size of a fund, the amount of assets the fund typically maintainsin cash or cash equivalents, the dollar amount and number and frequency of trades, and the types of securities in which the fund typically invests,short-term trading may interfere with the efficient management of the fund’s portfolio, increase the fund’s transaction costs, administrative costsand taxes, and/or impact the fund’s performance.
In addition, the nature of a fund’s portfolio holdings may allow a shareholder engaging in a short-term trading strategy to take advantage of possibledelays between the change in the value of a fund’s portfolio holdings and the reflection of that change in the net asset value of the fund’s shares.Such a delay may occur in funds that have significant investments in foreign securities, where the value of those securities is established some timebefore the fund calculates its own share price, or in funds that hold significant investments in small-cap securities, high-yield (junk) bonds andother types of investments that may not be frequently traded. This type of short-term trading is sometimes referred to as “arbitrage market timing,”and there is the possibility that such trading may dilute the value of fund shares if redeeming shareholders receive proceeds (and buyingshareholders receive shares) based upon net asset values which do not reflect appropriate fair value prices.
Short-Term Trading Policies. The funds’ advisor monitors trading in fund shares in an effort to identify short-term trading activity thatmay disadvantage long-term shareholders. Only transactions that exceed a certain dollar threshold that has been determined to be potentiallydisruptive to the management of a fund are subject to monitoring. It is the policy of the funds to permit no more than one round trip by an investorduring any 90-calendar-day period. A round trip is defined as a purchase into or redemption out of a fund (including purchases or redemptionsaccomplished by an exchange) paired with an opposite direction redemption out of or purchase into the same fund within 10 calendar days, in adollar amount that exceeds the monitoring threshold. If the advisor determines that a shareholder has made more than one round trip during any90-calendar-day period, the shareholder conducting such trading will, in less serious instances, be given an initial warning to discontinue suchtrading. In more serious instances (generally involving larger dollar amounts), or in the case of a second violation after an initial warning has beengiven, the shareholder may be temporarily or permanently barred from making future purchases into one or all of the funds or, alternatively, thefunds may limit the amount, number or frequency of any future purchases and/or the method by which the shareholder may request futurepurchases (including purchases by an exchange or transfer between a fund and any other fund). In addition to the foregoing sanctions, the fundsreserve the right to reject any purchase order at any time and for any reason, without prior written notice. The funds also reserve the right to
48 Prospectus – First American Income Funds

revoke the exchange privileges of any person at any time and for any reason. In making determinations concerning the rejection of purchase ordersand the revocation of exchange privileges, and in considering which sanctions to impose, the funds may consider an investor’s trading history inany of the First American funds, in non-First American mutual funds, or in accounts under a person’s common ownership or control.
Certain transactions are not subject to the funds’ short-term trading policies. These include transactions such as systematic redemptions andpurchases; retirement plan contributions, loans and distributions (including hardship withdrawals); purchase transactions involving transfers ofassets, rollovers, Roth IRA conversions and IRA re-characterizations; regular portfolio rebalancings in fee-based programs of registered investmentadvisors, financial planners and registered broker-dealers; and similar transactions.
Fund shares are frequently held through omnibus account arrangements, whereby a broker-dealer, investment advisor, retirement plan sponsor orother financial intermediary maintains an omnibus account with a fund for trading on behalf of its customers. The funds generally seek to applytheir short-term trading policies and procedures to these omnibus account arrangements, and monitor trading activity at the omnibus account levelto attempt to identify disruptive trades. Under agreements that the funds (or the funds’ distributor) have entered into with intermediaries, the fundsmay request transaction information from intermediaries at any time in order to determine whether there has been short-term trading by theintermediaries’ customers. The funds will request that the intermediary provide individual account level detail (or participant level detail in the caseof retirement plans) to the funds if more than one round trip in any 90 day period is detected at the omnibus or plan level and such round tripsappear to be (a) attributable to an individual shareholder or plan participant and (b) potentially detrimental to the respective fund and itsshareholders based on such factors as the time between transactions, the size of the transactions and the type of fund involved. If short-termtrading is detected at the individual account or participant level, the funds will request that the intermediary take appropriate action to curtail theactivity. If the intermediary does not take action, the funds will take such steps as are reasonably practicable to curtail the excessive trading,including terminating the relationship with the intermediary if necessary. An intermediary may apply its own short-term trading policies andprocedures, which may be more or less restrictive than the funds’ policies and procedures. If you purchase or sell fund shares through anintermediary, you should contact them to determine whether they impose different requirements or restrictions.
Telephone Transactions
The funds and their agents will not be responsible for any losses that may result from acting on wire or telephone instructions that they reasonablybelieve to be genuine. The funds and their agents will each follow reasonable procedures to confirm that instructions received by telephone aregenuine, which may include recording telephone conversations.
Once a telephone transaction has been placed, it generally cannot be canceled or modified.
It may be difficult to reach the funds by telephone during periods of unusual market activity. If you are unable to reach the funds or their agents bytelephone, please consider sending written instructions.
Accounts with Low Balances
Each fund reserves the right to liquidate or assess a low balance account fee to any account holding a balance that is less than the account balanceminimum of $1,000 for any reason, including market fluctuation.
If a fund elects to liquidate or assess a low balance account fee, then annually, on or about the second Wednesday of August, the fund will assess a$15 low balance account fee to certain retirement accounts, education savings plans, and UGMA/UTMA accounts that have balances under theaccount balance minimum. At the same time, other accounts with balances under the account balance minimum will be liquidated, with proceedsbeing mailed to the address of record. Prior to the assessment of any low balance account fee or liquidation of low balance accounts, affectedshareholders will receive a communication reminding them of the pending action, thereby providing time to ensure that balances are at or above theaccount balance minimum prior to any fee assessment or account liquidation.
An intermediary may apply its own procedures in attempting to comply with the funds’ low balance account policy.
Redemption in Kind
Generally, proceeds from redemption requests will be paid in cash. However, to minimize the effect of large redemption requests on a fund and itsremaining shareholders, if you redeem more than $250,000 of a fund’s assets within a 30-day period, each fund reserves the right to pay part or allof the proceeds from a redemption request in a proportionate share of securities from the fund’s portfolio instead of cash. The advisor will valuethese securities in accordance with the pricing methods employed to calculate the fund’s net asset value per share. If you receive redemptionproceeds in kind, you should expect to incur transaction costs upon disposition of the securities received in the redemption. In addition, you willbear the market risk associated with these securities until their disposition.
49 Prospectus – First American Income Funds
Shareholder Information
Additional Information on Purchasing, Redeeming and ExchangingFund Shares continued
Shareholder Information
Dividends and DistributionsDividends from a fund’s net investment income are declared daily and paid monthly. Any capital gains are distributed at least once each year.Generally, you will begin to earn dividends on the next business day after the fund receives your payment and will continue to earn dividendsthrough the business day immediately preceding the day the fund pays your redemption proceeds.
Dividend and capital gain distributions will be reinvested in additional shares of the fund paying the distribution, unless you request thatdistributions be reinvested in another First American fund or paid in cash. This request may be made on your new account form, by contacting yourfinancial intermediary, or by calling Investor Services at 800 677-3863. If you request that your distributions be paid in cash but those distributionscannot be delivered because of an incorrect mailing address, or if a distribution check remains uncashed for six months, the undelivered oruncashed distributions and all future distributions will be reinvested in fund shares at the current NAV.
TaxesSome of the tax consequences of investing in the funds are discussed below. More information about taxes is in the SAI. However, becauseeveryone’s tax situation is unique, always consult your tax professional about federal, state, and local tax consequences.
Taxes on Distributions
Each fund pays its shareholders dividends from its net investment income and any net capital gains that it has realized. For most investors, funddividends and distributions are considered taxable whether they are reinvested or taken in cash (unless your investment is in an IRA or other tax-advantaged account).
Dividends from a fund’s net investment income and short-term capital gains are taxable as ordinary income. Distributions of a fund’s long-termcapital gains are taxable as long-term gains, regardless of how long you have held your shares. The funds expect that, as a result of theirinvestment objectives and strategies, their distributions will consist primarily of ordinary income and that the distributions will not be treated as“qualified dividends” that are taxed at the same rates as long-term capital gains. Unless applicable tax provisions are extended, the current 15%maximum tax rate applicable to capital gains and the favorable treatment of “qualified dividend” income are scheduled to expire after 2010.
Taxes on Transactions
The sale of fund shares, or the exchange of one fund’s shares for shares of another fund, will be a taxable event and may result in a capital gain orloss. The gain or loss will be considered long-term if you have held your shares for more than one year. A gain or loss on shares held for one yearor less is considered short-term and is taxed at the same rates as ordinary income. Unless applicable tax provisions are extended, the current 15%maximum tax rate applicable to capital gains is scheduled to expire after 2010.
If, in redemption of his or her shares, a shareholder receives a distribution of securities instead of cash, the shareholder will be treated as receivingan amount equal to the fair market value of the securities at the time of the distribution for purposes of determining capital gain or loss on theredemption, and will also acquire a basis in the shares for federal income tax purposes equal to their fair market value.
The exchange of one class of shares for another class of shares in the same fund will not be taxable.
Considerations for Retirement Plan Clients
A plan participant whose retirement plan invests in a fund generally is not taxed on fund dividends or distributions received by the plan or on salesor exchanges of fund shares by the plan for federal income tax purposes. However, distributions to plan participants from a retirement plangenerally are taxable to plan participants as ordinary income. You should consult your tax professional about federal, state and local taxconsiderations.
More information about tax considerations that may affect the funds and their shareholders appears in the funds’ SAI.
Compensation Paid to Financial IntermediariesThe funds’ distributor receives any front-end sales charge or CDSC that you pay and any 12b-1 fees paid by the funds. From this revenue, thedistributor will pay financial intermediaries for the services they provide. The funds’ advisor and/or distributor may make additional payments tointermediaries from their own assets, as described below under “Additional Payments to Financial Intermediaries.”
50 Prospectus – First American Income Funds

Sales Charge Reallowance
The distributor pays (or “reallows”) a portion of the front-end sales charge on Class A shares to your financial intermediary, as follows:
Core Bond FundHigh Income Bond FundInflation Protected Securities FundTotal Return Bond Fund
Purchase AmountMaximum Reallowance
as a % of Purchase Price
Less than $50,000 4.00%$50,000 - $99,999 3.75%$100,000 - $249,999 3.25%$250,000 - $499,999 2.25%$500,000 - $999,999 1.75%$1 million and over 0.00%
Intermediate Government Bond FundIntermediate Term Bond Fund
Purchase AmountMaximum Reallowance
as a % of Purchase Price
Less than $50,000 2.00%$50,000 - $99,999 1.75%$100,000 - $249,999 1.50%$250,000 - $499,999 1.00%$500,000 - $999,999 0.75%$1 million and over 0.00%
Short Term Bond Fund
Purchase AmountMaximum Reallowance
as a % of Purchase Price
Less than $50,000 2.00%$50,000 - $99,999 1.75%$100,000 - $249,999 1.00%$250,000 and over 0.00%
Sales Commissions
There is no initial sales charge on Class A share purchases of $250,000 or more for Short Term Bond Fund and $1 million or more for each otherfund. However, your financial intermediary may receive a commission of up to 1% (up to 0.60% for Short Term Bond Fund) on your purchase.Although you pay no front-end sales charge when you buy Class C shares, the funds’ distributor pays a sales commission of 1% of the amountinvested to intermediaries selling Class C shares.
12b-1 Fees
The funds’ distributor uses the 12b-1 shareholder servicing fee to compensate financial intermediaries for administrative services performed onbehalf of the intermediaries’ customers. These intermediaries receive shareholder servicing fees of up to 0.25% (0.15% for Class A shares ofIntermediate Government Bond Fund, Intermediate Term Bond Fund, and Short Term Bond Fund) of a fund’s Class A, Class B, Class C, and Class Rshare average daily net assets attributable to shares sold through them. For Class A and Class R shares, the distributor begins to pay shareholder
51 Prospectus – First American Income Funds
Shareholder Information
Compensation Paid to Financial Intermediaries continued

servicing fees to these intermediaries immediately after you purchase shares. For Class B and Class C shares, the distributor begins to payshareholder servicing fees to these intermediaries one year after you purchase shares, but only if you continue to hold the shares at that time.
The funds’ distributor uses the 12b-1 distribution fee to compensate financial intermediaries for the sale of fund shares to their customers. Thefunds’ distributor pays intermediaries that sell Class C shares a 0.75% annual distribution fee beginning one year after the shares are sold. Thefunds’ distributor pays intermediaries that sell Class R shares a 0.25% annual distribution fee beginning immediately after you purchase shares. Thefunds’ distributor retains the Class B share 0.75% annual distribution fee in order to finance the payment of sales commissions to intermediariesthat sold Class B shares.
In all cases, intermediaries continue to receive 12b-1 fees for as long as you hold fund shares.
Additional Payments to Financial Intermediaries
The advisor and/or the distributor may pay additional compensation to financial intermediaries out of their own resources to selected intermediariesfor the purposes of promoting the sale of fund shares, maintaining share balances and/or for sub-accounting, administrative or shareholderprocessing services. The amounts of these payments could be significant, and may create an incentive for the intermediary or its representatives torecommend or offer shares of the funds to you. The intermediary may elevate the prominence or profile of the funds within the intermediary’sorganization by, for example, placement on a list of preferred or recommended funds, and/or granting the advisor and/or the distributor preferentialor enhanced opportunities to promote the funds in various ways within the intermediary’s organization. These payments are not reflected in the feesand expenses listed in the “Fund Summaries” section of the prospectus because they are not paid by the funds.
These payments are negotiated and may be based on such factors as the number or value of First American fund shares that the intermediary sellsor may sell; the value of the assets invested in the First American funds by the intermediary’s customers; the type and nature of services or supportfurnished by the intermediary; and/or other measures as determined from time to time by the advisor and/or distributor. Such payments aregenerally asset based but also may include the payment of a lump sum for services provided. In addition, the advisor and/or the distributor maymake payments to reimburse selected intermediaries for items such as ticket charges (i.e., fees that an intermediary charges its representatives foreffecting transactions in fund shares), operational charges, literature printing and/or distribution costs, and networking fees.
The advisor and/or distributor may make other payments or allow other promotional incentives to financial intermediaries to the extent permitted bySEC and FINRA rules and by other applicable laws and regulations.
You can ask your financial intermediary for information about any payments it receives from the advisor and/or the distributor and from the funds,and any services your intermediary provides, as well as about fees and/or commissions your intermediary charges. You can also find more detailsabout payments made by the advisor, and/or the distributor in the funds’ SAI.
Staying InformedShareholder ReportsShareholder reports are mailed twice a year. They include financial statements and performance information, and, on an annual basis, a messagefrom your portfolio managers and the report of independent registered public accounting firm. In an attempt to reduce shareholder costs and helpeliminate duplication, the funds will try to limit their mailings to one report for each address that lists one or more shareholders with the same lastname. If you would like additional copies, please call Investor Services at 800 677-3863.
Statements and ConfirmationsStatements summarizing activity in your account are mailed quarterly. Confirmations generally are mailed following each purchase or sale of fundshares, but some transactions, such as systematic purchases and dividend reinvestments, are reported on your account statement. Generally, thefunds do not send statements for shares held in a brokerage account or to individuals who have their shares held in an omnibus account, such asretirement plan participants. Please review your statements and confirmations as soon as you receive them and promptly report any discrepanciesto your financial intermediary or to Investor Services at 800 677-3863.
52 Prospectus – First American Income Funds
Shareholder Information
Compensation Paid to Financial Intermediaries continued

Financial HighlightsThe tables that follow present performance information about the share classes of each fund offered during the most recently completed fiscal year.This information is intended to help you understand each fund’s financial performance for the past five years or, if shorter, the period of operationsfor the fund or class of shares. Some of this information reflects financial results for a single fund share held throughout the period. Total returns inthe tables represent the rate that you would have earned or lost on an investment in the fund, assuming you reinvested all of your dividends anddistributions.
The information below has been derived from the financial statements audited by Ernst & Young LLP, an independent registered public accountingfirm, whose report, along with the funds’ financial statements, is included in the funds’ annual report, which is available upon request.
Core Bond Fund
Class A Shares 20101 20091 20081 20071
Fiscal periodended
June 30,20061,2 20051
Fiscal year ended June 30,
Fiscal yearended
September 30,
Per Share DataNet Asset Value, Beginning of Period $ 10.04 $ 10.86 $ 10.79 $ 10.71 $ 11.15 $ 11.27
Investment Operations:Net Investment Income 0.51 0.61 0.51 0.47 0.33 0.40Realized and Unrealized Gains (Losses) on Investments 1.18 (0.81) 0.05 0.09 (0.37) (0.09)Total From Investment Operations 1.69 (0.20) 0.56 0.56 (0.04) 0.31
Less Distributions:Dividends (from net investment income) (0.51) (0.62) (0.49) (0.48) (0.33) (0.42)Distributions (from net realized gains) — — — — (0.07) (0.01)Total Distributions (0.51) (0.62) (0.49) (0.48) (0.40) (0.43)
Net Asset Value, End of Period $ 11.22 $ 10.04 $ 10.86 $ 10.79 $ 10.71 $ 11.15
Total Return3 17.11% (1.37)% 5.24% 5.26% (0.34)% 2.75%
Ratios/Supplemental DataNet Assets, End of Period (000) $93,374 $82,373 $94,571 $102,723 $134,845 $161,410Ratio of Expenses to Average Net Assets 0.95% 0.95% 0.95% 0.95% 0.95% 0.95%Ratio of Net Investment Income to Average Net Assets 4.65% 6.34% 4.63% 4.25% 3.98% 3.51%Ratio of Expenses to Average Net Assets (excluding
waivers) 1.02% 1.02% 1.01% 1.01% 1.03% 1.05%Ratio of Net Investment Income to Average Net Assets
(excluding waivers) 4.58% 6.27% 4.57% 4.19% 3.90% 3.41%Portfolio Turnover Rate 83% 160% 131% 137% 139% 208%1 Per share data calculated using average shares outstanding method.2 For the nine-month period October 1, 2005 to June 30, 2006. Effective in 2006, the fund’s fiscal year end was changed from September 30 to June 30. All ratios for
the period have been annualized, except total return and portfolio turnover.3 Total return does not reflect sales charges. Total return would have been lower had certain expenses not been waived.
53 Prospectus – First American Income Funds

Class B Shares 20101 20091 20081 20071
Fiscal periodended
June 30,20061,2 20051
Fiscal year ended June 30,
Fiscal yearended
September 30,
Per Share DataNet Asset Value, Beginning of Period $ 9.95 $10.77 $10.70 $10.63 $ 11.07 $ 11.19Investment Operations:
Net Investment Income 0.43 0.54 0.42 0.38 0.26 0.31Realized and Unrealized Gains (Losses) on Investments 1.17 (0.81) 0.06 0.09 (0.36) (0.09)Total From Investment Operations 1.60 (0.27) 0.48 0.47 (0.10) 0.22
Less Distributions:Dividends (from net investment income) (0.43) (0.55) (0.41) (0.40) (0.27) (0.33)Distributions (from net realized gains) — — — — (0.07) (0.01)Total Distributions (0.43) (0.55) (0.41) (0.40) (0.34) (0.34)
Net Asset Value, End of Period $11.12 $ 9.95 $10.77 $10.70 $ 10.63 $ 11.07
Total Return3 16.31% (2.12)% 4.50% 4.41% (0.91)% 2.00%
Ratios/Supplemental DataNet Assets, End of Period (000) $3,607 $5,780 $7,733 $9,634 $13,819 $17,078Ratio of Expenses to Average Net Assets 1.70% 1.70% 1.70% 1.70% 1.70% 1.70%Ratio of Net Investment Income to Average Net Assets 3.97% 5.59% 3.87% 3.50% 3.23% 2.76%Ratio of Expenses to Average Net Assets (excluding waivers) 1.77% 1.77% 1.76% 1.76% 1.78% 1.80%Ratio of Net Investment Income to Average Net Assets
(excluding waivers) 3.90% 5.52% 3.81% 3.44% 3.15% 2.66%Portfolio Turnover Rate 83% 160% 131% 137% 139% 208%1 Per share data calculated using average shares outstanding method.2 For the nine-month period October 1, 2005 to June 30, 2006. Effective in 2006, the fund’s fiscal year end was changed from September 30 to June 30. All ratios for
the period have been annualized, except total return and portfolio turnover.3 Total return does not reflect sales charges. Total return would have been lower had certain expenses not been waived.
Class C Shares 20101 20091 20081 20071
Fiscal periodended
June 30,20061,2 20051
Fiscal year ended June 30,
Fiscal yearended
September 30,
Per Share DataNet Asset Value, Beginning of Period $10.00 $10.83 $10.75 $10.67 $11.12 $11.24Investment Operations:
Net Investment Income 0.42 0.54 0.43 0.38 0.26 0.31Realized and Unrealized Gains (Losses) on Investments 1.19 (0.82) 0.06 0.10 (0.37) (0.09)Total From Investment Operations 1.61 (0.28) 0.49 0.48 (0.11) 0.22
Less Distributions:Dividends (from net investment income) (0.43) (0.55) (0.41) (0.40) (0.27) (0.33)Distributions (from net realized gains) — — — — (0.07) (0.01)Total Distributions (0.43) (0.55) (0.41) (0.40) (0.34) (0.34)
Net Asset Value, End of Period $11.18 $10.00 $10.83 $10.75 $10.67 $11.12
Total Return3 16.32% (2.21)% 4.57% 4.48% (1.01)% 1.99%
Ratios/Supplemental DataNet Assets, End of Period (000) $3,796 $3,693 $4,383 $4,567 $5,183 $7,266Ratio of Expenses to Average Net Assets 1.70% 1.70% 1.70% 1.70% 1.70% 1.70%Ratio of Net Investment Income to Average Net Assets 3.91% 5.59% 3.89% 3.50% 3.22% 2.76%Ratio of Expenses to Average Net Assets (excluding waivers) 1.77% 1.77% 1.76% 1.76% 1.78% 1.80%Ratio of Net Investment Income to Average Net Assets
(excluding waivers) 3.84% 5.52% 3.83% 3.44% 3.14% 2.66%Portfolio Turnover Rate 83% 160% 131% 137% 139% 208%1 Per share data calculated using average shares outstanding method.2 For the nine-month period October 1, 2005 to June 30, 2006. Effective in 2006, the fund’s fiscal year end was changed from September 30 to June 30. All ratios for
the period have been annualized, except total return and portfolio turnover.3 Total return does not reflect sales charges. Total return would have been lower had certain expenses not been waived.
54 Prospectus – First American Income Funds
Financial Highlights
Core Bond Fund continued
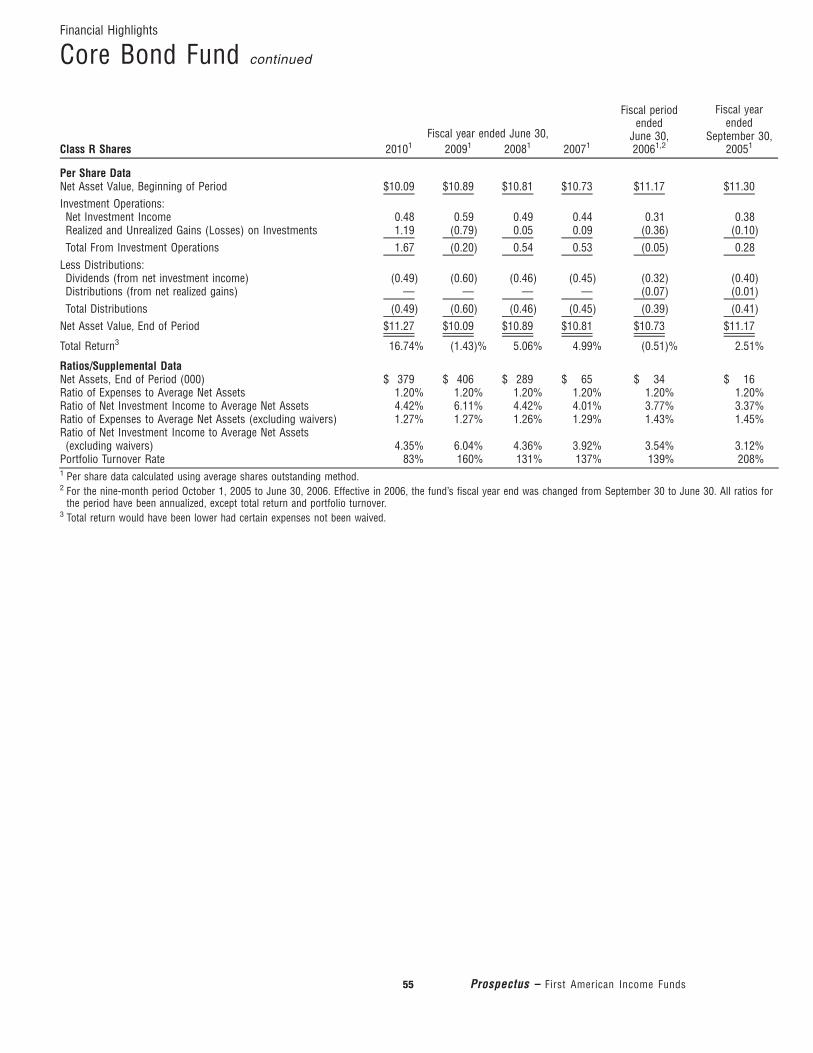
Class R Shares 20101 20091 20081 20071
Fiscal periodended
June 30,20061,2 20051
Fiscal year ended June 30,
Fiscal yearended
September 30,
Per Share DataNet Asset Value, Beginning of Period $10.09 $10.89 $10.81 $10.73 $11.17 $11.30Investment Operations:
Net Investment Income 0.48 0.59 0.49 0.44 0.31 0.38Realized and Unrealized Gains (Losses) on Investments 1.19 (0.79) 0.05 0.09 (0.36) (0.10)Total From Investment Operations 1.67 (0.20) 0.54 0.53 (0.05) 0.28
Less Distributions:Dividends (from net investment income) (0.49) (0.60) (0.46) (0.45) (0.32) (0.40)Distributions (from net realized gains) — — — — (0.07) (0.01)Total Distributions (0.49) (0.60) (0.46) (0.45) (0.39) (0.41)
Net Asset Value, End of Period $11.27 $10.09 $10.89 $10.81 $10.73 $11.17
Total Return3 16.74% (1.43)% 5.06% 4.99% (0.51)% 2.51%
Ratios/Supplemental DataNet Assets, End of Period (000) $ 379 $ 406 $ 289 $ 65 $ 34 $ 16Ratio of Expenses to Average Net Assets 1.20% 1.20% 1.20% 1.20% 1.20% 1.20%Ratio of Net Investment Income to Average Net Assets 4.42% 6.11% 4.42% 4.01% 3.77% 3.37%Ratio of Expenses to Average Net Assets (excluding waivers) 1.27% 1.27% 1.26% 1.29% 1.43% 1.45%Ratio of Net Investment Income to Average Net Assets
(excluding waivers) 4.35% 6.04% 4.36% 3.92% 3.54% 3.12%Portfolio Turnover Rate 83% 160% 131% 137% 139% 208%1 Per share data calculated using average shares outstanding method.2 For the nine-month period October 1, 2005 to June 30, 2006. Effective in 2006, the fund’s fiscal year end was changed from September 30 to June 30. All ratios for
the period have been annualized, except total return and portfolio turnover.3 Total return would have been lower had certain expenses not been waived.
55 Prospectus – First American Income Funds
Financial Highlights
Core Bond Fund continued

Class Y Shares 20101 20091 20081 20071
Fiscal periodended
June 30,20061,2 20051
Fiscal year ended June 30,
Fiscal yearended
September 30,
Per Share DataNet Asset Value, Beginning of Period $ 10.03 $ 10.86 $ 10.78 $ 10.70 $ 11.15 $ 11.27Investment Operations:
Net Investment Income 0.54 0.64 0.54 0.49 0.35 0.42Realized and Unrealized Gains (Losses) on
Investments 1.18 (0.82) 0.06 0.10 (0.38) (0.08)Total From Investment Operations 1.72 (0.18) 0.60 0.59 (0.03) 0.34
Less Distributions:Dividends (from net investment income) (0.54) (0.65) (0.52) (0.51) (0.35) (0.45)Distributions (from net realized gains) — — — — (0.07) (0.01)Total Distributions (0.54) (0.65) (0.52) (0.51) (0.42) (0.46)
Net Asset Value, End of Period $ 11.21 $ 10.03 $ 10.86 $ 10.78 $ 10.70 $ 11.15
Total Return3 17.42% (1.22)% 5.60% 5.53% (0.24)% 3.01%
Ratios/Supplemental DataNet Assets, End of Period (000) $1,179,453 $1,279,489 $1,468,599 $1,530,750 $1,680,105 $1,725,850Ratio of Expenses to Average Net Assets 0.70% 0.70% 0.70% 0.70% 0.70% 0.70%Ratio of Net Investment Income to Average Net
Assets 4.93% 6.57% 4.88% 4.50% 4.24% 3.77%Ratio of Expenses to Average Net Assets
(excluding waivers) 0.77% 0.77% 0.76% 0.76% 0.78% 0.80%Ratio of Net Investment Income to Average Net
Assets (excluding waivers) 4.86% 6.50% 4.82% 4.44% 4.16% 3.67%Portfolio Turnover Rate 83% 160% 131% 137% 139% 208%1 Per share data calculated using average shares outstanding method.2 For the nine-month period October 1, 2005 to June 30, 2006. Effective in 2006, the fund’s fiscal year end was changed from September 30 to June 30. All ratios for
the period have been annualized, except total return and portfolio turnover.3 Total return would have been lower had certain expenses not been waived.
56 Prospectus – First American Income Funds
Financial Highlights
Core Bond Fund continued
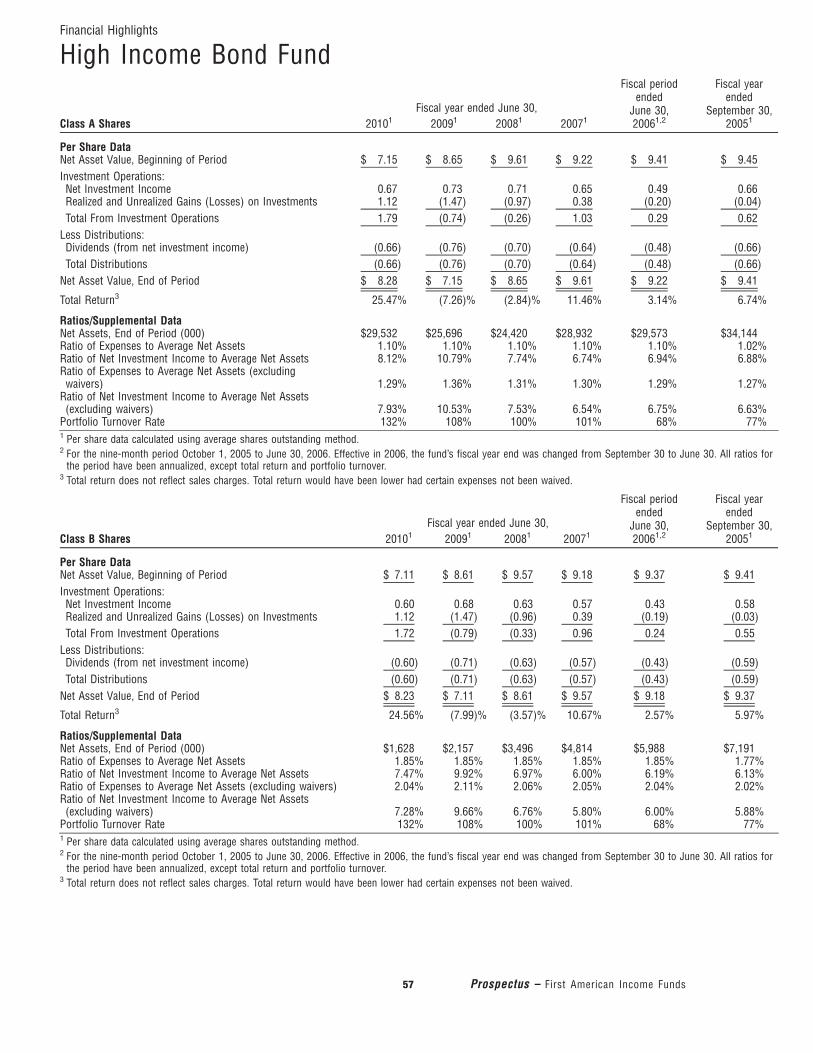
Financial Highlights
High Income Bond Fund
Class A Shares 20101 20091 20081 20071
Fiscal periodended
June 30,20061,2 20051
Fiscal year ended June 30,
Fiscal yearended
September 30,
Per Share DataNet Asset Value, Beginning of Period $ 7.15 $ 8.65 $ 9.61 $ 9.22 $ 9.41 $ 9.45Investment Operations:
Net Investment Income 0.67 0.73 0.71 0.65 0.49 0.66Realized and Unrealized Gains (Losses) on Investments 1.12 (1.47) (0.97) 0.38 (0.20) (0.04)Total From Investment Operations 1.79 (0.74) (0.26) 1.03 0.29 0.62
Less Distributions:Dividends (from net investment income) (0.66) (0.76) (0.70) (0.64) (0.48) (0.66)Total Distributions (0.66) (0.76) (0.70) (0.64) (0.48) (0.66)
Net Asset Value, End of Period $ 8.28 $ 7.15 $ 8.65 $ 9.61 $ 9.22 $ 9.41
Total Return3 25.47% (7.26)% (2.84)% 11.46% 3.14% 6.74%
Ratios/Supplemental DataNet Assets, End of Period (000) $29,532 $25,696 $24,420 $28,932 $29,573 $34,144Ratio of Expenses to Average Net Assets 1.10% 1.10% 1.10% 1.10% 1.10% 1.02%Ratio of Net Investment Income to Average Net Assets 8.12% 10.79% 7.74% 6.74% 6.94% 6.88%Ratio of Expenses to Average Net Assets (excluding
waivers) 1.29% 1.36% 1.31% 1.30% 1.29% 1.27%Ratio of Net Investment Income to Average Net Assets
(excluding waivers) 7.93% 10.53% 7.53% 6.54% 6.75% 6.63%Portfolio Turnover Rate 132% 108% 100% 101% 68% 77%1 Per share data calculated using average shares outstanding method.2 For the nine-month period October 1, 2005 to June 30, 2006. Effective in 2006, the fund’s fiscal year end was changed from September 30 to June 30. All ratios for
the period have been annualized, except total return and portfolio turnover.3 Total return does not reflect sales charges. Total return would have been lower had certain expenses not been waived.
Class B Shares 20101 20091 20081 20071
Fiscal periodended
June 30,20061,2 20051
Fiscal year ended June 30,
Fiscal yearended
September 30,
Per Share DataNet Asset Value, Beginning of Period $ 7.11 $ 8.61 $ 9.57 $ 9.18 $ 9.37 $ 9.41Investment Operations:
Net Investment Income 0.60 0.68 0.63 0.57 0.43 0.58Realized and Unrealized Gains (Losses) on Investments 1.12 (1.47) (0.96) 0.39 (0.19) (0.03)Total From Investment Operations 1.72 (0.79) (0.33) 0.96 0.24 0.55
Less Distributions:Dividends (from net investment income) (0.60) (0.71) (0.63) (0.57) (0.43) (0.59)Total Distributions (0.60) (0.71) (0.63) (0.57) (0.43) (0.59)
Net Asset Value, End of Period $ 8.23 $ 7.11 $ 8.61 $ 9.57 $ 9.18 $ 9.37
Total Return3 24.56% (7.99)% (3.57)% 10.67% 2.57% 5.97%
Ratios/Supplemental DataNet Assets, End of Period (000) $1,628 $2,157 $3,496 $4,814 $5,988 $7,191Ratio of Expenses to Average Net Assets 1.85% 1.85% 1.85% 1.85% 1.85% 1.77%Ratio of Net Investment Income to Average Net Assets 7.47% 9.92% 6.97% 6.00% 6.19% 6.13%Ratio of Expenses to Average Net Assets (excluding waivers) 2.04% 2.11% 2.06% 2.05% 2.04% 2.02%Ratio of Net Investment Income to Average Net Assets
(excluding waivers) 7.28% 9.66% 6.76% 5.80% 6.00% 5.88%Portfolio Turnover Rate 132% 108% 100% 101% 68% 77%1 Per share data calculated using average shares outstanding method.2 For the nine-month period October 1, 2005 to June 30, 2006. Effective in 2006, the fund’s fiscal year end was changed from September 30 to June 30. All ratios for
the period have been annualized, except total return and portfolio turnover.3 Total return does not reflect sales charges. Total return would have been lower had certain expenses not been waived.
57 Prospectus – First American Income Funds

Class C Shares 20101 20091 20081 20071
Fiscal periodended
June 30,20061,2 20051
Fiscal year ended June 30,
Fiscal yearended
September 30,
Per Share DataNet Asset Value, Beginning of Period $ 7.12 $ 8.62 $ 9.58 $ 9.19 $ 9.38 $ 9.42Investment Operations:
Net Investment Income 0.60 0.68 0.63 0.57 0.43 0.58Realized and Unrealized Gains (Losses) on Investments 1.13 (1.47) (0.96) 0.39 (0.19) (0.03)Total From Investment Operations 1.73 (0.79) (0.33) 0.96 0.24 0.55
Less Distributions:Dividends (from net investment income) (0.60) (0.71) (0.63) (0.57) (0.43) (0.59)Total Distributions (0.60) (0.71) (0.63) (0.57) (0.43) (0.59)
Net Asset Value, End of Period $ 8.25 $ 7.12 $ 8.62 $ 9.58 $ 9.19 $ 9.38
Total Return3 24.67% (7.98)% (3.57)% 10.66% 2.56% 5.96%
Ratios/Supplemental DataNet Assets, End of Period (000) $6,969 $5,038 $6,490 $8,522 $9,873 $13,403Ratio of Expenses to Average Net Assets 1.85% 1.85% 1.85% 1.85% 1.85% 1.77%Ratio of Net Investment Income to Average Net Assets 7.41% 9.98% 6.97% 5.98% 6.19% 6.13%Ratio of Expenses to Average Net Assets (excluding waivers) 2.04% 2.11% 2.06% 2.05% 2.04% 2.02%Ratio of Net Investment Income to Average Net Assets
(excluding waivers) 7.22% 9.72% 6.76% 5.78% 6.00% 5.88%Portfolio Turnover Rate 1.32% 108% 100% 101% 68% 77%1 Per share data calculated using average shares outstanding method.2 For the nine-month period October 1, 2005 to June 30, 2006. Effective in 2006, the fund’s fiscal year end was changed from September 30 to June 30. All ratios for
the period have been annualized, except total return and portfolio turnover.3 Total return would have been lower had certain expenses not been waived.
Class R Shares 20101 20091 20081 20071
Fiscal periodended
June 30,20061,2 20051
Fiscal year ended June 30,
Fiscal yearended
September 30,
Per Share DataNet Asset Value, Beginning of Period $ 7.28 $ 8.79 $ 9.75 $ 9.35 $ 9.53 $ 9.60Investment Operations:
Net Investment Income 0.66 0.73 0.69 0.62 0.49 0.62Realized and Unrealized Gains (Losses) on Investments 1.14 (1.49) (0.98) 0.40 (0.20) (0.04)Total From Investment Operations 1.80 (0.76) (0.29) 1.02 0.29 0.58
Less Distributions:Dividends (from net investment income) (0.64) (0.75) (0.67) (0.62) (0.47) (0.65)Total Distributions (0.64) (0.75) (0.67) (0.62) (0.47) (0.65)
Net Asset Value, End of Period $ 8.44 $ 7.28 $ 8.79 $ 9.75 $ 9.35 $ 9.53
Total Return3 25.12% (7.49)% (3.04)% 11.12% 3.09% 6.23%
Ratios/Supplemental DataNet Assets, End of Period (000) $ 343 $ 265 $ 185 $ 186 $ 73 $ 4Ratio of Expenses to Average Net Assets 1.35% 1.35% 1.35% 1.35% 1.35% 1.33%Ratio of Net Investment Income to Average Net Assets 7.92% 10.72% 7.37% 6.38% 6.82% 6.31%Ratio of Expenses to Average Net Assets (excluding waivers) 1.54% 1.61% 1.56% 1.56% 1.69% 1.73%Ratio of Net Investment Income to Average Net Assets
(excluding waivers) 7.73% 10.46% 7.16% 6.17% 6.48% 5.91%Portfolio Turnover Rate 132% 108% 100% 101% 68% 77%1 Per share data calculated using average shares outstanding method.2 For the nine-month period October 1, 2005 to June 30, 2006. Effective in 2006, the fund’s fiscal year end was changed from September 30 to June 30. All ratios for
the period have been annualized, except total return and portfolio turnover.3 Total return would have been lower had certain expenses not been waived.
58 Prospectus – First American Income Funds
Financial Highlights
High Income Bond Fund continued

Class Y Shares 20101 20091 20081 20071
Fiscal periodended
June 30,20061,2 20051
Fiscal year ended June 30,
Fiscal yearended
September 30,
Per Share DataNet Asset Value, Beginning of Period $ 7.16 $ 8.66 $ 9.62 $ 9.23 $ 9.42 $ 9.46Investment Operations:
Net Investment Income 0.69 0.75 0.73 0.67 0.51 0.68Realized and Unrealized Gains (Losses) on
Investments 1.12 (1.47) (0.97) 0.39 (0.20) (0.03)Total From Investment Operations 1.81 (0.72) (0.24) 1.06 0.31 0.65
Less Distributions:Dividends (from net investment income) (0.68) (0.78) (0.72) (0.67) (0.50) (0.69)Total Distributions (0.68) (0.78) (0.72) (0.67) (0.50) (0.69)
Net Asset Value, End of Period $ 8.29 $ 7.16 $ 8.66 $ 9.62 $ 9.23 $ 9.42
Total Return3 25.75% (7.01)% (2.59)% 11.73% 3.34% 7.01%
Ratios/Supplemental DataNet Assets, End of Period (000) $350,066 $182,051 $204,164 $232,998 $205,382 $207,610Ratio of Expenses to Average Net Assets 0.85% 0.85% 0.85% 0.85% 0.85% 0.77%Ratio of Net Investment Income to Average Net Assets 8.38% 10.93% 7.99% 6.98% 7.19% 7.13%Ratio of Expenses to Average Net Assets (excluding
waivers) 1.04% 1.11% 1.06% 1.05% 1.04% 1.02%Ratio of Net Investment Income to Average Net Assets
(excluding waivers) 8.19% 10.67% 7.78% 6.78% 7.00% 6.88%Portfolio Turnover Rate 132% 108% 100% 101% 68% 77%1 Per share data calculated using average shares outstanding method.2 For the nine-month period October 1, 2005 to June 30, 2006. Effective in 2006, the fund’s fiscal year end was changed from September 30 to June 30. All ratios for
the period have been annualized, except total return and portfolio turnover.3 Total return would have been lower had certain expenses not been waived.
59 Prospectus – First American Income Funds
Financial Highlights
High Income Bond Fund continued
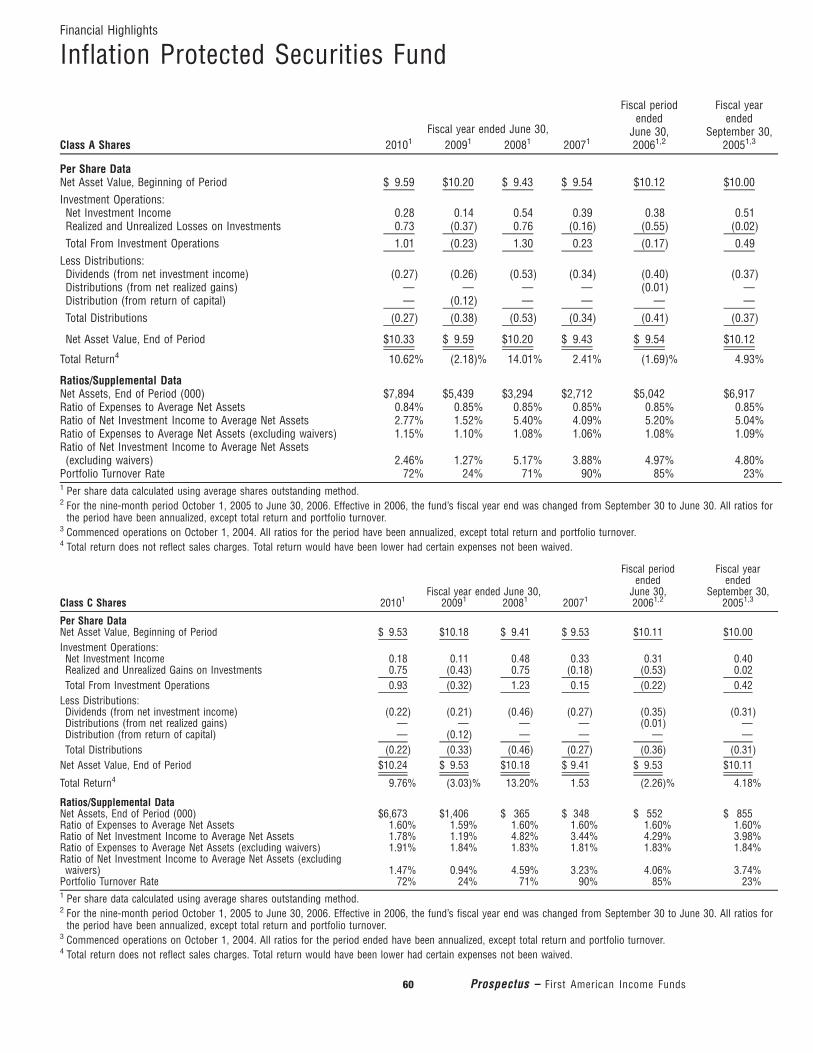
Financial Highlights
Inflation Protected Securities Fund
Class A Shares 20101 20091 20081 20071
Fiscal periodended
June 30,20061,2 20051,3
Fiscal year ended June 30,
Fiscal yearended
September 30,
Per Share DataNet Asset Value, Beginning of Period $ 9.59 $10.20 $ 9.43 $ 9.54 $10.12 $10.00Investment Operations:
Net Investment Income 0.28 0.14 0.54 0.39 0.38 0.51Realized and Unrealized Losses on Investments 0.73 (0.37) 0.76 (0.16) (0.55) (0.02)Total From Investment Operations 1.01 (0.23) 1.30 0.23 (0.17) 0.49
Less Distributions:Dividends (from net investment income) (0.27) (0.26) (0.53) (0.34) (0.40) (0.37)Distributions (from net realized gains) — — — — (0.01) —Distribution (from return of capital) — (0.12) — — — —Total Distributions (0.27) (0.38) (0.53) (0.34) (0.41) (0.37)
Net Asset Value, End of Period $10.33 $ 9.59 $10.20 $ 9.43 $ 9.54 $10.12
Total Return4 10.62% (2.18)% 14.01% 2.41% (1.69)% 4.93%
Ratios/Supplemental DataNet Assets, End of Period (000) $7,894 $5,439 $3,294 $2,712 $5,042 $6,917Ratio of Expenses to Average Net Assets 0.84% 0.85% 0.85% 0.85% 0.85% 0.85%Ratio of Net Investment Income to Average Net Assets 2.77% 1.52% 5.40% 4.09% 5.20% 5.04%Ratio of Expenses to Average Net Assets (excluding waivers) 1.15% 1.10% 1.08% 1.06% 1.08% 1.09%Ratio of Net Investment Income to Average Net Assets
(excluding waivers) 2.46% 1.27% 5.17% 3.88% 4.97% 4.80%Portfolio Turnover Rate 72% 24% 71% 90% 85% 23%1 Per share data calculated using average shares outstanding method.2 For the nine-month period October 1, 2005 to June 30, 2006. Effective in 2006, the fund’s fiscal year end was changed from September 30 to June 30. All ratios for
the period have been annualized, except total return and portfolio turnover.3 Commenced operations on October 1, 2004. All ratios for the period have been annualized, except total return and portfolio turnover.4 Total return does not reflect sales charges. Total return would have been lower had certain expenses not been waived.
Class C Shares 20101 20091 20081 20071
Fiscal periodended
June 30,20061,2
Fiscal yearended
September 30,20051,3
Fiscal year ended June 30,
Per Share DataNet Asset Value, Beginning of Period $ 9.53 $10.18 $ 9.41 $ 9.53 $10.11 $10.00Investment Operations:Net Investment Income 0.18 0.11 0.48 0.33 0.31 0.40Realized and Unrealized Gains on Investments 0.75 (0.43) 0.75 (0.18) (0.53) 0.02Total From Investment Operations 0.93 (0.32) 1.23 0.15 (0.22) 0.42
Less Distributions:Dividends (from net investment income) (0.22) (0.21) (0.46) (0.27) (0.35) (0.31)Distributions (from net realized gains) — — — — (0.01) —Distribution (from return of capital) — (0.12) — — — —Total Distributions (0.22) (0.33) (0.46) (0.27) (0.36) (0.31)
Net Asset Value, End of Period $10.24 $ 9.53 $10.18 $ 9.41 $ 9.53 $10.11
Total Return4 9.76% (3.03)% 13.20% 1.53 (2.26)% 4.18%
Ratios/Supplemental DataNet Assets, End of Period (000) $6,673 $1,406 $ 365 $ 348 $ 552 $ 855Ratio of Expenses to Average Net Assets 1.60% 1.59% 1.60% 1.60% 1.60% 1.60%Ratio of Net Investment Income to Average Net Assets 1.78% 1.19% 4.82% 3.44% 4.29% 3.98%Ratio of Expenses to Average Net Assets (excluding waivers) 1.91% 1.84% 1.83% 1.81% 1.83% 1.84%Ratio of Net Investment Income to Average Net Assets (excludingwaivers) 1.47% 0.94% 4.59% 3.23% 4.06% 3.74%
Portfolio Turnover Rate 72% 24% 71% 90% 85% 23%1 Per share data calculated using average shares outstanding method.2 For the nine-month period October 1, 2005 to June 30, 2006. Effective in 2006, the fund’s fiscal year end was changed from September 30 to June 30. All ratios for
the period have been annualized, except total return and portfolio turnover.3 Commenced operations on October 1, 2004. All ratios for the period ended have been annualized, except total return and portfolio turnover.4 Total return does not reflect sales charges. Total return would have been lower had certain expenses not been waived.
60 Prospectus – First American Income Funds

Class R Shares 20101 20091 20081 20071
Fiscal periodended
June 30,20061,2
Fiscal yearended
September 30,20011,3
Fiscal year ended June 30,
Per Share DataNet Asset Value, Beginning of Period $ 9.58 $10.20 $ 9.43 $ 9.55 $10.13 $10.00Investment Operations:Net Investment Income 0.26 0.13 0.52 0.33 0.38 0.43Realized and Unrealized Gains on Investments 0.72 (0.39) 0.75 (0.13) (0.56) 0.05Total From Investment Operations 0.98 (0.26) 1.27 0.20 (0.18) 0.48
Less Distributions:Dividends (from net investment income) (0.25) (0.24) (0.50) (0.32) (0.39) (0.35)Distributions (from net realized gains) — — — — (0.01) —Distributions (from return of capital) — (0.12) — — — —Total Distributions (0.25) (0.36) (0.50) (0.32) (0.40) (0.35)
Net Asset Value, End of Period $10.31 $ 9.58 $10.20 $ 9.43 $ 9.55 $10.13
Total Return4 10.32% (2.43)% 13.73% 2.09% (1.80)% 4.81%
Ratios/Supplemental DataNet Assets, End of Period (000) $1,332 $1,262 $1,175 $ 822 $ 1 $ 1Ratio of Expenses to Average Net Assets 1.09% 1.10% 1.10% 1.10% 1.10% 1.10%Ratio of Net Investment Income to Average Net Assets 2.64% 1.34% 5.21% 3.45% 5.17% 4.22%Ratio of Expenses to Average Net Assets (excluding waivers) 1.40% 1.35% 1.33% 1.31% 1.48% 1.49%Ratio of Net Investment Income to Average Net Assets(excluding waivers) 2.33% 1.09% 4.98% 3.24% 4.79% 3.83%
Portfolio Turnover Rate 72% 24% 71% 90% 85% 23%1 Per share data calculated using average shares outstanding method.2 For the nine-month period October 1, 2005 to June 30, 2006. Effective in 2006, the fund’s fiscal year end was changed from September 30 to June 30. All ratios for
the period have been annualized, except total return and portfolio turnover.3 Commenced operations on October 1, 2004. All ratios for the period have been annualized, except total return and portfolio turnover.4 Total return would have been lower had certain expenses not been waived.
Class Y Shares 20101 20091 20081 20071
Fiscal periodended
June 30,20061,2
Fiscal yearended
September 30,20051,3
Fiscal year ended June 30,
Per Share DataNet Asset Value, Beginning of Period $ 9.59 $ 10.20 $ 9.43 $ 9.55 $ 10.13 $ 10.00Investment Operations:Net Investment Income 0.33 0.23 0.56 0.40 0.42 0.51Realized and Unrealized Gains on Investments 0.71 (0.45) 0.76 (0.16) (0.57) 0.01Total From Investment Operations 1.04 (0.22) 1.32 0.24 (0.15) 0.52
Less Distributions:Dividends (from net investment income) (0.29) (0.27) (0.55) (0.36) (0.42) (0.39)Distributions (from net realized gains) — — — — (0.01) —Distributions (from return of capital) — (0.12) — — — —Total Distributions (0.29) (0.39) (0.55) (0.36) (0.43) (0.39)
Net Asset Value, End of Period $ 10.34 $ 9.59 $ 10.20 $ 9.43 $ 9.55 $ 10.13
Total Return4 10.92% (2.03)% 14.29% 2.56% (1.50)% 5.24%
Ratios/Supplemental DataNet Assets, End of Period (000) $156,983 $167,501 $278,749 $273,312 $317,977 $269,412Ratio of Expenses to Average Net Assets 0.59% 0.60% 0.60% 0.60% 0.60% 0.60%Ratio of Net Investment Income to Average Net Assets 3.27% 2.48% 5.64% 4.21% 5.73% 5.05%Ratio of Expenses to Average Net Assets (excluding waivers) 0.90% 0.85% 0.83% 0.81% 0.83% 0.84%Ratio of Net Investment Income to Average Net Assets(excluding waivers) 2.96% 2.23% 5.41% 4.00% 5.50% 4.81%
Portfolio Turnover Rate 72% 24% 71% 90% 85% 23%1 Per share data calculated using average shares outstanding method.2 For the nine-month period October 1, 2005 to June 30, 2006. Effective in 2006, the fund’s fiscal year end was changed from September 30 to June 30. All ratios for
the period have been annualized, except total return and portfolio turnover.3 Commenced operations on October 1, 2004. All ratios for the period have been annualized, except total return and portfolio turnover.4 Total return would have been lower had certain expenses not been waived.
61 Prospectus – First American Income Funds
Financial Highlights
Inflation Protected Securities Fund continued

Financial Highlights
Intermediate Government Bond Fund
Class A Shares 20101 20091 20081 20071
Fiscal periodended
June 30,20061,2 20051
Fiscal year ended June 30,
Fiscal yearended
September 30,
Per Share DataNet Asset Value, Beginning of Period $ 8.67 $ 8.42 $ 8.00 $ 7.99 $ 8.26 $ 8.82Investment Operations:
Net Investment Income 0.20 0.19 0.28 0.31 0.22 0.27Realized and Unrealized Gains (Losses) on Investments 0.27 0.25 0.43 0.06 (0.22) (0.15)Total From Investment Operations 0.47 0.44 0.71 0.37 0.00 0.12
Less Distributions:Dividends (from net investment income) (0.20) (0.19) (0.29) (0.33) (0.22) (0.28)Distributions (from net realized gains) (0.17) — — — (0.05) (0.40)Distributions (from return of capital) —3 — — (0.03) — —Total Distributions (0.37) (0.19) (0.29) (0.36) (0.27) (0.68)
Net Asset Value, End of Period $ 8.77 $ 8.67 $ 8.42 $ 8.00 $ 7.99 $ 8.26
Total Return4 5.50% 5.30% 8.90% 4.68% 0.06% 1.40%
Ratios/Supplemental DataNet Assets, End of Period (000) $19,003 $10,496 $6,504 $1,619 $1,689 $1,970Ratio of Expenses to Average Net Assets 0.75% 0.75% 0.75% 0.75% 0.75% 0.75%Ratio of Net Investment Income to Average Net Assets 2.33% 2.22% 3.32% 3.80% 3.56% 3.21%Ratio of Expenses to Average Net Assets (excluding waivers) 1.19% 1.15% 1.33% 1.46% 1.26% 1.09%Ratio of Net Investment Income to Average Net Assets
(excluding waivers) 1.89% 1.82% 2.74% 3.09% 3.05% 2.87%Portfolio Turnover Rate 105% 133% 118% 84% 70% 161%1 Per share data calculated using average shares outstanding method.2 For the nine-month period October 1, 2005 to June 30, 2006. Effective in 2006, the fund’s fiscal year end was changed from September 30 and June 30. All ratios
for the period have been annualized, except total return and portfolio turnover.3 Includes a tax return of capital of less than $0.01.4 Total return does not reflect sales charges. Total return would have been lower had certain expenses not been waived.
Class C Shares
Fiscal periodended
June 30,20101,2
Per Share DataNet Asset Value, Beginning of Period $ 8.76Investment Operations:
Net Investment Income 0.09Realized and Unrealized Gains on Investments 0.17Total From Investment Operations 0.26
Less Distributions:Dividends (from net investment income) (0.08)Distributions (from net realized gains) (0.17)Distributions (from return of capital) —3
Total Distributions (0.25)Net Asset Value, End of Period $ 8.77
Total Return4 3.00%
Ratios/Supplemental DataNet Assets, End of Period (000) $1,940Ratio of Expenses to Average Net Assets 1.60%Ratio of Net Investment Income to Average Net Assets 1.50%Ratio of Expenses to Average Net Assets (excluding waivers) 1.94%Ratio of Net Investment Income to Average Net Assets (excluding waivers) 1.16%Portfolio Turnover Rate 105%1 Per share data calculated using average shares outstanding method.2 Commenced operations on October 28, 2009. All ratios for the period October 28, 2009 to June 30, 2010 have been annualized, except total return and portfolio turnover.3 Includes a tax return of capital of less than $0.01.4 Total return does not reflect sales charges. Total return would have been lower had certain expenses not been waived.
62 Prospectus – First American Income Funds

Class R Shares
Fiscal periodended
June 30,20101,2
Per Share DataNet Asset Value, Beginning of Period $ 8.76Investment Operations:Net Investment Income 0.09Realized and Unrealized Gains on Investments 0.20Total From Investment Operations 0.29
Less Distributions:Dividends (from net investment income) (0.11)Distributions (from net realized gains) (0.17)Distributions (from return of capital) —3
Total Distributions (0.28)Net Asset Value, End of Period $ 8.77
Total Return4 3.34%
Ratios/Supplemental DataNet Assets, End of Period (000) $ 652Ratio of Expenses to Average Net Assets 1.10%Ratio of Net Investment Income to Average Net Assets 1.78%Ratio of Expenses to Average Net Assets (excluding waivers) 1.44%Ratio of Net Investment Income to Average Net Assets (excluding waivers) 1.44%Portfolio Turnover Rate 105%1 Per share data calculated using average shares outstanding method.2 Commenced operations on October 28, 2009. All ratios for the period October 28, 2009 to June 30, 2010 have been annualized, except total return and portfolio turnover.3 Includes a tax return of capital of less than $0.01.4 Total return would have been lower had certain expenses not been waived.
Class Y Shares 20101 20091 20081 20071
Fiscal periodended
June 30,20061,2 20051
Fiscal year ended June 30,
Fiscal yearended
September 30,
Per Share DataNet Asset Value, Beginning of Period $ 8.67 $ 8.42 $ 8.00 $ 7.99 $ 8.25 $ 8.82Investment Operations:Net Investment Income 0.21 0.21 0.30 0.32 0.22 0.28Realized and Unrealized Gains (Losses) on Investments 0.27 0.25 0.42 0.06 (0.20) (0.16)Total From Investment Operations 0.48 0.46 0.72 0.38 0.02 0.12
Less Distributions:Dividends (from net investment income) (0.21) (0.21) (0.30) (0.34) (0.23) (0.29)Distributions (from net realized gains) (0.17) — — — (0.05) (0.40)Distributions (from return of capital) —3 — — (0.03) — —Total Distributions (0.38) (0.21) (0.30) (0.37) (0.28) (0.69)
Net Asset Value, End of Period $ 8.77 $ 8.67 $ 8.42 $ 8.00 $ 7.99 $ 8.25
Total Return4 5.66% 5.46% 9.07% 4.84% 0.30% 1.43%
Ratios/Supplemental DataNet Assets, End of Period (000) $152,088 $101,253 $63,784 $37,705 $42,781 $69,349Ratio of Expenses to Average Net Assets 0.60% 0.60% 0.60% 0.60% 0.60% 0.60%Ratio of Net Investment Income to Average Net Assets 2.39% 2.41% 3.60% 3.94% 3.70% 3.34%Ratio of Expenses to Average Net Assets (excluding waivers) 0.94% 0.90% 1.08% 1.21% 1.01% 0.84%Ratio of Net Investment Income to Average Net Assets (excluding waivers) 2.05% 2.11% 3.12% 3.33% 3.29% 3.10%Portfolio Turnover Rate 105% 133% 118% 84% 70% 161%1 Per share data calculated using average shares outstanding method.2 For the nine-month period October 1, 2005 to June 30, 2006. Effective in 2006, the fund’s fiscal year end was changed from September 30 to June 30. All ratios for
the period have been annualized, except total return and portfolio turnover.3 Includes a tax return of capital of less than $0.01.4 Total return would have been lower had certain expenses not been waived.
63 Prospectus – First American Income Funds
Financial Highlights
Intermediate Government Bond Fund continued

Financial Highlights
Intermediate Term Bond Fund
Class A Shares 20101 20091 20081 20071
Fiscal periodended
June 30,20061,2 20051
Fiscal year ended June 30,
Fiscal yearended
September 30,
Per Share DataNet Asset Value, Beginning of Period $ 9.47 $ 9.90 $ 9.73 $ 9.68 $ 9.99 $ 10.25Investment Operations:
Net Investment Income 0.42 0.48 0.44 0.41 0.29 0.34Realized and Unrealized Gains (Losses) on
Investments 0.86 (0.40) 0.14 0.05 (0.27) (0.17)Total From Investment Operations 1.28 0.08 0.58 0.46 0.02 0.17
Less Distributions:Dividends (from net investment income) (0.42) (0.51) (0.41) (0.41) (0.30) (0.33)Distributions (from net realized gains) — — — — (0.03) (0.10)Total Distributions (0.42) (0.51) (0.41) (0.41) (0.33) (0.43)
Net Asset Value, End of Period $ 10.33 $ 9.47 $ 9.90 $ 9.73 $ 9.68 $ 9.99
Total Return3 13.64% 1.21% 6.02% 4.80% 0.23% 1.69%
Ratios/Supplemental DataNet Assets, End of Period (000) $26,341 $ 23,905 $ 28,364 $ 30,655 $ 38,296 $ 48,426Ratio of Expenses to Average Net Assets 0.85% 0.85% 0.85% 0.85% 0.75% 0.75%Ratio of Net Investment Income to Average Net Assets 4.12% 5.25% 4.38% 4.07% 3.88% 3.39%Ratio of Expenses to Average Net Assets (excluding
waivers) 1.01% 1.01% 1.01% 1.01% 1.03% 1.05%Ratio of Net Investment Income to Average Net Assets
(excluding waivers) 3.96% 5.09% 4.22% 3.91% 3.60% 3.09%Portfolio Turnover Rate 58% 41% 102% 110% 113% 118%1 Per share data calculated using average shares outstanding method.2 For the nine-month period October 1, 2005 to June 30, 2006. Effective in 2006, the fund’s fiscal year end was changed from September 30 and June 30. All ratios
for the period have been annualized, except total return and portfolio turnover.3 Total return does not reflect sales charges. Total return would have been lower had certain expenses not been waived.
Class Y Shares 20101 20091 20081 20071
Fiscal periodended
June 30,20061,2 20051
Fiscal year ended June 30,
Fiscal yearended
September 30,
Per Share DataNet Asset Value, Beginning of Period $ 9.43 $ 9.87 $ 9.70 $ 9.65 $ 9.96 $ 10.22Investment Operations:Net Investment Income 0.43 0.49 0.45 0.42 0.30 0.36Realized and Unrealized Gains (Losses) on Investments 0.86 (0.40) 0.15 0.06 (0.27) (0.17)Total From Investment Operations 1.29 0.09 0.60 0.48 0.03 0.19
Less Distributions:Dividends (from net investment income) (0.43) (0.53) (0.43) (0.43) (0.31) (0.35)Distributions (from net realized gains) — — — — (0.03) (0.10)Total Distributions (0.43) (0.53) (0.43) (0.43) (0.34) (0.45)
Net Asset Value, End of Period $ 10.29 $ 9.43 $ 9.87 $ 9.70 $ 9.65 $ 9.96
Total Return3 13.87% 1.26% 6.20% 4.98% 0.34% 1.85%
Ratios/Supplemental DataNet Assets, End of Period (000) $734,924 $724,531 $766,932 $752,984 $899,175 $1,074,624Ratio of Expenses to Average Net Assets 0.70% 0.70% 0.70% 0.70% 0.60% 0.60%Ratio of Net Investment Income to Average Net Assets 4.28% 5.39% 4.53% 4.22% 4.03% 3.55%Ratio of Expenses to Average Net Assets (excluding waivers) 0.76% 0.76% 0.76% 0.76% 0.78% 0.80%Ratio of Net Investment Income to Average Net Assets (excludingwaivers) 4.22% 5.33% 4.47% 4.16% 3.85% 3.35%
Portfolio Turnover Rate 58% 41% 102% 110% 113% 118%
1 Per share data calculated using average shares outstanding method.2 For the nine-month period October 1, 2005 to June 30, 2006. Effective in 2006, the fund’s fiscal year end was changed from September 30 to June 30. All ratios for
the period have been annualized, except total return and portfolio turnover.3 Total return would have been lower had certain expenses not been waived.
64 Prospectus – First American Income Funds

Financial Highlights
Short Term Bond Fund
Class A Shares 20101 20091 20081 20071
Fiscal periodended
June 30,20061,2 20051
Fiscal year ended June 30,
Fiscal yearended
September 30,
Per Share DataNet Asset Value, Beginning of Period $ 9.66 $ 9.89 $ 9.90 $ 9.83 $ 9.93 $ 10.11Investment Operations:
Net Investment Income 0.31 0.46 0.45 0.36 0.23 0.27Realized and Unrealized Gains (Losses) on Investments 0.34 (0.26) (0.03) 0.09 (0.06) (0.16)Total From Investment Operations 0.65 0.20 0.42 0.45 0.17 0.11
Less Distributions:Dividends (from net investment income) (0.33) (0.43) (0.43) (0.38) (0.27) (0.29)Distributions (from return of capital) — — — — — —3
Total Distributions (0.33) (0.43) (0.43) (0.38) (0.27) (0.29)Net Asset Value, End of Period $ 9.98 $ 9.66 $ 9.89 $ 9.90 $ 9.83 $ 9.93
Total Return4 6.77% 2.22% 4.30% 4.60% 1.75% 1.08%Ratios/Supplemental DataNet Assets, End of Period (000) $87,631 $65,704 $59,933 $66,722 $78,771 $97,863Ratio of Expenses to Average Net Assets 0.75% 0.74% 0.74% 0.75% 0.75% 0.75%Ratio of Net Investment Income to Average Net Assets 3.17% 4.87% 4.48% 3.61% 3.11% 2.68%Ratio of Expenses to Average Net Assets
(excluding waivers) 1.04% 1.06% 1.05% 1.04% 1.04% 1.05%Ratio of Net Investment Income to Average Net Assets
(excluding waivers) 2.88% 4.55% 4.17% 3.32% 2.82% 2.38%Portfolio Turnover Rate 44% 54% 55% 47% 60% 64%1 Per share data calculated using average shares outstanding method.2 For the nine-month period October 1, 2005 to June 30, 2006. Effective in 2006, the fund’s fiscal year end was changed from September 30 to June 30. All ratios for
the period have been annualized, except total return and portfolio turnover.3 Includes a tax return of capital of less than $0.01.4 Total return does not reflect sales charges. Total return would have been lower had certain expenses not been waived.
Class C Shares
Fiscal periodended
June 30,20101,2
Per Share DataNet Asset Value, Beginning of Period $ 9.95Investment Operations:
Net Investment Income 0.13Realized and Unrealized Gains (Losses) on Investments 0.06Total From Investment Operations 0.19
Less Distributions:Dividends (from net investment income) (0.14)Total Distributions (0.14)
Net Asset Value, End of Period $10.00
Total Return3 1.90%Ratios/Supplemental DataNet Assets, End of Period (000) $3,111Ratio of Expenses to Average Net Assets 1.60%Ratio of Net Investment Income to Average Net Assets 1.95%Ratio of Expenses to Average Net Assets (excluding waivers) 1.79%Ratio of Net Investment Income to Average Net Assets (excluding waivers) 1.76%Portfolio Turnover Rate 44%1 Per share data calculated using average shares outstanding method.2 Commenced operations on October 28, 2009. All ratios for the period October 28, 2009 to June 30, 2010 have been annualized, except total return and portfolio turnover.3 Total return does not reflect sales charges. Total return would have been lower had certain expenses not been waived.
65 Prospectus – First American Income Funds
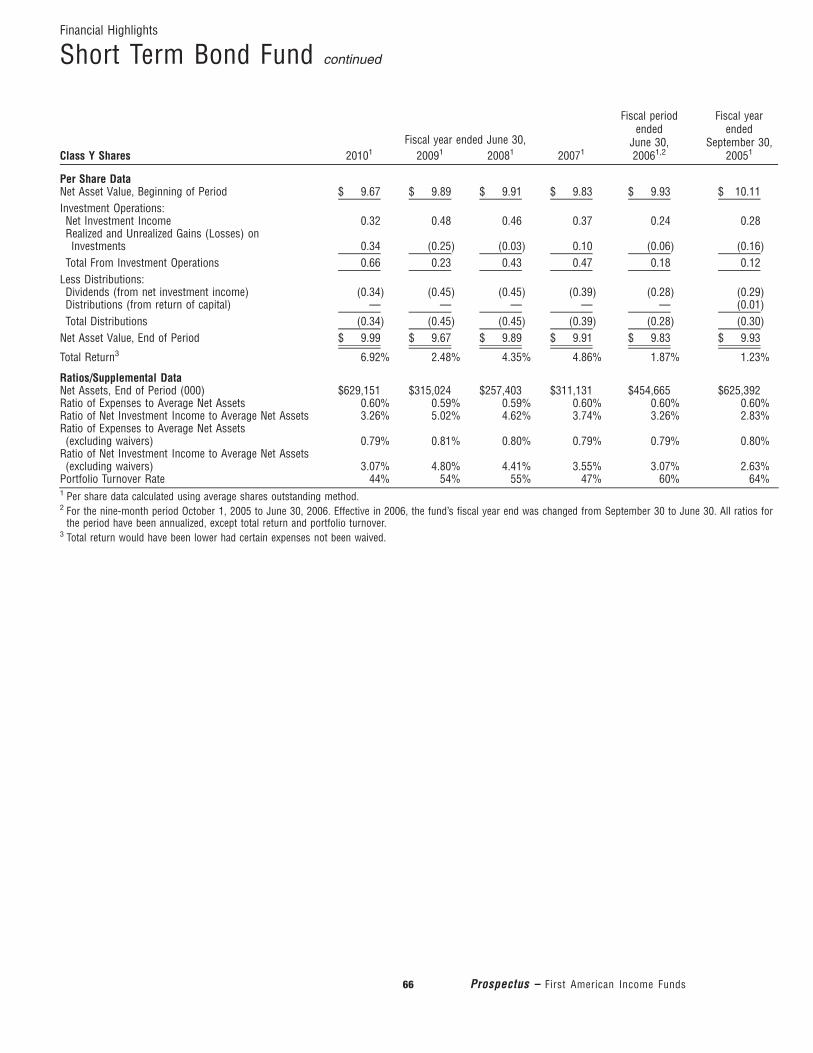
Class Y Shares 20101 20091 20081 20071
Fiscal periodended
June 30,20061,2 20051
Fiscal year ended June 30,
Fiscal yearended
September 30,
Per Share DataNet Asset Value, Beginning of Period $ 9.67 $ 9.89 $ 9.91 $ 9.83 $ 9.93 $ 10.11Investment Operations:
Net Investment Income 0.32 0.48 0.46 0.37 0.24 0.28Realized and Unrealized Gains (Losses) on
Investments 0.34 (0.25) (0.03) 0.10 (0.06) (0.16)Total From Investment Operations 0.66 0.23 0.43 0.47 0.18 0.12
Less Distributions:Dividends (from net investment income) (0.34) (0.45) (0.45) (0.39) (0.28) (0.29)Distributions (from return of capital) — — — — — (0.01)Total Distributions (0.34) (0.45) (0.45) (0.39) (0.28) (0.30)
Net Asset Value, End of Period $ 9.99 $ 9.67 $ 9.89 $ 9.91 $ 9.83 $ 9.93
Total Return3 6.92% 2.48% 4.35% 4.86% 1.87% 1.23%
Ratios/Supplemental DataNet Assets, End of Period (000) $629,151 $315,024 $257,403 $311,131 $454,665 $625,392Ratio of Expenses to Average Net Assets 0.60% 0.59% 0.59% 0.60% 0.60% 0.60%Ratio of Net Investment Income to Average Net Assets 3.26% 5.02% 4.62% 3.74% 3.26% 2.83%Ratio of Expenses to Average Net Assets
(excluding waivers) 0.79% 0.81% 0.80% 0.79% 0.79% 0.80%Ratio of Net Investment Income to Average Net Assets
(excluding waivers) 3.07% 4.80% 4.41% 3.55% 3.07% 2.63%Portfolio Turnover Rate 44% 54% 55% 47% 60% 64%1 Per share data calculated using average shares outstanding method.2 For the nine-month period October 1, 2005 to June 30, 2006. Effective in 2006, the fund’s fiscal year end was changed from September 30 to June 30. All ratios for
the period have been annualized, except total return and portfolio turnover.3 Total return would have been lower had certain expenses not been waived.
66 Prospectus – First American Income Funds
Financial Highlights
Short Term Bond Fund continued

Financial Highlights
Total Return Bond Fund1
Class A Shares 20102 20092 20082 20072
Fiscal periodended
June 30,20062,3 20052
Fiscal year ended June 30,
Fiscal yearended
September 30,
Per Share DataNet Asset Value, Beginning of Period $ 9.01 $ 9.90 $ 9.83 $ 9.86 $ 10.18 $ 10.25Investment Operations:
Net Investment Income 0.52 0.64 0.49 0.45 0.31 0.43Realized and Unrealized Gains (Losses) on Investments 1.28 (0.74) 0.05 (0.02) (0.33) (0.07)Total From Investment Operations 1.80 (0.10) 0.54 0.43 (0.02) 0.36
Less Distributions:Dividends (from net investment income) (0.54) (0.63) (0.47) (0.46) (0.30) (0.43)Distributions (from net realized gains) — (0.16) — — — —Total Distributions (0.54) (0.79) (0.47) (0.46) (0.30) (0.43)
Net Asset Value, End of Period $ 10.27 $ 9.01 $ 9.90 $ 9.83 $ 9.86 $ 10.18
Total Return4 20.21% 0.16% 5.51% 4.36% (0.17)% 3.57%
Ratios/Supplemental DataNet Assets, End of Period (000) $28,165 $13,948 $15,567 $13,198 $15,522 $19,113Ratio of Expenses to Average Net Assets 0.92% 1.00% 0.99% 1.00% 1.00% 1.00%Ratio of Net Investment Income to Average Net Assets 5.19% 7.58% 4.87% 4.48% 4.14% 4.20%Ratio of Expenses to Average Net Assets (excluding
waivers) 1.13% 1.13% 1.11% 1.13% 1.17% 1.25%Ratio of Net Investment Income to Average Net Assets
(excluding waivers) 4.98% 7.45% 4.75% 4.35% 3.97% 3.95%Portfolio Turnover Rate 96% 147% 124% 180% 166% 285%1 Prior to May 13, 2005, the fund had different principal investment strategies and was named Corporate Bond Fund.2 Per share data calculated using average shares outstanding method.3 For the nine-month period October 1, 2005 to June 30, 2006. Effective in 2006, the fund’s fiscal year end was changed from September 30 to June 30. All ratios for
the period have been annualized, except total return and portfolio turnover.4 Total return does not reflect sales charges. Total return would have been lower had certain expenses not been waived.
67 Prospectus – First American Income Funds

Class B Shares 20102 20092 20082 20072
Fiscal periodended
June 30,20062,3 20052
Fiscal year ended June 30,
Fiscal yearended
September 30,
Per Share DataNet Asset Value, Beginning of Period $ 8.97 $ 9.86 $ 9.80 $ 9.82 $10.14 $10.21Investment Operations:
Net Investment Income 0.45 0.58 0.41 0.38 0.25 0.35Realized and Unrealized Gains (Losses) on Investments 1.26 (0.74) 0.05 (0.02) (0.32) (0.07)Total From Investment Operations 1.71 (0.16) 0.46 0.36 (0.07) 0.28
Less Distributions:Dividends (from net investment income) (0.46) (0.57) (0.40) (0.38) (0.25) (0.35)Distributions (from net realized gains) — (0.16) — — — —Total Distributions (0.46) (0.73) (0.40) (0.38) (0.25) (0.35)
Net Asset Value, End of Period $10.22 $ 8.97 $ 9.86 $ 9.80 $ 9.82 $10.14
Total Return4 19.22% (0.58)% 4.65% 3.69% (0.74)% 2.81%
Ratios/Supplemental DataNet Assets, End of Period (000) $1,413 $1,719 $2,384 $2,272 $3,657 $4,395Ratio of Expenses to Average Net Assets 1.74% 1.75% 1.74% 1.75% 1.75% 1.75%Ratio of Net Investment Income to Average Net Assets 4.48% 6.84% 4.13% 3.74% 3.40% 3.45%Ratio of Expenses to Average Net Assets (excluding waivers) 1.87% 1.88% 1.86% 1.88% 1.92% 2.00%Ratio of Net Investment Income to Average Net Assets
(excluding waivers) 4.35% 6.71% 4.01% 3.61% 3.23% 3.20%Portfolio Turnover Rate 96% 147% 124% 180% 166% 285%1 Prior to May 13, 2005, the fund had different principal investment strategies and was named Corporate Bond Fund.2 Per share data calculated using average shares outstanding method.3 For the nine-month period October 1, 2005 to June 30, 2006. Effective in 2006, the fund’s fiscal year end was changed from September 30 to June 30. All ratios for
the period have been annualized, except total return and portfolio turnover.4 Total return does not reflect sales charges. Total return would have been lower had certain expenses not been waived.
68 Prospectus – First American Income Funds
Financial Highlights
Total Return Bond Fund1continued
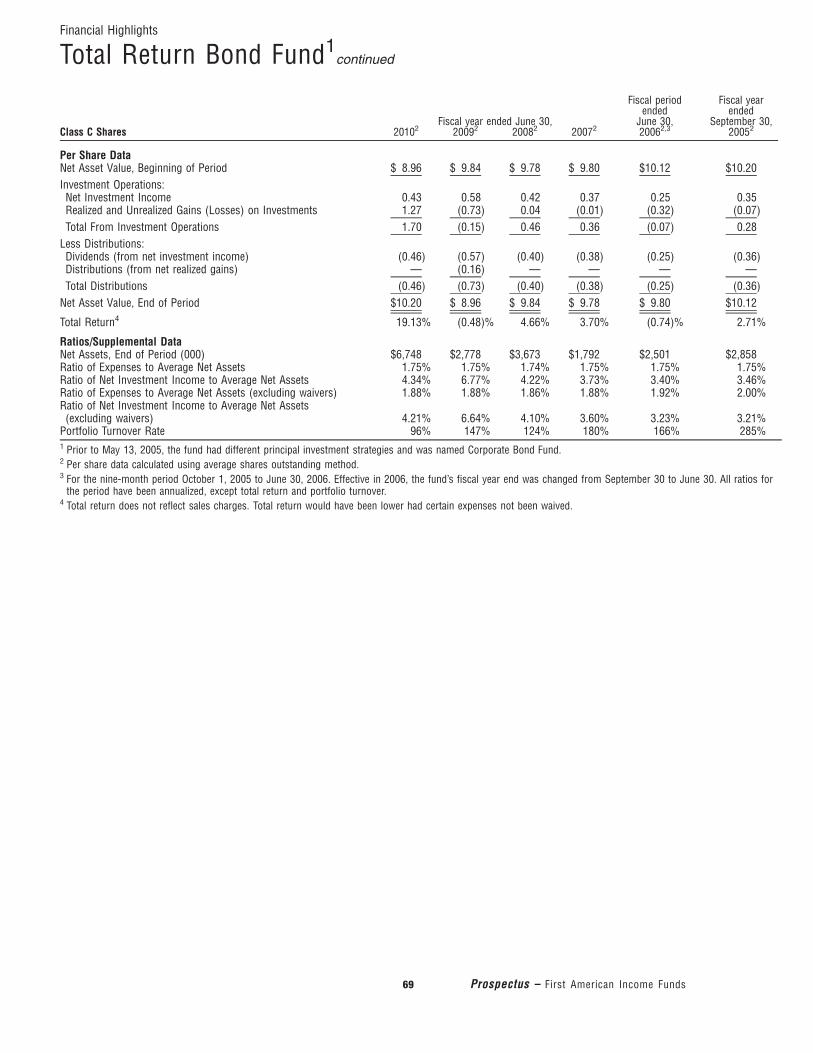
Class C Shares 20102 20092 20082 20072
Fiscal periodended
June 30,20062,3 20052
Fiscal year ended June 30,
Fiscal yearended
September 30,
Per Share DataNet Asset Value, Beginning of Period $ 8.96 $ 9.84 $ 9.78 $ 9.80 $10.12 $10.20Investment Operations:
Net Investment Income 0.43 0.58 0.42 0.37 0.25 0.35Realized and Unrealized Gains (Losses) on Investments 1.27 (0.73) 0.04 (0.01) (0.32) (0.07)Total From Investment Operations 1.70 (0.15) 0.46 0.36 (0.07) 0.28
Less Distributions:Dividends (from net investment income) (0.46) (0.57) (0.40) (0.38) (0.25) (0.36)Distributions (from net realized gains) — (0.16) — — — —Total Distributions (0.46) (0.73) (0.40) (0.38) (0.25) (0.36)
Net Asset Value, End of Period $10.20 $ 8.96 $ 9.84 $ 9.78 $ 9.80 $10.12
Total Return4 19.13% (0.48)% 4.66% 3.70% (0.74)% 2.71%
Ratios/Supplemental DataNet Assets, End of Period (000) $6,748 $2,778 $3,673 $1,792 $2,501 $2,858Ratio of Expenses to Average Net Assets 1.75% 1.75% 1.74% 1.75% 1.75% 1.75%Ratio of Net Investment Income to Average Net Assets 4.34% 6.77% 4.22% 3.73% 3.40% 3.46%Ratio of Expenses to Average Net Assets (excluding waivers) 1.88% 1.88% 1.86% 1.88% 1.92% 2.00%Ratio of Net Investment Income to Average Net Assets
(excluding waivers) 4.21% 6.64% 4.10% 3.60% 3.23% 3.21%Portfolio Turnover Rate 96% 147% 124% 180% 166% 285%1 Prior to May 13, 2005, the fund had different principal investment strategies and was named Corporate Bond Fund.2 Per share data calculated using average shares outstanding method.3 For the nine-month period October 1, 2005 to June 30, 2006. Effective in 2006, the fund’s fiscal year end was changed from September 30 to June 30. All ratios for
the period have been annualized, except total return and portfolio turnover.4 Total return does not reflect sales charges. Total return would have been lower had certain expenses not been waived.
69 Prospectus – First American Income Funds
Financial Highlights
Total Return Bond Fund1continued
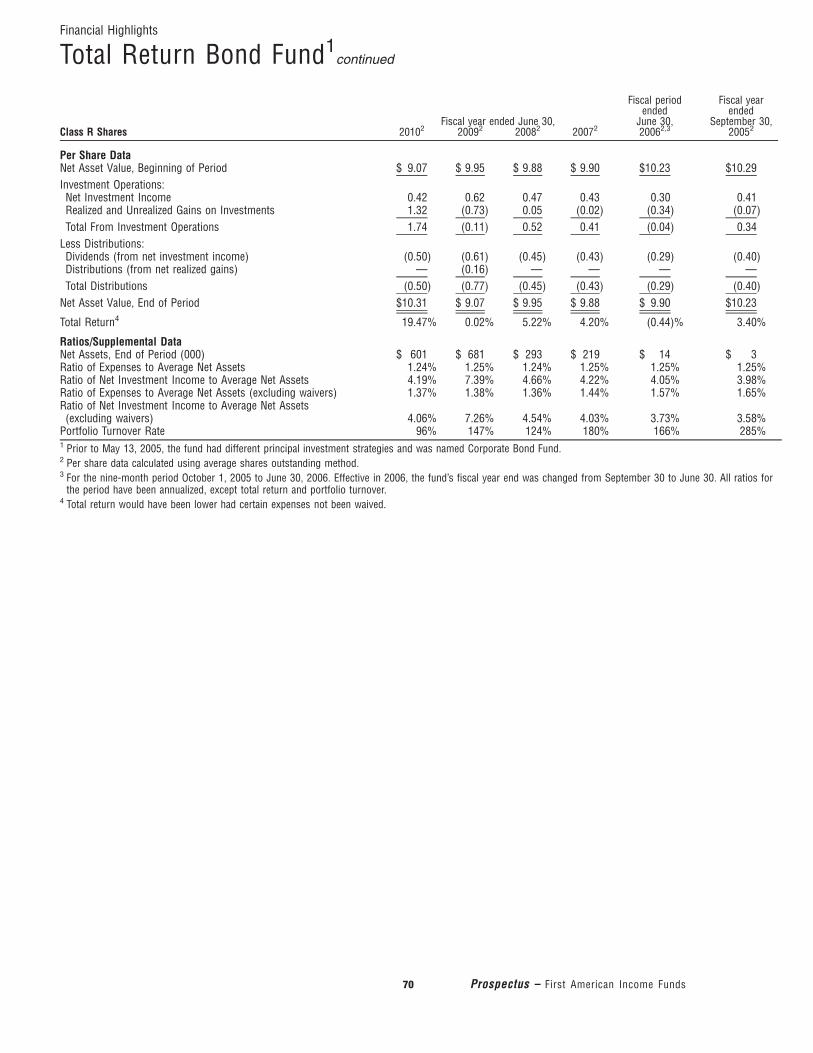
Class R Shares 20102 20092 20082 20072
Fiscal periodended
June 30,20062,3 20052
Fiscal year ended June 30,
Fiscal yearended
September 30,
Per Share DataNet Asset Value, Beginning of Period $ 9.07 $ 9.95 $ 9.88 $ 9.90 $10.23 $10.29Investment Operations:
Net Investment Income 0.42 0.62 0.47 0.43 0.30 0.41Realized and Unrealized Gains on Investments 1.32 (0.73) 0.05 (0.02) (0.34) (0.07)Total From Investment Operations 1.74 (0.11) 0.52 0.41 (0.04) 0.34
Less Distributions:Dividends (from net investment income) (0.50) (0.61) (0.45) (0.43) (0.29) (0.40)Distributions (from net realized gains) — (0.16) — — — —Total Distributions (0.50) (0.77) (0.45) (0.43) (0.29) (0.40)
Net Asset Value, End of Period $10.31 $ 9.07 $ 9.95 $ 9.88 $ 9.90 $10.23
Total Return4 19.47% 0.02% 5.22% 4.20% (0.44)% 3.40%
Ratios/Supplemental DataNet Assets, End of Period (000) $ 601 $ 681 $ 293 $ 219 $ 14 $ 3Ratio of Expenses to Average Net Assets 1.24% 1.25% 1.24% 1.25% 1.25% 1.25%Ratio of Net Investment Income to Average Net Assets 4.19% 7.39% 4.66% 4.22% 4.05% 3.98%Ratio of Expenses to Average Net Assets (excluding waivers) 1.37% 1.38% 1.36% 1.44% 1.57% 1.65%Ratio of Net Investment Income to Average Net Assets
(excluding waivers) 4.06% 7.26% 4.54% 4.03% 3.73% 3.58%Portfolio Turnover Rate 96% 147% 124% 180% 166% 285%1 Prior to May 13, 2005, the fund had different principal investment strategies and was named Corporate Bond Fund.2 Per share data calculated using average shares outstanding method.3 For the nine-month period October 1, 2005 to June 30, 2006. Effective in 2006, the fund’s fiscal year end was changed from September 30 to June 30. All ratios for
the period have been annualized, except total return and portfolio turnover.4 Total return would have been lower had certain expenses not been waived.
70 Prospectus – First American Income Funds
Financial Highlights
Total Return Bond Fund1continued

Class Y Shares 20102 20092 20082 20072
Fiscal periodended
June 30,20062,3 20052
Fiscal year ended June 30,
Fiscal periodended
September 30,
Per Share DataNet Asset Value, Beginning of Period $ 9.01 $ 9.89 $ 9.83 $ 9.85 $ 10.17 $ 10.24Investment Operations:
Net Investment Income 0.55 0.66 0.52 0.47 0.33 0.46Realized and Unrealized Gains (Losses) on Investments 1.25 (0.73) 0.04 (0.01) (0.33) (0.07)Total From Investment Operations 1.80 (0.07) 0.56 0.46 0.00 0.39
Less Distributions:Dividends (from net investment income) (0.55) (0.65) (0.50) (0.48) (0.32) (0.46)Distributions (from net realized gains) — (0.16) — — — —Total Distributions (0.55) (0.81) (0.50) (0.48) (0.32) (0.46)
Net Asset Value, End of Period $ 10.26 $ 9.01 $ 9.89 $ 9.83 $ 9.85 $ 10.17
Total Return4 20.31% 0.52% 5.67% 4.73% 0.02% 3.83%
Ratios/Supplemental DataNet Assets, End of Period (000) $655,301 $633,108 $1,069,211 $851,513 $378,338 $278,777Ratio of Expenses to Average Net Assets 0.74% 0.75% 0.74% 0.75% 0.75% 0.75%Ratio of Net Investment Income to Average Net Assets 5.44% 7.77% 5.15% 4.71% 4.43% 4.43%Ratio of Expenses to Average Net Assets
(excluding waivers) 0.87% 0.88% 0.86% 0.88% 0.92% 1.00%Ratio of Net Investment Income to Average Net Assets
(excluding waivers) 5.31% 7.64% 5.03% 4.58% 4.26% 4.18%Portfolio Turnover Rate 96% 147% 124% 180% 166% 285%1 The financial highlights prior to May 13, 2005 are those of the Corporate Bond Fund, which changed its principal investment strategies and changed its name to
Total Return Bond Fund on that date.2 Per share data calculated using average shares outstanding method.3 For the nine-month period October 1, 2005 to June 30, 2006. Effective in 2006, the fund’s fiscal year end was changed from September 30 to June 30. All ratios for
the period have been annualized, except total return and portfolio turnover.4 Total return would have been lower had certain expenses not been waived.
71 Prospectus – First American Income Funds
Financial Highlights
Total Return Bond Fund1continued

First American Funds’ Privacy PolicyWe want you to understand what information we collect and how it’s used.
“Nonpublic personal information” is nonpublic information that we obtain while providing financial products or servicesto you.
Why we collect your informationWe gather nonpublic personal information about you and your accounts so that we can:• Know who you are and prevent unauthorized access to your information.• Comply with the laws and regulations that govern us.
The types of information we collectWe may collect the following nonpublic personal information about you:• Information about your identity, such as your name, address, and social security number.• Information about your transactions with us.• Information you provide on applications, such as your beneficiaries and banking information, if provided to us.
Confidentiality and securityWe require our service providers to restrict access to nonpublic personal information about you to those employees who need that information inorder to provide products or services to you. We also require them to maintain physical, electronic, and procedural safeguards that comply withapplicable federal standards and regulations to guard your information.
What information we discloseWe may share all of the nonpublic personal information that we collect about you with our affiliated providers of financial services, including ourfamily of funds and their advisor, and with companies that perform marketing services on our behalf.
We’re permitted by law to disclose nonpublic personal information about you to other third parties in certain circumstances. For example, we maydisclose nonpublic personal information about you to affiliated and nonaffiliated third parties to assist us in servicing your account (e.g., mailing offund-related materials) and to government entities (e.g., IRS for tax purposes).
We’ll continue to adhere to the privacy policies and practices described here even after your account is closed or becomes inactive.
Additional rights and protectionsYou may have other privacy protections under applicable state laws. To the extent that these state laws apply, we will comply with them when weshare information about you. This privacy policy does not apply to your relationship with other financial service providers, such as broker-dealers.We may amend this privacy notice at any time, and we will inform you of changes as required by law.
Our pledge applies to products and services offered by:• First American Funds, Inc.• First American Investment Funds, Inc.• First American Strategy Funds, Inc.• American Strategic Income Portfolio Inc.• American Strategic Income Portfolio Inc. II• American Strategic Income Portfolio Inc. III
• American Select Portfolio Inc.• American Municipal Income Portfolio Inc.• Minnesota Municipal Income Portfolio Inc.• First American Minnesota Municipal Income Fund II, Inc.• American Income Fund, Inc.
NOT FDIC INSURED NO BANK GUARANTEE MAY LOSE VALUE
THIS PAGE IS NOT PART OF THE PROSPECTUS

First American FundsP.O. Box 1330Minneapolis, MN 55440-1330
The Statement of Additional Information (SAI) provides more detailsabout the funds and their policies and is incorporated into thisprospectus by reference (which means that it is legally part of thisprospectus).
Additional information about the funds’ investments is available in thefunds’ annual and semi-annual reports to shareholders. In the funds’annual report, you will find a discussion of the market conditions andinvestment strategies that significantly affected the funds’performance during their last fiscal year.
You can obtain a free copy of the funds’ most recent annual or semi-annual reports or the SAI, request other information about the funds,or make other shareholder inquiries by calling Investor Services at800 677-3863 or by contacting the funds at the address above.
Annual or semi-annual reports and the SAI are also available on thefunds’ Internet site at www.firstamericanfunds.com.
Information about the funds (including the SAI) can also be reviewedand copied at the Securities and Exchange Commission’s (SEC) PublicReference Room in Washington, D.C. To find out more about thispublic service, call the SEC at 1-202-551-8090. Reports and otherinformation about the funds are also available on the EDGARDatabase on the SEC’s Internet site at www.sec.gov, or you canobtain copies of this information, after paying a duplicating fee, byelectronic request at the following e-mail address:[email protected], or by writing the SEC’s Public Reference Section,Washington, D.C. 20549-1520.
SEC file number: 811-05309 PROBOND 10/10