Embed Size (px)
Citation preview

Slide 1 of 31
Income Inequality and Health in Washington State
Donald L. Patrick, Jesse J. Plascak, Shirley A.A. BeresfordUniversity of Washington
Autumn Quarterly MeetingBiobehavioral Cancer Prevention and Training Program
October 31st, 2014
** Funded in part by National Cancer Institute Biobehavioral Cancer Prevention and Control Training Grant (R25CA092408) and P50CA148143
Slide 2 of 31
Outline
1. Background2. Gini Index and top 1%3. Associations between SES Inequality and health4. Conclusions

Slide 3 of 31
Slide 4 of 31
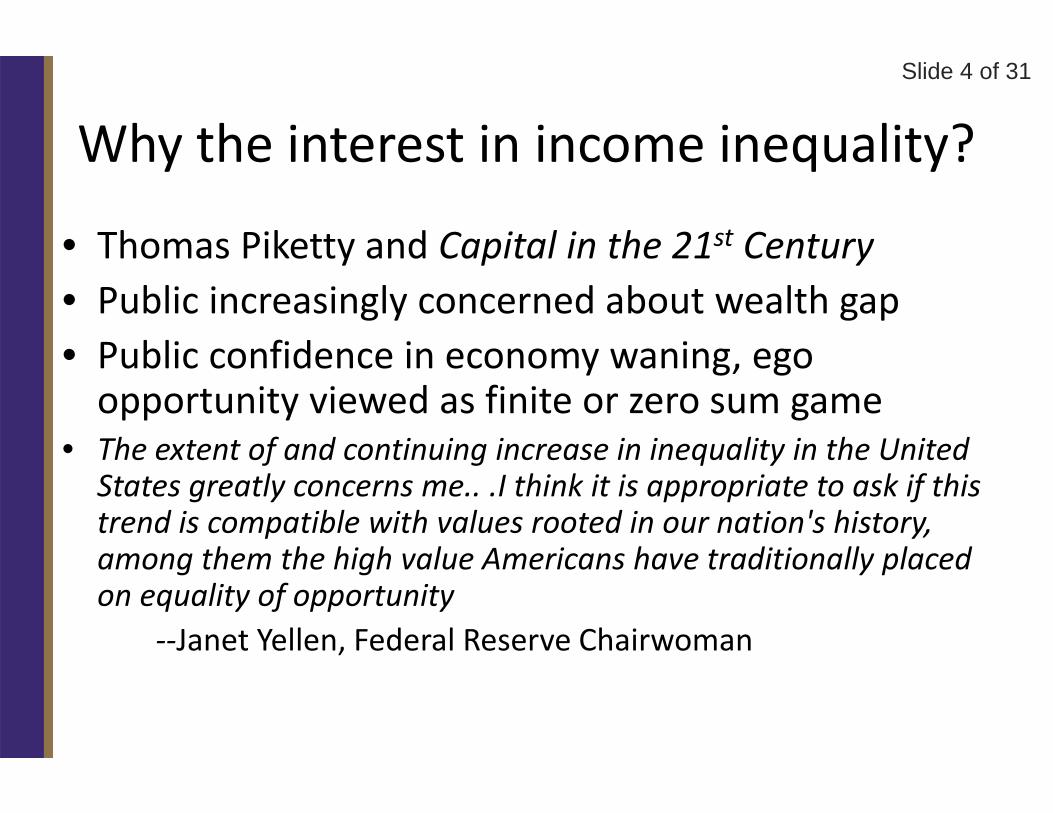
Why the interest in income inequality?
• Thomas Piketty and Capital in the 21st Century• Public increasingly concerned about wealth gap• Public confidence in economy waning, ego opportunity viewed as finite or zero sum game
• The extent of and continuing increase in inequality in the United States greatly concerns me.. .I think it is appropriate to ask if this trend is compatible with values rooted in our nation's history, among them the high value Americans have traditionally placed on equality of opportunity
‐‐Janet Yellen, Federal Reserve Chairwoman
Slide 5 of 20
Is income inequality bad for population health?
Slide 6 of 31
Previous Literature
• Higher income inequality associated with all‐cause mortality, self‐rated health, depressive symptoms, hypertension, smoking, BMI, disability status
• Sensitive to geographic scale and lag effects– Strongest evidence of association at state‐level– Evidence of 15+ year time lag
Slide 7 of 31
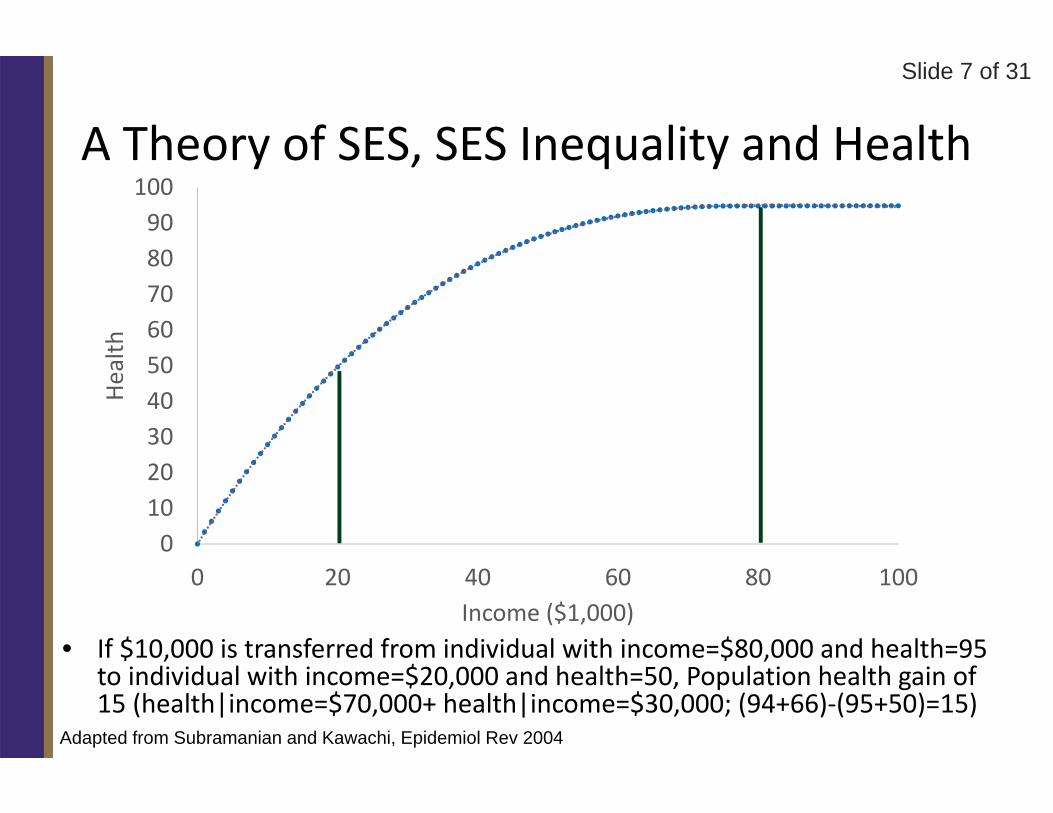
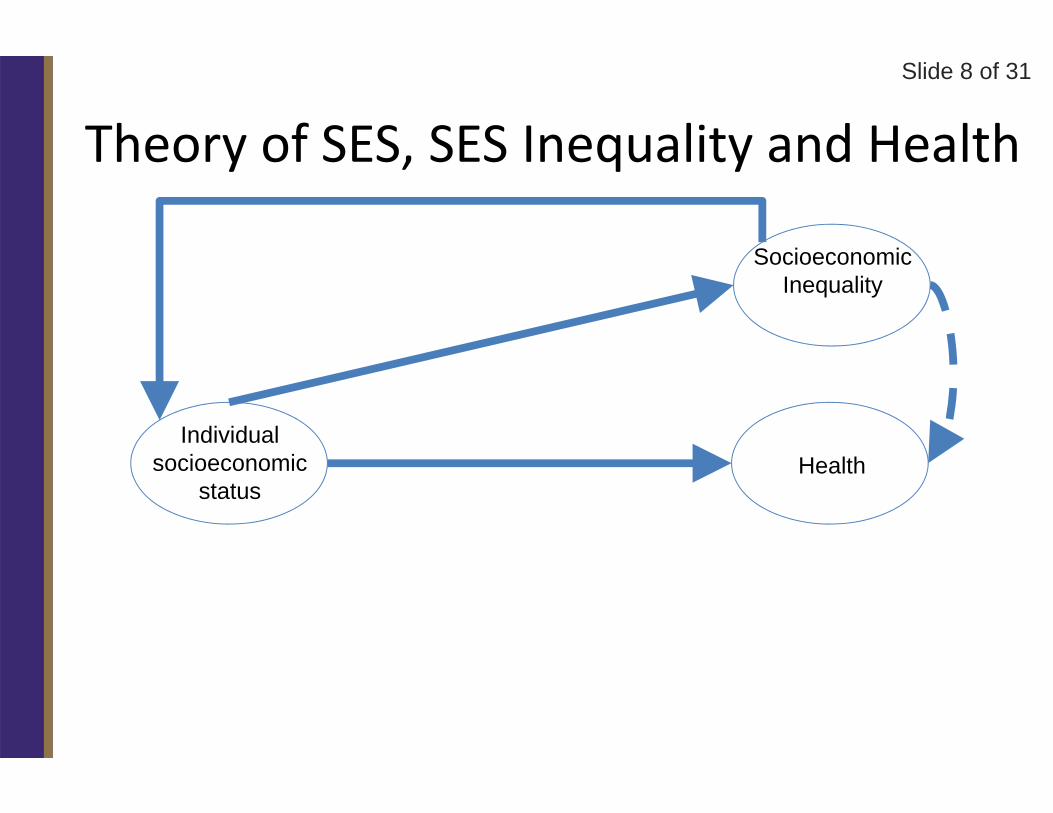
A Theory of SES, SES Inequality and Health
• If $10,000 is transferred from individual with income=$80,000 and health=95 to individual with income=$20,000 and health=50, Population health gain of 15 (health|income=$70,000+ health|income=$30,000; (94+66)‐(95+50)=15)
Adapted from Subramanian and Kawachi, Epidemiol Rev 2004
0102030405060708090100
0 20 40 60 80 100
Health
Income ($1,000)
Slide 8 of 31
Theory of SES, SES Inequality and Health
Individual socioeconomic
statusHealth
Socioeconomic Inequality
Slide 9 of 31
Measuring Income Inequality and Health
Jesse Plascak
Slide 10 of 31
A
0
10
20
30
40
50
60
70
80
90
100
0 10 20 30 40 50 60 70 80 90 100
Cumulative % of Incom
e
Cumulative % of Individuals
B
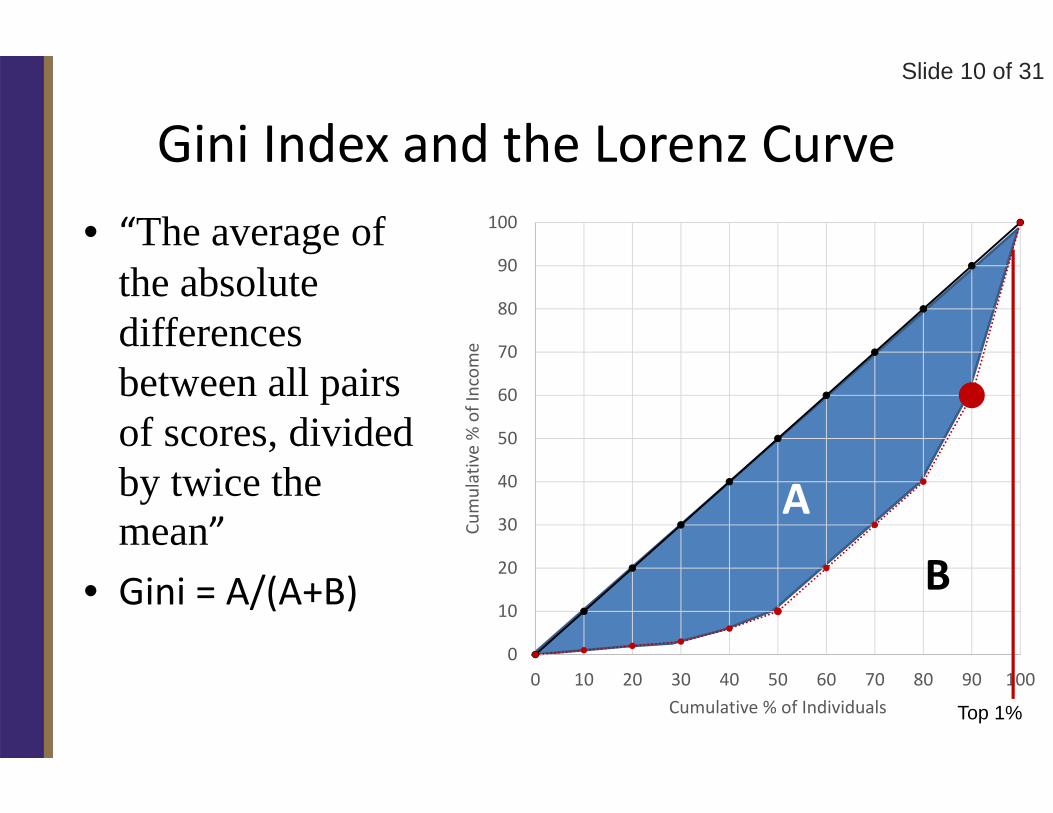
Gini Index and the Lorenz Curve• “The average of
the absolute differences between all pairs of scores, divided by twice the mean”
• Gini = A/(A+B)
Top 1%
Slide 11 of 31
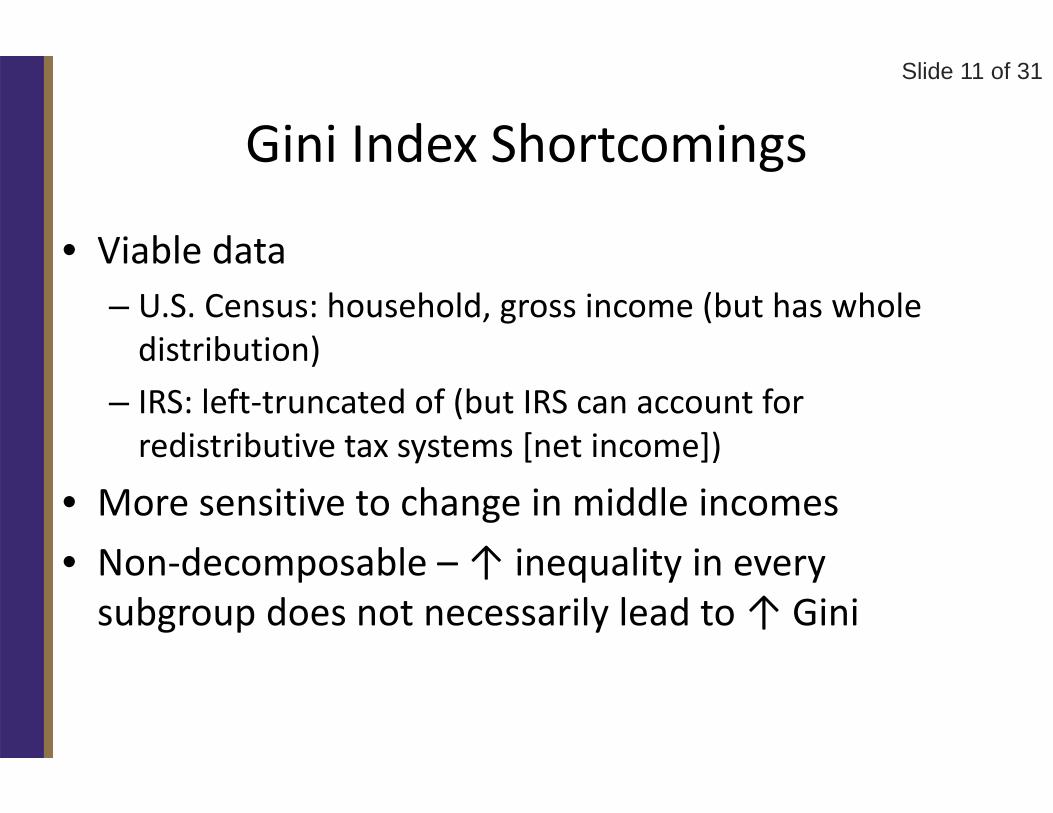
Gini Index Shortcomings
• Viable data– U.S. Census: household, gross income (but has whole distribution)
– IRS: left‐truncated of (but IRS can account for redistributive tax systems [net income])
• More sensitive to change in middle incomes• Non‐decomposable –↑ inequality in every subgroup does not necessarily lead to ↑ Gini
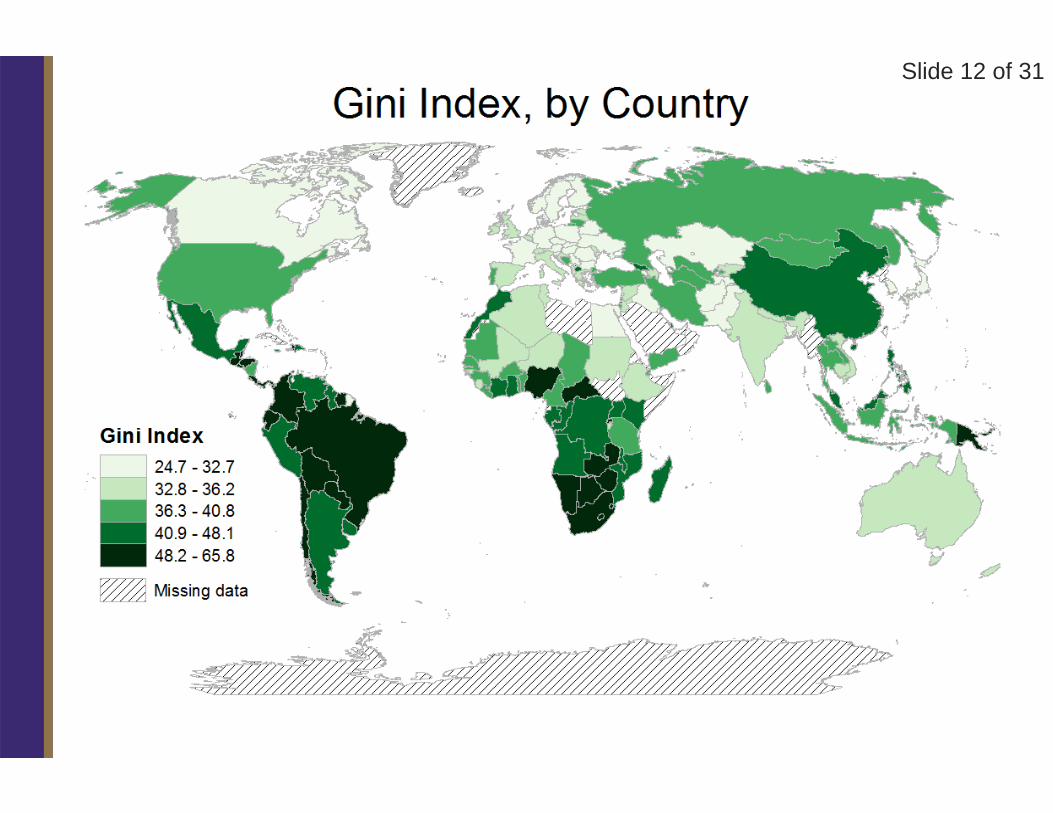
Slide 12 of 31
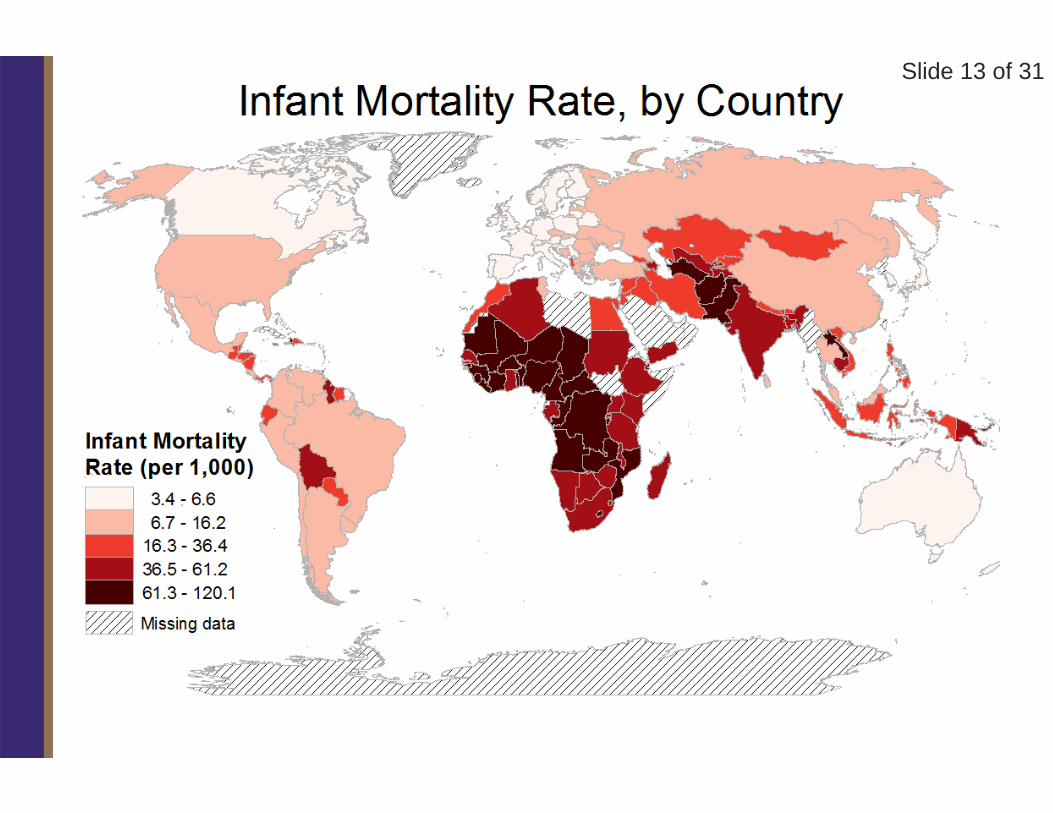
Slide 13 of 31
Slide 14 of 31
Trends in Income Inequality and Health
Shirley Beresford
Slide 15 of 31
0
5
10
15
20
25
30
35
40
45
50
1910 1920 1930 1940 1950 1960 1970 1980 1990 2000 2010 2020
% OF PR
E‐TA
X INCO
ME HELD BY TO
P 1%
YEAR
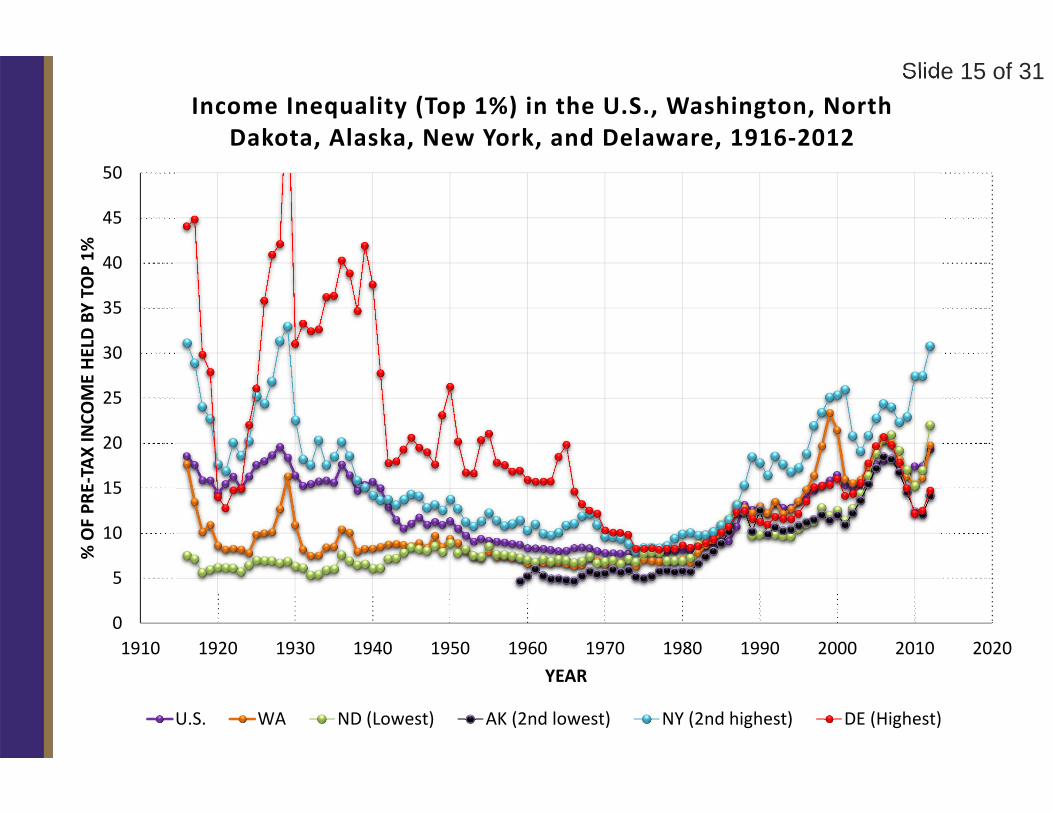
Income Inequality (Top 1%) in the U.S., Washington, North Dakota, Alaska, New York, and Delaware, 1916‐2012
U.S. WA ND (Lowest) AK (2nd lowest) NY (2nd highest) DE (Highest)
Slide 16 of 31
0
2
4
6
8
10
12
14
16
18
20
4
80
1910 1920 1930 1940 1950 1960 1970 1980 1990 2000 2010 2020
% OF PR
E‐TA
X INCO
ME HELD BY TO
P 1%
LOG IN
FANT MORTAL
ITY RA
TE (P
ER 1,000
)
YEAR
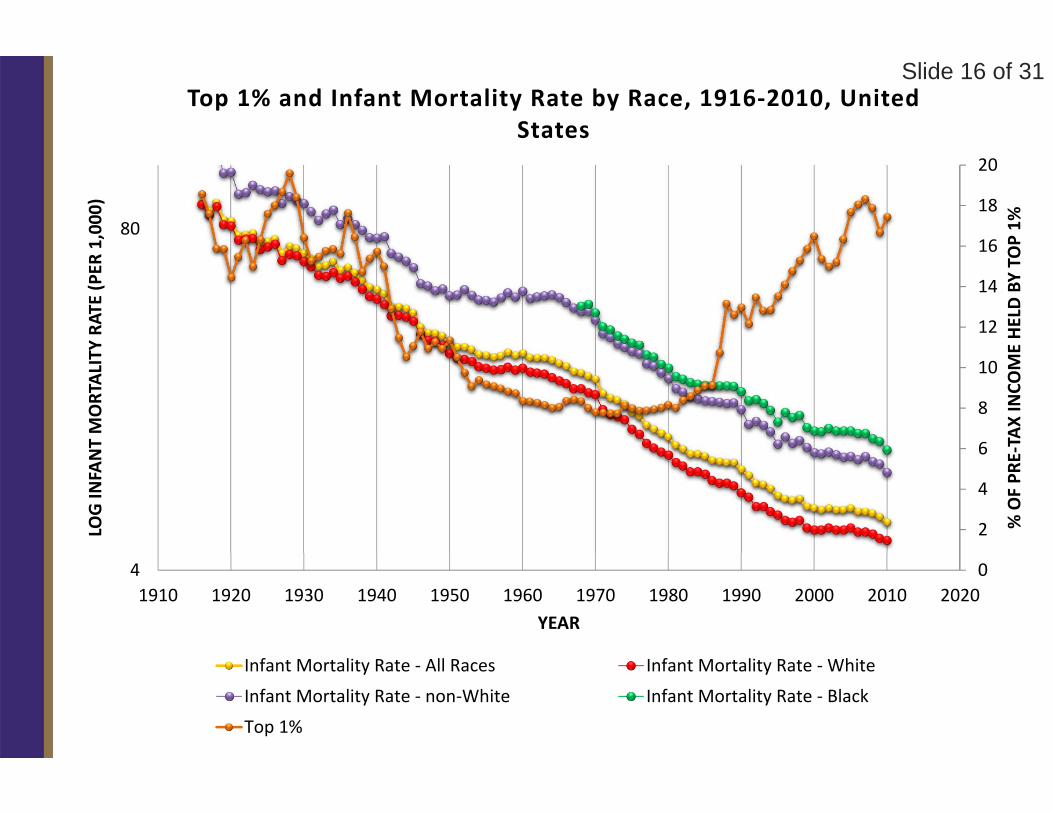
Top 1% and Infant Mortality Rate by Race, 1916‐2010, United States
Infant Mortality Rate ‐ All Races Infant Mortality Rate ‐ White
Infant Mortality Rate ‐ non‐White Infant Mortality Rate ‐ Black
Top 1%
Slide 17 of 20
0.33
0.35
0.37
0.39
0.41
0.43
0.45
1.7
1.8
1.9
2.0
2.1
2.2
2.3
2.4
2.5
2.6
2.7
1940 1950 1960 1970 1980 1990 2000 2010 2020
GINI INDEX
INFANT MORTAL
ITY EV
ENT RA
TE RAT
IO
YEAR
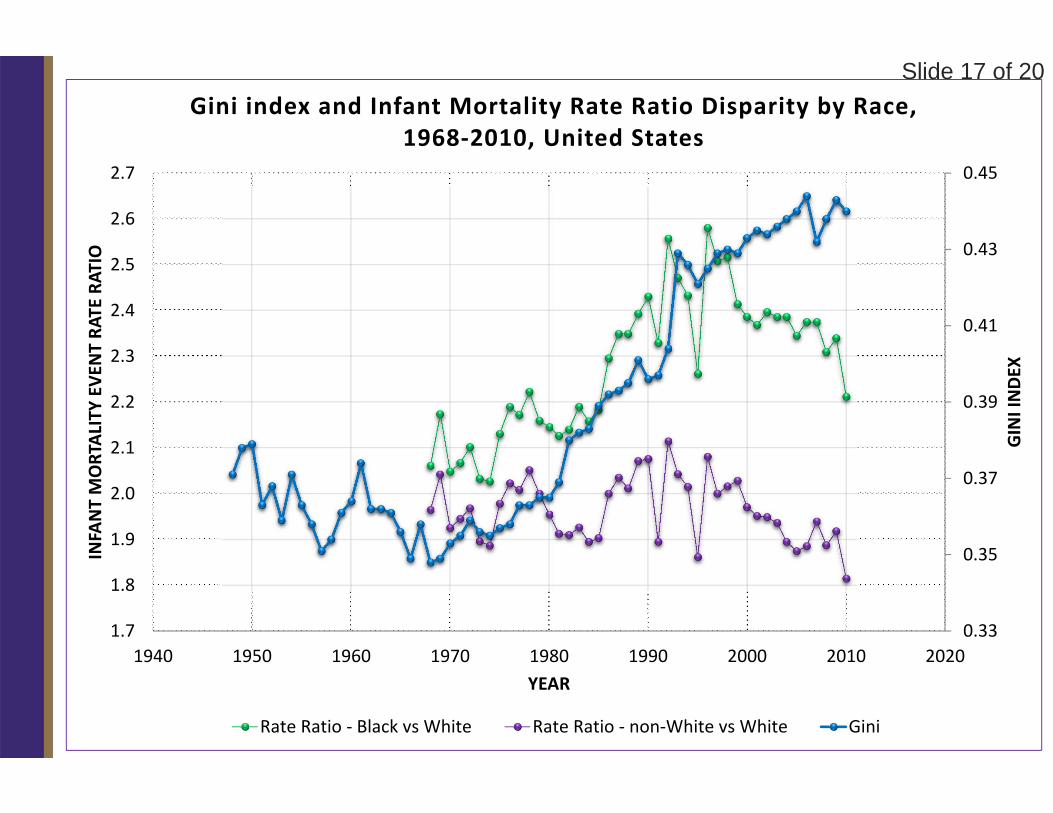
Gini index and Infant Mortality Rate Ratio Disparity by Race, 1968‐2010, United States
Rate Ratio ‐ Black vs White Rate Ratio ‐ non‐White vs White Gini
Slide 18 of 31
0
5
10
15
20
25
30
0.00
0.05
0.10
0.15
0.20
0.25
0.30
0.35
0.40
0.45
0.50
0.55
0.60
0.65
1910 1920 1930 1940 1950 1960 1970 1980 1990 2000 2010 2020
% OF PR
E‐TA
X INCO
ME HELD BY TO
P 1%
GINIINDEX
OF PR
E‐TA
X INCO
ME
YEAR
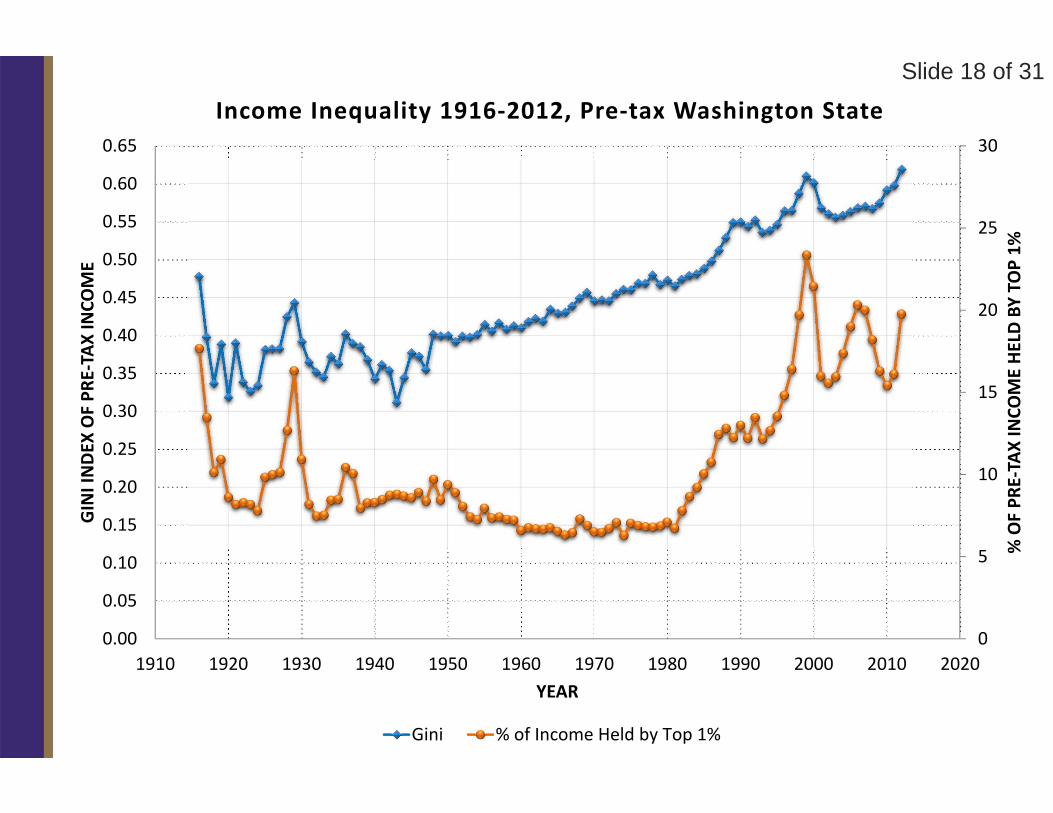
Income Inequality 1916‐2012, Pre‐tax Washington State
Gini % of Income Held by Top 1%
Slide 19 of 31
0
5
10
15
20
25
30
0
10
20
30
40
50
60
70
1910 1920 1930 1940 1950 1960 1970 1980 1990 2000 2010 2020
% OF PR
E‐TA
X INCO
ME HELD BY TO
P 1%
INFANT MORTAL
ITY RA
TE (P
ER 1,000
)
YEAR
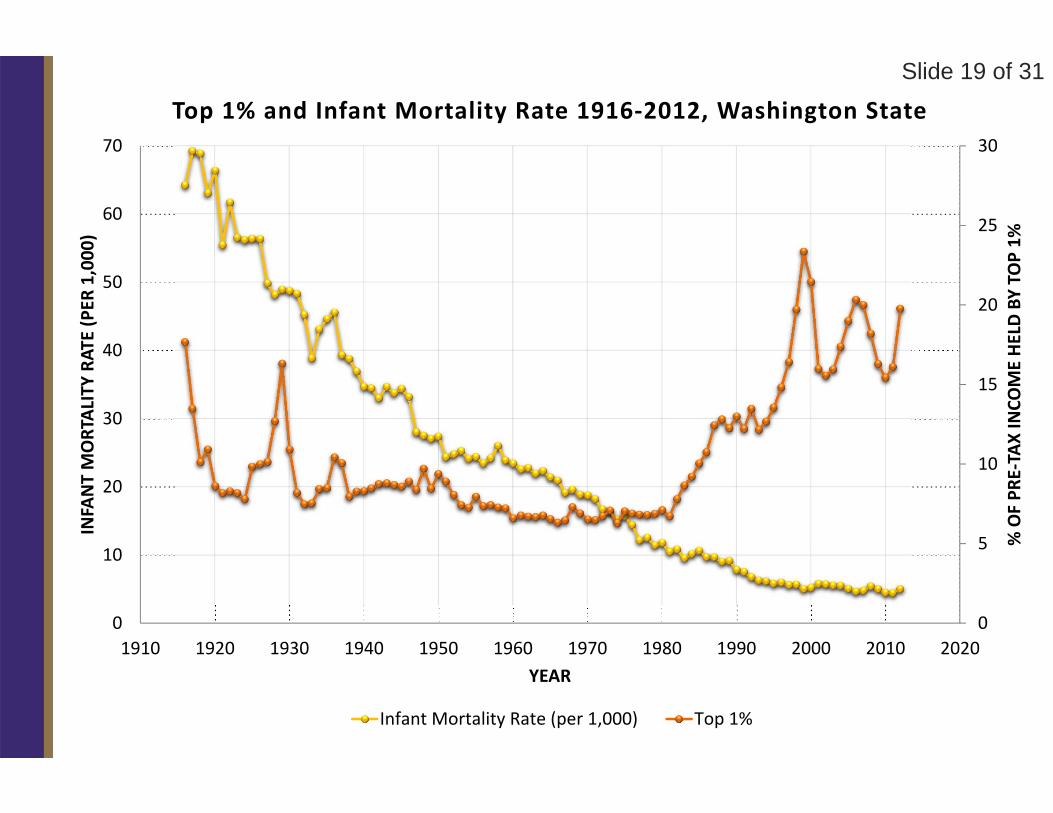
Top 1% and Infant Mortality Rate 1916‐2012, Washington State
Infant Mortality Rate (per 1,000) Top 1%
Slide 20 of 31
0.30
0.35
0.40
0.45
0.50
0.55
0.60
0.65
0
10
20
30
40
50
60
70
1910 1920 1930 1940 1950 1960 1970 1980 1990 2000 2010 2020
GINI INDEX
INFANT MORTAL
ITY RA
TE (P
ER 1,000
)
YEAR
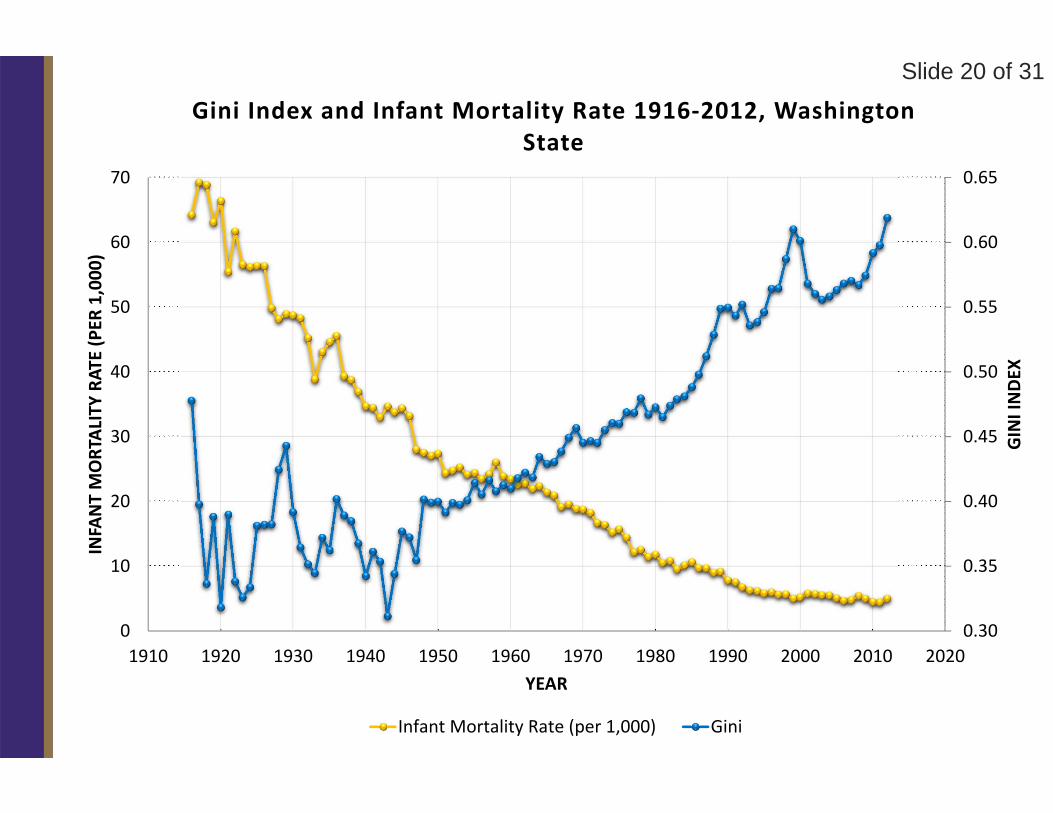
Gini Index and Infant Mortality Rate 1916‐2012, Washington State
Infant Mortality Rate (per 1,000) Gini
Slide 21 of 31
0.30
0.35
0.40
0.45
0.50
0.55
0.60
0.65
1
10
100
1910 1920 1930 1940 1950 1960 1970 1980 1990 2000 2010 2020
GINI INDEX
LOG IN
FANT MORTAL
ITY RA
TE (P
ER 1,000
)
YEAR
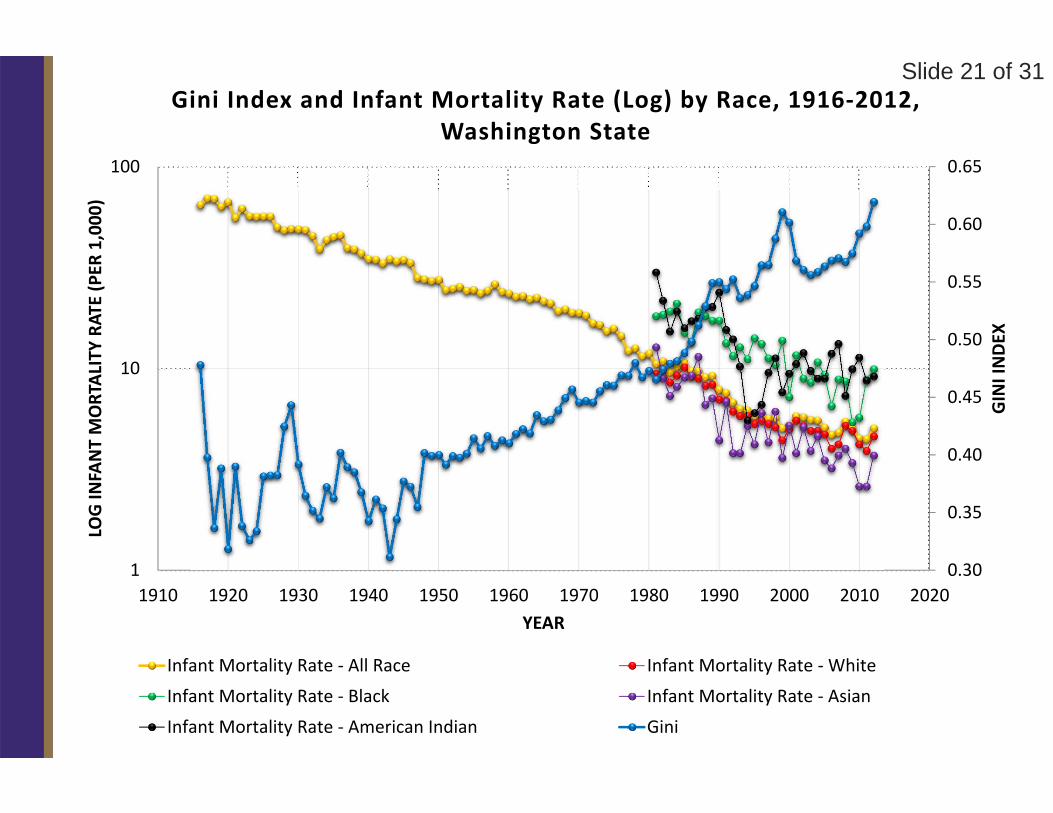
Gini Index and Infant Mortality Rate (Log) by Race, 1916‐2012, Washington State
Infant Mortality Rate ‐ All Race Infant Mortality Rate ‐ White
Infant Mortality Rate ‐ Black Infant Mortality Rate ‐ Asian
Infant Mortality Rate ‐ American Indian Gini
Slide 22 of 31
0.30
0.32
0.34
0.36
0.38
0.40
0.42
0.44
0.46
0.48
0.50
12.0
12.5
13.0
13.5
14.0
14.5
15.0
1999 2009
GINI INDEX
% POOR/FAIR HEA
LTH
YEAR
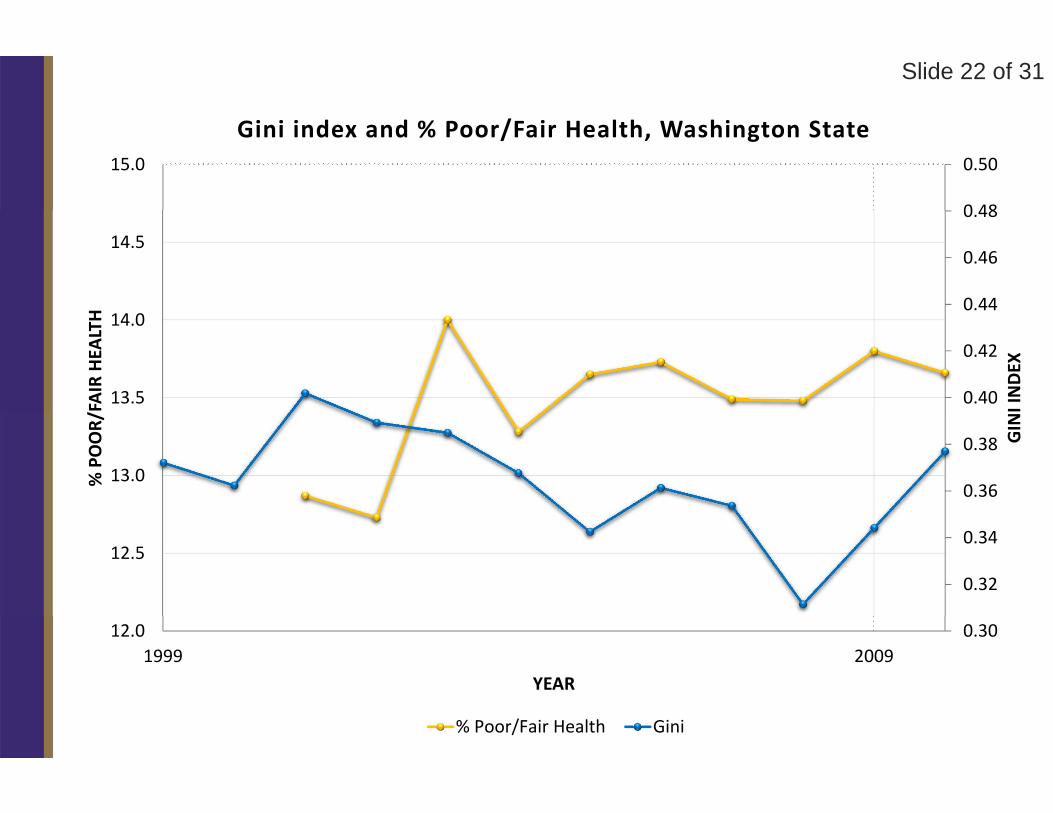
Gini index and % Poor/Fair Health, Washington State
% Poor/Fair Health Gini
Slide 23 of 31
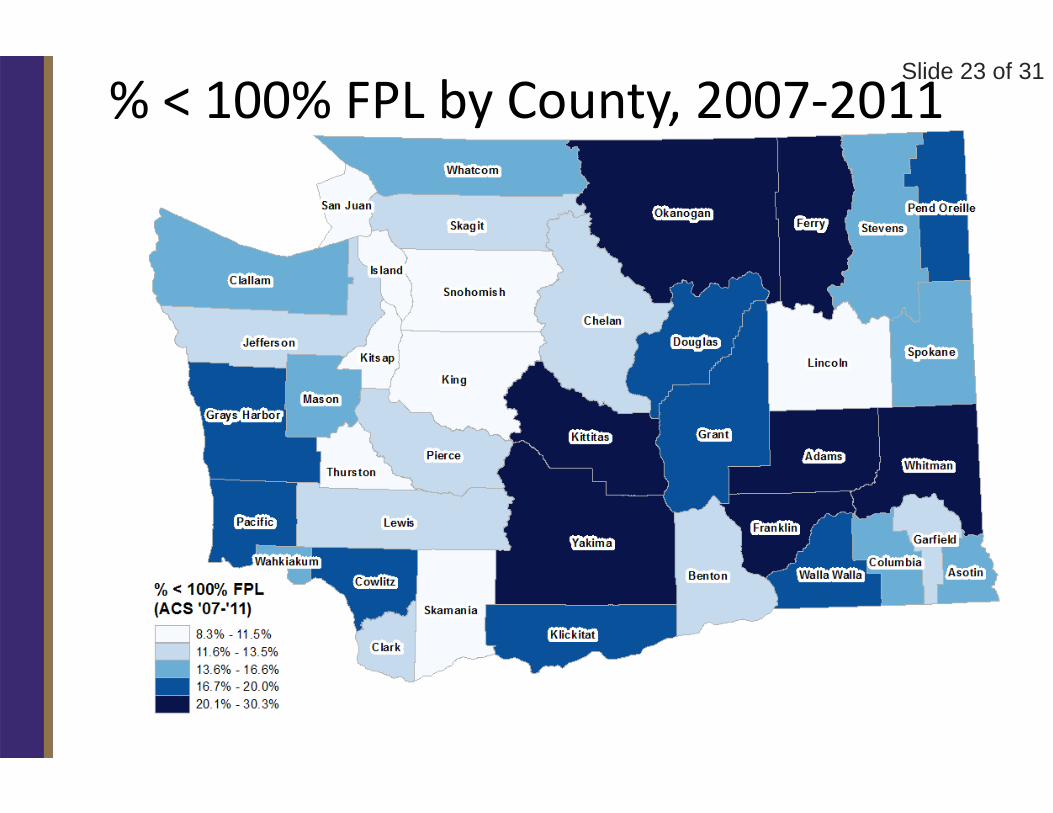
% < 100% FPL by County, 2007‐2011
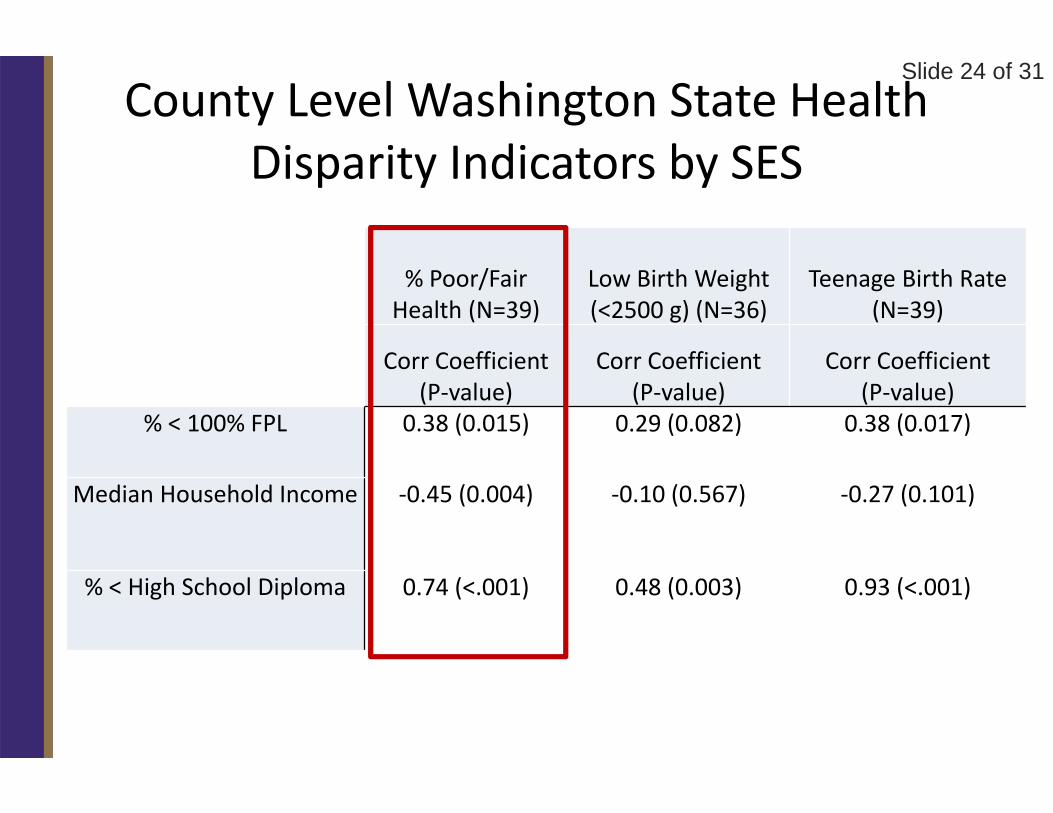
Slide 24 of 31County Level Washington State Health
Disparity Indicators by SES
% Poor/Fair Health (N=39)
Low Birth Weight (<2500 g) (N=36)
Teenage Birth Rate (N=39)
Corr Coefficient (P‐value)
Corr Coefficient(P‐value)
Corr Coefficient (P‐value)
% < 100% FPL 0.38 (0.015) 0.29 (0.082) 0.38 (0.017)
Median Household Income ‐0.45 (0.004) ‐0.10 (0.567) ‐0.27 (0.101)
% < High School Diploma 0.74 (<.001) 0.48 (0.003) 0.93 (<.001)
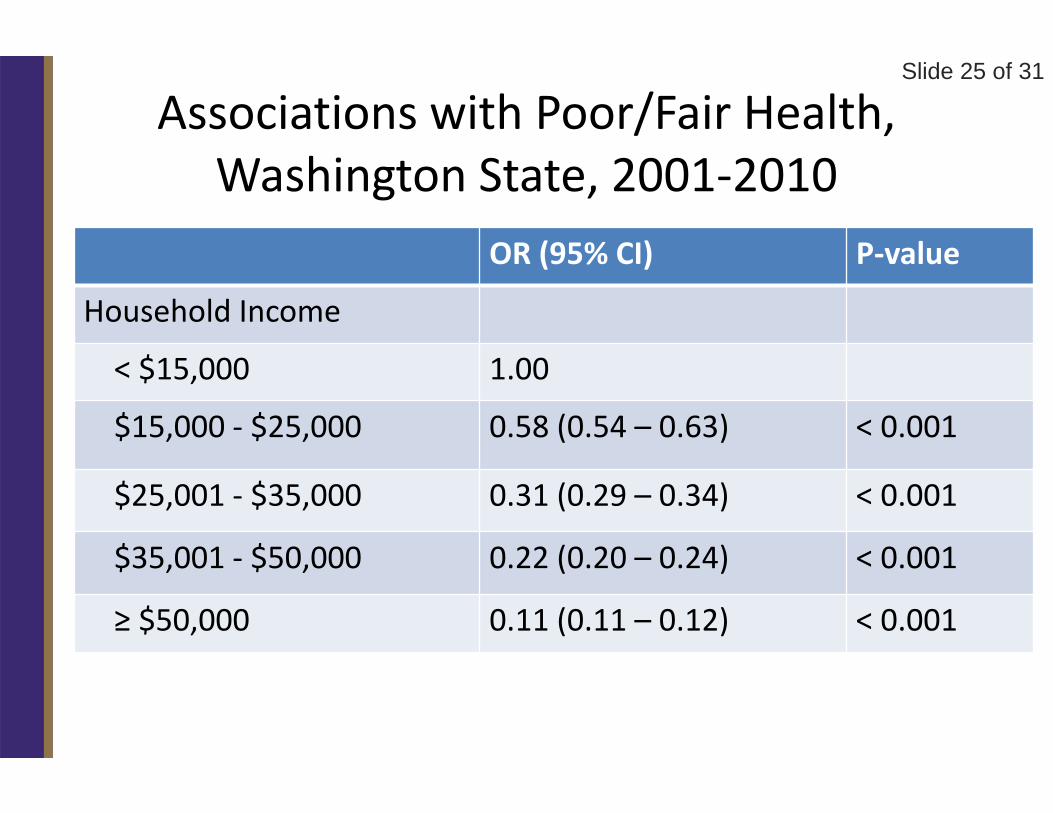
Slide 25 of 31
Associations with Poor/Fair Health, Washington State, 2001‐2010
OR (95% CI) P‐value
Household Income
< $15,000 1.00
$15,000 ‐ $25,000 0.58 (0.54 – 0.63) < 0.001
$25,001 ‐ $35,000 0.31 (0.29 – 0.34) < 0.001
$35,001 ‐ $50,000 0.22 (0.20 – 0.24) < 0.001
≥ $50,000 0.11 (0.11 – 0.12) < 0.001
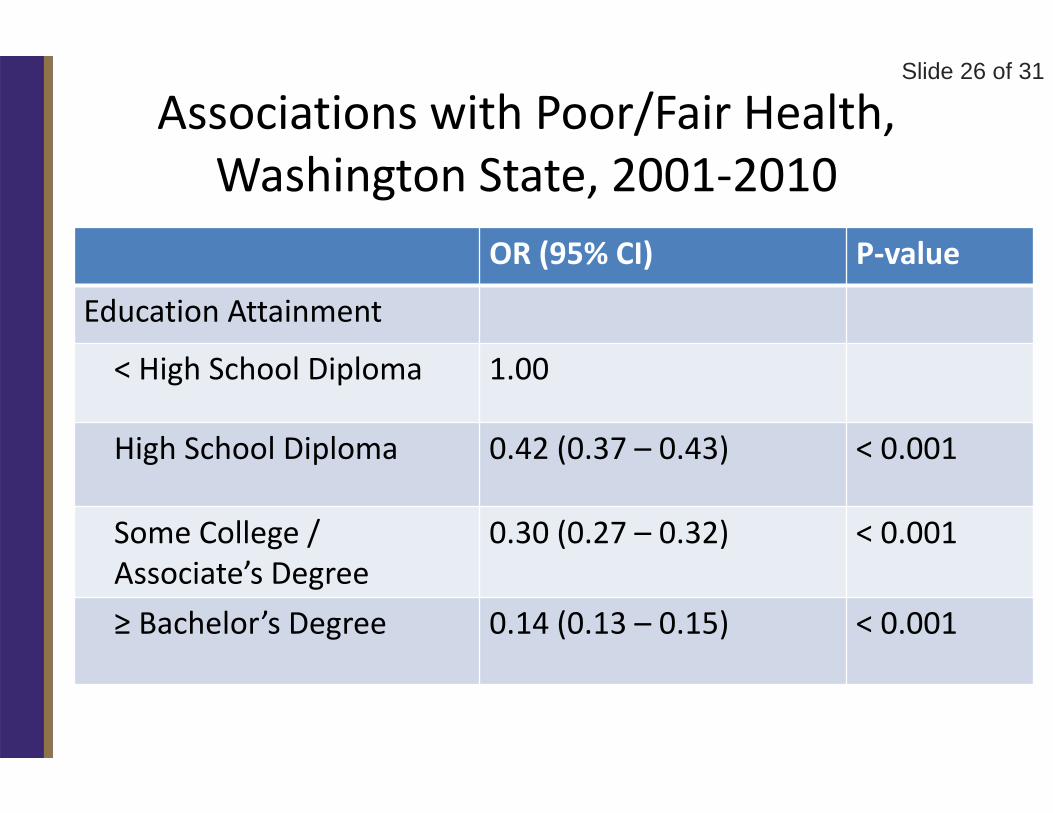
Slide 26 of 31
Associations with Poor/Fair Health, Washington State, 2001‐2010
OR (95% CI) P‐value
Education Attainment
< High School Diploma 1.00
High School Diploma 0.42 (0.37 – 0.43) < 0.001
Some College /Associate’s Degree
0.30 (0.27 – 0.32) < 0.001
≥ Bachelor’s Degree 0.14 (0.13 – 0.15) < 0.001

Slide 27 of 31
Conclusions and Discussion
Donald Patrick
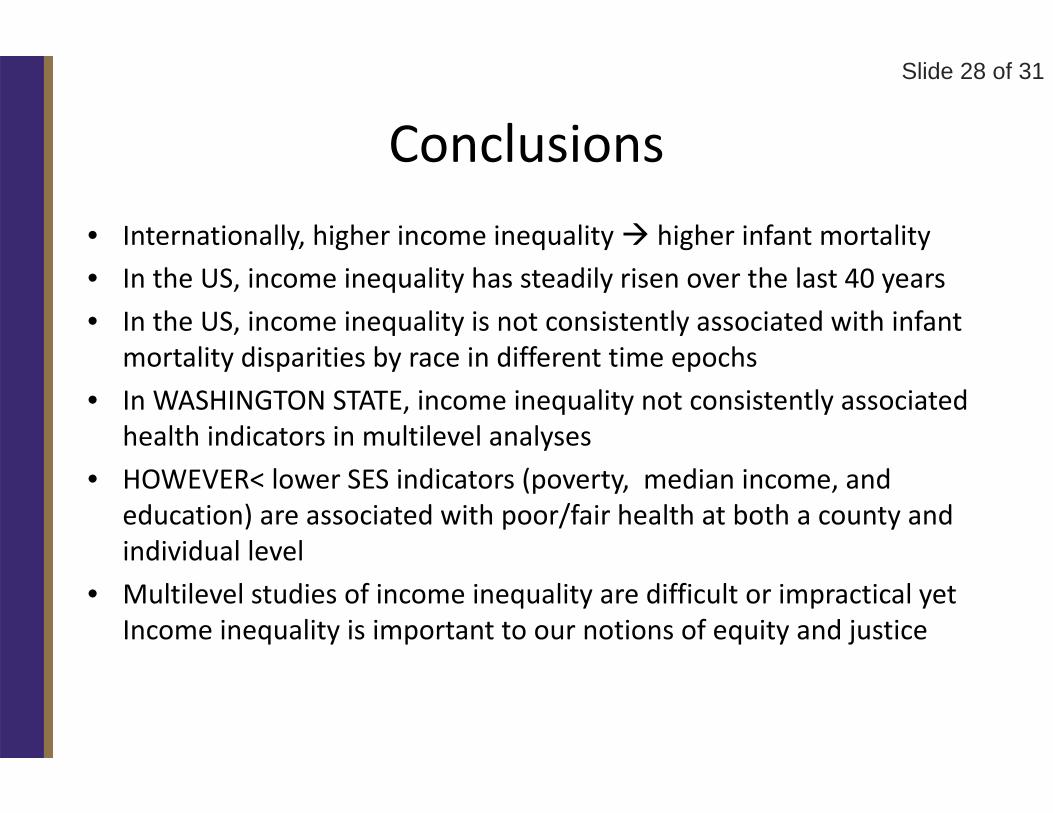
Slide 28 of 31
Conclusions• Internationally, higher income inequality higher infant mortality• In the US, income inequality has steadily risen over the last 40 years• In the US, income inequality is not consistently associated with infant
mortality disparities by race in different time epochs• In WASHINGTON STATE, income inequality not consistently associated
health indicators in multilevel analyses• HOWEVER< lower SES indicators (poverty, median income, and
education) are associated with poor/fair health at both a county and individual level
• Multilevel studies of income inequality are difficult or impractical yet Income inequality is important to our notions of equity and justice
Slide 29 of 31
Policy Implications
• Interventions at policy and individual level may be best directed toward reducing poverty and increasing education for all
• Distributive Justness: John Rawls– Each person as an equal right to the most extensive basic liberty compatible with a similar liberty for others
– Social and economic inequalities are to be arranged so they are to the greatest benefit to the least advantaged members of society
Slide 30 of 31
Data Sources• Internal Revenue Service ‐ household income inequality by year
– Mark Frank of Sam Houston State University (State data)– Immanuel Saez of University of California, Berkeley (U.S. data)
• U.S. Census Bureau American Community Survey– County‐level % < 100% federal poverty level, median household income, % < high school
diploma, income Gini– 2007‐2011
• Behavioral Risk Factor Surveillance System– Individual‐level % poor/fair health, household income, education attainment, age, sex– 2001‐2010
• National Center for Health Statistics– Infant mortality rate by race and year (U.S.)– Low birth rate, teenage birth rate 2005‐2011 (Washington State)
• Washington State Department of Health, Center for Health Statistics– Infant mortality rate by race and year
• The World Bank (international data)– Infant mortality and income Gini

Slide 31 of 31
Thank you!