Embed Size (px)
Citation preview
Section 2Income Sources
32 ♦ Income of the Population 55 or Older, 2012
Income Sources
Key Terms and Concepts for Section 2 1
Table characteristicsAge. Age classification is based on the age of the person at his or her last birthday as of March 2013. A married couple’s age is defined as the age of the husband—unless he is under age 55 and the wife is 55 or older, in which case it is the age of the wife.Aged unit. With age 55 as the cutoff, aged units are defined as married couples living together—at least one of whom is 55 or older—and non‑married persons 55 or older.Marital status. Married persons are married and living with their spouse. Nonmarried per‑sons may be divorced, widowed, never married, separated, or married but living apart from their spouse.Race. The categories White alone, Black alone, and Asian alone reflect respondents who reported only one race. Because of changes to the race category, data on race are not directly comparable to editions prior to 2002. A person’s race is his or her reported race. A married cou‑ple’s race is defined as the race of the husband.Hispanic origin. Persons of Hispanic origin may be of any race. A married couple is of His‑panic origin if the husband is of Hispanic origin.Family. A family is a group of two or more people (one of whom is the householder) related by birth, marriage, or adoption and residing together; all such people (including related sub‑family members) are considered as members of one family.Social Security beneficiary. A beneficiary may be receiving retired-worker benefits, depen‑dents’ or survivor benefits, disability benefits, or transitionally insured benefits.
Poverty. The Census Bureau uses a set of money income thresholds that vary by family size and composition to detect who is poor. If a family’s total income is less than that family’s threshold, then that family, and every individual in it, is considered poor.Per capita income. Per capita income is total family income divided by the number of persons in the family.The ratio of Social Security income to total income. This ratio is defined as Social Security income divided by total income. Units and persons in families with less than $1 of total income or negative earnings or asset income are excluded from these tables.
Income sources
EarningsWages and salaries. Wages and salaries is defined as total money earnings received for work performed as an employee during the income year. It includes wages, salary, Armed Forces pay, commissions, tips, piece‑rate pay‑ments, and cash bonuses earned, before deduc‑tions are made for taxes, bonds, pensions, union dues, and so forth. Earnings for self-employed persons in incorporated businesses are considered wage and salary.Self-employment. Income from self- employment is the combined income from farm and nonfarm self‑employment.
Retirement benefitsSocial Security. Includes retired-worker ben‑efits, dependents’ or survivor benefits, disability benefits, and transitionally insured benefits.
Government employee pensions. Govern‑ment employee pensions include regular pay‑ments from federal government (civil service), military, and state or local governments.Private pensions and annuities. Private pensions and annuities include regular pay‑ments from companies or unions, annuities or paid‑up insurance policies, individual retirement accounts (IRAs), Keogh, or 401(k) payments. Nonregular (nonannuitized or lump‑sum) with‑drawals from IRA, Keogh, and 401(k) plans are not included as income.
Asset incomeInterest income. Interest includes payments people receive (or have credited to their accounts) from bonds, treasury notes, IRAs, certificates of deposit, interest-bearing savings and checking accounts, and all other invest‑ments that pay interest.Dividends. Dividends include income people receive from stock holdings and mutual fund shares. The CPS does not include capital gains from the sale of stock holdings as income.Rents, royalties, and estates and trusts. Include net income people receive from the rental of a house, store, or other property, receipts from boarders or lodgers, net royalty income, and periodic payments from estate or trust funds.
Other incomeUnemployment compensation. Includes payments the respondent received from
1 For more information, consult the Glossary at the front of this publication.
Income of the Population 55 or Older, 2012 ♦ 33
Income Sources
government unemployment agencies or private companies during periods of unemployment and any strike benefits the respondent received from union funds.Workers’ compensation. Includes payments people receive periodically from public or private insurance companies for injuries received at work.Veterans’ payments. Include payments dis‑abled members of the armed forces or survivors of deceased veterans receive periodically from the Department of Veterans Affairs for educa‑tion and on‑the‑job training, and means‑tested assistance to veterans.Personal contributions. Include child support, alimony, and financial assistance from friends and relatives.
Public Assistance—Cash benefitsSupplemental Security Income. Supplemen‑tal Security Income includes payments made by federal, State, and local welfare agencies to low‑income persons who are aged (65 or older), blind, or disabled, and who have limited income and financial resources.Other Public Assistance. Includes cash public assistance payments low‑income people receive, such as Aid to Families with Dependent Children (AFDC, ADC), temporary assistance to needy families (TANF), general assistance, and emergency assistance.
Public Assistance—Noncash BenefitsNoncash benefits. Include SNAP benefits, energy assistance, and housing assistance. Receipt of noncash benefits is only reported in the section on the sources of income received. No dollar values are assigned to the noncash
benefits in this publication, and they are not included in total money income. A person or aged unit is indicated as having received a noncash benefit if any person in the household received food, energy, or housing assistance.Food. In this publication, food noncash benefits are comprised solely of SNAP benefits.Energy. The Low-Income Home Energy Assis‑tance Program provides financial assistance to qualified households to help them pay heating costs.Housing. There are some programs through which housing assistance is provided to low‑income families and individuals living in public or privately owned dwellings. Two of the more com‑mon types of programs in which federal, State, and local funds are used to subsidize private sector housing are rent supplement and interest reduction plans.
Income Sources of Aged Units
Total 65–69 70–74 75–79 80 or older
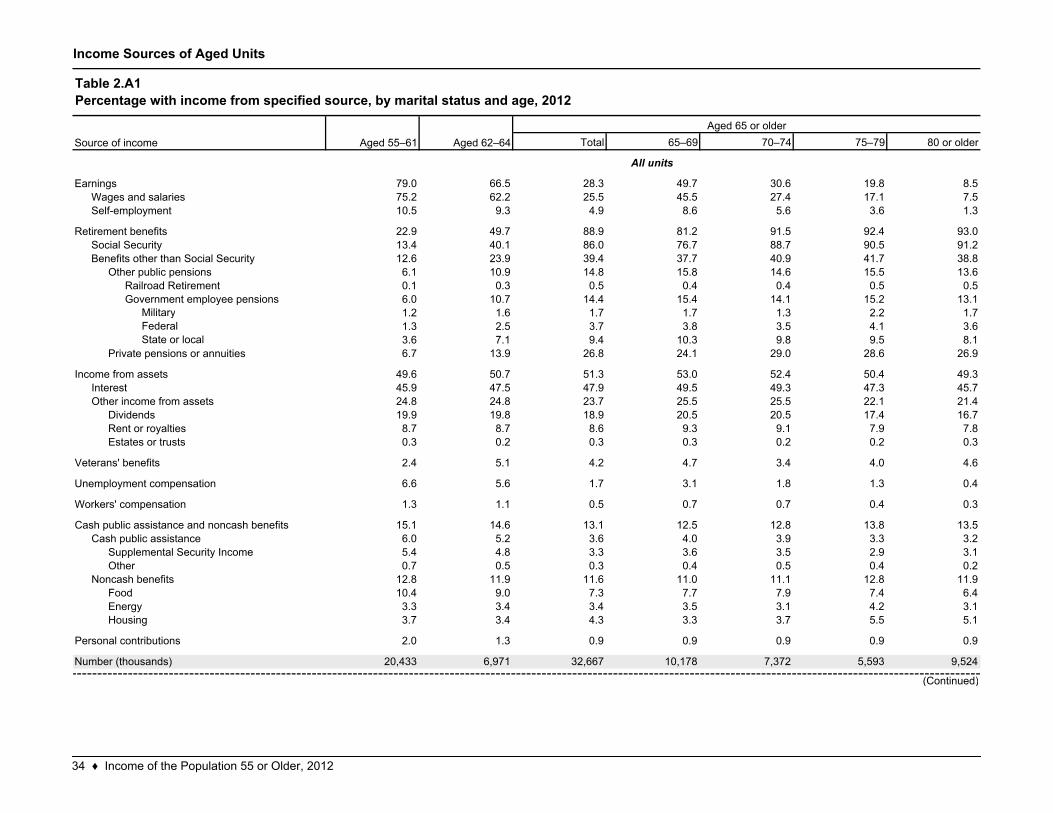
79.0 66.5 28.3 49.7 30.6 19.8 8.575.2 62.2 25.5 45.5 27.4 17.1 7.510.5 9.3 4.9 8.6 5.6 3.6 1.3
22.9 49.7 88.9 81.2 91.5 92.4 93.013.4 40.1 86.0 76.7 88.7 90.5 91.212.6 23.9 39.4 37.7 40.9 41.7 38.86.1 10.9 14.8 15.8 14.6 15.5 13.60.1 0.3 0.5 0.4 0.4 0.5 0.56.0 10.7 14.4 15.4 14.1 15.2 13.1
Military 1.2 1.6 1.7 1.7 1.3 2.2 1.7Federal 1.3 2.5 3.7 3.8 3.5 4.1 3.6State or local 3.6 7.1 9.4 10.3 9.8 9.5 8.1
6.7 13.9 26.8 24.1 29.0 28.6 26.9
49.6 50.7 51.3 53.0 52.4 50.4 49.345.9 47.5 47.9 49.5 49.3 47.3 45.724.8 24.8 23.7 25.5 25.5 22.1 21.419.9 19.8 18.9 20.5 20.5 17.4 16.78.7 8.7 8.6 9.3 9.1 7.9 7.80.3 0.2 0.3 0.3 0.2 0.2 0.3
2.4 5.1 4.2 4.7 3.4 4.0 4.6
6.6 5.6 1.7 3.1 1.8 1.3 0.4
1.3 1.1 0.5 0.7 0.7 0.4 0.3
15.1 14.6 13.1 12.5 12.8 13.8 13.56.0 5.2 3.6 4.0 3.9 3.3 3.25.4 4.8 3.3 3.6 3.5 2.9 3.10.7 0.5 0.3 0.4 0.5 0.4 0.2
12.8 11.9 11.6 11.0 11.1 12.8 11.910.4 9.0 7.3 7.7 7.9 7.4 6.43.3 3.4 3.4 3.5 3.1 4.2 3.13.7 3.4 4.3 3.3 3.7 5.5 5.1
2.0 1.3 0.9 0.9 0.9 0.9 0.9
20,433 6,971 32,667 10,178 7,372 5,593 9,524Number (thousands)
Source of income
EarningsWages and salariesSelf-employment
Retirement benefitsSocial SecurityBenefits other than Social Security
Unemployment compensation
All units
(Continued)
Other public pensionsRailroad RetirementGovernment employee pensions
Private pensions or annuities
Income from assets
Personal contributions
Other income from assetsDividendsRent or royaltiesEstates or trusts
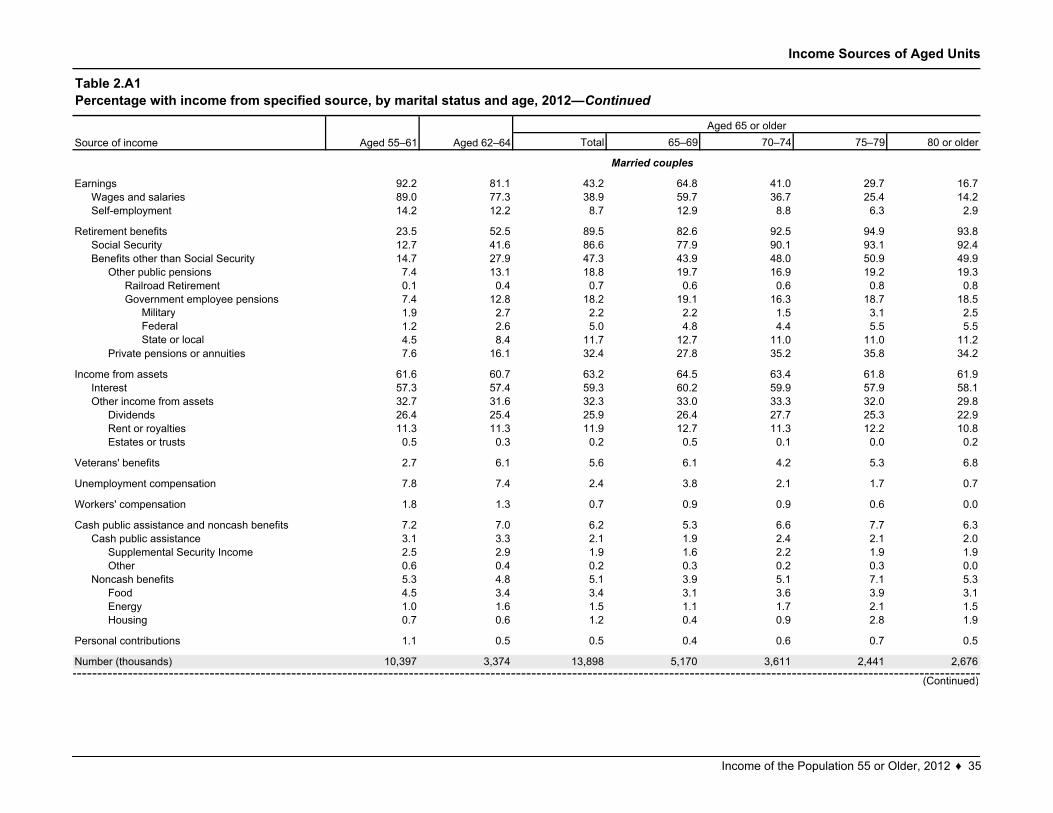
Table 2.A1Percentage with income from specified source, by marital status and age, 2012
Aged 55–61 Aged 62–64Aged 65 or older
Interest
Veterans' benefits
Workers' compensation
Cash public assistance and noncash benefitsCash public assistance
Supplemental Security IncomeOther
Noncash benefitsFoodEnergyHousing
34 ♦ Income of the Population 55 or Older, 2012
Income Sources of Aged Units
Total 65–69 70–74 75–79 80 or older
92.2 81.1 43.2 64.8 41.0 29.7 16.789.0 77.3 38.9 59.7 36.7 25.4 14.214.2 12.2 8.7 12.9 8.8 6.3 2.9
23.5 52.5 89.5 82.6 92.5 94.9 93.812.7 41.6 86.6 77.9 90.1 93.1 92.414.7 27.9 47.3 43.9 48.0 50.9 49.97.4 13.1 18.8 19.7 16.9 19.2 19.30.1 0.4 0.7 0.6 0.6 0.8 0.87.4 12.8 18.2 19.1 16.3 18.7 18.5
Military 1.9 2.7 2.2 2.2 1.5 3.1 2.5Federal 1.2 2.6 5.0 4.8 4.4 5.5 5.5State or local 4.5 8.4 11.7 12.7 11.0 11.0 11.2
7.6 16.1 32.4 27.8 35.2 35.8 34.2
61.6 60.7 63.2 64.5 63.4 61.8 61.957.3 57.4 59.3 60.2 59.9 57.9 58.132.7 31.6 32.3 33.0 33.3 32.0 29.826.4 25.4 25.9 26.4 27.7 25.3 22.911.3 11.3 11.9 12.7 11.3 12.2 10.80.5 0.3 0.2 0.5 0.1 0.0 0.2
2.7 6.1 5.6 6.1 4.2 5.3 6.8
7.8 7.4 2.4 3.8 2.1 1.7 0.7
1.8 1.3 0.7 0.9 0.9 0.6 0.0
7.2 7.0 6.2 5.3 6.6 7.7 6.33.1 3.3 2.1 1.9 2.4 2.1 2.02.5 2.9 1.9 1.6 2.2 1.9 1.90.6 0.4 0.2 0.3 0.2 0.3 0.05.3 4.8 5.1 3.9 5.1 7.1 5.34.5 3.4 3.4 3.1 3.6 3.9 3.11.0 1.6 1.5 1.1 1.7 2.1 1.50.7 0.6 1.2 0.4 0.9 2.8 1.9
1.1 0.5 0.5 0.4 0.6 0.7 0.5
10,397 3,374 13,898 5,170 3,611 2,441 2,676
Food
DividendsRent or royaltiesEstates or trusts
Veterans' benefits
Unemployment compensation
Workers' compensation
Cash public assistance and noncash benefitsCash public assistance
Supplemental Security IncomeOther
Noncash benefits
EnergyHousing
Personal contributions
Number (thousands)
Other income from assets
Wages and salariesSelf-employment
Retirement benefitsSocial SecurityBenefits other than Social Security
Other public pensionsRailroad RetirementGovernment employee pensions
Earnings
Private pensions or annuities
Income from assetsInterest
Table 2.A1Percentage with income from specified source, by marital status and age, 2012—Continued
Source of income Aged 55–61 Aged 62–64Aged 65 or older
(Continued)
Married couples
Income of the Population 55 or Older, 2012 ♦ 35
Income Sources of Aged Units
Total 65–69 70–74 75–79 80 or older
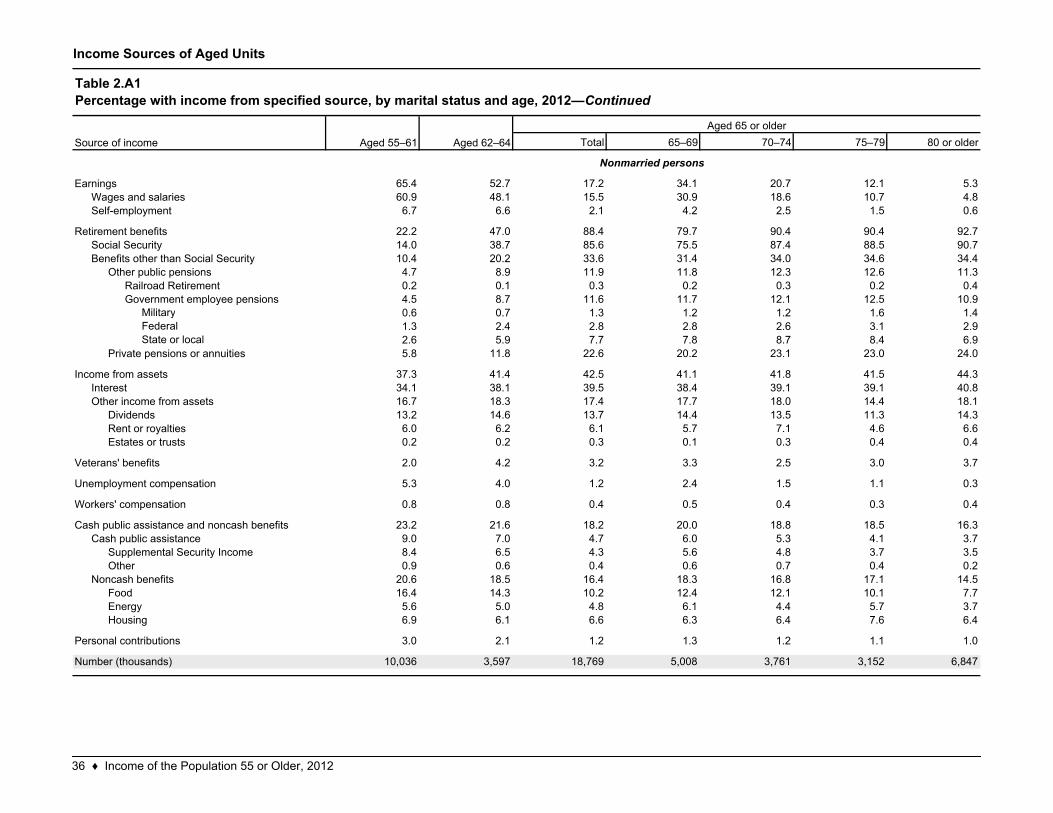
65.4 52.7 17.2 34.1 20.7 12.1 5.360.9 48.1 15.5 30.9 18.6 10.7 4.86.7 6.6 2.1 4.2 2.5 1.5 0.6
22.2 47.0 88.4 79.7 90.4 90.4 92.714.0 38.7 85.6 75.5 87.4 88.5 90.710.4 20.2 33.6 31.4 34.0 34.6 34.44.7 8.9 11.9 11.8 12.3 12.6 11.30.2 0.1 0.3 0.2 0.3 0.2 0.44.5 8.7 11.6 11.7 12.1 12.5 10.9
Military 0.6 0.7 1.3 1.2 1.2 1.6 1.4Federal 1.3 2.4 2.8 2.8 2.6 3.1 2.9State or local 2.6 5.9 7.7 7.8 8.7 8.4 6.9
5.8 11.8 22.6 20.2 23.1 23.0 24.0
37.3 41.4 42.5 41.1 41.8 41.5 44.334.1 38.1 39.5 38.4 39.1 39.1 40.816.7 18.3 17.4 17.7 18.0 14.4 18.113.2 14.6 13.7 14.4 13.5 11.3 14.36.0 6.2 6.1 5.7 7.1 4.6 6.60.2 0.2 0.3 0.1 0.3 0.4 0.4
2.0 4.2 3.2 3.3 2.5 3.0 3.7
5.3 4.0 1.2 2.4 1.5 1.1 0.3
0.8 0.8 0.4 0.5 0.4 0.3 0.4
23.2 21.6 18.2 20.0 18.8 18.5 16.39.0 7.0 4.7 6.0 5.3 4.1 3.78.4 6.5 4.3 5.6 4.8 3.7 3.50.9 0.6 0.4 0.6 0.7 0.4 0.2
20.6 18.5 16.4 18.3 16.8 17.1 14.516.4 14.3 10.2 12.4 12.1 10.1 7.75.6 5.0 4.8 6.1 4.4 5.7 3.76.9 6.1 6.6 6.3 6.4 7.6 6.4
3.0 2.1 1.2 1.3 1.2 1.1 1.0
10,036 3,597 18,769 5,008 3,761 3,152 6,847
Housing
Personal contributions
Cash public assistanceSupplemental Security IncomeOther
Noncash benefitsFoodEnergy
Number (thousands)
Other public pensions
Cash public assistance and noncash benefits
Government employee pensions
Private pensions or annuities
Income from assetsInterestOther income from assets
DividendsRent or royaltiesEstates or trusts
Railroad Retirement
Veterans' benefits
Unemployment compensation
Workers' compensation
Benefits other than Social Security
EarningsWages and salariesSelf-employment
Retirement benefitsSocial Security
Nonmarried persons
Table 2.A1Percentage with income from specified source, by marital status and age, 2012—Continued
Source of income Aged 55–61 Aged 62–64Aged 65 or older
36 ♦ Income of the Population 55 or Older, 2012
Income Sources of Aged Units
55–61 62–64 65 or older 55–61 62–64 65 or older 55–61 62–64 65 or older
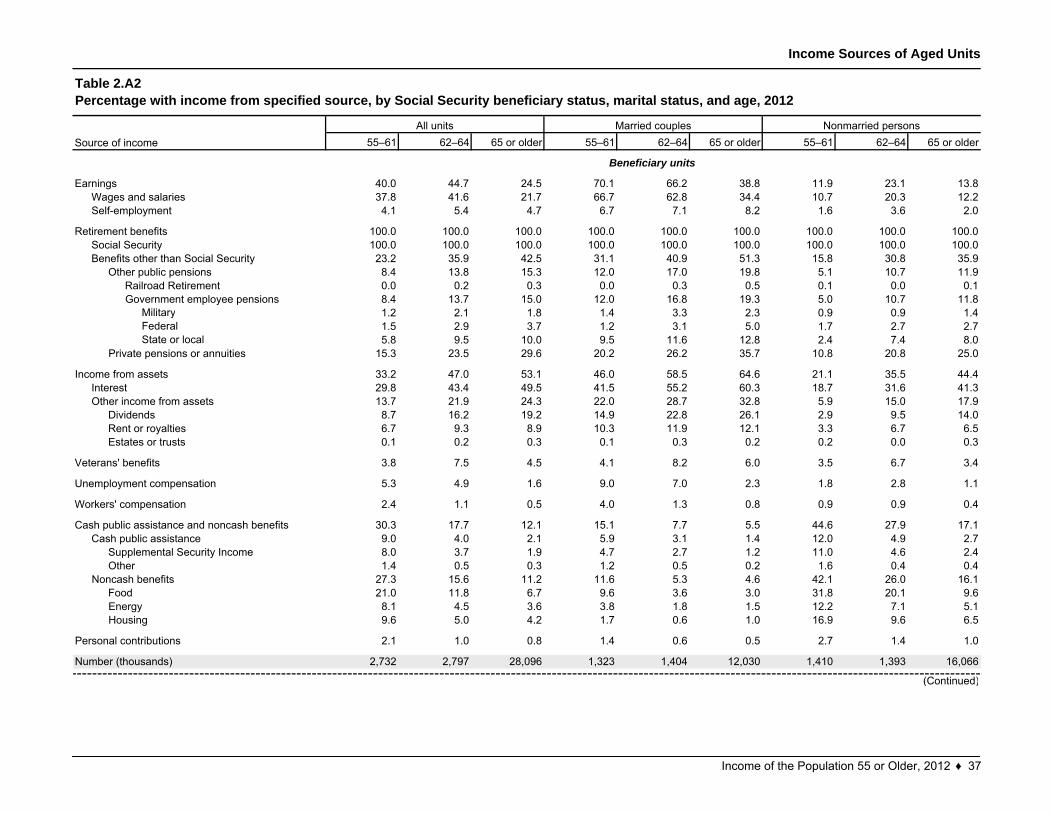
40.0 44.7 24.5 70.1 66.2 38.8 11.9 23.1 13.837.8 41.6 21.7 66.7 62.8 34.4 10.7 20.3 12.24.1 5.4 4.7 6.7 7.1 8.2 1.6 3.6 2.0
100.0 100.0 100.0 100.0 100.0 100.0 100.0 100.0 100.0100.0 100.0 100.0 100.0 100.0 100.0 100.0 100.0 100.023.2 35.9 42.5 31.1 40.9 51.3 15.8 30.8 35.98.4 13.8 15.3 12.0 17.0 19.8 5.1 10.7 11.90.0 0.2 0.3 0.0 0.3 0.5 0.1 0.0 0.18.4 13.7 15.0 12.0 16.8 19.3 5.0 10.7 11.8
Military 1.2 2.1 1.8 1.4 3.3 2.3 0.9 0.9 1.4Federal 1.5 2.9 3.7 1.2 3.1 5.0 1.7 2.7 2.7State or local 5.8 9.5 10.0 9.5 11.6 12.8 2.4 7.4 8.0
15.3 23.5 29.6 20.2 26.2 35.7 10.8 20.8 25.0
33.2 47.0 53.1 46.0 58.5 64.6 21.1 35.5 44.429.8 43.4 49.5 41.5 55.2 60.3 18.7 31.6 41.313.7 21.9 24.3 22.0 28.7 32.8 5.9 15.0 17.98.7 16.2 19.2 14.9 22.8 26.1 2.9 9.5 14.06.7 9.3 8.9 10.3 11.9 12.1 3.3 6.7 6.50.1 0.2 0.3 0.1 0.3 0.2 0.2 0.0 0.3
3.8 7.5 4.5 4.1 8.2 6.0 3.5 6.7 3.4
5.3 4.9 1.6 9.0 7.0 2.3 1.8 2.8 1.1
2.4 1.1 0.5 4.0 1.3 0.8 0.9 0.9 0.4
30.3 17.7 12.1 15.1 7.7 5.5 44.6 27.9 17.19.0 4.0 2.1 5.9 3.1 1.4 12.0 4.9 2.78.0 3.7 1.9 4.7 2.7 1.2 11.0 4.6 2.41.4 0.5 0.3 1.2 0.5 0.2 1.6 0.4 0.4
27.3 15.6 11.2 11.6 5.3 4.6 42.1 26.0 16.121.0 11.8 6.7 9.6 3.6 3.0 31.8 20.1 9.68.1 4.5 3.6 3.8 1.8 1.5 12.2 7.1 5.19.6 5.0 4.2 1.7 0.6 1.0 16.9 9.6 6.5
2.1 1.0 0.8 1.4 0.6 0.5 2.7 1.4 1.0
2,732 2,797 28,096 1,323 1,404 12,030 1,410 1,393 16,066
Noncash benefits
EnergyHousing
Personal contributions
Number (thousands)
Government employee pensions
Private pensions or annuities
Income from assets
(Continued)
Interest
Food
DividendsRent or royaltiesEstates or trusts
Veterans' benefits
Unemployment compensation
Workers' compensation
Cash public assistance and noncash benefitsCash public assistance
Supplemental Security IncomeOther
Table 2.A2Percentage with income from specified source, by Social Security beneficiary status, marital status, and age, 2012
All units Married couples Nonmarried personsSource of income
EarningsWages and salariesSelf-employment
Retirement benefitsSocial SecurityBenefits other than Social Security
Other public pensionsRailroad Retirement
Other income from assets
Beneficiary units
Income of the Population 55 or Older, 2012 ♦ 37
Income Sources of Aged Units
55–61 62–64 65 or older 55–61 62–64 65 or older 55–61 62–64 65 or older
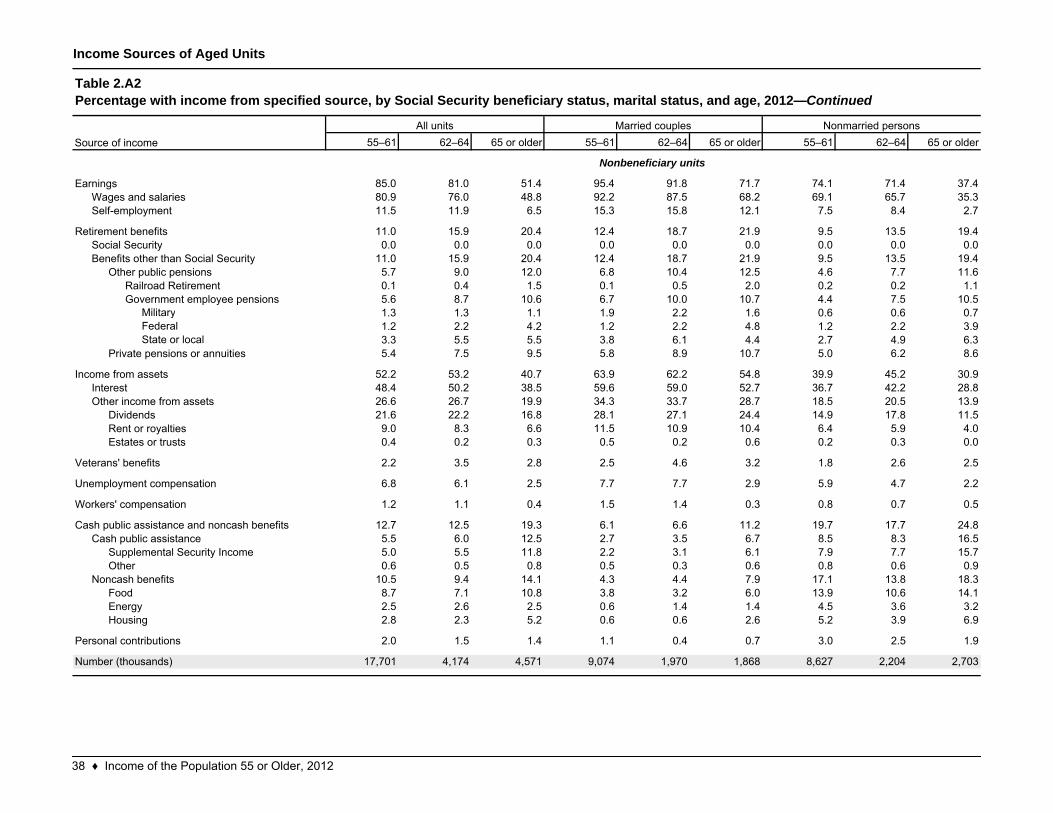
85.0 81.0 51.4 95.4 91.8 71.7 74.1 71.4 37.480.9 76.0 48.8 92.2 87.5 68.2 69.1 65.7 35.311.5 11.9 6.5 15.3 15.8 12.1 7.5 8.4 2.7
11.0 15.9 20.4 12.4 18.7 21.9 9.5 13.5 19.40.0 0.0 0.0 0.0 0.0 0.0 0.0 0.0 0.0
11.0 15.9 20.4 12.4 18.7 21.9 9.5 13.5 19.45.7 9.0 12.0 6.8 10.4 12.5 4.6 7.7 11.60.1 0.4 1.5 0.1 0.5 2.0 0.2 0.2 1.15.6 8.7 10.6 6.7 10.0 10.7 4.4 7.5 10.5
Military 1.3 1.3 1.1 1.9 2.2 1.6 0.6 0.6 0.7Federal 1.2 2.2 4.2 1.2 2.2 4.8 1.2 2.2 3.9State or local 3.3 5.5 5.5 3.8 6.1 4.4 2.7 4.9 6.3
5.4 7.5 9.5 5.8 8.9 10.7 5.0 6.2 8.6
52.2 53.2 40.7 63.9 62.2 54.8 39.9 45.2 30.948.4 50.2 38.5 59.6 59.0 52.7 36.7 42.2 28.826.6 26.7 19.9 34.3 33.7 28.7 18.5 20.5 13.921.6 22.2 16.8 28.1 27.1 24.4 14.9 17.8 11.59.0 8.3 6.6 11.5 10.9 10.4 6.4 5.9 4.00.4 0.2 0.3 0.5 0.2 0.6 0.2 0.3 0.0
2.2 3.5 2.8 2.5 4.6 3.2 1.8 2.6 2.5
6.8 6.1 2.5 7.7 7.7 2.9 5.9 4.7 2.2
1.2 1.1 0.4 1.5 1.4 0.3 0.8 0.7 0.5
12.7 12.5 19.3 6.1 6.6 11.2 19.7 17.7 24.85.5 6.0 12.5 2.7 3.5 6.7 8.5 8.3 16.55.0 5.5 11.8 2.2 3.1 6.1 7.9 7.7 15.70.6 0.5 0.8 0.5 0.3 0.6 0.8 0.6 0.9
10.5 9.4 14.1 4.3 4.4 7.9 17.1 13.8 18.38.7 7.1 10.8 3.8 3.2 6.0 13.9 10.6 14.12.5 2.6 2.5 0.6 1.4 1.4 4.5 3.6 3.22.8 2.3 5.2 0.6 0.6 2.6 5.2 3.9 6.9
2.0 1.5 1.4 1.1 0.4 0.7 3.0 2.5 1.9
17,701 4,174 4,571 9,074 1,970 1,868 8,627 2,204 2,703
Energy
Workers' compensation
Housing
Personal contributions
Number (thousands)
Cash public assistance and noncash benefitsCash public assistance
Supplemental Security IncomeOther
Noncash benefitsFood
Unemployment compensation
Self-employment
Retirement benefitsSocial SecurityBenefits other than Social Security
Other public pensions
Government employee pensions
Private pensions or annuities
Income from assetsInterestOther income from assets
DividendsRent or royaltiesEstates or trusts
Veterans' benefits
Railroad Retirement
EarningsWages and salaries
Table 2.A2Percentage with income from specified source, by Social Security beneficiary status, marital status, and age, 2012—Continued
Source of incomeAll units Married couples Nonmarried persons
Nonbeneficiary units
38 ♦ Income of the Population 55 or Older, 2012
Income Sources of Aged Units
55–61 62–64 65 or older 55–61 62–64 65 or older 55–61 62–64 65 or older 55–61 62–64 65 or older
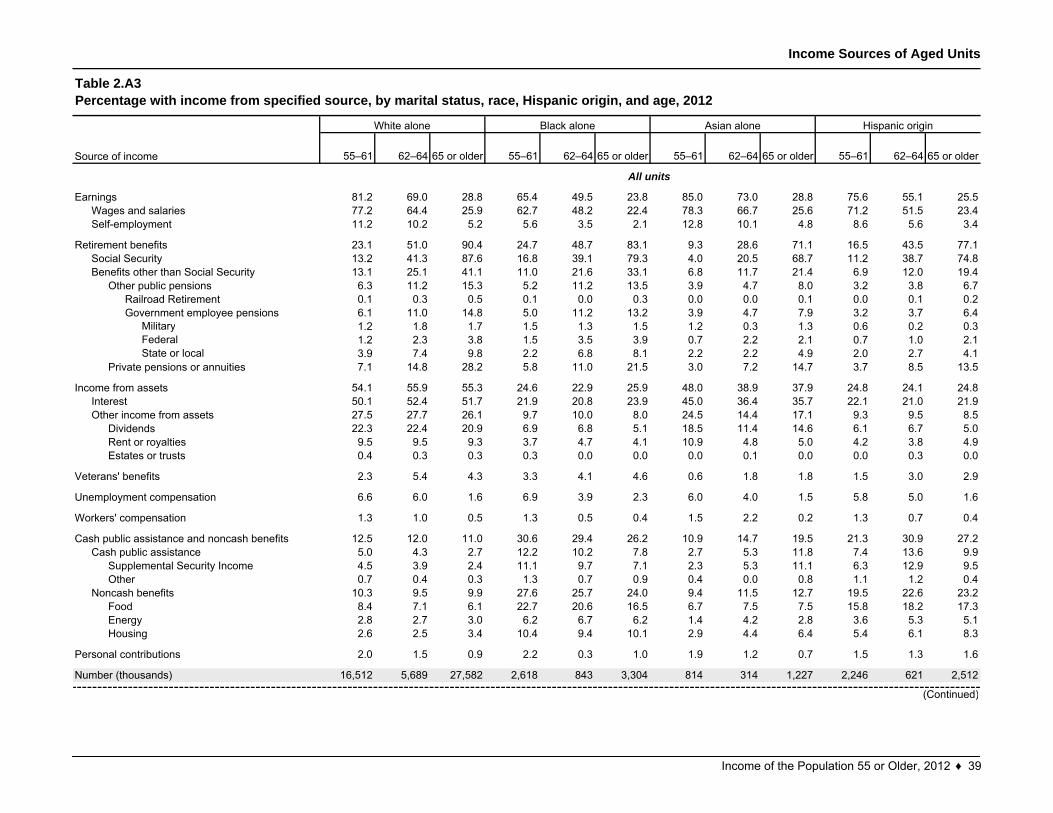
81.2 69.0 28.8 65.4 49.5 23.8 85.0 73.0 28.8 75.6 55.1 25.577.2 64.4 25.9 62.7 48.2 22.4 78.3 66.7 25.6 71.2 51.5 23.411.2 10.2 5.2 5.6 3.5 2.1 12.8 10.1 4.8 8.6 5.6 3.4
23.1 51.0 90.4 24.7 48.7 83.1 9.3 28.6 71.1 16.5 43.5 77.113.2 41.3 87.6 16.8 39.1 79.3 4.0 20.5 68.7 11.2 38.7 74.813.1 25.1 41.1 11.0 21.6 33.1 6.8 11.7 21.4 6.9 12.0 19.46.3 11.2 15.3 5.2 11.2 13.5 3.9 4.7 8.0 3.2 3.8 6.70.1 0.3 0.5 0.1 0.0 0.3 0.0 0.0 0.1 0.0 0.1 0.26.1 11.0 14.8 5.0 11.2 13.2 3.9 4.7 7.9 3.2 3.7 6.4
Military 1.2 1.8 1.7 1.5 1.3 1.5 1.2 0.3 1.3 0.6 0.2 0.3Federal 1.2 2.3 3.8 1.5 3.5 3.9 0.7 2.2 2.1 0.7 1.0 2.1State or local 3.9 7.4 9.8 2.2 6.8 8.1 2.2 2.2 4.9 2.0 2.7 4.1
7.1 14.8 28.2 5.8 11.0 21.5 3.0 7.2 14.7 3.7 8.5 13.5
54.1 55.9 55.3 24.6 22.9 25.9 48.0 38.9 37.9 24.8 24.1 24.850.1 52.4 51.7 21.9 20.8 23.9 45.0 36.4 35.7 22.1 21.0 21.927.5 27.7 26.1 9.7 10.0 8.0 24.5 14.4 17.1 9.3 9.5 8.522.3 22.4 20.9 6.9 6.8 5.1 18.5 11.4 14.6 6.1 6.7 5.09.5 9.5 9.3 3.7 4.7 4.1 10.9 4.8 5.0 4.2 3.8 4.90.4 0.3 0.3 0.3 0.0 0.0 0.0 0.1 0.0 0.0 0.3 0.0
2.3 5.4 4.3 3.3 4.1 4.6 0.6 1.8 1.8 1.5 3.0 2.9
6.6 6.0 1.6 6.9 3.9 2.3 6.0 4.0 1.5 5.8 5.0 1.6
1.3 1.0 0.5 1.3 0.5 0.4 1.5 2.2 0.2 1.3 0.7 0.4
12.5 12.0 11.0 30.6 29.4 26.2 10.9 14.7 19.5 21.3 30.9 27.25.0 4.3 2.7 12.2 10.2 7.8 2.7 5.3 11.8 7.4 13.6 9.94.5 3.9 2.4 11.1 9.7 7.1 2.3 5.3 11.1 6.3 12.9 9.50.7 0.4 0.3 1.3 0.7 0.9 0.4 0.0 0.8 1.1 1.2 0.4
10.3 9.5 9.9 27.6 25.7 24.0 9.4 11.5 12.7 19.5 22.6 23.28.4 7.1 6.1 22.7 20.6 16.5 6.7 7.5 7.5 15.8 18.2 17.32.8 2.7 3.0 6.2 6.7 6.2 1.4 4.2 2.8 3.6 5.3 5.12.6 2.5 3.4 10.4 9.4 10.1 2.9 4.4 6.4 5.4 6.1 8.3
2.0 1.5 0.9 2.2 0.3 1.0 1.9 1.2 0.7 1.5 1.3 1.6
16,512 5,689 27,582 2,618 843 3,304 814 314 1,227 2,246 621 2,512
Estates or trusts
Veterans' benefits
Workers' compensation
Cash public assistance and noncash benefitsCash public assistance
Supplemental Security IncomeOther
Noncash benefitsFood
Unemployment compensation
EnergyHousing
Personal contributions
Number (thousands)
Other income from assetsDividendsRent or royalties
All units
Other public pensionsRailroad RetirementGovernment employee pensions
Private pensions or annuities
Income from assets
Table 2.A3Percentage with income from specified source, by marital status, race, Hispanic origin, and age, 2012
White alone Black alone Asian alone Hispanic origin
Source of income
EarningsWages and salariesSelf-employment
Retirement benefitsSocial SecurityBenefits other than Social Security
(Continued)
Interest
Income of the Population 55 or Older, 2012 ♦ 39
Income Sources of Aged Units
55–61 62–64 65 or older 55–61 62–64 65 or older 55–61 62–64 65 or older 55–61 62–64 65 or older
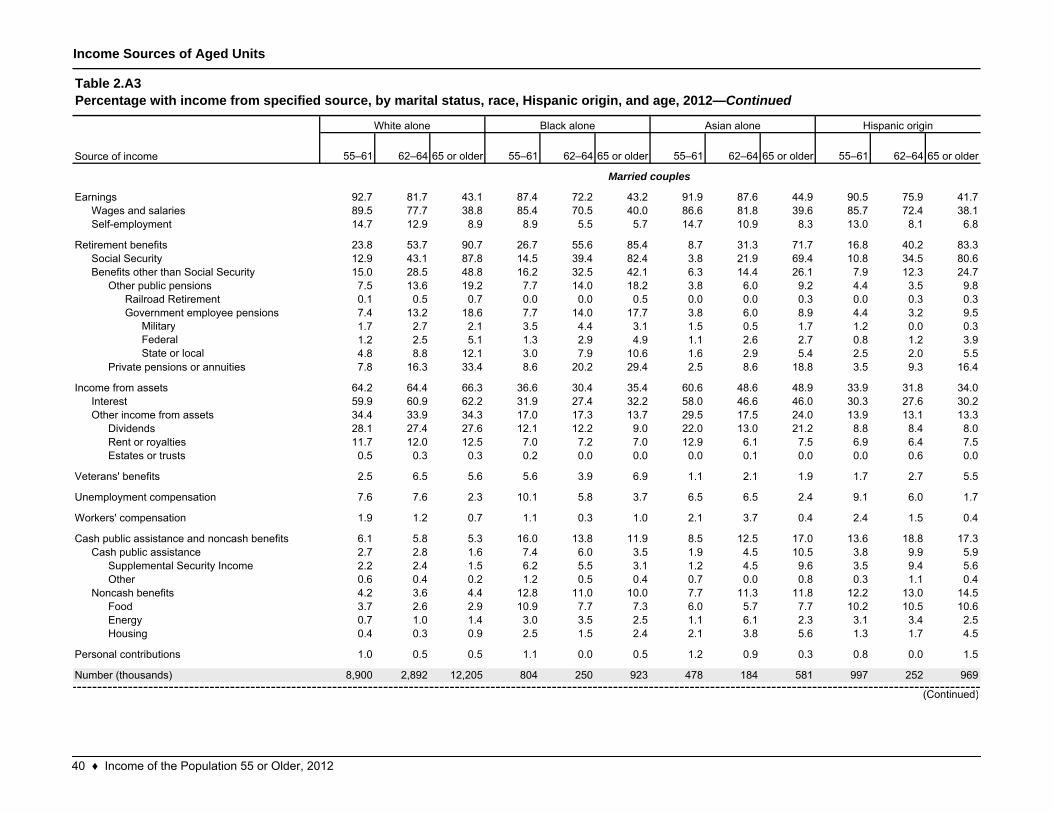
92.7 81.7 43.1 87.4 72.2 43.2 91.9 87.6 44.9 90.5 75.9 41.789.5 77.7 38.8 85.4 70.5 40.0 86.6 81.8 39.6 85.7 72.4 38.114.7 12.9 8.9 8.9 5.5 5.7 14.7 10.9 8.3 13.0 8.1 6.8
23.8 53.7 90.7 26.7 55.6 85.4 8.7 31.3 71.7 16.8 40.2 83.312.9 43.1 87.8 14.5 39.4 82.4 3.8 21.9 69.4 10.8 34.5 80.615.0 28.5 48.8 16.2 32.5 42.1 6.3 14.4 26.1 7.9 12.3 24.77.5 13.6 19.2 7.7 14.0 18.2 3.8 6.0 9.2 4.4 3.5 9.80.1 0.5 0.7 0.0 0.0 0.5 0.0 0.0 0.3 0.0 0.3 0.37.4 13.2 18.6 7.7 14.0 17.7 3.8 6.0 8.9 4.4 3.2 9.5
Military 1.7 2.7 2.1 3.5 4.4 3.1 1.5 0.5 1.7 1.2 0.0 0.3Federal 1.2 2.5 5.1 1.3 2.9 4.9 1.1 2.6 2.7 0.8 1.2 3.9State or local 4.8 8.8 12.1 3.0 7.9 10.6 1.6 2.9 5.4 2.5 2.0 5.5
7.8 16.3 33.4 8.6 20.2 29.4 2.5 8.6 18.8 3.5 9.3 16.4
64.2 64.4 66.3 36.6 30.4 35.4 60.6 48.6 48.9 33.9 31.8 34.059.9 60.9 62.2 31.9 27.4 32.2 58.0 46.6 46.0 30.3 27.6 30.234.4 33.9 34.3 17.0 17.3 13.7 29.5 17.5 24.0 13.9 13.1 13.328.1 27.4 27.6 12.1 12.2 9.0 22.0 13.0 21.2 8.8 8.4 8.011.7 12.0 12.5 7.0 7.2 7.0 12.9 6.1 7.5 6.9 6.4 7.50.5 0.3 0.3 0.2 0.0 0.0 0.0 0.1 0.0 0.0 0.6 0.0
2.5 6.5 5.6 5.6 3.9 6.9 1.1 2.1 1.9 1.7 2.7 5.5
7.6 7.6 2.3 10.1 5.8 3.7 6.5 6.5 2.4 9.1 6.0 1.7
1.9 1.2 0.7 1.1 0.3 1.0 2.1 3.7 0.4 2.4 1.5 0.4
6.1 5.8 5.3 16.0 13.8 11.9 8.5 12.5 17.0 13.6 18.8 17.32.7 2.8 1.6 7.4 6.0 3.5 1.9 4.5 10.5 3.8 9.9 5.92.2 2.4 1.5 6.2 5.5 3.1 1.2 4.5 9.6 3.5 9.4 5.60.6 0.4 0.2 1.2 0.5 0.4 0.7 0.0 0.8 0.3 1.1 0.44.2 3.6 4.4 12.8 11.0 10.0 7.7 11.3 11.8 12.2 13.0 14.53.7 2.6 2.9 10.9 7.7 7.3 6.0 5.7 7.7 10.2 10.5 10.60.7 1.0 1.4 3.0 3.5 2.5 1.1 6.1 2.3 3.1 3.4 2.50.4 0.3 0.9 2.5 1.5 2.4 2.1 3.8 5.6 1.3 1.7 4.5
1.0 0.5 0.5 1.1 0.0 0.5 1.2 0.9 0.3 0.8 0.0 1.5
8,900 2,892 12,205 804 250 923 478 184 581 997 252 969
OtherNoncash benefits
EnergyHousing
Personal contributions
Number (thousands)
Food
(Continued)
Supplemental Security Income
Other public pensionsRailroad RetirementGovernment employee pensions
Private pensions or annuities
Income from assetsInterest
DividendsRent or royaltiesEstates or trusts
Veterans' benefits
Unemployment compensation
Other income from assets
Wages and salariesSelf-employment
Retirement benefitsSocial SecurityBenefits other than Social Security
Workers' compensation
Cash public assistance and noncash benefitsCash public assistance
Earnings
Married couples
Table 2.A3Percentage with income from specified source, by marital status, race, Hispanic origin, and age, 2012—Continued
Source of income
White alone Black alone Asian alone Hispanic origin
40 ♦ Income of the Population 55 or Older, 2012
Income Sources of Aged Units
55–61 62–64 65 or older 55–61 62–64 65 or older 55–61 62–64 65 or older 55–61 62–64 65 or older
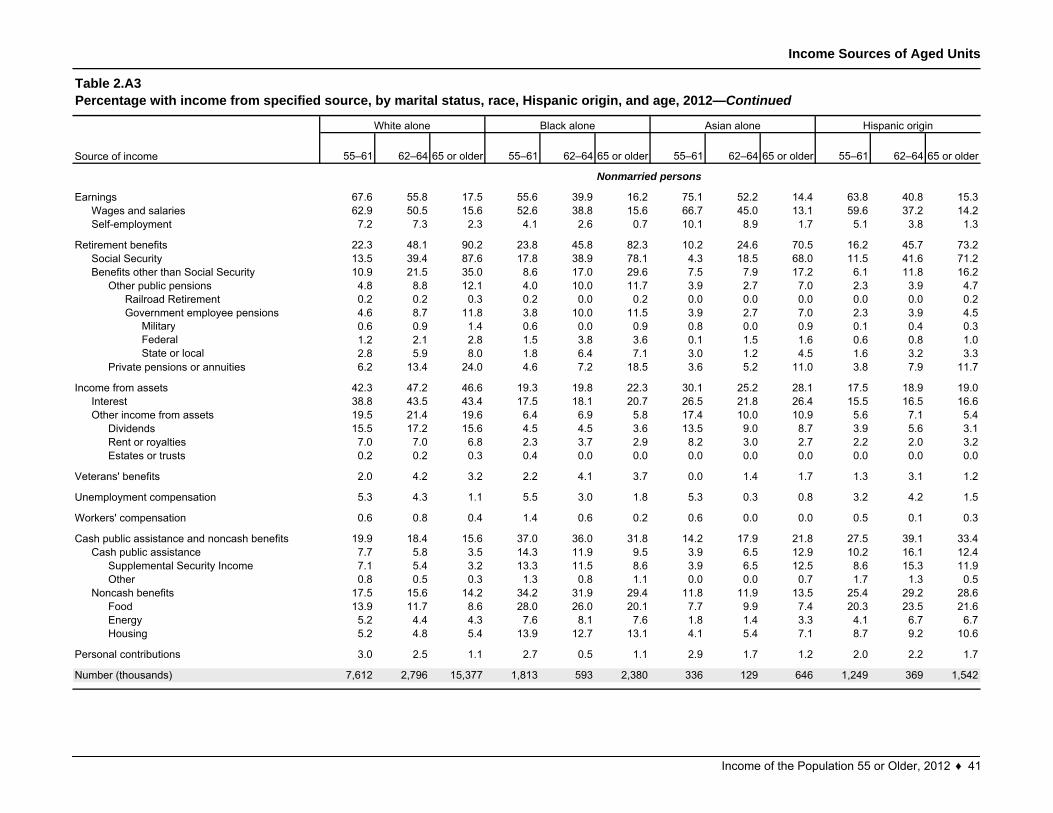
67.6 55.8 17.5 55.6 39.9 16.2 75.1 52.2 14.4 63.8 40.8 15.362.9 50.5 15.6 52.6 38.8 15.6 66.7 45.0 13.1 59.6 37.2 14.27.2 7.3 2.3 4.1 2.6 0.7 10.1 8.9 1.7 5.1 3.8 1.3
22.3 48.1 90.2 23.8 45.8 82.3 10.2 24.6 70.5 16.2 45.7 73.213.5 39.4 87.6 17.8 38.9 78.1 4.3 18.5 68.0 11.5 41.6 71.210.9 21.5 35.0 8.6 17.0 29.6 7.5 7.9 17.2 6.1 11.8 16.24.8 8.8 12.1 4.0 10.0 11.7 3.9 2.7 7.0 2.3 3.9 4.70.2 0.2 0.3 0.2 0.0 0.2 0.0 0.0 0.0 0.0 0.0 0.24.6 8.7 11.8 3.8 10.0 11.5 3.9 2.7 7.0 2.3 3.9 4.5
Military 0.6 0.9 1.4 0.6 0.0 0.9 0.8 0.0 0.9 0.1 0.4 0.3Federal 1.2 2.1 2.8 1.5 3.8 3.6 0.1 1.5 1.6 0.6 0.8 1.0State or local 2.8 5.9 8.0 1.8 6.4 7.1 3.0 1.2 4.5 1.6 3.2 3.3
6.2 13.4 24.0 4.6 7.2 18.5 3.6 5.2 11.0 3.8 7.9 11.7
42.3 47.2 46.6 19.3 19.8 22.3 30.1 25.2 28.1 17.5 18.9 19.038.8 43.5 43.4 17.5 18.1 20.7 26.5 21.8 26.4 15.5 16.5 16.619.5 21.4 19.6 6.4 6.9 5.8 17.4 10.0 10.9 5.6 7.1 5.415.5 17.2 15.6 4.5 4.5 3.6 13.5 9.0 8.7 3.9 5.6 3.17.0 7.0 6.8 2.3 3.7 2.9 8.2 3.0 2.7 2.2 2.0 3.20.2 0.2 0.3 0.4 0.0 0.0 0.0 0.0 0.0 0.0 0.0 0.0
2.0 4.2 3.2 2.2 4.1 3.7 0.0 1.4 1.7 1.3 3.1 1.2
5.3 4.3 1.1 5.5 3.0 1.8 5.3 0.3 0.8 3.2 4.2 1.5
0.6 0.8 0.4 1.4 0.6 0.2 0.6 0.0 0.0 0.5 0.1 0.3
19.9 18.4 15.6 37.0 36.0 31.8 14.2 17.9 21.8 27.5 39.1 33.47.7 5.8 3.5 14.3 11.9 9.5 3.9 6.5 12.9 10.2 16.1 12.47.1 5.4 3.2 13.3 11.5 8.6 3.9 6.5 12.5 8.6 15.3 11.90.8 0.5 0.3 1.3 0.8 1.1 0.0 0.0 0.7 1.7 1.3 0.5
17.5 15.6 14.2 34.2 31.9 29.4 11.8 11.9 13.5 25.4 29.2 28.613.9 11.7 8.6 28.0 26.0 20.1 7.7 9.9 7.4 20.3 23.5 21.65.2 4.4 4.3 7.6 8.1 7.6 1.8 1.4 3.3 4.1 6.7 6.75.2 4.8 5.4 13.9 12.7 13.1 4.1 5.4 7.1 8.7 9.2 10.6
3.0 2.5 1.1 2.7 0.5 1.1 2.9 1.7 1.2 2.0 2.2 1.7
7,612 2,796 15,377 1,813 593 2,380 336 129 646 1,249 369 1,542
Housing
Personal contributions
Number (thousands)
Cash public assistanceSupplemental Security IncomeOther
Noncash benefitsFoodEnergy
Cash public assistance and noncash benefits
Government employee pensions
Private pensions or annuities
Income from assetsInterestOther income from assets
Workers' compensation
Retirement benefitsSocial SecurityBenefits other than Social Security
Other public pensions
DividendsRent or royaltiesEstates or trusts
Veterans' benefits
Unemployment compensation
Railroad Retirement
EarningsWages and salariesSelf-employment
Table 2.A3Percentage with income from specified source, by marital status, race, Hispanic origin, and age, 2012—Continued
Source of income
White alone Black alone Asian alone Hispanic origin
Nonmarried persons
Income of the Population 55 or Older, 2012 ♦ 41
Income Sources of Aged Units
55–61 62–64 65 or older 55–61 62–64 65 or older 55–61 62–64 65 or older 55–61 62–64 65 or older
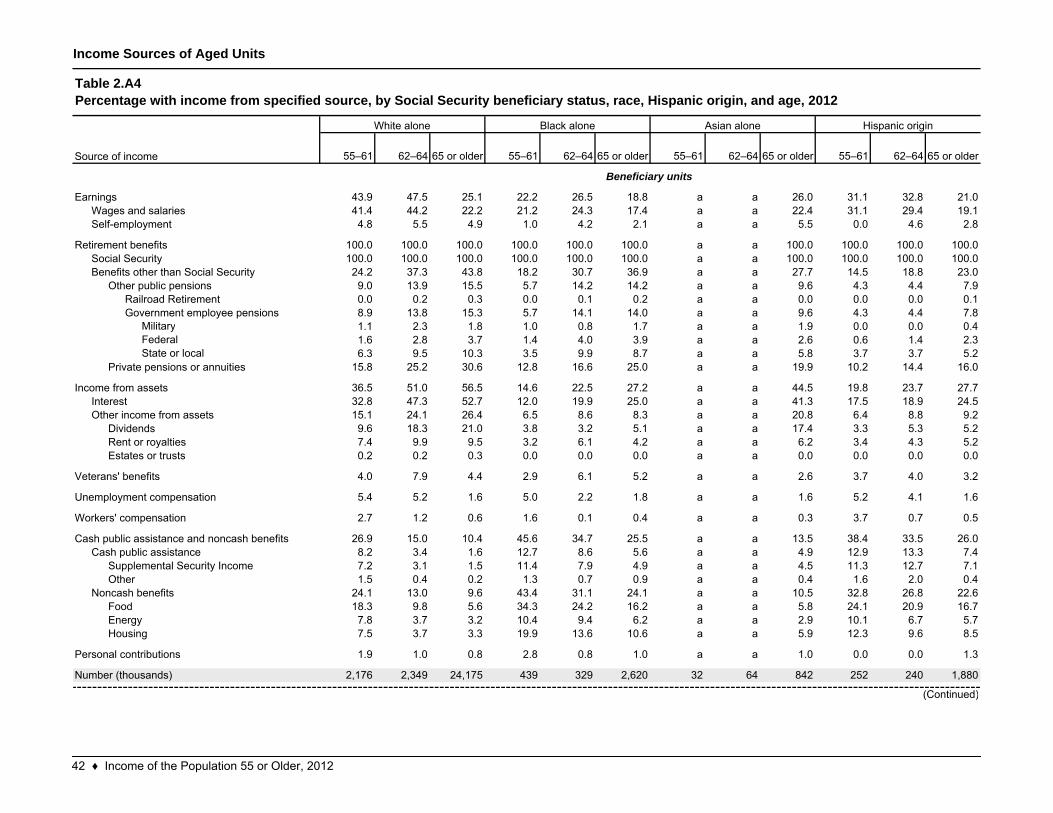
43.9 47.5 25.1 22.2 26.5 18.8 a a 26.0 31.1 32.8 21.041.4 44.2 22.2 21.2 24.3 17.4 a a 22.4 31.1 29.4 19.14.8 5.5 4.9 1.0 4.2 2.1 a a 5.5 0.0 4.6 2.8
100.0 100.0 100.0 100.0 100.0 100.0 a a 100.0 100.0 100.0 100.0100.0 100.0 100.0 100.0 100.0 100.0 a a 100.0 100.0 100.0 100.024.2 37.3 43.8 18.2 30.7 36.9 a a 27.7 14.5 18.8 23.09.0 13.9 15.5 5.7 14.2 14.2 a a 9.6 4.3 4.4 7.90.0 0.2 0.3 0.0 0.1 0.2 a a 0.0 0.0 0.0 0.18.9 13.8 15.3 5.7 14.1 14.0 a a 9.6 4.3 4.4 7.8
Military 1.1 2.3 1.8 1.0 0.8 1.7 a a 1.9 0.0 0.0 0.4Federal 1.6 2.8 3.7 1.4 4.0 3.9 a a 2.6 0.6 1.4 2.3State or local 6.3 9.5 10.3 3.5 9.9 8.7 a a 5.8 3.7 3.7 5.2
15.8 25.2 30.6 12.8 16.6 25.0 a a 19.9 10.2 14.4 16.0
36.5 51.0 56.5 14.6 22.5 27.2 a a 44.5 19.8 23.7 27.732.8 47.3 52.7 12.0 19.9 25.0 a a 41.3 17.5 18.9 24.515.1 24.1 26.4 6.5 8.6 8.3 a a 20.8 6.4 8.8 9.29.6 18.3 21.0 3.8 3.2 5.1 a a 17.4 3.3 5.3 5.27.4 9.9 9.5 3.2 6.1 4.2 a a 6.2 3.4 4.3 5.20.2 0.2 0.3 0.0 0.0 0.0 a a 0.0 0.0 0.0 0.0
4.0 7.9 4.4 2.9 6.1 5.2 a a 2.6 3.7 4.0 3.2
5.4 5.2 1.6 5.0 2.2 1.8 a a 1.6 5.2 4.1 1.6
2.7 1.2 0.6 1.6 0.1 0.4 a a 0.3 3.7 0.7 0.5
26.9 15.0 10.4 45.6 34.7 25.5 a a 13.5 38.4 33.5 26.08.2 3.4 1.6 12.7 8.6 5.6 a a 4.9 12.9 13.3 7.47.2 3.1 1.5 11.4 7.9 4.9 a a 4.5 11.3 12.7 7.11.5 0.4 0.2 1.3 0.7 0.9 a a 0.4 1.6 2.0 0.4
24.1 13.0 9.6 43.4 31.1 24.1 a a 10.5 32.8 26.8 22.618.3 9.8 5.6 34.3 24.2 16.2 a a 5.8 24.1 20.9 16.77.8 3.7 3.2 10.4 9.4 6.2 a a 2.9 10.1 6.7 5.77.5 3.7 3.3 19.9 13.6 10.6 a a 5.9 12.3 9.6 8.5
1.9 1.0 0.8 2.8 0.8 1.0 a a 1.0 0.0 0.0 1.3
2,176 2,349 24,175 439 329 2,620 32 64 842 252 240 1,880
Other
FoodEnergyHousing
Personal contributions
Number (thousands)
Noncash benefits
Supplemental Security Income
Other public pensionsRailroad RetirementGovernment employee pensions
Private pensions or annuities
Income from assets
Other income from assetsDividendsRent or royaltiesEstates or trusts
Interest
Veterans' benefits
Unemployment compensation
Workers' compensation
Cash public assistance and noncash benefitsCash public assistance
Beneficiary units
Source of income
EarningsWages and salariesSelf-employment
Retirement benefitsSocial SecurityBenefits other than Social Security
(Continued)
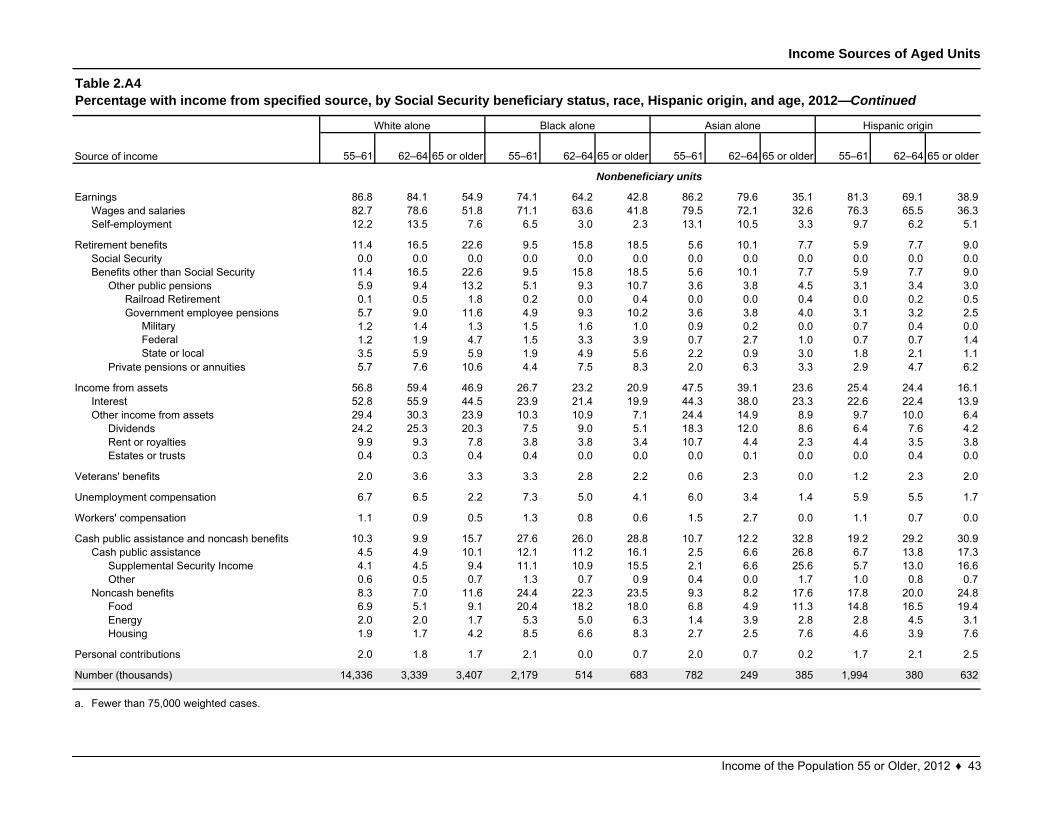
Table 2.A4Percentage with income from specified source, by Social Security beneficiary status, race, Hispanic origin, and age, 2012
White alone Black alone Asian alone Hispanic origin
42 ♦ Income of the Population 55 or Older, 2012
Income Sources of Aged Units
55–61 62–64 65 or older 55–61 62–64 65 or older 55–61 62–64 65 or older 55–61 62–64 65 or older
86.8 84.1 54.9 74.1 64.2 42.8 86.2 79.6 35.1 81.3 69.1 38.982.7 78.6 51.8 71.1 63.6 41.8 79.5 72.1 32.6 76.3 65.5 36.312.2 13.5 7.6 6.5 3.0 2.3 13.1 10.5 3.3 9.7 6.2 5.1
11.4 16.5 22.6 9.5 15.8 18.5 5.6 10.1 7.7 5.9 7.7 9.00.0 0.0 0.0 0.0 0.0 0.0 0.0 0.0 0.0 0.0 0.0 0.0
11.4 16.5 22.6 9.5 15.8 18.5 5.6 10.1 7.7 5.9 7.7 9.05.9 9.4 13.2 5.1 9.3 10.7 3.6 3.8 4.5 3.1 3.4 3.00.1 0.5 1.8 0.2 0.0 0.4 0.0 0.0 0.4 0.0 0.2 0.55.7 9.0 11.6 4.9 9.3 10.2 3.6 3.8 4.0 3.1 3.2 2.5
Military 1.2 1.4 1.3 1.5 1.6 1.0 0.9 0.2 0.0 0.7 0.4 0.0Federal 1.2 1.9 4.7 1.5 3.3 3.9 0.7 2.7 1.0 0.7 0.7 1.4State or local 3.5 5.9 5.9 1.9 4.9 5.6 2.2 0.9 3.0 1.8 2.1 1.1
5.7 7.6 10.6 4.4 7.5 8.3 2.0 6.3 3.3 2.9 4.7 6.2
56.8 59.4 46.9 26.7 23.2 20.9 47.5 39.1 23.6 25.4 24.4 16.152.8 55.9 44.5 23.9 21.4 19.9 44.3 38.0 23.3 22.6 22.4 13.929.4 30.3 23.9 10.3 10.9 7.1 24.4 14.9 8.9 9.7 10.0 6.424.2 25.3 20.3 7.5 9.0 5.1 18.3 12.0 8.6 6.4 7.6 4.29.9 9.3 7.8 3.8 3.8 3.4 10.7 4.4 2.3 4.4 3.5 3.80.4 0.3 0.4 0.4 0.0 0.0 0.0 0.1 0.0 0.0 0.4 0.0
2.0 3.6 3.3 3.3 2.8 2.2 0.6 2.3 0.0 1.2 2.3 2.0
6.7 6.5 2.2 7.3 5.0 4.1 6.0 3.4 1.4 5.9 5.5 1.7
1.1 0.9 0.5 1.3 0.8 0.6 1.5 2.7 0.0 1.1 0.7 0.0
10.3 9.9 15.7 27.6 26.0 28.8 10.7 12.2 32.8 19.2 29.2 30.94.5 4.9 10.1 12.1 11.2 16.1 2.5 6.6 26.8 6.7 13.8 17.34.1 4.5 9.4 11.1 10.9 15.5 2.1 6.6 25.6 5.7 13.0 16.60.6 0.5 0.7 1.3 0.7 0.9 0.4 0.0 1.7 1.0 0.8 0.78.3 7.0 11.6 24.4 22.3 23.5 9.3 8.2 17.6 17.8 20.0 24.86.9 5.1 9.1 20.4 18.2 18.0 6.8 4.9 11.3 14.8 16.5 19.42.0 2.0 1.7 5.3 5.0 6.3 1.4 3.9 2.8 2.8 4.5 3.11.9 1.7 4.2 8.5 6.6 8.3 2.7 2.5 7.6 4.6 3.9 7.6
2.0 1.8 1.7 2.1 0.0 0.7 2.0 0.7 0.2 1.7 2.1 2.5
14,336 3,339 3,407 2,179 514 683 782 249 385 1,994 380 632
a. Fewer than 75,000 weighted cases.
Noncash benefitsFoodEnergyHousing
Personal contributions
Number (thousands)
Cash public assistance and noncash benefitsCash public assistance
Supplemental Security IncomeOther
DividendsRent or royaltiesEstates or trusts
Veterans' benefits
Unemployment compensation
Workers' compensation
Railroad RetirementGovernment employee pensions
Private pensions or annuities
Income from assetsInterestOther income from assets
Other public pensions
EarningsWages and salariesSelf-employment
Retirement benefitsSocial SecurityBenefits other than Social Security
Nonbeneficiary units
Table 2.A4Percentage with income from specified source, by Social Security beneficiary status, race, Hispanic origin, and age, 2012—Continued
Source of income
White alone Black alone Asian alone Hispanic origin
Income of the Population 55 or Older, 2012 ♦ 43
Income Sources of Aged Units
Yes No Yes No Yes No Yes No Yes No Yes No
Total percent 100.0 100.0 100.0 100.0 100.0 100.0 100.0 100.0 100.0 100.0 100.0 100.0 100.0 100.0 100.0
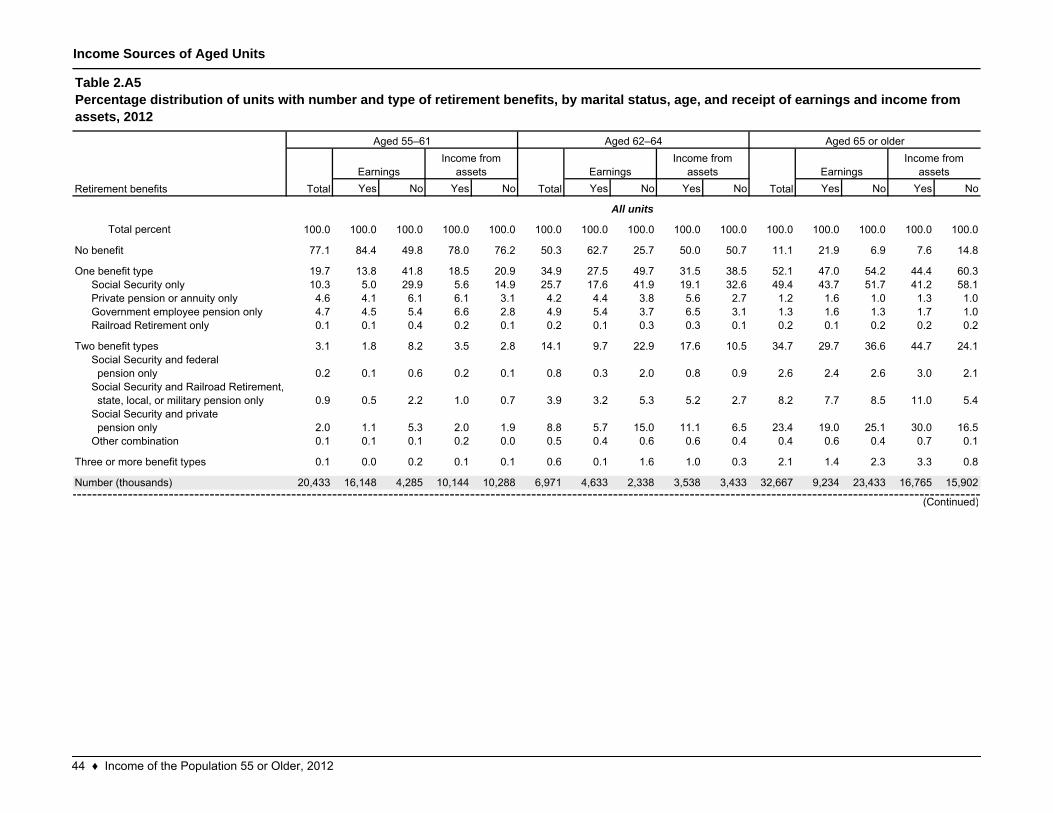
77.1 84.4 49.8 78.0 76.2 50.3 62.7 25.7 50.0 50.7 11.1 21.9 6.9 7.6 14.8
19.7 13.8 41.8 18.5 20.9 34.9 27.5 49.7 31.5 38.5 52.1 47.0 54.2 44.4 60.310.3 5.0 29.9 5.6 14.9 25.7 17.6 41.9 19.1 32.6 49.4 43.7 51.7 41.2 58.14.6 4.1 6.1 6.1 3.1 4.2 4.4 3.8 5.6 2.7 1.2 1.6 1.0 1.3 1.04.7 4.5 5.4 6.6 2.8 4.9 5.4 3.7 6.5 3.1 1.3 1.6 1.3 1.7 1.00.1 0.1 0.4 0.2 0.1 0.2 0.1 0.3 0.3 0.1 0.2 0.1 0.2 0.2 0.2
3.1 1.8 8.2 3.5 2.8 14.1 9.7 22.9 17.6 10.5 34.7 29.7 36.6 44.7 24.1
0.2 0.1 0.6 0.2 0.1 0.8 0.3 2.0 0.8 0.9 2.6 2.4 2.6 3.0 2.1
0.9 0.5 2.2 1.0 0.7 3.9 3.2 5.3 5.2 2.7 8.2 7.7 8.5 11.0 5.4
2.0 1.1 5.3 2.0 1.9 8.8 5.7 15.0 11.1 6.5 23.4 19.0 25.1 30.0 16.50.1 0.1 0.1 0.2 0.0 0.5 0.4 0.6 0.6 0.4 0.4 0.6 0.4 0.7 0.1
0.1 0.0 0.2 0.1 0.1 0.6 0.1 1.6 1.0 0.3 2.1 1.4 2.3 3.3 0.8
20,433 16,148 4,285 10,144 10,288 6,971 4,633 2,338 3,538 3,433 32,667 9,234 23,433 16,765 15,902
Three or more benefit types
Number (thousands)
Earnings
(Continued)
Income from assets
TotalEarnings
Income from assets
Two benefit typesSocial Security and federal pension onlySocial Security and Railroad Retirement, state, local, or military pension onlySocial Security and private pension onlyOther combination
All units
Table 2.A5Percentage distribution of units with number and type of retirement benefits, by marital status, age, and receipt of earnings and income from assets, 2012
Aged 55–61 Aged 62–64 Aged 65 or older
Retirement benefits
No benefit
One benefit typeSocial Security onlyPrivate pension or annuity onlyGovernment employee pension onlyRailroad Retirement only
TotalEarnings
Income from assets
Total
44 ♦ Income of the Population 55 or Older, 2012
Income Sources of Aged Units
Yes No Yes No Yes No Yes No Yes No Yes No
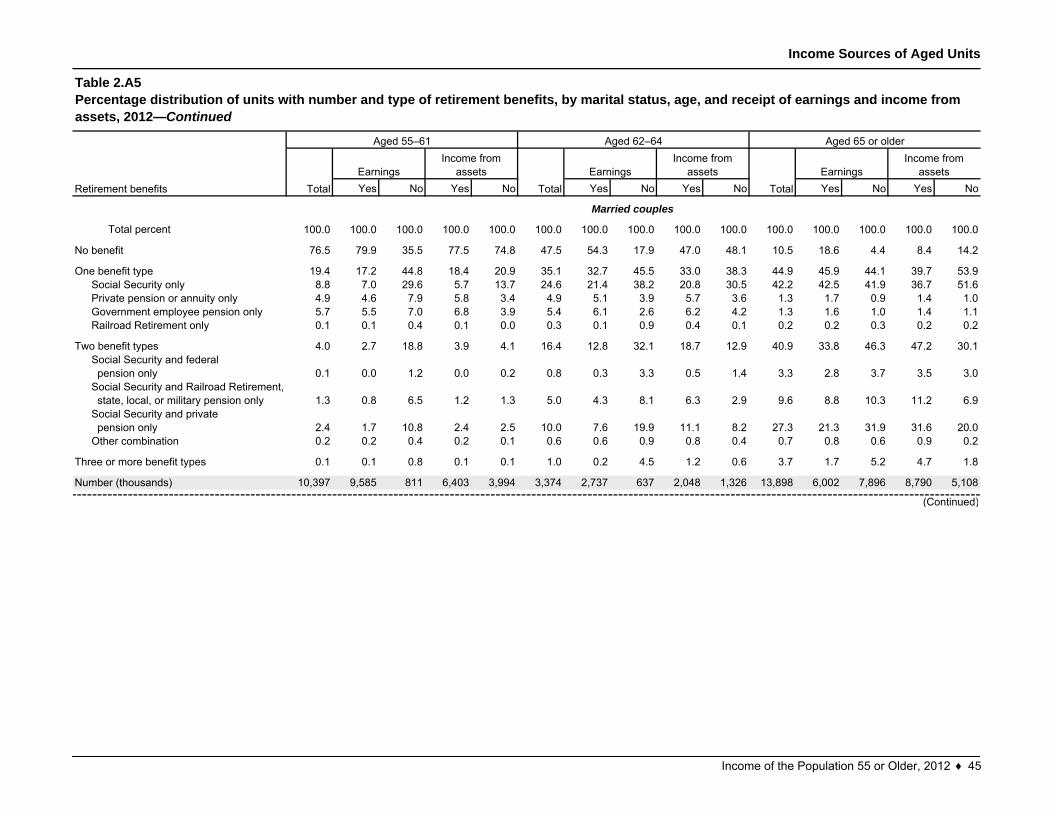
Total percent 100.0 100.0 100.0 100.0 100.0 100.0 100.0 100.0 100.0 100.0 100.0 100.0 100.0 100.0 100.0
76.5 79.9 35.5 77.5 74.8 47.5 54.3 17.9 47.0 48.1 10.5 18.6 4.4 8.4 14.2
19.4 17.2 44.8 18.4 20.9 35.1 32.7 45.5 33.0 38.3 44.9 45.9 44.1 39.7 53.98.8 7.0 29.6 5.7 13.7 24.6 21.4 38.2 20.8 30.5 42.2 42.5 41.9 36.7 51.64.9 4.6 7.9 5.8 3.4 4.9 5.1 3.9 5.7 3.6 1.3 1.7 0.9 1.4 1.05.7 5.5 7.0 6.8 3.9 5.4 6.1 2.6 6.2 4.2 1.3 1.6 1.0 1.4 1.10.1 0.1 0.4 0.1 0.0 0.3 0.1 0.9 0.4 0.1 0.2 0.2 0.3 0.2 0.2
4.0 2.7 18.8 3.9 4.1 16.4 12.8 32.1 18.7 12.9 40.9 33.8 46.3 47.2 30.1
0.1 0.0 1.2 0.0 0.2 0.8 0.3 3.3 0.5 1.4 3.3 2.8 3.7 3.5 3.0
1.3 0.8 6.5 1.2 1.3 5.0 4.3 8.1 6.3 2.9 9.6 8.8 10.3 11.2 6.9
2.4 1.7 10.8 2.4 2.5 10.0 7.6 19.9 11.1 8.2 27.3 21.3 31.9 31.6 20.00.2 0.2 0.4 0.2 0.1 0.6 0.6 0.9 0.8 0.4 0.7 0.8 0.6 0.9 0.2
0.1 0.1 0.8 0.1 0.1 1.0 0.2 4.5 1.2 0.6 3.7 1.7 5.2 4.7 1.8
10,397 9,585 811 6,403 3,994 3,374 2,737 637 2,048 1,326 13,898 6,002 7,896 8,790 5,108
No benefit
One benefit typeSocial Security onlyPrivate pension or annuity only
Railroad Retirement only
Two benefit typesSocial Security and federal pension onlySocial Security and Railroad Retirement, state, local, or military pension onlySocial Security and private pension only
Aged 65 or older
Total
Other combination
Three or more benefit types
Number (thousands)
Table 2.A5Percentage distribution of units with number and type of retirement benefits, by marital status, age, and receipt of earnings and income from assets, 2012—Continued
Retirement benefits
Aged 55–61 Aged 62–64
TotalEarnings
Income from assets
(Continued)
EarningsIncome from
assetsTotal
EarningsIncome from
assets
Government employee pension only
Married couples
Income of the Population 55 or Older, 2012 ♦ 45
Income Sources of Aged Units
Yes No Yes No Yes No Yes No Yes No Yes No
Total percent 100.0 100.0 100.0 100.0 100.0 100.0 100.0 100.0 100.0 100.0 100.0 100.0 100.0 100.0 100.0
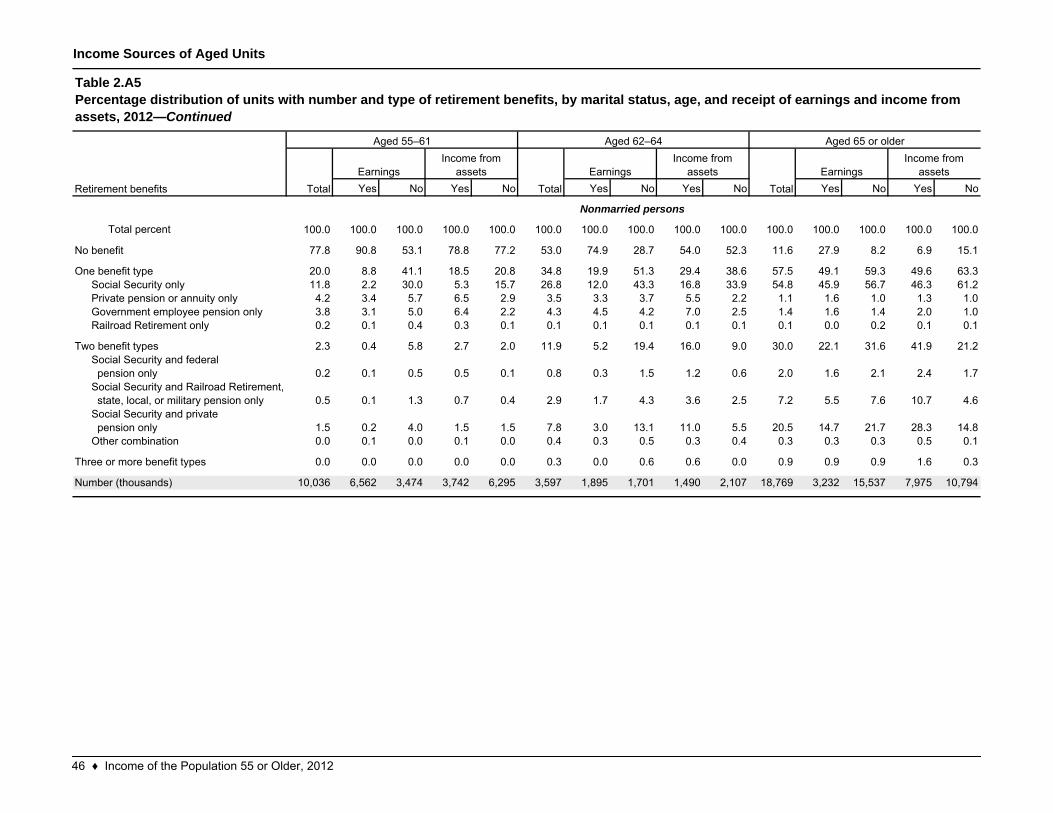
77.8 90.8 53.1 78.8 77.2 53.0 74.9 28.7 54.0 52.3 11.6 27.9 8.2 6.9 15.1
20.0 8.8 41.1 18.5 20.8 34.8 19.9 51.3 29.4 38.6 57.5 49.1 59.3 49.6 63.311.8 2.2 30.0 5.3 15.7 26.8 12.0 43.3 16.8 33.9 54.8 45.9 56.7 46.3 61.24.2 3.4 5.7 6.5 2.9 3.5 3.3 3.7 5.5 2.2 1.1 1.6 1.0 1.3 1.03.8 3.1 5.0 6.4 2.2 4.3 4.5 4.2 7.0 2.5 1.4 1.6 1.4 2.0 1.00.2 0.1 0.4 0.3 0.1 0.1 0.1 0.1 0.1 0.1 0.1 0.0 0.2 0.1 0.1
2.3 0.4 5.8 2.7 2.0 11.9 5.2 19.4 16.0 9.0 30.0 22.1 31.6 41.9 21.2
0.2 0.1 0.5 0.5 0.1 0.8 0.3 1.5 1.2 0.6 2.0 1.6 2.1 2.4 1.7
0.5 0.1 1.3 0.7 0.4 2.9 1.7 4.3 3.6 2.5 7.2 5.5 7.6 10.7 4.6
1.5 0.2 4.0 1.5 1.5 7.8 3.0 13.1 11.0 5.5 20.5 14.7 21.7 28.3 14.80.0 0.1 0.0 0.1 0.0 0.4 0.3 0.5 0.3 0.4 0.3 0.3 0.3 0.5 0.1
0.0 0.0 0.0 0.0 0.0 0.3 0.0 0.6 0.6 0.0 0.9 0.9 0.9 1.6 0.3
10,036 6,562 3,474 3,742 6,295 3,597 1,895 1,701 1,490 2,107 18,769 3,232 15,537 7,975 10,794
One benefit typeSocial Security only
Other combination
Private pension or annuity only
Three or more benefit types
Number (thousands)
Government employee pension onlyRailroad Retirement only
Two benefit typesSocial Security and federal pension onlySocial Security and Railroad Retirement, state, local, or military pension onlySocial Security and private pension only
No benefit
Retirement benefits
Nonmarried persons
Table 2.A5Percentage distribution of units with number and type of retirement benefits, by marital status, age, and receipt of earnings and income from assets, 2012—Continued
Aged 55–61 Aged 62–64 Aged 65 or older
TotalEarnings
Income from assets
TotalEarnings
Income from assets
TotalEarnings
Income from assets
46 ♦ Income of the Population 55 or Older, 2012
Income Sources of Units 65 or Older
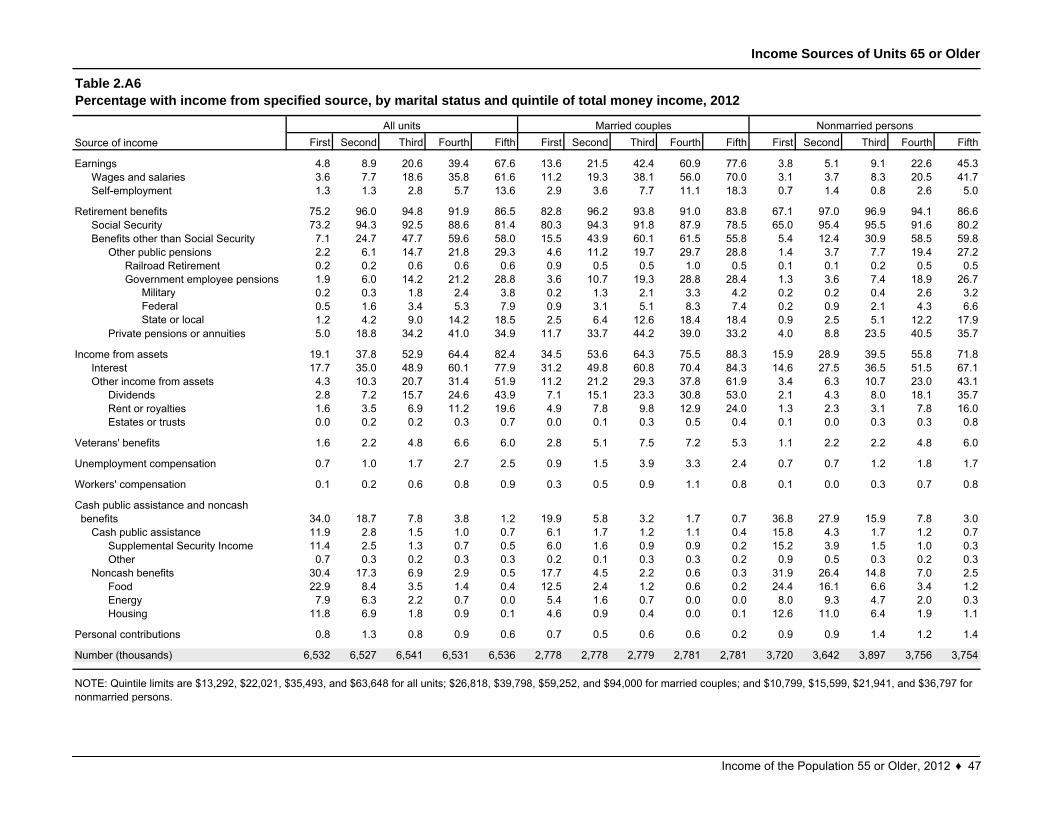
First Second Third Fourth Fifth First Second Third Fourth Fifth First Second Third Fourth Fifth
4.8 8.9 20.6 39.4 67.6 13.6 21.5 42.4 60.9 77.6 3.8 5.1 9.1 22.6 45.33.6 7.7 18.6 35.8 61.6 11.2 19.3 38.1 56.0 70.0 3.1 3.7 8.3 20.5 41.71.3 1.3 2.8 5.7 13.6 2.9 3.6 7.7 11.1 18.3 0.7 1.4 0.8 2.6 5.0
75.2 96.0 94.8 91.9 86.5 82.8 96.2 93.8 91.0 83.8 67.1 97.0 96.9 94.1 86.673.2 94.3 92.5 88.6 81.4 80.3 94.3 91.8 87.9 78.5 65.0 95.4 95.5 91.6 80.27.1 24.7 47.7 59.6 58.0 15.5 43.9 60.1 61.5 55.8 5.4 12.4 30.9 58.5 59.82.2 6.1 14.7 21.8 29.3 4.6 11.2 19.7 29.7 28.8 1.4 3.7 7.7 19.4 27.20.2 0.2 0.6 0.6 0.6 0.9 0.5 0.5 1.0 0.5 0.1 0.1 0.2 0.5 0.51.9 6.0 14.2 21.2 28.8 3.6 10.7 19.3 28.8 28.4 1.3 3.6 7.4 18.9 26.7
Military 0.2 0.3 1.8 2.4 3.8 0.2 1.3 2.1 3.3 4.2 0.2 0.2 0.4 2.6 3.2Federal 0.5 1.6 3.4 5.3 7.9 0.9 3.1 5.1 8.3 7.4 0.2 0.9 2.1 4.3 6.6State or local 1.2 4.2 9.0 14.2 18.5 2.5 6.4 12.6 18.4 18.4 0.9 2.5 5.1 12.2 17.9
5.0 18.8 34.2 41.0 34.9 11.7 33.7 44.2 39.0 33.2 4.0 8.8 23.5 40.5 35.7
19.1 37.8 52.9 64.4 82.4 34.5 53.6 64.3 75.5 88.3 15.9 28.9 39.5 55.8 71.817.7 35.0 48.9 60.1 77.9 31.2 49.8 60.8 70.4 84.3 14.6 27.5 36.5 51.5 67.14.3 10.3 20.7 31.4 51.9 11.2 21.2 29.3 37.8 61.9 3.4 6.3 10.7 23.0 43.12.8 7.2 15.7 24.6 43.9 7.1 15.1 23.3 30.8 53.0 2.1 4.3 8.0 18.1 35.71.6 3.5 6.9 11.2 19.6 4.9 7.8 9.8 12.9 24.0 1.3 2.3 3.1 7.8 16.00.0 0.2 0.2 0.3 0.7 0.0 0.1 0.3 0.5 0.4 0.1 0.0 0.3 0.3 0.8
1.6 2.2 4.8 6.6 6.0 2.8 5.1 7.5 7.2 5.3 1.1 2.2 2.2 4.8 6.0
0.7 1.0 1.7 2.7 2.5 0.9 1.5 3.9 3.3 2.4 0.7 0.7 1.2 1.8 1.7
0.1 0.2 0.6 0.8 0.9 0.3 0.5 0.9 1.1 0.8 0.1 0.0 0.3 0.7 0.8
34.0 18.7 7.8 3.8 1.2 19.9 5.8 3.2 1.7 0.7 36.8 27.9 15.9 7.8 3.011.9 2.8 1.5 1.0 0.7 6.1 1.7 1.2 1.1 0.4 15.8 4.3 1.7 1.2 0.711.4 2.5 1.3 0.7 0.5 6.0 1.6 0.9 0.9 0.2 15.2 3.9 1.5 1.0 0.30.7 0.3 0.2 0.3 0.3 0.2 0.1 0.3 0.3 0.2 0.9 0.5 0.3 0.2 0.3
30.4 17.3 6.9 2.9 0.5 17.7 4.5 2.2 0.6 0.3 31.9 26.4 14.8 7.0 2.522.9 8.4 3.5 1.4 0.4 12.5 2.4 1.2 0.6 0.2 24.4 16.1 6.6 3.4 1.27.9 6.3 2.2 0.7 0.0 5.4 1.6 0.7 0.0 0.0 8.0 9.3 4.7 2.0 0.3
11.8 6.9 1.8 0.9 0.1 4.6 0.9 0.4 0.0 0.1 12.6 11.0 6.4 1.9 1.1
0.8 1.3 0.8 0.9 0.6 0.7 0.5 0.6 0.6 0.2 0.9 0.9 1.4 1.2 1.4
6,532 6,527 6,541 6,531 6,536 2,778 2,778 2,779 2,781 2,781 3,720 3,642 3,897 3,756 3,754
NOTE: Quintile limits are $13,292, $22,021, $35,493, and $63,648 for all units; $26,818, $39,798, $59,252, and $94,000 for married couples; and $10,799, $15,599, $21,941, and $36,797 for nonmarried persons.
Housing
Personal contributions
Number (thousands)
Energy
DividendsRent or royaltiesEstates or trusts
Veterans' benefits
Unemployment compensation
Workers' compensation
Cash public assistanceSupplemental Security IncomeOther
Noncash benefitsFood
EarningsWages and salariesSelf-employment
Retirement benefits
Cash public assistance and noncash benefits
Government employee pensions
Private pensions or annuities
Income from assetsInterestOther income from assets
Social SecurityBenefits other than Social Security
Other public pensionsRailroad Retirement
Table 2.A6Percentage with income from specified source, by marital status and quintile of total money income, 2012
All units Married couples Nonmarried personsSource of income
Income of the Population 55 or Older, 2012 ♦ 47
Income Sources of Beneficiary Units 65 or Older
All unitsMarried couples
Nonmarried persons All units
Married couples
Nonmarried persons All units
Married couples
Nonmarried persons All units
Married couples
Nonmarried persons
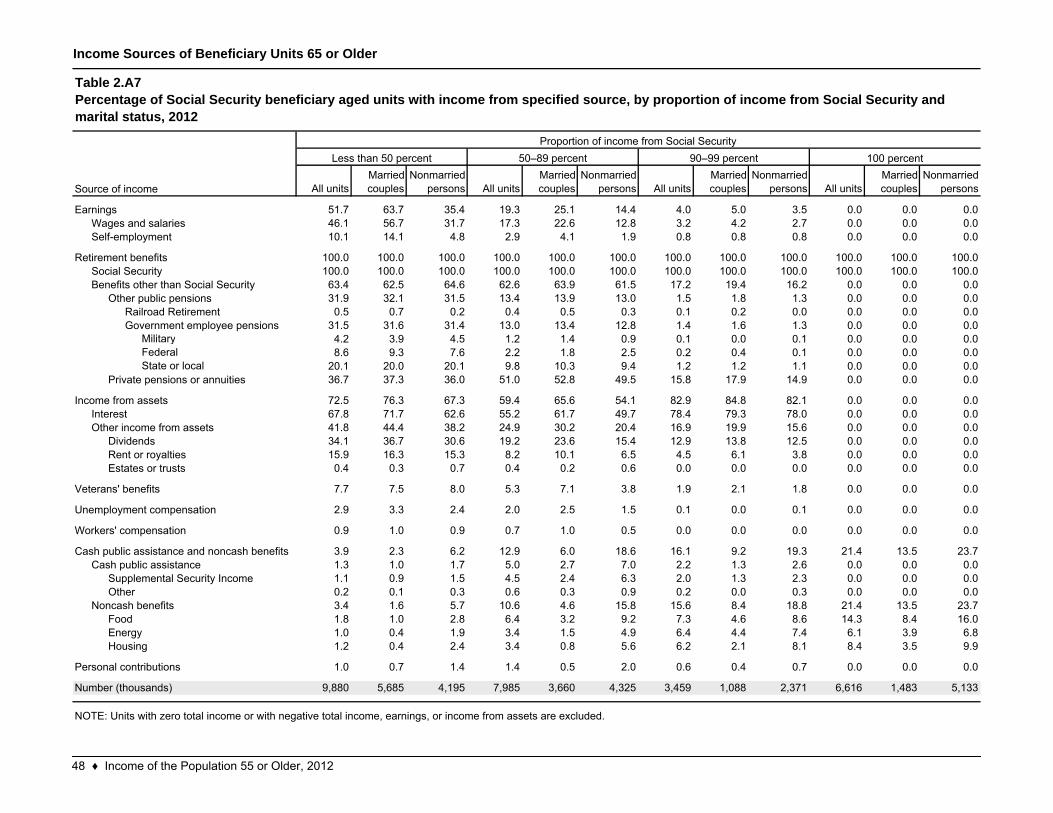
51.7 63.7 35.4 19.3 25.1 14.4 4.0 5.0 3.5 0.0 0.0 0.046.1 56.7 31.7 17.3 22.6 12.8 3.2 4.2 2.7 0.0 0.0 0.010.1 14.1 4.8 2.9 4.1 1.9 0.8 0.8 0.8 0.0 0.0 0.0
100.0 100.0 100.0 100.0 100.0 100.0 100.0 100.0 100.0 100.0 100.0 100.0100.0 100.0 100.0 100.0 100.0 100.0 100.0 100.0 100.0 100.0 100.0 100.063.4 62.5 64.6 62.6 63.9 61.5 17.2 19.4 16.2 0.0 0.0 0.031.9 32.1 31.5 13.4 13.9 13.0 1.5 1.8 1.3 0.0 0.0 0.00.5 0.7 0.2 0.4 0.5 0.3 0.1 0.2 0.0 0.0 0.0 0.0
31.5 31.6 31.4 13.0 13.4 12.8 1.4 1.6 1.3 0.0 0.0 0.0Military 4.2 3.9 4.5 1.2 1.4 0.9 0.1 0.0 0.1 0.0 0.0 0.0Federal 8.6 9.3 7.6 2.2 1.8 2.5 0.2 0.4 0.1 0.0 0.0 0.0State or local 20.1 20.0 20.1 9.8 10.3 9.4 1.2 1.2 1.1 0.0 0.0 0.0
36.7 37.3 36.0 51.0 52.8 49.5 15.8 17.9 14.9 0.0 0.0 0.0
72.5 76.3 67.3 59.4 65.6 54.1 82.9 84.8 82.1 0.0 0.0 0.067.8 71.7 62.6 55.2 61.7 49.7 78.4 79.3 78.0 0.0 0.0 0.041.8 44.4 38.2 24.9 30.2 20.4 16.9 19.9 15.6 0.0 0.0 0.034.1 36.7 30.6 19.2 23.6 15.4 12.9 13.8 12.5 0.0 0.0 0.015.9 16.3 15.3 8.2 10.1 6.5 4.5 6.1 3.8 0.0 0.0 0.00.4 0.3 0.7 0.4 0.2 0.6 0.0 0.0 0.0 0.0 0.0 0.0
7.7 7.5 8.0 5.3 7.1 3.8 1.9 2.1 1.8 0.0 0.0 0.0
2.9 3.3 2.4 2.0 2.5 1.5 0.1 0.0 0.1 0.0 0.0 0.0
0.9 1.0 0.9 0.7 1.0 0.5 0.0 0.0 0.0 0.0 0.0 0.0
3.9 2.3 6.2 12.9 6.0 18.6 16.1 9.2 19.3 21.4 13.5 23.71.3 1.0 1.7 5.0 2.7 7.0 2.2 1.3 2.6 0.0 0.0 0.01.1 0.9 1.5 4.5 2.4 6.3 2.0 1.3 2.3 0.0 0.0 0.00.2 0.1 0.3 0.6 0.3 0.9 0.2 0.0 0.3 0.0 0.0 0.03.4 1.6 5.7 10.6 4.6 15.8 15.6 8.4 18.8 21.4 13.5 23.71.8 1.0 2.8 6.4 3.2 9.2 7.3 4.6 8.6 14.3 8.4 16.01.0 0.4 1.9 3.4 1.5 4.9 6.4 4.4 7.4 6.1 3.9 6.81.2 0.4 2.4 3.4 0.8 5.6 6.2 2.1 8.1 8.4 3.5 9.9
1.0 0.7 1.4 1.4 0.5 2.0 0.6 0.4 0.7 0.0 0.0 0.0
9,880 5,685 4,195 7,985 3,660 4,325 3,459 1,088 2,371 6,616 1,483 5,133
OtherNoncash benefits
FoodEnergy
NOTE: Units with zero total income or with negative total income, earnings, or income from assets are excluded.
Housing
Personal contributions
Number (thousands)
Income from assetsInterestOther income from assets
Cash public assistanceSupplemental Security Income
Unemployment compensation
Workers' compensation
Cash public assistance and noncash benefits
DividendsRent or royaltiesEstates or trusts
Veterans' benefits
100 percent
Source of income
EarningsWages and salariesSelf-employment
Retirement benefitsSocial SecurityBenefits other than Social Security
Other public pensionsRailroad RetirementGovernment employee pensions
Private pensions or annuities
Table 2.A7Percentage of Social Security beneficiary aged units with income from specified source, by proportion of income from Social Security and marital status, 2012
Proportion of income from Social SecurityLess than 50 percent 50–89 percent 90–99 percent
48 ♦ Income of the Population 55 or Older, 2012
Family Income Sources of Aged Persons
Total 65–69 70–74 75–79 80 or older
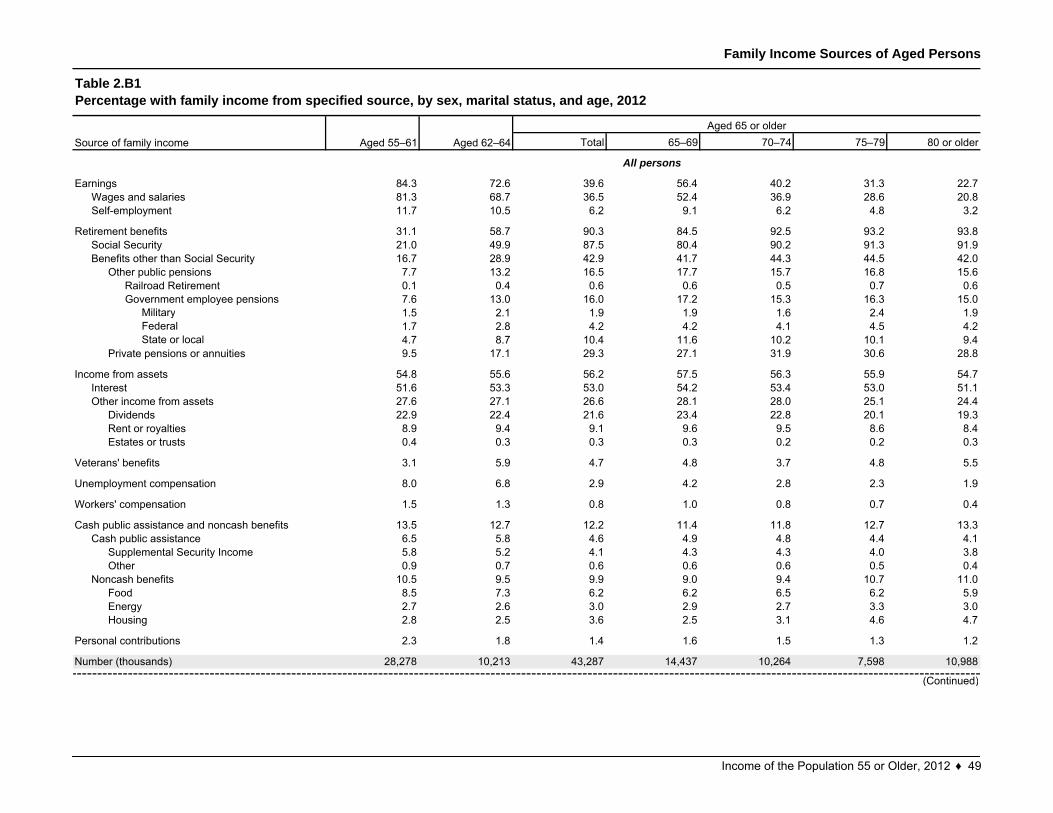
84.3 72.6 39.6 56.4 40.2 31.3 22.781.3 68.7 36.5 52.4 36.9 28.6 20.811.7 10.5 6.2 9.1 6.2 4.8 3.2
31.1 58.7 90.3 84.5 92.5 93.2 93.821.0 49.9 87.5 80.4 90.2 91.3 91.916.7 28.9 42.9 41.7 44.3 44.5 42.07.7 13.2 16.5 17.7 15.7 16.8 15.60.1 0.4 0.6 0.6 0.5 0.7 0.67.6 13.0 16.0 17.2 15.3 16.3 15.0
Military 1.5 2.1 1.9 1.9 1.6 2.4 1.9Federal 1.7 2.8 4.2 4.2 4.1 4.5 4.2State or local 4.7 8.7 10.4 11.6 10.2 10.1 9.4
9.5 17.1 29.3 27.1 31.9 30.6 28.8
54.8 55.6 56.2 57.5 56.3 55.9 54.751.6 53.3 53.0 54.2 53.4 53.0 51.127.6 27.1 26.6 28.1 28.0 25.1 24.422.9 22.4 21.6 23.4 22.8 20.1 19.38.9 9.4 9.1 9.6 9.5 8.6 8.40.4 0.3 0.3 0.3 0.2 0.2 0.3
3.1 5.9 4.7 4.8 3.7 4.8 5.5
8.0 6.8 2.9 4.2 2.8 2.3 1.9
1.5 1.3 0.8 1.0 0.8 0.7 0.4
13.5 12.7 12.2 11.4 11.8 12.7 13.36.5 5.8 4.6 4.9 4.8 4.4 4.15.8 5.2 4.1 4.3 4.3 4.0 3.80.9 0.7 0.6 0.6 0.6 0.5 0.4
10.5 9.5 9.9 9.0 9.4 10.7 11.08.5 7.3 6.2 6.2 6.5 6.2 5.92.7 2.6 3.0 2.9 2.7 3.3 3.02.8 2.5 3.6 2.5 3.1 4.6 4.7
2.3 1.8 1.4 1.6 1.5 1.3 1.2
28,278 10,213 43,287 14,437 10,264 7,598 10,988
Housing
Personal contributions
Number (thousands)
Estates or trusts
Veterans' benefits
Unemployment compensation
Workers' compensation
Cash public assistance and noncash benefitsCash public assistance
Supplemental Security IncomeOther
Noncash benefitsFoodEnergy
Social SecurityBenefits other than Social Security
Other public pensionsRailroad Retirement
All persons
Private pensions or annuities
Income from assetsInterest
Rent or royalties
Other income from assetsDividends
Table 2.B1Percentage with family income from specified source, by sex, marital status, and age, 2012
Aged 55–61 Aged 62–64Aged 65 or older
Government employee pensions
Source of family income
EarningsWages and salariesSelf-employment
(Continued)
Retirement benefits
Income of the Population 55 or Older, 2012 ♦ 49
Family Income Sources of Aged Persons
Total 65–69 70–74 75–79 80 or older
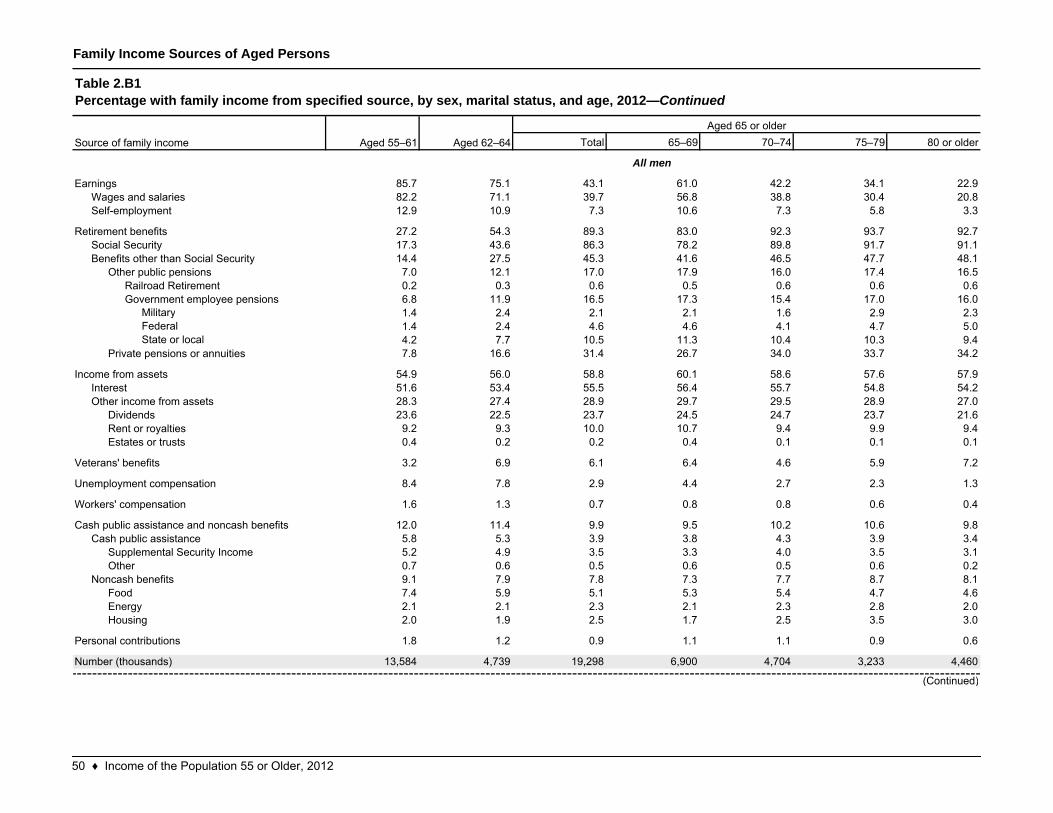
85.7 75.1 43.1 61.0 42.2 34.1 22.982.2 71.1 39.7 56.8 38.8 30.4 20.812.9 10.9 7.3 10.6 7.3 5.8 3.3
27.2 54.3 89.3 83.0 92.3 93.7 92.717.3 43.6 86.3 78.2 89.8 91.7 91.114.4 27.5 45.3 41.6 46.5 47.7 48.17.0 12.1 17.0 17.9 16.0 17.4 16.50.2 0.3 0.6 0.5 0.6 0.6 0.66.8 11.9 16.5 17.3 15.4 17.0 16.0
Military 1.4 2.4 2.1 2.1 1.6 2.9 2.3Federal 1.4 2.4 4.6 4.6 4.1 4.7 5.0State or local 4.2 7.7 10.5 11.3 10.4 10.3 9.4
7.8 16.6 31.4 26.7 34.0 33.7 34.2
54.9 56.0 58.8 60.1 58.6 57.6 57.951.6 53.4 55.5 56.4 55.7 54.8 54.228.3 27.4 28.9 29.7 29.5 28.9 27.023.6 22.5 23.7 24.5 24.7 23.7 21.69.2 9.3 10.0 10.7 9.4 9.9 9.40.4 0.2 0.2 0.4 0.1 0.1 0.1
3.2 6.9 6.1 6.4 4.6 5.9 7.2
8.4 7.8 2.9 4.4 2.7 2.3 1.3
1.6 1.3 0.7 0.8 0.8 0.6 0.4
12.0 11.4 9.9 9.5 10.2 10.6 9.85.8 5.3 3.9 3.8 4.3 3.9 3.45.2 4.9 3.5 3.3 4.0 3.5 3.10.7 0.6 0.5 0.6 0.5 0.6 0.29.1 7.9 7.8 7.3 7.7 8.7 8.17.4 5.9 5.1 5.3 5.4 4.7 4.62.1 2.1 2.3 2.1 2.3 2.8 2.02.0 1.9 2.5 1.7 2.5 3.5 3.0
1.8 1.2 0.9 1.1 1.1 0.9 0.6
13,584 4,739 19,298 6,900 4,704 3,233 4,460
Supplemental Security IncomeOther
Noncash benefitsFoodEnergyHousing
Personal contributions
Number (thousands)
Cash public assistance and noncash benefitsCash public assistance
Other public pensionsRailroad RetirementGovernment employee pensions
EarningsWages and salariesSelf-employment
Private pensions or annuities
Income from assetsInterestOther income from assets
DividendsRent or royaltiesEstates or trusts
Veterans' benefits
Unemployment compensation
Retirement benefitsSocial SecurityBenefits other than Social Security
Workers' compensation
All men
Table 2.B1Percentage with family income from specified source, by sex, marital status, and age, 2012—Continued
Source of family income Aged 55–61 Aged 62–64Aged 65 or older
(Continued)
50 ♦ Income of the Population 55 or Older, 2012

Family Income Sources of Aged Persons
Total 65–69 70–74 75–79 80 or older
93.2 83.1 48.3 68.2 46.6 36.3 22.990.6 79.9 44.4 63.8 42.8 32.1 20.414.5 11.7 8.6 12.2 8.6 6.5 3.7
26.9 54.7 90.2 83.7 93.1 95.0 94.416.0 43.7 87.3 79.0 90.7 93.2 93.015.8 29.1 48.0 44.7 48.5 51.1 50.67.8 13.6 19.0 20.0 17.1 19.2 19.50.1 0.4 0.7 0.7 0.7 0.8 0.87.7 13.3 18.4 19.4 16.5 18.7 18.7
Military 1.7 2.8 2.2 2.1 1.5 3.1 2.5Federal 1.4 2.6 5.0 4.9 4.4 5.4 5.6State or local 4.9 8.7 11.9 13.0 11.2 11.1 11.4
8.4 16.9 32.8 28.4 35.6 36.0 34.7
62.3 61.3 63.5 65.0 63.5 61.7 62.058.9 59.1 60.1 61.3 60.5 58.9 58.732.7 31.3 32.0 32.7 33.0 31.6 29.527.3 26.2 26.3 26.9 28.1 25.9 23.210.6 10.2 11.1 12.1 10.3 11.3 10.30.5 0.3 0.3 0.5 0.1 0.0 0.2
2.9 6.3 5.7 6.2 4.4 5.6 7.0
9.1 8.3 3.1 4.6 2.8 2.5 1.1
2.0 1.4 0.8 1.1 1.0 0.8 0.1
7.8 7.9 6.9 6.1 7.2 8.7 6.64.2 4.5 3.2 3.2 3.7 3.4 2.43.5 4.1 2.8 2.7 3.3 3.0 2.20.8 0.5 0.4 0.5 0.3 0.6 0.15.0 4.7 5.0 3.8 4.9 7.2 5.24.3 3.3 3.3 3.0 3.5 3.9 2.91.0 1.7 1.5 1.1 1.7 2.2 1.40.7 0.5 1.3 0.4 0.9 2.8 2.0
1.8 0.8 1.0 1.0 1.2 1.0 0.6
9,287 3,273 13,770 5,108 3,587 2,419 2,656
EnergyHousing
Personal contributions
Number (thousands)
Veterans' benefits
Unemployment compensation
Workers' compensation
Cash public assistance and noncash benefitsCash public assistance
Supplemental Security IncomeOther
Noncash benefitsFood
DividendsRent or royaltiesEstates or trusts
EarningsWages and salariesSelf-employment
Retirement benefitsSocial SecurityBenefits other than Social Security
Other public pensionsRailroad RetirementGovernment employee pensions
Private pensions or annuities
Income from assetsInterestOther income from assets
Table 2.B1Percentage with family income from specified source, by sex, marital status, and age, 2012—Continued
Source of family income Aged 55–61 Aged 62–64Aged 65 or older
(Continued)
Married men
Income of the Population 55 or Older, 2012 ♦ 51
Family Income Sources of Aged Persons
Total 65–69 70–74 75–79 80 or older
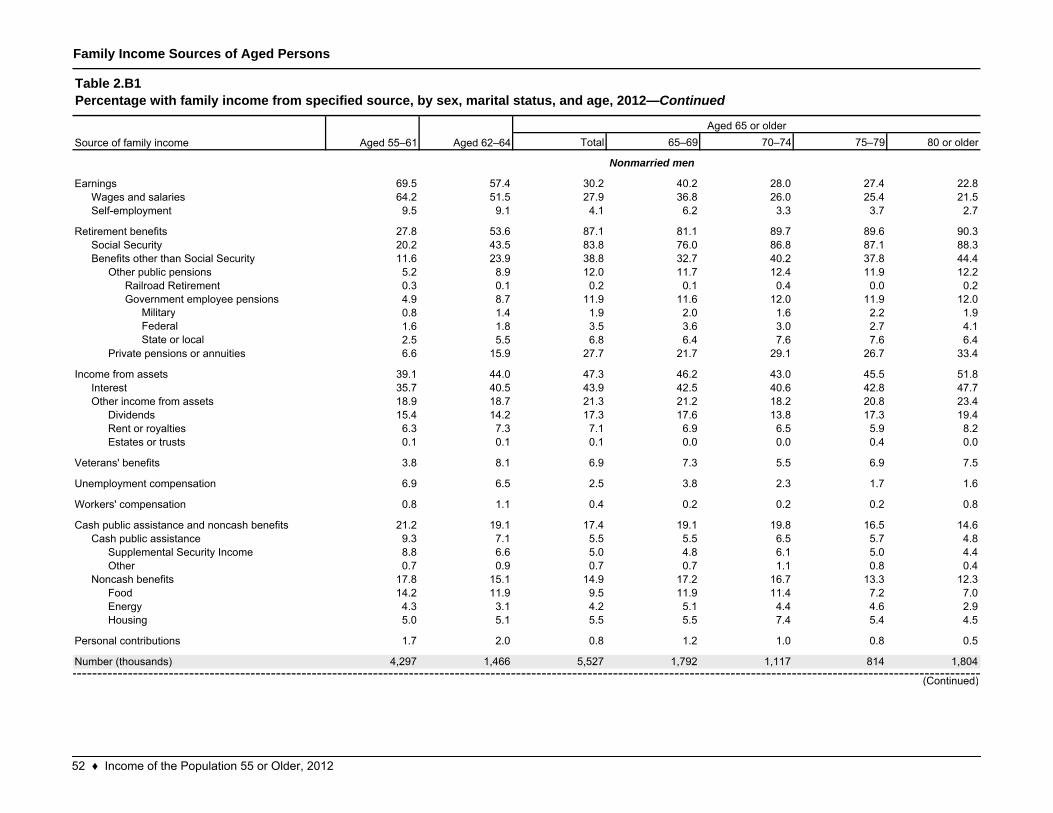
69.5 57.4 30.2 40.2 28.0 27.4 22.864.2 51.5 27.9 36.8 26.0 25.4 21.59.5 9.1 4.1 6.2 3.3 3.7 2.7
27.8 53.6 87.1 81.1 89.7 89.6 90.320.2 43.5 83.8 76.0 86.8 87.1 88.311.6 23.9 38.8 32.7 40.2 37.8 44.45.2 8.9 12.0 11.7 12.4 11.9 12.20.3 0.1 0.2 0.1 0.4 0.0 0.24.9 8.7 11.9 11.6 12.0 11.9 12.0
Military 0.8 1.4 1.9 2.0 1.6 2.2 1.9Federal 1.6 1.8 3.5 3.6 3.0 2.7 4.1State or local 2.5 5.5 6.8 6.4 7.6 7.6 6.4
6.6 15.9 27.7 21.7 29.1 26.7 33.4
39.1 44.0 47.3 46.2 43.0 45.5 51.835.7 40.5 43.9 42.5 40.6 42.8 47.718.9 18.7 21.3 21.2 18.2 20.8 23.415.4 14.2 17.3 17.6 13.8 17.3 19.46.3 7.3 7.1 6.9 6.5 5.9 8.20.1 0.1 0.1 0.0 0.0 0.4 0.0
3.8 8.1 6.9 7.3 5.5 6.9 7.5
6.9 6.5 2.5 3.8 2.3 1.7 1.6
0.8 1.1 0.4 0.2 0.2 0.2 0.8
21.2 19.1 17.4 19.1 19.8 16.5 14.69.3 7.1 5.5 5.5 6.5 5.7 4.88.8 6.6 5.0 4.8 6.1 5.0 4.40.7 0.9 0.7 0.7 1.1 0.8 0.4
17.8 15.1 14.9 17.2 16.7 13.3 12.314.2 11.9 9.5 11.9 11.4 7.2 7.04.3 3.1 4.2 5.1 4.4 4.6 2.95.0 5.1 5.5 5.5 7.4 5.4 4.5
1.7 2.0 0.8 1.2 1.0 0.8 0.5
4,297 1,466 5,527 1,792 1,117 814 1,804
InterestOther income from assets
DividendsRent or royaltiesEstates or trusts
Veterans' benefits
Unemployment compensation
Workers' compensation
Cash public assistance and noncash benefitsCash public assistance
Supplemental Security IncomeOther
Noncash benefitsFoodEnergyHousing
Personal contributions
Number (thousands)
EarningsWages and salariesSelf-employment
Retirement benefitsSocial Security
Table 2.B1Percentage with family income from specified source, by sex, marital status, and age, 2012—Continued
Source of family income
Nonmarried men
Aged 55–61 Aged 62–64Aged 65 or older
(Continued)
Government employee pensions
Private pensions or annuities
Income from assets
Benefits other than Social SecurityOther public pensions
Railroad Retirement
52 ♦ Income of the Population 55 or Older, 2012
Family Income Sources of Aged Persons
Total 65–69 70–74 75–79 80 or older
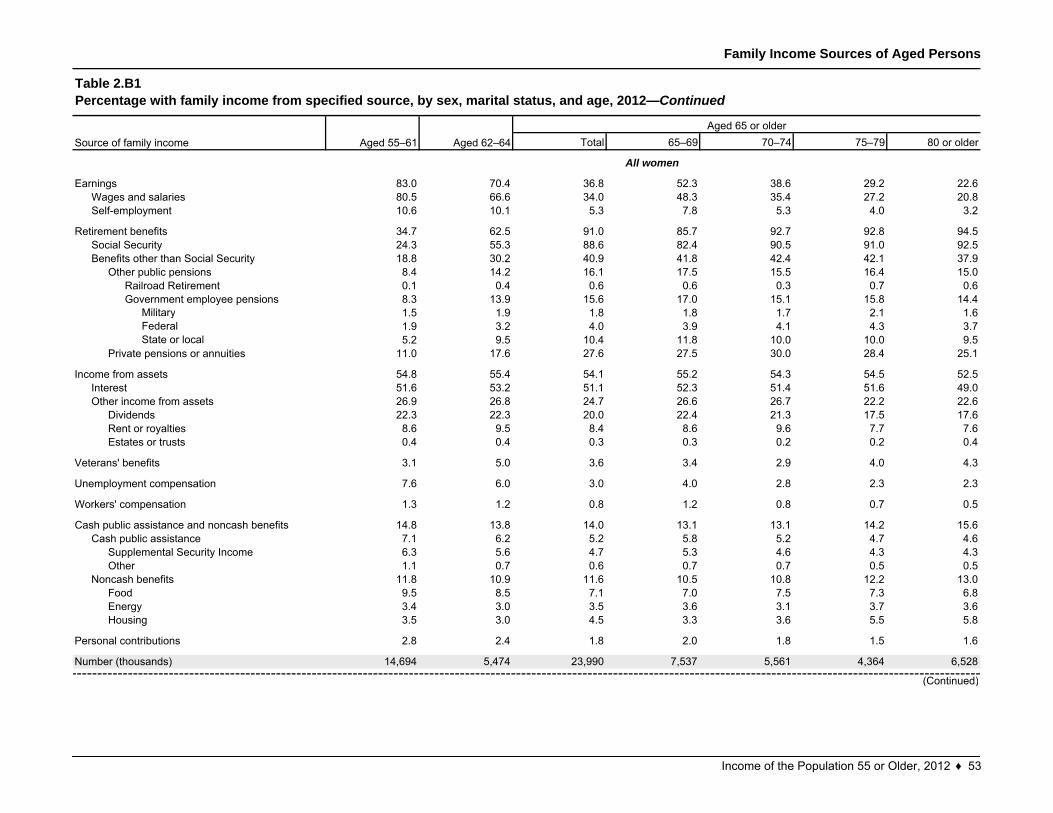
83.0 70.4 36.8 52.3 38.6 29.2 22.680.5 66.6 34.0 48.3 35.4 27.2 20.810.6 10.1 5.3 7.8 5.3 4.0 3.2
34.7 62.5 91.0 85.7 92.7 92.8 94.524.3 55.3 88.6 82.4 90.5 91.0 92.518.8 30.2 40.9 41.8 42.4 42.1 37.98.4 14.2 16.1 17.5 15.5 16.4 15.00.1 0.4 0.6 0.6 0.3 0.7 0.68.3 13.9 15.6 17.0 15.1 15.8 14.4
Military 1.5 1.9 1.8 1.8 1.7 2.1 1.6Federal 1.9 3.2 4.0 3.9 4.1 4.3 3.7State or local 5.2 9.5 10.4 11.8 10.0 10.0 9.5
11.0 17.6 27.6 27.5 30.0 28.4 25.1
54.8 55.4 54.1 55.2 54.3 54.5 52.551.6 53.2 51.1 52.3 51.4 51.6 49.026.9 26.8 24.7 26.6 26.7 22.2 22.622.3 22.3 20.0 22.4 21.3 17.5 17.68.6 9.5 8.4 8.6 9.6 7.7 7.60.4 0.4 0.3 0.3 0.2 0.2 0.4
3.1 5.0 3.6 3.4 2.9 4.0 4.3
7.6 6.0 3.0 4.0 2.8 2.3 2.3
1.3 1.2 0.8 1.2 0.8 0.7 0.5
14.8 13.8 14.0 13.1 13.1 14.2 15.67.1 6.2 5.2 5.8 5.2 4.7 4.66.3 5.6 4.7 5.3 4.6 4.3 4.31.1 0.7 0.6 0.7 0.7 0.5 0.5
11.8 10.9 11.6 10.5 10.8 12.2 13.09.5 8.5 7.1 7.0 7.5 7.3 6.83.4 3.0 3.5 3.6 3.1 3.7 3.63.5 3.0 4.5 3.3 3.6 5.5 5.8
2.8 2.4 1.8 2.0 1.8 1.5 1.6
14,694 5,474 23,990 7,537 5,561 4,364 6,528
Supplemental Security IncomeOther
Noncash benefitsFoodEnergyHousing
Personal contributions
Number (thousands)
Other public pensionsRailroad RetirementGovernment employee pensions
Private pensions or annuities
Income from assetsInterestOther income from assets
DividendsRent or royaltiesEstates or trusts
Veterans' benefits
Unemployment compensation
(Continued)
Workers' compensation
Cash public assistance and noncash benefitsCash public assistance
Retirement benefitsSocial SecurityBenefits other than Social Security
EarningsWages and salariesSelf-employment
All women
Table 2.B1Percentage with family income from specified source, by sex, marital status, and age, 2012—Continued
Source of family income Aged 55–61 Aged 62–64Aged 65 or older
Income of the Population 55 or Older, 2012 ♦ 53
Family Income Sources of Aged Persons
Total 65–69 70–74 75–79 80 or older
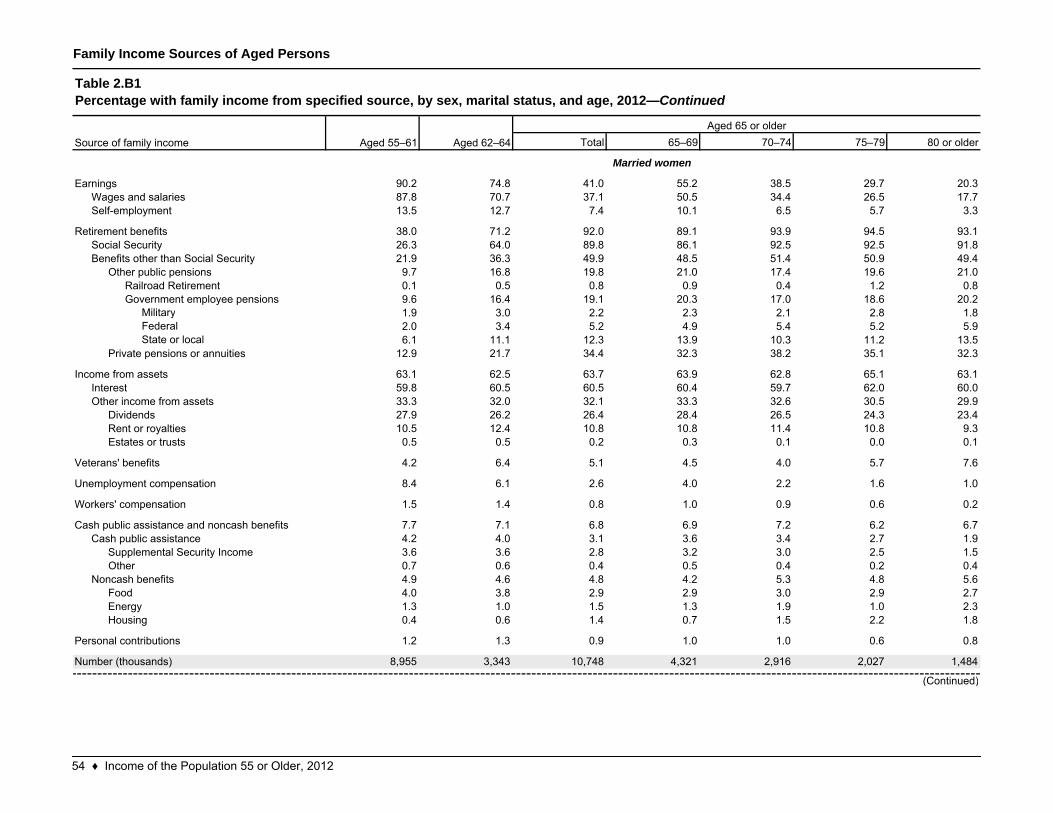
90.2 74.8 41.0 55.2 38.5 29.7 20.387.8 70.7 37.1 50.5 34.4 26.5 17.713.5 12.7 7.4 10.1 6.5 5.7 3.3
38.0 71.2 92.0 89.1 93.9 94.5 93.126.3 64.0 89.8 86.1 92.5 92.5 91.821.9 36.3 49.9 48.5 51.4 50.9 49.49.7 16.8 19.8 21.0 17.4 19.6 21.00.1 0.5 0.8 0.9 0.4 1.2 0.89.6 16.4 19.1 20.3 17.0 18.6 20.2
Military 1.9 3.0 2.2 2.3 2.1 2.8 1.8Federal 2.0 3.4 5.2 4.9 5.4 5.2 5.9State or local 6.1 11.1 12.3 13.9 10.3 11.2 13.5
12.9 21.7 34.4 32.3 38.2 35.1 32.3
63.1 62.5 63.7 63.9 62.8 65.1 63.159.8 60.5 60.5 60.4 59.7 62.0 60.033.3 32.0 32.1 33.3 32.6 30.5 29.927.9 26.2 26.4 28.4 26.5 24.3 23.410.5 12.4 10.8 10.8 11.4 10.8 9.30.5 0.5 0.2 0.3 0.1 0.0 0.1
4.2 6.4 5.1 4.5 4.0 5.7 7.6
8.4 6.1 2.6 4.0 2.2 1.6 1.0
1.5 1.4 0.8 1.0 0.9 0.6 0.2
7.7 7.1 6.8 6.9 7.2 6.2 6.74.2 4.0 3.1 3.6 3.4 2.7 1.93.6 3.6 2.8 3.2 3.0 2.5 1.50.7 0.6 0.4 0.5 0.4 0.2 0.44.9 4.6 4.8 4.2 5.3 4.8 5.64.0 3.8 2.9 2.9 3.0 2.9 2.71.3 1.0 1.5 1.3 1.9 1.0 2.30.4 0.6 1.4 0.7 1.5 2.2 1.8
1.2 1.3 0.9 1.0 1.0 0.6 0.8
8,955 3,343 10,748 4,321 2,916 2,027 1,484
Veterans' benefits
Unemployment compensation
Workers' compensation
Cash public assistance and noncash benefitsCash public assistance
Supplemental Security Income
EnergyHousing
Personal contributions
Number (thousands)
(Continued)
OtherNoncash benefits
Food
Wages and salariesSelf-employment
Retirement benefitsSocial SecurityBenefits other than Social Security
Other public pensionsRailroad RetirementGovernment employee pensions
Private pensions or annuities
Income from assetsInterestOther income from assets
DividendsRent or royaltiesEstates or trusts
Earnings
Table 2.B1Percentage with family income from specified source, by sex, marital status, and age, 2012—Continued
Source of family income Aged 55–61 Aged 62–64Aged 65 or older
Married women
54 ♦ Income of the Population 55 or Older, 2012
Family Income Sources of Aged Persons
Total 65–69 70–74 75–79 80 or older
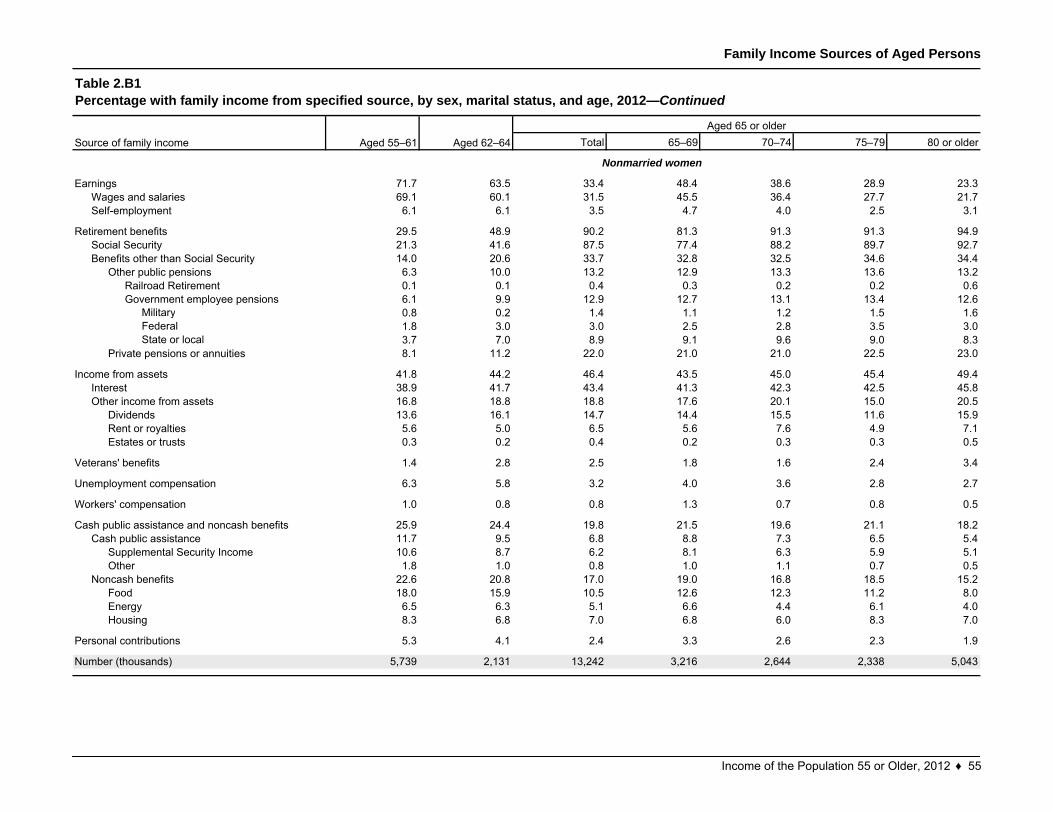
71.7 63.5 33.4 48.4 38.6 28.9 23.369.1 60.1 31.5 45.5 36.4 27.7 21.76.1 6.1 3.5 4.7 4.0 2.5 3.1
29.5 48.9 90.2 81.3 91.3 91.3 94.921.3 41.6 87.5 77.4 88.2 89.7 92.714.0 20.6 33.7 32.8 32.5 34.6 34.46.3 10.0 13.2 12.9 13.3 13.6 13.20.1 0.1 0.4 0.3 0.2 0.2 0.66.1 9.9 12.9 12.7 13.1 13.4 12.6
Military 0.8 0.2 1.4 1.1 1.2 1.5 1.6Federal 1.8 3.0 3.0 2.5 2.8 3.5 3.0State or local 3.7 7.0 8.9 9.1 9.6 9.0 8.3
8.1 11.2 22.0 21.0 21.0 22.5 23.0
41.8 44.2 46.4 43.5 45.0 45.4 49.438.9 41.7 43.4 41.3 42.3 42.5 45.816.8 18.8 18.8 17.6 20.1 15.0 20.513.6 16.1 14.7 14.4 15.5 11.6 15.95.6 5.0 6.5 5.6 7.6 4.9 7.10.3 0.2 0.4 0.2 0.3 0.3 0.5
1.4 2.8 2.5 1.8 1.6 2.4 3.4
6.3 5.8 3.2 4.0 3.6 2.8 2.7
1.0 0.8 0.8 1.3 0.7 0.8 0.5
25.9 24.4 19.8 21.5 19.6 21.1 18.211.7 9.5 6.8 8.8 7.3 6.5 5.410.6 8.7 6.2 8.1 6.3 5.9 5.11.8 1.0 0.8 1.0 1.1 0.7 0.5
22.6 20.8 17.0 19.0 16.8 18.5 15.218.0 15.9 10.5 12.6 12.3 11.2 8.06.5 6.3 5.1 6.6 4.4 6.1 4.08.3 6.8 7.0 6.8 6.0 8.3 7.0
5.3 4.1 2.4 3.3 2.6 2.3 1.9
5,739 2,131 13,242 3,216 2,644 2,338 5,043
Rent or royaltiesEstates or trusts
Veterans' benefits
Housing
Personal contributions
Number (thousands)
Cash public assistanceSupplemental Security IncomeOther
Noncash benefitsFoodEnergy
Aged 55–61 Aged 62–64Aged 65 or older
Government employee pensions
Private pensions or annuities
Income from assetsInterestOther income from assets
Dividends
Unemployment compensation
Workers' compensation
Cash public assistance and noncash benefits
EarningsWages and salariesSelf-employment
Retirement benefitsSocial SecurityBenefits other than Social Security
Other public pensionsRailroad Retirement
Table 2.B1Percentage with family income from specified source, by sex, marital status, and age, 2012—Continued
Source of family income
Nonmarried women
Income of the Population 55 or Older, 2012 ♦ 55
Family Income Sources of Aged Persons
55–61 62–64 65 or older 55–61 62–64 65 or older 55–61 62–64 65 or older
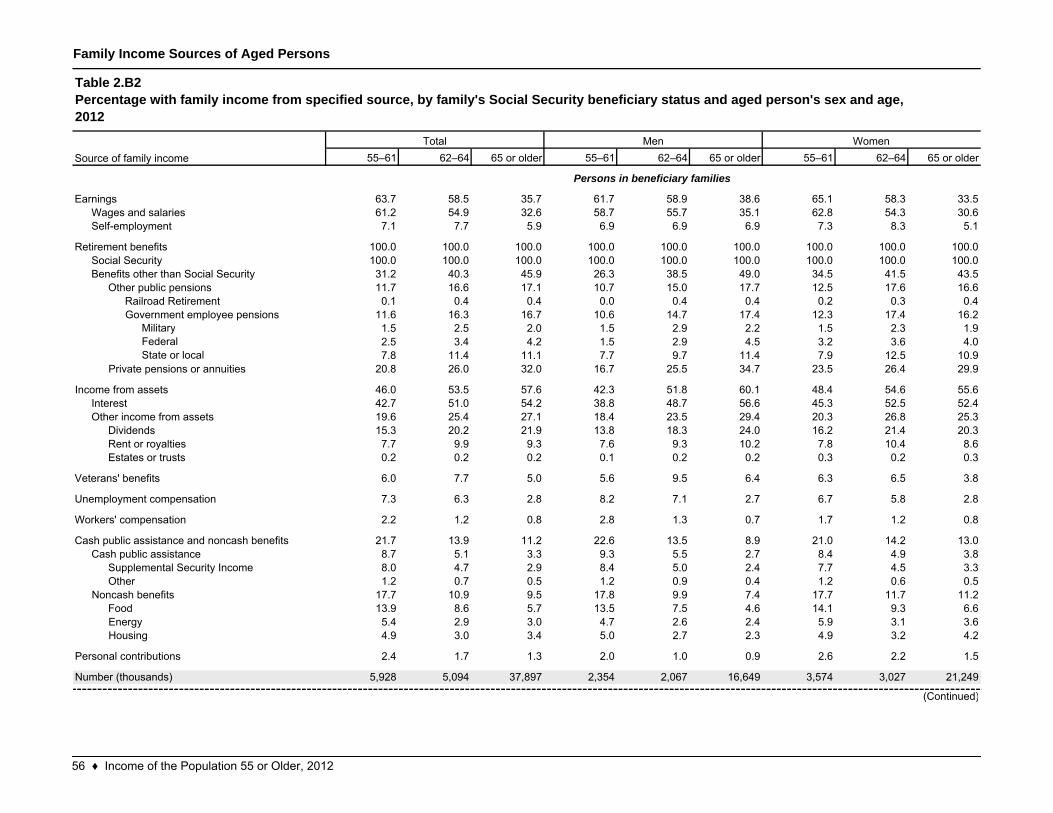
63.7 58.5 35.7 61.7 58.9 38.6 65.1 58.3 33.561.2 54.9 32.6 58.7 55.7 35.1 62.8 54.3 30.67.1 7.7 5.9 6.9 6.9 6.9 7.3 8.3 5.1
100.0 100.0 100.0 100.0 100.0 100.0 100.0 100.0 100.0100.0 100.0 100.0 100.0 100.0 100.0 100.0 100.0 100.031.2 40.3 45.9 26.3 38.5 49.0 34.5 41.5 43.511.7 16.6 17.1 10.7 15.0 17.7 12.5 17.6 16.60.1 0.4 0.4 0.0 0.4 0.4 0.2 0.3 0.4
11.6 16.3 16.7 10.6 14.7 17.4 12.3 17.4 16.2Military 1.5 2.5 2.0 1.5 2.9 2.2 1.5 2.3 1.9Federal 2.5 3.4 4.2 1.5 2.9 4.5 3.2 3.6 4.0State or local 7.8 11.4 11.1 7.7 9.7 11.4 7.9 12.5 10.9
20.8 26.0 32.0 16.7 25.5 34.7 23.5 26.4 29.9
46.0 53.5 57.6 42.3 51.8 60.1 48.4 54.6 55.642.7 51.0 54.2 38.8 48.7 56.6 45.3 52.5 52.419.6 25.4 27.1 18.4 23.5 29.4 20.3 26.8 25.315.3 20.2 21.9 13.8 18.3 24.0 16.2 21.4 20.37.7 9.9 9.3 7.6 9.3 10.2 7.8 10.4 8.60.2 0.2 0.2 0.1 0.2 0.2 0.3 0.2 0.3
6.0 7.7 5.0 5.6 9.5 6.4 6.3 6.5 3.8
7.3 6.3 2.8 8.2 7.1 2.7 6.7 5.8 2.8
2.2 1.2 0.8 2.8 1.3 0.7 1.7 1.2 0.8
21.7 13.9 11.2 22.6 13.5 8.9 21.0 14.2 13.08.7 5.1 3.3 9.3 5.5 2.7 8.4 4.9 3.88.0 4.7 2.9 8.4 5.0 2.4 7.7 4.5 3.31.2 0.7 0.5 1.2 0.9 0.4 1.2 0.6 0.5
17.7 10.9 9.5 17.8 9.9 7.4 17.7 11.7 11.213.9 8.6 5.7 13.5 7.5 4.6 14.1 9.3 6.65.4 2.9 3.0 4.7 2.6 2.4 5.9 3.1 3.64.9 3.0 3.4 5.0 2.7 2.3 4.9 3.2 4.2
2.4 1.7 1.3 2.0 1.0 0.9 2.6 2.2 1.5
5,928 5,094 37,897 2,354 2,067 16,649 3,574 3,027 21,249
Noncash benefits
EnergyHousing
Personal contributions
Number (thousands)
Government employee pensions
Private pensions or annuities
Income from assets
(Continued)
Interest
Food
DividendsRent or royaltiesEstates or trusts
Veterans' benefits
Unemployment compensation
Workers' compensation
Cash public assistance and noncash benefitsCash public assistance
Supplemental Security IncomeOther
Table 2.B2Percentage with family income from specified source, by family's Social Security beneficiary status and aged person's sex and age,2012
Total Men WomenSource of family income
EarningsWages and salariesSelf-employment
Retirement benefitsSocial SecurityBenefits other than Social Security
Other public pensionsRailroad Retirement
Other income from assets
Persons in beneficiary families
56 ♦ Income of the Population 55 or Older, 2012
Family Income Sources of Aged Persons
55–61 62–64 65 or older 55–61 62–64 65 or older 55–61 62–64 65 or older
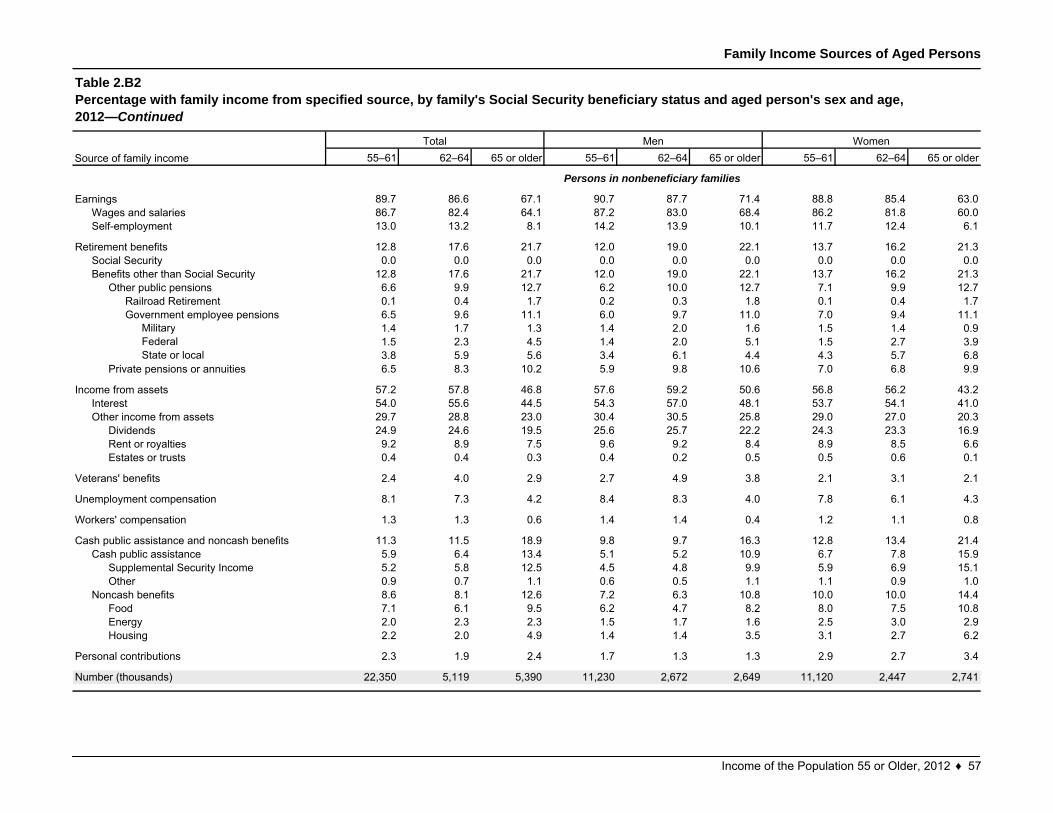
89.7 86.6 67.1 90.7 87.7 71.4 88.8 85.4 63.086.7 82.4 64.1 87.2 83.0 68.4 86.2 81.8 60.013.0 13.2 8.1 14.2 13.9 10.1 11.7 12.4 6.1
12.8 17.6 21.7 12.0 19.0 22.1 13.7 16.2 21.30.0 0.0 0.0 0.0 0.0 0.0 0.0 0.0 0.0
12.8 17.6 21.7 12.0 19.0 22.1 13.7 16.2 21.36.6 9.9 12.7 6.2 10.0 12.7 7.1 9.9 12.70.1 0.4 1.7 0.2 0.3 1.8 0.1 0.4 1.76.5 9.6 11.1 6.0 9.7 11.0 7.0 9.4 11.1
Military 1.4 1.7 1.3 1.4 2.0 1.6 1.5 1.4 0.9Federal 1.5 2.3 4.5 1.4 2.0 5.1 1.5 2.7 3.9State or local 3.8 5.9 5.6 3.4 6.1 4.4 4.3 5.7 6.8
6.5 8.3 10.2 5.9 9.8 10.6 7.0 6.8 9.9
57.2 57.8 46.8 57.6 59.2 50.6 56.8 56.2 43.254.0 55.6 44.5 54.3 57.0 48.1 53.7 54.1 41.029.7 28.8 23.0 30.4 30.5 25.8 29.0 27.0 20.324.9 24.6 19.5 25.6 25.7 22.2 24.3 23.3 16.99.2 8.9 7.5 9.6 9.2 8.4 8.9 8.5 6.60.4 0.4 0.3 0.4 0.2 0.5 0.5 0.6 0.1
2.4 4.0 2.9 2.7 4.9 3.8 2.1 3.1 2.1
8.1 7.3 4.2 8.4 8.3 4.0 7.8 6.1 4.3
1.3 1.3 0.6 1.4 1.4 0.4 1.2 1.1 0.8
11.3 11.5 18.9 9.8 9.7 16.3 12.8 13.4 21.45.9 6.4 13.4 5.1 5.2 10.9 6.7 7.8 15.95.2 5.8 12.5 4.5 4.8 9.9 5.9 6.9 15.10.9 0.7 1.1 0.6 0.5 1.1 1.1 0.9 1.08.6 8.1 12.6 7.2 6.3 10.8 10.0 10.0 14.47.1 6.1 9.5 6.2 4.7 8.2 8.0 7.5 10.82.0 2.3 2.3 1.5 1.7 1.6 2.5 3.0 2.92.2 2.0 4.9 1.4 1.4 3.5 3.1 2.7 6.2
2.3 1.9 2.4 1.7 1.3 1.3 2.9 2.7 3.4
22,350 5,119 5,390 11,230 2,672 2,649 11,120 2,447 2,741
Energy
Workers' compensation
Housing
Personal contributions
Number (thousands)
Cash public assistance and noncash benefitsCash public assistance
Supplemental Security IncomeOther
Noncash benefitsFood
Unemployment compensation
Self-employment
Retirement benefitsSocial SecurityBenefits other than Social Security
Other public pensions
Government employee pensions
Private pensions or annuities
Income from assetsInterestOther income from assets
DividendsRent or royaltiesEstates or trusts
Veterans' benefits
Railroad Retirement
EarningsWages and salaries
Table 2.B2Percentage with family income from specified source, by family's Social Security beneficiary status and aged person's sex and age,2012—Continued
Source of family incomeTotal Men Women
Persons in nonbeneficiary families
Income of the Population 55 or Older, 2012 ♦ 57
Family Income Sources of Aged Persons
55–61 62–64 65 or older 55–61 62–64 65 or older 55–61 62–64 65 or older 55–61 62–64 65 or older
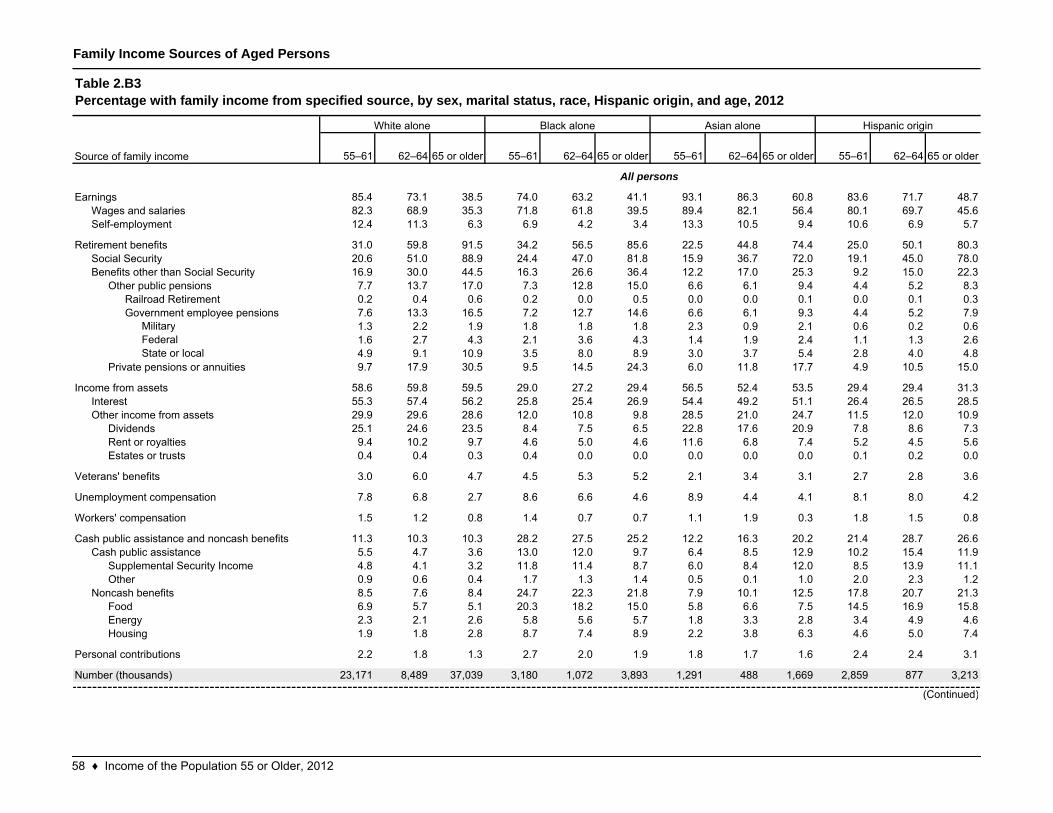
85.4 73.1 38.5 74.0 63.2 41.1 93.1 86.3 60.8 83.6 71.7 48.782.3 68.9 35.3 71.8 61.8 39.5 89.4 82.1 56.4 80.1 69.7 45.612.4 11.3 6.3 6.9 4.2 3.4 13.3 10.5 9.4 10.6 6.9 5.7
31.0 59.8 91.5 34.2 56.5 85.6 22.5 44.8 74.4 25.0 50.1 80.320.6 51.0 88.9 24.4 47.0 81.8 15.9 36.7 72.0 19.1 45.0 78.016.9 30.0 44.5 16.3 26.6 36.4 12.2 17.0 25.3 9.2 15.0 22.37.7 13.7 17.0 7.3 12.8 15.0 6.6 6.1 9.4 4.4 5.2 8.30.2 0.4 0.6 0.2 0.0 0.5 0.0 0.0 0.1 0.0 0.1 0.37.6 13.3 16.5 7.2 12.7 14.6 6.6 6.1 9.3 4.4 5.2 7.9
Military 1.3 2.2 1.9 1.8 1.8 1.8 2.3 0.9 2.1 0.6 0.2 0.6Federal 1.6 2.7 4.3 2.1 3.6 4.3 1.4 1.9 2.4 1.1 1.3 2.6State or local 4.9 9.1 10.9 3.5 8.0 8.9 3.0 3.7 5.4 2.8 4.0 4.8
9.7 17.9 30.5 9.5 14.5 24.3 6.0 11.8 17.7 4.9 10.5 15.0
58.6 59.8 59.5 29.0 27.2 29.4 56.5 52.4 53.5 29.4 29.4 31.355.3 57.4 56.2 25.8 25.4 26.9 54.4 49.2 51.1 26.4 26.5 28.529.9 29.6 28.6 12.0 10.8 9.8 28.5 21.0 24.7 11.5 12.0 10.925.1 24.6 23.5 8.4 7.5 6.5 22.8 17.6 20.9 7.8 8.6 7.39.4 10.2 9.7 4.6 5.0 4.6 11.6 6.8 7.4 5.2 4.5 5.60.4 0.4 0.3 0.4 0.0 0.0 0.0 0.0 0.0 0.1 0.2 0.0
3.0 6.0 4.7 4.5 5.3 5.2 2.1 3.4 3.1 2.7 2.8 3.6
7.8 6.8 2.7 8.6 6.6 4.6 8.9 4.4 4.1 8.1 8.0 4.2
1.5 1.2 0.8 1.4 0.7 0.7 1.1 1.9 0.3 1.8 1.5 0.8
11.3 10.3 10.3 28.2 27.5 25.2 12.2 16.3 20.2 21.4 28.7 26.65.5 4.7 3.6 13.0 12.0 9.7 6.4 8.5 12.9 10.2 15.4 11.94.8 4.1 3.2 11.8 11.4 8.7 6.0 8.4 12.0 8.5 13.9 11.10.9 0.6 0.4 1.7 1.3 1.4 0.5 0.1 1.0 2.0 2.3 1.28.5 7.6 8.4 24.7 22.3 21.8 7.9 10.1 12.5 17.8 20.7 21.36.9 5.7 5.1 20.3 18.2 15.0 5.8 6.6 7.5 14.5 16.9 15.82.3 2.1 2.6 5.8 5.6 5.7 1.8 3.3 2.8 3.4 4.9 4.61.9 1.8 2.8 8.7 7.4 8.9 2.2 3.8 6.3 4.6 5.0 7.4
2.2 1.8 1.3 2.7 2.0 1.9 1.8 1.7 1.6 2.4 2.4 3.1
23,171 8,489 37,039 3,180 1,072 3,893 1,291 488 1,669 2,859 877 3,213
Food
DividendsRent or royaltiesEstates or trusts
Veterans' benefits
Unemployment compensation
Workers' compensation
EnergyHousing
Personal contributions
Number (thousands)
Cash public assistance and noncash benefitsCash public assistance
Supplemental Security IncomeOther
Noncash benefits
Source of family income
EarningsWages and salariesSelf-employment
Retirement benefitsSocial SecurityBenefits other than Social Security
Other public pensions
All persons
Railroad RetirementGovernment employee pensions
Private pensions or annuities
Income from assetsInterestOther income from assets
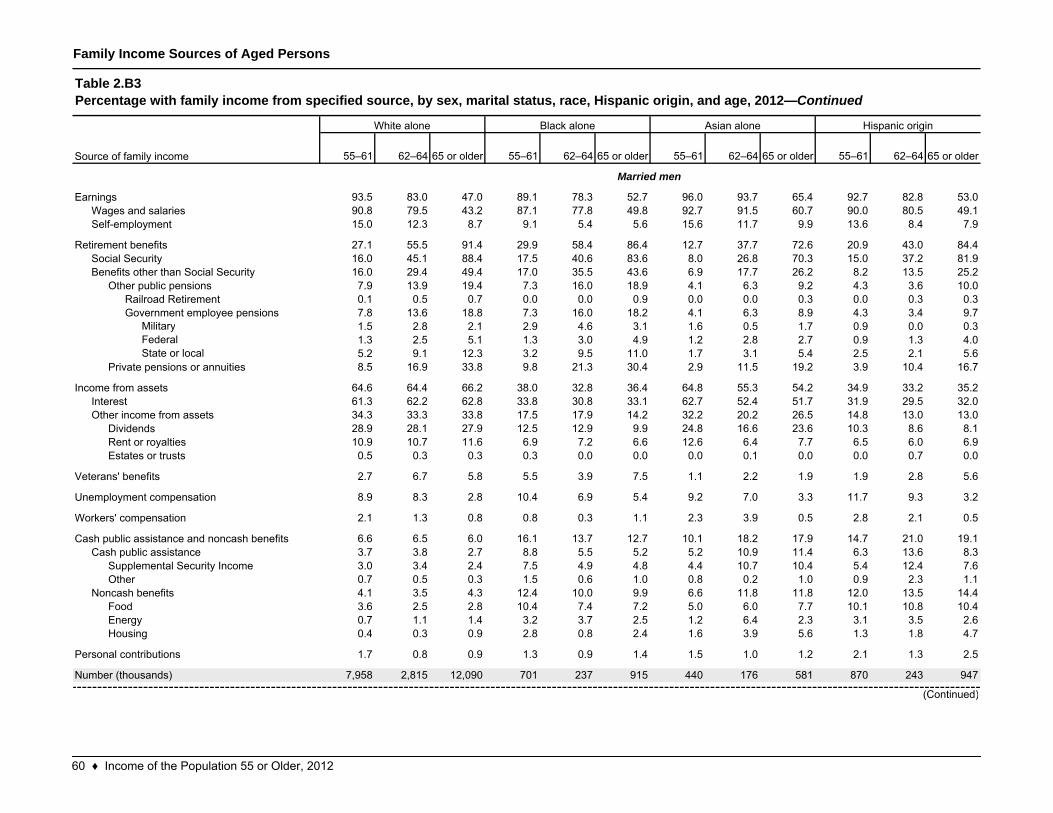
Table 2.B3Percentage with family income from specified source, by sex, marital status, race, Hispanic origin, and age, 2012
White alone Black alone Asian alone Hispanic origin
(Continued)
58 ♦ Income of the Population 55 or Older, 2012
Family Income Sources of Aged Persons
55–61 62–64 65 or older 55–61 62–64 65 or older 55–61 62–64 65 or older 55–61 62–64 65 or older
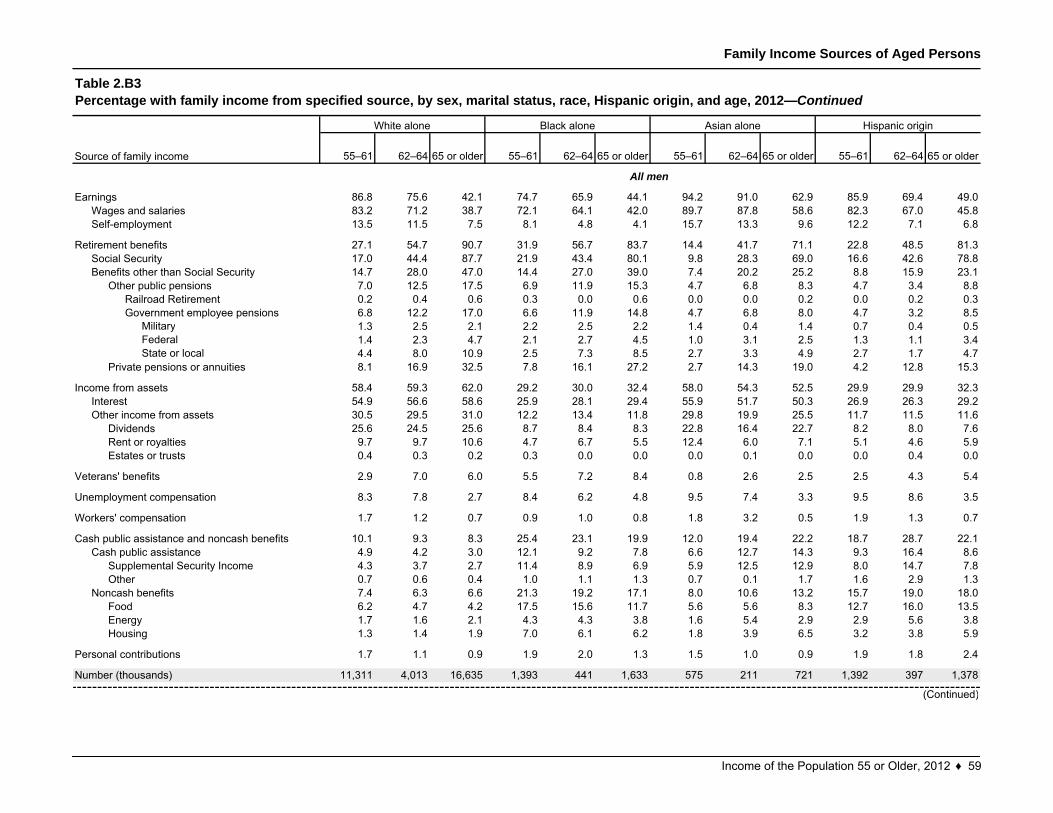
86.8 75.6 42.1 74.7 65.9 44.1 94.2 91.0 62.9 85.9 69.4 49.083.2 71.2 38.7 72.1 64.1 42.0 89.7 87.8 58.6 82.3 67.0 45.813.5 11.5 7.5 8.1 4.8 4.1 15.7 13.3 9.6 12.2 7.1 6.8
27.1 54.7 90.7 31.9 56.7 83.7 14.4 41.7 71.1 22.8 48.5 81.317.0 44.4 87.7 21.9 43.4 80.1 9.8 28.3 69.0 16.6 42.6 78.814.7 28.0 47.0 14.4 27.0 39.0 7.4 20.2 25.2 8.8 15.9 23.17.0 12.5 17.5 6.9 11.9 15.3 4.7 6.8 8.3 4.7 3.4 8.80.2 0.4 0.6 0.3 0.0 0.6 0.0 0.0 0.2 0.0 0.2 0.36.8 12.2 17.0 6.6 11.9 14.8 4.7 6.8 8.0 4.7 3.2 8.5
Military 1.3 2.5 2.1 2.2 2.5 2.2 1.4 0.4 1.4 0.7 0.4 0.5Federal 1.4 2.3 4.7 2.1 2.7 4.5 1.0 3.1 2.5 1.3 1.1 3.4State or local 4.4 8.0 10.9 2.5 7.3 8.5 2.7 3.3 4.9 2.7 1.7 4.7
8.1 16.9 32.5 7.8 16.1 27.2 2.7 14.3 19.0 4.2 12.8 15.3
58.4 59.3 62.0 29.2 30.0 32.4 58.0 54.3 52.5 29.9 29.9 32.354.9 56.6 58.6 25.9 28.1 29.4 55.9 51.7 50.3 26.9 26.3 29.230.5 29.5 31.0 12.2 13.4 11.8 29.8 19.9 25.5 11.7 11.5 11.625.6 24.5 25.6 8.7 8.4 8.3 22.8 16.4 22.7 8.2 8.0 7.69.7 9.7 10.6 4.7 6.7 5.5 12.4 6.0 7.1 5.1 4.6 5.90.4 0.3 0.2 0.3 0.0 0.0 0.0 0.1 0.0 0.0 0.4 0.0
2.9 7.0 6.0 5.5 7.2 8.4 0.8 2.6 2.5 2.5 4.3 5.4
8.3 7.8 2.7 8.4 6.2 4.8 9.5 7.4 3.3 9.5 8.6 3.5
1.7 1.2 0.7 0.9 1.0 0.8 1.8 3.2 0.5 1.9 1.3 0.7
10.1 9.3 8.3 25.4 23.1 19.9 12.0 19.4 22.2 18.7 28.7 22.14.9 4.2 3.0 12.1 9.2 7.8 6.6 12.7 14.3 9.3 16.4 8.64.3 3.7 2.7 11.4 8.9 6.9 5.9 12.5 12.9 8.0 14.7 7.80.7 0.6 0.4 1.0 1.1 1.3 0.7 0.1 1.7 1.6 2.9 1.37.4 6.3 6.6 21.3 19.2 17.1 8.0 10.6 13.2 15.7 19.0 18.06.2 4.7 4.2 17.5 15.6 11.7 5.6 5.6 8.3 12.7 16.0 13.51.7 1.6 2.1 4.3 4.3 3.8 1.6 5.4 2.9 2.9 5.6 3.81.3 1.4 1.9 7.0 6.1 6.2 1.8 3.9 6.5 3.2 3.8 5.9
1.7 1.1 0.9 1.9 2.0 1.3 1.5 1.0 0.9 1.9 1.8 2.4
11,311 4,013 16,635 1,393 441 1,633 575 211 721 1,392 397 1,378
Government employee pensions
Private pensions or annuities
Income from assetsInterestOther income from assets
DividendsRent or royaltiesEstates or trusts
Veterans' benefits
Unemployment compensation
Workers' compensation
Cash public assistance and noncash benefitsCash public assistance
Supplemental Security IncomeOther
Noncash benefitsFoodEnergyHousing
Personal contributions
Number (thousands)
Benefits other than Social SecurityOther public pensions
Railroad Retirement
EarningsWages and salariesSelf-employment
Retirement benefitsSocial Security
All men
(Continued)
Table 2.B3Percentage with family income from specified source, by sex, marital status, race, Hispanic origin, and age, 2012—Continued
Source of family income
White alone Black alone Asian alone Hispanic origin
Income of the Population 55 or Older, 2012 ♦ 59
Family Income Sources of Aged Persons
55–61 62–64 65 or older 55–61 62–64 65 or older 55–61 62–64 65 or older 55–61 62–64 65 or older
93.5 83.0 47.0 89.1 78.3 52.7 96.0 93.7 65.4 92.7 82.8 53.090.8 79.5 43.2 87.1 77.8 49.8 92.7 91.5 60.7 90.0 80.5 49.115.0 12.3 8.7 9.1 5.4 5.6 15.6 11.7 9.9 13.6 8.4 7.9
27.1 55.5 91.4 29.9 58.4 86.4 12.7 37.7 72.6 20.9 43.0 84.416.0 45.1 88.4 17.5 40.6 83.6 8.0 26.8 70.3 15.0 37.2 81.916.0 29.4 49.4 17.0 35.5 43.6 6.9 17.7 26.2 8.2 13.5 25.27.9 13.9 19.4 7.3 16.0 18.9 4.1 6.3 9.2 4.3 3.6 10.00.1 0.5 0.7 0.0 0.0 0.9 0.0 0.0 0.3 0.0 0.3 0.37.8 13.6 18.8 7.3 16.0 18.2 4.1 6.3 8.9 4.3 3.4 9.7
Military 1.5 2.8 2.1 2.9 4.6 3.1 1.6 0.5 1.7 0.9 0.0 0.3Federal 1.3 2.5 5.1 1.3 3.0 4.9 1.2 2.8 2.7 0.9 1.3 4.0State or local 5.2 9.1 12.3 3.2 9.5 11.0 1.7 3.1 5.4 2.5 2.1 5.6
8.5 16.9 33.8 9.8 21.3 30.4 2.9 11.5 19.2 3.9 10.4 16.7
64.6 64.4 66.2 38.0 32.8 36.4 64.8 55.3 54.2 34.9 33.2 35.261.3 62.2 62.8 33.8 30.8 33.1 62.7 52.4 51.7 31.9 29.5 32.034.3 33.3 33.8 17.5 17.9 14.2 32.2 20.2 26.5 14.8 13.0 13.028.9 28.1 27.9 12.5 12.9 9.9 24.8 16.6 23.6 10.3 8.6 8.110.9 10.7 11.6 6.9 7.2 6.6 12.6 6.4 7.7 6.5 6.0 6.90.5 0.3 0.3 0.3 0.0 0.0 0.0 0.1 0.0 0.0 0.7 0.0
2.7 6.7 5.8 5.5 3.9 7.5 1.1 2.2 1.9 1.9 2.8 5.6
8.9 8.3 2.8 10.4 6.9 5.4 9.2 7.0 3.3 11.7 9.3 3.2
2.1 1.3 0.8 0.8 0.3 1.1 2.3 3.9 0.5 2.8 2.1 0.5
6.6 6.5 6.0 16.1 13.7 12.7 10.1 18.2 17.9 14.7 21.0 19.13.7 3.8 2.7 8.8 5.5 5.2 5.2 10.9 11.4 6.3 13.6 8.33.0 3.4 2.4 7.5 4.9 4.8 4.4 10.7 10.4 5.4 12.4 7.60.7 0.5 0.3 1.5 0.6 1.0 0.8 0.2 1.0 0.9 2.3 1.14.1 3.5 4.3 12.4 10.0 9.9 6.6 11.8 11.8 12.0 13.5 14.43.6 2.5 2.8 10.4 7.4 7.2 5.0 6.0 7.7 10.1 10.8 10.40.7 1.1 1.4 3.2 3.7 2.5 1.2 6.4 2.3 3.1 3.5 2.60.4 0.3 0.9 2.8 0.8 2.4 1.6 3.9 5.6 1.3 1.8 4.7
1.7 0.8 0.9 1.3 0.9 1.4 1.5 1.0 1.2 2.1 1.3 2.5
7,958 2,815 12,090 701 237 915 440 176 581 870 243 947
Personal contributions
Number (thousands)
FoodEnergyHousing
Retirement benefitsSocial SecurityBenefits other than Social Security
Other public pensionsRailroad RetirementGovernment employee pensions
Private pensions or annuities
Income from assetsInterestOther income from assets
DividendsRent or royaltiesEstates or trusts
Veterans' benefits
Unemployment compensation
Workers' compensation
Cash public assistance and noncash benefitsCash public assistance
Supplemental Security IncomeOther
Noncash benefits
EarningsWages and salariesSelf-employment
Married men
Table 2.B3Percentage with family income from specified source, by sex, marital status, race, Hispanic origin, and age, 2012—Continued
Source of family income
White alone Black alone Asian alone Hispanic origin
(Continued)
60 ♦ Income of the Population 55 or Older, 2012
Family Income Sources of Aged Persons
55–61 62–64 65 or older 55–61 62–64 65 or older 55–61 62–64 65 or older 55–61 62–64 65 or older
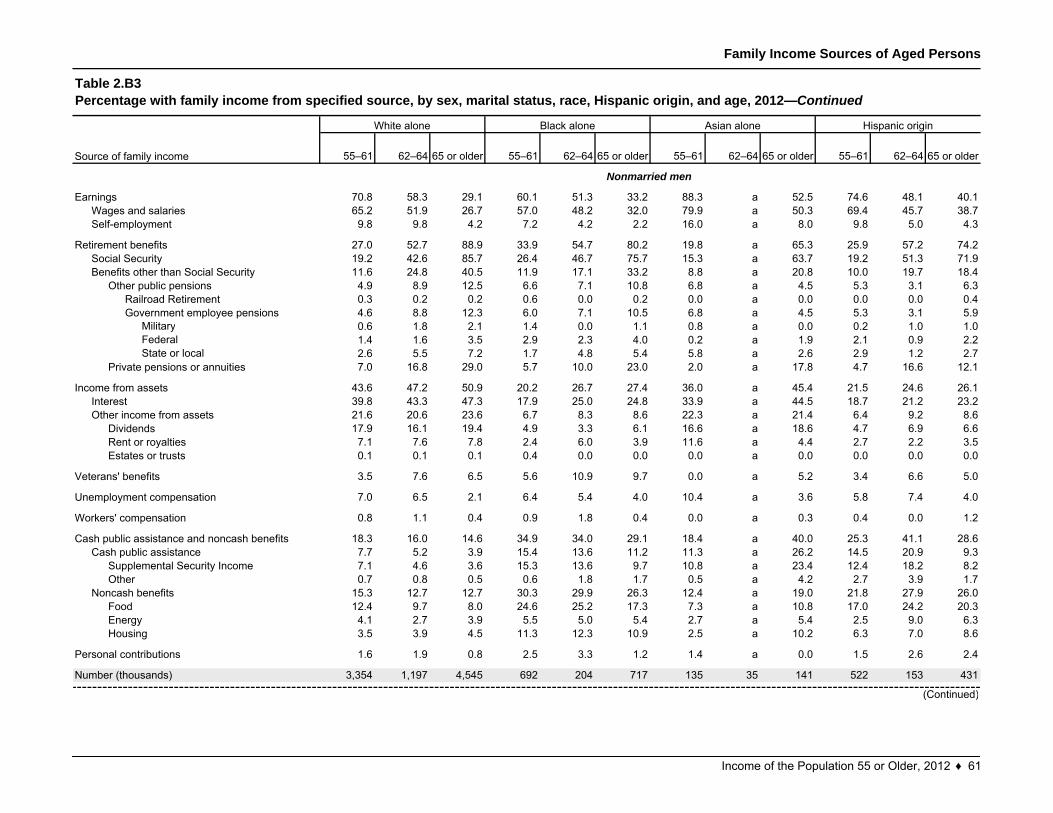
70.8 58.3 29.1 60.1 51.3 33.2 88.3 a 52.5 74.6 48.1 40.165.2 51.9 26.7 57.0 48.2 32.0 79.9 a 50.3 69.4 45.7 38.79.8 9.8 4.2 7.2 4.2 2.2 16.0 a 8.0 9.8 5.0 4.3
27.0 52.7 88.9 33.9 54.7 80.2 19.8 a 65.3 25.9 57.2 74.219.2 42.6 85.7 26.4 46.7 75.7 15.3 a 63.7 19.2 51.3 71.911.6 24.8 40.5 11.9 17.1 33.2 8.8 a 20.8 10.0 19.7 18.44.9 8.9 12.5 6.6 7.1 10.8 6.8 a 4.5 5.3 3.1 6.30.3 0.2 0.2 0.6 0.0 0.2 0.0 a 0.0 0.0 0.0 0.44.6 8.8 12.3 6.0 7.1 10.5 6.8 a 4.5 5.3 3.1 5.9
Military 0.6 1.8 2.1 1.4 0.0 1.1 0.8 a 0.0 0.2 1.0 1.0Federal 1.4 1.6 3.5 2.9 2.3 4.0 0.2 a 1.9 2.1 0.9 2.2State or local 2.6 5.5 7.2 1.7 4.8 5.4 5.8 a 2.6 2.9 1.2 2.7
7.0 16.8 29.0 5.7 10.0 23.0 2.0 a 17.8 4.7 16.6 12.1
43.6 47.2 50.9 20.2 26.7 27.4 36.0 a 45.4 21.5 24.6 26.139.8 43.3 47.3 17.9 25.0 24.8 33.9 a 44.5 18.7 21.2 23.221.6 20.6 23.6 6.7 8.3 8.6 22.3 a 21.4 6.4 9.2 8.617.9 16.1 19.4 4.9 3.3 6.1 16.6 a 18.6 4.7 6.9 6.67.1 7.6 7.8 2.4 6.0 3.9 11.6 a 4.4 2.7 2.2 3.50.1 0.1 0.1 0.4 0.0 0.0 0.0 a 0.0 0.0 0.0 0.0
3.5 7.6 6.5 5.6 10.9 9.7 0.0 a 5.2 3.4 6.6 5.0
7.0 6.5 2.1 6.4 5.4 4.0 10.4 a 3.6 5.8 7.4 4.0
0.8 1.1 0.4 0.9 1.8 0.4 0.0 a 0.3 0.4 0.0 1.2
18.3 16.0 14.6 34.9 34.0 29.1 18.4 a 40.0 25.3 41.1 28.67.7 5.2 3.9 15.4 13.6 11.2 11.3 a 26.2 14.5 20.9 9.37.1 4.6 3.6 15.3 13.6 9.7 10.8 a 23.4 12.4 18.2 8.20.7 0.8 0.5 0.6 1.8 1.7 0.5 a 4.2 2.7 3.9 1.7
15.3 12.7 12.7 30.3 29.9 26.3 12.4 a 19.0 21.8 27.9 26.012.4 9.7 8.0 24.6 25.2 17.3 7.3 a 10.8 17.0 24.2 20.34.1 2.7 3.9 5.5 5.0 5.4 2.7 a 5.4 2.5 9.0 6.33.5 3.9 4.5 11.3 12.3 10.9 2.5 a 10.2 6.3 7.0 8.6
1.6 1.9 0.8 2.5 3.3 1.2 1.4 a 0.0 1.5 2.6 2.4
3,354 1,197 4,545 692 204 717 135 35 141 522 153 431
OtherNoncash benefits
FoodEnergyHousing
Personal contributions
Number (thousands)
Cash public assistance and noncash benefitsCash public assistance
Supplemental Security Income
EarningsWages and salariesSelf-employment
Retirement benefitsSocial SecurityBenefits other than Social Security
Other public pensionsRailroad RetirementGovernment employee pensions
Private pensions or annuities
Income from assetsInterestOther income from assets
DividendsRent or royaltiesEstates or trusts
Veterans' benefits
Unemployment compensation
Workers' compensation
Nonmarried men
Table 2.B3Percentage with family income from specified source, by sex, marital status, race, Hispanic origin, and age, 2012—Continued
Source of family income
White alone Black alone Asian alone Hispanic origin
(Continued)
Income of the Population 55 or Older, 2012 ♦ 61
Family Income Sources of Aged Persons
55–61 62–64 65 or older 55–61 62–64 65 or older 55–61 62–64 65 or older 55–61 62–64 65 or older
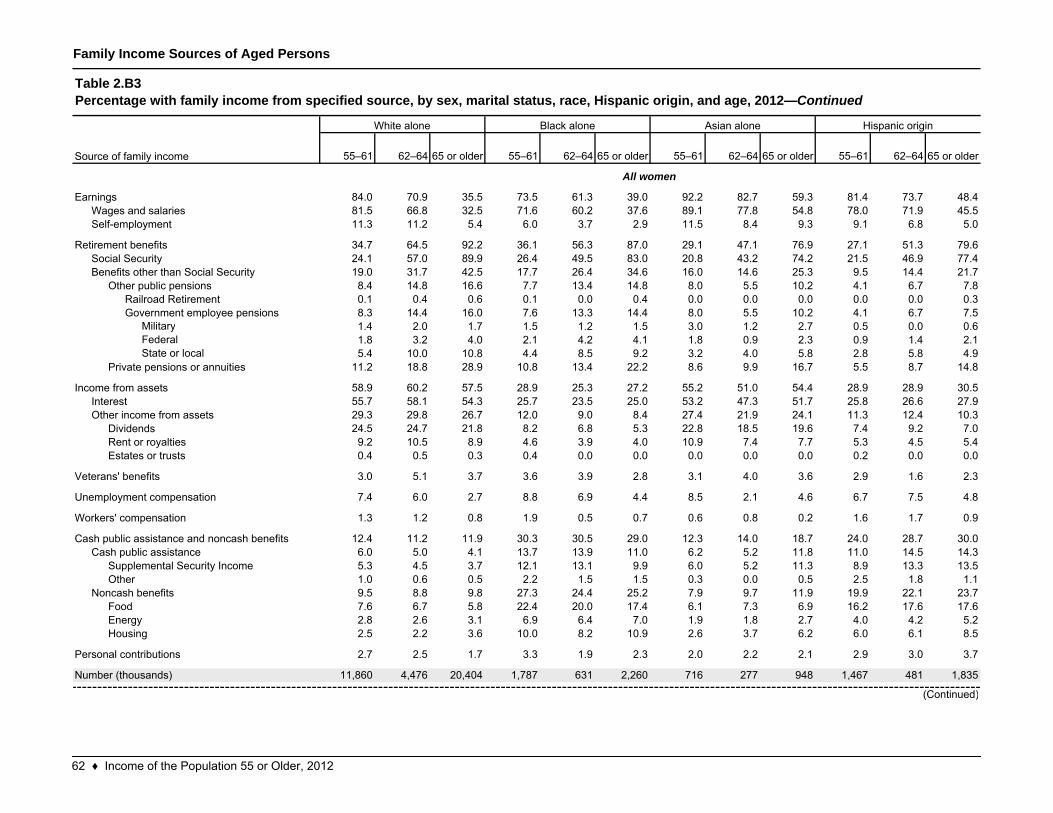
84.0 70.9 35.5 73.5 61.3 39.0 92.2 82.7 59.3 81.4 73.7 48.481.5 66.8 32.5 71.6 60.2 37.6 89.1 77.8 54.8 78.0 71.9 45.511.3 11.2 5.4 6.0 3.7 2.9 11.5 8.4 9.3 9.1 6.8 5.0
34.7 64.5 92.2 36.1 56.3 87.0 29.1 47.1 76.9 27.1 51.3 79.624.1 57.0 89.9 26.4 49.5 83.0 20.8 43.2 74.2 21.5 46.9 77.419.0 31.7 42.5 17.7 26.4 34.6 16.0 14.6 25.3 9.5 14.4 21.78.4 14.8 16.6 7.7 13.4 14.8 8.0 5.5 10.2 4.1 6.7 7.80.1 0.4 0.6 0.1 0.0 0.4 0.0 0.0 0.0 0.0 0.0 0.38.3 14.4 16.0 7.6 13.3 14.4 8.0 5.5 10.2 4.1 6.7 7.5
Military 1.4 2.0 1.7 1.5 1.2 1.5 3.0 1.2 2.7 0.5 0.0 0.6Federal 1.8 3.2 4.0 2.1 4.2 4.1 1.8 0.9 2.3 0.9 1.4 2.1State or local 5.4 10.0 10.8 4.4 8.5 9.2 3.2 4.0 5.8 2.8 5.8 4.9
11.2 18.8 28.9 10.8 13.4 22.2 8.6 9.9 16.7 5.5 8.7 14.8
58.9 60.2 57.5 28.9 25.3 27.2 55.2 51.0 54.4 28.9 28.9 30.555.7 58.1 54.3 25.7 23.5 25.0 53.2 47.3 51.7 25.8 26.6 27.929.3 29.8 26.7 12.0 9.0 8.4 27.4 21.9 24.1 11.3 12.4 10.324.5 24.7 21.8 8.2 6.8 5.3 22.8 18.5 19.6 7.4 9.2 7.09.2 10.5 8.9 4.6 3.9 4.0 10.9 7.4 7.7 5.3 4.5 5.40.4 0.5 0.3 0.4 0.0 0.0 0.0 0.0 0.0 0.2 0.0 0.0
3.0 5.1 3.7 3.6 3.9 2.8 3.1 4.0 3.6 2.9 1.6 2.3
7.4 6.0 2.7 8.8 6.9 4.4 8.5 2.1 4.6 6.7 7.5 4.8
1.3 1.2 0.8 1.9 0.5 0.7 0.6 0.8 0.2 1.6 1.7 0.9
12.4 11.2 11.9 30.3 30.5 29.0 12.3 14.0 18.7 24.0 28.7 30.06.0 5.0 4.1 13.7 13.9 11.0 6.2 5.2 11.8 11.0 14.5 14.35.3 4.5 3.7 12.1 13.1 9.9 6.0 5.2 11.3 8.9 13.3 13.51.0 0.6 0.5 2.2 1.5 1.5 0.3 0.0 0.5 2.5 1.8 1.19.5 8.8 9.8 27.3 24.4 25.2 7.9 9.7 11.9 19.9 22.1 23.77.6 6.7 5.8 22.4 20.0 17.4 6.1 7.3 6.9 16.2 17.6 17.62.8 2.6 3.1 6.9 6.4 7.0 1.9 1.8 2.7 4.0 4.2 5.22.5 2.2 3.6 10.0 8.2 10.9 2.6 3.7 6.2 6.0 6.1 8.5
2.7 2.5 1.7 3.3 1.9 2.3 2.0 2.2 2.1 2.9 3.0 3.7
11,860 4,476 20,404 1,787 631 2,260 716 277 948 1,467 481 1,835
Unemployment compensation
Workers' compensation
Cash public assistance and noncash benefitsCash public assistance
Supplemental Security IncomeOther
Noncash benefitsFoodEnergyHousing
Personal contributions
Number (thousands)
Rent or royaltiesEstates or trusts
Veterans' benefits
EarningsWages and salariesSelf-employment
Retirement benefitsSocial SecurityBenefits other than Social Security
Other public pensionsRailroad RetirementGovernment employee pensions
Private pensions or annuities
Income from assetsInterestOther income from assets
Dividends
All women
Table 2.B3Percentage with family income from specified source, by sex, marital status, race, Hispanic origin, and age, 2012—Continued
Source of family income
White alone Black alone Asian alone Hispanic origin
(Continued)
62 ♦ Income of the Population 55 or Older, 2012
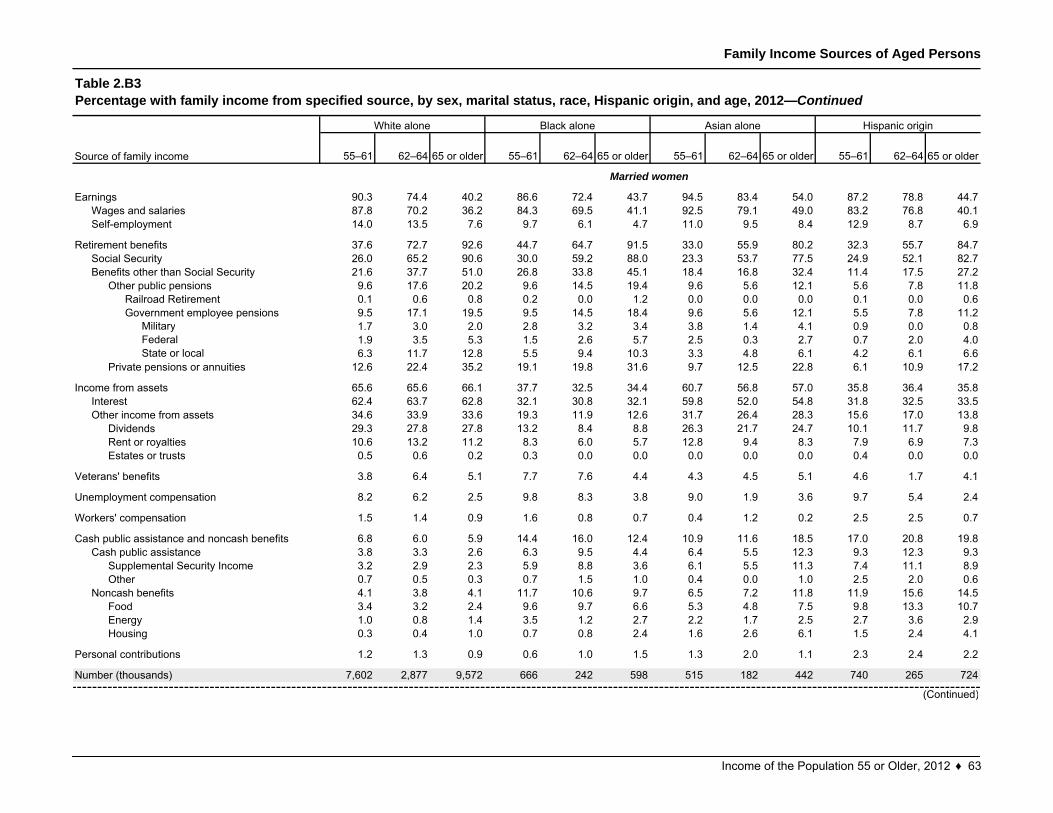
Family Income Sources of Aged Persons
55–61 62–64 65 or older 55–61 62–64 65 or older 55–61 62–64 65 or older 55–61 62–64 65 or older
90.3 74.4 40.2 86.6 72.4 43.7 94.5 83.4 54.0 87.2 78.8 44.787.8 70.2 36.2 84.3 69.5 41.1 92.5 79.1 49.0 83.2 76.8 40.114.0 13.5 7.6 9.7 6.1 4.7 11.0 9.5 8.4 12.9 8.7 6.9
37.6 72.7 92.6 44.7 64.7 91.5 33.0 55.9 80.2 32.3 55.7 84.726.0 65.2 90.6 30.0 59.2 88.0 23.3 53.7 77.5 24.9 52.1 82.721.6 37.7 51.0 26.8 33.8 45.1 18.4 16.8 32.4 11.4 17.5 27.29.6 17.6 20.2 9.6 14.5 19.4 9.6 5.6 12.1 5.6 7.8 11.80.1 0.6 0.8 0.2 0.0 1.2 0.0 0.0 0.0 0.1 0.0 0.69.5 17.1 19.5 9.5 14.5 18.4 9.6 5.6 12.1 5.5 7.8 11.2
Military 1.7 3.0 2.0 2.8 3.2 3.4 3.8 1.4 4.1 0.9 0.0 0.8Federal 1.9 3.5 5.3 1.5 2.6 5.7 2.5 0.3 2.7 0.7 2.0 4.0State or local 6.3 11.7 12.8 5.5 9.4 10.3 3.3 4.8 6.1 4.2 6.1 6.6
12.6 22.4 35.2 19.1 19.8 31.6 9.7 12.5 22.8 6.1 10.9 17.2
65.6 65.6 66.1 37.7 32.5 34.4 60.7 56.8 57.0 35.8 36.4 35.862.4 63.7 62.8 32.1 30.8 32.1 59.8 52.0 54.8 31.8 32.5 33.534.6 33.9 33.6 19.3 11.9 12.6 31.7 26.4 28.3 15.6 17.0 13.829.3 27.8 27.8 13.2 8.4 8.8 26.3 21.7 24.7 10.1 11.7 9.810.6 13.2 11.2 8.3 6.0 5.7 12.8 9.4 8.3 7.9 6.9 7.30.5 0.6 0.2 0.3 0.0 0.0 0.0 0.0 0.0 0.4 0.0 0.0
3.8 6.4 5.1 7.7 7.6 4.4 4.3 4.5 5.1 4.6 1.7 4.1
8.2 6.2 2.5 9.8 8.3 3.8 9.0 1.9 3.6 9.7 5.4 2.4
1.5 1.4 0.9 1.6 0.8 0.7 0.4 1.2 0.2 2.5 2.5 0.7
6.8 6.0 5.9 14.4 16.0 12.4 10.9 11.6 18.5 17.0 20.8 19.83.8 3.3 2.6 6.3 9.5 4.4 6.4 5.5 12.3 9.3 12.3 9.33.2 2.9 2.3 5.9 8.8 3.6 6.1 5.5 11.3 7.4 11.1 8.90.7 0.5 0.3 0.7 1.5 1.0 0.4 0.0 1.0 2.5 2.0 0.64.1 3.8 4.1 11.7 10.6 9.7 6.5 7.2 11.8 11.9 15.6 14.53.4 3.2 2.4 9.6 9.7 6.6 5.3 4.8 7.5 9.8 13.3 10.71.0 0.8 1.4 3.5 1.2 2.7 2.2 1.7 2.5 2.7 3.6 2.90.3 0.4 1.0 0.7 0.8 2.4 1.6 2.6 6.1 1.5 2.4 4.1
1.2 1.3 0.9 0.6 1.0 1.5 1.3 2.0 1.1 2.3 2.4 2.2
7,602 2,877 9,572 666 242 598 515 182 442 740 265 724
FoodEnergyHousing
Personal contributions
Number (thousands)
Retirement benefitsSocial SecurityBenefits other than Social Security
Other public pensionsRailroad RetirementGovernment employee pensions
Other income from assetsDividendsRent or royaltiesEstates or trusts
Veterans' benefits
Unemployment compensation
Workers' compensation
Cash public assistance and noncash benefitsCash public assistance
Supplemental Security IncomeOther
Noncash benefits
(Continued)
Private pensions or annuities
Income from assetsInterest
Table 2.B3Percentage with family income from specified source, by sex, marital status, race, Hispanic origin, and age, 2012—Continued
Source of family income
White alone Black alone Asian alone Hispanic origin
EarningsWages and salariesSelf-employment
Married women
Income of the Population 55 or Older, 2012 ♦ 63
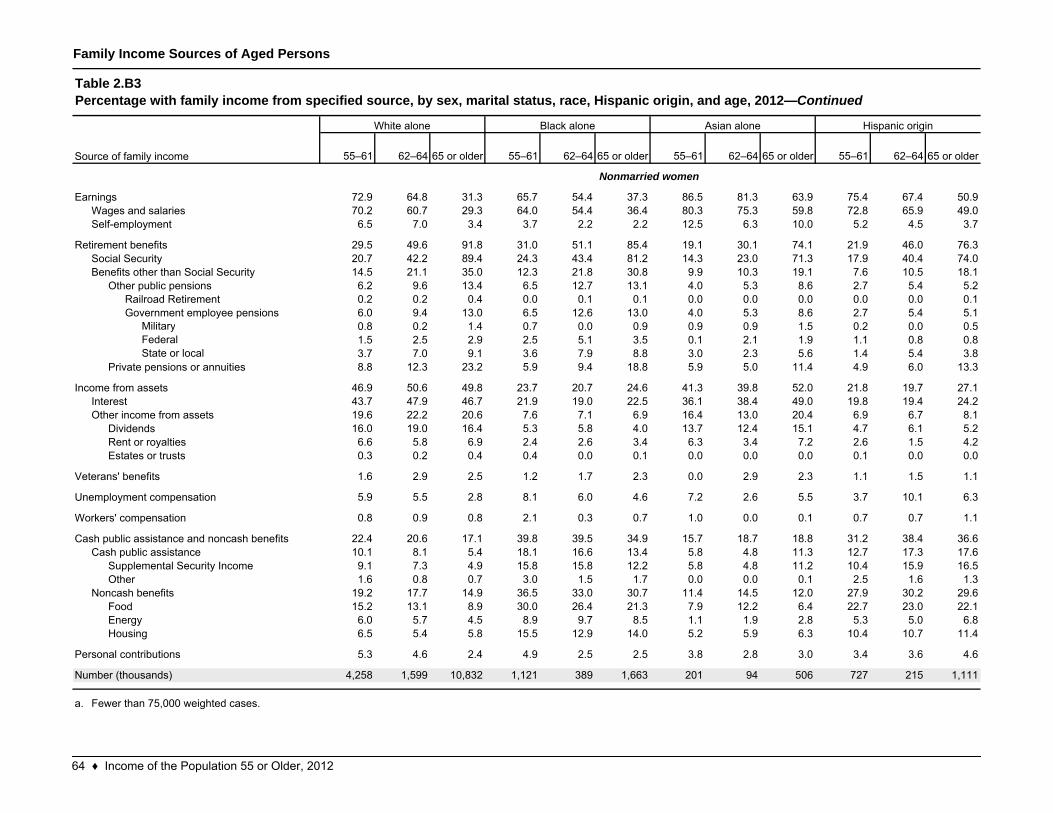
Family Income Sources of Aged Persons
55–61 62–64 65 or older 55–61 62–64 65 or older 55–61 62–64 65 or older 55–61 62–64 65 or older
72.9 64.8 31.3 65.7 54.4 37.3 86.5 81.3 63.9 75.4 67.4 50.970.2 60.7 29.3 64.0 54.4 36.4 80.3 75.3 59.8 72.8 65.9 49.06.5 7.0 3.4 3.7 2.2 2.2 12.5 6.3 10.0 5.2 4.5 3.7
29.5 49.6 91.8 31.0 51.1 85.4 19.1 30.1 74.1 21.9 46.0 76.320.7 42.2 89.4 24.3 43.4 81.2 14.3 23.0 71.3 17.9 40.4 74.014.5 21.1 35.0 12.3 21.8 30.8 9.9 10.3 19.1 7.6 10.5 18.16.2 9.6 13.4 6.5 12.7 13.1 4.0 5.3 8.6 2.7 5.4 5.20.2 0.2 0.4 0.0 0.1 0.1 0.0 0.0 0.0 0.0 0.0 0.16.0 9.4 13.0 6.5 12.6 13.0 4.0 5.3 8.6 2.7 5.4 5.1
Military 0.8 0.2 1.4 0.7 0.0 0.9 0.9 0.9 1.5 0.2 0.0 0.5Federal 1.5 2.5 2.9 2.5 5.1 3.5 0.1 2.1 1.9 1.1 0.8 0.8State or local 3.7 7.0 9.1 3.6 7.9 8.8 3.0 2.3 5.6 1.4 5.4 3.8
8.8 12.3 23.2 5.9 9.4 18.8 5.9 5.0 11.4 4.9 6.0 13.3
46.9 50.6 49.8 23.7 20.7 24.6 41.3 39.8 52.0 21.8 19.7 27.143.7 47.9 46.7 21.9 19.0 22.5 36.1 38.4 49.0 19.8 19.4 24.219.6 22.2 20.6 7.6 7.1 6.9 16.4 13.0 20.4 6.9 6.7 8.116.0 19.0 16.4 5.3 5.8 4.0 13.7 12.4 15.1 4.7 6.1 5.26.6 5.8 6.9 2.4 2.6 3.4 6.3 3.4 7.2 2.6 1.5 4.20.3 0.2 0.4 0.4 0.0 0.1 0.0 0.0 0.0 0.1 0.0 0.0
1.6 2.9 2.5 1.2 1.7 2.3 0.0 2.9 2.3 1.1 1.5 1.1
5.9 5.5 2.8 8.1 6.0 4.6 7.2 2.6 5.5 3.7 10.1 6.3
0.8 0.9 0.8 2.1 0.3 0.7 1.0 0.0 0.1 0.7 0.7 1.1
22.4 20.6 17.1 39.8 39.5 34.9 15.7 18.7 18.8 31.2 38.4 36.610.1 8.1 5.4 18.1 16.6 13.4 5.8 4.8 11.3 12.7 17.3 17.69.1 7.3 4.9 15.8 15.8 12.2 5.8 4.8 11.2 10.4 15.9 16.51.6 0.8 0.7 3.0 1.5 1.7 0.0 0.0 0.1 2.5 1.6 1.3
19.2 17.7 14.9 36.5 33.0 30.7 11.4 14.5 12.0 27.9 30.2 29.615.2 13.1 8.9 30.0 26.4 21.3 7.9 12.2 6.4 22.7 23.0 22.16.0 5.7 4.5 8.9 9.7 8.5 1.1 1.9 2.8 5.3 5.0 6.86.5 5.4 5.8 15.5 12.9 14.0 5.2 5.9 6.3 10.4 10.7 11.4
5.3 4.6 2.4 4.9 2.5 2.5 3.8 2.8 3.0 3.4 3.6 4.6
4,258 1,599 10,832 1,121 389 1,663 201 94 506 727 215 1,111
a.
EnergyHousing
Personal contributions
EarningsWages and salariesSelf-employment
Retirement benefits
Number (thousands)
Fewer than 75,000 weighted cases.
Railroad RetirementGovernment employee pensions
Private pensions or annuities
Income from assetsInterestOther income from assets
DividendsRent or royaltiesEstates or trusts
Veterans' benefits
Unemployment compensation
Workers' compensation
Cash public assistance and noncash benefitsCash public assistance
Supplemental Security IncomeOther
Noncash benefitsFood
White alone Black alone Asian alone Hispanic origin
Social SecurityBenefits other than Social Security
Other public pensions
Table 2.B3Percentage with family income from specified source, by sex, marital status, race, Hispanic origin, and age, 2012—Continued
Source of family income
Nonmarried women
64 ♦ Income of the Population 55 or Older, 2012
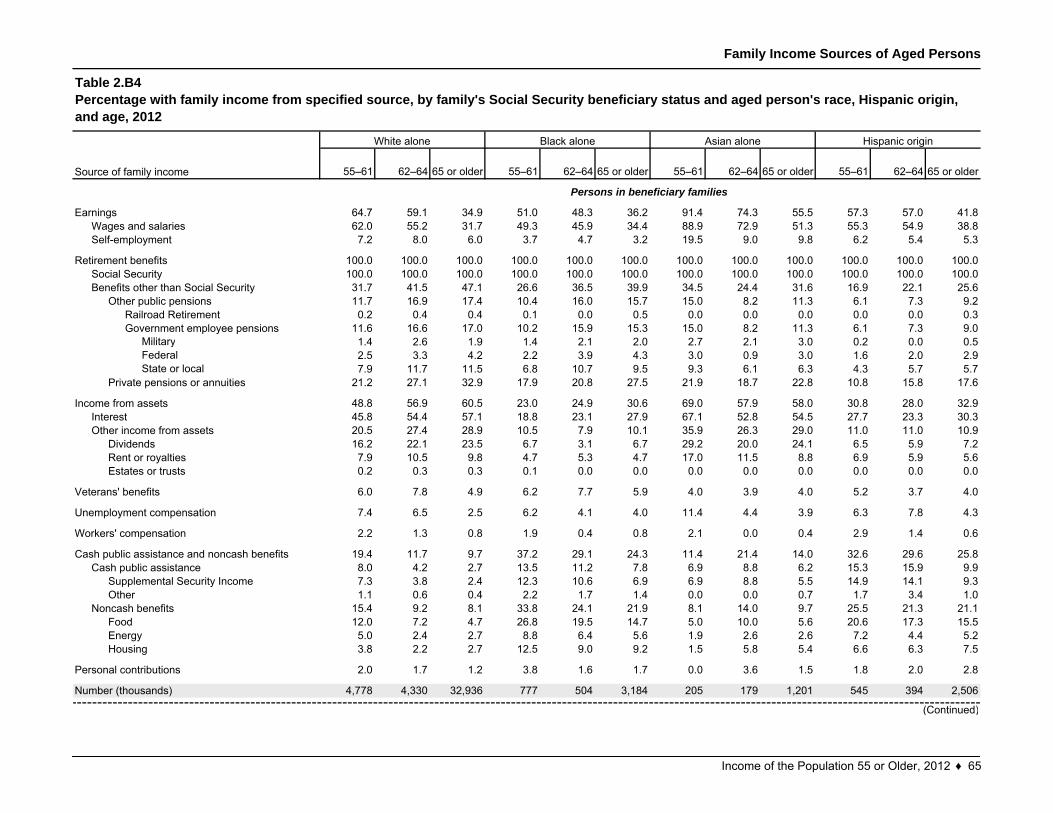
Family Income Sources of Aged Persons
55–61 62–64 65 or older 55–61 62–64 65 or older 55–61 62–64 65 or older 55–61 62–64 65 or older
64.7 59.1 34.9 51.0 48.3 36.2 91.4 74.3 55.5 57.3 57.0 41.862.0 55.2 31.7 49.3 45.9 34.4 88.9 72.9 51.3 55.3 54.9 38.87.2 8.0 6.0 3.7 4.7 3.2 19.5 9.0 9.8 6.2 5.4 5.3
100.0 100.0 100.0 100.0 100.0 100.0 100.0 100.0 100.0 100.0 100.0 100.0100.0 100.0 100.0 100.0 100.0 100.0 100.0 100.0 100.0 100.0 100.0 100.031.7 41.5 47.1 26.6 36.5 39.9 34.5 24.4 31.6 16.9 22.1 25.611.7 16.9 17.4 10.4 16.0 15.7 15.0 8.2 11.3 6.1 7.3 9.20.2 0.4 0.4 0.1 0.0 0.5 0.0 0.0 0.0 0.0 0.0 0.3
11.6 16.6 17.0 10.2 15.9 15.3 15.0 8.2 11.3 6.1 7.3 9.0Military 1.4 2.6 1.9 1.4 2.1 2.0 2.7 2.1 3.0 0.2 0.0 0.5Federal 2.5 3.3 4.2 2.2 3.9 4.3 3.0 0.9 3.0 1.6 2.0 2.9State or local 7.9 11.7 11.5 6.8 10.7 9.5 9.3 6.1 6.3 4.3 5.7 5.7
21.2 27.1 32.9 17.9 20.8 27.5 21.9 18.7 22.8 10.8 15.8 17.6
48.8 56.9 60.5 23.0 24.9 30.6 69.0 57.9 58.0 30.8 28.0 32.945.8 54.4 57.1 18.8 23.1 27.9 67.1 52.8 54.5 27.7 23.3 30.320.5 27.4 28.9 10.5 7.9 10.1 35.9 26.3 29.0 11.0 11.0 10.916.2 22.1 23.5 6.7 3.1 6.7 29.2 20.0 24.1 6.5 5.9 7.27.9 10.5 9.8 4.7 5.3 4.7 17.0 11.5 8.8 6.9 5.9 5.60.2 0.3 0.3 0.1 0.0 0.0 0.0 0.0 0.0 0.0 0.0 0.0
6.0 7.8 4.9 6.2 7.7 5.9 4.0 3.9 4.0 5.2 3.7 4.0
7.4 6.5 2.5 6.2 4.1 4.0 11.4 4.4 3.9 6.3 7.8 4.3
2.2 1.3 0.8 1.9 0.4 0.8 2.1 0.0 0.4 2.9 1.4 0.6
19.4 11.7 9.7 37.2 29.1 24.3 11.4 21.4 14.0 32.6 29.6 25.88.0 4.2 2.7 13.5 11.2 7.8 6.9 8.8 6.2 15.3 15.9 9.97.3 3.8 2.4 12.3 10.6 6.9 6.9 8.8 5.5 14.9 14.1 9.31.1 0.6 0.4 2.2 1.7 1.4 0.0 0.0 0.7 1.7 3.4 1.0
15.4 9.2 8.1 33.8 24.1 21.9 8.1 14.0 9.7 25.5 21.3 21.112.0 7.2 4.7 26.8 19.5 14.7 5.0 10.0 5.6 20.6 17.3 15.55.0 2.4 2.7 8.8 6.4 5.6 1.9 2.6 2.6 7.2 4.4 5.23.8 2.2 2.7 12.5 9.0 9.2 1.5 5.8 5.4 6.6 6.3 7.5
2.0 1.7 1.2 3.8 1.6 1.7 0.0 3.6 1.5 1.8 2.0 2.8
4,778 4,330 32,936 777 504 3,184 205 179 1,201 545 394 2,506
OtherNoncash benefits
EnergyHousing
Personal contributions
Number (thousands)
Food
Workers' compensation
Cash public assistance and noncash benefitsCash public assistance
Supplemental Security Income
Other public pensionsRailroad RetirementGovernment employee pensions
Private pensions or annuities
Income from assetsInterestOther income from assets
DividendsRent or royaltiesEstates or trusts
Veterans' benefits
Unemployment compensation
Persons in beneficiary families
Source of family income
EarningsWages and salariesSelf-employment
Retirement benefitsSocial SecurityBenefits other than Social Security
(Continued)
Table 2.B4Percentage with family income from specified source, by family's Social Security beneficiary status and aged person's race, Hispanic origin, and age, 2012
White alone Black alone Asian alone Hispanic origin
Income of the Population 55 or Older, 2012 ♦ 65
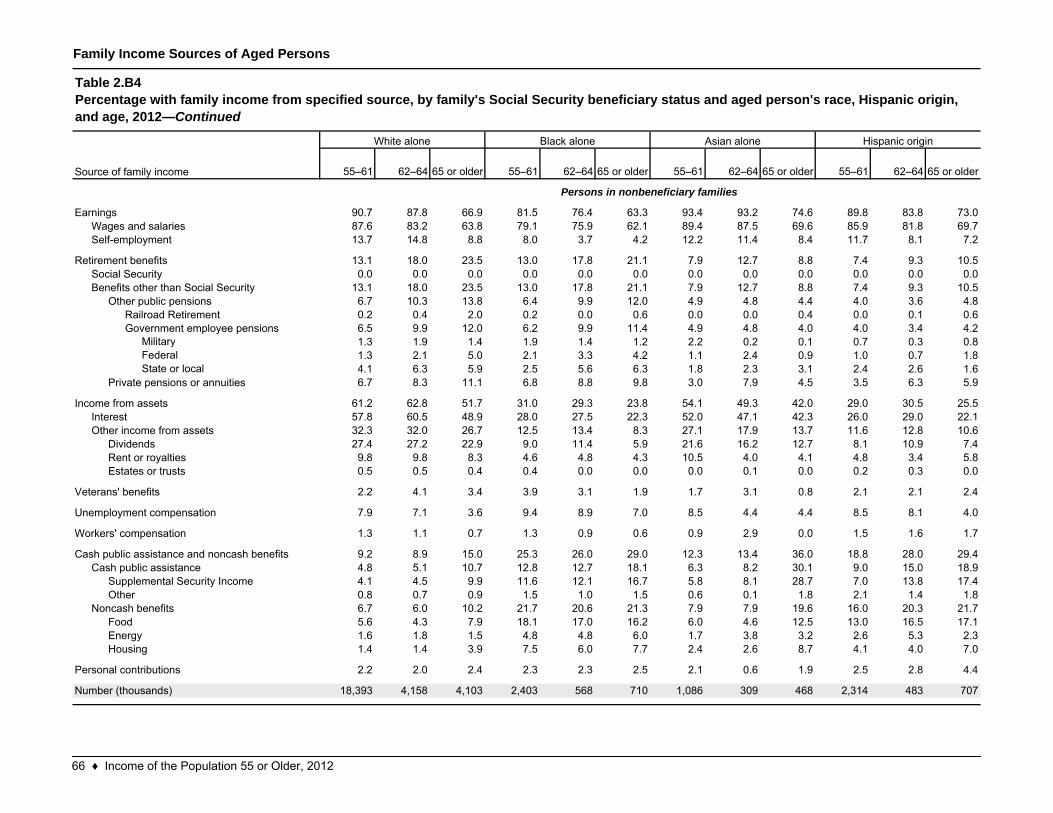
Family Income Sources of Aged Persons
55–61 62–64 65 or older 55–61 62–64 65 or older 55–61 62–64 65 or older 55–61 62–64 65 or older
90.7 87.8 66.9 81.5 76.4 63.3 93.4 93.2 74.6 89.8 83.8 73.087.6 83.2 63.8 79.1 75.9 62.1 89.4 87.5 69.6 85.9 81.8 69.713.7 14.8 8.8 8.0 3.7 4.2 12.2 11.4 8.4 11.7 8.1 7.2
13.1 18.0 23.5 13.0 17.8 21.1 7.9 12.7 8.8 7.4 9.3 10.50.0 0.0 0.0 0.0 0.0 0.0 0.0 0.0 0.0 0.0 0.0 0.0
13.1 18.0 23.5 13.0 17.8 21.1 7.9 12.7 8.8 7.4 9.3 10.56.7 10.3 13.8 6.4 9.9 12.0 4.9 4.8 4.4 4.0 3.6 4.80.2 0.4 2.0 0.2 0.0 0.6 0.0 0.0 0.4 0.0 0.1 0.66.5 9.9 12.0 6.2 9.9 11.4 4.9 4.8 4.0 4.0 3.4 4.2
Military 1.3 1.9 1.4 1.9 1.4 1.2 2.2 0.2 0.1 0.7 0.3 0.8Federal 1.3 2.1 5.0 2.1 3.3 4.2 1.1 2.4 0.9 1.0 0.7 1.8State or local 4.1 6.3 5.9 2.5 5.6 6.3 1.8 2.3 3.1 2.4 2.6 1.6
6.7 8.3 11.1 6.8 8.8 9.8 3.0 7.9 4.5 3.5 6.3 5.9
61.2 62.8 51.7 31.0 29.3 23.8 54.1 49.3 42.0 29.0 30.5 25.557.8 60.5 48.9 28.0 27.5 22.3 52.0 47.1 42.3 26.0 29.0 22.132.3 32.0 26.7 12.5 13.4 8.3 27.1 17.9 13.7 11.6 12.8 10.627.4 27.2 22.9 9.0 11.4 5.9 21.6 16.2 12.7 8.1 10.9 7.49.8 9.8 8.3 4.6 4.8 4.3 10.5 4.0 4.1 4.8 3.4 5.80.5 0.5 0.4 0.4 0.0 0.0 0.0 0.1 0.0 0.2 0.3 0.0
2.2 4.1 3.4 3.9 3.1 1.9 1.7 3.1 0.8 2.1 2.1 2.4
7.9 7.1 3.6 9.4 8.9 7.0 8.5 4.4 4.4 8.5 8.1 4.0
1.3 1.1 0.7 1.3 0.9 0.6 0.9 2.9 0.0 1.5 1.6 1.7
9.2 8.9 15.0 25.3 26.0 29.0 12.3 13.4 36.0 18.8 28.0 29.44.8 5.1 10.7 12.8 12.7 18.1 6.3 8.2 30.1 9.0 15.0 18.94.1 4.5 9.9 11.6 12.1 16.7 5.8 8.1 28.7 7.0 13.8 17.40.8 0.7 0.9 1.5 1.0 1.5 0.6 0.1 1.8 2.1 1.4 1.86.7 6.0 10.2 21.7 20.6 21.3 7.9 7.9 19.6 16.0 20.3 21.75.6 4.3 7.9 18.1 17.0 16.2 6.0 4.6 12.5 13.0 16.5 17.11.6 1.8 1.5 4.8 4.8 6.0 1.7 3.8 3.2 2.6 5.3 2.31.4 1.4 3.9 7.5 6.0 7.7 2.4 2.6 8.7 4.1 4.0 7.0
2.2 2.0 2.4 2.3 2.3 2.5 2.1 0.6 1.9 2.5 2.8 4.4
18,393 4,158 4,103 2,403 568 710 1,086 309 468 2,314 483 707
Housing
Personal contributions
Number (thousands)
Cash public assistanceSupplemental Security IncomeOther
Noncash benefitsFoodEnergy
Cash public assistance and noncash benefits
Government employee pensions
Private pensions or annuities
Income from assetsInterestOther income from assets
Workers' compensation
DividendsRent or royaltiesEstates or trusts
Veterans' benefits
Unemployment compensation
Railroad Retirement
EarningsWages and salariesSelf-employment
Retirement benefitsSocial SecurityBenefits other than Social Security
Other public pensions
Persons in nonbeneficiary families
Table 2.B4Percentage with family income from specified source, by family's Social Security beneficiary status and aged person's race, Hispanic origin, and age, 2012—Continued
Source of family income
White alone Black alone Asian alone Hispanic origin
66 ♦ Income of the Population 55 or Older, 2012
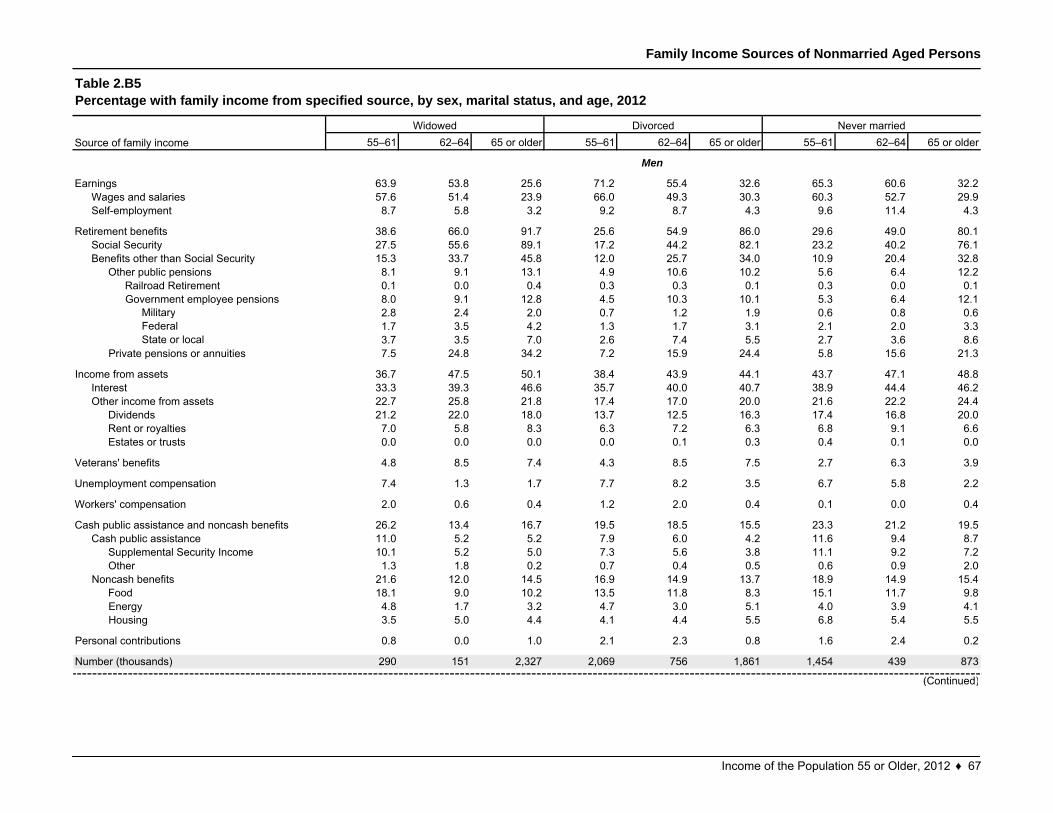
Family Income Sources of Nonmarried Aged Persons
55–61 62–64 65 or older 55–61 62–64 65 or older 55–61 62–64 65 or older
63.9 53.8 25.6 71.2 55.4 32.6 65.3 60.6 32.257.6 51.4 23.9 66.0 49.3 30.3 60.3 52.7 29.98.7 5.8 3.2 9.2 8.7 4.3 9.6 11.4 4.3
38.6 66.0 91.7 25.6 54.9 86.0 29.6 49.0 80.127.5 55.6 89.1 17.2 44.2 82.1 23.2 40.2 76.115.3 33.7 45.8 12.0 25.7 34.0 10.9 20.4 32.88.1 9.1 13.1 4.9 10.6 10.2 5.6 6.4 12.20.1 0.0 0.4 0.3 0.3 0.1 0.3 0.0 0.18.0 9.1 12.8 4.5 10.3 10.1 5.3 6.4 12.1
Military 2.8 2.4 2.0 0.7 1.2 1.9 0.6 0.8 0.6Federal 1.7 3.5 4.2 1.3 1.7 3.1 2.1 2.0 3.3State or local 3.7 3.5 7.0 2.6 7.4 5.5 2.7 3.6 8.6
7.5 24.8 34.2 7.2 15.9 24.4 5.8 15.6 21.3
36.7 47.5 50.1 38.4 43.9 44.1 43.7 47.1 48.833.3 39.3 46.6 35.7 40.0 40.7 38.9 44.4 46.222.7 25.8 21.8 17.4 17.0 20.0 21.6 22.2 24.421.2 22.0 18.0 13.7 12.5 16.3 17.4 16.8 20.07.0 5.8 8.3 6.3 7.2 6.3 6.8 9.1 6.60.0 0.0 0.0 0.0 0.1 0.3 0.4 0.1 0.0
4.8 8.5 7.4 4.3 8.5 7.5 2.7 6.3 3.9
7.4 1.3 1.7 7.7 8.2 3.5 6.7 5.8 2.2
2.0 0.6 0.4 1.2 2.0 0.4 0.1 0.0 0.4
26.2 13.4 16.7 19.5 18.5 15.5 23.3 21.2 19.511.0 5.2 5.2 7.9 6.0 4.2 11.6 9.4 8.710.1 5.2 5.0 7.3 5.6 3.8 11.1 9.2 7.21.3 1.8 0.2 0.7 0.4 0.5 0.6 0.9 2.0
21.6 12.0 14.5 16.9 14.9 13.7 18.9 14.9 15.418.1 9.0 10.2 13.5 11.8 8.3 15.1 11.7 9.84.8 1.7 3.2 4.7 3.0 5.1 4.0 3.9 4.13.5 5.0 4.4 4.1 4.4 5.5 6.8 5.4 5.5
0.8 0.0 1.0 2.1 2.3 0.8 1.6 2.4 0.2
290 151 2,327 2,069 756 1,861 1,454 439 873
Noncash benefits
EnergyHousing
Personal contributions
Number (thousands)
Government employee pensions
Private pensions or annuities
Income from assets
(Continued)
Interest
Food
DividendsRent or royaltiesEstates or trusts
Veterans' benefits
Unemployment compensation
Workers' compensation
Cash public assistance and noncash benefitsCash public assistance
Supplemental Security IncomeOther
Table 2.B5Percentage with family income from specified source, by sex, marital status, and age, 2012
Widowed Divorced Never marriedSource of family income
EarningsWages and salariesSelf-employment
Retirement benefitsSocial SecurityBenefits other than Social Security
Other public pensionsRailroad Retirement
Other income from assets
Men
Income of the Population 55 or Older, 2012 ♦ 67
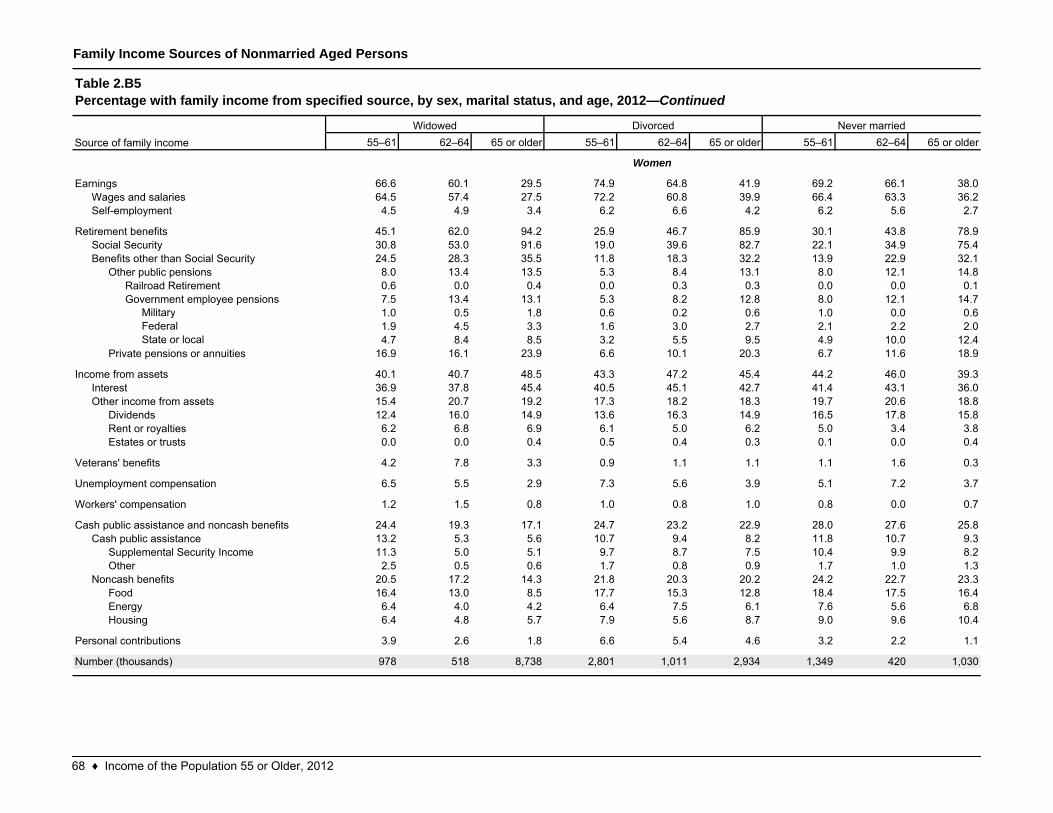
Family Income Sources of Nonmarried Aged Persons
55–61 62–64 65 or older 55–61 62–64 65 or older 55–61 62–64 65 or older
66.6 60.1 29.5 74.9 64.8 41.9 69.2 66.1 38.064.5 57.4 27.5 72.2 60.8 39.9 66.4 63.3 36.24.5 4.9 3.4 6.2 6.6 4.2 6.2 5.6 2.7
45.1 62.0 94.2 25.9 46.7 85.9 30.1 43.8 78.930.8 53.0 91.6 19.0 39.6 82.7 22.1 34.9 75.424.5 28.3 35.5 11.8 18.3 32.2 13.9 22.9 32.18.0 13.4 13.5 5.3 8.4 13.1 8.0 12.1 14.80.6 0.0 0.4 0.0 0.3 0.3 0.0 0.0 0.17.5 13.4 13.1 5.3 8.2 12.8 8.0 12.1 14.7
Military 1.0 0.5 1.8 0.6 0.2 0.6 1.0 0.0 0.6Federal 1.9 4.5 3.3 1.6 3.0 2.7 2.1 2.2 2.0State or local 4.7 8.4 8.5 3.2 5.5 9.5 4.9 10.0 12.4
16.9 16.1 23.9 6.6 10.1 20.3 6.7 11.6 18.9
40.1 40.7 48.5 43.3 47.2 45.4 44.2 46.0 39.336.9 37.8 45.4 40.5 45.1 42.7 41.4 43.1 36.015.4 20.7 19.2 17.3 18.2 18.3 19.7 20.6 18.812.4 16.0 14.9 13.6 16.3 14.9 16.5 17.8 15.86.2 6.8 6.9 6.1 5.0 6.2 5.0 3.4 3.80.0 0.0 0.4 0.5 0.4 0.3 0.1 0.0 0.4
4.2 7.8 3.3 0.9 1.1 1.1 1.1 1.6 0.3
6.5 5.5 2.9 7.3 5.6 3.9 5.1 7.2 3.7
1.2 1.5 0.8 1.0 0.8 1.0 0.8 0.0 0.7
24.4 19.3 17.1 24.7 23.2 22.9 28.0 27.6 25.813.2 5.3 5.6 10.7 9.4 8.2 11.8 10.7 9.311.3 5.0 5.1 9.7 8.7 7.5 10.4 9.9 8.22.5 0.5 0.6 1.7 0.8 0.9 1.7 1.0 1.3
20.5 17.2 14.3 21.8 20.3 20.2 24.2 22.7 23.316.4 13.0 8.5 17.7 15.3 12.8 18.4 17.5 16.46.4 4.0 4.2 6.4 7.5 6.1 7.6 5.6 6.86.4 4.8 5.7 7.9 5.6 8.7 9.0 9.6 10.4
3.9 2.6 1.8 6.6 5.4 4.6 3.2 2.2 1.1
978 518 8,738 2,801 1,011 2,934 1,349 420 1,030
Energy
Workers' compensation
Housing
Personal contributions
Number (thousands)
Cash public assistance and noncash benefitsCash public assistance
Supplemental Security IncomeOther
Noncash benefitsFood
Unemployment compensation
Self-employment
Retirement benefitsSocial SecurityBenefits other than Social Security
Other public pensions
Government employee pensions
Private pensions or annuities
Income from assetsInterestOther income from assets
DividendsRent or royaltiesEstates or trusts
Veterans' benefits
Railroad Retirement
EarningsWages and salaries
Table 2.B5Percentage with family income from specified source, by sex, marital status, and age, 2012—Continued
Source of family incomeWidowed Divorced Never married
Women
68 ♦ Income of the Population 55 or Older, 2012
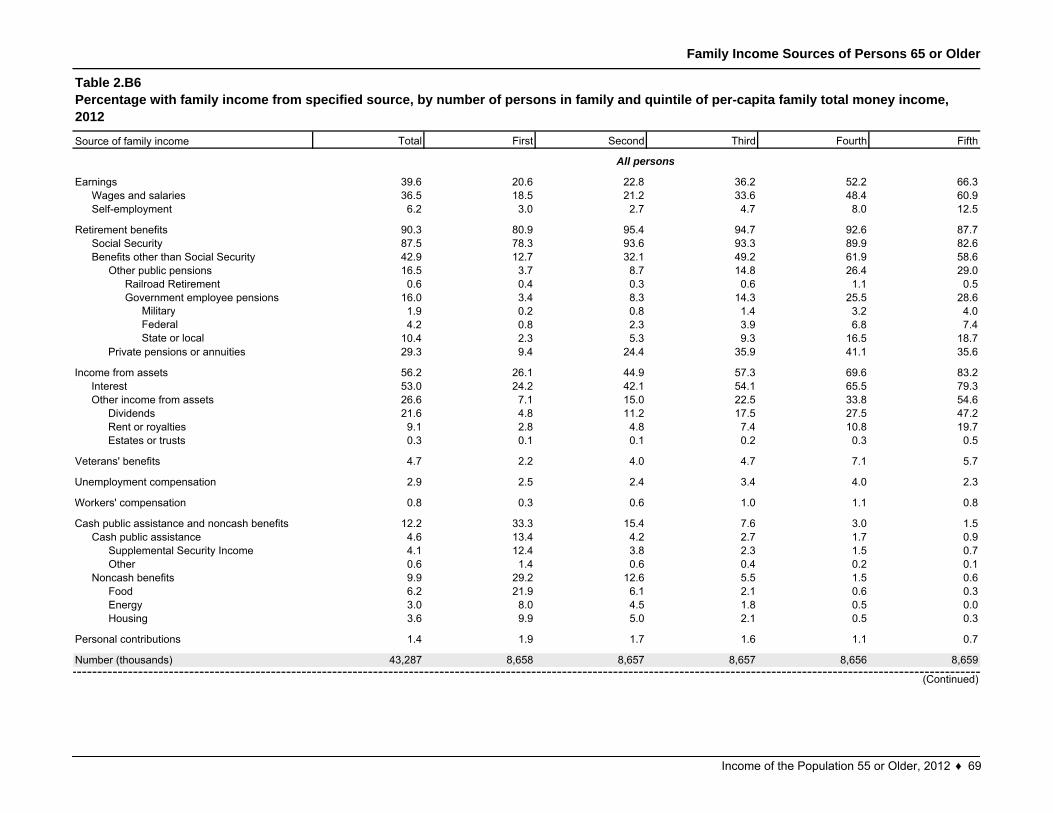
Family Income Sources of Persons 65 or Older
Total First Second Third Fourth Fifth
39.6 20.6 22.8 36.2 52.2 66.336.5 18.5 21.2 33.6 48.4 60.96.2 3.0 2.7 4.7 8.0 12.5
90.3 80.9 95.4 94.7 92.6 87.787.5 78.3 93.6 93.3 89.9 82.642.9 12.7 32.1 49.2 61.9 58.616.5 3.7 8.7 14.8 26.4 29.00.6 0.4 0.3 0.6 1.1 0.5
16.0 3.4 8.3 14.3 25.5 28.6Military 1.9 0.2 0.8 1.4 3.2 4.0Federal 4.2 0.8 2.3 3.9 6.8 7.4State or local 10.4 2.3 5.3 9.3 16.5 18.7
29.3 9.4 24.4 35.9 41.1 35.6
56.2 26.1 44.9 57.3 69.6 83.253.0 24.2 42.1 54.1 65.5 79.326.6 7.1 15.0 22.5 33.8 54.621.6 4.8 11.2 17.5 27.5 47.29.1 2.8 4.8 7.4 10.8 19.70.3 0.1 0.1 0.2 0.3 0.5
4.7 2.2 4.0 4.7 7.1 5.7
2.9 2.5 2.4 3.4 4.0 2.3
0.8 0.3 0.6 1.0 1.1 0.8
12.2 33.3 15.4 7.6 3.0 1.54.6 13.4 4.2 2.7 1.7 0.94.1 12.4 3.8 2.3 1.5 0.70.6 1.4 0.6 0.4 0.2 0.19.9 29.2 12.6 5.5 1.5 0.66.2 21.9 6.1 2.1 0.6 0.33.0 8.0 4.5 1.8 0.5 0.03.6 9.9 5.0 2.1 0.5 0.3
1.4 1.9 1.7 1.6 1.1 0.7
43,287 8,658 8,657 8,657 8,656 8,659
Cash public assistanceSupplemental Security IncomeOther
Source of family income
EarningsWages and salariesSelf-employment
Retirement benefitsSocial SecurityBenefits other than Social Security
Other public pensions
Noncash benefitsFoodEnergyHousing
Personal contributions
Number (thousands)
Veterans' benefits
Table 2.B6Percentage with family income from specified source, by number of persons in family and quintile of per-capita family total money income,2012
All persons
Railroad RetirementGovernment employee pensions
Private pensions or annuities
Income from assets
Unemployment compensation
(Continued)
InterestOther income from assets
DividendsRent or royaltiesEstates or trusts
Workers' compensation
Cash public assistance and noncash benefits
Income of the Population 55 or Older, 2012 ♦ 69
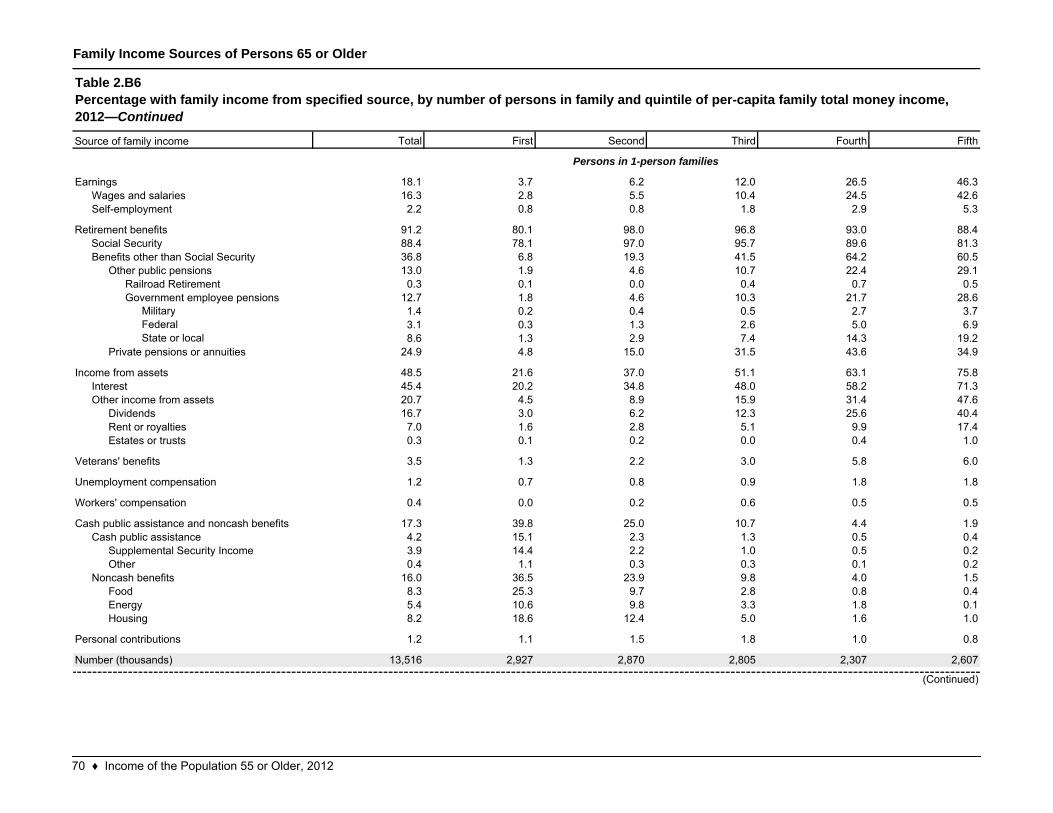
Family Income Sources of Persons 65 or Older
Total First Second Third Fourth Fifth
18.1 3.7 6.2 12.0 26.5 46.316.3 2.8 5.5 10.4 24.5 42.62.2 0.8 0.8 1.8 2.9 5.3
91.2 80.1 98.0 96.8 93.0 88.488.4 78.1 97.0 95.7 89.6 81.336.8 6.8 19.3 41.5 64.2 60.513.0 1.9 4.6 10.7 22.4 29.10.3 0.1 0.0 0.4 0.7 0.5
12.7 1.8 4.6 10.3 21.7 28.6Military 1.4 0.2 0.4 0.5 2.7 3.7Federal 3.1 0.3 1.3 2.6 5.0 6.9State or local 8.6 1.3 2.9 7.4 14.3 19.2
24.9 4.8 15.0 31.5 43.6 34.9
48.5 21.6 37.0 51.1 63.1 75.845.4 20.2 34.8 48.0 58.2 71.320.7 4.5 8.9 15.9 31.4 47.616.7 3.0 6.2 12.3 25.6 40.47.0 1.6 2.8 5.1 9.9 17.40.3 0.1 0.2 0.0 0.4 1.0
3.5 1.3 2.2 3.0 5.8 6.0
1.2 0.7 0.8 0.9 1.8 1.8
0.4 0.0 0.2 0.6 0.5 0.5
17.3 39.8 25.0 10.7 4.4 1.94.2 15.1 2.3 1.3 0.5 0.43.9 14.4 2.2 1.0 0.5 0.20.4 1.1 0.3 0.3 0.1 0.2
16.0 36.5 23.9 9.8 4.0 1.58.3 25.3 9.7 2.8 0.8 0.45.4 10.6 9.8 3.3 1.8 0.18.2 18.6 12.4 5.0 1.6 1.0
1.2 1.1 1.5 1.8 1.0 0.8
13,516 2,927 2,870 2,805 2,307 2,607
FoodEnergyHousing
Personal contributions
Number (thousands)
Other public pensionsRailroad RetirementGovernment employee pensions
Private pensions or annuities
Income from assetsInterestOther income from assets
DividendsRent or royaltiesEstates or trusts
Veterans' benefits
Unemployment compensation
Workers' compensation
Cash public assistance and noncash benefitsCash public assistance
Supplemental Security IncomeOther
Noncash benefits
Benefits other than Social Security
EarningsWages and salariesSelf-employment
Persons in 1-person families
Table 2.B6Percentage with family income from specified source, by number of persons in family and quintile of per-capita family total money income,2012—Continued
Source of family income
(Continued)
Retirement benefitsSocial Security
70 ♦ Income of the Population 55 or Older, 2012
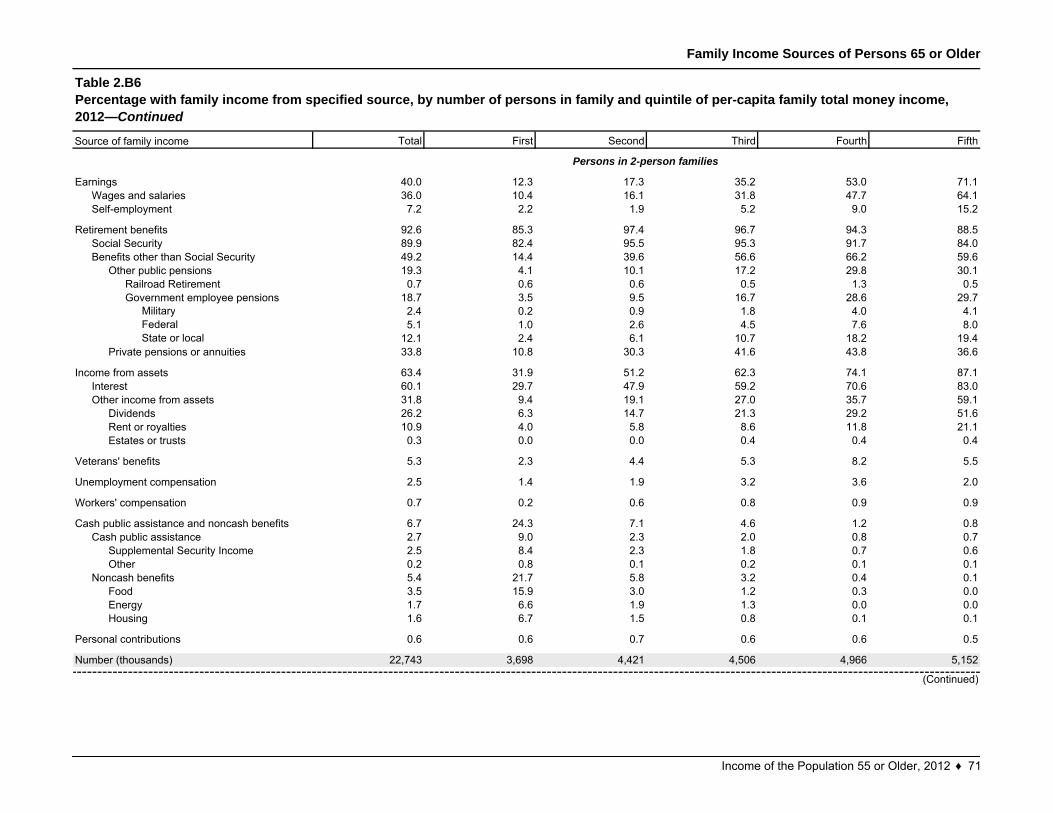
Family Income Sources of Persons 65 or Older
Total First Second Third Fourth Fifth
40.0 12.3 17.3 35.2 53.0 71.136.0 10.4 16.1 31.8 47.7 64.17.2 2.2 1.9 5.2 9.0 15.2
92.6 85.3 97.4 96.7 94.3 88.589.9 82.4 95.5 95.3 91.7 84.049.2 14.4 39.6 56.6 66.2 59.619.3 4.1 10.1 17.2 29.8 30.10.7 0.6 0.6 0.5 1.3 0.5
18.7 3.5 9.5 16.7 28.6 29.7Military 2.4 0.2 0.9 1.8 4.0 4.1Federal 5.1 1.0 2.6 4.5 7.6 8.0State or local 12.1 2.4 6.1 10.7 18.2 19.4
33.8 10.8 30.3 41.6 43.8 36.6
63.4 31.9 51.2 62.3 74.1 87.160.1 29.7 47.9 59.2 70.6 83.031.8 9.4 19.1 27.0 35.7 59.126.2 6.3 14.7 21.3 29.2 51.610.9 4.0 5.8 8.6 11.8 21.10.3 0.0 0.0 0.4 0.4 0.4
5.3 2.3 4.4 5.3 8.2 5.5
2.5 1.4 1.9 3.2 3.6 2.0
0.7 0.2 0.6 0.8 0.9 0.9
6.7 24.3 7.1 4.6 1.2 0.82.7 9.0 2.3 2.0 0.8 0.72.5 8.4 2.3 1.8 0.7 0.60.2 0.8 0.1 0.2 0.1 0.15.4 21.7 5.8 3.2 0.4 0.13.5 15.9 3.0 1.2 0.3 0.01.7 6.6 1.9 1.3 0.0 0.01.6 6.7 1.5 0.8 0.1 0.1
0.6 0.6 0.7 0.6 0.6 0.5
22,743 3,698 4,421 4,506 4,966 5,152
Cash public assistance and noncash benefitsCash public assistance
Supplemental Security Income
EnergyHousing
Personal contributions
Number (thousands)
OtherNoncash benefits
Food
Wages and salariesSelf-employment
Retirement benefitsSocial SecurityBenefits other than Social Security
Other public pensionsRailroad RetirementGovernment employee pensions
Private pensions or annuities
Income from assetsInterestOther income from assets
DividendsRent or royaltiesEstates or trusts
Veterans' benefits
Unemployment compensation
Workers' compensation
Earnings
(Continued)
Persons in 2-person families
Table 2.B6Percentage with family income from specified source, by number of persons in family and quintile of per-capita family total money income,2012—Continued
Source of family income
Income of the Population 55 or Older, 2012 ♦ 71
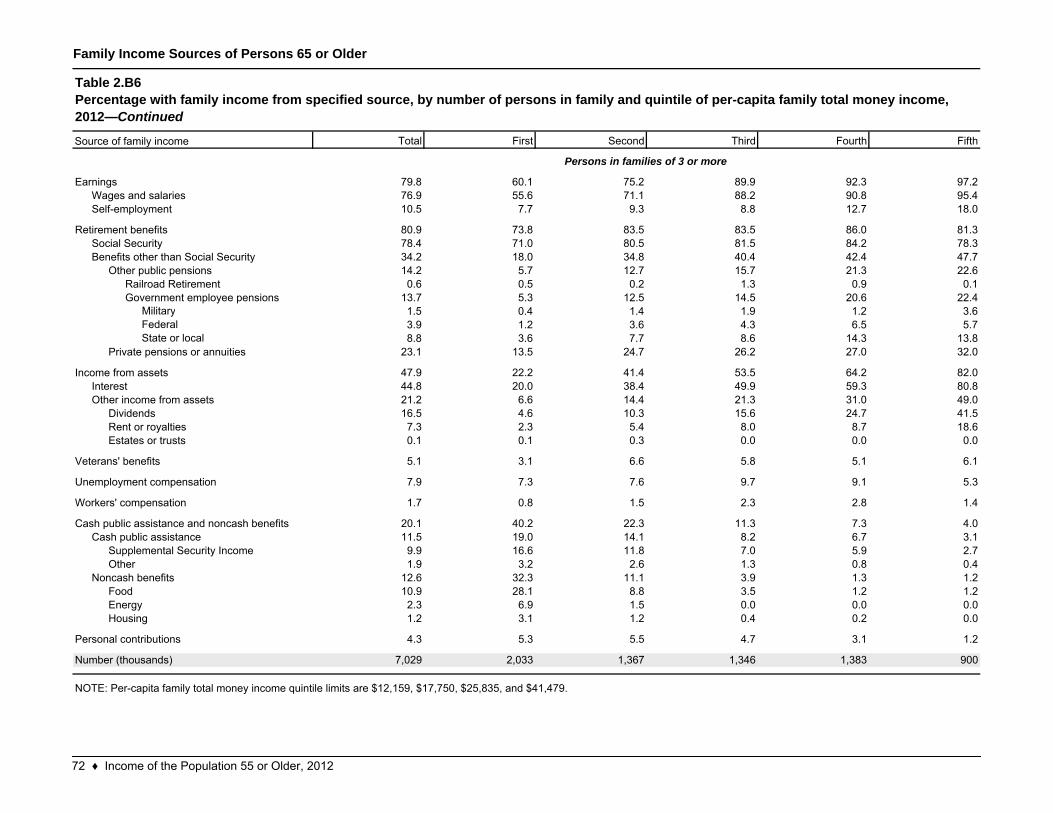
Family Income Sources of Persons 65 or Older
Total First Second Third Fourth Fifth
79.8 60.1 75.2 89.9 92.3 97.276.9 55.6 71.1 88.2 90.8 95.410.5 7.7 9.3 8.8 12.7 18.0
80.9 73.8 83.5 83.5 86.0 81.378.4 71.0 80.5 81.5 84.2 78.334.2 18.0 34.8 40.4 42.4 47.714.2 5.7 12.7 15.7 21.3 22.60.6 0.5 0.2 1.3 0.9 0.1
13.7 5.3 12.5 14.5 20.6 22.4Military 1.5 0.4 1.4 1.9 1.2 3.6Federal 3.9 1.2 3.6 4.3 6.5 5.7State or local 8.8 3.6 7.7 8.6 14.3 13.8
23.1 13.5 24.7 26.2 27.0 32.0
47.9 22.2 41.4 53.5 64.2 82.044.8 20.0 38.4 49.9 59.3 80.821.2 6.6 14.4 21.3 31.0 49.016.5 4.6 10.3 15.6 24.7 41.57.3 2.3 5.4 8.0 8.7 18.60.1 0.1 0.3 0.0 0.0 0.0
5.1 3.1 6.6 5.8 5.1 6.1
7.9 7.3 7.6 9.7 9.1 5.3
1.7 0.8 1.5 2.3 2.8 1.4
20.1 40.2 22.3 11.3 7.3 4.011.5 19.0 14.1 8.2 6.7 3.19.9 16.6 11.8 7.0 5.9 2.71.9 3.2 2.6 1.3 0.8 0.4
12.6 32.3 11.1 3.9 1.3 1.210.9 28.1 8.8 3.5 1.2 1.22.3 6.9 1.5 0.0 0.0 0.01.2 3.1 1.2 0.4 0.2 0.0
4.3 5.3 5.5 4.7 3.1 1.2
7,029 2,033 1,367 1,346 1,383 900
Rent or royaltiesEstates or trusts
Veterans' benefits
Housing
Personal contributions
Number (thousands)
Cash public assistanceSupplemental Security IncomeOther
Noncash benefitsFoodEnergy
Unemployment compensation
Workers' compensation
Cash public assistance and noncash benefits
EarningsWages and salariesSelf-employment
Retirement benefitsSocial SecurityBenefits other than Social Security
Other public pensionsRailroad RetirementGovernment employee pensions
Private pensions or annuities
Income from assetsInterestOther income from assets
Dividends
Persons in families of 3 or more
NOTE: Per-capita family total money income quintile limits are $12,159, $17,750, $25,835, and $41,479.
Table 2.B6Percentage with family income from specified source, by number of persons in family and quintile of per-capita family total money income,2012—Continued
Source of family income
72 ♦ Income of the Population 55 or Older, 2012
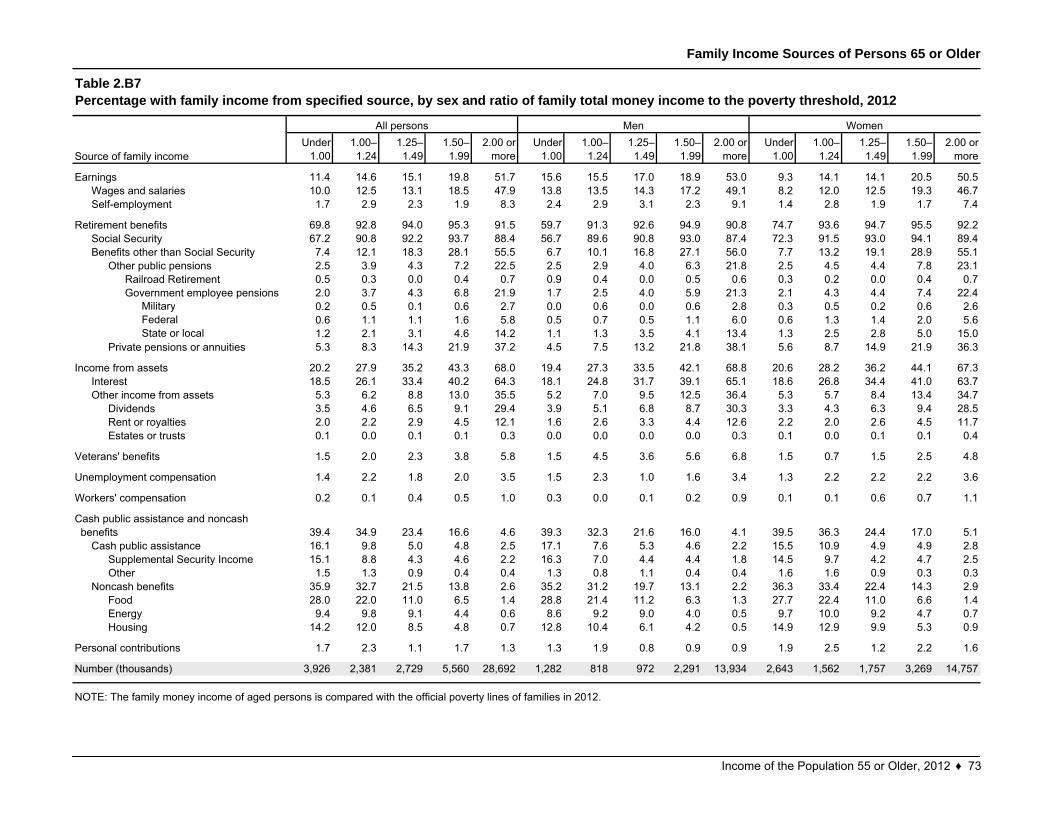
Family Income Sources of Persons 65 or Older
Under 1.00
1.00– 1.24
1.25– 1.49
1.50– 1.99
2.00 or more
Under 1.00
1.00– 1.24
1.25– 1.49
1.50– 1.99
2.00 or more
Under 1.00
1.00– 1.24
1.25– 1.49
1.50– 1.99
2.00 or more
11.4 14.6 15.1 19.8 51.7 15.6 15.5 17.0 18.9 53.0 9.3 14.1 14.1 20.5 50.510.0 12.5 13.1 18.5 47.9 13.8 13.5 14.3 17.2 49.1 8.2 12.0 12.5 19.3 46.71.7 2.9 2.3 1.9 8.3 2.4 2.9 3.1 2.3 9.1 1.4 2.8 1.9 1.7 7.4
69.8 92.8 94.0 95.3 91.5 59.7 91.3 92.6 94.9 90.8 74.7 93.6 94.7 95.5 92.267.2 90.8 92.2 93.7 88.4 56.7 89.6 90.8 93.0 87.4 72.3 91.5 93.0 94.1 89.47.4 12.1 18.3 28.1 55.5 6.7 10.1 16.8 27.1 56.0 7.7 13.2 19.1 28.9 55.12.5 3.9 4.3 7.2 22.5 2.5 2.9 4.0 6.3 21.8 2.5 4.5 4.4 7.8 23.10.5 0.3 0.0 0.4 0.7 0.9 0.4 0.0 0.5 0.6 0.3 0.2 0.0 0.4 0.72.0 3.7 4.3 6.8 21.9 1.7 2.5 4.0 5.9 21.3 2.1 4.3 4.4 7.4 22.4
Military 0.2 0.5 0.1 0.6 2.7 0.0 0.6 0.0 0.6 2.8 0.3 0.5 0.2 0.6 2.6Federal 0.6 1.1 1.1 1.6 5.8 0.5 0.7 0.5 1.1 6.0 0.6 1.3 1.4 2.0 5.6State or local 1.2 2.1 3.1 4.6 14.2 1.1 1.3 3.5 4.1 13.4 1.3 2.5 2.8 5.0 15.0
5.3 8.3 14.3 21.9 37.2 4.5 7.5 13.2 21.8 38.1 5.6 8.7 14.9 21.9 36.3
20.2 27.9 35.2 43.3 68.0 19.4 27.3 33.5 42.1 68.8 20.6 28.2 36.2 44.1 67.318.5 26.1 33.4 40.2 64.3 18.1 24.8 31.7 39.1 65.1 18.6 26.8 34.4 41.0 63.75.3 6.2 8.8 13.0 35.5 5.2 7.0 9.5 12.5 36.4 5.3 5.7 8.4 13.4 34.73.5 4.6 6.5 9.1 29.4 3.9 5.1 6.8 8.7 30.3 3.3 4.3 6.3 9.4 28.52.0 2.2 2.9 4.5 12.1 1.6 2.6 3.3 4.4 12.6 2.2 2.0 2.6 4.5 11.70.1 0.0 0.1 0.1 0.3 0.0 0.0 0.0 0.0 0.3 0.1 0.0 0.1 0.1 0.4
1.5 2.0 2.3 3.8 5.8 1.5 4.5 3.6 5.6 6.8 1.5 0.7 1.5 2.5 4.8
1.4 2.2 1.8 2.0 3.5 1.5 2.3 1.0 1.6 3.4 1.3 2.2 2.2 2.2 3.6
0.2 0.1 0.4 0.5 1.0 0.3 0.0 0.1 0.2 0.9 0.1 0.1 0.6 0.7 1.1
39.4 34.9 23.4 16.6 4.6 39.3 32.3 21.6 16.0 4.1 39.5 36.3 24.4 17.0 5.116.1 9.8 5.0 4.8 2.5 17.1 7.6 5.3 4.6 2.2 15.5 10.9 4.9 4.9 2.815.1 8.8 4.3 4.6 2.2 16.3 7.0 4.4 4.4 1.8 14.5 9.7 4.2 4.7 2.51.5 1.3 0.9 0.4 0.4 1.3 0.8 1.1 0.4 0.4 1.6 1.6 0.9 0.3 0.3
35.9 32.7 21.5 13.8 2.6 35.2 31.2 19.7 13.1 2.2 36.3 33.4 22.4 14.3 2.928.0 22.0 11.0 6.5 1.4 28.8 21.4 11.2 6.3 1.3 27.7 22.4 11.0 6.6 1.49.4 9.8 9.1 4.4 0.6 8.6 9.2 9.0 4.0 0.5 9.7 10.0 9.2 4.7 0.7
14.2 12.0 8.5 4.8 0.7 12.8 10.4 6.1 4.2 0.5 14.9 12.9 9.9 5.3 0.9
1.7 2.3 1.1 1.7 1.3 1.3 1.9 0.8 0.9 0.9 1.9 2.5 1.2 2.2 1.6
3,926 2,381 2,729 5,560 28,692 1,282 818 972 2,291 13,934 2,643 1,562 1,757 3,269 14,757
NOTE: The family money income of aged persons is compared with the official poverty lines of families in 2012.
Housing
Personal contributions
Number (thousands)
Energy
DividendsRent or royaltiesEstates or trusts
Veterans' benefits
Unemployment compensation
Workers' compensation
Cash public assistanceSupplemental Security IncomeOther
Noncash benefitsFood
EarningsWages and salariesSelf-employment
Retirement benefits
Cash public assistance and noncash benefits
Government employee pensions
Private pensions or annuities
Income from assetsInterestOther income from assets
Social SecurityBenefits other than Social Security
Other public pensionsRailroad Retirement
Table 2.B7Percentage with family income from specified source, by sex and ratio of family total money income to the poverty threshold, 2012
All persons Men Women
Source of family income
Income of the Population 55 or Older, 2012 ♦ 73
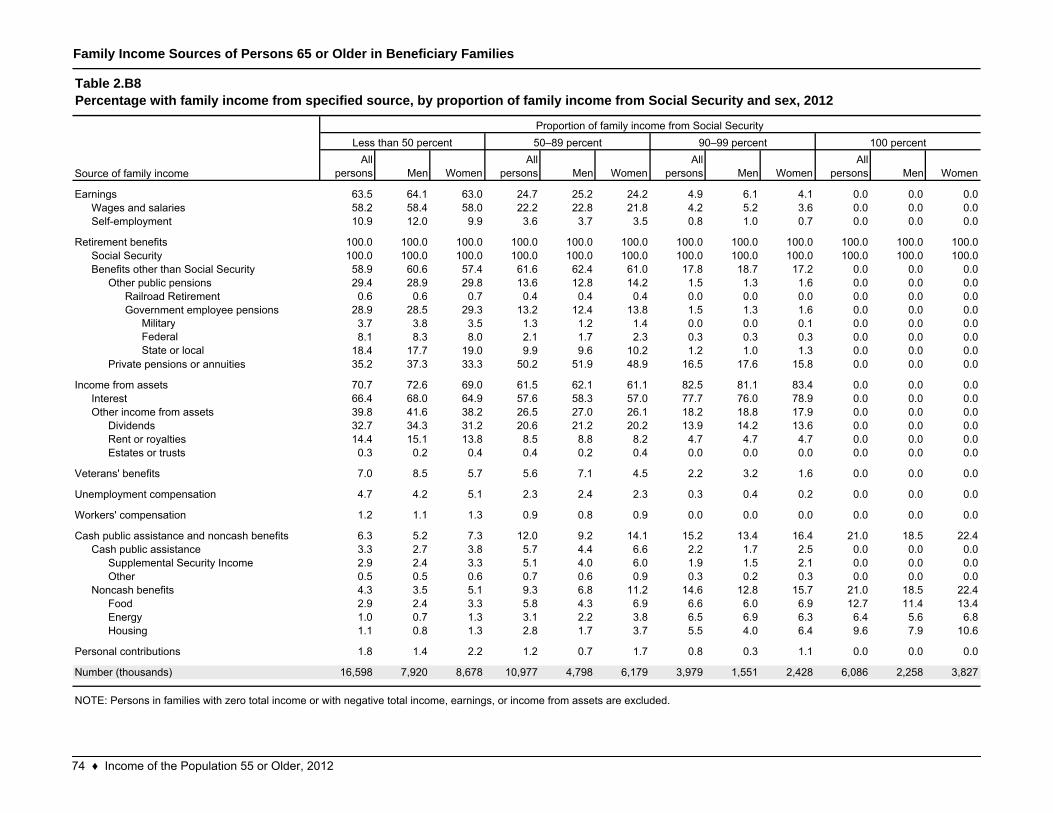
Family Income Sources of Persons 65 or Older in Beneficiary Families
All persons Men Women
All persons Men Women
All persons Men Women
All persons Men Women
63.5 64.1 63.0 24.7 25.2 24.2 4.9 6.1 4.1 0.0 0.0 0.058.2 58.4 58.0 22.2 22.8 21.8 4.2 5.2 3.6 0.0 0.0 0.010.9 12.0 9.9 3.6 3.7 3.5 0.8 1.0 0.7 0.0 0.0 0.0
100.0 100.0 100.0 100.0 100.0 100.0 100.0 100.0 100.0 100.0 100.0 100.0100.0 100.0 100.0 100.0 100.0 100.0 100.0 100.0 100.0 100.0 100.0 100.058.9 60.6 57.4 61.6 62.4 61.0 17.8 18.7 17.2 0.0 0.0 0.029.4 28.9 29.8 13.6 12.8 14.2 1.5 1.3 1.6 0.0 0.0 0.00.6 0.6 0.7 0.4 0.4 0.4 0.0 0.0 0.0 0.0 0.0 0.0
28.9 28.5 29.3 13.2 12.4 13.8 1.5 1.3 1.6 0.0 0.0 0.0Military 3.7 3.8 3.5 1.3 1.2 1.4 0.0 0.0 0.1 0.0 0.0 0.0Federal 8.1 8.3 8.0 2.1 1.7 2.3 0.3 0.3 0.3 0.0 0.0 0.0State or local 18.4 17.7 19.0 9.9 9.6 10.2 1.2 1.0 1.3 0.0 0.0 0.0
35.2 37.3 33.3 50.2 51.9 48.9 16.5 17.6 15.8 0.0 0.0 0.0
70.7 72.6 69.0 61.5 62.1 61.1 82.5 81.1 83.4 0.0 0.0 0.066.4 68.0 64.9 57.6 58.3 57.0 77.7 76.0 78.9 0.0 0.0 0.039.8 41.6 38.2 26.5 27.0 26.1 18.2 18.8 17.9 0.0 0.0 0.032.7 34.3 31.2 20.6 21.2 20.2 13.9 14.2 13.6 0.0 0.0 0.014.4 15.1 13.8 8.5 8.8 8.2 4.7 4.7 4.7 0.0 0.0 0.00.3 0.2 0.4 0.4 0.2 0.4 0.0 0.0 0.0 0.0 0.0 0.0
7.0 8.5 5.7 5.6 7.1 4.5 2.2 3.2 1.6 0.0 0.0 0.0
4.7 4.2 5.1 2.3 2.4 2.3 0.3 0.4 0.2 0.0 0.0 0.0
1.2 1.1 1.3 0.9 0.8 0.9 0.0 0.0 0.0 0.0 0.0 0.0
6.3 5.2 7.3 12.0 9.2 14.1 15.2 13.4 16.4 21.0 18.5 22.43.3 2.7 3.8 5.7 4.4 6.6 2.2 1.7 2.5 0.0 0.0 0.02.9 2.4 3.3 5.1 4.0 6.0 1.9 1.5 2.1 0.0 0.0 0.00.5 0.5 0.6 0.7 0.6 0.9 0.3 0.2 0.3 0.0 0.0 0.04.3 3.5 5.1 9.3 6.8 11.2 14.6 12.8 15.7 21.0 18.5 22.42.9 2.4 3.3 5.8 4.3 6.9 6.6 6.0 6.9 12.7 11.4 13.41.0 0.7 1.3 3.1 2.2 3.8 6.5 6.9 6.3 6.4 5.6 6.81.1 0.8 1.3 2.8 1.7 3.7 5.5 4.0 6.4 9.6 7.9 10.6
1.8 1.4 2.2 1.2 0.7 1.7 0.8 0.3 1.1 0.0 0.0 0.0
16,598 7,920 8,678 10,977 4,798 6,179 3,979 1,551 2,428 6,086 2,258 3,827
OtherNoncash benefits
FoodEnergy
NOTE: Persons in families with zero total income or with negative total income, earnings, or income from assets are excluded.
Housing
Personal contributions
Number (thousands)
Income from assetsInterestOther income from assets
Cash public assistanceSupplemental Security Income
Unemployment compensation
Workers' compensation
Cash public assistance and noncash benefits
DividendsRent or royaltiesEstates or trusts
Veterans' benefits
100 percent
Source of family income
EarningsWages and salariesSelf-employment
Retirement benefitsSocial SecurityBenefits other than Social Security
Other public pensionsRailroad RetirementGovernment employee pensions
Private pensions or annuities
Table 2.B8Percentage with family income from specified source, by proportion of family income from Social Security and sex, 2012
Proportion of family income from Social SecurityLess than 50 percent 50–89 percent 90–99 percent
74 ♦ Income of the Population 55 or Older, 2012