Embed Size (px)
Citation preview

Income Tax Reform andCalifornia Orchard Development
Hoy F. Carman
The effects of requiring capitalization of citrus and almond orchard developmentexpenses on acreage, production and product prices for seven California orchard andvine crops are estimated. Acreage and production of citrus and almonds decreased, asexpected. The decreases in orange and lemon acreage, however, were more than offsetby increased acreage of walnuts and grapes. The switch of developer and investorinterest to walnuts and grapes appears to have added to the cyclical instability ofproduction and prices for these two crops. Perennial crop adjustments to selectivechanges in tax provisions involve very significant time lags.
Income tax provisions are an importantfactor in capital investment decisions for or-chard, grove and vineyard development.Special farm tax provisions, especially cashaccounting and the current deduction of or-chard development costs, provide significantdevelopment incentives. Termination ofmuch of this incentive for development ofcitrus groves and almond orchards by federalincome tax reform in 1969 and 1970 has hadshort- and longer-run impacts on citrus andalmonds as well as other perennial crops.
The expected impacts of capitalization re-quirements on citrus and almonds are de-creased plantings, decreased total acreage
Hoy F. Carman is Professor of Agricultural Economics atthe University of California, Davis and a member of theGiannini Foundation of Agricultural Economics. Theresearch on which this paper is based was done undercontract for the U.S. Department of Agriculture as partof the Structure of Agriculture Project. The author ac-knowledges the constructive suggestions of the Journalreviewers. Giannini Foundation Research Paper No.637.
'The citrus provision requires that all expenditures forpurchase, planting, cultivation, maintenance, or devel-opment of any citrus grove must be capitalized duringthe first four tax years after planting. The rule applies tocitrus trees planted after December 31, 1969, and wasextended to almond trees planted after December 29,1970. The text of the law is in IRC section 278. A
and in the longer-run, decreased productionand higher product prices than would haveexisted without capitalization. For other or-chard crops there may be increased plant-ings, increased total acreage, increased pro-duction and decreased prices as developmentresponds to changing comparative after-taxdevelopment costs.
Objectives
Empirical studies of the impact of agricul-tural income tax incentives and changes inthese incentives have utilized budgeted ex-amples and very specific assumptions con-cerning cost conditions, crop returns, andthe income tax bracket of the developer.Thus, they have limited applicability foraggregate studies and, while one can be con-fident of the general direction of impacts,there is a great deal of uncertainty on mag-nitudes. There are now sufficient data availa-ble to obtain statistical estimates of the im-pact of the citrus and almond capitalizationrequirements on acreage, production and
Treasury Regulation [1.278-1 (a)(2)(iii)] issued in 1971provides that section 278 shall not apply to expendi-tures attributable to real estate taxes or interest, to soiland water conservation expenditures allowable as adeduction under IRC section 175 or to expenditures forclearing land allowable as a deduction under IRC sec-tion 182.
165

Western Journal of Agricultural Economics
prices for California citrus, almonds and re-lated crops.2
The specific objectives of this research areto:
1. Describe the utilization of farm incometax provisions in orchard developmentand present available evidence on theextent of nonfarm investor activity.
2. Specify a model of perennial crop sup-ply response which includes a variableto measure the impact of tax reform.
3. Use this supply response model to esti-mate the impact of changing cost capi-talization provisions on acreage, pro-duction and prices for California naveloranges, valencia oranges, lemons, al-monds, walnuts, avocados and grapes.
This article is organized in line with theobjectives. The analytical portion of thestudy is restricted to California crops becauseCalifornia has a variety of tree and vine cropsas well as published annual estimates ofplantings, bearing acreage, nonbearing acre-age, yield and price required for the analysis.The three citrus crops and almonds weredirectly affected by tax provisions changed in1970 and 1971. Walnuts, avocados andgrapes are included to determine if there wasa shift in developer and investor interest tothese crops, as hypothesized.
Income Tax Incentives andOrchard Development
The establishment of orchards and vine-yards (other than citrus and almonds) offerstax shelter opportunities. The current deduc-tion of pre-production expenses provides de-ferral while recovery of a high proportion ofestablishment costs when the property is soldconverts ordinary income to capital gains.Since the crops require several years to reachfull bearing, the development costs are de-ductible from other taxable income.
2Obtaining data to measure the impact of agriculturalincome tax incentives has been and will continue to bedifficult. Krause and Shapiro discuss some of the prob-lems associated with researching tax shelter invest-ments and also comment on research needs.
Citrus grove and almond orchard develop-ment were popular tax shelter investmentsduring the 1960's. Capitalization provisionseffective in 1970 and 1971, however, shiftedinvestor interest to other crops. Since 1971there have been public offerings emphasizingtax shelter advantages for the development ofgrapes, avocados, walnuts, dates, figs, olives,pistachio nuts, and kiwi fruit. The publicofferings of tax shelter investments in or-chard development were effectively ter-minated, however, by the Tax Reform Act of1976. The 1976 Act requires farming syndi-cates to capitalize planting and developmentcosts for all orchards, groves and vineyards. 3
Individual investors, however, can continueto treat orchard development expenses as acurrent cost to be deducted from other in-come for all crops except citrus and almonds.
Comparison of the present value of currentdeduction versus capitalization of pre-production expenses reveals a significant ad-vantage for current deduction whether theorchard is sold when developed or retainedthroughout its bearing life. Budgeted exam-ples presented by [Carman 1972 and Carmanand Kenyon] demonstrate that the tax sub-sidy varies directly with the income level ofthe investor and is largest for those investorswith the largest income, be it from farming orelsewhere.
The Extent of Tax MotivatedOrchard Development
Data related to tax shelter investments inagriculture are very limited. Interstate pub-lic offerings to nonfarm investors are regis-tered with the Securities Exchange Commis-sion (SEC). Public offerings sold only intra-state usually must be registered with a stateagency. However, neither the SEC nor thecomparable state agencies publish data on
3Sisson discusses the provisions affecting agriculture inthe Tax Reform Act of 1976. Those aimed specifically attax shelter investments include limitation on deduc-tions to amount at risk, limits on deductions for farmingsyndicates, accrual accounting for large farm corpora-tions, and restrictions on prepaid interest.
166
December 1981

Income Tax Reform
the offerings, even though they are regis-tered. Moreover, private placements andsmall private offerings have no registrationrequirements.
Scofield found that there were eightlimited partnerships to establish orchardsand vineyards registered with the SEC in1970-71. They planned to develop about22,000 acres with investor capital of approxi-mately $40 million. Jeanne Dangerfield list-ed a who's who of syndicated farming in 1973which included offerings for orchard andvineyard development worth almost $53 mil-lion on 47,000 acres in California. There wasundoubtedly some overlap in the syndicateslisted by Scofield and Dangerfield. A largenumber of smaller syndications sold onlywithin California (or only within other states)and private placements were not included ineither report. To place these acreages inperspective, estimated annual plantings of allCalifornia tree and vine crops from 1970 to1972 averaged about 85,000 acres.
Estimated Impacts
The development of perennial crops isbased on expected profits over the life of theasset where after-tax profits depend on botheconomic conditions and tax provisions. Ex-pected economic conditions, with expecta-tions based on recent experience, are prob-ably the most important determinant of newtree plantings. The income tax subsidy pro-vided by current deduction of developmentexpenses can be expected to increase treeplantings, total acreage and ultimately, totalproduction. The amount of tax subsidy availa-ble to a developer depends on the develop-er's tax bracket. Thus, the increase in treeplantings as a result of the subsidy is a func-tion of the elasticity of tree planting anddevelopers' tax brackets.
Carman and Youde estimated the acreageresponse of five California orchard crops toincome tax subsidies. Assuming all develop-ers were in the 50% marginal tax bracket, thepercentage increase in acreage by crop wasestimated as: apples, 2.38%; apricots, 3.20%;
avocados, 6.48%; freestone peaches, 1.75%;and olives, 0.14%. Using an economic sur-plus framework, Carman and Youde es-timated that for the five orchard crops con-sidered, combined net returns to consumers,middlemen, and producers as a result oforchard development tax subsidies rangedfrom $.12 per dollar of subsidy for olives to$15.00 per dollar of subsidy for apricots.While the distribution of gains varied bycommodity, consumer surplus was thelargest segment of gross social returns for allcrops and income tax brackets considered.
A case study of five large California farmsusing a utility-maximizing risk frameworkfound that farmers would reduce their acre-age of tree crops by 16% in response torequiring capitalization of development costsfor all orchard crops [Lin et al]. This estimateis probably too high for the total situation,given the comparatively high tax brackets ofthe large case study farms.
To summarize, the available evidence onthe impact of tax subsidies on orchard devel-opment is incomplete. The current deduc-tion of development costs reduces after-taxcosts of development and should expandplanted acreage, ceteris paribus. The impactapparently varies by crop and can be affectedby the tax status of developers. The impacton total acreage of individual crops may beclose to zero or as great as 16%. With in-creased acreage, increased production, lowerproduct prices and probably lower orchardprices would be expected. But, because ofextensive lags between planting and produc-tion and interactions between prices, plant-ings and removals, the impacts may not beapparent for a number of years, if at all.
The studies to date are partial analysesbased on budgeted examples. Thus, the im-pacts of tax subsidies outlined above are bestregarded as testable hypotheses based oneconomic theory. In the following sections,empirical models are specified and estimatedas a limited test of the above hypotheses forCalifornia navel and valenica oranges, lem-ons, almonds, walnuts, avocados and grapes.
167
Carman

Western Journal of Agricultural Economics
Perennial Crop Supply Response
Perennial crop development involves ex-tensive lagged adjustments not found in an-nual crops. Investor and developer expecta-tions are often based on recent productionand price relationships. Establishment of theperennial crop then takes several years fromplanting to commercial production and re-quires a significant capital investment. Pro-duction occurs over an extended period, fin-ally decreasing for "old" plants which areeventually removed. Thus, the production ofa perennial crop is a function of lagged plant-ing and removal decisions which combine todetermine bearing and nonbearing acreage.Annual production is the product of bearingacreage and yield.
Evaluation of the impact of citrus and al-mond capitalization requirements on theseand related perennial crops requires specifi-cation and estimation of a model of supplyresponse for each crop. The theoreticalframework for models of producer supplyresponse has been developed by several re-searchers. Most recent applications and es-timated models involve minor modificationsand extensions to the basic model presentedby French and Matthews.
The French and Matthews theoreticalmodel has five major components. They are:(1) functions for desired production and bear-ing acreage, (2) a relation between desiredand actual planting, (3) an acreage removalequation, (4) relationships between unob-servable expectations and observable vari-ables, and (5) a yield equation. Their empiri-cal application of the model was to asparagus.
The French and Matthews model has beenmodified, extended and further validated fora number of crops. Rae and Carman for-mulated a revised measure of yield expecta-tions given technical change (semi-denseplantings) and applied the model to the NewZealand apple industry. Baritelle and Priceestimated a supply response model for theWashington apple industry. They utilized apolynomial lag formulation to estimate annu-al net changes in the number of trees. Bush-nell developed a supply response component
168
for his optimum control model of the worldalmond market. Minami, French and Kingapplied a supply response model to analysisof the impact of the California cling peachmarketing order. Thor used a similar modelto analyze the impact of the California-Arizona orange marketing orders. Each ofthe above studies assisted in the develop-ment and estimation of the supply responsemodel utilized in this study.
The Supply Response Model
A supply response model to estimate theimpact through time of capitalization provi-sions requires components for total acreagebearing acreage, yields and average farmlevel prices. The structure of the model uti-lized is illustrated in Figure 1. It is a simplerecursive model based on the lagged re-sponse of production to prices. Beginningwith California production and moving clock-wise, the model indicates that current priceis determined by current production and de-mand. Profit expectations are based on acombination of current and past prices (ortotal revenue per acre) and cost factors. Acre-age decisions, involving planting and remov-als, are a function of profit expectations. Notethat existing acreage may be considered inthe planting and removal decisions. Acreagedecisions may not affect production for sever-al years. Thus, current production is a func-tion of past prices. The cobweb or cyclicalbehavior of perennial crop production andprices shown in the model was previouslydemonstrated by French and Bressler.
As shown in Figure 1, annual production isthe product of average yield and bearingacreage. Equations are estimated for annualplanting and annual change in total acreage.Then, these estimated relationships are usedto calculate an estimate of bearing acreageusing the following identity:
TAt = BAt + NBAt or BAt = TAt - NBAt
where:
TA is total acreage of the crop in year t.
December 1981

Income Tax Reform
Figure 1. A Simple Recursive Model ofCalifornia Perennial Crop Acreage, Produc-tion and Prices.
BA is bearing acreage in year t.
NBA is nonbearing acreage in year t.
Assuming that all plantings reach bearingage, nonbearing acreage is the sum of plant-ings during the number of years that elapsebetween the time a tree is planted andclassified as bearing. The time required for atree to be classified as bearing varies by crop,variety and geographic region. The range oftimes used by the California Crop and Live-stock Reporting Service and the times usedin this study for a tree to reach bearing sizeare shown by crop in Table 1. The basicspecification of equations for each modelcomponent are described in the followingsections.
Planting: New plantings of a perennialcrop are specified as a function of expectedprofitability of both that crop and alternativecrops. Since these expectations cannot beobserved, estimation requires specification ofa set of observable variables related to ex-pected profitability.
It is typically assumed that producer ex-pectations are based on recent experience.Thus, empirical models of planting usuallyinclude lagged values for prices or total reve-nue adjusted for costs of production. Simpleaverages, geometrically weighted averages,and distributed lag formulations of variouslengths have been employed. Estimatedplanting equations have also included vari-ables for urbanization, risk and uncertainty,farm labor availability, returns from othercrops, acreage (total, bearing, or acreage inparticular size categories), technologicalchange, and changes in tax laws. The availa-bility of land suitable for orchard crops couldalso affect expectations. Attempts to developa suitable variable for new irrigated acreageon the west side of the San Joaquin Valley,however, were unsuccessful because of datalimitations.
For the crops included in this study, newplantings are specified as a function of laggedaverage prices or total revenue divided bythe index of prices paid by farmers for pro-duction items, a dummy variable for incometax reform, farm labor availability, and totalor bearing acreage. We expect the price ortotal revenue variable to be positively related
TABLE 1. The Number of Years California Fruit and Nut Crops Require to Reach Bearing Age.
Years From Planting to Bearing
Crop Rangea Used in This Study
----------------------------------- years-------------------------------
Almonds 4-5 5Avocados 3-5 3Grapes 3 3Lemons 5-6 5Navel Oranges 5-6 6Valencia Oranges 5-6 5Walnuts 5-7 6
aSource: California Crop and Livestock Reporting Service, California Fruit and Nut Acreage, annualissues.
169
Carman

Western Journal of Agricultural Economics
to plantings. Note that selection of eitherlagged price or total revenue and the numberof years to be averaged was based on theformulation which provided the best statisti-cal results. We expect the coefficient on thetax reform variable to be negatively related tocitrus and almond plantings and to be posi-tively related to plantings of avocados, grapesand walnuts.
Inclusion of a variable for farm labor availa-bility is based on Bushnell's almond study.He reasoned that producers concerned aboutlabor availability would shift to crops whichhad mechanized harvest. The same argumentcan be extended to crops such as citrus forwhich harvest timing is not critical. Citruscan be stored on-the-tree with picking overan extended period. The coefficient on thelabor index variable should be negative forcrops which have mechanized harvest orwhich can be easily harvested over an ex-tended period.
The coefficient on the acreage variableshould be negative because: (1) increasedacreages are associated with potentially larg-er crops and lower product prices, and (2)orchards are developed on the most suitableland first, and expansion takes place on lowerquality land. Each of these two factors areassociated with decreases in expected profits.
Changes in Total Acreage: Annual changesin total acreage of a perennial crop can beregarded as net investment whereas plant-ings are gross investment.4 Thus, the specifi-cation for the annual change in total acreageequation should be similar to the plantingequation. In this study, the independent var-iables included in the two equations are iden-tical. Arguments regarding expected signs on
4 Net changes (net investment) in the capital stock oftrees can be separated into planting (gross investment)and removals. Consider the relationship:
TAt = TAt-, + Nt - Rt
which states that total acreage (TA) of a perennial cropat the end of year t is the total acreage at the end of yeart- 1 plus plantings (N) and minus removals (R) in year t.Moving TAt_ 1 to the left side of the equation, we have:
170
coefficients are also identical for the twoequations.
A possible weakness in identical specifica-tion of the two equations is that there may bevariables associated with removals which areonly weakly associated with planting. Thisproblem should be insignificant, however,since the dependent variable in each equa-tion is a function of expected profits and theindependent variables are observable vari-ables associated with expected profitabil;4v.
Yields: Per acre yields can be influencedby a number of factors including manage-ment and cultural practices, weather,varieties, age of trees, application of inputsand technology. For the projections portionof this study, we are interested only in long-term trends in yields. Thus, average yieldsare specified as a function of time. Bothlinear and logarithmic forms of the equationswere estimated. The linear form providedsuperior results for all crops except lemons.
Prices: The price equation is a central com-ponent of the supply response simulationmodel. Prices are specified as a function ofcurrent production of the crop and compet-ing crops, consumer income, carryover,population and tastes and preferences. Weexpect prices to be negatively related to pro-duction of the crop, production of competingcrops and carryover. Each of these variablesis expressed in per capita terms. We expectprices to be positively related to per capitaincome. Changes in tastes and preferences,reflected by a trend variable, may be eithernegative or positive.
Prices are estimated as a linear function ofthe variables specified using ordinary leastsquares methods. Equations were estimatedusing both current and real prices and in-
TAt - TAt_ = Nt - Rt
where TAt - TAt_ i is the annual change in total acre-age. One would prefer to estimate removals directlyand use a removals equation to estimate annual changesin total acreage. This direct approach is hampered,however, by serious data problems. Annual removalsare not reported and, while they can be calculated,little confidence can be placed in the calculated series.
December 1981

Income Tax Reform
comes. Current prices and incomes yieldedthe best statistical results and are used in thesimulation model.
Estimation of the Model
The time span covered by data used inestimation of the model varies by equation.The yield and price equations are estimatedfor the period 1960-1978. The planting andchange in total acreage equations utilize datato yield estimated values for each of the years1962 through 1978. Thus, for a crop whichuses a three-year lagged average of total rev-enue, data for the period 1958-1978 are re-quired.
Various formulations of prices and per acretotal revenue, including simple averages,weighted averages and distributed lags, wereinvestigated. Simple averages provided thebest statistical results. The choice of price ortotal revenue and the number of years av-eraged were based on statistical measures. Azero-one variable was utilized to estimate theimpact of tax reform. Various lags were inves-tigated for the tax variable since producersand developers may have had developmentcommitments not subject to immediatechange. Lemons were the only crop in whicha one-year lag of the tax reform variableimproved results.
Some adjustments to the planting andacreage data series were necessary. An exam-ple for derivation of the new planting seriesand an explanation of necessary adjustmentsis contained in [Carman 1980, pp. 76-77].Acreage data, new plantings, average yields,and prices used in estimating the model foreach crop and a summary of variables utilizedand data sources is also included in Carman1980, (pp. 78-86).
Estimated Model Components
Equations for planting, change in totalacreage, yield and price are estimated foreach crop. These equations, the componentsof each simulation model, are joined togetherand used to estimate the impact of tax reformprovisions on each of the seven crops.
Planting and Acreage Equations
Estimated equations for annual new plant-ings and annual changes in total acreage foreach of the seven crops studied are presentedin Table 2. The estimated equations are gen-erally quite good as shown by the statisticalmeasures included. The tabled R2 values in-dicate that the variables included in theequations explain from 82 to 98% of thevariation in annual plantings and from 66 to96% of the variation in annual change in totalacreage. The Durbin-Watson statistics showno evidence of serial correlation in the re-siduals. The estimated coefficients generallyhave the expected signs, most are statisticallysignificant at the 95% level of confidence orgreater and most are of reasonable mag-nitudes.
The coefficients on the lagged averageprice and lagged average total revenue peracre divided by the index of prices paid byfarmers for production items are positive, asexpected, and 12 of the 14 are significant atthe 99% confidence level. The best statisticalresults were provided by lagged moving av-erages of five years for lemons and walnuts,three years for valencia oranges and av-ocados, and two years for navel oranges andalmonds. For grapes, deflated prices laggedone year were utilized.
Comparison of the price or total revenuecoefficients for the plantings and change intotal acreage equations reveals that the coef-ficient is larger in the change in total acreageequation for five of the seven crops. Thisindicates that removals are an inverse func-tion of expected profits for these crops, i.e.,higher current prices or total revenue areassociated with lower removals. It appearsthat removals are a positive function of pricesor total revenue for the two nut crops. How-ever, there is little difference in the size ofthe two coefficients for almonds and thechange in total acreage coefficient for walnutsis not significant.
Each of the coefficients on the tax reformvariable has the expected sign and seven ofthe 14 are significant at the 95% confidence
171
Carman

Western Journal of Agricultural Economics
CY0)
c\jC.
LO 0
C\i
LO
C\i
N. Qc OD (D0) a) 0) CD
O00CO
N.CMC\iNmNm
COCOCY
NC C c0000 40 00C
Ie) Ie)0 (D -r- CO)
Ii I r
I 0) I0 CV
T- I o ·I- V- - ~I I
CY)0LO8-O
CDCc
10) O )OON. oc
I I_ I
cN OC0 cCO00
I
0)0C) 00 o
6ico N.'t
I I
-Y004
CO00C\
C1) LO
C) N.
CN C1:C
1
id I. dt
C, 10 a) 0c~ 1( ONJ
CO CM CO t
N. C1 )TI , I
I I - I
(n LO a)0)1 I0)O Cc -t N
IO I'C
cc l- 0 ClN1 Cl)I -I CO I
Cl) q , '
T-* l 00 CMw - 0d Lo
co c coo... v v_.- v
.l c
T7- N7-7
L)CMCO
Iv
O OcO t 1OCD a Ln -cdr T- D
0) C () L0
CyN- c10
0C 0c D( LO C OD -
. C
O
FL <
0 c) 0 c)CD C )0) 0 CDLO ' M-
I I1-
COU)0)
CU
CU .C
o Eac CU
COU)
IL
a
<
§8 LO
CO 040 C5) I a)CD N CVj L6
_ _
CO
E CdU)-j
Un1)C)
0
HD
1O. CNM C) -rvc c
cc Co 10 --o COO LO
CO 0 CM CD0 0- CM T- 'ItLC O LN 0LO - N -
O CU CM C) Co t CM iLO) 0 LCM COYo0 0
0r co ^0°S C)
t 0)
0) - 0)U) U C)
e-
l - 0 U)o Hco c CZ
~<s~ CE 0 < co .
;Fc 3:
U)1)0i.
CU
U)
CO
CZEE
-0 aa) IrCM CoC; D ICZ o
E 0 Dn-M-CZCVLL CO c
00E
.Q
ECXo
u)U)
CU
CU>g
oS
0.
i
a)
r-
E)
c
0I-
cn
c
E
0
0
*0
(,Un
c
(U
0
*
a
c(U
w0.a
*0
o1
cn E(0
X
O0 aq)
m U) a
) > -0) - .)
O a)
0a
-<-O<
o
C a)c -C 0 -a C ZrQ. WU
ojUoa)C
172
December 1981
II

Income Tax Reform
O - CON- 00 N- C)0) 0 co -CM
.~) o-C~Jl C~l 0
(0
caci c~ c-
0 t CO Co .Jl
rC) -r-C) CY
o6 cyi o6 c~jCM
0) ~ t 0 O L ) CO
oi 0 6- ( C i
O CO (C\j
to (0
a) 1-t ) c0) t C) '
C U) r4 [5
It )
CM CMCCj LO 't O LO I'l CM LO0) LO (00 0 00LO "cl,CF) Ci a 0) Cm
Ccl CM 'Id'CM l-
U) /)Q) 0)o a0
Qo Ec< oQ<<o< l <
> L a (3<a aC
0aS
cacoCO0
.E00)
4-
0)
c20)
a
N-0)
0)c~J
N- C
0) a)co ~~000) ~ ~ - )
0CO 0)-(0N- II *, 0)
N-0)~~~~~) C F~~ a> n~~~~
P( OG(0co co 0 c a)
a,~~~~~c (D ;_-
C,'- 4-
I ~~~~~~~CDN-
0 )(D0) CO co(D a )
(00) ~~~~~) =0)'- 0 )>.CO0)
CZ "4- -0CZ C U)0O-oo .7;; c) a
> 70 0CZ CIO 0) -
CZE ~ 0 0)> - 0) CY )0 ) C 0 a) _ (p
E cm (D E~3 c c C-
E c Co a) t$ C " 0 %0 CO U)C(OO a> Li
E a) 0) 0)2at En E a, c'
CZ 0) CO> c J1maxt
E ) a00) OO ) COO)E > a)m~ a
a ) CZ0 C a) .0 . Hu, a) d Ld 0 COu
=3 0 a) Q. - a)a " 0 c o a a)r
E C > -C -05 (D a
.0 0 -0 ( .4 . . -, O
Carman
u)
) Q °n
Co Z
E N
CO ov
UC0)
I5CZ
(0 0 '
0) CO
1<
O ac
CZ
CO>
'D a)
a)
-0) a)
0) 0)
CO >
O00
10
c
cl0
C41-jt·
CI0 -a C
2 p
173
ii
i
iiii
iii
i
c4
A
4
9 I I
Western Journal of Agricultural Economics
level. These tax coefficients indicate that newplantings and total acreage of citrus and al-monds decreased with capitalization re-quirements while new plantings and totalacreage of walnuts, avocados and grapes in-creased. The variable for tax reform is re-tained in each of the equations, even whennot significant, and the estimated coefficientsare utilized in the simulation model to com-pare results with and without tax reform. 5
The availability of farm labor as measuredby the index of farm labor input in the PacificRegion is related to plantings and changes intotal acreage for five of the crops. New plant-ings and total acreage of navel oranges, al-monds and walnuts increased as farm labordecreased. Navel oranges are stored on-treeand harvested over an extended period whilealmonds and walnuts are mechanically har-vested. Thus, availability of harvest labor isnot as critical for these crops as it is for manyothers. Plantings of valencia oranges and av-ocados as well as total acreage of avocadosdecreased as the farm labor index decreased.
Plantings and annual changes in total acre-age are negatively related to total acreage ofvalencia oranges, almonds and grapes andbearing acreage of walnuts. This negativerelationship is expected and five of the coeffi-cients are significant at the 99% confidencelevel. The remaining three coefficients aresignificant at lower confidence levels.
Yields
Actual yields for each crop are utilized inthe model for the period 1970 to 1978 but anestimate is required for the projections to1985. Average yields for the period 1960 to1978 are used unless there was a significanttrend in yields. Simple trend equations for
5One could argue that, if the coefficient measuring the
impact of tax reform is not significantly different than
zero at a high confidence level, it should not be used to
estimate the impact of tax reform in the simulation
model. The estimated coefficients are, however, the
best estimates available and they are consistent with the
theoretical model employed. The reader should note
that the confidence placed in the estimated impacts of
the tax reform will vary by crop.
174
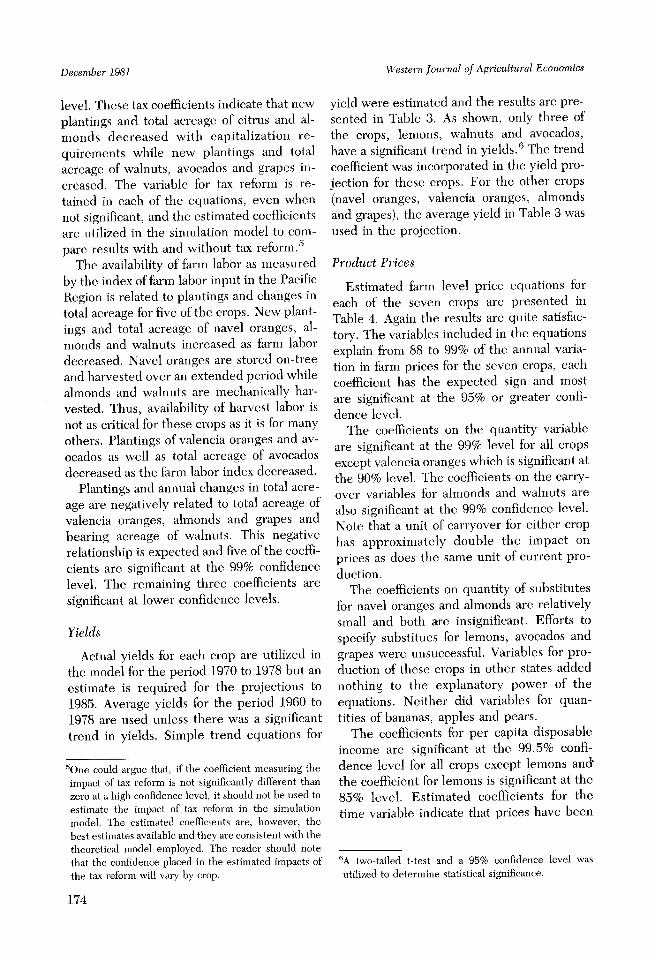
yield were estimated and the results are pre-sented in Table 3. As shown, only three ofthe crops, lemons, walnuts and avocados,have a significant trend in yields. 6 The trendcoefficient was incorporated in the yield pro-jection for these crops. For the other crops(navel oranges, valencia oranges, almondsand grapes), the average yield in Table 3 wasused in the projection.
Product Prices
Estimated farm level price equations foreach of the seven crops are presented inTable 4. Again the results are quite satisfac-tory. The variables included in the equationsexplain from 88 to 99% of the annual varia-tion in farm prices for the seven crops, eachcoefficient has the expected sign and mostare significant at the 95% or greater confi-dence level.
The coefficients on the quantity variableare significant at the 99% level for all cropsexcept valencia oranges which is significant atthe 90% level. The coefficients on the carry-over variables for almonds and walnuts arealso significant at the 99% confidence level.Note that a unit of carryover for either crophas approximately double the impact onprices as does the same unit of current pro-duction.
The coefficients on quantity of substitutesfor navel oranges and almonds are relativelysmall and both are insignificant. Efforts tospecify substitues for lemons, avocados andgrapes were unsuccessful. Variables for pro-duction of these crops in other states addednothing to the explanatory power of theequations. Neither did variables for quan-tities of bananas, apples and pears.
The coefficients for per capita disposableincome are significant at the 99.5% confi-dence level for all crops except lemons andthe coefficient for lemons is significant at the85% level. Estimated coefficients for thetime variable indicate that prices have been
6A two-tailed t-test and a 95% confidence level was
utilized to determine statistical significance.
December 1981

Income Tax Reform
TABLE 3. Average Per Acre Yields for Selected California Tree and Vine Crops as a Functionof Time, 1960-1978.
Cropa Constant Time Coefficient R2 Average Yield
Navel Oranges 207.33 .8088 .009 215 c
(9.00)b (.40)Valencia Oranges 204.44 2.7544 .100 251C
(5.72) (1.38)Lemonsd 5.56 .1475 .520 358C
(73.48) (4.32)Almonds .5492 .0083 .159 .6900e
(6.67) (1.80)Walnuts .4530 .0330 .741 .7832e
(8.40) (6.98)Avocados 1.8963 .0815 .224 2.7116 f
(4.51) (2.21)Grapes 7.1995 -. 0126 .006 7.0732f
(16.21) (-.32)
aThe dependent variable is average yield per acre.bFigures in parentheses are t-statistics.CBoxes per acre.dThe lemon yield equation is estimated linear in logarithms, i.e., In YLconstant and b is the coefficient for Time
eTons per acre (in-shell).'Tons per acre.
trending upward for lemons and downwardfor navel oranges, almonds, walnuts andgrapes. There was no significant price trendfor either avocados or valencia oranges.
Two dummy variables were used to ac-count for unusually high prices for almondsin 1973 and grapes in 1973-1974 which couldnot be explained with traditional demandvariables. Perhaps the unusually high com-modity prices during this period, some ofwhich was due to speculation, affected thesetwo crops. Given the purpose of the priceequations, it appears worthwhile to includethe dummy variables.
Simulation Results
Model components are joined togetherwithin the framework illustrated in Figure 1to simulate behavior of plantings, acreage,production and prices of each crop both withand without current development cost capi-talization provisions for citrus and almonds.The difference between the with and withoutcost capitalization alternatives is incor-
In a + bin Time where a is the
porated through the coefficients for the taxreform dummy variables. The sequence ofcalculations performed for each crop is out-lined in Figure 2. Actual values for each ofthe variables shown in step 1 of Figure 2 areentered for each year during the period 1970-1978. Projections for the years 1979-1985require insertion of assumed values for thevariables in Figure 2. The assumed values ofthe variables for the projections are as fol-lows:
* Population is the series II projection ofcivilian population in the 48 contiguousstates.
* Per capita income, prices paid for pro-duction items, and the farm labor indexuse 1979 values.
* Carryover and quantity of substitutecrops are the five-year average 1975-1979.
* Yield is the trend projection, if signifi-cant, or the average yield for the period1960-1978.
175
Carman

Western Journal of Agricultural Economics
CDcO cV oo ui oo.C .b .N cO LO o
04 N - v--
C 00 - LO ) 10 c0 00 0) 0 0) )
N- .co. o
0 CO
co-Co
CO COm CO
I-
00 _- -CD - O O -- OOCOL) O 0 CMv- L- I CO -
I _ I _-
- 0CM, 0 -4 00 .O t O CM CM r0 o 0CO LOr
. r . . '.. 0
C.O -O N-IO
oc\
CM
L) CI-
I6 I
1 1
O CO O
O) - )O CN LOCN CCo CM r O. .r ' r .
-
tc l 0) -LO't L10-CO CO CO Nt I ICM 00|
I I
oCO
v-
O O0 CO
dv-
4-
~O 0
Oa
CO 0)O
a ° °
'~t-r- 'b-10_
LO I LICn IO
0) 0)
Ol_ O _nO C (D -
0 C-0 (. . .CI D I o
I I
CMr i t I-LC i o I1) CD - O
v-
OCD O O((D CM CO C
CM I (D
N- -D
I I
050 LO 0Co 10O O 00
Co i
'T-0 'T-6)00 - 0 C00 CM CO Co00 I'- I
00 - - COCo LO) C CM
CO - C-0CM
0)0)cnC )
CO 0 )O
C CO 0)
0) 0 o c o a.E E coo E E ' g .
z , < F < O
,?b
0 cO0 Co
I CO
C )
Ij
CO·,O Il
v-
(0
0)
O
o0.5
()Co
.) .2C*-C 0
U)000) T~-0
-O 0
2 20)0 0)
a oLa0)
coa
Cl 0
OOZCCCo 0)
0))
0) .C a) CZ
C/) t--
CO
o~d
no0
0 ~~~~~~~~aaa~3 0 0)
*0~~~~~~~.
0 -n 3 a> Ca
0 0 0 '~~~~ 0 ~0 .0 0 80)~~~~~~~~
a aVt) C "O 00
COCOCO~~~~0 )
8~C) o C70 0
. .!2.2 .2 c~ 0 0 : _
COCCO00)
-0 CI 8
>~~~~ >d > C OC 0)~~~C 0 ) CO o )0~0
*0 V -0 a ~~~~~~~ _ ~~ a C0
CC
0)0 0) .2 C 0 0
a~~~ aa,
C) 0- 4) 4) 0 a
.C .C C- . C) - .C - C 0 .
a- 0ti~~C
cn :) ) o CZ Co
co CL a a)0n O
,; m CZ a)a
a) a) a co cn CD 0 C
=a> > > C: ar co
0) a) a) co wa~~a~~a~~o 0~~~~3 v, ,.
Cf 3 M O
a a a~~ a, '~~ 'CJ ' a, aU- E <a a o
December 1981
_1COv-
0) C °0 C 0p
I
zC4 MC
COE
EE
a>E
COa)
COCS
o
0) .CL O
0)200C:
<D
|
0)
0)
CO>o
¢
(
C
oCD
0
r-m
z.-
L._
0c-
0
O'
Q)
U.
E._
L
I
a
I-
a)
LU-J
/)
a Q)
C 3
cn
a>o
0)0
a
CO
U)
CO
CO0
o
0O-
176
i5
i

Income Tax Reform
-per capita income-quantity of substitutes-corryover-population
2. rCalculate constants for price, planting and annualL change in total acreage equations.
3. [Enter lagged values for price or total revenue,total acreage and planting.
4. Model calculations are performed by year for the
L number of years specified as shown below:
Year t
Total I
Planting
4.Nonbearing I
Acreage
IE Ii-|. Productionj
Prie -
Year t + 1
- I Acrge
.r Planting --
4.
Production
I Price i
Figure 2. Sequence of Calculations for Simu-lation of Acreage, Production and Price.
Each component of the supply responsemodel has been analyzed and tested for sig-nificance but this does not guarantee that theentire model will perform as desired. Sincethe purpose of the model is to measure theimpact of tax reform on acreage, productionand prices for selected perennial crops, itmust be able to generate estimates of thesevariables which closely track the actual dataseries. A comparison of actual and simulatedvalues assuming current tax provisions (withtax reform results) for the years 1970 to 1978indicates that the model does well at identify-ing turning points and is able to closely tracktotal acreage, production and prices. Calcula-tion of root-mean-square percent error statis-tics, as suggested by Pindyck and Rubinfeld[pp. 360-367], yields values ranging from.36% for walnut total acreage to 4.48% fornavel orange price (Table 5). The lower theRMSPE the more precise are the modelestimates. The model generally does an ex-cellent job of estimating total acreage andproduction and provides acceptable esti-mates of farm prices.
The annual estimated impact of tax reformprovisions for the period 1970-1985 is mea-
TABLE 5. Root-Mean-Square Percent Errors for the Test of the Simulation Model, 1970-1978.
Variables
Total FarmCrop Acreage Production Price
------------------------------------- root-mean-square percent error---------------------------------------Navel Oranges .0046 .0077 .0448Valencia Oranges .0060 .0084 .0358Lemons .0040 .0124 .0416Almonds .0045 .0355 .0303Walnuts .0036 .0076 .0313Avocados .0153 .0186 .0393Grapes .0058 .0045 .0147
Source: Calculated from Carman [1980, pp. 27-59]. The formula for calculating root-mean-square percenterror (RMSPE) is:
r \ o=1 ~ ~ l2 1/2
RMSPE - (1) 2] 1/2T t-=1 Yt
where T = number of sample periodsYt = simulated value of variableYt = actual value of variable
177
-yield-production cost Index-labor availability Index-income tax Impact
5.
Carman

Western Journal of Agricultural Economics
sured by the differences between the twosimulated series for total acreage, productionand price. The simulation model results indi-cate that the impacts of development costcapitalization requirements for citrus and al-monds vary significantly by crop. There was alarge decrease in citrus acreage and produc-tion but only a small decrease for almonds. Ashift in investor interest to grapes and wal-nuts resulted in increased acreage of thosetwo crops. The impact on avocado develop-ment was barely discernible.
A summary of the simulated percentageimpact of tax reform on the seven cropsstudied for three years in the study period ispresented in'Table 6. The immediate impactof tax reform on navel orange acreage, pro-duction and price was modest. The impactincreases through time, however, with a1978 estimated decrease in bearing acreageand production of 7% resulting in prices
3.8% higher than without reform. Valenciaorange and lemon acreage were over 10%lower in 1973 with reform than without. Thisdifference increases through time with pro-jected 1985 production over 27% below whatit would have been without reform. Thisacreage impact is the largest for the sevencrops studied. The percentage impact onvalencia orange prices is small and probablyunderstated. The projected price increasedoesn't include the impact of decreased pro-duction in other orange producing states.
The simulated impact of tax reform onalmonds is small and is projected to increasevery little through time (Table 6). The per-centage impact on 1978 and 1985 productionand prices is less than 1%. There is a greatersimulated impact for walnuts and there is alsoevidence of increased cyclical production andprice behavior with tax reform. Total acreageincreases by 9% in 1978 and is then projected
TABLE 6. Simulated Percentage Impact of Tax Reform on Total Acreage, Bearing Acreage,Production and Prices of Selected California Perennial Crops, 1973, 1978 andProjected 1985.
TotalCrop Years Acreage Production Price
---------------------------------------- percent difference----------------------------------------Navel Oranges 1973 - 2.78 - 3.75 3.85
1978 - 5.12 - 7.06 3.781985 - 7.54 -10.46 7.89
Valencia Oranges 1973 -10.10 -11.69 3.341978 -17.39 -21.15 3.251985 -19.03 -27.18 4.92
Lemons 1973 -11.70 - 7.27 6.901978 -21.36 -18.90 14.961985 -21.04 - 27.42 31.81
Almonds 1973 - 0.96 1.41 - .331978 - 1.96 .74 - .211985 - 2.11 - .99 .49
Walnuts 1973 2.29 - 3.61 4.511978 9.00 .88 - .411985 1.95 6.12 - 2.72
Avocados 1973 .43 .88 - .481978 - .43 .49 - .561985 .14 0 0
Grapes 1973 9.95 - 5.69 2.011978 14.68 10.30 - 2.371985 14.32 12.92 - 3.40
Source: [Carman 1980, pp. 27-59]. All percentage calculations use the without tax reform simulated results asthe base.
178
December 1981

Income Tax Reform
to decrease. As total acreage decreases, bear-ing acreage increases with changes in therelative proportions of bearing and nonbear-ing acreage.
Tax reform has a very small simulated im-pact on avocados through 1978 with the pro-jection showing no impact by 1985. Modelresults show that the hypothesized shift ininvestor interest to avocados was very small.
There was a significant shift to vineyarddevelopment associated with tax reform forcitrus and almonds. Simulation results indi-cate that tax reform was responsible for anincrease in total grape acreage of 9.95% in1973, increasing to over 14% in 1978 and1985 (Table 6). Bearing acreage and produc-tion initially decreased in response to taxreform and then increased to 10.3% over thelevel without reform with a further 2.6%increase through 1985. The estimated 1978decrease in grape prices due to increasedacreage is 2.37%.
Summary and Conclusions
A perennial crop supply response model isspecified and estimated for navel oranges,valencia oranges, lemons, almonds, walnuts,avocados, and grapes. The model is thenused to estimate the annual impacts of citrusand almond tax reform on acreage, produc-tion and prices for each crop for the period1970-1985. Navel orange, valencia orange,lemon and almond acreage and productiondecrease in response to tax reform. The es-timated decrease in 1978 total acreage rangesfrom 21% for lemons to 2% for almonds.Reductions are projected to continuethrough 1985. Acreage and production ofwalnuts and grapes increased in response totax reform for citrus and almonds. The 1978total acreage increase is 9% for walnuts and14.7% for grapes. Avocados show almost noresponse to tax reform for citrus and al-monds.
A brief review of testimony on the TaxReform Act of 1969 reveals an apparent de-sire to curb citrus grove development bynonfarm investors. The possible shift of in-vestor interest to other crops was not an issue
at the time. A year later, however, the citrusprovision was extended to almonds becauseof increased interest in almond orchard de-velopment as a tax shelter.
The effects of selective changes in tax rulescan be dramatic as investors and developersswitch among crops to take advantage offavorable provisions. Model results indicatethat 1978 California citrus and almond acre-age decreased 46,241 acres due to cost capi-talization provisions effective in 1970 and1971. At the same time, walnut and grapeacreage was estimated to be 99,163 acresgreater as a result of citrus and almond costcapitalization. Acreage of crops not inclued inthe analysis, such as pistachios and kiwi,probably also expanded as investors took ad-vantage of the favorable tax treatment availa-ble for these other crops. The problem ofnonfarm investment in orchard developmentsimply shifted from citrus and almonds toother crops with the imposition of capitaliza-tion requirements. It appears that increasedinvestor interest in grapes and walnuts addedto the cyclical instability of production andprices for these two crops. The impacts con-tinue for many years because of the extensivetime lags in perennial crop development.
Tax incentives for orchard developmentcertainly increase the demand for land suit-able for orchards and increase its price. Atthe same time, expanded acreage of an or-chard crop may result in a lower value for thetrees. Tax incentives have significant struc-tural implications. The number of farmsgrowing a particular orchard crop and aver-age acreage are affected. Conditions of entryvary depending on the current income andtax bracket of the developer. High incomeinvestors have a decided advantage.
References
Baritelle, John L. and David W. Price. "Supply Re-sponse and Marketing Strategies for DeciduousCrops." American Journal of Agricultural Economics56(1974): 245-53.
Bushnell, Peter G. "Dynamic Analysis of the WorldAlmond Market and the United States Almond Mar-
179
Carman

Western Journal of Agricultural Economics
keting Order." Ph. D. Thesis, University of California,Davis, 1978.
Carman, Hoy F. "Tax Loss Agricultural InvestmentsAfter Tax Reform." American Journal of AgriculturalEconomics 54(1972): 627-34.
. "The Estimated Impact of Orchard Cost Capi-talization Provisions on California Orchard Develop-ment." Report submitted to U.S. Dept. of Agr. Struc-ture Project, September 1980.
Carman, Hoy F. and David E. Kenyon. "Tax ShelterAspects of Orchard Development Before and AfterTax Reform." HortScience 7(1972): 105-107.
Carman, Hoy F. and James G. Youde. "Alternative TaxTreatment of Orchard Development Costs: Impactson Producers, Middlemen and Consumers." Ameri-can Journal of Agricultural Economics 55(1973): 184-91.
Dangerfield, Jeanne. "Sowing the Till." CongressionalRecord 119, No. 74(1973): S9248-55.
French, Ben C. and Raymond C. Bressler. "The LemonCycle." Journal of Farm Economics 44(1962): 1021-36.
French, Ben C. and Jim L. Matthews. "A Supply Re-sponse Model for Perennial Crops." American Journalof Agricultural Economics 53(1971): 478-90.
Krause, Kenneth R. and Harvey Shapiro. "Tax-InducedInvestment in Agriculture: Gaps in Research." Ag-ricultural Economics Research 26(1974): 13-21.
Lin, William, H. F. Carman, C. V. Moore and G. W.Dean. "Producer Response to Income Taxes: An Em-pirical Test Within a Risk Framework." National TaxJournal 27(1974): 183-95.
Minami, Dwight D., Ben C. French and Gordon A.King. An Econometric Analysis of Market Control inthe California Cling Peach Industry. Giannini Foun-dation Monograph No. 39, University of California,Berkeley, 1979.
Pindyck, Robert S. and Daniel L. Rubinfeld.Econometric Models and Economic Forecast (2nd Edi-tion). McGraw-Hill Book Company, New York, 1981.
Rae, Alan N. and Hoy F. Carman. "A Model of newZealand Apple Supply Response to TechnologicalChange." The Australian Journal of Agricultural Eco-nomics 19(1975): 39-51.
Scofield, William H. "Nonfarm Equity Capital in Agri-culture." Agricultural Finance Review 33(1972): 36-41.
Sisson, Charles A. Provisions of Importance to Agricul-ture in the Tax Reform Act of 1976. Washington,D.C.: USDA ERS-645, 1976.
Thor, Peter K. "An Economic Analysis of the MarketingOrders for the California-Arizona Orange Industry."Ph.D. Thesis, University of California, Davis, 1980.
180
December 1981