Embed Size (px)
Citation preview
1
INCORPORATING 3D UTILITY INVESTIGATIONS WITH ADVANCED UTILITY LOCATING TECHNOLOGIES WITHIN TRANSPORTATION AGENCIES
INTRODUCTION This guidance document is intended to provide states with the newest information for applying advanced utility locating technologies on Subsurface Utility Engineering (SUE) projects, specifically Multichannel Ground Penetrating Radar (MCGPR) and multichannel (often called multi-coil) Time Domain Electromagnetic Induction (TDEMI), as researched and implemented through the SHRP2 R01B product. The product deliverables show how advanced geophysical technologies can assist in obtaining information that cannot be obtained using traditional Quality Level B (QL B) utility investigation techniques; in particular, depth (Z) to the utility, but also geometry. Supplemental 3D data increase the effectiveness and value of a SUE program. Advanced geophysical utility locating technologies, are not a replacement for traditional SUE QL B utility locating, but can be used as a 3D (X,Y,Z) data complement to the 2D (X,Y) SUE investigation. The combination of standard 2D SUE methods and implementing advanced 3D technologies (where appropriate) is useful in reducing the level of uncertainty and increasing the level of completeness of subsurface information regarding the existing utility infrastructure beneath a project site. Integrating SUE 2D and 3D data delivers the most detail possible for 3D utility characterization of pipes, duct banks, vaults and other subsurface features. Integrated 2D and 3D data sets, allow complimentary geophysical SUE methods to be applied to the optimal amount and positioning of positive location / verification test holes across a site. The return on the investment, at the project-level or SUE program-level will be realized when positive identification / verification test holes required to achieve Quality Level A (QL A) standards for safe and cost-effective project delivery, can be optimized (possibly reduced) through better 3D model generation and higher confidence in the subsurface utility infrastructure.
In accordance with the American Society of Civil Engineers (ASCE) standard of care guideline: 38-02 Standard Guidelines for the Collection and Depiction of Existing Subsurface Utility Data (https://www.fhwa.dot.gov/programadmin/asce.cfm) the following quality levels have been established for Subsurface Utility Engineering (SUE) practice:
1. QL A: Utility Quality Level A. The activities involved to obtain the highest accuracy available for horizontal and vertical location of utilities, via excavation and exposure (or verification of previously exposed and surveyed utilities), and subsequent measurement of subsurface utilities, usually at a specific point.
2. QL B: Utility Quality Level B. The activities involved to determine the existence and approximate horizontal position of subsurface utilities, via application of appropriate geophysical methods, and the professional judgment used to correlate such information to QL C information.
3. QL C: Utility Quality Level C. The activities involved in surveying and plotting visible above-ground utility features, and the professional judgment used to correlate such information to QL D information.
2
4. QL D: Utility Quality Level D. Any information on utilities derived from existing records and oral recollections.
Along with individual state standards, guidelines, and manuals for SUE practice, numerous documents are available which define methods for detection and mapping of utilities at each quality level defined above. Multiple documents found in literature depict how each quality level contributes to a transportation project delivery, including:
1. “Feasibility of Mapping and Marking Underground Utilities by State Transportation Departments” (Report FHWA-HRT-16-019) C.A. Quiroga, J. Anspach, P. Scott, E. Kraus… Federal Highway Administration, Washington, D.C., July 2018 https://www.fhwa.dot.gov/publications/research/infrastructure/pavements/16019/index.cfm
2. “Highway / Utility Guide” Publication No. FHWA-SA-93-049 (J. Thorne, D. Turner, and J Lindly. Federal Highway Administration, June 1993) https://www.fhwa.dot.gov/utilities/010604.pdf
3. The White Paper on the ASCE “Standard Guideline for Recording and Exchanging Utility Infrastructure Data” (https://www.asce.org/uploadedFiles/Technical_Areas/Construction_Engeering/Content_Pieces/as-built-standards-whitepaper.pdf)
4. “Applying Subsurface Utility Engineering to Highway and Road Projects” (https://www.fhwa.dot.gov/programadmin/sueshow.cfm) (perhaps the most comprehensive and current set of documents and information)
Non-invasive / geophysical data collection for QL B SUE surveys are routine and considered the standard of practice for 2D project delivery. Field instrumentation, data visualization and ease of use have led to better 2D QL B SUE survey results. These surveys often have integrated GPS data for spatial positioning or followed up with GPS to create digital 2D maps. A few methods such as EMI and GPR, provide a ‘reasonable estimate’ to the target utility which can be documented in the field. There are numerous technologies and types of geophysical systems currently in use for 2D SUE QL B investigations including:
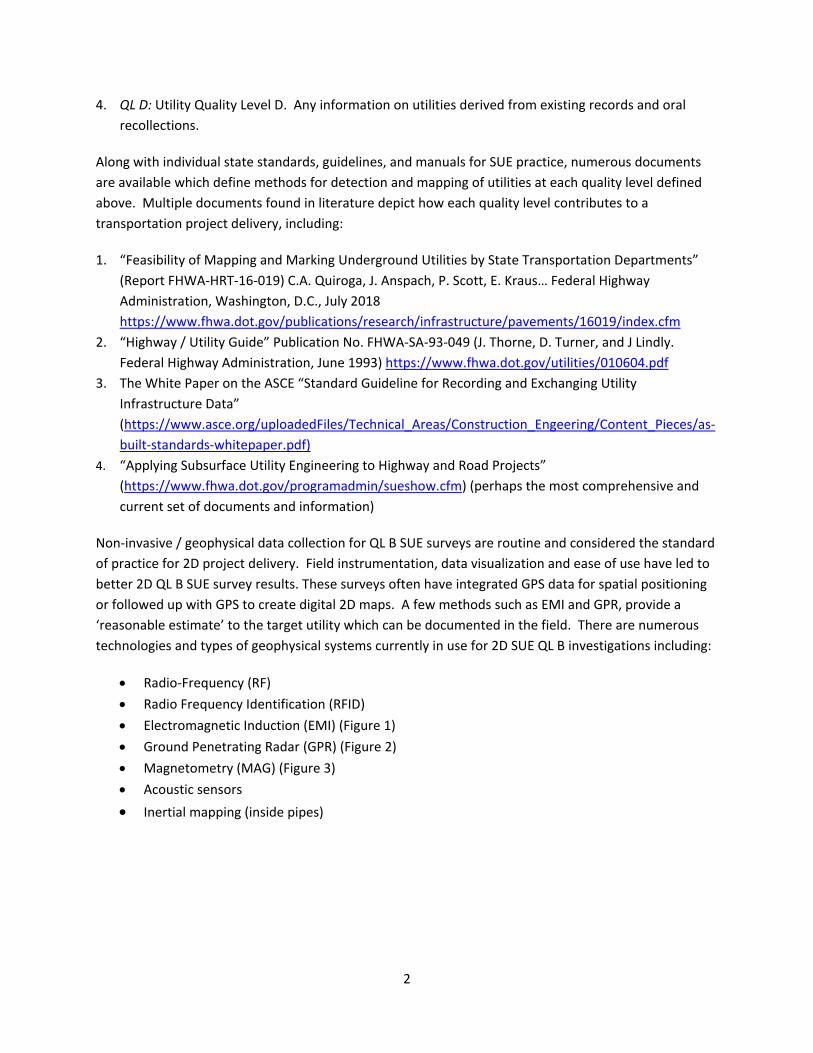
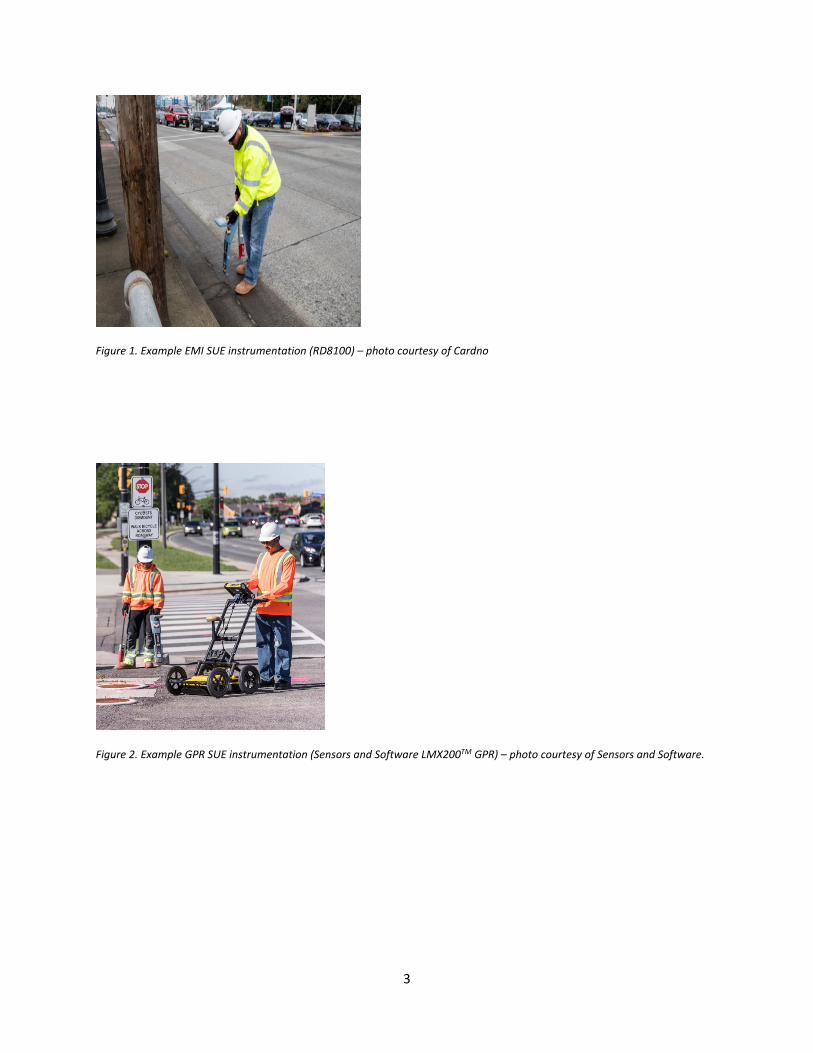
• Radio-Frequency (RF) • Radio Frequency Identification (RFID) • Electromagnetic Induction (EMI) (Figure 1) • Ground Penetrating Radar (GPR) (Figure 2) • Magnetometry (MAG) (Figure 3) • Acoustic sensors • Inertial mapping (inside pipes)
3
Figure 1. Example EMI SUE instrumentation (RD8100) – photo courtesy of Cardno
Figure 2. Example GPR SUE instrumentation (Sensors and Software LMX200TM GPR) – photo courtesy of Sensors and Software.

4
Figure 3. Example MAG SUE instrumentation (Vivax-Metrotech Spar 300 with GPS) – photo courtesy of Utility Mapping Services, Inc.
A thorough discussion regarding the state of the practice for 2D utility data collection equipment, including One-Call, investigation practices, and standard results can be found in “Feasibility of Mapping and Marking Underground Utilities by State Transportation Departments” listed above.
Over the past 10 years, numerous manufacturers of simple and sophisticated hand-held SUE geophysical instrumentation have created better detection and mapping capabilities for horizontal X,Y positions, where QL B results are presented in two-dimensional plan map view. The painted locations are followed-up with survey grade real-time kinematic (RTK) GPS for georeferencing and development of plan map deliverables. Some of the newer SUE geophysical systems have the capability to estimate depth to the utility, and thus have become closer to 3D QL B survey data, yet do not deliver a 3D model but rather, depth estimates presented on the plan map.
Multiple advanced utility locating technology methods were researched under the SHRP2 program to enhance and deliver 3D georeferenced QL B models. Results from the original SHRP2 research established that a single integrated towed platform containing GPR, TDEMI, RFID, acoustic, and seismic detectors was not practical, due to interference from various systems with each other.
From 2016 to 2019 the SHRP2 Implementation Assistance Program provided state agencies with the opportunity to apply their standard 2D SUE program approach and field methods on active highway projects, along with MCGPR and TDEMI advanced 3D geophysical mapping technologies. These technologies were to be used in concert with standard 2D geophysical SUE methods, and integrated together to evaluate the value, strengths, and weaknesses of MCGPR and TDEMI, as they relate to 3D utility mapping. The purpose was to deploy these 3D utility locating technologies with survey-grade georeferenced multisensor geophysical platforms for detection and location of underground utilities and to generate 3D QL B subsurface models.
5
Multiple GPR manufacturers have been developing sophisticated MCGPR antenna array systems (i.e., high number of channels and/or variable frequency range). As the industry develops the manufacturing of 3D MCGPR hardware and software, SUE contractors increasingly own and operate them. Therefore, MCGPR technology and the current service providers were chosen to satisfy the goals of this research effort. Improved MCGPR instrumentation and proprietary software developed by the manufactures allow for more robust data analysis and interpretation with real-time on-site data analysis (e.g., tomography), better on-site screen display and utility identification, and expanded capability to export 3D data into roadway design software (e.g., 3DCad, Bentley, etc.).
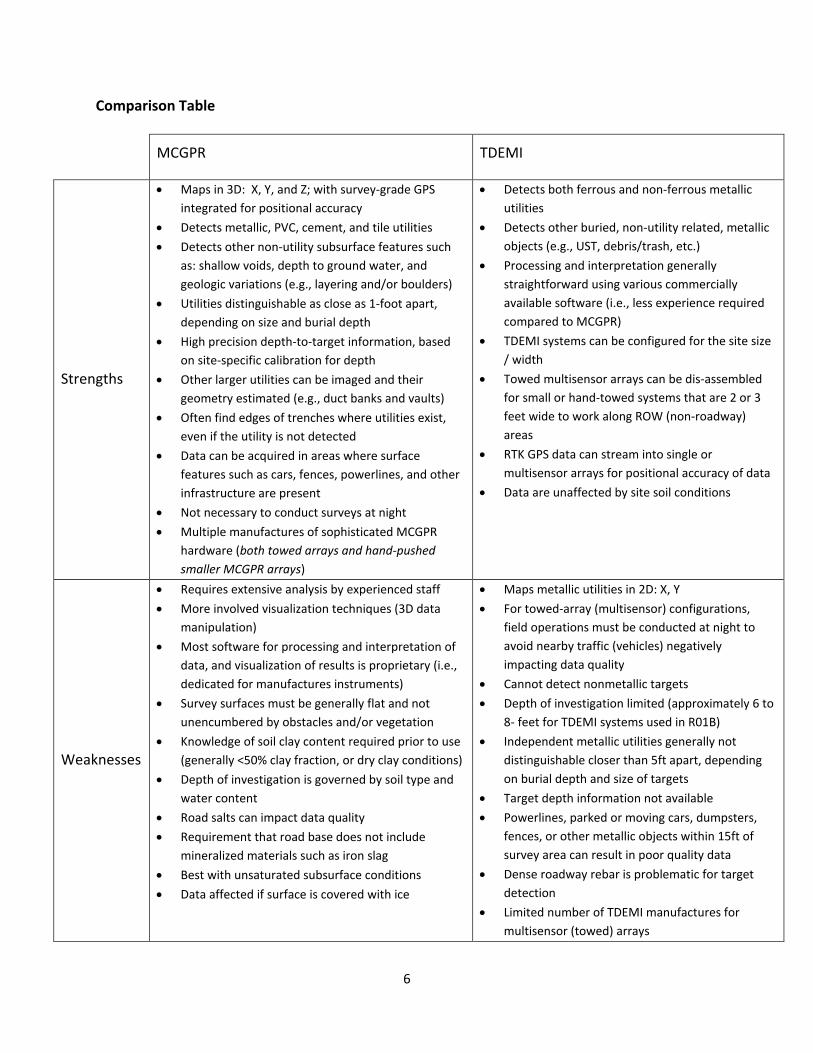
The following table identifies the strengths and weaknesses of MCGPR and multichannel (often called multi-coil) TDEMI. Each method has positive attributes for utility detection, as well as limitations. The limitations range from the physics of the method, to the site conditions and utility type to be imaged. Many lessons learned from the research provide insights to the proper use of one or both of these technologies for QL B SUE investigations. MCGPR provides value to estimate depth to the utility and is suitable to utilize in daylight hours with minimal impact to traffic flow; however, its inability to image through clay substrate must be taken into account based on the site geology. The TDEMI method is unaffected by the soils or rock in the subsurface, but it is a method suited only for mapping metallic utilities in plan view. The following table while not inclusive for all systems, nor all strengths and weaknesses, captures the geophysical system features as reported to date.
6
Comparison Table
MCGPR TDEMI
Strengths
• Maps in 3D: X, Y, and Z; with survey-grade GPS integrated for positional accuracy
• Detects metallic, PVC, cement, and tile utilities • Detects other non-utility subsurface features such
as: shallow voids, depth to ground water, and geologic variations (e.g., layering and/or boulders)
• Utilities distinguishable as close as 1-foot apart, depending on size and burial depth
• High precision depth-to-target information, based on site-specific calibration for depth
• Other larger utilities can be imaged and their geometry estimated (e.g., duct banks and vaults)
• Often find edges of trenches where utilities exist, even if the utility is not detected
• Data can be acquired in areas where surface features such as cars, fences, powerlines, and other infrastructure are present
• Not necessary to conduct surveys at night • Multiple manufactures of sophisticated MCGPR
hardware (both towed arrays and hand-pushed smaller MCGPR arrays)
• Detects both ferrous and non-ferrous metallic utilities
• Detects other buried, non-utility related, metallic objects (e.g., UST, debris/trash, etc.)
• Processing and interpretation generally straightforward using various commercially available software (i.e., less experience required compared to MCGPR)
• TDEMI systems can be configured for the site size / width
• Towed multisensor arrays can be dis-assembled for small or hand-towed systems that are 2 or 3 feet wide to work along ROW (non-roadway) areas
• RTK GPS data can stream into single or multisensor arrays for positional accuracy of data
• Data are unaffected by site soil conditions
Weaknesses
• Requires extensive analysis by experienced staff • More involved visualization techniques (3D data
manipulation) • Most software for processing and interpretation of
data, and visualization of results is proprietary (i.e., dedicated for manufactures instruments)
• Survey surfaces must be generally flat and not unencumbered by obstacles and/or vegetation
• Knowledge of soil clay content required prior to use (generally <50% clay fraction, or dry clay conditions)
• Depth of investigation is governed by soil type and water content
• Road salts can impact data quality • Requirement that road base does not include
mineralized materials such as iron slag • Best with unsaturated subsurface conditions • Data affected if surface is covered with ice
• Maps metallic utilities in 2D: X, Y • For towed-array (multisensor) configurations,
field operations must be conducted at night to avoid nearby traffic (vehicles) negatively impacting data quality
• Cannot detect nonmetallic targets • Depth of investigation limited (approximately 6 to
8- feet for TDEMI systems used in R01B) • Independent metallic utilities generally not
distinguishable closer than 5ft apart, depending on burial depth and size of targets
• Target depth information not available • Powerlines, parked or moving cars, dumpsters,
fences, or other metallic objects within 15ft of survey area can result in poor quality data
• Dense roadway rebar is problematic for target detection
• Limited number of TDEMI manufactures for multisensor (towed) arrays
7
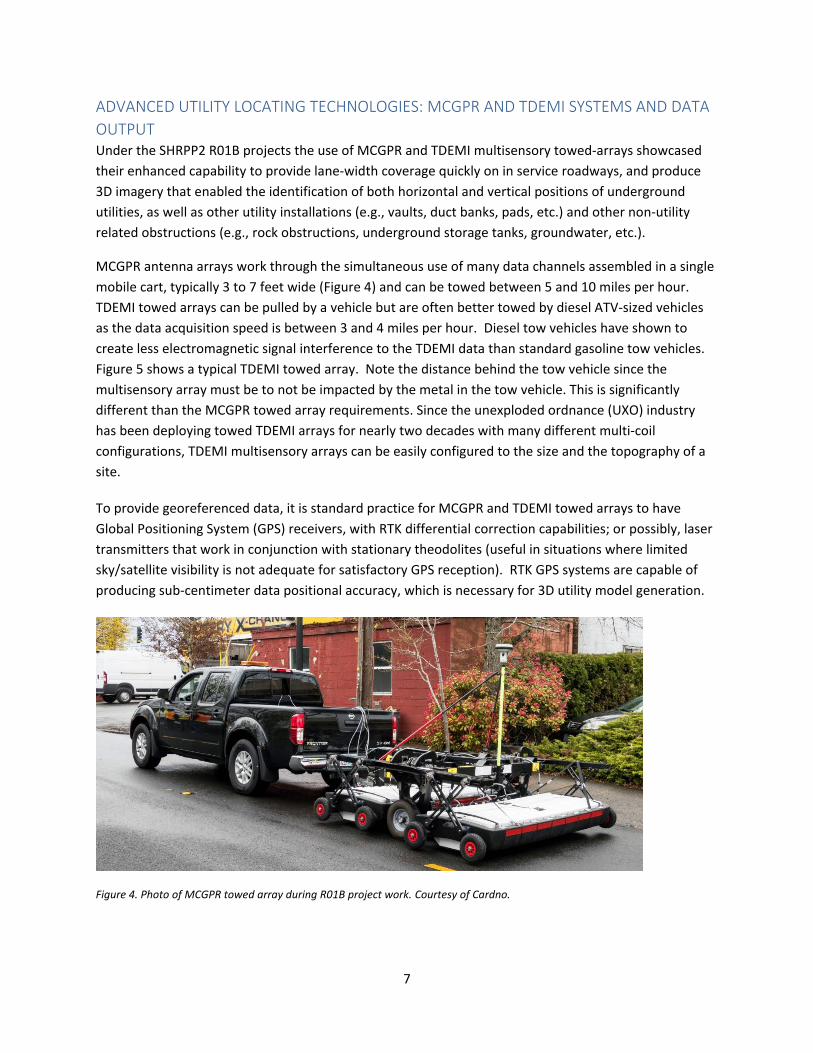
ADVANCED UTILITY LOCATING TECHNOLOGIES: MCGPR AND TDEMI SYSTEMS AND DATA OUTPUT Under the SHRPP2 R01B projects the use of MCGPR and TDEMI multisensory towed-arrays showcased their enhanced capability to provide lane-width coverage quickly on in service roadways, and produce 3D imagery that enabled the identification of both horizontal and vertical positions of underground utilities, as well as other utility installations (e.g., vaults, duct banks, pads, etc.) and other non-utility related obstructions (e.g., rock obstructions, underground storage tanks, groundwater, etc.).
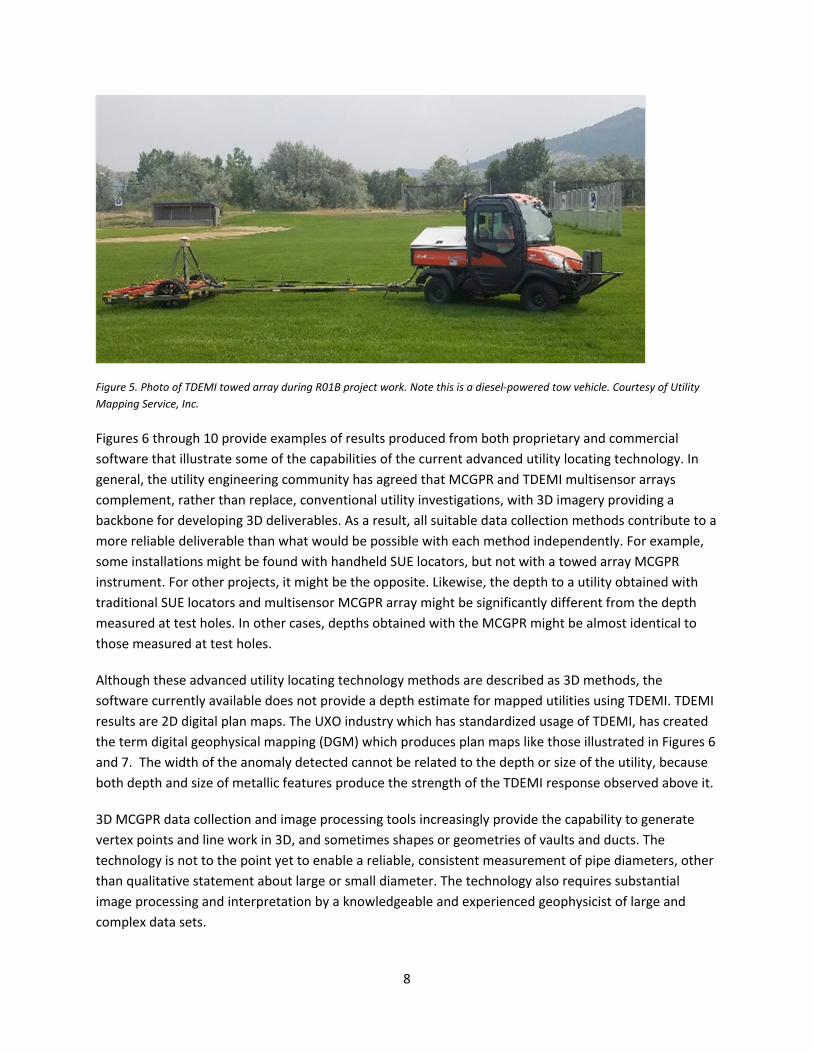
MCGPR antenna arrays work through the simultaneous use of many data channels assembled in a single mobile cart, typically 3 to 7 feet wide (Figure 4) and can be towed between 5 and 10 miles per hour. TDEMI towed arrays can be pulled by a vehicle but are often better towed by diesel ATV-sized vehicles as the data acquisition speed is between 3 and 4 miles per hour. Diesel tow vehicles have shown to create less electromagnetic signal interference to the TDEMI data than standard gasoline tow vehicles. Figure 5 shows a typical TDEMI towed array. Note the distance behind the tow vehicle since the multisensory array must be to not be impacted by the metal in the tow vehicle. This is significantly different than the MCGPR towed array requirements. Since the unexploded ordnance (UXO) industry has been deploying towed TDEMI arrays for nearly two decades with many different multi-coil configurations, TDEMI multisensory arrays can be easily configured to the size and the topography of a site.
To provide georeferenced data, it is standard practice for MCGPR and TDEMI towed arrays to have Global Positioning System (GPS) receivers, with RTK differential correction capabilities; or possibly, laser transmitters that work in conjunction with stationary theodolites (useful in situations where limited sky/satellite visibility is not adequate for satisfactory GPS reception). RTK GPS systems are capable of producing sub-centimeter data positional accuracy, which is necessary for 3D utility model generation.
Figure 4. Photo of MCGPR towed array during R01B project work. Courtesy of Cardno.
8
Figure 5. Photo of TDEMI towed array during R01B project work. Note this is a diesel-powered tow vehicle. Courtesy of Utility Mapping Service, Inc.
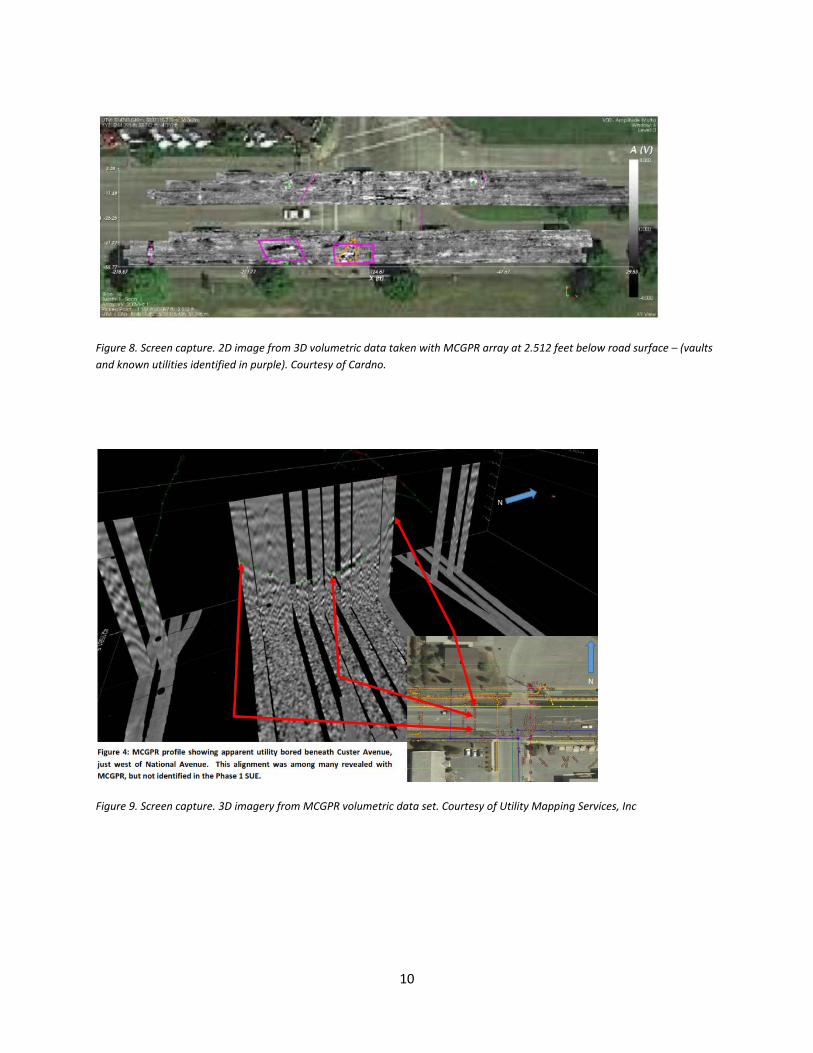
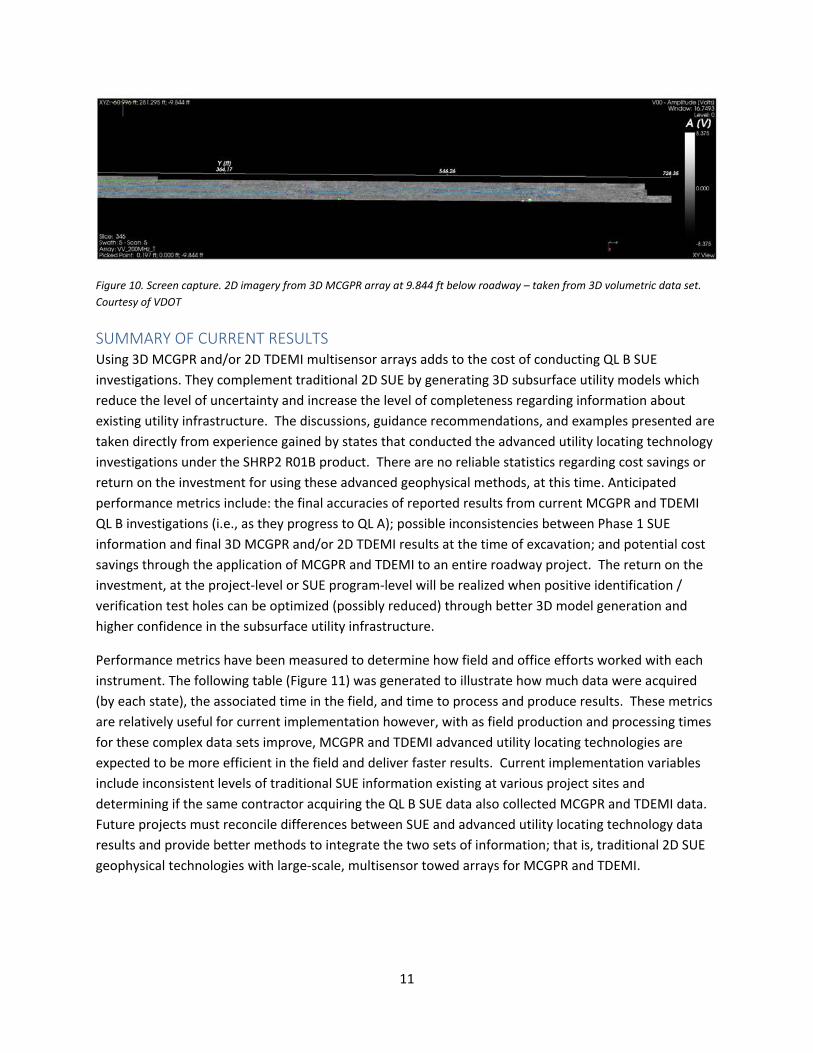
Figures 6 through 10 provide examples of results produced from both proprietary and commercial software that illustrate some of the capabilities of the current advanced utility locating technology. In general, the utility engineering community has agreed that MCGPR and TDEMI multisensor arrays complement, rather than replace, conventional utility investigations, with 3D imagery providing a backbone for developing 3D deliverables. As a result, all suitable data collection methods contribute to a more reliable deliverable than what would be possible with each method independently. For example, some installations might be found with handheld SUE locators, but not with a towed array MCGPR instrument. For other projects, it might be the opposite. Likewise, the depth to a utility obtained with traditional SUE locators and multisensor MCGPR array might be significantly different from the depth measured at test holes. In other cases, depths obtained with the MCGPR might be almost identical to those measured at test holes.
Although these advanced utility locating technology methods are described as 3D methods, the software currently available does not provide a depth estimate for mapped utilities using TDEMI. TDEMI results are 2D digital plan maps. The UXO industry which has standardized usage of TDEMI, has created the term digital geophysical mapping (DGM) which produces plan maps like those illustrated in Figures 6 and 7. The width of the anomaly detected cannot be related to the depth or size of the utility, because both depth and size of metallic features produce the strength of the TDEMI response observed above it.
3D MCGPR data collection and image processing tools increasingly provide the capability to generate vertex points and line work in 3D, and sometimes shapes or geometries of vaults and ducts. The technology is not to the point yet to enable a reliable, consistent measurement of pipe diameters, other than qualitative statement about large or small diameter. The technology also requires substantial image processing and interpretation by a knowledgeable and experienced geophysicist of large and complex data sets.

9
Figure 6. Screen capture. 2D plan map from TDEMI data collection – (these maps are often referred to as a heat map where red indicates metallic objects on the surface or in the subsurface). Courtesy of Cardno.
Figure 7. Screen capture. Draft 2D plan map (overlain on Google Earth Imagery) from TDEMI data collection – (known metallic utilities shown as thin yellow lines for comparison). Courtesy of Caltrans.
10
Figure 8. Screen capture. 2D image from 3D volumetric data taken with MCGPR array at 2.512 feet below road surface – (vaults and known utilities identified in purple). Courtesy of Cardno.
Figure 9. Screen capture. 3D imagery from MCGPR volumetric data set. Courtesy of Utility Mapping Services, Inc
11
Figure 10. Screen capture. 2D imagery from 3D MCGPR array at 9.844 ft below roadway – taken from 3D volumetric data set. Courtesy of VDOT
SUMMARY OF CURRENT RESULTS Using 3D MCGPR and/or 2D TDEMI multisensor arrays adds to the cost of conducting QL B SUE investigations. They complement traditional 2D SUE by generating 3D subsurface utility models which reduce the level of uncertainty and increase the level of completeness regarding information about existing utility infrastructure. The discussions, guidance recommendations, and examples presented are taken directly from experience gained by states that conducted the advanced utility locating technology investigations under the SHRP2 R01B product. There are no reliable statistics regarding cost savings or return on the investment for using these advanced geophysical methods, at this time. Anticipated performance metrics include: the final accuracies of reported results from current MCGPR and TDEMI QL B investigations (i.e., as they progress to QL A); possible inconsistencies between Phase 1 SUE information and final 3D MCGPR and/or 2D TDEMI results at the time of excavation; and potential cost savings through the application of MCGPR and TDEMI to an entire roadway project. The return on the investment, at the project-level or SUE program-level will be realized when positive identification / verification test holes can be optimized (possibly reduced) through better 3D model generation and higher confidence in the subsurface utility infrastructure.
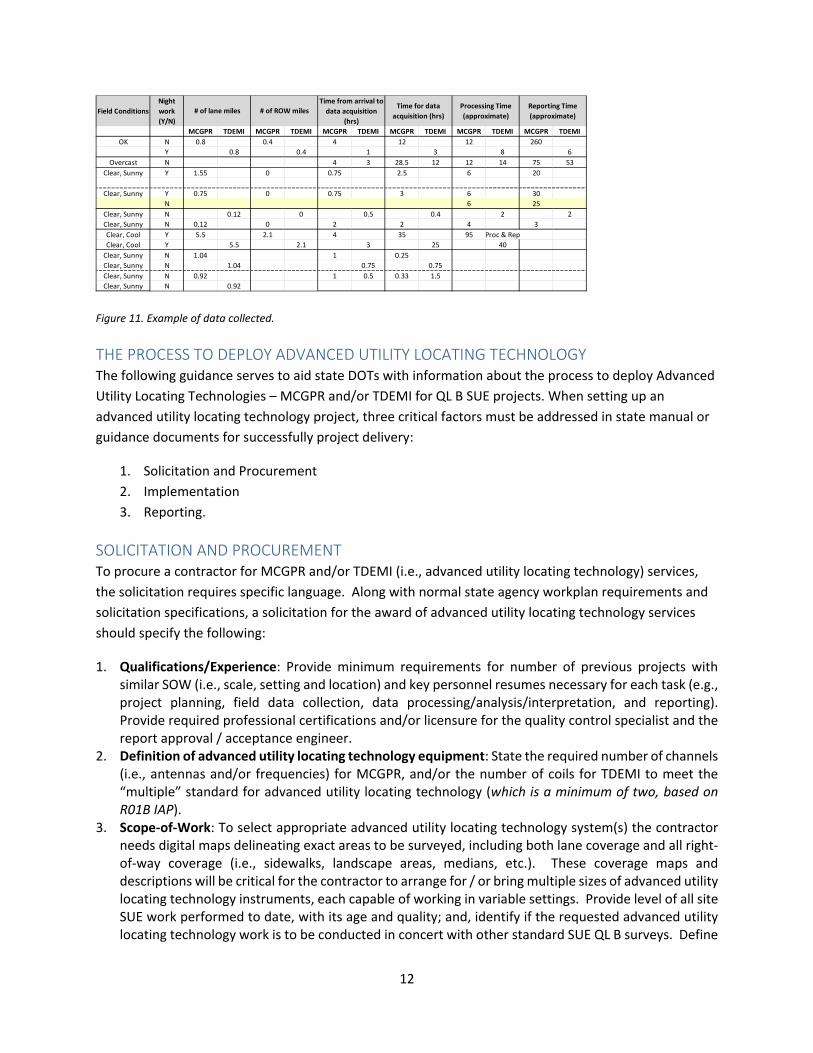
Performance metrics have been measured to determine how field and office efforts worked with each instrument. The following table (Figure 11) was generated to illustrate how much data were acquired (by each state), the associated time in the field, and time to process and produce results. These metrics are relatively useful for current implementation however, with as field production and processing times for these complex data sets improve, MCGPR and TDEMI advanced utility locating technologies are expected to be more efficient in the field and deliver faster results. Current implementation variables include inconsistent levels of traditional SUE information existing at various project sites and determining if the same contractor acquiring the QL B SUE data also collected MCGPR and TDEMI data. Future projects must reconcile differences between SUE and advanced utility locating technology data results and provide better methods to integrate the two sets of information; that is, traditional 2D SUE geophysical technologies with large-scale, multisensor towed arrays for MCGPR and TDEMI.
12
Figure 11. Example of data collected.
THE PROCESS TO DEPLOY ADVANCED UTILITY LOCATING TECHNOLOGY The following guidance serves to aid state DOTs with information about the process to deploy Advanced Utility Locating Technologies – MCGPR and/or TDEMI for QL B SUE projects. When setting up an advanced utility locating technology project, three critical factors must be addressed in state manual or guidance documents for successfully project delivery:
1. Solicitation and Procurement 2. Implementation 3. Reporting.
SOLICITATION AND PROCUREMENT To procure a contractor for MCGPR and/or TDEMI (i.e., advanced utility locating technology) services, the solicitation requires specific language. Along with normal state agency workplan requirements and solicitation specifications, a solicitation for the award of advanced utility locating technology services should specify the following:
1. Qualifications/Experience: Provide minimum requirements for number of previous projects with similar SOW (i.e., scale, setting and location) and key personnel resumes necessary for each task (e.g., project planning, field data collection, data processing/analysis/interpretation, and reporting). Provide required professional certifications and/or licensure for the quality control specialist and the report approval / acceptance engineer.
2. Definition of advanced utility locating technology equipment: State the required number of channels (i.e., antennas and/or frequencies) for MCGPR, and/or the number of coils for TDEMI to meet the “multiple” standard for advanced utility locating technology (which is a minimum of two, based on R01B IAP).
3. Scope-of-Work: To select appropriate advanced utility locating technology system(s) the contractor needs digital maps delineating exact areas to be surveyed, including both lane coverage and all right-of-way coverage (i.e., sidewalks, landscape areas, medians, etc.). These coverage maps and descriptions will be critical for the contractor to arrange for / or bring multiple sizes of advanced utility locating technology instruments, each capable of working in variable settings. Provide level of all site SUE work performed to date, with its age and quality; and, identify if the requested advanced utility locating technology work is to be conducted in concert with other standard SUE QL B surveys. Define
Field Conditions
Night work (Y/N)
MCGPR TDEMI MCGPR TDEMI MCGPR TDEMI MCGPR TDEMI MCGPR TDEMI MCGPR TDEMI OK N 0.8 0.4 4 12 12 260 Y 0.8 0.4 1 3 8 6
Overcast N 4 3 28.5 12 12 14 75 53 Clear, Sunny Y 1.55 0 0.75 2.5 6 20
Clear, Sunny Y 0.75 0 0.75 3 6 30 N 6 25
Clear, Sunny N 0.12 0 0.5 0.4 2 2 Clear, Sunny N 0.12 0 2 2 4 3
Clear, Cool Y 5.5 2.1 4 35 95 Proc & Rep Clear, Cool Y 5.5 2.1 3 25 40
Clear, Sunny N 1.04 1 0.25 Clear, Sunny N 1.04 0.75 0.75 Clear, Sunny N 0.92 1 0.5 0.33 1.5 Clear, Sunny N 0.92
Reporting Time (approximate)
Time from arrival to data acquisition
(hrs)# of lane miles # of ROW miles
Time for data acquisition (hrs)
Processing Time (approximate)
13
the coordinate system to be used for deliverables. Site information regarding geology, surface / roadway conditions and any site-specific hazards should be provided at this scoping phase of the solicitation.
4. Deliverables: Final results should be delivered in electronic formats with the following submittals: digital report; digital file maps (in state pre-defined format); other digital files (not limited to: raw field data, map data, and data videos); supporting SUE information integrated into the interpretation; digital coordinates tables of identified utilities and unconfirmed anomalies; limitations of advanced utility locating technology results based on data quality; and, confidence in the QL B results from use of advanced utility locating technology. ASCE 38 QL B standards apply for advanced utility locating technologies with 3D results (where applicable), therefore the deliverables should not solely be text report with figures and maps.
Note: Item #2 is best responded to by the experienced contractor based on the SOW, based on site description and necessary deliverables. Justification for system selection should be provided by the potential contractors.
IMPLEMENTATION: Key elements of advanced utility locating technology implementation arise early in the process after contractor selection. Project planning is key because many state departments need to interact and clearly communicate with the contractor prior to the start of project work. It is recommended that time be allocated in the contract for pre-project planning meetings intended to prepare and coordinate state staff and selected contractor with necessary information and knowledge of the approach to deploying advanced utility locating technology – whether MCGPR, TDEMI, or both. Guidance suggestions regarding implementation of advanced utility locating technology include but are not limited to the following:
Communication: Because multiple state department staff are required throughout the project, immediately creating an open line of communication between contractor(s) and state staff will alleviate numerous potential problems during deployment. Establishing a line of direct communication for the various phases of implementation (described below) is also key.
Review of Phase 1 SUE Survey(s) – existing and expected: If the entire SUE investigation is conducted by the same vendor the final results can be more reliable and easier to integrate and interpret between the various data sets. This helps the advanced utility locating technology contractor to provide the best QL B results. When this is not possible, due to qualifications, project timing or contracting, spending sufficient time early in project planning with the advanced utility locating technology contractor can significantly enhance the project efficiency, the final result and data accuracy, as well as time required to submit the final QL B deliverables.
Field Deployment: This phase includes the majority of the advanced utility locating technology tasks, each of which require planning and coordination among different state and contractor staff.
Method selection: This brief list should be considered by state staff when contractors are deploying advanced utility locating technology:

14
SOW – The advanced utility locating technology methods and/or instrument(s)chosen for a project will depend on the lane miles and ROW areas and size; that is, the technologies have been developed and packaged primarily for ‘lane-width’ surveys and as such can acquire many miles of data in a single shift. With a data acquisition travel speed of approximately 5 to 10 miles per hour, the more lane-miles in the SOW, the shorter duration of the field effort. The limiting factor for total line length acquired is based on traffic flow, and safe turn-around areas. Multiple items listed below impact which instrument to deploy, and where.
Geology / Site Conditions – MCGPR works best in dry, course to sandy soil conditions, with a signal depth of penetration dependent on the material type. MCGPR does not work well when there is greater than (approximately) 20 percent fines in the subgrade soils, or if there is ice on the roadway or recent application of salt on the road (e.g., winter months). Imaging utilities with TDEMI is unaffected by the geologic materials, or salt on the road surface. Both MCGPR and TDEMI are greatly impacted by the presence of closely-spaced rebar in concrete roadway surfaces; detection of utilities with advanced utility locating technology beneath reinforced concrete is extremely limited.
Utility Type – TDEMI is a metallic pipe location method, thus it does not work for PVC and HDPE, without a tracer wire. Additionally, if the tracer wire is buried deeper than about 4 feet, it may not be detected. Depth of investigation for TDEMI is approximately 6-8 feet below ground. MCGPR cannot image directly PVC or HDPE pipes, but commonly images the edges of the trench and embedment materials. 3D MCGPR is very effective at defining geometry and size of vaults but cannot image the bottom of the structures. Manhole covers reflect MCGPR signal so nothing immediately beneath them can be imaged. Similarly, is impacted by the large metallic manhole cover, so nothing can be imaged below them. Under the right site conditions the covers can be removed for better definition of the manhole and/or vault, and adjacent utilities.
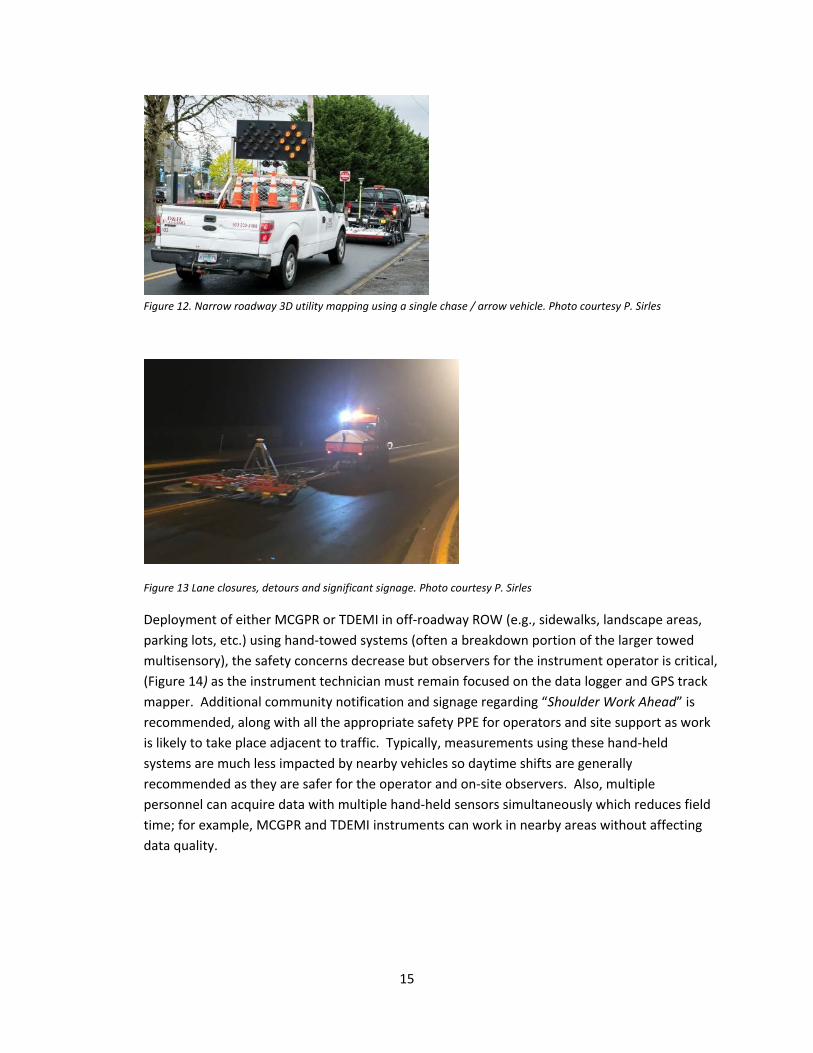
Traffic Controls / Safety – Field work for MCGPR is a safe and effective approach to lane-width and narrow roadway 3D utility mapping using a single chase / arrow vehicle (Figure 12). The tow vehicle, MCGPR trailer, and chase vehicle only impede traffic; thus, it can be deployed during daylight shifts. Community awareness and/or signage prior to field work is recommended. Whereas, TDEMI measurements are greatly impacted by the presence of nearby vehicles (i.e., large metallic objects), and as such it is proven to be most effective for roadway / lane-width mapping during night shifts, requiring substantially different traffic controls. Lane closures, detours and significant signage is recommended (Figure 13); as such, in general no chase vehicle is required.
15
Figure 12. Narrow roadway 3D utility mapping using a single chase / arrow vehicle. Photo courtesy P. Sirles
Figure 13 Lane closures, detours and significant signage. Photo courtesy P. Sirles
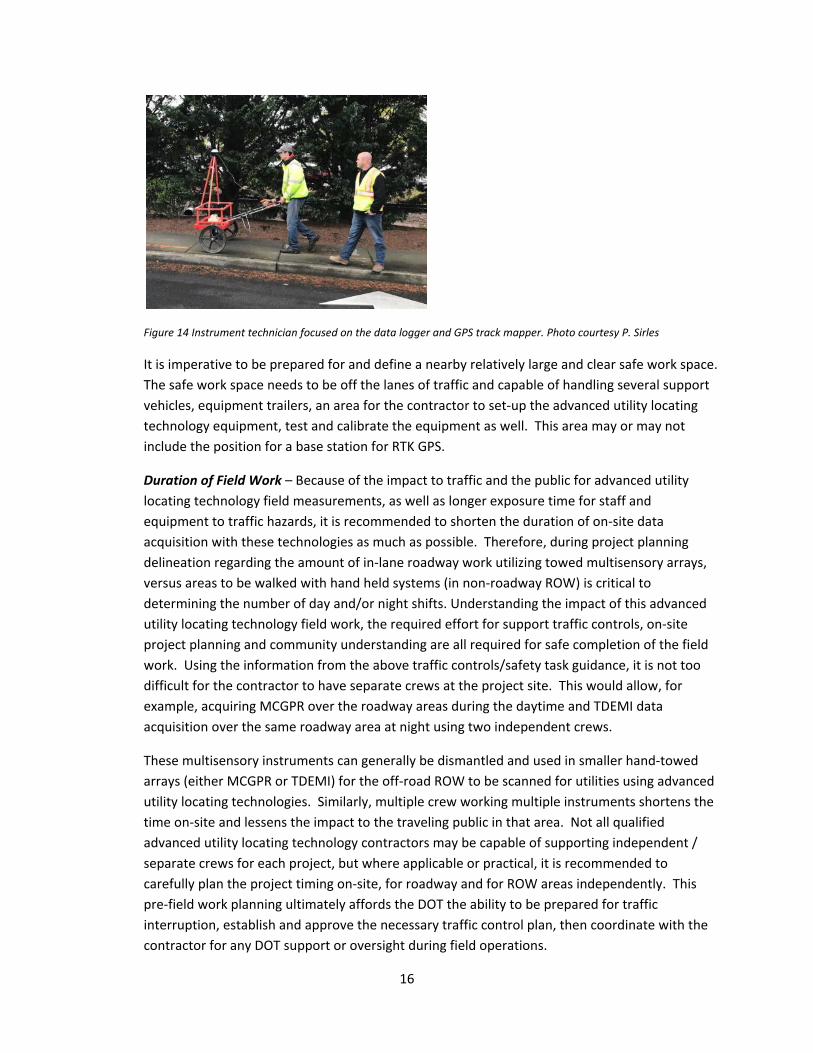
Deployment of either MCGPR or TDEMI in off-roadway ROW (e.g., sidewalks, landscape areas, parking lots, etc.) using hand-towed systems (often a breakdown portion of the larger towed multisensory), the safety concerns decrease but observers for the instrument operator is critical, (Figure 14) as the instrument technician must remain focused on the data logger and GPS track mapper. Additional community notification and signage regarding “Shoulder Work Ahead” is recommended, along with all the appropriate safety PPE for operators and site support as work is likely to take place adjacent to traffic. Typically, measurements using these hand-held systems are much less impacted by nearby vehicles so daytime shifts are generally recommended as they are safer for the operator and on-site observers. Also, multiple personnel can acquire data with multiple hand-held sensors simultaneously which reduces field time; for example, MCGPR and TDEMI instruments can work in nearby areas without affecting data quality.
16
Figure 14 Instrument technician focused on the data logger and GPS track mapper. Photo courtesy P. Sirles
It is imperative to be prepared for and define a nearby relatively large and clear safe work space. The safe work space needs to be off the lanes of traffic and capable of handling several support vehicles, equipment trailers, an area for the contractor to set-up the advanced utility locating technology equipment, test and calibrate the equipment as well. This area may or may not include the position for a base station for RTK GPS.
Duration of Field Work – Because of the impact to traffic and the public for advanced utility locating technology field measurements, as well as longer exposure time for staff and equipment to traffic hazards, it is recommended to shorten the duration of on-site data acquisition with these technologies as much as possible. Therefore, during project planning delineation regarding the amount of in-lane roadway work utilizing towed multisensory arrays, versus areas to be walked with hand held systems (in non-roadway ROW) is critical to determining the number of day and/or night shifts. Understanding the impact of this advanced utility locating technology field work, the required effort for support traffic controls, on-site project planning and community understanding are all required for safe completion of the field work. Using the information from the above traffic controls/safety task guidance, it is not too difficult for the contractor to have separate crews at the project site. This would allow, for example, acquiring MCGPR over the roadway areas during the daytime and TDEMI data acquisition over the same roadway area at night using two independent crews.
These multisensory instruments can generally be dismantled and used in smaller hand-towed arrays (either MCGPR or TDEMI) for the off-road ROW to be scanned for utilities using advanced utility locating technologies. Similarly, multiple crew working multiple instruments shortens the time on-site and lessens the impact to the traveling public in that area. Not all qualified advanced utility locating technology contractors may be capable of supporting independent / separate crews for each project, but where applicable or practical, it is recommended to carefully plan the project timing on-site, for roadway and for ROW areas independently. This pre-field work planning ultimately affords the DOT the ability to be prepared for traffic interruption, establish and approve the necessary traffic control plan, then coordinate with the contractor for any DOT support or oversight during field operations.
17
Survey controls – Advanced utility locating technology requires georeferenced data to produce 3D results, using survey grade GPS or appropriate substitute where GPS is not capable of achieving the ASCE 38-02 positional accuracy standard for QL B. Planning with the state survey department on the coordinate system to be used throughout the project, the position of monuments or control points, and integration of survey systems is important to iron-out prior to start of the field work. A lot of time can be lost without early and cooperative interaction between the DOT and the contractor. The level of accuracy required for advanced utility locating technology towed multisensor instruments is the same as the hand-held systems used in the smaller ROW areas. RTK GPS must be streamed into the instruments to achieve a pre-determined level of accuracy, as defined by the SOW.
Data Processing & Analysis – It is recommended that state staff assigned to a QL B advanced utility locating technology project spend sufficient time with the geophysical contractor, early during the data processing phase, to understand the processes used to produce 3D QL B data sets in order to better understand the deliverables. It is not critical to understand all the nuances of the geophysical data and processing sequence, just the elements that affect interpretation of utilities, or adversely affect the results. Waiting to the end of the project when reports and electronic/digital data are submitted will make it very difficult for the state and contractor to agree on the value, usefulness, and possibly unexpected limitations of the final results.
Utilizing qualified and trained geophysical state staff or the contractors in the data processing and analysis of MCGPR and/or TDEMI is the key to successful project delivery. Numerous factors prevent advanced utility locating technology data from being easily processed with simple or commercially software; particularly, MCGPR data. The fact that, to date, all MCGPR data processing, analysis, and visualization software is propriety to the system hardware, makes these data unique to process. Proprietary system data file formats alone prohibit 3D data processing with other commercial GPR software, including 3D GPR analysis software (e.g., GPR Slice®). It is likely that this will improve with time as the advanced utility locating technology industry matures. Vendors of MCGPR software provide instrument-specific training for the geophysicists operating and processing MCGPR data. For example, GRED is the IDS instruments data processing software, and Examiner is the data processing software for 3D Radar instruments. Both software packages have a well-thought-out processing flow, visualization capabilities with multiple output displays and formats. Additionally, they both allow for key integration of other SUE data in the visualization of their results.
TDEMI data processing has been significantly advanced through UXO industry efforts. The US Army Corps of Engineers (USACE) created specific data acquisition steps (for system calibration) and processing steps to assure both accuracy of the results and safety for the Explosive Ordnance Disposal Technicians (EODT) who would investigate anomalies detected and mapped. Multiple processing software packages are available; for example, GeoSoft, Aarhus Workbench, and STEMINV have all be well tested and approved for stable results and delivery of quality-controlled data sets. Most TDEMI contractors are familiar with these software packages, yet
18
prefer one versus another, and have qualified geophysicists working through the multisensor and single-sensor TDEMI systems.
Site SUE Data Integration – It is not practical to expect that advanced utility locating technology will be used by the same contractor conducting Phase 1 QL B SUE surveys. During the planning stage of an advanced utility locating technology 3D project, the type of SUE data, quality of SUE data, documentation of SUE information with the advanced utility locating technology contractor is critical for project delivery. The consequence of mis-ties and uncertainty in the utilities and anomalies identified can be significant. Without advanced coordination of data acquisition, integration of the two data sets can be the most difficult portion of the data processing and analysis. While the data from advanced utility locating technology methods might be considered more accurate, for some utility systems/types, other utilities identified in the SUE process may go undetected by either or both MCGPR or TDEMI. This fact reveals the importance for the two complimentary data sets. Where practical using the same contractor for the SUE and advanced utility locating technology QL B surveys will benefit the project delivery. Understanding how the two data sets relate to one other, in positive and negative ways, takes considerable staff time; often time unaccounted for during scoping, budgeting and contracting.
REPORTING The use of advanced utility locating technology for 3D mapping of utilities is still maturing. There is not a standard report format or final deliverables. Beyond the normal Phase 1 QL B investigation report deliverables, an advanced utility locating technology final report must contain: Phase 1 SUE data correlation; interpretation of advanced utility locating technology (MCGPR and/or TDEMI results); approach to integration of Phase 1 SUE results into advanced utility locating technology 3D results; 2D and 3D visualization and presentation of advanced utility locating technology data; and, a discussion regarding resolution of discrepancies between SUE and advanced utility locating technology results.
The following is an example table of contents that applies to a Phase 1 SUE project where advanced utility locating technology was also applied, using both MCGPR and TDEMI.
Introduction Project Selection, Identification Scope of Work and Implementation Planning Proposed Project Logistics Utility Ownership Equipment Selection Site and Soil Conditions MCGPR Considerations TDEMI Considerations Utility Engineering Services Performed Results
19
Phase 1 / Traditional SUE QL B Method Results advanced utility locating technology MCGPR Results advanced utility locating technology TDEMI Results
Unresolved Issues Limitations with MCGPR Data Limitations with TDEMI Data
Lessons Learned Time and Cost Matrix Summary and Conclusions Recommendations APPENDICES: MCGPR Images (2D Time Slices, 2D Cross-Sections and 3D Volumes) TDEMI Heat Maps (2D Plan Maps) Anomalies Unrelated to Utilities
It is accepted that that results from traditional SUE geophysical methods are not exact, and the addition of advanced utility locating technology 3D data collection, processing and results verification require an exercise of professional judgment to correlate data from these different data sources, as well as resolve conflicting information. In addition, use of 3D MCGPR data sets is not straight-forward, in terms of file formats, integration to state design systems, or the ability to resolve all features identified with this advanced utility locating technologies. For example, in multiple project sites advanced utility locating technology results successfully identified other subsurface features unrelated to utilities (e.g., unusual geologic conditions and other non-utility obstructions) which could affect design and/or construction of the DOT project. These features are defined as anomalies, and therefore must be documented; that is, identified on plan sheets, and defined in table format with coordinates and a brief interpretation of their character (e.g., shallow rock from MCGPR or large buried metallic object from TDEMI). Advanced utility locating technology anomalies should be broken out separately in an appendix to the utility engineering report.
Based on all the QL B Phase 1 SUE and advanced utility locating technology 3D results, the report must provide recommendations for follow-up investigations. The follow-up may include additional site investigations with geophysical methods (standard SUE or advanced utility locating technology), or the next level of intrusive activities to achieve QLA status for the feature, or for the project as a whole. These recommendations may be needed to further resolve discrepancies, conflicts and address any anomalies not known to be utilities.
A detailed list of state reporting requirements that might be considered for projects including advanced utility locating technologies, are provided below as additional guidance. These reporting requirements are extracted from the 2018 California Subsurface Utility Engineering A/E Template “Scope of

20
Work/Deliverables – Subsurface Utility Engineering Services”; Reporting - Section K – SUE Deliverables1.
1. All required reports, documentation, studies, field notes and sketches, plan drawings, and electronic data shall be submitted for review and acceptance by the Project Manager.
2. Final submittals shall incorporate any corrections or revisions resulting from Caltrans’ review.
3. Plan Drawings.
a. If requested, the Consultant shall submit an example of an original plan sheet and obtain approval from Caltrans prior to drafting plans.
b. Plan drawings shall conform to the requirements set forth in the Caltrans Surveys Manual, Caltrans CADD User’s Manual, Caltrans Standard Plans and Standard Specifications, or as otherwise directed or approved by DOT.
c. Drawings with colors shall be reproducible by all printing or duplication media in black-and-white.
d. Drafting and lettering shall be of proper density and legibility for a 50% reduction during reproduction.
e. The depiction of attributes such as line type, material type, age, condition, ownership, status (e.g., in-service, out-of-service, active, abandoned), number of conduits or direct buried cables, or other required information, shall not be eliminated, obliterated, or obscured by the manner of reproduction or by 50% reduction in size.
f. Final drawings for reproduction shall have all drafting work and image on one side of the sheet.
g. The Consultant shall replace, at no cost to Caltrans, plan sheets that do not comply with the above criteria.
4. Digital Data File Deliverables.
a. Digital data file deliverables shall be in comma-separated variable format and with a data structure to be specified by Caltrans. Digital data file deliverables shall contain the utility data elements needed to enable virtual regeneration of a 3-D model of the utility infrastructure for a project with appropriate attribution and at a sufficient level of detail to aid in identifying potential utility conflicts for project planning and design.
1 Documents available upon request from Caltrans. Contact: [email protected]
21
b. The Consultant’s selected hardware and software, methodology, and format for deliverables, shall conform to the applicable requirements of the Caltrans Survey and/or Drafting Manuals, or shall be as otherwise directed or approved by Caltrans.
c. The Consultant shall contact the Project Manager, prior to creating any electronic data, to verify the current collection and submission requirements.
d. Where physical storage media are used, the Consultant shall identify each unit of media submitted, with adhesive labels affixed to the media and containing identifying and archival information prescribed by the Project Manager.
e. A transmittal letter must accompany the physical storage media and shall contain the same information as required to be affixed to the media and shall also contain a description of the data formats and software utilized.
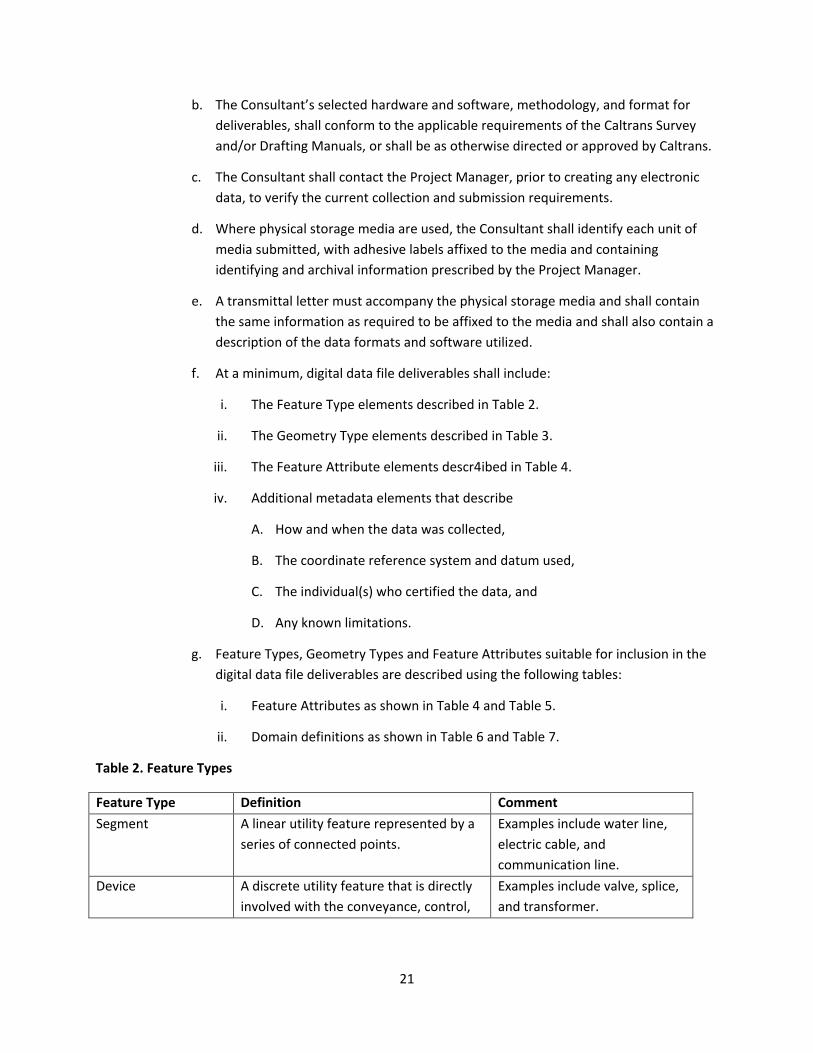
f. At a minimum, digital data file deliverables shall include:
i. The Feature Type elements described in Table 2.
ii. The Geometry Type elements described in Table 3.
iii. The Feature Attribute elements descr4ibed in Table 4.
iv. Additional metadata elements that describe
A. How and when the data was collected,
B. The coordinate reference system and datum used,
C. The individual(s) who certified the data, and
D. Any known limitations.
g. Feature Types, Geometry Types and Feature Attributes suitable for inclusion in the digital data file deliverables are described using the following tables:
i. Feature Attributes as shown in Table 4 and Table 5.
ii. Domain definitions as shown in Table 6 and Table 7.
Table 2. Feature Types
Feature Type Definition Comment Segment A linear utility feature represented by a
series of connected points. Examples include water line, electric cable, and communication line.
Device A discrete utility feature that is directly involved with the conveyance, control,
Examples include valve, splice, and transformer.
22
or distribution of a particular utility service.
Access Point An opening that provides access to utility devices, segments, and containing structures. This feature type is only a point or two-dimensional.
Examples include lid, cover, door, and grate.
Support Structure A structure used to support utility lines and devices.
Examples include pole, tower, and thrust block.
Containing Structure A structure or chamber that houses or provides access to utility devices and typically provides a junction area for multiple utility lines.
Examples include pull box, junction box, manhole, vault, and valve box.
Secured Utility Area An area typically fenced off to restrict access to utility facilities.
Encasement A structure that encloses and protects utility facilities and surrounding infrastructure, environment, and the public.
Examples include concrete cap, steel pipe, and tunnel.
Marker A visible or remotely detectable sign or device used to reference the location of a utility facility.
Tracer A wire or tape used to reference the location of a linear utility facility.
Table 3. Geometry Types
Feature Type Geometry Type (Minimum Required1)
Geometry Type (Optional2)
Segment Line String 3D Object3 Device Point Polygon or 3D Object Access Point Point Polygon Support Structure Point Polygon or 3D Object Containing Structure Polygon 3D Object Secured Utility Area Polygon Encasement Line String 3D Object Marker Point Tracer Line String 1Minimum required geometry type is the simplest geometric depiction of a feature type that conforms to this standard. 2 Optional geometry type is any alternative geometric depictions of a feature type that may be used under this standard. 3If using a 3D Object geometry type, the 3D Object shall include all necessary transformation data to convert local coordinates to georeferenced coordinate data
23
Table 4. Feature Attributes
Feature Attribute
Applies to Feature Type
Segm
ent
Dev
ice
Acce
ss P
oint
Supp
ort
Stru
ctur
e
Cont
aini
ng
Stru
ctur
e
Secu
red
Util
ity
Area
Enca
sem
ent
Mar
ker
Trac
er
ID M M M M M M M M M Owner M M M M M M M M M Operator O O O O O O O O O Utility Type M M M M M M M M M Device Type M M M M M M O O Conveyance Purpose M M M M M O O Intended Permanence M M M M M M M M M Buried Status O O O O O O O O O Operational Status M M M M M M M M M Horizontal Spatial Reference M M M M M M M M M Vertical Spatial Reference M M M M M M M M M Accuracy Level M M M M M M M M M XYZ M M M M M M M M M Azimuth C C C C C XYZ Observed O O O O O O O O O XY Relative Position C C C C C C C C C Z Relative Position C C C C C C C C C XYZ Junction Point O O O O O O O O O Quality Level O O O O O O O O O Linked File O O O O O O O O O Date Data Collected O O O O O O O O O Data Sensitivity Level O O O O O O O O O Is Certified O O O O O O O O O Certification Summary O O O O O O O O O Material O O O O Is Cathodic Protected O O O O Is Encased O O O Is Filled O O O Fill Material O O O Conveyance Method O O Cross Section Configuration O Number of Conduits O Inside Height O O O Inside Width O O O Inside Length O Outside Height O O O O O Outside Width O O O O O O O Outside Length O O O O O Wall Thickness O O O M = Mandatory; O = Optional; C = Conditional (applies if the geometry type used is a 3D object or if observed data are available); Blank = Does not apply
24
Table 5. Feature Attribute Definitions
Attribute Definition Domain
Accuracy Level
Numerical code describing the positional accuracy of points defining the utility feature, as described in Table 1.
Azimuth Horizontal angle (measured clockwise) of the length
dimension of a utility feature with respect to a north base line.
Buried Status
Indicator of whether the feature is partially or completely underground.
Aboveground Completely
Buried
Partially Buried
Cathodic Protected
Cathodic Protected True FALSE
Certification Summary
Name and credentials of the party that certified the data
Certified Indicator of whether the data have been certified True FALSE
Conveyance Method
Method to move or convey matter through the utility feature
Gravity High Pressure Low Pressure Pressurized
Other Unknown Not Applicable
Conveyance Purpose
Primary purpose of service of the utility feature
Cathodic Protection
Collector Control
Monitoring Cooling Data Transfer Distribution Fire Heating Irrigation
Lighting Service Sign Illumination Trace Traffic Control Transmission Other Unknown
Cross Section
Configuration of the cross section of the utility feature
Arch Box Cable Circular Pipe Duct
Duct Bank Horizontal Ellipse Pear Trench Other
Data Sensitivity Level
Indicator of the sensitivity level of the data recorded for a utility feature. If the data are considered sensitive security information (SSI), the data must be labeled on any output produced and handled in accordance with 49 CFR 1520.
Restricted Unrestricted
SSI
Date Data Collected
Date when a utility feature was surveyed in the field
25
Device Type Type of device
Air Eliminator Amplifier Anchor Anode Antenna Armor Attenuator Cable Cap Capacitor Catch Basin Cathodic Test
Station Clean Out Conduit Cover Culvert Culvert End Curb Inlet Door Downspout Drain Drain Separator Drop Inlet Duct Duct Bank Fill Point Filter Fire Connection
Point Generator Glycol Recovery
Pit Grate Grease Trap Grit Chamber Ground Ground Point Ground Rod Guy Anchor Guy Pole Guy Wire Hand Hole Head Bolt Outlet Headwall Hydrant
Outlet Paging Device Panel Pedestal Pig Launch Point Pipe End Pole Pressure
Reducing Station
Pump Ejector Station
Pre-Conditioned Air Unit
Pull Box Pump Pump Booster
Station Pump Station Pump Station
Ejector Push Brace Radio Receptacle Rectifier Reducer Regulator Regulator
Reducer Relay Repeater Reservoir RFID Marker Riser Sample Point Satellite Sensor Service Loop Service Point Solar Panel Speaker Splice Splice Box Splitter Sprinkler Stilling Basin
26
Impedance Matching Point
Inlet Intake Junction Box Lid Lift Station Light Lighting Circuit
Point Lighting Service
Point Line Line Clean Out Load Capacitor Load Coil Manhole Marker Post Marker Sign Media Converter Meter Motor Network Systems
Site Neutralizer Oil Water
Separator
Stormceptor Storm Filter Storm Gate Stub Out Switch Tank Tape Telephone Terminal Terminator Thrust Block Tower Transformer Treatment Unit Trench Tunnel Undefined Utility
Point Vault Valve Box Valve Vent Wing wall Wire Other Unknown
Encased Indicator of the presence of encasement to insulate or
protect the utility feature True FALSE
Fill Material Material used to fill the space between a utility feature
and its encasement or an out-of-service feature. Flowable Fill Foam
Sand Styrofoam
Filled Indicator of the presence of filling material inside the
infrastructure feature True FALSE
Horizontal Spatial Reference
Coordinate system and datum associated with the X and Y coordinates
ID Alphanumeric utility feature identifier
Inside Height
For circular shaped segments, inside diameter of the utility feature cross section.
For non-circular shaped segments, maximum inside height of cross-sectional shape.
For features other than segments, maximum inside height of feature.
For segments, not applicable.
27
Inside Length
For features other than segments, maximum inside length of feature (measured in the horizontal plane, perpendicular to the width).
Inside Width
For circular shaped segments, not applicable. For non-circular shaped segments, maximum inside
width of cross-sectional shape. For features other than segments, maximum inside
width of feature.
Intended Permanence
Intended longevity of the utility feature Permanent Temporary
Linked File
Name of file(s) containing information about the utility feature (e.g., digital photos, CAD files, video, permits, agreement, and other supporting information). Files may be stored as separate fields in a table or as part of an array that contains file names in a single field.
Material
Predominant material of which the utility feature is constructed. For features that transmit a signal or electrical power, material refers to the conductor material.
Acrylonitrile Butadiene Styrene
Aluminum Asbestos Cement Asphalt Block Abandoned in
Place Brick Canvas Clay Coaxial Cable Composite Concrete Copper Corrugated Metal Corrugated
Plastic Ductile Iron Earthen Fiber Optic (or
Optical Fiber) Fiberglass Galvanized Steel Geotextile Glass
Gravel High Density
Polyethylene (HDPE)
Iron Multiple Nickel Pitch Fiber Plastic Polyethylene Polypropylene Polystyrene Polyvinyl
Chloride (PVC) Reinforced
Concrete Removed Steel Stone Terracotta Tile Titanium Transite Twisted Pair
Copper Unknown Wood Wrapped Steel
Number of Conduits
Number of conduits within a pipe or duct bank Number of
Conduits
28
Operational Status
Operational status of the utility feature (see definition of various operational status options in Table 7).
Abandoned In Place
In Service
Other Out of Service Proposed
Operator Name of the entity that operates the utility feature
Outside Height
For circular shaped segments, outside diameter of the utility feature cross section.
For non-circular shaped segments, maximum outside height of cross-sectional shape.
For features other than segments, maximum outside height of feature.
Outside Length
For segments, not applicable. For features other than segments, maximum outside
length of feature (measured in the horizontal plane, perpendicular to the width).
Outside Width Outside Width
For circular shaped segments, not applicable. For non-circular shaped segments, maximum outside
width of cross-sectional shape. For features other than segments, maximum outside width of feature.
Owner Name of the entity that owns the utility feature
Quality Level
Quality level in accordance with ASCE/CI 38- 02 A B
C D
Utility Type Type of utility feature (see definitions of various utility
types in Table 6)
Chemical Communication Compressed Air
or Other Gas Disposal Electric Heating and
Cooling Natural Gas Non-Potable
Water
Petroleum Reclaimed Water Steam Storm Water Wastewater Water Joint Use Other Unknown
Vertical Spatial Reference
Coordinate system and datum for the Z coordinate
Wall Thickness
Maximum wall thickness.
XY Relative Position
Relative position of XYZ Observed with respect to the horizontal alignment of the utility feature.
Center Right Edge Left Edge
29
XYZ
X, Y, and Z coordinates representing the center of the utility feature for data exchange purposes. Depending on the implementation, the X, Y, and Z coordinates may be stored as separate fields in a table or as part of an array that contains spatial data in a single field.
For non-linear structures, XYZ represents an anchor point used for 3D representations, which may or not coincide with the feature’s centroid. In many cases, XYZ coincides with the observed location in the field (e.g., center of manhole lid). For proper orientation in a 3D space, the Azimuth attribute is also necessary.
XYZ Junction Point
X, Y, and Z coordinates of the junction point where two features connect (e.g., the point where a pipe into a manhole or vault, or the point where a manhole chimney connects to a vault).
XYZ Observed
X, Y, and Z coordinates of the utility feature as measured in the field. Depending on the implementation, the X, Y, and Z coordinates may be stored as separate fields in a table or as part of an array that contains spatial data in a single field.
Z Relative Position
Relative position of XYZ Observed with respect to the elevation of the utility feature.
Center Crown/Top Soffit
Invert Bottom
Table 6. Domain Definitions for Utility Type
Utility Type Carries Chemical Chemical substances other than petroleum and
natural gas. Communication Data, voice, and/or video signals. Depending on the
carrier technology and other factors, a communication feature can include optical fiber, coaxial cable, or twisted pair copper.
Compressed Air or Other Gas Compressed air or a gas other than natural gas. Disposal Disposal substances, typically in connection with the
extraction of hydrocarbon products. Electric Electrical power. Heating and Cooling Fluids used to heat or cool buildings and other
facilities. Natural Gas Flammable gas, mostly methane, that occurs
naturally underground. Non-Potable Water Non-potable water. Non-potable water is water that
has not been tested, treated, and approved for human consumption.

30
Petroleum Raw or refined petroleum products in a liquid state. Reclaimed (or Recycled) Water Water that has been reclaimed or recycled and can
be used for new, usually non-drinking, purposes. Steam Pressurized steam. Storm Water Storm water. Wastewater Water that has been used at homes, businesses, and
industrial processes. Water Potable water. Joint Use More than one type of utility.
Table 7. Domain Definitions for Operational Status
Operational Status Description Proposed Proposed utility feature that has not been built yet In Service Active, in-service utility feature (including short-
term service interruptions for maintenance activities)
Out of Service Temporary non-usage of a functioning utility feature in which property rights are maintained
Abandoned in-Place Permanent non-usage (i.e., the utility feature will not be used again) in which property rights are relinquished but liabilities (e.g., environmental liabilities) are maintained
Removed Physically removed from the field Unknown Operational status not determined