Embed Size (px)
Citation preview
Incorporating Meteosat Second Generation Products
in Season Monitoring
Blessing SiwelaSADC Regional Remote Sensing Unit
November 15 2005
Outline
METEOSAT introduction METEOSAT data
Access to data Data format(s)
METEOSAT-7 vs METEOSAT-8 METEOSAT-8 products (current and
potential) for season monitoring
METEOSAT
Geo-stationary 36 000 km altitude Spatial Resolution 3km x 3km visible, thermal infra-red and water
vapour channels 42% of Earth covered 7 year design lifetime
Access to METEOSAT-8 data
Data available in XPIF format on PUMA receiver(s)
All historic MSG data (older than 24 hours) available in the EUMETSAT archive via an online ordering interface on the EUMETSAT Web site;
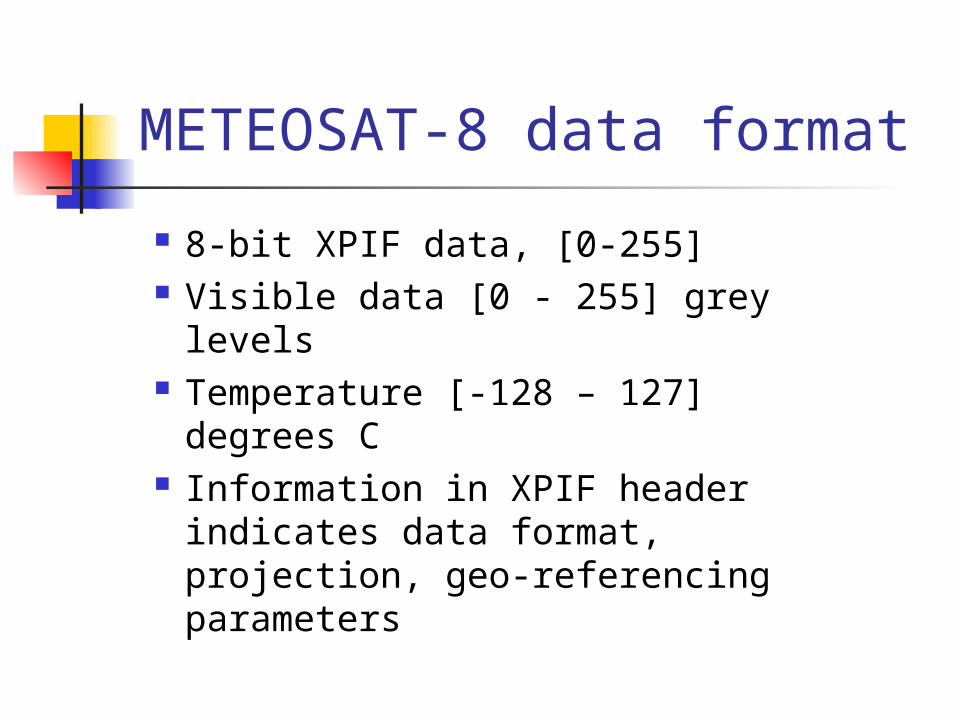
METEOSAT-8 data format
8-bit XPIF data, [0-255] Visible data [0 - 255] grey levels Temperature [-128 – 127]
degrees C Information in XPIF header
indicates data format, projection, geo-referencing parameters
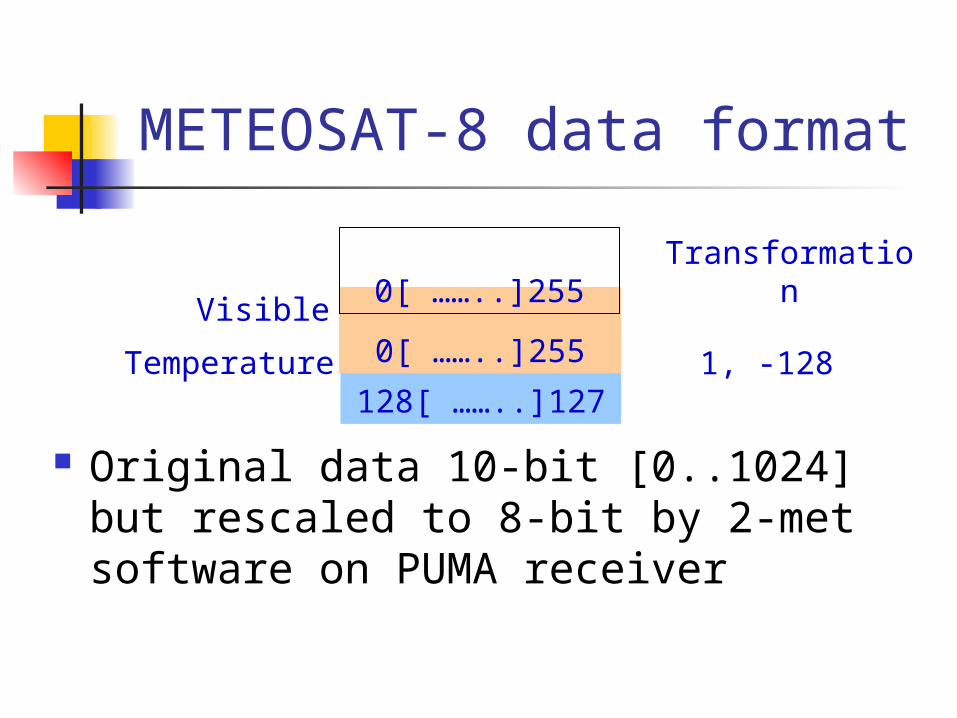
METEOSAT-8 data format
Original data 10-bit [0..1024] but rescaled to 8-bit by 2-met software on PUMA receiver
Temperature
Visible
-128[ ……..]127
0[ ……..]255
0[ ……..]255
1, -128
Transformation
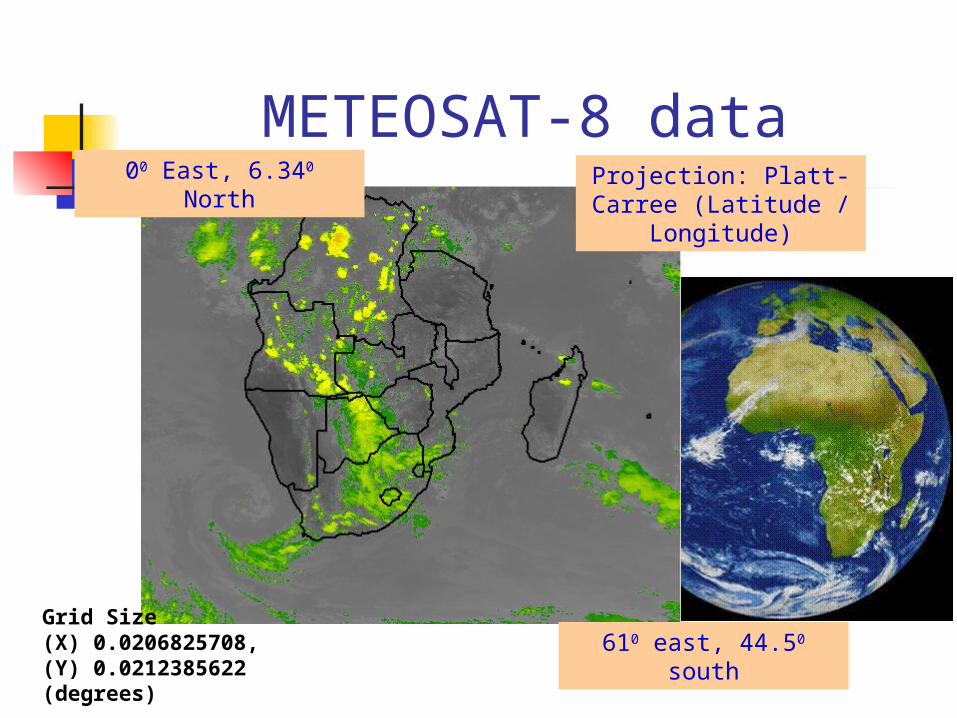
METEOSAT-8 data
Grid Size(X) 0.0206825708, (Y) 0.0212385622 (degrees)
610 east, 44.50 south
00 East, 6.340 North Projection: Platt-Carree (Latitude /
Longitude)
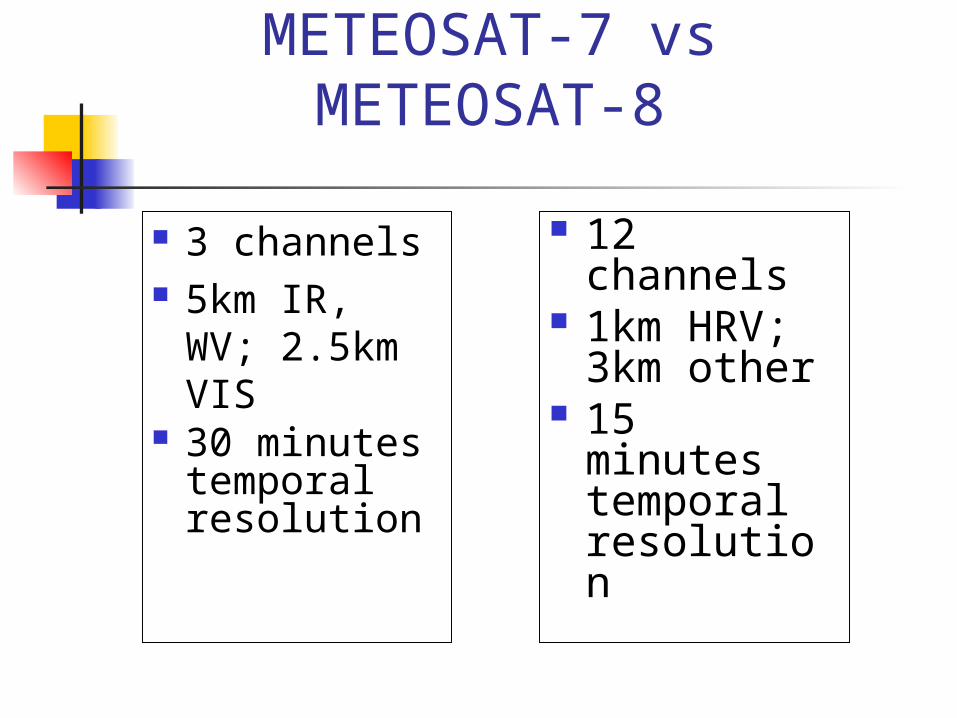
METEOSAT-7 vs METEOSAT-8
3 channels 5km IR, WV;
2.5km VIS 30 minutes
temporal resolution
12 channels 1km HRV;
3km other 15 minutes
temporal resolution
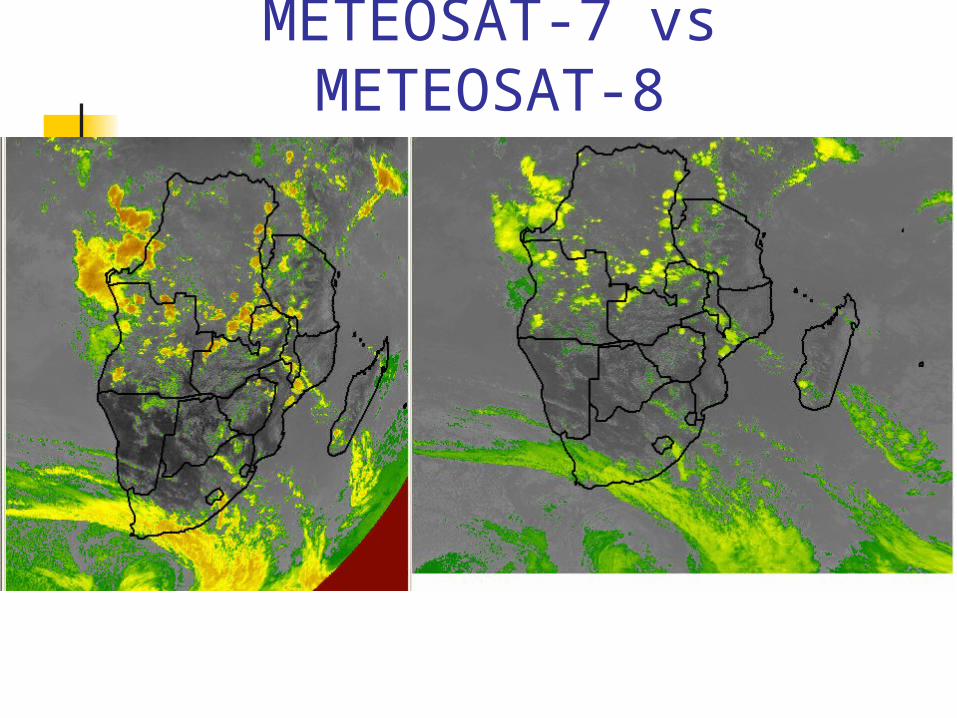
METEOSAT-7 vs METEOSAT-8
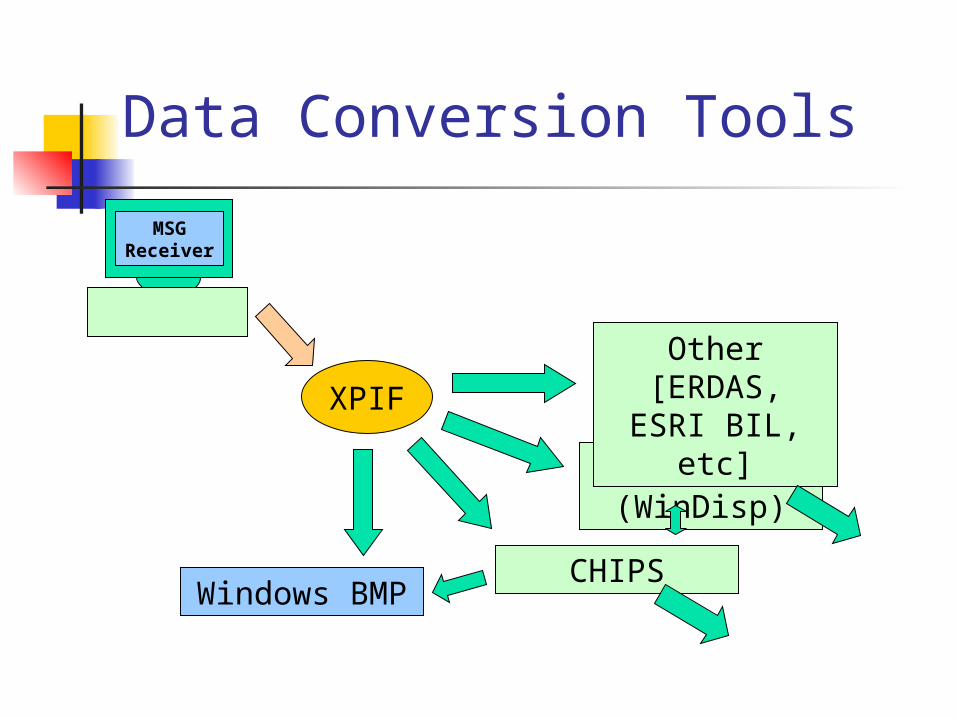
IDA (WinDisp)
Data Conversion Tools
XPIF
CHIPSWindows BMP
Other [ERDAS, ESRI
BIL, etc]
MSG Receive
r

Cold Cloud Duration from TIR data
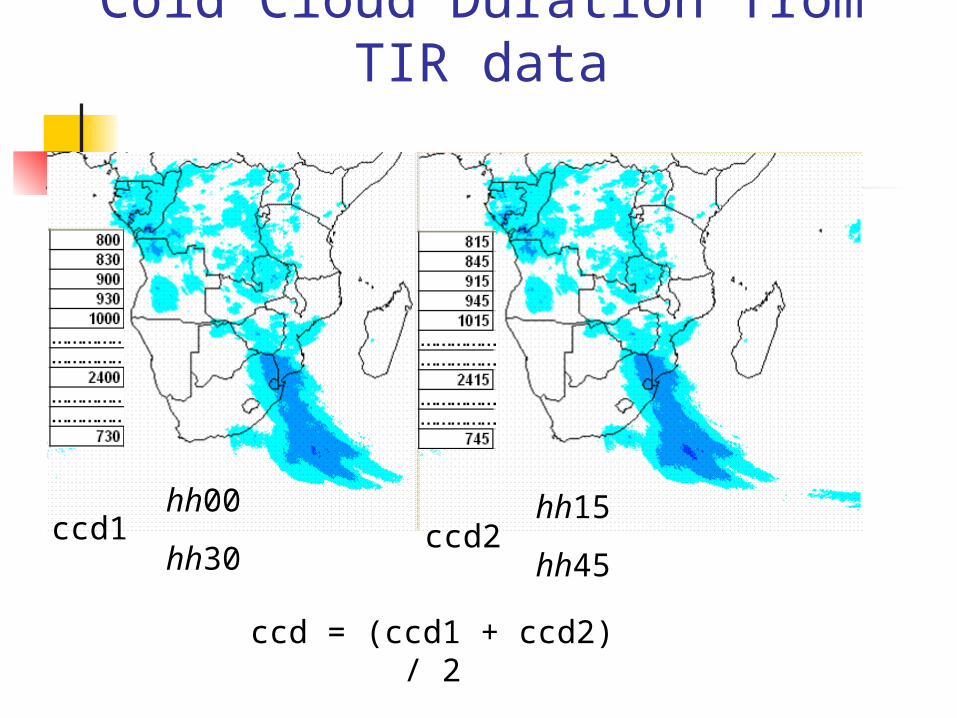
Cold Cloud Duration from TIR data
hh00
hh30
hh15
hh45ccd1 ccd2
ccd = (ccd1 + ccd2) / 2

Cold Cloud Duration from TIR data
October 11-20 2005
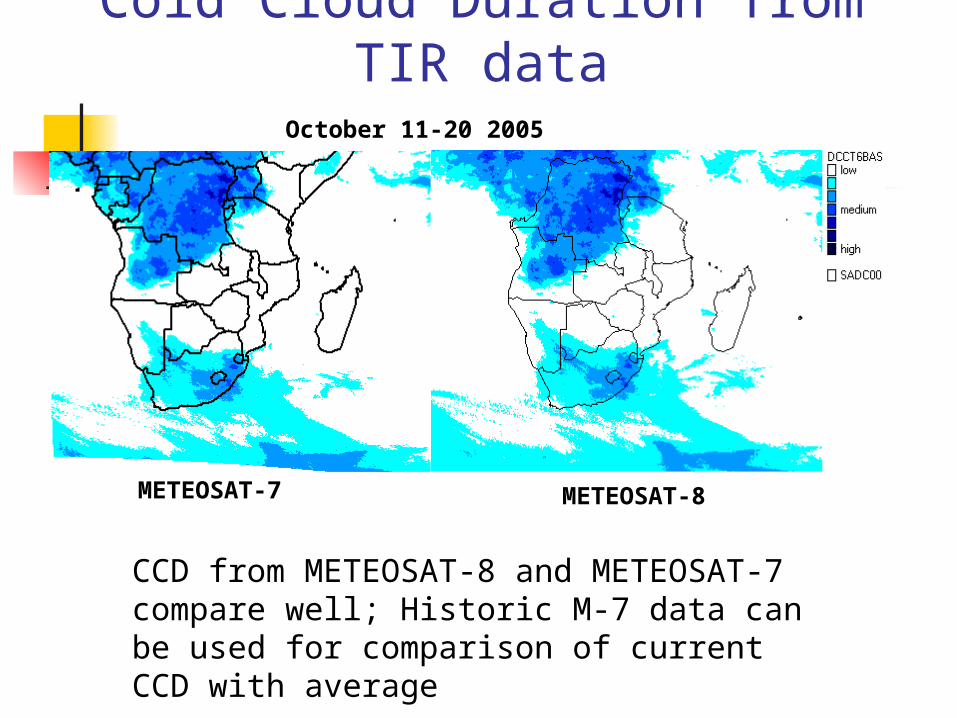
Cold Cloud Duration from TIR data
CCD from METEOSAT-8 and METEOSAT-7 compare well; Historic M-7 data can be used for comparison of current CCD with average
METEOSAT-7
METEOSAT-8
October 11-20 2005

Rainfall Estimation from TIR data
CCD -> RFE Refine using
rain gauge or other data sources
WMO-GTS Radar data
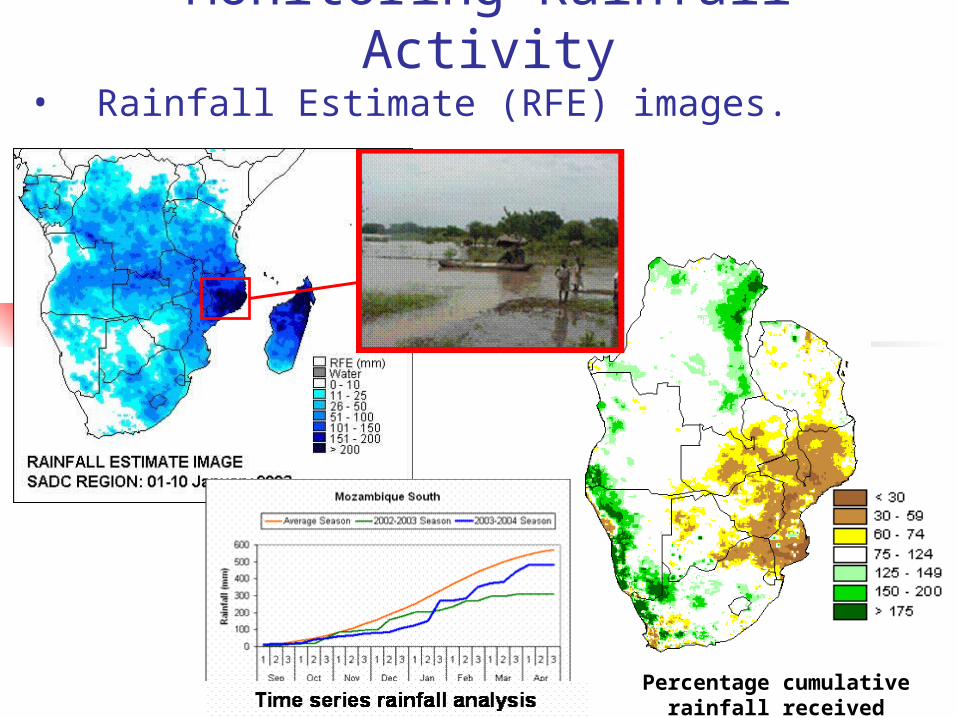
Percentage cumulative rainfall received
Monitoring Rainfall Activity• Rainfall Estimate (RFE) images.
Rainfall Estimates Applications
Water Balance ModelsWater Requirements Satisfaction Index (WRSI)
Standardized Precipitation IndexStatistical method for measuring drought
Hydrological modelling Stream flow model

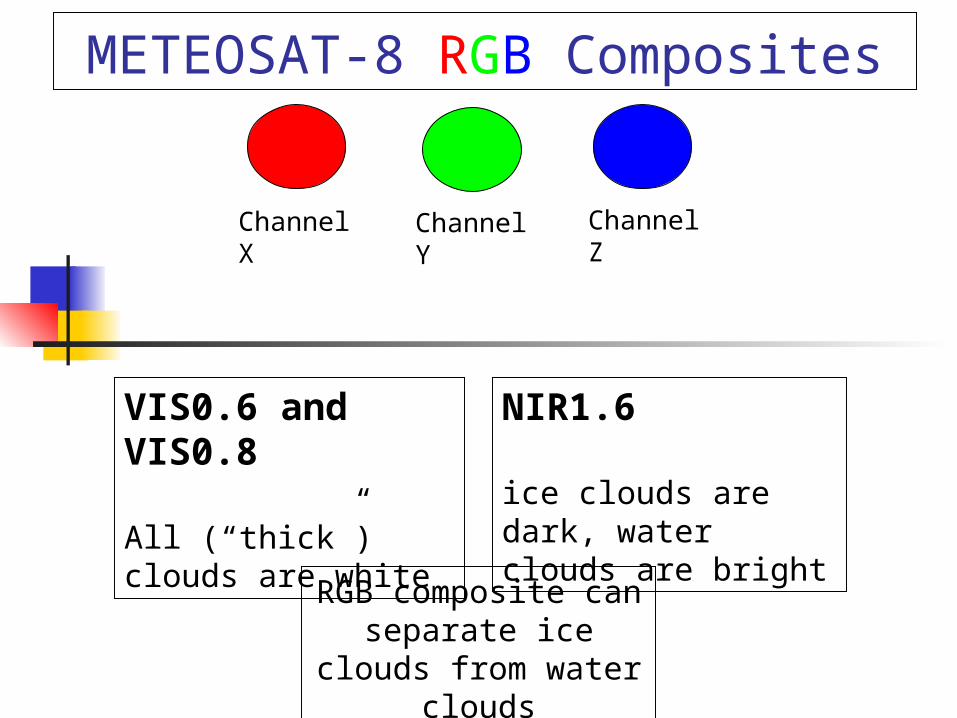
METEOSAT-8 RGB Composites
Channel X
Channel Y
Channel Z
METEOSAT-8 RGB Composites
Channel X
Channel Y
Channel Z
NIR1.6
ice clouds are dark, water clouds are bright
VIS0.6 and VIS0.8
All (“thick”) clouds are white
RGB composite can separate ice clouds from water clouds
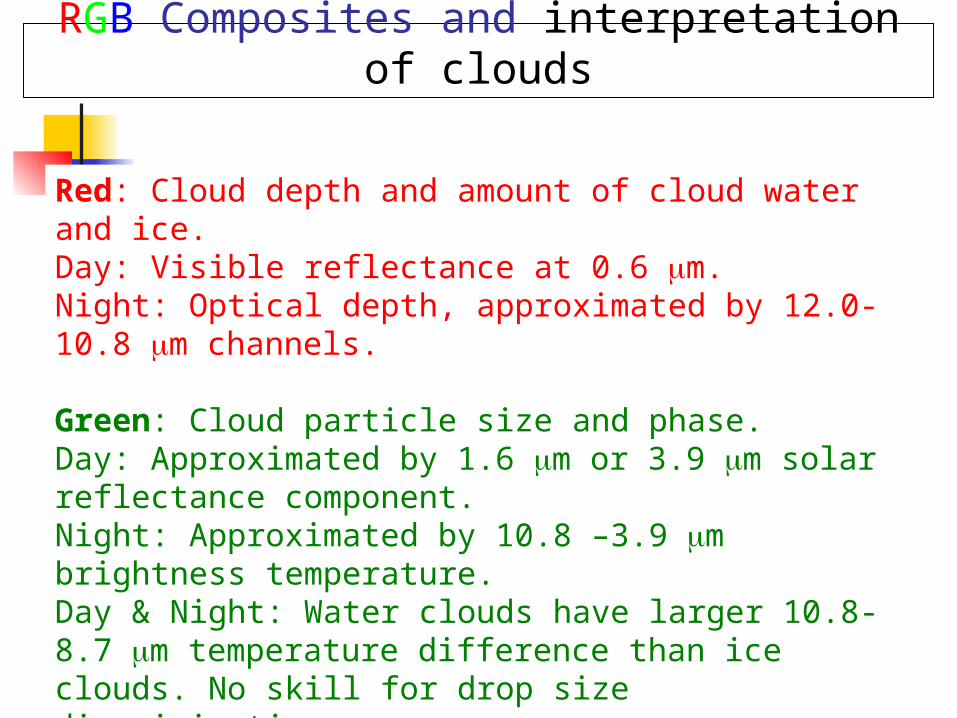
Red: Cloud depth and amount of cloud water and ice.Day: Visible reflectance at 0.6 m. Night: Optical depth, approximated by 12.0-10.8 m channels.
Green: Cloud particle size and phase.Day: Approximated by 1.6 m or 3.9 m solar reflectance component. Night: Approximated by 10.8 –3.9 m brightness temperature.Day & Night: Water clouds have larger 10.8-8.7 m temperature difference than ice clouds. No skill for drop size discrimination.
Blue: Temperature is provided by 10.8 m day and night.
RGB Composites and interpretation of clouds
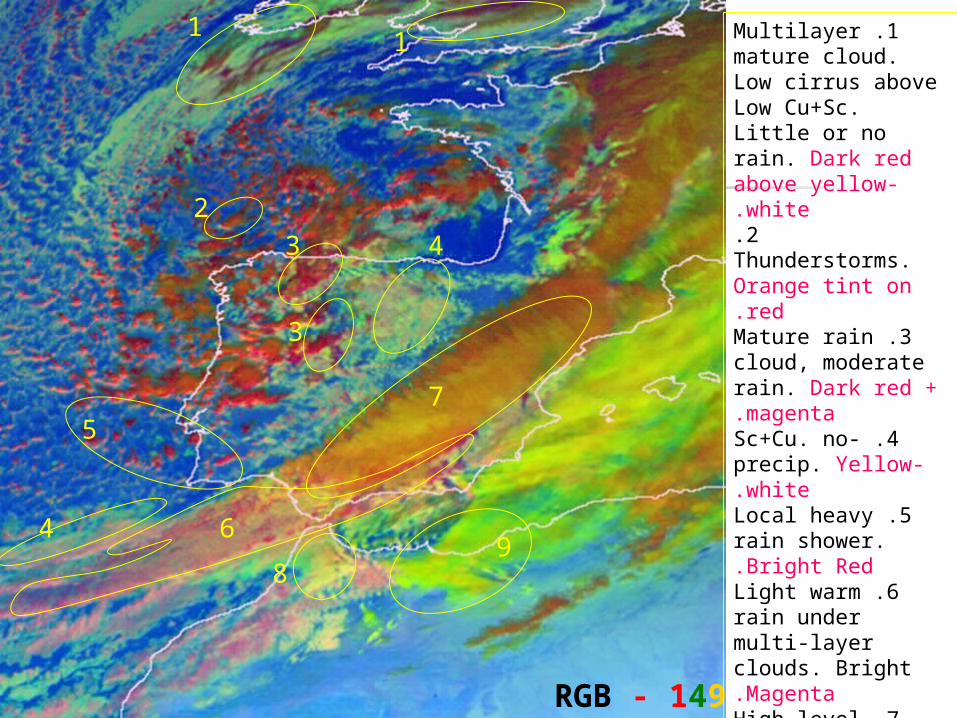
RGB - 149
1 1
3 4
6
7
89
4
5
3
1 .Multilayer mature cloud. Low cirrus above Low Cu+Sc. Little or no rain. Dark red above yellow-white.
2 .Thunderstorms. Orange tint on red.
3 .Mature rain cloud, moderate rain. Dark red + magenta.
4 .Sc+Cu. no-precip. Yellow-white.
5 .Local heavy rain shower. Bright Red.
6 .Light warm rain under multi-layer clouds. Bright Magenta.
7 .High level shield, raining on the east side. Orange riding over red.
8 .Mid-level orographic clouds. No rain. Intense yellos.
9 .Ciro-cumulus. No rain. Dirty yellow.
2

NIR
NIR
Vegetation Monitoring
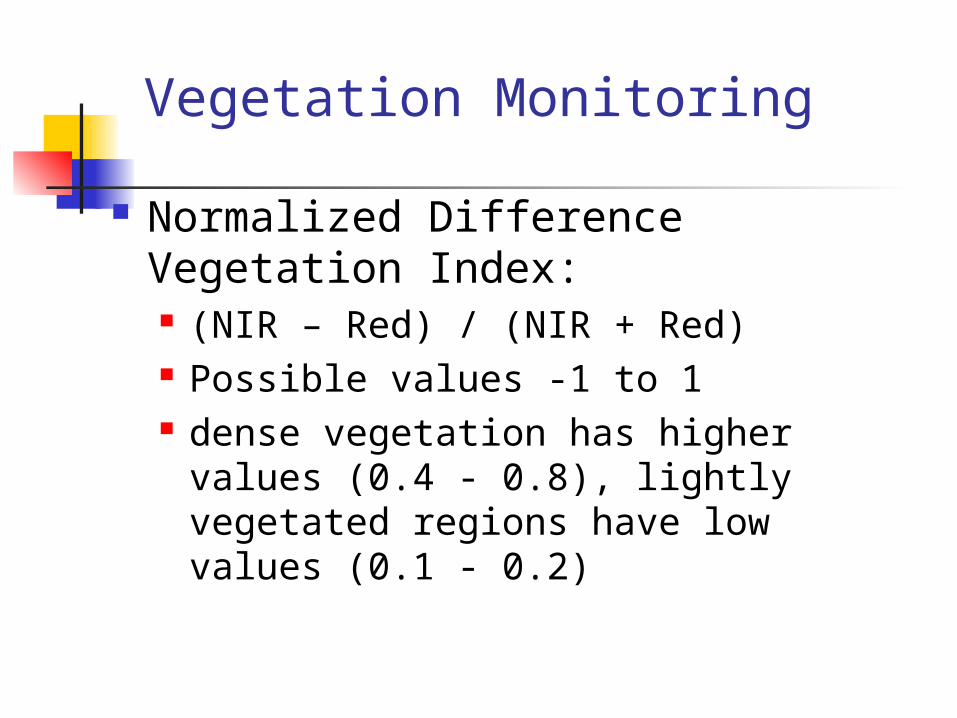
Normalized Difference Vegetation Index: (NIR – Red) / (NIR + Red) Possible values -1 to 1 dense vegetation has higher
values (0.4 - 0.8), lightly vegetated regions have low values (0.1 - 0.2)
Vegetation Monitoring
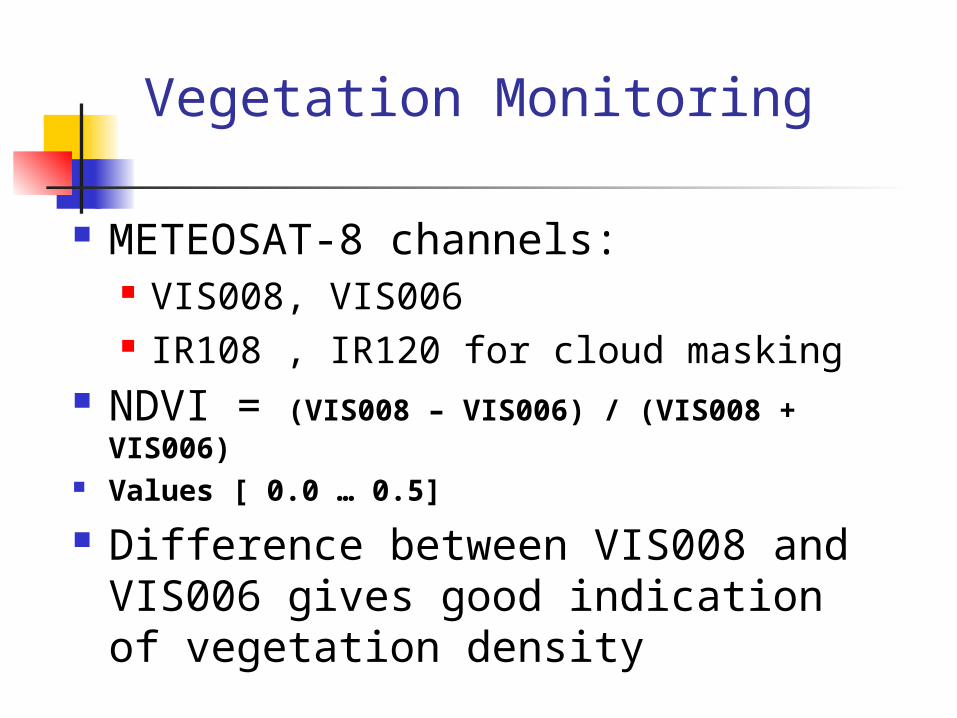
METEOSAT-8 channels: VIS008, VIS006 IR108 , IR120 for cloud masking
NDVI = (VIS008 – VIS006) / (VIS008 + VIS006)
Values [ 0.0 … 0.5]
Difference between VIS008 and VIS006 gives good indication of vegetation density
Vegetation Monitoring
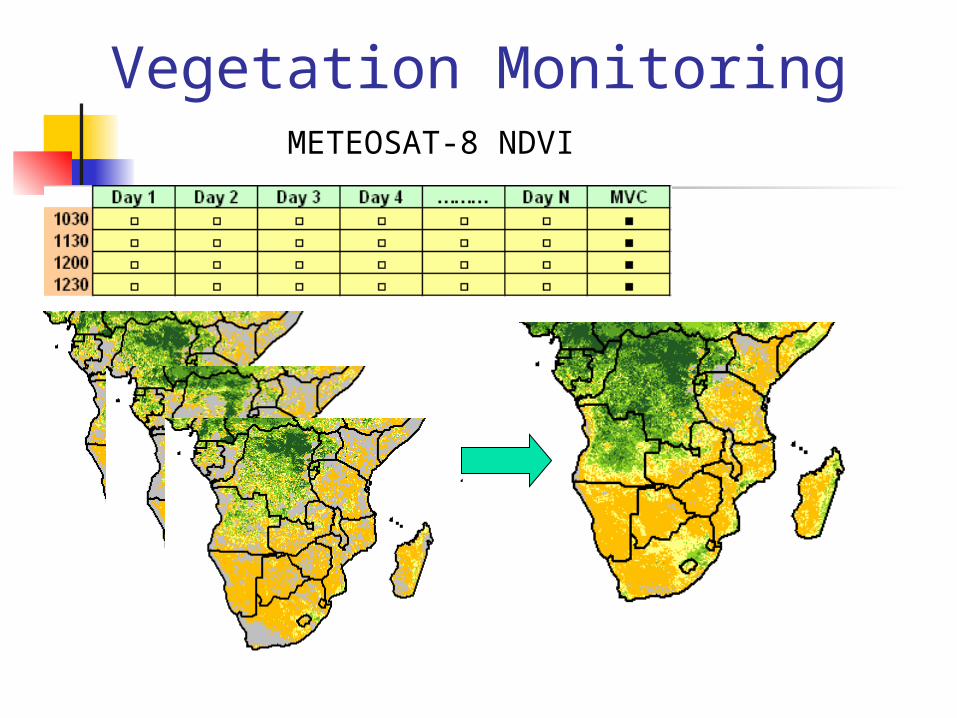
Vegetation MonitoringMETEOSAT-8 NDVI

Vegetation Monitoring
Cloud interference
sometimes limits use of NDVI
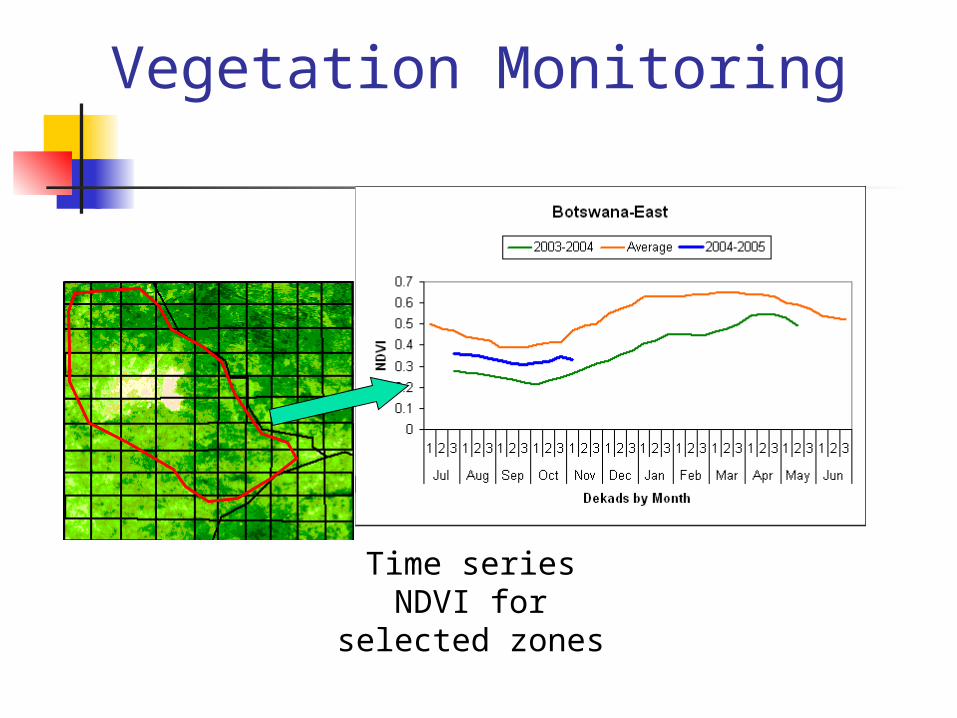
Vegetation Monitoring
Time series NDVI for
selected zones
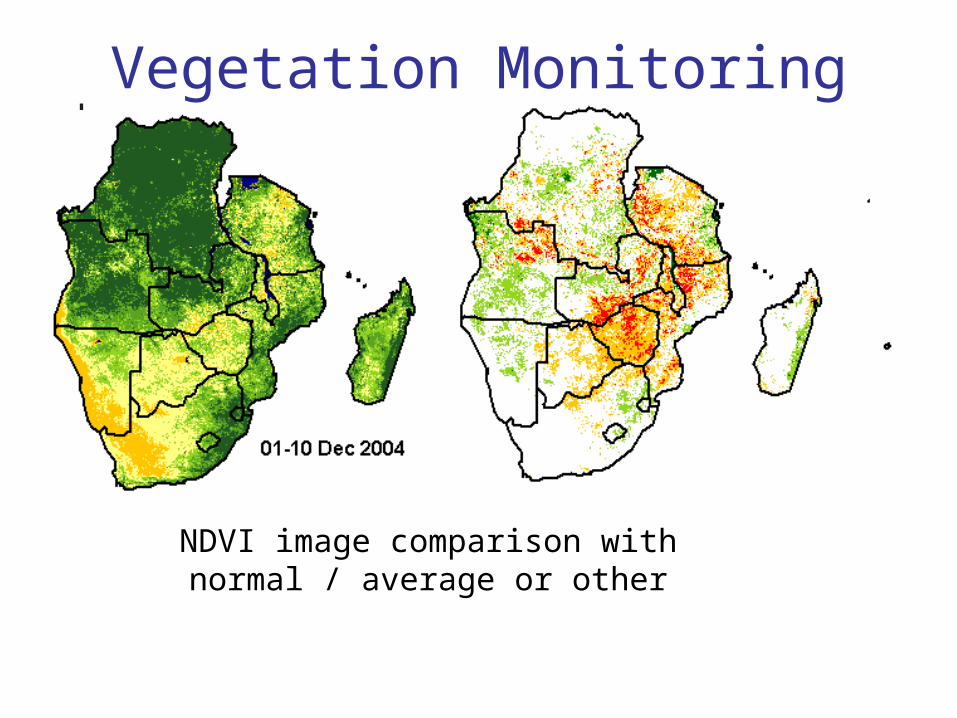
Vegetation Monitoring
NDVI image comparison with normal / average or other

Thermal infrared radiation to monitor surface temperature of the crops can also be used to get information on crop health.
The more transpiration from crops, the cooler the leaves; warmer leaf temperature may suggest water stress.
Vegetation Monitoring
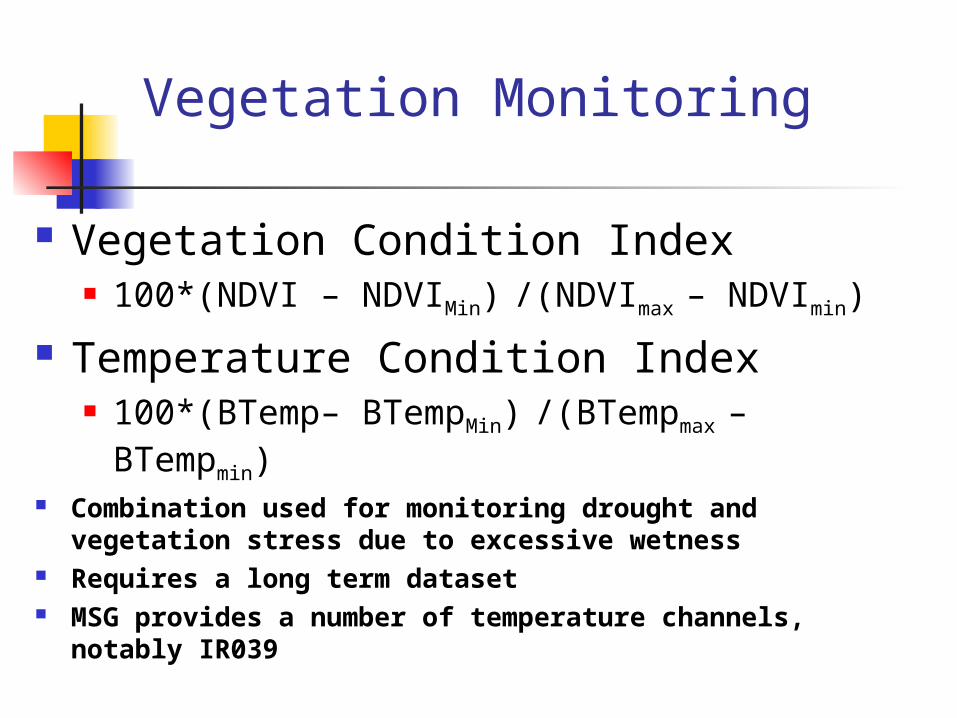
Vegetation Condition Index 100*(NDVI – NDVIMin) /(NDVImax – NDVImin)
Temperature Condition Index 100*(BTemp– BTempMin) /(BTempmax –
BTempmin) Combination used for monitoring drought and
vegetation stress due to excessive wetness Requires a long term dataset MSG provides a number of temperature channels,
notably IR039
Vegetation Monitoring
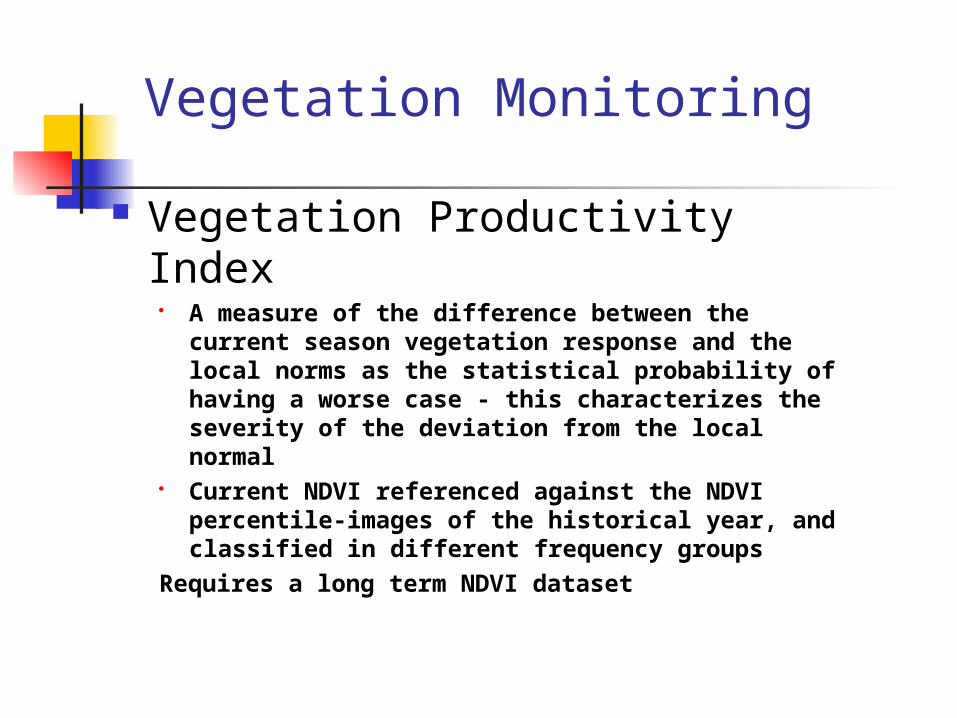
Vegetation Productivity Index A measure of the difference between the
current season vegetation response and the local norms as the statistical probability of having a worse case - this characterizes the severity of the deviation from the local normal
Current NDVI referenced against the NDVI percentile-images of the historical year, and classified in different frequency groups
Requires a long term NDVI dataset
Vegetation Monitoring
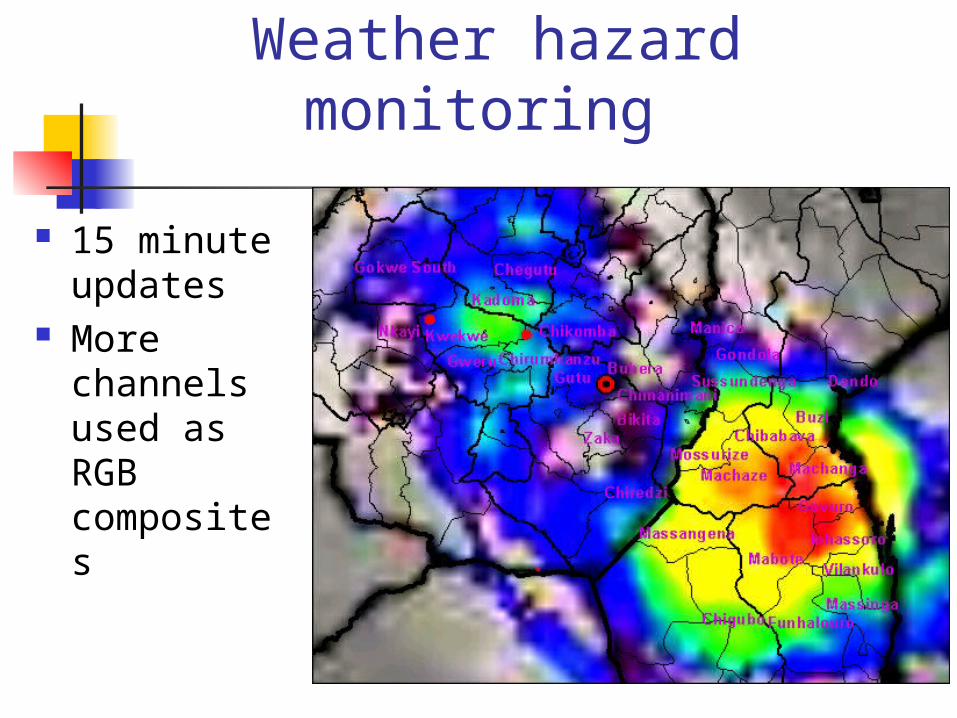
Weather hazard monitoring
15 minute updates
More channels used as RGB composites

Summary
MSG provides more than just a continuation of the service from the MFG
MSG data can be used for applications other than meteorological eg monitoring land surface parameters