Embed Size (px)
Citation preview
Increase Efficiency Using Six Sigma Methodologies
by
Justin E. Faust
A Research Paper Submitted in Partial Fulfillment of the
Requirements for the Master of Science Degree
III
Manufacturing Engineering
Manufacturing Competitiveness Depth Area
The Graduate School
University of Wisconsin-Stout
December, 2009
Author: Faust, Justin E.
The Graduate School University of Wisconsin-Stout
Menomonie, WI
Title: Efficiency Increase Using Six Sigma Statistical Methodologies
Graduate Degree/ Major: MS Manufacturing Engineering
Research Adviser: John Dzissah, Ph.D. CQE
MonthlY ear: December, 2009
Number of Pages: 27
Style Manual Used: American Psychological Association, 5th edition
ABSTRACT
Six Sigma is a business process that eliminates waste or defects by focusing on
outputs that are essential to the customer. Through the use ofDMAIC (Define, Measure,
Analyze, Improve, and Control) organizations can reduce waste in their processes.
Chapter II literature review will shed more light on the Six Sigma methodology
explaining key areas including a historical perspective, what Six Sigma is, and the
process.
The goal of this study is to look at prosperity of implementing Six Sigma at
Company XYZ on a particular product line by capitalizing on the DMAIC process.
Process maps were created to show critical paths; data will was collected and analyzed.
Conclusions and recommendations were drawn from the analyzed data.
11
iii
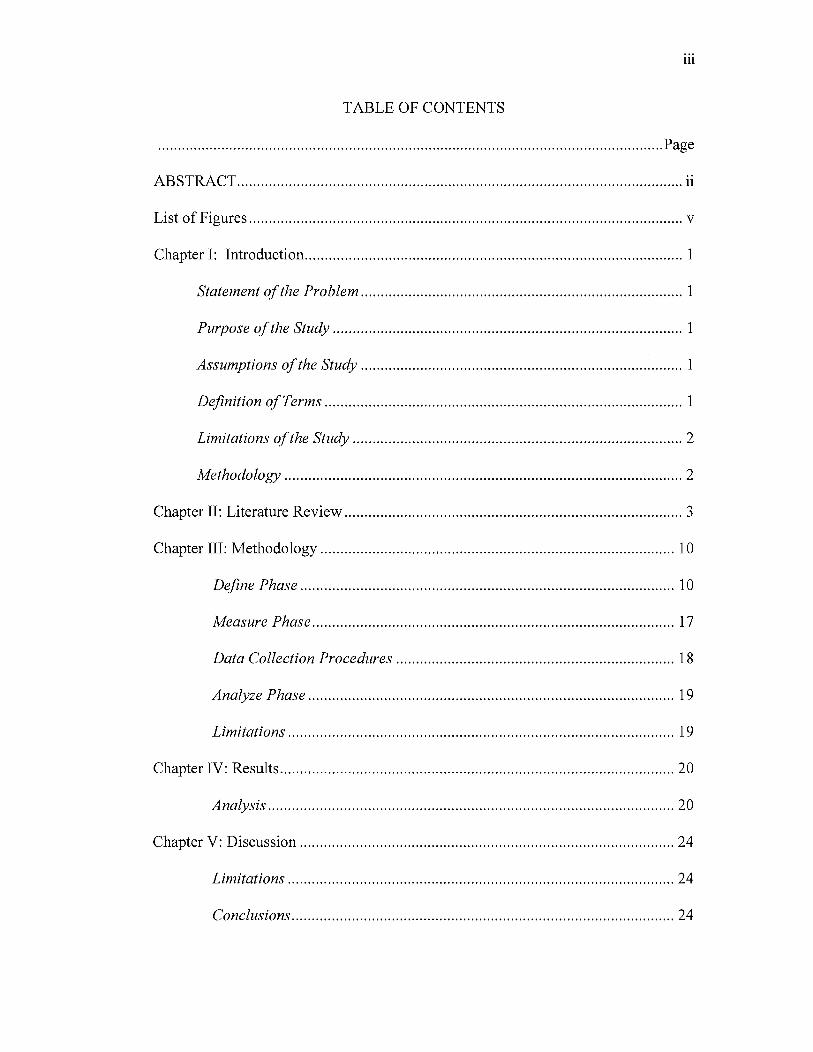
TABLE OF CONTENTS
............................................................................................................................... Page
ABSTRACT ................................................................................................................ ii
List of Figures ............................................................................................................. v
Chapter I: Introduction ............................................................................................... 1
Statement of the Problem ................................................................................. 1
Purpose of the Study ........................................................................................ 1
Assumptions of the Study ................................................................................. 1
Definition of Terms .......................................................................................... 1
Limitations of the Study ................................................................................... 2
Methodology ..... ............................................................................................... 2
Chapter II: Literature Review ..................................................................................... 3
Chapter III: Methodology ......................................................................................... 10
Define Phase .............................................................................................. 10
Measure Phase ........ ................................................................................... 17
Data Collection Procedures ...................................................................... 18
Analyze Phase ............................................................................................ 19
Limitations ................................................................................................. 19
Chapter IV: Results ................................................................................................... 20
Analysis ................ : ..................................................................................... 20
Chapter V: Discussion .............................................................................................. 24
Limitations ................................................................................................. 24
Conclusions ................................................................................................ 24
IV
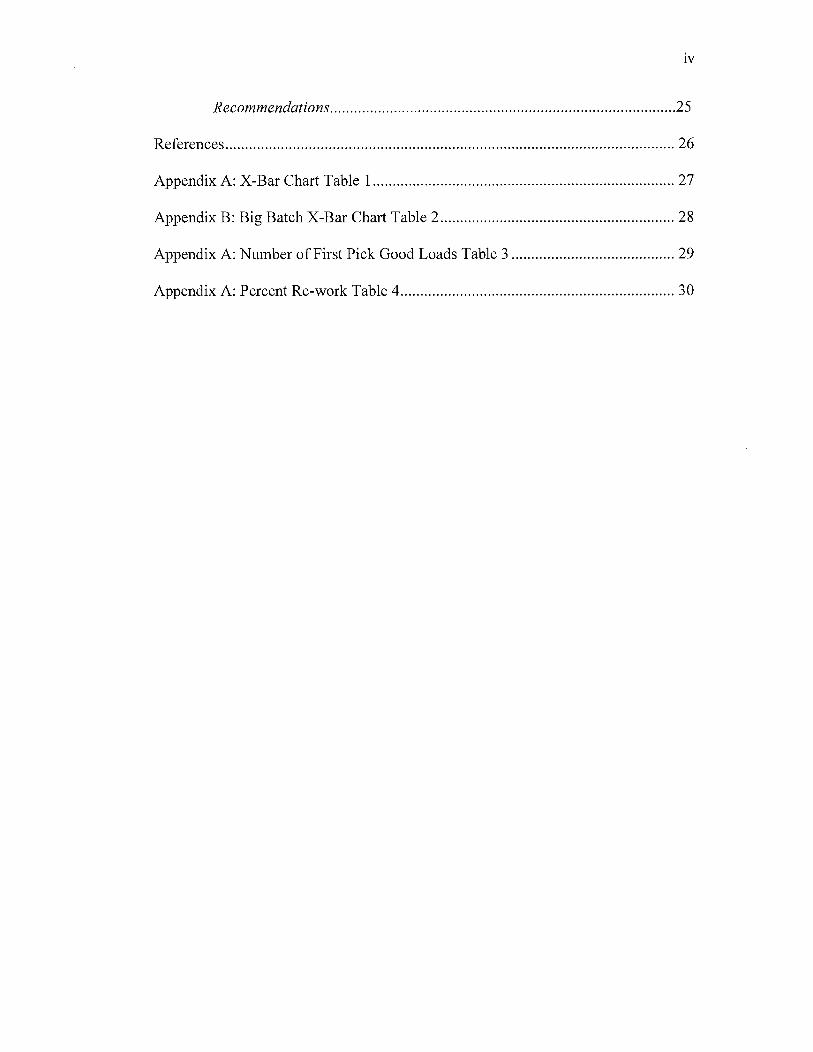
Recommendations ....................................................................................... 25
References ................................................................................................................. 26
Appendix A: X-Bar Chart Table 1 ............................................................................ 27
Appendix B: Big Batch X-Bar Chart Table 2 ........................................................... 28
Appendix A: Number of First Pick Good Loads Table 3 ......................................... 29
Appendix A: Percent Re-work Table 4 ..................................................................... 30
v
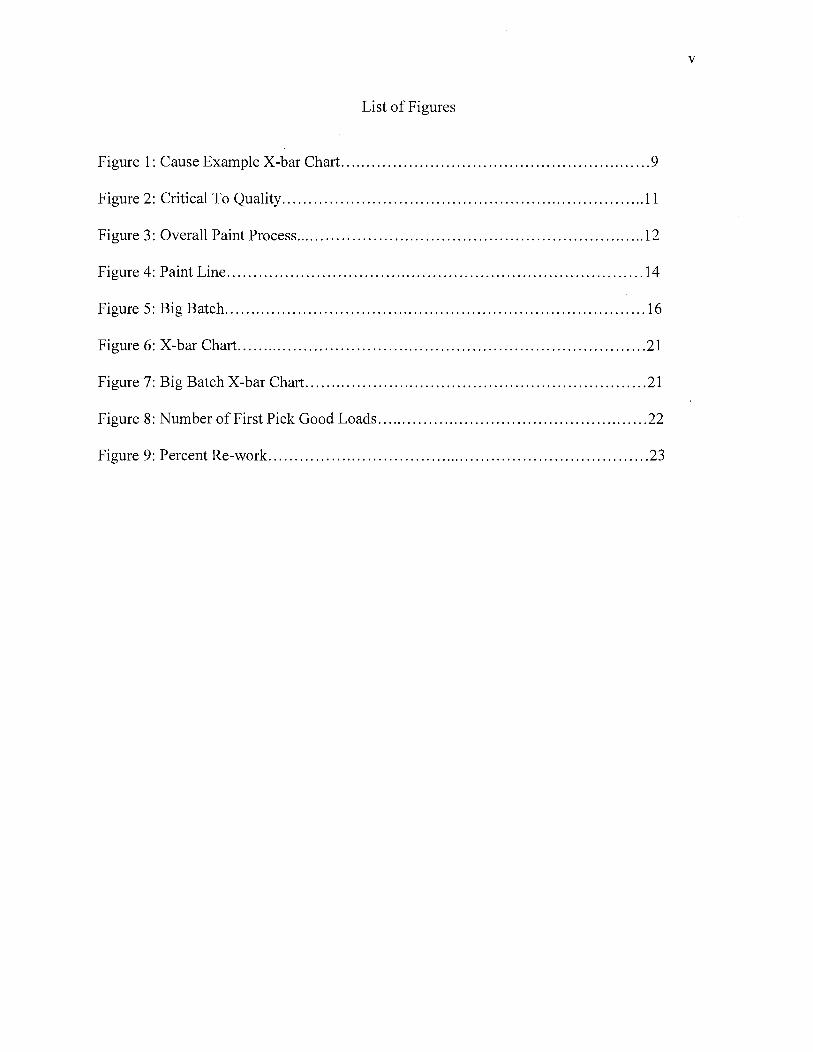
List of Figures
Figure 1: Cause Example X-bar Chart ........................................................... 9
Figure 2: Critical To Quality ..................................................................... 11
Figure 3: Overall Paint Process ................................................................... 12
Figure 4: Paint Line ............................................................................... 14
Figure 5: Big Batch ................................................................................ 16
Figure 6: X-bar Chart .............................................................................. 21
Figure 7: Big Batch X-bar Chart ................................................................. 21
Figure 8: Number of First Pick Good Loads .................................................... 22
Figure 9: Percent Re-work ......................................................................... 23
Chapter I: Introduction
Six Sigma is a quality methodology that increases profits by reducing costs associated
with quality issues and warranty problems. It focuses on reduction in variations of process and
product quality characteristics which are critical to the customer. At Company XYZ, one
warranty claim for defective paint or a bad bearing of products can be tens of thousands of
dollars; and that does not include potential lost business due to bad company reputation.
Statement of the Problem
Company XYZ has implemented lean manufacturing in February 2008. This has resulted
in waste reduction in the company's operations. However, the company would like to improve
customer satisfaction further by reducing in variations of process and product quality
characteristics which are critical to the customer
Purpose of the Study
The purpose of this study is to improve customer satisfaction by using the six sigma
quality improvement methodology to compliment the implemented lean methods to reduce
variations of process and product quality characteristics which are critical to the customer
Assumptions of the Study
This study will focus on the paint system at Company XYZ.
Definition of Terms
Six sigma - a business process by which waste or defects are removed by focusing on
process or outputs important to the customer.
DMAIC - Define, Measure, Analyze, Improve and Control
2
Value stream mapping - a technique used to identify material and information flow for a
product or service to the customer.
Lean manufacturing - business process by which waste is eliminated.
CTQ (Critical to quality) - needs that the customer has in deeming the product quality
KP IV - Key process input variables
KPOV - Key process output variables
Standard Deviation - Shows how much variation exists from the mean
ASTM - American Society of Testing and Materials is an international organization that
develops and publishes testing standards
Limitations of the Study
This study will use the DMAIC process; due to the scope of the project, only define,
measure, and analyze phases will be used. Improve and control phases will be up to Company
XYZ. Occasionally, special coatings are sent to other companies for paint; these products will
be omitted from this study because we do not have control over their processes. In addition,
customer is also aware that there is a longer lead time on the product if special paint is chosen.
Methodology
This study will focus on the paint process. The processes will be mapped and critical to
quality processes will be identified for improvement. Aspects such as first pass yield, scrap costs
and process wait time will also be considered and specific periods of time will be chosen to
collect data for further analysis.
3
Chapter II: Literature Review
Companies tum to improving quality to increase profits and improve company
perception. Warranty and scrap can be easily calculated in most production operations.
However, the cost of quality can be difficult to calculate due to external failure costs. Customers
tend to shy away from companies with bad reputations due to poor quality records. The
proceeding will show Six Sigma quality methodologies are used to improve process outputs
yielding reduced warranty work and improved customer satisfaction.
Carl Frederick Gauss (1777-1855) introduced the concept of the normal curve which is
the beginning of the mathematics behind Six Sigma. Six Sigma as a measurement standard in
product variation is traced back to the 1920's when Walter Shewhart demonstrated that three
sigma from the mean is the point where a process requires correction (Abramowich 2005).
Walter Shewhart also developed the Shewhart Learning and Improvement cycles which
combines creative management thinking with statistical analysis. The Shewhart cycle includes a
continuous process of Plan, Do, Study, and Act or PDSA. Other measurement standards
(Process capability ratio, Zero Defects, etc.) were later introduced, but credit for coining the term
"Six Sigma" is given to Bill Smith a Motorola engineer (Summers 2006). Six Sigma is federally
licensed by Motorola (Przekop 2006).
In the early and mid-1980s, Motorola engineers decided that the traditional quality levels
for measuring defects in thousands of opportunities didn't provide enough information. A new
standard of measuring the defects per million opportunities was developed and thus created the
methodology and needed cultural change associated with it. The Motorola research provided
powerful bottom line results in their organization; greater than $16 Billion in savings was
documented as a result of the efforts.

4
Industries around the world have adopted Six Sigma as a way of doing business. This is a
direct result of many of America's leaders openly praising the benefits of Six Sigma such as
Larry Bossidy of Allied Signal (now Honeywell), and Jack Welch of General Electric Company.
Honeywell International has been utilizing Six Sigma from since the early 1990's. The
Six Sigma program was center around manufacturing and operational productivity gains. The
Six Sigma productivity gains were so successful that Honeywell was the benchmark for
productivity gains. Honeywell's Six Sigma model had been modified and expanded to be used
for the market place and business. The new Honeywell Six Sigma model is called the Six Sigma
Plus. The Six Sigma Plus model concentrates on sales, marketing, product development,
business, and strategy development processes. The emanation of Six Sigma Plus uses the
traditional DMAIC mechanism to compose a road map for productivity gains (Abramowich
2005).
An interesting aspect of Six Sigma is the resistance from individuals. Six Sigma is not
used by Motorola today, but on the contrary, Motorola may not be in business today without Six
Sigma. Motorola started Six Sigma, others have improved it. General Electric actually boasted
billions from using Six Sigma (Abramowich 2005).
Customer focus and key business initiatives are two focus features that distinguish Six
Sigma from quality models such as Quality Circles and Total Quality Management (Abramowich
2005). A key principle in Six Sigma is finding the root cause of problems requires a look at
processes further upstream to find the root cause. Dealing with the problem is far less effective
than dealing with the inputs and the outputs of the root cause of the problem (Abramowich
2005). One of the formidable pioneers in Six Sigma, Forrest W. Breyfogle III (Breyfogle 2003)
talks about S4/IEE which is Smarter Six Sigma Solutions with Integrated Enterprise Excellence.
5
This S4/IEE approach goes beyond traditional Six Sigma and integrates enterprise measures and
improvement methodologies such as Lean and theory of constraints. S4/IEE serves an example
of how Six Sigma is evolving and improving from its inception by Motorola in the 1980's.
The concept of input! output can be demonstrated in everyday devices such as a light
switch. Flipping the switch turns the light on which is an archetype of an output also called a
KPOV (Key Process Output Variable), CTQ (Critical To Quality), or the Y's in the process
(Breyfogle 2003). For example, when a light switch is switched on the output is light; looking
at the light switch from a Six Sigma standpoint, the KPOV is switching the light on which is
made up of KPIV s (Key Process Input Variables) like the striker plate making contact with the
power. The power and striker plate are KPIV s that effects the downstream output by which
trying to understand the root cause of the output. Along with finding the root cause of problems
is a development of measures based off the outputs or the customer wants; these CTQs will be
talked about later in the chapter under the define portion of the DMAIC process. The DMAIC is
a cornerstone process that Six Sigma uses in providing the CTQs to the customer; the DMAIC
process is also talked about in the later part of this chapter. More detail quality measures and
analysis techniques will further explain the concepts and idea around Six Sigma and ultimately
providing the customer their needs or CTQs.
It is important to create a management framework to support the implementation of Six
Sigma. This framework guides organizational decisions regardless of the scope or action and it
is step one for implementation and assist management to believe in the successes and benefits of
Six Sigma (Przekop 2006). The management framework should include operational concepts,
values, and norms for day to day operations. It also includes the vision for the organization, how
this is to be realized and management style needed for successful Six Sigma implementation
(Przekop 2006).
6
Numerous leading companies such as Home Depot and 3M have adopted Six Sigma for
advantages which include increased profits and customer satisfaction (Prezekop 2006). The six
sigma is a model that sets a customer focused performance goal for the entire company.
Lean manufacturing was predominantly derived from Toyota Production System. Lean
manufacturing simply attempts to reduce waste. Lean focuses on reducing waste which
translates to a more productive system. Six Sigma maps the process and reduces defects
(Womack and others 1990). Six Sigma and lean manufacturing complement each other. Six
Sigma is focused on variability reduction while lean focuses on reduction in waste.
Define, measure, analyze, improve and control (DMAIC) is the process to follow when
doing a Six Sigma project (Breyfogle 2003, Steven 2009). The Six Sigma DMAIC process is not
very different from any other problem solving technique. The DMAIC process is designed to get
to the root cause of the problem and not just provide a temporary fix. The proceeding sections
will explain what DMAIC is and how they are used in a Six Sigma project.
In the define phase the problem is defined. Then the processes that can create issues for
the customer if they are not correct such as paint or a loose bolt and critical to quality (CTQ) for
the customer are identified. The product flow is then mapped and the steps critical to the
customer are identified (Eckes 2005). A process flow map is simple chart that uses objects and
arrows to show an overview of key process (Abramowich 2005). This map shows where
potential problems are this enables the team to focus on the root cause of those potential
problems. The process map also allows the Six Sigma team to find the key process input
variables (KPIV) and the key process output variables (KPOV). KPIV are those input steps,
7
processes or actions that provide the KPOV. The KPOV are those outputs that are valued by the
customer (Breyfogle 2003
In the measure phase, the identified CTQs are measured. Measuring or tracking is the key
point in this section. The DMAIC process measures what is important to the customer (Przekop
2006). The define phase segregated the KPIV and KPOV from the process map, so measuring is
based on these. KPIV and KPOV were selected because they were most critical to the customer.
The data gathered is organized for analysis.
Analyze phase involves statistical analysis of the data collected in measure phase. The
data should be graphed, charted and descriptive statistics obtained to draw conclusions
(Breyfoggle 2003). The statistics of interest here are the mean and standard deviation.
The mean is the average in a population. This is calculated by simply adding the data set
up and dividing by the number in that particular data set. The mean shows where most of the
data points are lying (Voelker and Orton 1993). Any process goal is for the mean of the process
CTQ to meet nominal value of the quality characteristics of interest to the customer.
The standard deviation is a well understood mathematical function that gives another
perspective ofthe data set. Mathematically, the standard deviation is the square root of the
variance which is a measure of variability or dispersion of a data set. Simply put, standard
deviation shows how much variation exists from the population mean or average. Ideally,
minimal process variation would exist; graphically data points would lie close to the mean
showing a small standard deviation. An important piece of standard deviation is the normal
curve also known as a Gaussian distribution. The normal curve describes data that clusters about
the mean which is associated to the probability density function. Graphically, the normal curve
looks like a bell shaped cure peaking around the mean. A large standard deviation shows that the
8
data is spread out with respect to the mean, while a smaller standard deviation shows the data'
points are closer to the mean (Clark 1992). Sigma (cr) is commonly used as the character used to
represent the standard deviation. In the Six Sigma methodology, six standard deviations from
the mean is the goal which equates to a large percentage of collected data lying plus or minus the
mean. Another way to think of this is the upper and lower control limits are within six standard
deviations of the mean which equates to 95% of the good parts lying within those limits and one
standard deviation plus or minus equals 68.2% of the data. Data close to the mean signifies that
there is minimal process deviation or processes that are out of control. Mathematically, six cr
equates to 3.4 defects per million (Breyfogle 2003). Fifteen sigma, for example, signifies a large
variability in the data which is not advantageous for tight process control.
The upper and lower control limits are used to see how close the data tracks to the
statistical mean. The upper and lower control limits are calculated and are mathematically +/- 3
standard deviations about the mean. Control limits that are very close to the mean are good
because 99.73% of the data is then close to the mean, this equates to good process control
assuming the mean is at a desirable level.
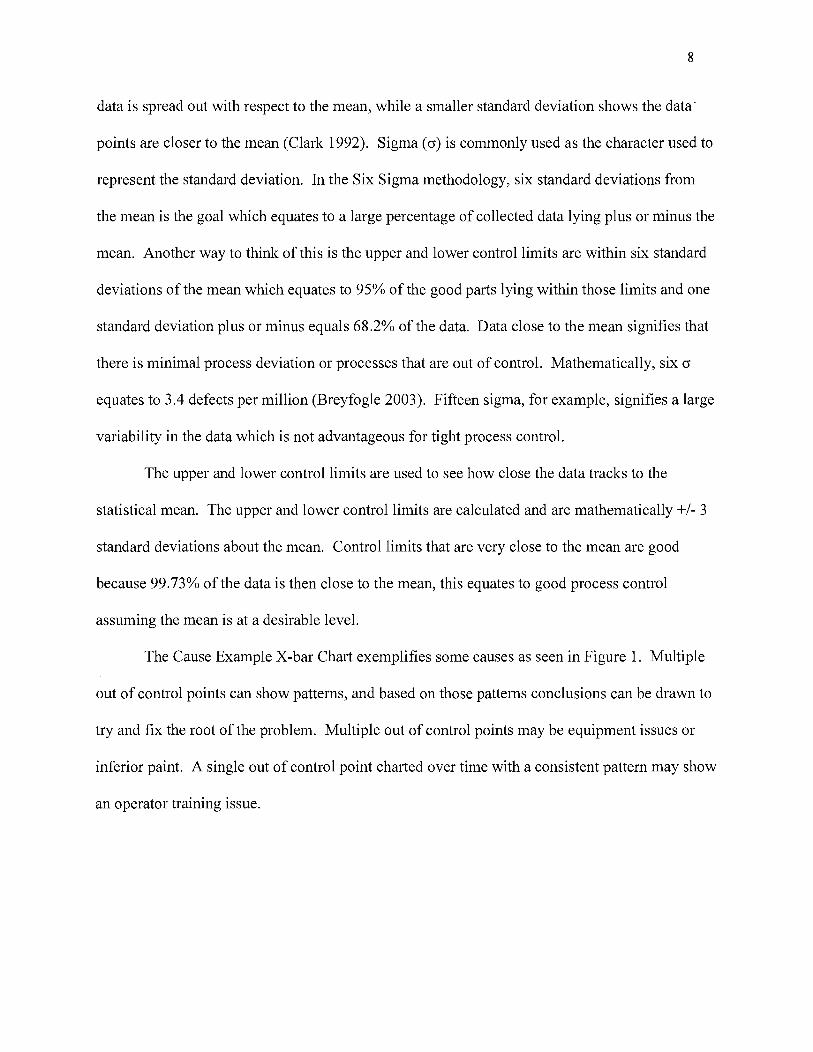
The Cause Example X-bar Chati exemplifies some causes as seen in Figure 1. Multiple
out of control points can show patterns, and based on those patterns conclusions can be drawn to
try and fix the root of the problem. Multiple out of control points may be equipment issues or
inferior paint. A single out of control point chatied over time with a consistent pattern may show
an operator training issue.
9
Cause Example X-bar Chart __ A>.erages ____ Lower contro l limit
Upper control limit
Equipment l - Centerline
• r--I Issli e
••• ~ I ~ l t--~ O (lcl'lilOr
• I~ I X Issue
~ 3.' V ".. / ~ ... t t ~
'" "'" I ~ 3 . ~ .... ... + I .... .... >
" I-« + I 2 ~ ,
" -- + T , + I I
05
I 0 , 2 3 • , • 7 • , 'D " U n ~
Sample number
Figure I : Cause Example X-Bar Chart
Improve what was targeted from the previous steps of defining, analyzing, and
measuring. Th is is a fai rl y straight forward step in the process; an action plan shou ld be created
to fix the targeted area or areas. Improving an identified problem is not always the correct
approach (Pande2002). It is important to look at the root of the problem and to continue th is
improvement which leads to the control portion of the DMAIC process.
It is essential to maintain processes that were augmented. The cont rol plan is in the fo rm
of a document to ensure that the processes meet or exceed the customer's expectat ions (Breyfogle
2003).
The DMAIC is a systematic process that identifies, analyzes, improves and contro ls
processes to meet the customer' s needs. It is important to fol low the process, identify the root
cause of the problem and correct it.
10
Chapter III: Methodology
This chapter focuses on how the Six Sigma process was implemented to determine
whether it will help customer satisfaction. The metric for customer satisfaction will be value
added improvements that will affect the customer's product. The customer's needs are the
primary focus for the Six Sigma process. The following section addresses define, measure, and
analyze phase of the DMAIC process.
Define Phase
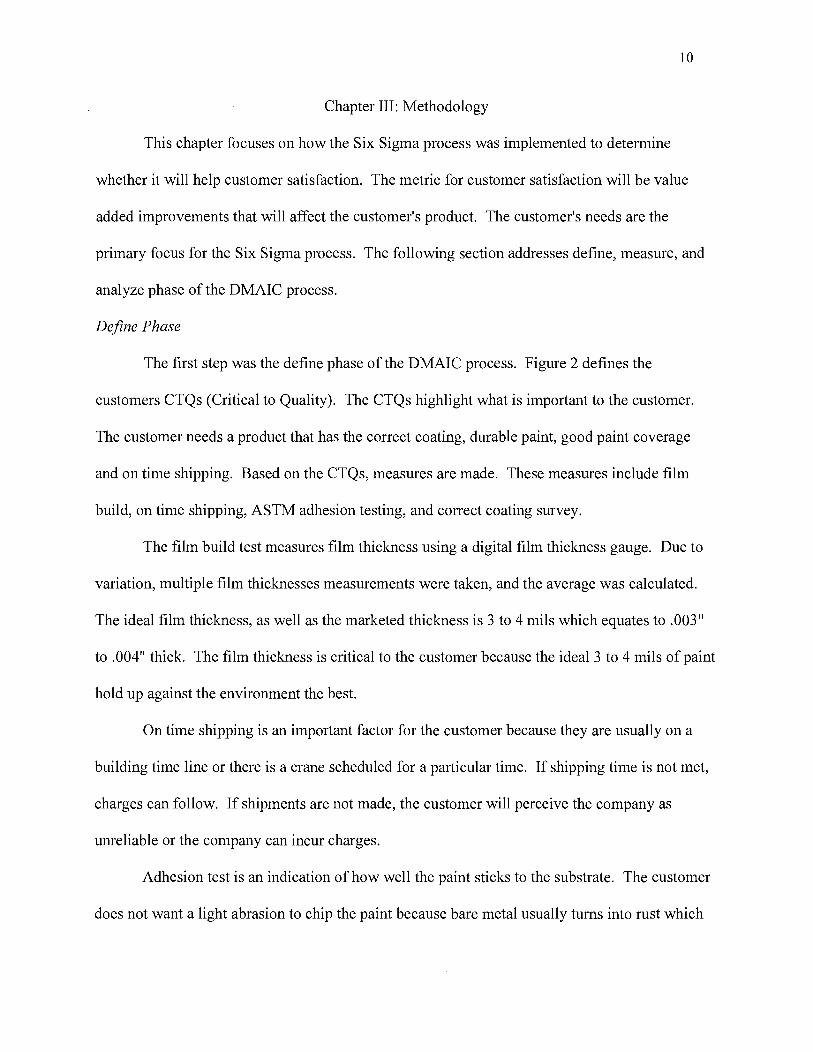
The first step was the define phase of the DMAIC process. Figure 2 defines the
customers CTQs (Critical to Quality). The CTQs highlight what is important to the customer.
The customer needs a product that has the correct coating, durable paint, good paint coverage
and on time shipping. Based on the CTQs, measures are made. These measures include film
build, on time shipping, ASTM adhesion testing, and correct coating survey.
The film build test measures film thickness using a digital film thickness gauge. Due to
variation, multiple film thicknesses measurements were taken, and the average was calculated.
The ideal film thickness, as well as the marketed thickness is 3 to 4 mils which equates to .003"
to .004" thick. The film thickness is critical to the customer because the ideal 3 to 4 mils of paint
hold up against the environment the best.
On time shipping is an important factor for the customer because they are usually on a
building time line or there is a crane scheduled for a particular time. If shipping time is not met,
charges can follow. If shipments are not made, the customer will perceive the company as
unreliable or the company can incur charges.
Adhesion test is an indication of how well the paint sticks to the substrate. The customer
does not want a light abrasion to chip the paint because bare metal usually turns into rust which
11
can be very unsightly and eventually create rust through failure. The cure oven on the paint line
as well as big batch cures parts all the same, based on time and temperature regardless of part
size and geometry. This generalized curing may cause issues for the customer, soit is important
to measure adhesion.
The correct coating is important because many of these systems are placed in very harsh
environments such as near a salty body of water or exhausting acidic chemicals. Many
customers pay a premium for a particular coating and architects may have criteria of a certain
color, so the unit blends in to the environment and does not look unsightly.
CUSTOMER NEEDS
CRITICAL TO QUALITY
CORRECT PAINT
DURABLE PAINT
ON TIME
GOOD COVERAGE
Figure 2: Critical To Quality
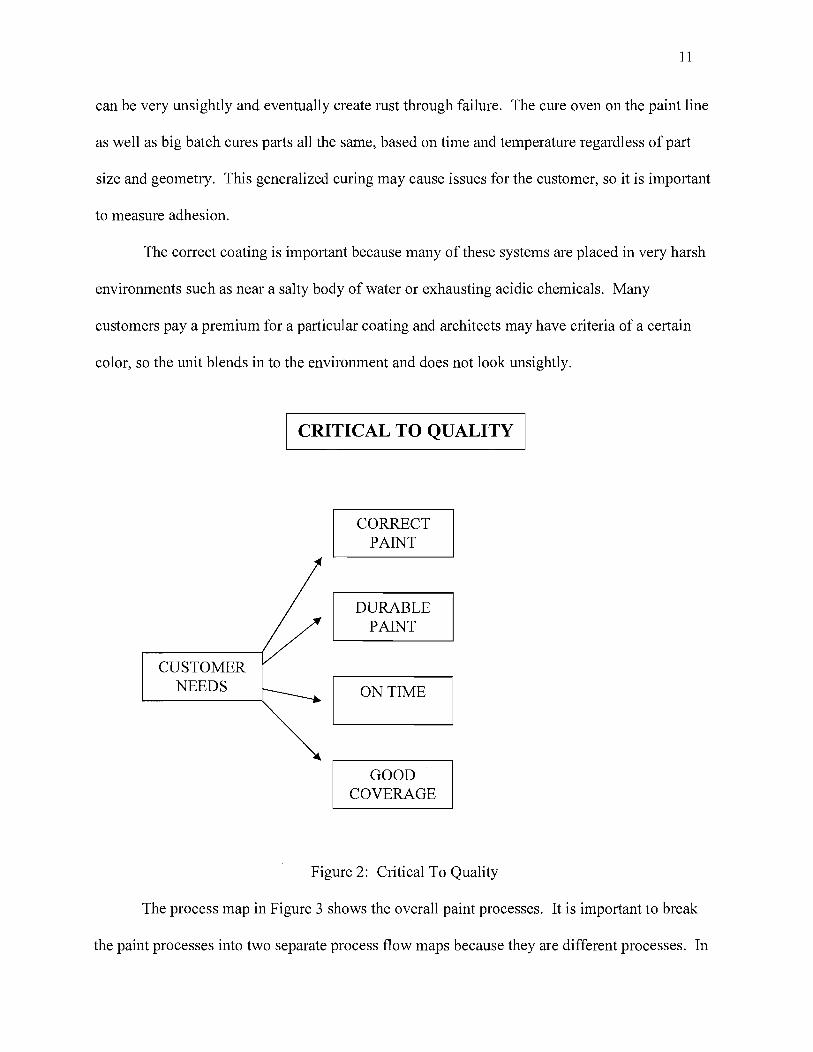
The process map in Figure 3 shows the overall paint processes. It is important to break
the paint processes into two separate process flow maps because they are different processes. In
12
doing this, better quality will be attained for the customer because individual processes can be
measure and tracked accordingly. The overall paint process starts with gathering and sorting
parts. Depending on part size and complexity of geometry, parts will flow through either big
batch or the paint line. The processes then come together during the last step of gathering the
kits.
BIG BATCH
OVERALL PAINT PROCESS
Figure 3: Overall Paint Process
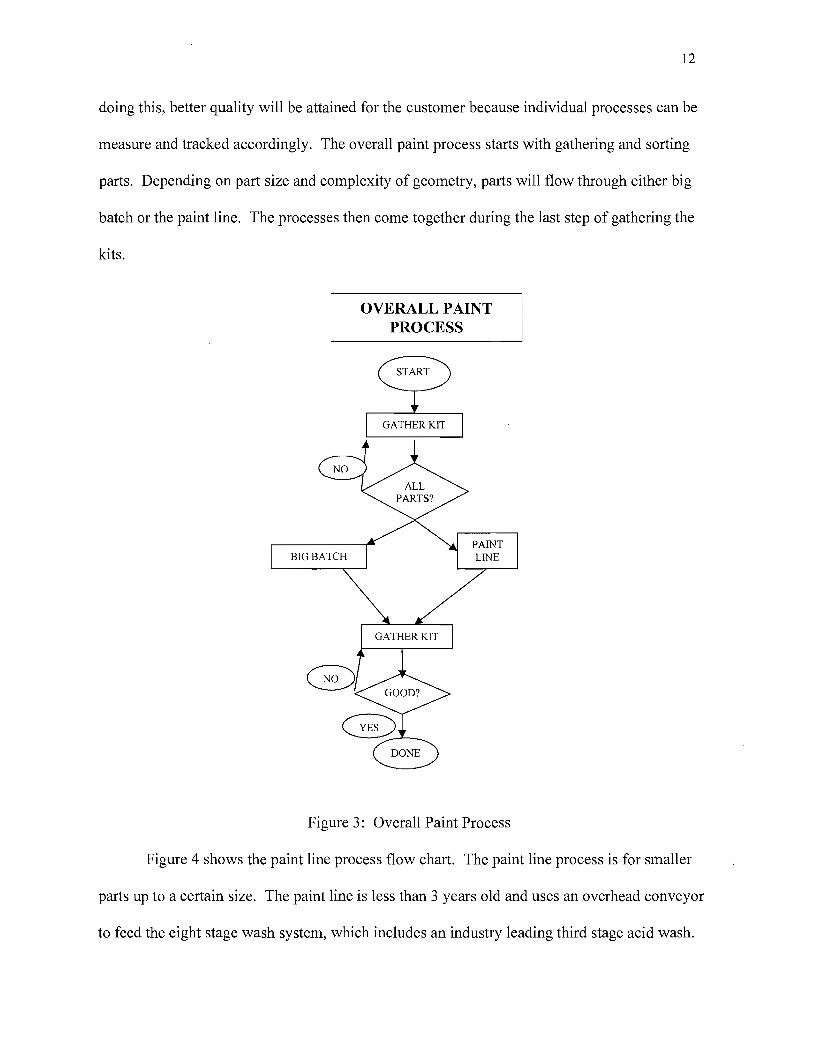
Figure 4 shows the paint line process flow chart. The paint line process is for smaller
parts up to a certain size. The paint line is less than 3 years old and uses an overhead conveyor
to feed the eight stage wash system, which includes an industry leading third stage acid wash.
13
The parts are dried and fed to the automatic powder paint curtain. The overall part geometry is
read using an automatic eye reader to choreograph the paint guns that make up the powder paint
cUliain. The powder paint is electro statically charged and the conveyor is grounded so the
powder paint sticks to the parts as well as reduces over spray. Due to the nature of the automatic
paint curtain, a part with internal geometry does not get coated. Two painters are stationed just
after the powder paint curtain to touch up any missed geometry and coat the inside if necessary.
The parts are moved along to the cure oven for a specific period of time. All the parts receive
the same time and temperature conditions in the cure oven regardless of size and geometry. The
proceeding steps are cool off and unload parts from the conveyor.
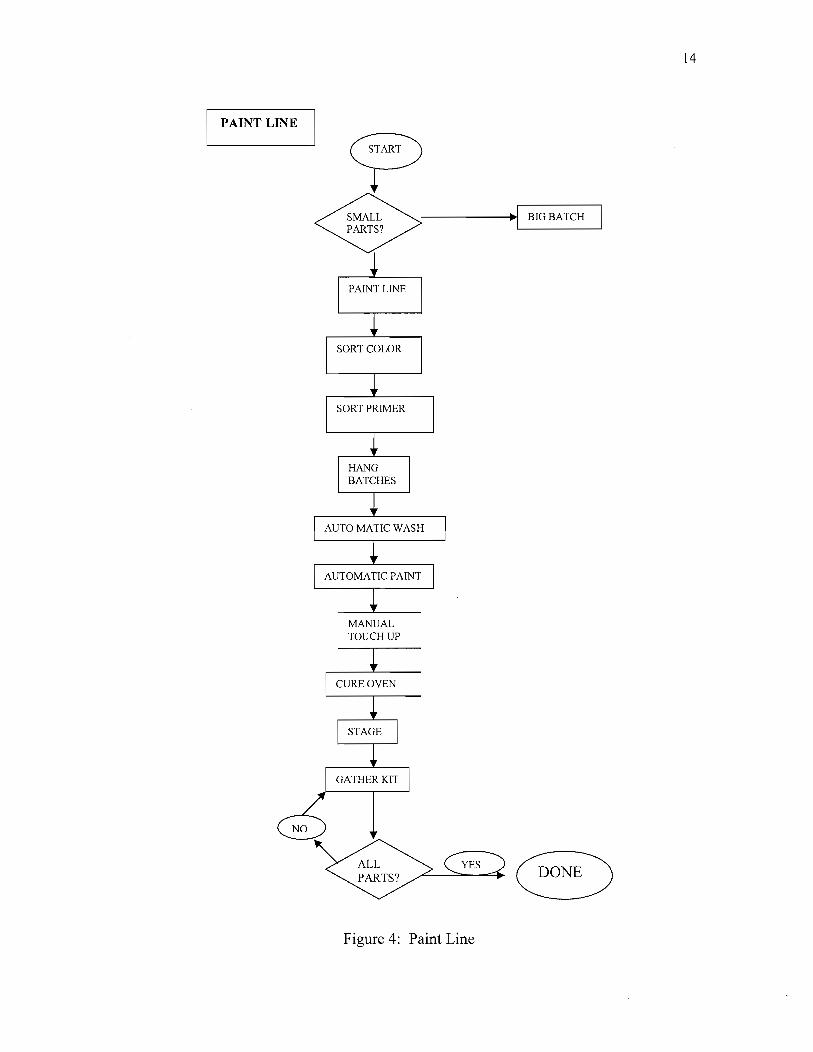
PAINT LINE
ALL PARTS?
------+l~1 BIGBATCH
Figure 4: Paint Line
14
15
Big batch process as shown in Figure 5 is another paint process used primarily for large
parts that will not fit on the automatic paint line or have abnormally complex geometry. The
processes and end result are the same, but big batch must be done manually due to the size and
complexity of the parts. As seen in Figure 5, there are 6 different wash processes dependent on
material. If the parts are not washed according to their specific wash process, quality concerns
will certainly arise.

BIG BATCH
'--S_T_E_E_L----'I I ALUMINUM I
~
SMALL PARTS? -------.t.1 PAlNT LINE
PART TYPE
~ STAINLESS
STEEL I PREPERATION I LI_Q_E_P_W_H_E_E_L----'
~ CURE
DONE
Figure 5: Big Batch
16
17
Measure Phase
Based on the customer's CTQs, processes critical to customer quality are identified.
Measurements taken will show if the processes are in control, which equates to a product that
will please the customer. This section highlights the measure phase of the DMAIC process that
was used.
A paint audit form was created to gather the data. The date and time for the survey was
taken and recorded. The survey includes 12 randomly selected samples with the part description
and production order recorded. The processes identified either big batch or paint line along with
pass fail criteria in specified areas such as laser scale and weld scale removal. The value stream
team leader collects data on three primary areas which include percent of re-work, number of
first pick good loads, and number of painted kits per total hours. This data is then graphed for all
in the paint area to see.
Multiple film thickness readings were taken dependant on part whether it was a
centrifugal or XYZ product. Due to the complexity of the XYZ product line, they received five
readings verses three for the standard centrifugal product line, an average of the readings was
calculated and recorded for analysis.
On time shipment is impOliant to the customer because project timelines are dependant
on this product reaching the job site on time. The shop flow is based on the product flowing
through the respective area. If the kit is gathered and painted in a reasonable amount of time, the
unit will ship on time. If the kit is missing parts, the kit will not ship until the correct parts are
found. To measure on time shipping, the number of first pick loads is used as a measure.
18
Adhesion is measured using the ASTM cross hatch test, this measures proper adhesion
which is a function of correct cure time and temperature of the cure oven. Samples can be run
through both the paint line and big batch area and then be tested and ranked accordingly. The
ASTM cross hatch test can be very subjective, so care should be taken to be as accurate and
consistent as possible. A poorly washed part will have adhesion issues because the paint will not
properly stick to the substrate. Adhesion testing will verify that the part was washed correctly
either in big batch or the paint line.
Another quality measure can be the number of re-hangs or reworked units. If quality is
poor as a result of failure in one of the process, then the unit will need to be re-painted or
reworked. This is a good measure, but is not specific to the type of defect encountered. Correct
color is part of the re-hang or re-work category. Re-paint or rework can mean light paint, poor
adhesion, or paint too thick.
Data Collection Procedures
Data collection consisted of filling out a paint audit form; the form captures important
information such as time, date, and film build readings in specified areas. Audits were taken for
a three month period from July to September approximately one per week by an unbiased source.
The number ofre-hangs or reworked units, number of first pick good loads, and number
of kits painted per total labor hours were collected and recorded by the supervisors for a specific
period of time for the month of September.
Due to time constraints, ASTM adhesion testing was not done. It is very important to
perform a six sigma study in manageable pieces in an effort to not get lost and overwhelmed.

19
Analyze Phase
The data was analyzed using run charts and other statistical tools such as mean and
standard deviation. The results of the analysis phase can be seen in the results section. From the
analysis phase of the DMAIC process conclusions may be drawn to make improvements.
Microsoft Excel is the primary data analysis tool; software such as Mini tab was not available.
Limitations
Due to the overall size of the project, this paper identifies the CTQs and talks about the
measure that can be derived from those CTQs and analyze only certain measures generated while
others will be recommended for the future.
20
Chapter IV: Results
This study uses the DMAIC process for the Six Sigma study. The Six Sigma study
performed up to this point has identified the CTQ's and identifies the customers needs which is
the define phase of the DMAIC process. Six Sigma is a customer focused quality improvement
initiative. Process flow charts were drawn up to aid in identifying areas that should be measured
from process control. The measure phase was driven by the CTQ's and the process flow charts;
data was collected based on this. Based on the measures, data was collected and now can be
analyzed as seen in the analysis portion of the study which is the analysis phase of the DMAIC
process.
Analysis
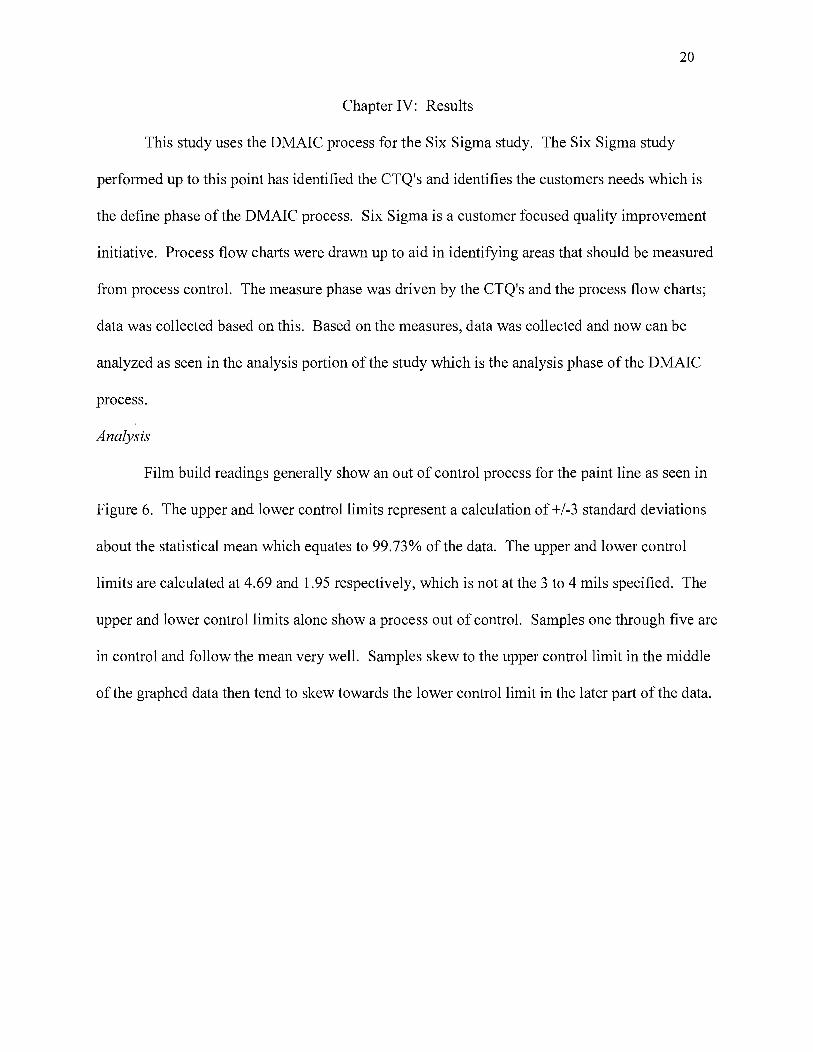
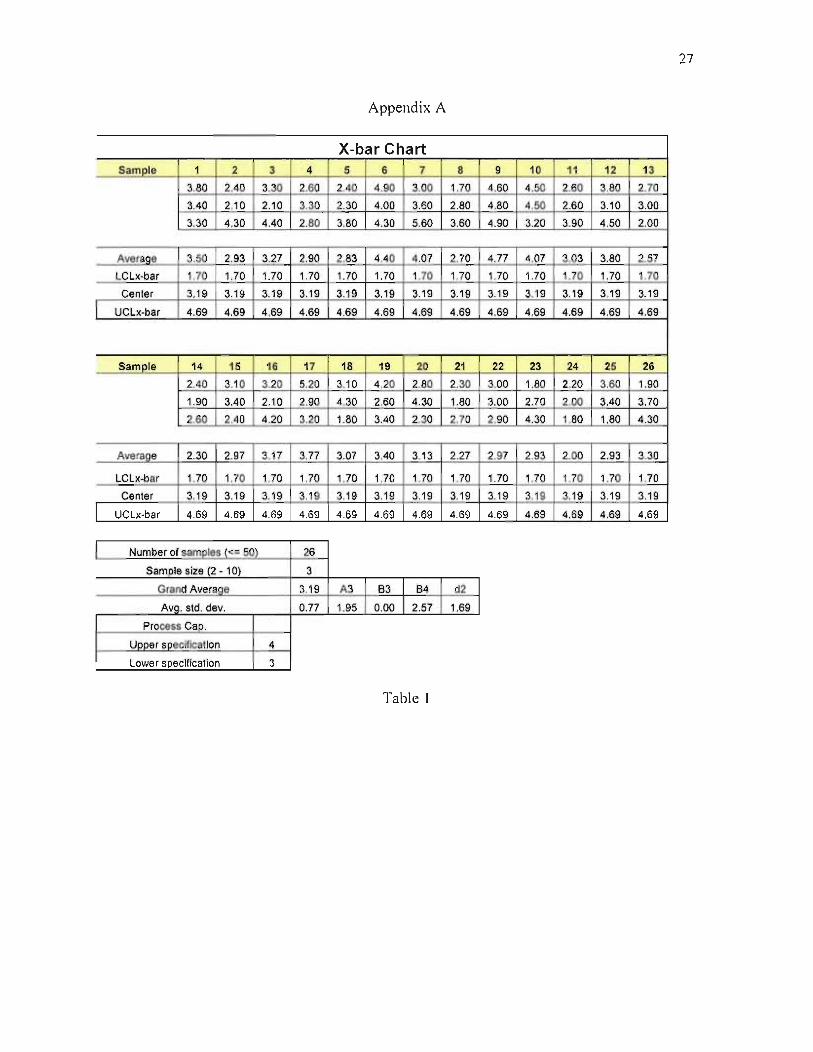
Film build readings generally show an out of control process for the paint line as seen in
Figure 6. The upper and lower control limits represent a calculation of +/-3 standard deviations
about the statistical mean which equates to 99.73 % of the data. The upper and lower control
limits are calculated at 4.69 and 1.95 respectively, which is not at the 3 to 4 mils specified. The
upper and lower control limits alone show a process out of control. Samples one through five are
in control and follow the mean very well. Samples skew to the upper control limit in the middle
of the graphed data then tend to skew towards the lower control limit in the later part of the data.
21
X-bar Chart ~A\erages Lower control limit Upper control hmll
- Centerline
, J I
• .-:- '- I I f-~ Ii- fV-~
I
~ . ---"-- - ;A r- I ... , '" , I ~ • .. ~
~ , -:'-1 I-'-~ I .", r • ~~ /,1 , .. - I--"
~ r
2 I- ---f-, - .- -•
, r r
r-- I_r- I ~.
0 I I , 2 3 • , • 7 , • " " " " " " " " " " 20 " 22 23 2" 25 28
Sample number
Figure 6: X-bar Chart
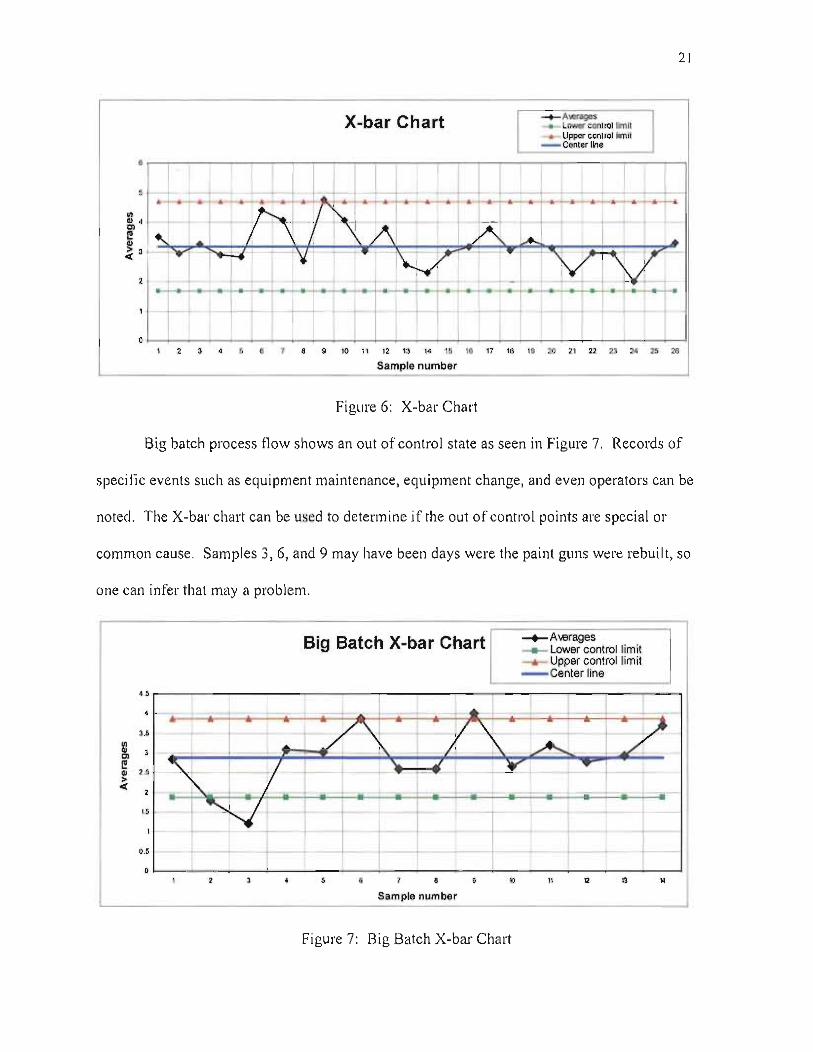
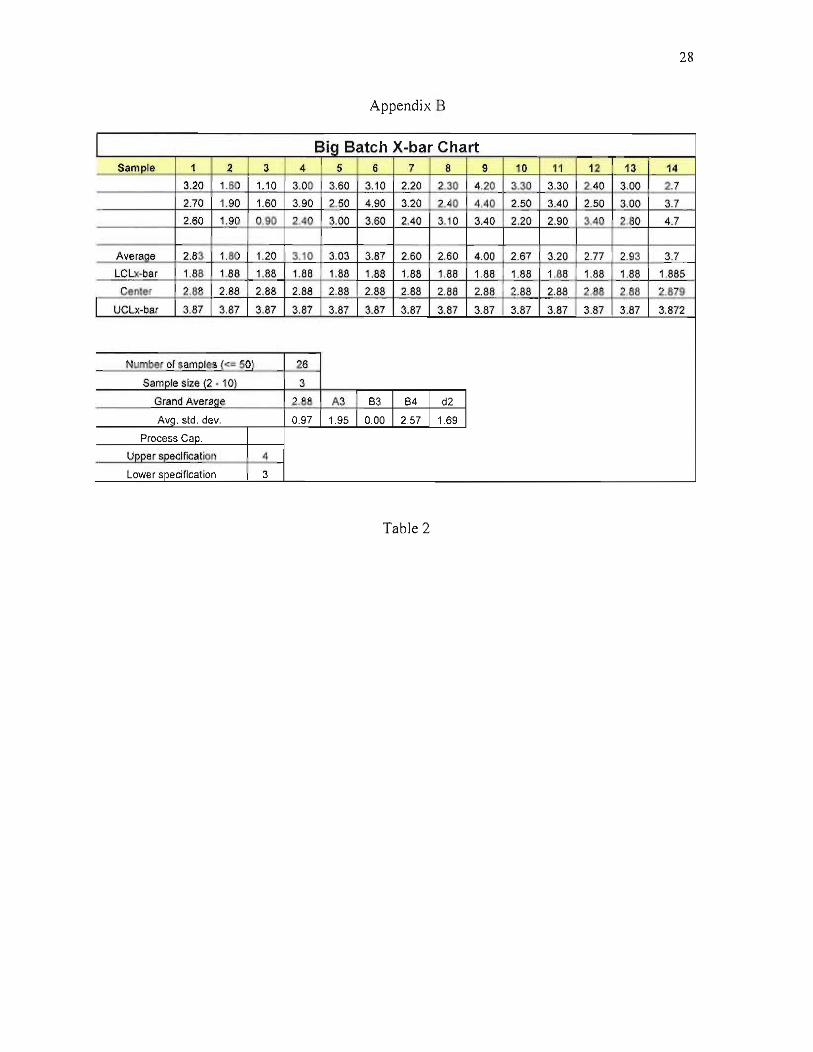
Big batch process fl ow shows an oul of control state as seen in Figure 7. Rccords of
specific events such as equipment maintenance, equipment change, and even operators can be
noted. The X-bar chart can be used to determine if the out of control points are special or
common cause. Samples 3, 6, and 9 may have been days were the paint guns were rebuilt, so
one can infer that maya problcm.
Big Batch X-bar Chart -+--A wrages ___ Lower control limit __ Upper control limit - Center line
" L .-. - ~ c---I- • u t /'\1\ - V '~ - £ ~ ... / 1 -I "........ ~ 3
'" ~ 2.' " / 1
y ... ~ > < 2 '" " - ........
+ 1 --l-- t-,
t t " 0 , 2 , • , • 1 • • • " • • M
Sample number
Figure 7: Big Batch X-bar Chart
22
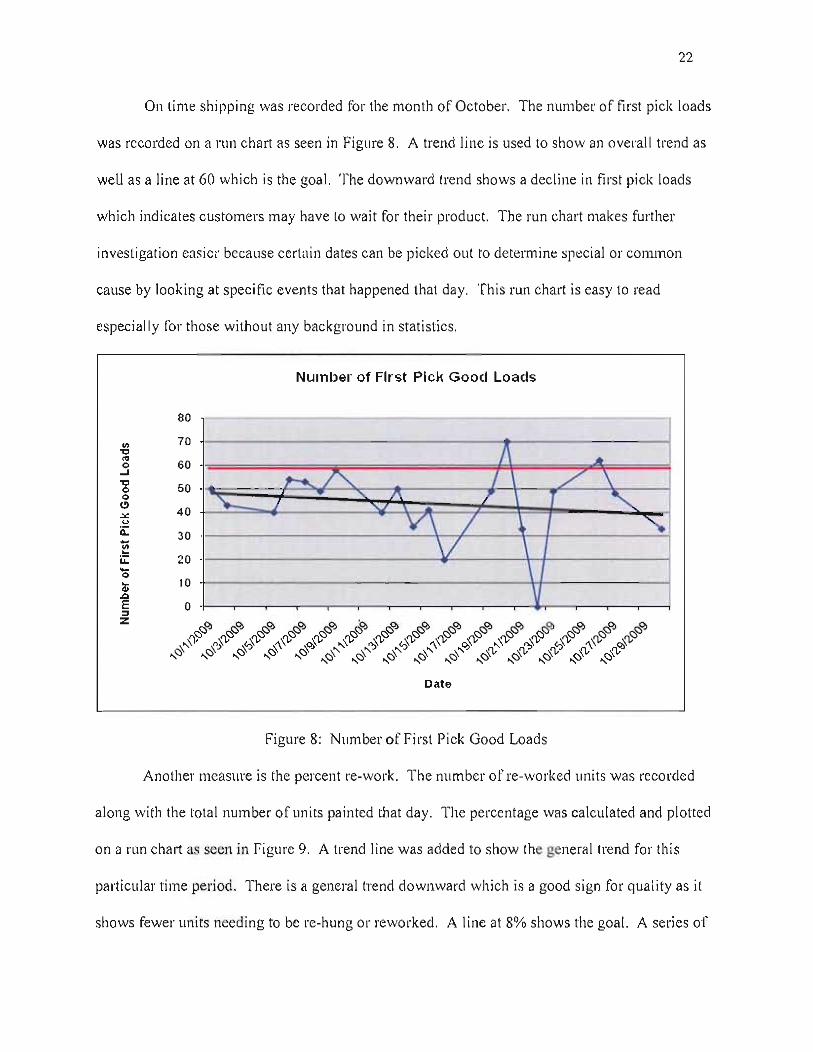
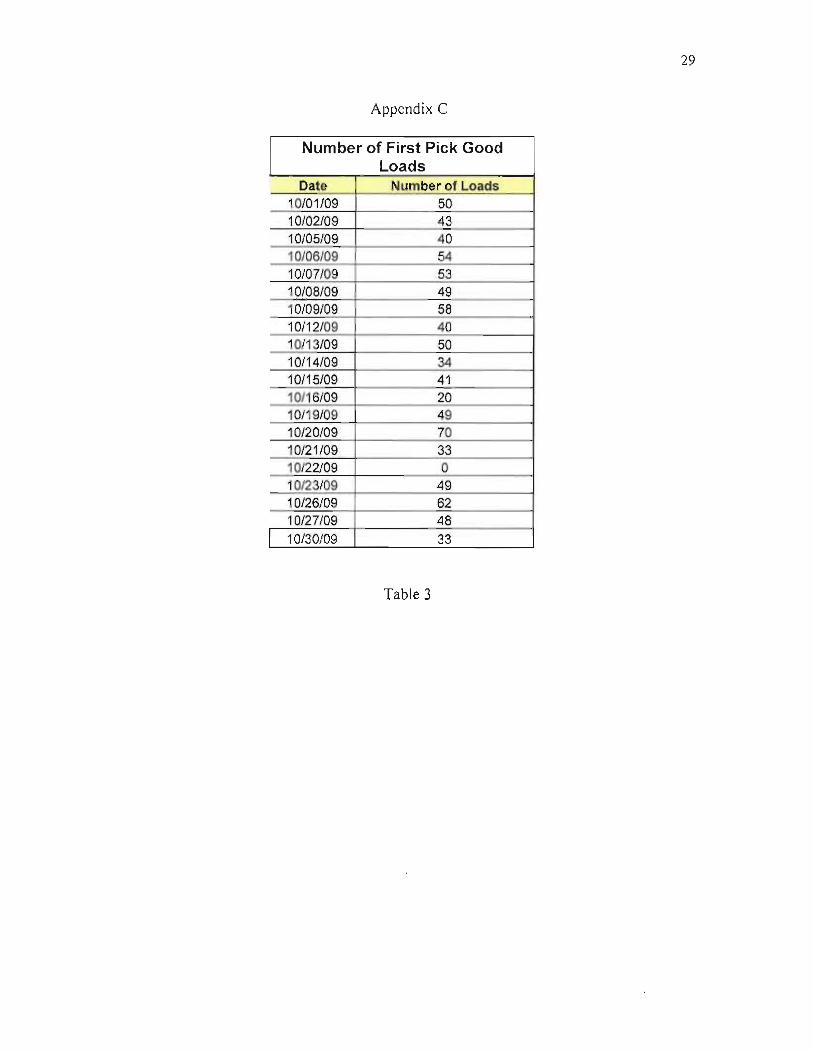
On time shipping was recorded fo r the month of October. The number of first pick loads
was recorded on a nlll chart as seen in Figure 8. A trcnd line is lIsed to show an overall trend as
well as a line at 60 which is the goa l. The downward trend shows a decline in first pick loads
which indicates customers may have to wait for their product. The run chart makes fU11her
investigation easier because certai n dates can be picked out to determine special or common
cause by looking at spccifi c events that happened that day. This run chart is easy to read
especiall y for those wi thout any background in statisti cs.
'" ..., .. o .... .., o o
" ... u ii:
80
70
GO
50
40
30
20
10
o
~
Nlimber of First Pick Good Loads
/\ t-..A /
j /
V\ / V
Date
Figure 8: N umber of First Pick Good Loads
,. / \
-""" '.
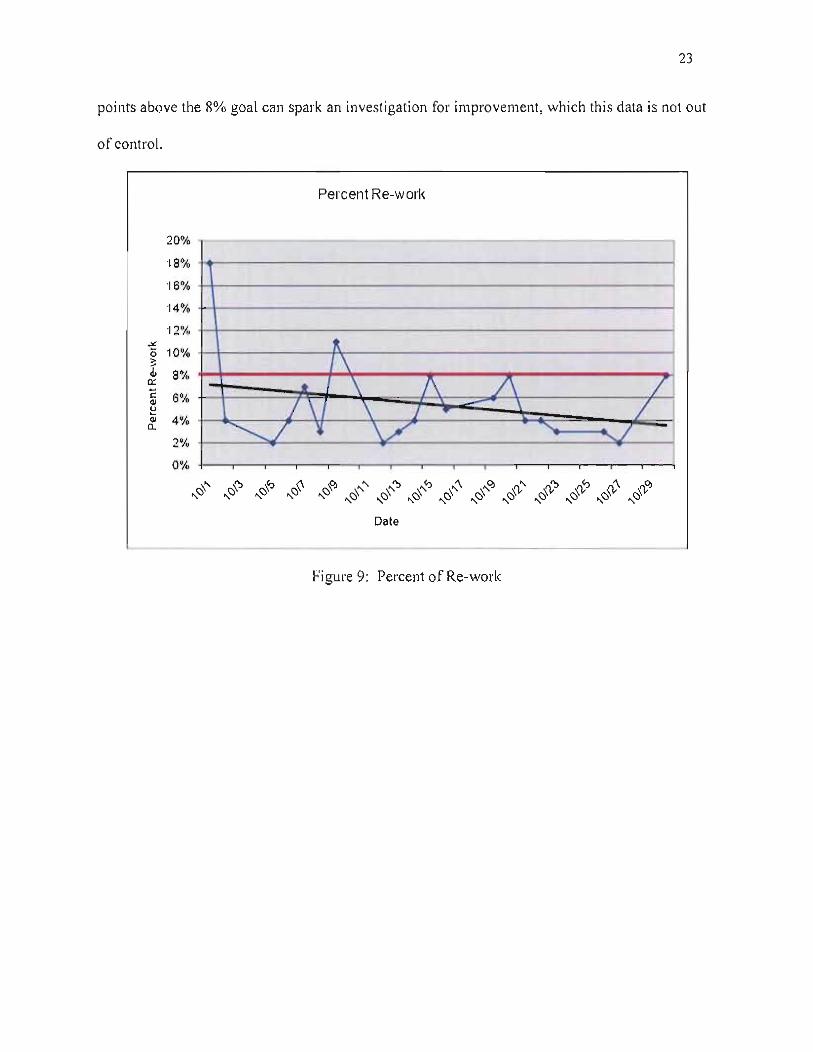
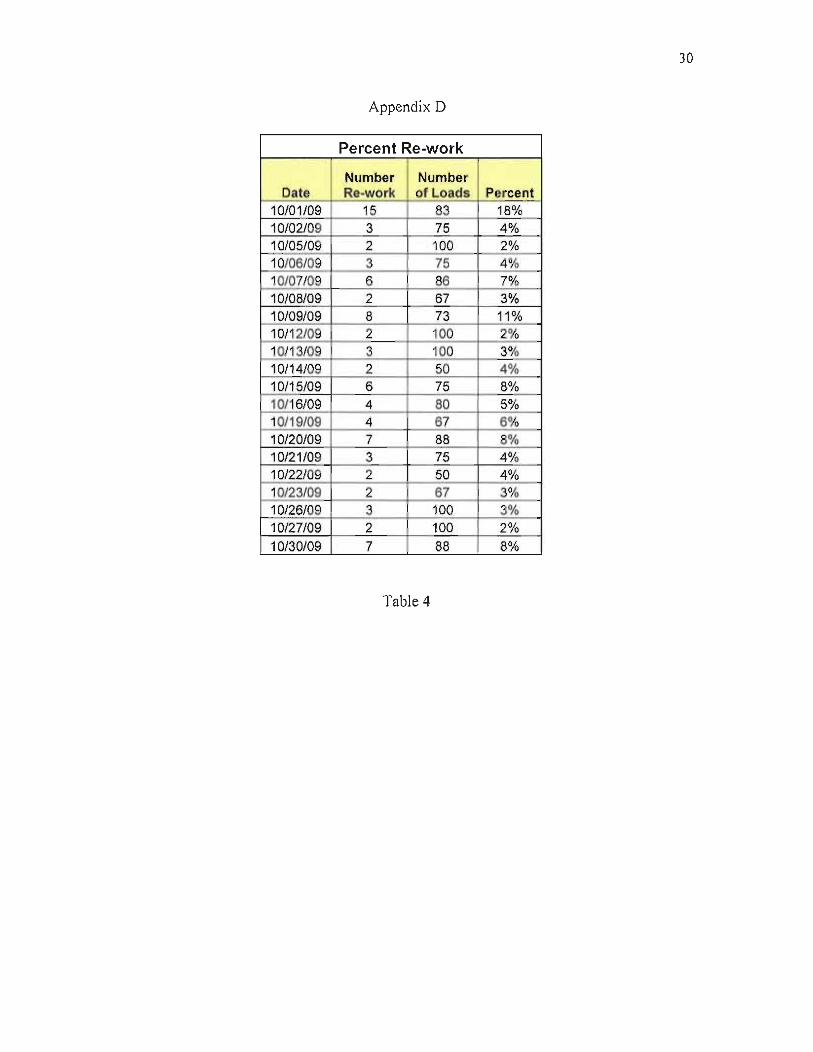
Another measure is the percent re-work. The num ber of re-worked units was recorded
along wi th the total number of units painted that day. The percentage was calculated and plotted
on a run chart as seen in Figure 9. A trend line was added to show the general trend fo r this
parti cular time period. There is a general trend downwa rd wh ich is a good sign fo r qual ity as it
shows fewer uni ts needing to be re-hung or reworked. A line at 8% shows the goa l. A seri es of
23
points above the 8% goal can spark an investigation for improvement, which this data is not out
of control.
Percent Re-work
20%
18%
16%
14%
12%
"'" (; 10% 3 d> 8%
'" C 6% " ~ " 4%
Cl.
2%
~ \
• \ 1\ L\ / J \ \ j \ /
............... / ~ \/ ...... /
0%
.~... .~"> .~., .<:>0 ~o, ...... ~ ... "> ~ ... " ~ ~\ ... o, ~~... ~"> ~~., ~<Y ~~'"
." ., "' "' " ,r:§. ,~ ,,~ ,,\::)\ "v "v ,,<::) ,,"" "v ""V
Date
Figure 9: Percent of Re-work
24
Chapter V: Discussion
This paper focuses on the DMAIC process. The customer's CTQ's were defined which is
essentially the customer needs. The DMAIC is a customer centered process that reflects what is
important to the customer. The measure phase goes through quality measures based on the
customers CTQ's. The analyze phase went through analysis of certain identified measures.
Limitations
The customer needs which are identified as the critical to quality (CTQs) are stated along
with the measures that are derived from those CTQs. Certain measures were chosen to analyze;
ASTM was omitted due to time constraints. The DMAIC process includes improve and control
phase which will be substituted with recommendations outlined in the proceeding section.
Conclusions
The film build analysis shows an out of control process with upper and lower control
limits out of touch with the specification of 3 to 4 mils of paint for both the paint line and big
batch. The number of first pick loads shows a downward decline for the worse. The goal of 60
was not attained, so investigation should follow to at least trend upward. Particular days can be
analyzed to determine special or common cause. The percent of re-works trends downward as
seen in the run chart which is good. The goal of 8% or less was attained except on sporadic
occasions. The percent re-work should be watched closely because it is close to being
considered out of control.
25
Recommendations
It is recommended that statistical process control chart be set up to control film build on
both the paint line and big batch. Film build is a fundamental critical to quality (CTQ) aspect for
paint quality. The advent of wireless film build readers with integrated statistical software would
generate easy data collection and analysis. The process control chart can be used as a
mechanism to drive changes. The process control chart will show if the out of control points are
special or common cause there by not making changes to chase a problem.
It is also recommended that the statistical tools be used to drive the process, not to
measure the process for what it is. More data on why particular out of control parts are not
within specification is needed.
The number of re-work units is not specific to the type of defect encountered. Re-paint
or re-work can mean light paint, poor adhesion, or paint too thick. If this measure is used, the
data should incorporate some detail as to what type of defect caused the unit to be re-hung so the
root cause can be addressed.
Conceptually, the paint line is tracking performance to see how well or not so well we are
doing. I would recommend that the data be taken one step further to drive change. The Six
Sigma process dictates that it is not productive to chase the problem, but find and fix the root of
the problem based on the breakdown of the processes and data. Let data drive change.
26
References
Abramowich, Edward (2005). Six sigma for growth: Driving profitable top line Results, John
Wiley and Sons (Asia) Pte Ltd., Two Clementi Loop, #02-01, Singapore
Breyfogle, F. W. (2003). Implementing six sigma: Smarter solutions using statistical methods
(2nd ed.) John Wiley & Sons, Inc., Hoboken, New Jersey
Clark, G. M., & Cook, D. (1992). A basic course in statistics (3 rd ed.) Edward Arnold, Kent, TN
Eckes, G. (2005). Six sigma execution: How the world's greatest companies live and breathe six
sigma. McGraw-Hill, Two Penn Plaza, New York, NY
Keller, Paul (2005), Six sigma demystified. McGraw-Hill, Two Penn Plaza, New York, NY
Steven, M. (2009) Trimming waste?: A guide to six sigma, lean, and the theory of constraints
Canadian Plastics (p. 19) Jan.lFeb. 2009; 67,1; ABIIINFORM Global
Summers, Donna C. (2006). Quality (4th ed.) Pearson Education, Inc., Upper Saddle River, NJ
Pande, P., & Holpp, L.(2002). What is six sigma? McGraw-Hill, Two Penn Plaza, New York,
NY
Prezekop, Penelope (2006), Six sigma for business excellence: A manager's guide to supervising
six sigma projects and teams. McGraw-Hill, Two Penn Plaza, New York, NY
Voelker, David H. and Orton, Peter Z. (1993), Statistics, Cliffs Notes Inc., Lincoln, NE
Womack, James P.; Jones, Daniel T.; Roos, Daniel; Carpenter, Donna Sammons (1990) The
machine that changed the world, HarperCollins Publishers, 10 East 53 rd St, New York,
NY
27
Appendix A
X-bar Chart Sample 1 2 3 4 5 6 7 8 9 10 11 12 13
3.80 2.40 3.30 2.60 2.40 4.90 3.00 1.70 4.60 4.50 2.60 3.80 2.70
3.40 2.10 2.10 3.30 2.30 4.00 3.60 2.80 4.80 4.50 2.60 3.10 3.00
3.30 4.30 4.40 2.80 3.80 4.30 5.60 3.60 4.90 3.20 3.90 4.50 2.00
Average 3. 50 2.93 3.27 2.90 2.83 4.40 4.07 2.70 4.77 4.07 3.03 3.80 2.57
LCLx·bar 1.70 1.70 1.70 1.70 1.70 1.70 1.70 1.70 1.70 1.70 1.70 1.70 1.70
Center 3.19 3.19 3.19 3.19 3.19 3.19 3.1 9 3.19 3.19 3.19 3.19 3.19 3.19
I UCLx·bar 4.69 4.69 4.69 4.69 4.69 4.69 4.69 4.69 4.69 4.69 4.69 4.69 4.69
Sa mple 14 15 16 17 18 19 20 21 22 23 24 25 26
2.40 3.10 3.20 5.20 3.10 4.20 2.80 2.30 3.00 1.80 2.20 3.60 1.90
1.90 3.40 2.10 2.90 4.30 2.60 4.30 1.80 3.00 2.70 2.00 3.40 3.70
2.60 2.40 4.20 3.20 1.80 3.40 2.30 2.70 2.90 4.30 1.80 1.80 4.30
Average 2.30 2.97 3.17 3.77 3.07 3.40 3.13 2.27 2.97 2.93 2.00 2.93 3.30
LCLx·bar 1.70 1.70 1.70 1.70 1.70 1.70 1.70 1.70 1.70 1.70 1.70 1.70 1.70
Center 3.19 3.19 3.19 3.19 3.19 3.19 3.19 3.19 3.19 3.19 3.19 3.19 3.19
I UCLx·bar 4.69 4.69 4.69 4.69 4.69 4.69 4.69 4.69 4.69 4.69 4.69 4.69 4.69
Number of samples «= 50) 26
Sample size (2 • 10) 3
Grand AversQe 3.19 A3 63 64 d2
Avg. std. dev . 0.77 1.95 0.00 2.57 1.69
Process Cap.
UDoer scecificatlon 4
Lower specification 3
Table I
28
Appendix B
r Bi~ Batch X-bar Chart Sam Die 1 2 3 4 5 6 7 8 9 10 11 12 13 14
3.20 1.60 1.10 3.00 3.60 3.10 2.20 2.30 4.20 3.30 3.30 2.40 3.00 2.7
2.70 1.90 1.60 3.90 2.50 4.90 3.20 2.40 4.40 2.50 3.40 2.50 3.00 3.7
2.60 1.90 0.90 2.40 3.00 3.60 2.40 3.10 3.40 2.20 2.90 3.40 2.80 4.7
Averane 2.83 1.80 1.20 3. 10 3.03 3.87 2.60 2.60 4.00 2.67 3.20 2.77 2.93 3.7
LCLx~bar 1.88 1.88 1.88 1.88 1.88 1.88 1.88 1.88 1.88 1.88 1.88 1.88 1.88 1.885
Center 2.88 2.88 2.88 2.88 2.88 2.88 2.88 2.88 2.88 2.88 2.88 2.88 2.88 2.879
I UCl x-bar 3.87 3.87 3.87 3.87 3.87 3.87 3.87 3.87 3.87 3.87 3.87 3.87 3.87 3.872
Number of samnles «= 50\ 26
SamDle size 12 · 10\ 3
Grand Averaoe 2.88 A3 83 84 d2
Ava. sid . dev. 0.97 1.95 0.00 2.57 1.69
Process Cao,
UDoer sOBcification 4
Lower snecification 3
Table 2
29
Appendix C
Number of First Pick Good Loads
Date Number of Loads 10101/09 50 10102/09 43 10105/09 40 10106/09 54 10107109 53 10108/09 49 10109/09 58 10/12/09 40 10/13/09 50 10/14/09 34 10/15/09 41 10/16/09 20 10/19/09 49 10/20109 70 10/21/09 33 10/22/09 0 10/23/09 49 10/26/09 62 10/27109 48 10/30109 33
Table 3
30
Appendix D
Percent Re-work
Number Number Date Re-work of Loads Percent
10101/09 15 83 18% 10102/09 3 75 4% 10105/09 2 100 2% 10106/09 3 75 4% 10107109 6 86 7% 10108/09 2 67 3% 10109/09 8 73 11 % 10/12/09 2 100 2% 10/13/09 3 100 3% 10/14/09 2 50 4% 10/15/09 6 75 8% 10/16/09 4 80 5% 10/19/09 4 67 6% 10/20109 7 88 8% 10/21/09 3 75 4% 10/22/09 2 50 4% 10/23/09 2 67 3% 10/26/09 3 100 3% 10/27109 2 100 2% 10/30109 7 88 8%
Table 4


![[Bill Faust, Michael Faust] Pitch Yourself Stando(BookFi.org)](https://img.pdfslide.net/doc/110x75/55cf8f5d550346703b9b9f46/bill-faust-michael-faust-pitch-yourself-standobookfiorg.jpg)