Embed Size (px)
Citation preview

SINTEF Energy Research SINTEF Energy Research 2012-02-10
TR A7195- Unrestricted
Report
Increasing balance power capacity in Norwegian hydroelectric power stations A preliminary study of specific cases in Southern Norway Author(s) Eivind Solvang, Atle Harby, Ånund Killingtveit


1 of 86
SINTEF Energi AS SINTEF Energy Research
Address: Postboks 4761 Sluppen NO-7465 Trondheim NORWAY
Telephone:+47 73597200 Telefax:+47 73597250
[email protected] www.sintef.no/energi Enterprise /VAT No: NO 939 350 675 MVA
Report
Increasing balance power capacity in Norwegian hydroelectric power stations A preliminary study of specific cases in Southern Norway
KEYWORDS: Balance power Power potential Hydro storage Pumped storage Environmental impacts Grid connection
VERSION1.1 DATE
2012-02-10
AUTHOR(S)
Eivind Solvang, Atle Harby, Ånund Killingtveit
CLIENT(S)
CEDREN CLIENT’S REF.
CEDRENs Board of Directors
PROJECT NO.
12X757 NUMBER OF PAGES
86
ABSTRACT This report describes the results of a preliminary study relating to increasing the power output of hydroelectric power plants at existing reservoirs in Southern Norway subject to the constraints of current regulations regarding highest and lowest regulated water levels (HRWL and LRWL). The main scenario involves twelve new power stations with a combined power output of 11,200 MW. It is envisaged that these power stations would be constructed with new tunnels to an upstream reservoir and to the downstream outflow into a reservoir, a fjord or the sea. Five of the power plants are pumped storage power stations with a combined output of 5,200 MW, while the remainder are hydro storage hydroelectric power stations with a combined output of 6,000 MW, all but one of which discharge into a fjord or the sea. None of the selected power stations will experience more rapid water level variations than 14 cm per hour in the affected upstream and downstream reservoirs. The strictest restrictions on water level variation are associated with downstream reservoirs. In most cases it will take 2-4 weeks of constant power generation to empty an upstream reservoir. It is assumed that the operation of the existing power station will remain unchanged. The most serious environmental challenges affecting reservoirs resulting from increased power generation installation are connected with the risk of increased erosion, changes in circulation, changes in water temperature, reduced ice cover and increased danger of unstable ice. All these physical changes can have an impact on ecosystems. Many of the selected reservoirs are already strongly affected by water level regulation. In reservoirs which receive pumped water from lower reservoirs or neighbouring water systems, environmental impacts can be considerable because transferred water can result in major changes in water chemistry and temperature, and a range of organisms may be transferred from the lower reservoir to the upper one. Knowledge of the possible effects of such water transfer is incomplete. The environmental challenges connected with balance power will vary from project to project and will depend on the type of operational pattern and restrictions implemented. Our ability to develop and use knowledge of environmental effects will determine what sort of local impacts balance power projects may have. Each of the power station installations studied will require connection through a separate 420 kV line to appropriate points in the central supply grid if power exchange with other countries is to take place by way of the central transmission grid.
PREPARED BY
Eivind Solvang SIGNATURE
CHECKED BY
Michael Belsnes SIGNATURE
APPROVED BY
Magnus Korpås SIGNATURE
REPORT NO.
TR A7195 ISBN
978-82-594-3519-4 CLASSIFICATION
Unrestricted CLASSIFICATION THIS PAGE
Unrestricted


PROJECT NO. 12X757
REPORT NO. TR A7195
VERSION 1.1
3 of 86
Table of contents
1 Introduction ........................................................................................................................................................................................................................... 5 1.1 Increasing balance power capacity in Southern Norway .........................................................................................................5 1.2 Other studies ..........................................................................................................................................................................................................6 1.3 Summary of cases ..............................................................................................................................................................................................6 1.4 Calculation model ................................................................................................................................................................................................8
2 Analysis of the selected cases ........................................................................................................................................................................... 12 2.1 Tonstad.................................................................................................................................................................................................................... 12 2.2 Blåsjø – Svartevatn – Otramagasinene ............................................................................................................................................. 18 2.3 Møsvatn – Tinnsjø – Kallhovd/Mår ....................................................................................................................................................... 38 2.4 Lysebotn ................................................................................................................................................................................................................. 46 2.5 Mauranger – Oksla – Tysso ....................................................................................................................................................................... 50 2.6 Sima ........................................................................................................................................................................................................................... 58 2.7 Aurland - Tyin ...................................................................................................................................................................................................... 62
3 Examples of new power generation and pumping capacity .......................................................................................................... 70 3.1 Installations .......................................................................................................................................................................................................... 70 3.2 Potential for increased power generation and pumping capacity in Norway .......................................................... 71
4 Environmental impact ................................................................................................................................................................................................ 73 4.1 General ..................................................................................................................................................................................................................... 73
4.1.1 The construction phase ............................................................................................................................................................ 73 4.1.2 The operational phase ................................................................................................................................................................ 74
4.2 Environmental impacts of selected cases ...................................................................................................................................... 76
5 Grid connection ............................................................................................................................................................................................................... 78
6 Costs ..................................................................................................................................................................................................................................... 81
7 Conclusions ........................................................................................................................................................................................................................ 83
8 References .......................................................................................................................................................................................................................... 85

PROJECT NO. 12X757
REPORT NO. TR A7195
VERSION 1.1
5 of 86
1 Introduction
1.1 Increasing balance power capacity in Southern Norway Many countries are in the process of increasing the proportion of renewable energy in their electrical supply, and for European countries this will generally result in an increase in wind and solar power generation. Since it is not possible to store energy generated by wind and solar power plants, there will be an increased need to balance consumption and generation. Hydroelectric power generation systems can store energy through the storage of water in a reservoir, and it is also possible to pump water from a lower reservoir to a higher one, thereby storing energy for later consumption. This type of compensation for the difference between production and consumption is known as “balance power”. Norwegian hydroelectric reservoirs have considerable storage capacity and there is great international and national interest in Norway’s ability to supply balance power services over various time scales to the European market. The potential and challenges have not been studied to any great extent. This report describes a preliminary study of the technical potential of balance power in Norway, and includes a brief treatment of environmental impacts and grid connection. The balance power capacity of Norwegian hydroelectric power stations can be increased by increasing the absorption capacity and turbine/generator output in some power stations, and by installing (reversible) pump turbines to pump water between two reservoirs. This should preferably be achieved by constructing new tunnels parallel to existing ones and by building new power stations in association with existing facilities. The balance power capacity of hydroelectric power stations depends on how much power can be supplied during periods of shortage and how much power can be absorbed in periods of overproduction. The power capacity depends on the level of power which can be supplied or absorbed in a given period. Power can be absorbed if a power station can pump water up to a higher reservoir. In many power stations the capacity of the downstream reservoir will limit the amount of power which can be supplied. Pumping at times of the day when the power demand is lowest (e.g. at night) will reduce the capacity restriction effect of the downstream reservoir. Such pumping will also increase the capacity of the upstream reservoir and the periods of power generation can be extended by pumping water back during the part of the day in which the power demand is lowest, to be used at the time when the demand is highest. Increased exploitation of reservoirs for generating balance power is planned to take place in compliance with existing regulations governing highest and lowest regulated water levels (HRWL and LRWL). Rapid changes in water level in reservoirs resulting from increased power generation (drawing down) can harm species inhabiting the reservoirs, as well as the reservoirs themselves. Pumping can result in detrimental spreading of species from one water system to another. For the purposes of this report, the construction of new reservoirs with the aim of balance power generation is disregarded.
PROJECT NO. 12X757
REPORT NO. TR A7195
VERSION 1.1
6 of 86
1.2 Other studies The Norwegian Water Resources and Energy Directorate (NVE) has studied the potential for increasing the power output of 89 existing hydroelectric power stations with an output of more than 50 MW [1]. These are mainly power stations which discharge into the sea, reservoirs or large lakes. The study did not consider the potential represented by pumping. The 89 power stations studied by NVE had an average usage time of approximately 3,900 hours. If the usage time for each individual power station can be reduced to 2,000 hours by upgrading its power output, the total power output of these power stations can be increased from 17,000 MW to 33,500 MW. This is an increase of 16,500 MW. A reduction of usage time to 2,000 hours was selected to illustrate the potential for improvement. In some power stations the increase in power output could be significantly more than that corresponding to a usage time of 2,000 hours. EC Group and THEMA Consulting Group have carried out a study for Energi Norge [2] in which the following project hypothesis is studied: It is possible to establish at least 10,000 MW of profitable power output in Norway to contribute to the balancing of more than 100,000 MW of new and difficult to regulate power generation in Europe by 2030, reducing greenhouse gas emissions from equivalent thermal power generation and providing climatic benefits. The study concludes that this is possible, but that there are a number of important barriers which will make it difficult to achieve. CEDREN and SINTEF Energy Research have contributed to the above-mentioned study in the form of the results presented in this report. The combined output of the twelve power stations in Table 3.1 is 11,200 MW. These are used in Energi Norge’s study as an example of how it is possible to establish 10,000 MW of new capacity using existing regulated reservoirs in compliance with current regulations regarding highest and lowest regulated water levels. Several energy companies have commenced their own studies of the potential for increasing hydro storage and pumped storage capacity, but these have not yet been completed or published. In Germany a government-appointed committee has studied [3, 4] how extensive exchange with the Norwegian hydroelectric generation system may make Germany’s energy supplies 100 per cent renewable by 2050. Among a number of alternatives, the report shows that exchange with Norway will also be by far the cheapest option if this goal is to be met.
1.3 Summary of cases We have selected 19 specific cases in Southern Norway in order to analyse the potential for increasing power output for the purpose of balance power generation. The analysis has been carried out using a simple calculation model. The selected cases are listed below and described in Chapter 2. All the cases are new power stations and with the exception of B7 are located adjacent to existing plants. It is envisaged that the new power stations would be constructed with new tunnels to an upstream reservoir and to the downstream outflow into a reservoir, a fjord or the sea. The power stations are designated “pumped storage power stations” or “hydro storage power stations”. The first category has reversible pump turbines, pumping water between two reservoirs, while hydro storage power stations are not fitted with such pump turbines. With one exception (G2), all the hydro storage power stations discharge into a fjord or the sea. The case designation includes the name of the power station with which the new plant is associated (e.g. Tonstad), or in some cases the name of the downstream reservoir or fjord. The name of either an upstream or downstream reservoir or fjord is added in parentheses.
PROJECT NO. 12X757
REPORT NO. TR A7195
VERSION 1.1
7 of 86
A Tonstad A1 Tonstad pumped storage power station (Homstølvatn – Sirdalsvatn)
A2 Tonstad pumped storage power station (Nesjen – Sirdalsvatn) B Blåsjø – Svartevatn – Otra reservoirs
B1 Bossvatn pumped storage power station (Blåsjø – Bossvatn) B2 Bossvatn pumped storage power station (Svartevatn – Bossvatn) B3 Holen pumped storage power station (Urarvatn – Bossvatn) B4 Vatnedalsvatn pumped storage power station (Urarvatn – Vatnedalsvatn) B5 Kvilldal pumped storage power station (Sandsavatn – Suldalsvatn) B6 Kvilldal pumped storage power station (Blåsjø – Suldalsvatn) B7 Jøsenfjorden hydro storage power station (Blåsjø – Jøsenfjorden/sea)
C Møsvatn – Tinnsjø – Kallhovd/Mår
C1 Tinnsjø pumped storage power station (Møsvatn – Tinnsjø) C2 Tinnsjø pumped storage power station (Møsvatn – Tinnsjø) + Tinnsjø pumped storage power station
(Kallhovd – Tinnsjø) C3 Tinnsjø pumped storage power station (Kallhovd – Tinnsjø) + Tinnsjø pumped storage power
station (Møsvatn – Tinnsjø)
C1 and C2 involve the same power station, Tinnsjø (Møsvatn – Tinnsjø). The difference between C1 and C2 is that C2 also includes drawdown from Kallhovd to Tinnsjø via the power station at C3, Tinnsjø (Kallhovd – Tinnsjø).
D Lysebotn
D1 Lysebotn hydro storage power station (Lyngsvatn – Lysefjorden/sea) E Mauranger – Oksla – Tysso
E1 Mauranger hydro storage power station (Juklavatn – Hardangerfjorden/sea) E2 Oksla hydro storage power station (Ringedalsvatn – Hardangerfjorden/sea) E3 Tysso pumped storage power station (Langevatn – Ringedalsvatn)
F Sima
F1 Sy-Sima hydro storage power station (Sysenvatn – Hardangerfjorden/sea) G Aurland – Tyin
G1 Aurland/Vangen hydro storage power station (Viddalsvatn – Aurlandsfjorden/sea) G2 Tyin hydro storage power station (Tyin – Årdalsvatnet)
PROJECT NO. 12X757
REPORT NO. TR A7195
VERSION 1.1
8 of 86
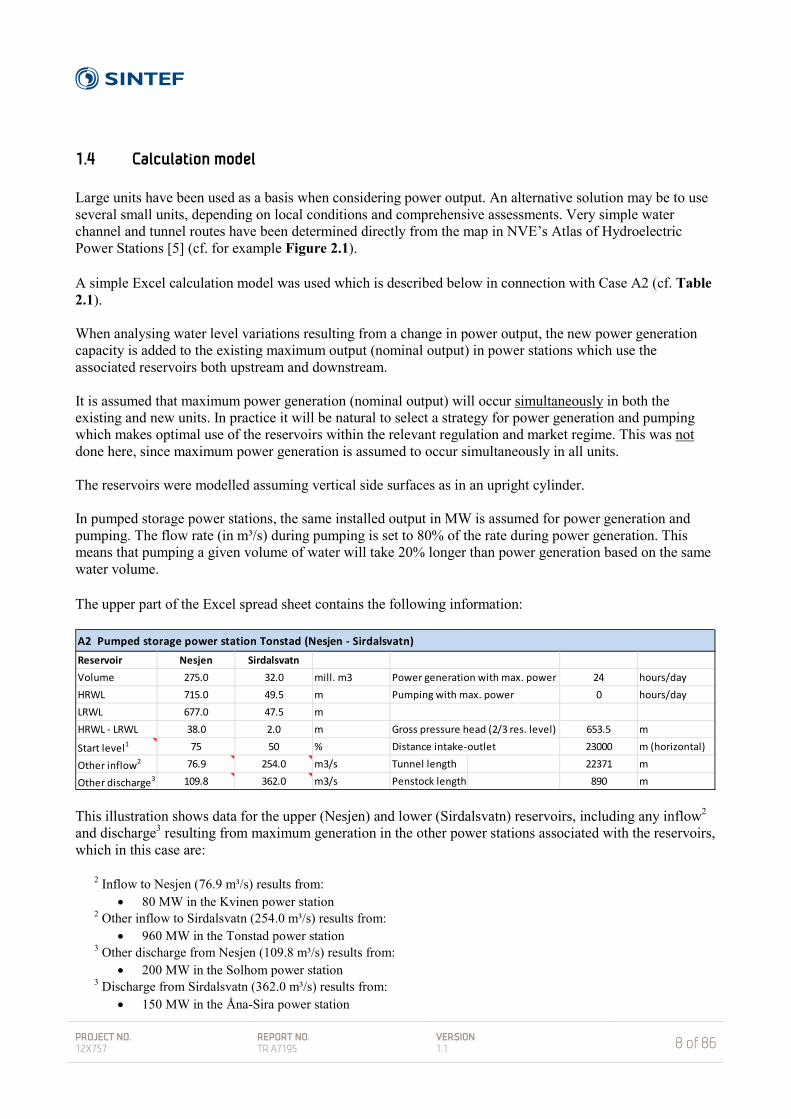
1.4 Calculation model Large units have been used as a basis when considering power output. An alternative solution may be to use several small units, depending on local conditions and comprehensive assessments. Very simple water channel and tunnel routes have been determined directly from the map in NVE’s Atlas of Hydroelectric Power Stations [5] (cf. for example Figure 2.1). A simple Excel calculation model was used which is described below in connection with Case A2 (cf. Table 2.1). When analysing water level variations resulting from a change in power output, the new power generation capacity is added to the existing maximum output (nominal output) in power stations which use the associated reservoirs both upstream and downstream. It is assumed that maximum power generation (nominal output) will occur simultaneously in both the existing and new units. In practice it will be natural to select a strategy for power generation and pumping which makes optimal use of the reservoirs within the relevant regulation and market regime. This was not done here, since maximum power generation is assumed to occur simultaneously in all units. The reservoirs were modelled assuming vertical side surfaces as in an upright cylinder. In pumped storage power stations, the same installed output in MW is assumed for power generation and pumping. The flow rate (in m³/s) during pumping is set to 80% of the rate during power generation. This means that pumping a given volume of water will take 20% longer than power generation based on the same water volume. The upper part of the Excel spread sheet contains the following information:
This illustration shows data for the upper (Nesjen) and lower (Sirdalsvatn) reservoirs, including any inflow2 and discharge3 resulting from maximum generation in the other power stations associated with the reservoirs, which in this case are:
2 Inflow to Nesjen (76.9 m³/s) results from: • 80 MW in the Kvinen power station
2 Other inflow to Sirdalsvatn (254.0 m³/s) results from: • 960 MW in the Tonstad power station
3 Other discharge from Nesjen (109.8 m³/s) results from: • 200 MW in the Solhom power station
3 Discharge from Sirdalsvatn (362.0 m³/s) results from: • 150 MW in the Åna-Sira power station
A2 Pumped storage power station Tonstad (Nesjen - Sirdalsvatn)Reservoir Nesjen Sirdalsvatn Volume 275.0 32.0 mill. m3 Power generation with max. power 24 hours/dayHRWL 715.0 49.5 m Pumping with max. power 0 hours/dayLRWL 677.0 47.5 m HRWL - LRWL 38.0 2.0 m Gross pressure head (2/3 res. level) 653.5 m
Start level1 75 50 % Distance intake-outlet 23000 m (horizontal)
Other inflow2 76.9 254.0 m3/s Tunnel length 22371 m
Other discharge3 109.8 362.0 m3/s Penstock length 890 m
PROJECT NO. 12X757
REPORT NO. TR A7195
VERSION 1.1
9 of 86
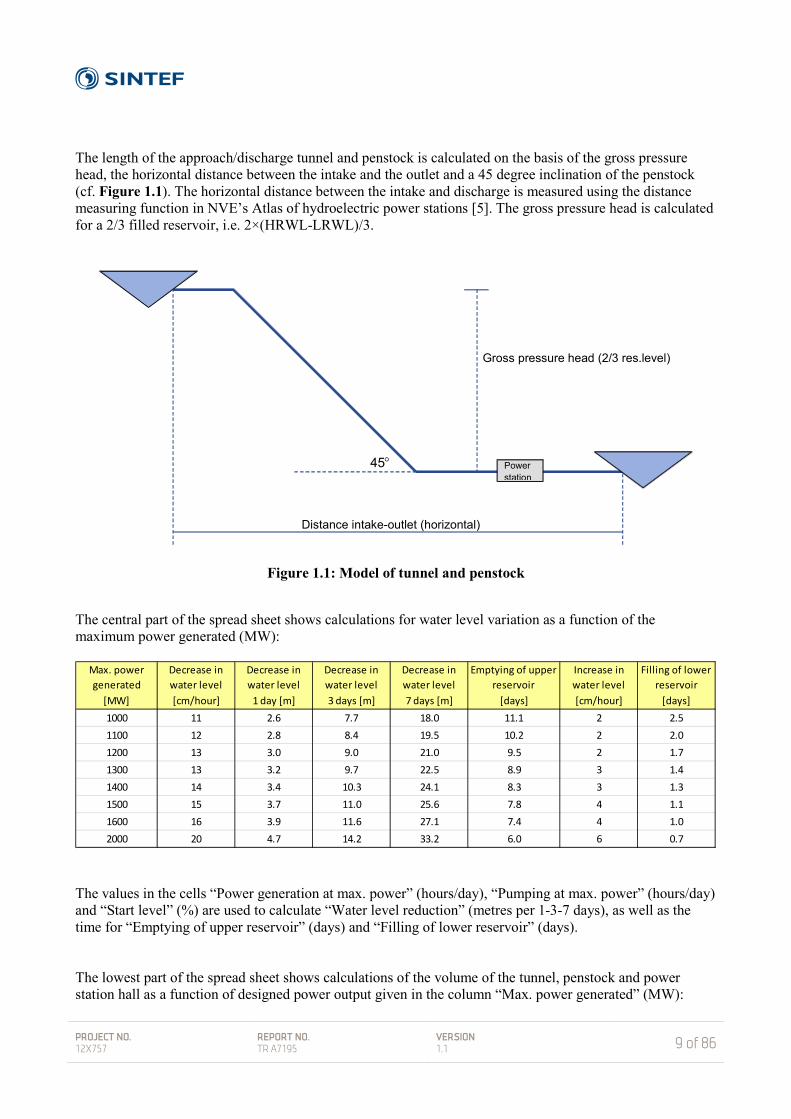
The length of the approach/discharge tunnel and penstock is calculated on the basis of the gross pressure head, the horizontal distance between the intake and the outlet and a 45 degree inclination of the penstock (cf. Figure 1.1). The horizontal distance between the intake and discharge is measured using the distance measuring function in NVE’s Atlas of hydroelectric power stations [5]. The gross pressure head is calculated for a 2/3 filled reservoir, i.e. 2×(HRWL-LRWL)/3.
Figure 1.1: Model of tunnel and penstock
The central part of the spread sheet shows calculations for water level variation as a function of the maximum power generated (MW):
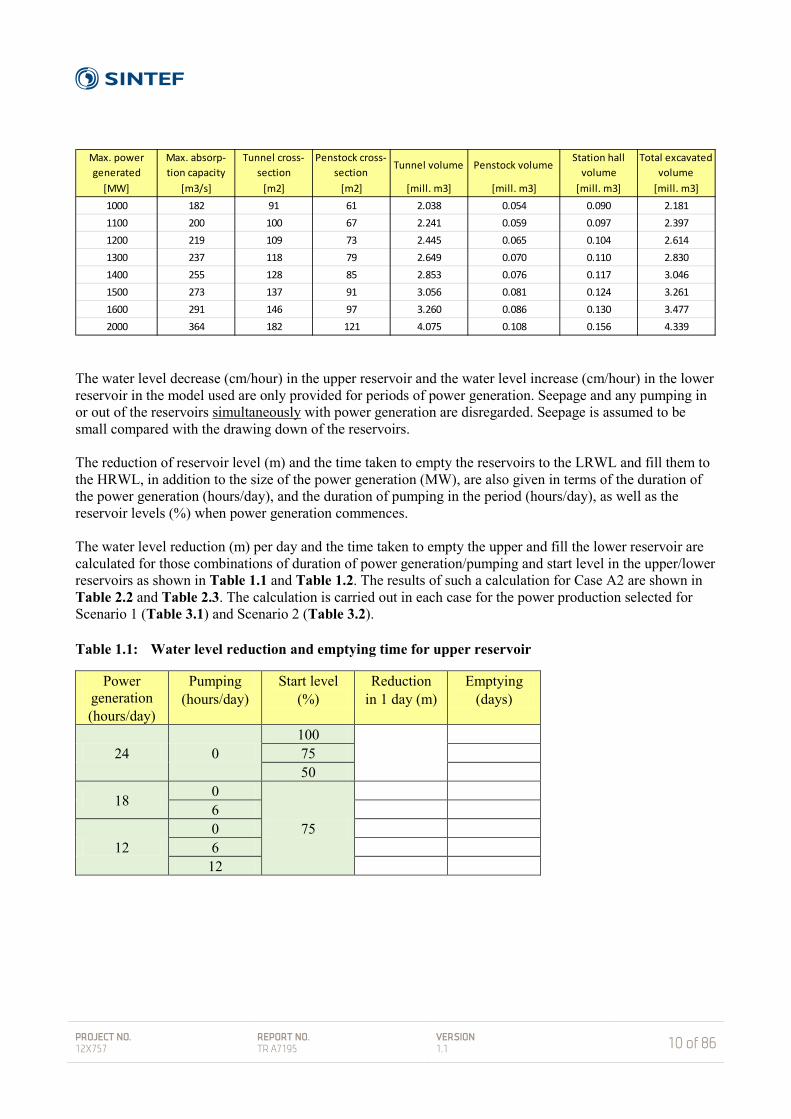
The values in the cells “Power generation at max. power” (hours/day), “Pumping at max. power” (hours/day) and “Start level” (%) are used to calculate “Water level reduction” (metres per 1-3-7 days), as well as the time for “Emptying of upper reservoir” (days) and “Filling of lower reservoir” (days). The lowest part of the spread sheet shows calculations of the volume of the tunnel, penstock and power station hall as a function of designed power output given in the column “Max. power generated” (MW):
Max. power generated
Decrease in water level
Decrease in water level
Decrease in water level
Decrease in water level
Emptying of upper reservoir
Increase in water level
Filling of lower reservoir
[MW] [cm/hour] 1 day [m] 3 days [m] 7 days [m] [days] [cm/hour] [days]1000 11 2.6 7.7 18.0 11.1 2 2.51100 12 2.8 8.4 19.5 10.2 2 2.01200 13 3.0 9.0 21.0 9.5 2 1.71300 13 3.2 9.7 22.5 8.9 3 1.41400 14 3.4 10.3 24.1 8.3 3 1.31500 15 3.7 11.0 25.6 7.8 4 1.11600 16 3.9 11.6 27.1 7.4 4 1.02000 20 4.7 14.2 33.2 6.0 6 0.7
Power station
45 °
Gross pressure head (2/3 res.level)
Distance intake-outlet (horizontal)
PROJECT NO. 12X757
REPORT NO. TR A7195
VERSION 1.1
10 of 86
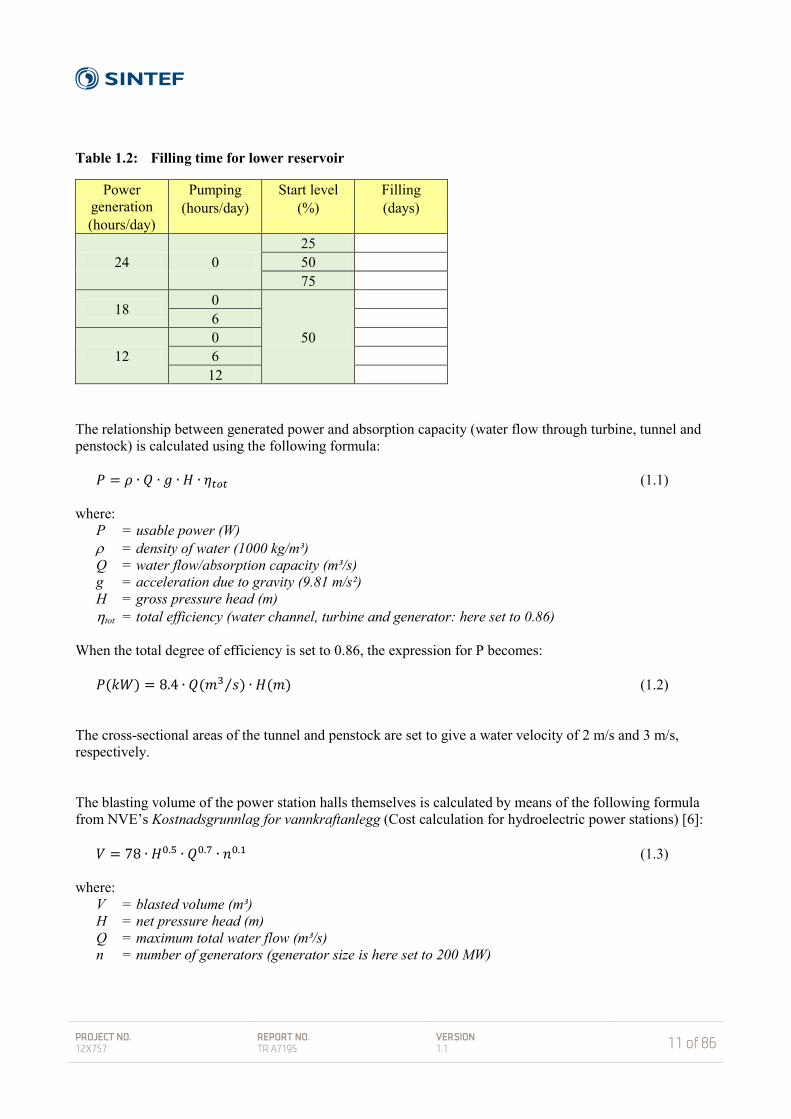
The water level decrease (cm/hour) in the upper reservoir and the water level increase (cm/hour) in the lower reservoir in the model used are only provided for periods of power generation. Seepage and any pumping in or out of the reservoirs simultaneously with power generation are disregarded. Seepage is assumed to be small compared with the drawing down of the reservoirs. The reduction of reservoir level (m) and the time taken to empty the reservoirs to the LRWL and fill them to the HRWL, in addition to the size of the power generation (MW), are also given in terms of the duration of the power generation (hours/day), and the duration of pumping in the period (hours/day), as well as the reservoir levels (%) when power generation commences. The water level reduction (m) per day and the time taken to empty the upper and fill the lower reservoir are calculated for those combinations of duration of power generation/pumping and start level in the upper/lower reservoirs as shown in Table 1.1 and Table 1.2. The results of such a calculation for Case A2 are shown in Table 2.2 and Table 2.3. The calculation is carried out in each case for the power production selected for Scenario 1 (Table 3.1) and Scenario 2 (Table 3.2). Table 1.1: Water level reduction and emptying time for upper reservoir
Power generation (hours/day)
Pumping (hours/day)
Start level (%)
Reduction in 1 day (m)
Emptying (days)
24 0 100
75 50
18 0
75
6
12 0 6 12
Max. power generated
Max. absorp- tion capacity
Tunnel cross-section
Penstock cross-section
Tunnel volume Penstock volumeStation hall
volumeTotal excavated
volume[MW] [m3/s] [m2] [m2] [mill. m3] [mill. m3] [mill. m3] [mill. m3]1000 182 91 61 2.038 0.054 0.090 2.1811100 200 100 67 2.241 0.059 0.097 2.3971200 219 109 73 2.445 0.065 0.104 2.6141300 237 118 79 2.649 0.070 0.110 2.8301400 255 128 85 2.853 0.076 0.117 3.0461500 273 137 91 3.056 0.081 0.124 3.2611600 291 146 97 3.260 0.086 0.130 3.4772000 364 182 121 4.075 0.108 0.156 4.339
PROJECT NO. 12X757
REPORT NO. TR A7195
VERSION 1.1
11 of 86
Table 1.2: Filling time for lower reservoir
Power generation (hours/day)
Pumping (hours/day)
Start level (%)
Filling (days)
24 0 25 50 75
18 0
50
6
12 0 6 12
The relationship between generated power and absorption capacity (water flow through turbine, tunnel and penstock) is calculated using the following formula:
𝑃 = 𝜌 ∙ 𝑄 ∙ 𝑔 ∙ 𝐻 ∙ 𝜂𝑡𝑜𝑡 (1.1) where:
P = usable power (W) ρ = density of water (1000 kg/m³) Q = water flow/absorption capacity (m³/s) g = acceleration due to gravity (9.81 m/s²) H = gross pressure head (m) ηtot = total efficiency (water channel, turbine and generator: here set to 0.86)
When the total degree of efficiency is set to 0.86, the expression for P becomes:
𝑃(𝑘𝑊) = 8.4 ∙ 𝑄(𝑚3 𝑠⁄ ) ∙ 𝐻(𝑚) (1.2) The cross-sectional areas of the tunnel and penstock are set to give a water velocity of 2 m/s and 3 m/s, respectively. The blasting volume of the power station halls themselves is calculated by means of the following formula from NVE’s Kostnadsgrunnlag for vannkraftanlegg (Cost calculation for hydroelectric power stations) [6]:
𝑉 = 78 ∙ 𝐻0.5 ∙ 𝑄0.7 ∙ 𝑛0.1 (1.3) where:
V = blasted volume (m³) H = net pressure head (m) Q = maximum total water flow (m³/s) n = number of generators (generator size is here set to 200 MW)
PROJECT NO. 12X757
REPORT NO. TR A7195
VERSION 1.1
12 of 86
2 Analysis of the selected cases
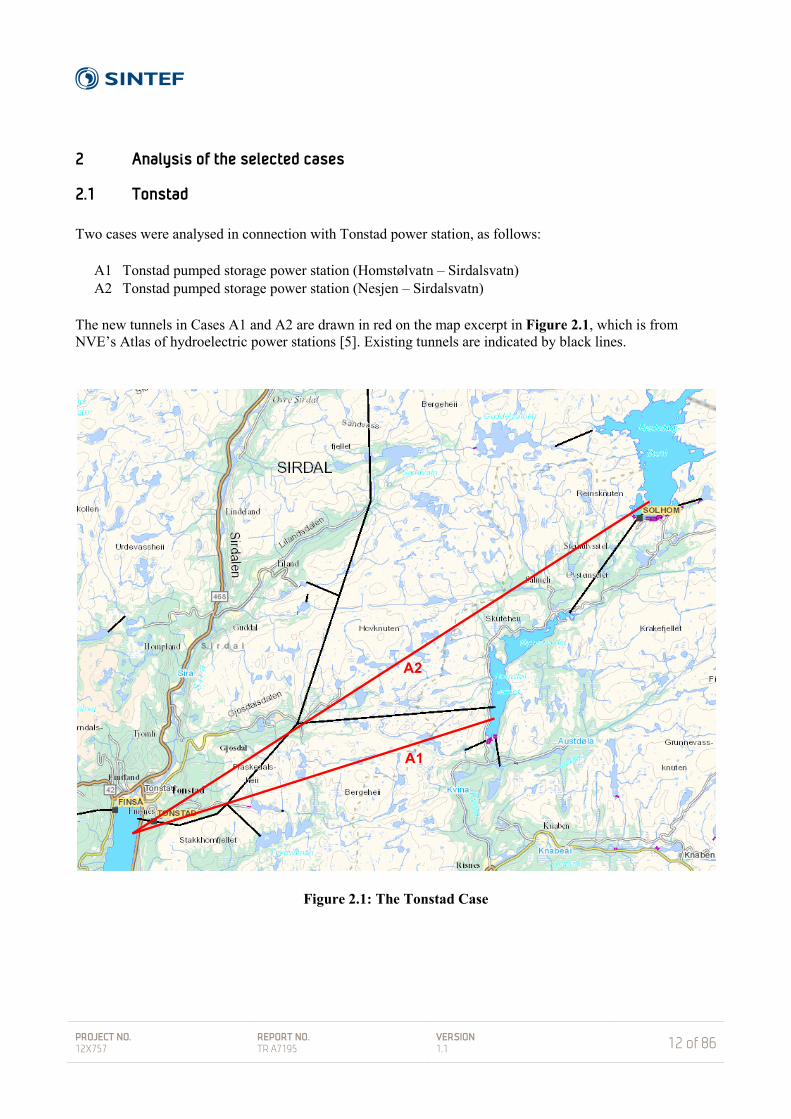
2.1 Tonstad Two cases were analysed in connection with Tonstad power station, as follows: A1 Tonstad pumped storage power station (Homstølvatn – Sirdalsvatn) A2 Tonstad pumped storage power station (Nesjen – Sirdalsvatn) The new tunnels in Cases A1 and A2 are drawn in red on the map excerpt in Figure 2.1, which is from NVE’s Atlas of hydroelectric power stations [5]. Existing tunnels are indicated by black lines.
Figure 2.1: The Tonstad Case
A1
A2

PROJECT NO. 12X757
REPORT NO. TR A7195
VERSION 1.1
13 of 86
The new pumped storage power station, new tunnels and associated reservoirs in Case A1-A2 are shown in Figure 2.2.
Figure 2.2: The Tonstad Case
Kvinen
Tonstad
Tjørom
Pump
Nesjen 275 mill. m3 HRV = 715 LRV = 677
Sirdalsvatn 32 mill. m3 HRV = 50 LRV = 48
Homstølvatn 55 mill. m3 HRV = 498 LRV = 471
Gravatn 340 mill. m3 HRV = 660 LRV = 625
Solhom
Ousdalsvatn 12 mill. m3 HRV = 498 LRV = 482
A1 A2
200 MW
80 MW
120 MW
960 MW
PROJECT NO. 12X757
REPORT NO. TR A7195
VERSION 1.1
14 of 86
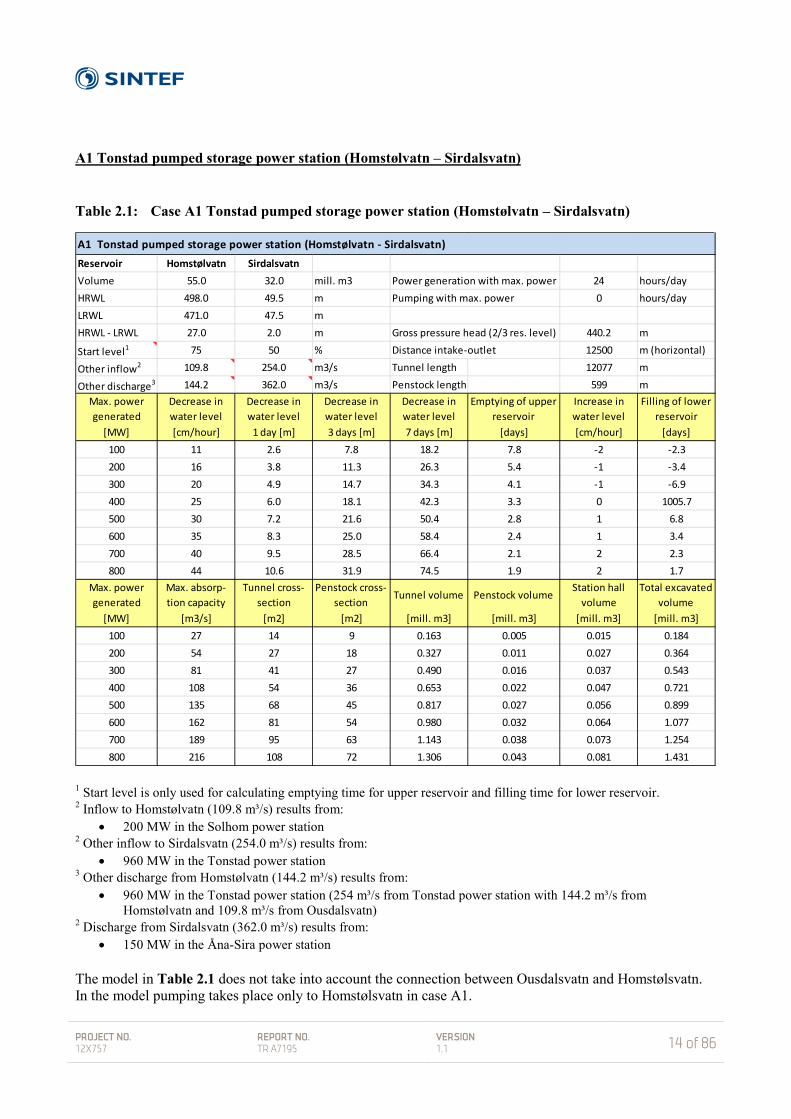
A1 Tonstad pumped storage power station (Homstølvatn – Sirdalsvatn) Table 2.1: Case A1 Tonstad pumped storage power station (Homstølvatn – Sirdalsvatn)
1 Start level is only used for calculating emptying time for upper reservoir and filling time for lower reservoir. 2 Inflow to Homstølvatn (109.8 m³/s) results from:
• 200 MW in the Solhom power station 2 Other inflow to Sirdalsvatn (254.0 m³/s) results from:
• 960 MW in the Tonstad power station 3 Other discharge from Homstølvatn (144.2 m³/s) results from:
• 960 MW in the Tonstad power station (254 m³/s from Tonstad power station with 144.2 m³/s from Homstølvatn and 109.8 m³/s from Ousdalsvatn)
2 Discharge from Sirdalsvatn (362.0 m³/s) results from: • 150 MW in the Åna-Sira power station
The model in Table 2.1 does not take into account the connection between Ousdalsvatn and Homstølsvatn. In the model pumping takes place only to Homstølsvatn in case A1.
A1 Tonstad pumped storage power station (Homstølvatn - Sirdalsvatn)Reservoir Homstølvatn Sirdalsvatn Volume 55.0 32.0 mill. m3 Power generation with max. power 24 hours/dayHRWL 498.0 49.5 m Pumping with max. power 0 hours/dayLRWL 471.0 47.5 m HRWL - LRWL 27.0 2.0 m Gross pressure head (2/3 res. level) 440.2 m
Start level1 75 50 % Distance intake-outlet 12500 m (horizontal)
Other inflow2 109.8 254.0 m3/s Tunnel length 12077 m
Other discharge3 144.2 362.0 m3/s Penstock length 599 mMax. power generated
Decrease in water level
Decrease in water level
Decrease in water level
Decrease in water level
Emptying of upper reservoir
Increase in water level
Filling of lower reservoir
[MW] [cm/hour] 1 day [m] 3 days [m] 7 days [m] [days] [cm/hour] [days]100 11 2.6 7.8 18.2 7.8 -2 -2.3200 16 3.8 11.3 26.3 5.4 -1 -3.4300 20 4.9 14.7 34.3 4.1 -1 -6.9400 25 6.0 18.1 42.3 3.3 0 1005.7500 30 7.2 21.6 50.4 2.8 1 6.8600 35 8.3 25.0 58.4 2.4 1 3.4700 40 9.5 28.5 66.4 2.1 2 2.3800 44 10.6 31.9 74.5 1.9 2 1.7
Max. power generated
Max. absorp- tion capacity
Tunnel cross-section
Penstock cross-section
Tunnel volume Penstock volumeStation hall
volumeTotal excavated
volume[MW] [m3/s] [m2] [m2] [mill. m3] [mill. m3] [mill. m3] [mill. m3]
100 27 14 9 0.163 0.005 0.015 0.184200 54 27 18 0.327 0.011 0.027 0.364300 81 41 27 0.490 0.016 0.037 0.543400 108 54 36 0.653 0.022 0.047 0.721500 135 68 45 0.817 0.027 0.056 0.899600 162 81 54 0.980 0.032 0.064 1.077700 189 95 63 1.143 0.038 0.073 1.254800 216 108 72 1.306 0.043 0.081 1.431

PROJECT NO. 12X757
REPORT NO. TR A7195
VERSION 1.1
15 of 86
Table 2.1 shows the water level decrease in Homstølsvatn (upper reservoir) and water level increase in Sirdalsvatn (lower reservoir) in the event of maximum power generation for 24 hours/day in Tonstad pumped storage power station, when the design power output is 100 – 800 MW. The remaining inflow and discharge for these two reservoirs are indicated by the footnotes to the table. The start levels in the upper and lower reservoirs are 75 % and 50 %, respectively. Table 2.2 shows the water level reduction (m) per day and drawdown time (days) to LRWL for Homstølsvatn when the power generation in Tonstad pumped storage power station is 400 MW. The number of hours/day of power generation and pumping and the start level (%) in Homstølsvatn are varied. Table 2.3 shows the filling time (days) to HRWL for Sirdalsvatn under corresponding conditions. Tabell 2.2: Water level reduction and emptying time for Homstølsvatn when
Tonstad pumped storage power station is generating 400 MW
Power generation (hours/day)
Pumping (hours/day)
Start level (%)
Reduction in 1 day (m)
Emptying (days)
24 0 100
6.0 4.5
75 3.3 50 2.2
18 0
75
4.5 4.5 6 3.3 6.1
12 0 3.0 6.7 6 1.8 11.2 12 0.6 33.5
Tabell 2.3: Filling time for Sirdalsvatn when Tonstad pumped
storage power station is generating 400 MW
Power generation (hours/day)
Pumping (hours/day)
Start level (%)
Filling1
(days)
24 0 25 - 50 - 75 -
18 0
50
- 6 -
12 0 - 6 - 12 -
1With the selected inflow from Tonstad (254 m3/s) and discharge to Åna-Sira (362.0 m3/s) there is little (~ 0 cm/hour) decrease in water level in Sirdalsvatn as consequence of 400 MW generation in Tonstad pumped storage power station (108 m3/s). The filling time up to HRWL is therefore omitted in the table.
PROJECT NO. 12X757
REPORT NO. TR A7195
VERSION 1.1
16 of 86
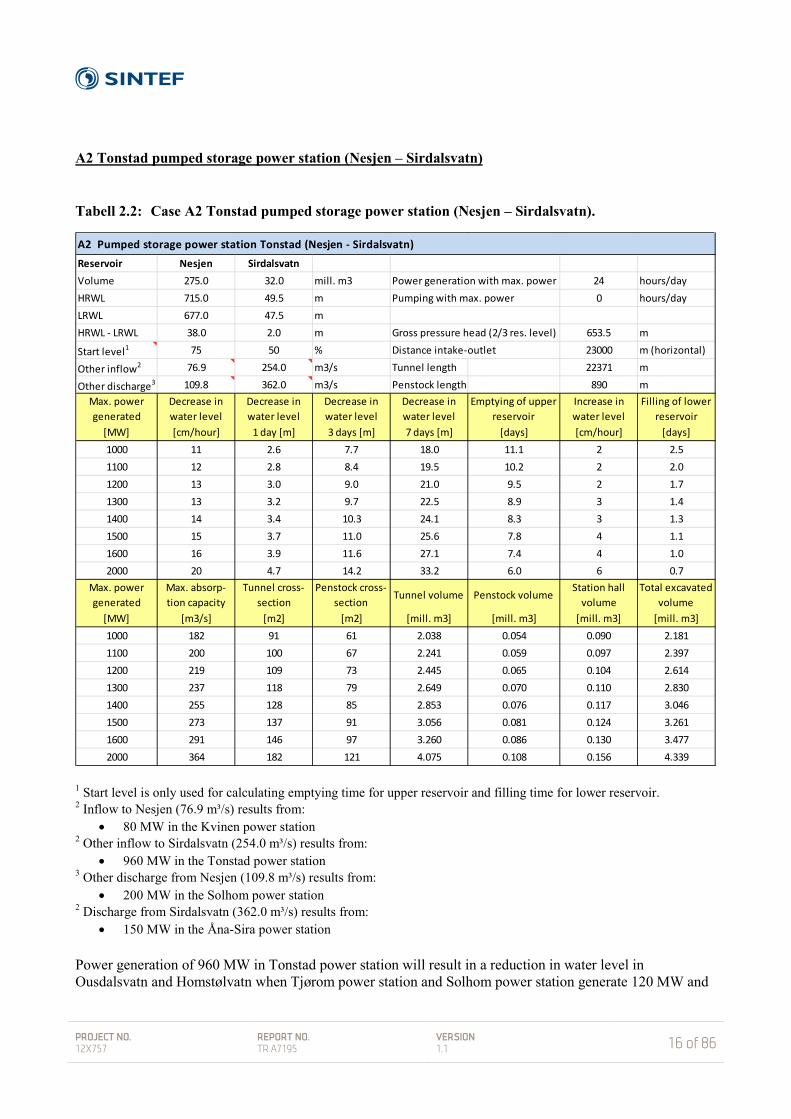
A2 Tonstad pumped storage power station (Nesjen – Sirdalsvatn) Tabell 2.2: Case A2 Tonstad pumped storage power station (Nesjen – Sirdalsvatn).
1 Start level is only used for calculating emptying time for upper reservoir and filling time for lower reservoir. 2 Inflow to Nesjen (76.9 m³/s) results from:
• 80 MW in the Kvinen power station 2 Other inflow to Sirdalsvatn (254.0 m³/s) results from:
• 960 MW in the Tonstad power station 3 Other discharge from Nesjen (109.8 m³/s) results from:
• 200 MW in the Solhom power station 2 Discharge from Sirdalsvatn (362.0 m³/s) results from:
• 150 MW in the Åna-Sira power station Power generation of 960 MW in Tonstad power station will result in a reduction in water level in Ousdalsvatn and Homstølvatn when Tjørom power station and Solhom power station generate 120 MW and
A2 Pumped storage power station Tonstad (Nesjen - Sirdalsvatn)Reservoir Nesjen Sirdalsvatn Volume 275.0 32.0 mill. m3 Power generation with max. power 24 hours/dayHRWL 715.0 49.5 m Pumping with max. power 0 hours/dayLRWL 677.0 47.5 m HRWL - LRWL 38.0 2.0 m Gross pressure head (2/3 res. level) 653.5 m
Start level1 75 50 % Distance intake-outlet 23000 m (horizontal)
Other inflow2 76.9 254.0 m3/s Tunnel length 22371 m
Other discharge3 109.8 362.0 m3/s Penstock length 890 mMax. power generated
Decrease in water level
Decrease in water level
Decrease in water level
Decrease in water level
Emptying of upper reservoir
Increase in water level
Filling of lower reservoir
[MW] [cm/hour] 1 day [m] 3 days [m] 7 days [m] [days] [cm/hour] [days]1000 11 2.6 7.7 18.0 11.1 2 2.51100 12 2.8 8.4 19.5 10.2 2 2.01200 13 3.0 9.0 21.0 9.5 2 1.71300 13 3.2 9.7 22.5 8.9 3 1.41400 14 3.4 10.3 24.1 8.3 3 1.31500 15 3.7 11.0 25.6 7.8 4 1.11600 16 3.9 11.6 27.1 7.4 4 1.02000 20 4.7 14.2 33.2 6.0 6 0.7
Max. power generated
Max. absorp- tion capacity
Tunnel cross-section
Penstock cross-section
Tunnel volume Penstock volumeStation hall
volumeTotal excavated
volume[MW] [m3/s] [m2] [m2] [mill. m3] [mill. m3] [mill. m3] [mill. m3]1000 182 91 61 2.038 0.054 0.090 2.1811100 200 100 67 2.241 0.059 0.097 2.3971200 219 109 73 2.445 0.065 0.104 2.6141300 237 118 79 2.649 0.070 0.110 2.8301400 255 128 85 2.853 0.076 0.117 3.0461500 273 137 91 3.056 0.081 0.124 3.2611600 291 146 97 3.260 0.086 0.130 3.4772000 364 182 121 4.075 0.108 0.156 4.339
PROJECT NO. 12X757
REPORT NO. TR A7195
VERSION 1.1
17 of 86
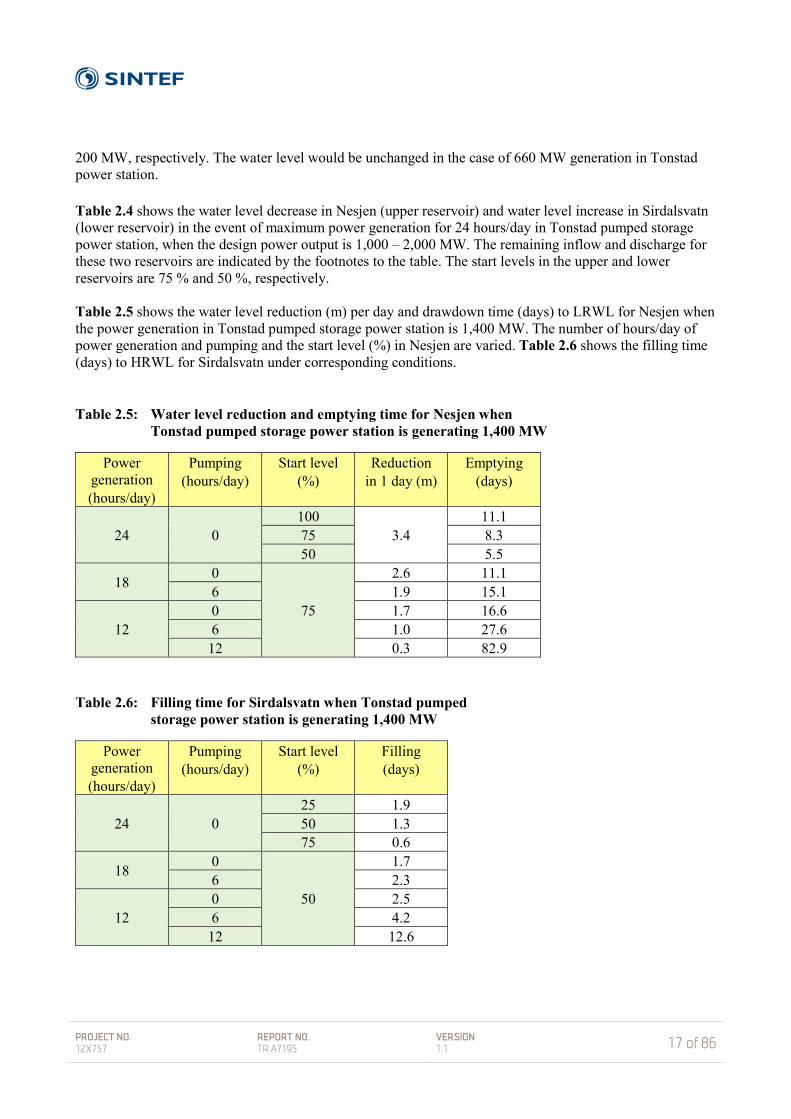
200 MW, respectively. The water level would be unchanged in the case of 660 MW generation in Tonstad power station. Table 2.4 shows the water level decrease in Nesjen (upper reservoir) and water level increase in Sirdalsvatn (lower reservoir) in the event of maximum power generation for 24 hours/day in Tonstad pumped storage power station, when the design power output is 1,000 – 2,000 MW. The remaining inflow and discharge for these two reservoirs are indicated by the footnotes to the table. The start levels in the upper and lower reservoirs are 75 % and 50 %, respectively. Table 2.5 shows the water level reduction (m) per day and drawdown time (days) to LRWL for Nesjen when the power generation in Tonstad pumped storage power station is 1,400 MW. The number of hours/day of power generation and pumping and the start level (%) in Nesjen are varied. Table 2.6 shows the filling time (days) to HRWL for Sirdalsvatn under corresponding conditions. Table 2.5: Water level reduction and emptying time for Nesjen when
Tonstad pumped storage power station is generating 1,400 MW
Power generation (hours/day)
Pumping (hours/day)
Start level (%)
Reduction in 1 day (m)
Emptying (days)
24 0 100
3.4 11.1
75 8.3 50 5.5
18 0
75
2.6 11.1 6 1.9 15.1
12 0 1.7 16.6 6 1.0 27.6 12 0.3 82.9
Table 2.6: Filling time for Sirdalsvatn when Tonstad pumped
storage power station is generating 1,400 MW
Power generation (hours/day)
Pumping (hours/day)
Start level (%)
Filling (days)
24 0 25 1.9 50 1.3 75 0.6
18 0
50
1.7 6 2.3
12 0 2.5 6 4.2 12 12.6
PROJECT NO. 12X757
REPORT NO. TR A7195
VERSION 1.1
18 of 86
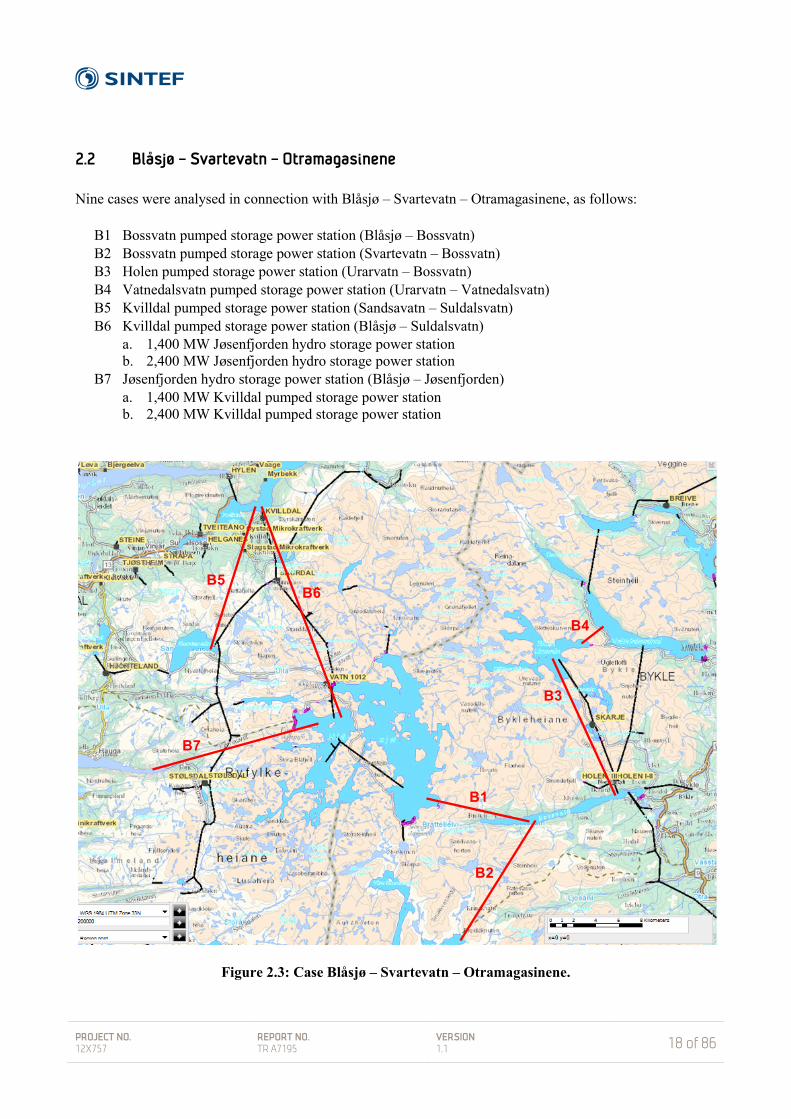
2.2 Blåsjø – Svartevatn – Otramagasinene Nine cases were analysed in connection with Blåsjø – Svartevatn – Otramagasinene, as follows:
B1 Bossvatn pumped storage power station (Blåsjø – Bossvatn) B2 Bossvatn pumped storage power station (Svartevatn – Bossvatn) B3 Holen pumped storage power station (Urarvatn – Bossvatn) B4 Vatnedalsvatn pumped storage power station (Urarvatn – Vatnedalsvatn) B5 Kvilldal pumped storage power station (Sandsavatn – Suldalsvatn) B6 Kvilldal pumped storage power station (Blåsjø – Suldalsvatn)
a. 1,400 MW Jøsenfjorden hydro storage power station b. 2,400 MW Jøsenfjorden hydro storage power station
B7 Jøsenfjorden hydro storage power station (Blåsjø – Jøsenfjorden) a. 1,400 MW Kvilldal pumped storage power station b. 2,400 MW Kvilldal pumped storage power station
Figure 2.3: Case Blåsjø – Svartevatn – Otramagasinene.
B1
B2
B3
B4
B5B6
B7

PROJECT NO. 12X757
REPORT NO. TR A7195
VERSION 1.1
19 of 86
The new tunnels in case B1 – B7 are drawn in red on the map excerpt in Figure 2.3, which is from NVE’s Atlas of hydroelectric power stations [5]. Existing tunnels are indicated by black lines. The new hydro storage and pumped storage power stations, new tunnels and associated reservoirs in cases B1-B6 are illustrated in Figure 2.4.
Figure 2.4: Case Blåsjø – Svartevatn – Otramagasinene.
Pumping in Kvilldal pumped storage power station from Suldalsvatn to Blåsjø in case B6 must be carried out in two steps because of the large difference in elevation (gross pressure head of 945 m). The decrease in water level in Blåsjø in case B1, B6 and B7 includes discharge to Sandsavatn due to 640 MW power generation in Saurdal power station. Case B6 and B7 could also realised with zero generation in Saurdal power station as discharge there, which corresponds to 640 MW, would result in more power if the water was used in Kvilldal pumped storage power station (B6) and Jøsenfjorden hydro storage power station (B7) due to larger head.
Pumpe
Pumpe Holen 3 Holen1-2
HylenKvilldal
Saurdal
sjø
Blåsjø3105 mill. m3HRV = 1055LRV = 930
Bossvatn296 mill. m3HRV = 551LRV = 495
Urarvatn253 mill. m3HRV = 1175LRV = 1141
Svartevatn1398 mill. m3HRV = 899LRV = 780
Suldalsvatn44 mill. m3HRV = 69LRV = 67
Vatnedalsvatn1150 mill. m3HRV = 840LRV = 700
Sandsavatn228 mill. m3HRV = 605LRV = 560
Gravatn+
Tjørom kraftverk
Hylsfjorden
Eff.verk sjø
JøsenfjordenPumpe
B1
230 MW
B2
B3 B4
B5 B6B7
160 MW
640 MW
160 MW
1240 MW
PROJECT NO. 12X757
REPORT NO. TR A7195
VERSION 1.1
20 of 86
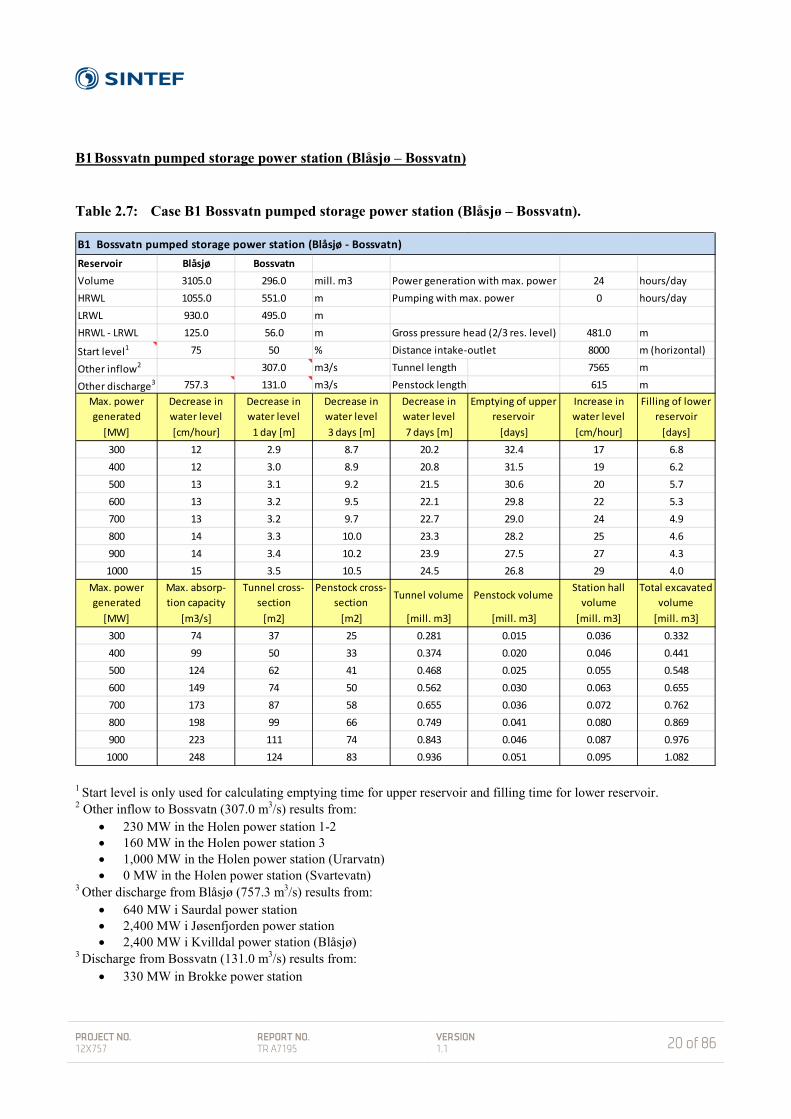
B1 Bossvatn pumped storage power station (Blåsjø – Bossvatn) Table 2.7: Case B1 Bossvatn pumped storage power station (Blåsjø – Bossvatn).
1 Start level is only used for calculating emptying time for upper reservoir and filling time for lower reservoir. 2 Other inflow to Bossvatn (307.0 m3/s) results from:
• 230 MW in the Holen power station 1-2 • 160 MW in the Holen power station 3 • 1,000 MW in the Holen power station (Urarvatn) • 0 MW in the Holen power station (Svartevatn)
3 Other discharge from Blåsjø (757.3 m3/s) results from: • 640 MW i Saurdal power station • 2,400 MW i Jøsenfjorden power station • 2,400 MW i Kvilldal power station (Blåsjø)
3 Discharge from Bossvatn (131.0 m3/s) results from: • 330 MW in Brokke power station
B1 Bossvatn pumped storage power station (Blåsjø - Bossvatn)Reservoir Blåsjø Bossvatn Volume 3105.0 296.0 mill. m3 Power generation with max. power 24 hours/dayHRWL 1055.0 551.0 m Pumping with max. power 0 hours/dayLRWL 930.0 495.0 m HRWL - LRWL 125.0 56.0 m Gross pressure head (2/3 res. level) 481.0 m
Start level1 75 50 % Distance intake-outlet 8000 m (horizontal)
Other inflow2 307.0 m3/s Tunnel length 7565 m
Other discharge3 757.3 131.0 m3/s Penstock length 615 mMax. power generated
Decrease in water level
Decrease in water level
Decrease in water level
Decrease in water level
Emptying of upper reservoir
Increase in water level
Filling of lower reservoir
[MW] [cm/hour] 1 day [m] 3 days [m] 7 days [m] [days] [cm/hour] [days]300 12 2.9 8.7 20.2 32.4 17 6.8400 12 3.0 8.9 20.8 31.5 19 6.2500 13 3.1 9.2 21.5 30.6 20 5.7600 13 3.2 9.5 22.1 29.8 22 5.3700 13 3.2 9.7 22.7 29.0 24 4.9800 14 3.3 10.0 23.3 28.2 25 4.6900 14 3.4 10.2 23.9 27.5 27 4.31000 15 3.5 10.5 24.5 26.8 29 4.0
Max. power generated
Max. absorp- tion capacity
Tunnel cross-section
Penstock cross-section
Tunnel volume Penstock volumeStation hall
volumeTotal excavated
volume[MW] [m3/s] [m2] [m2] [mill. m3] [mill. m3] [mill. m3] [mill. m3]
300 74 37 25 0.281 0.015 0.036 0.332400 99 50 33 0.374 0.020 0.046 0.441500 124 62 41 0.468 0.025 0.055 0.548600 149 74 50 0.562 0.030 0.063 0.655700 173 87 58 0.655 0.036 0.072 0.762800 198 99 66 0.749 0.041 0.080 0.869900 223 111 74 0.843 0.046 0.087 0.9761000 248 124 83 0.936 0.051 0.095 1.082

PROJECT NO. 12X757
REPORT NO. TR A7195
VERSION 1.1
21 of 86
Table 2.7 shows the water level decrease in Blåsjø (upper reservoir) and water level increase in Bossvatn (lower reservoir) in the event of maximum power generation for 24 hours/day in Bossvatn pumped storage power station, when the design power output is 300 – 1,000 MW. The remaining inflow and discharge for these two reservoirs are indicated by the footnotes to the table. The start levels in the upper and lower reservoirs are 75 % and 50 %, respectively. Table 2.8 shows the water level reduction (m) per day and drawdown time (days) to LRWL for Blåsjø when the power generation in Bossvatn pumped storage power station is 700 MW. The number of hours/day of power generation and pumping and the start level (%) in Blåsjø are varied. Table 2.9 shows the filling time (days) to HRWL for Bossvatn under corresponding conditions. Table 2.3: Water level reduction and emptying time for Blåsjø when
Bossvatn pumped storage power station is generating 700 MW
Power generation (hours/day)
Pumping (hours/day)
Start level (%)
Reduction in 1 day (m)
Emptying (days)
24 0 100
3.2 38.6
75 29.0 50 19.3
18 0
75
2.4 38.6 6 1.8 52.7
12 0 1.6 57.9 6 1.0 96.5 12 0.3 289.6
Table 2.4: Filling time for Bossvatn when Bossvatn pumped
storage power station is generating 700 MW
Power generation (hours/day)
Pumping (hours/day)
Start level (%)
Filling (days)
24 0 25 7.4 50 4.9 75 2.5
18 0
50
6.5 6 8.9
12 0 9.8 6 16.3 12 49.0
PROJECT NO. 12X757
REPORT NO. TR A7195
VERSION 1.1
22 of 86
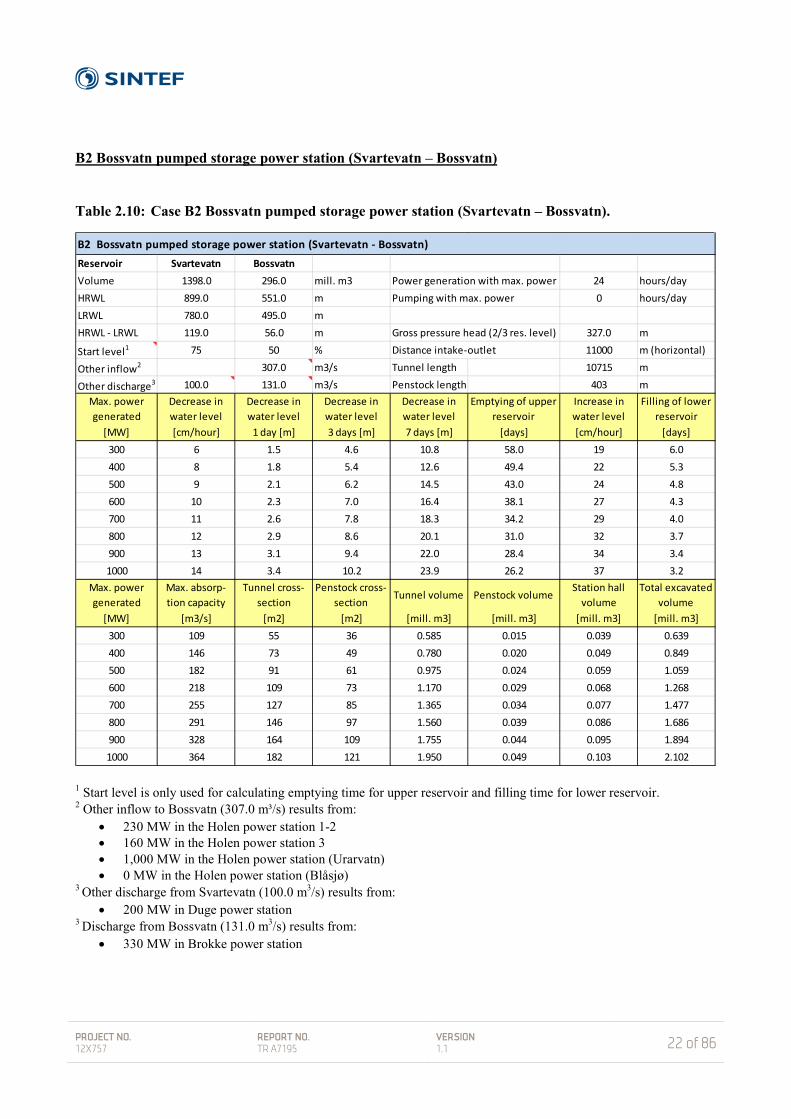
B2 Bossvatn pumped storage power station (Svartevatn – Bossvatn) Table 2.10: Case B2 Bossvatn pumped storage power station (Svartevatn – Bossvatn).
1 Start level is only used for calculating emptying time for upper reservoir and filling time for lower reservoir. 2 Other inflow to Bossvatn (307.0 m³/s) results from:
• 230 MW in the Holen power station 1-2 • 160 MW in the Holen power station 3 • 1,000 MW in the Holen power station (Urarvatn) • 0 MW in the Holen power station (Blåsjø)
3 Other discharge from Svartevatn (100.0 m3/s) results from: • 200 MW in Duge power station
3 Discharge from Bossvatn (131.0 m3/s) results from: • 330 MW in Brokke power station
B2 Bossvatn pumped storage power station (Svartevatn - Bossvatn)Reservoir Svartevatn Bossvatn Volume 1398.0 296.0 mill. m3 Power generation with max. power 24 hours/dayHRWL 899.0 551.0 m Pumping with max. power 0 hours/dayLRWL 780.0 495.0 m HRWL - LRWL 119.0 56.0 m Gross pressure head (2/3 res. level) 327.0 m
Start level1 75 50 % Distance intake-outlet 11000 m (horizontal)
Other inflow2 307.0 m3/s Tunnel length 10715 m
Other discharge3 100.0 131.0 m3/s Penstock length 403 mMax. power generated
Decrease in water level
Decrease in water level
Decrease in water level
Decrease in water level
Emptying of upper reservoir
Increase in water level
Filling of lower reservoir
[MW] [cm/hour] 1 day [m] 3 days [m] 7 days [m] [days] [cm/hour] [days]300 6 1.5 4.6 10.8 58.0 19 6.0400 8 1.8 5.4 12.6 49.4 22 5.3500 9 2.1 6.2 14.5 43.0 24 4.8600 10 2.3 7.0 16.4 38.1 27 4.3700 11 2.6 7.8 18.3 34.2 29 4.0800 12 2.9 8.6 20.1 31.0 32 3.7900 13 3.1 9.4 22.0 28.4 34 3.41000 14 3.4 10.2 23.9 26.2 37 3.2
Max. power generated
Max. absorp- tion capacity
Tunnel cross-section
Penstock cross-section
Tunnel volume Penstock volumeStation hall
volumeTotal excavated
volume[MW] [m3/s] [m2] [m2] [mill. m3] [mill. m3] [mill. m3] [mill. m3]
300 109 55 36 0.585 0.015 0.039 0.639400 146 73 49 0.780 0.020 0.049 0.849500 182 91 61 0.975 0.024 0.059 1.059600 218 109 73 1.170 0.029 0.068 1.268700 255 127 85 1.365 0.034 0.077 1.477800 291 146 97 1.560 0.039 0.086 1.686900 328 164 109 1.755 0.044 0.095 1.8941000 364 182 121 1.950 0.049 0.103 2.102

PROJECT NO. 12X757
REPORT NO. TR A7195
VERSION 1.1
23 of 86
Table 2.10 shows the water level decrease in Svartevatn (upper reservoir) and water level increase in Bossvatn (lower reservoir) in the event of maximum power generation for 24 hours/day in Bossvatn pumped storage power station, when the design power output is 300 – 1,000 MW. The remaining inflow and discharge for these two reservoirs are indicated by the footnotes to the table. The start levels in the upper and lower reservoirs are 75 % and 50 %, respectively. Table 2.11 shows the water level reduction (m) per day and drawdown time (days) to LRWL for Svartevatn when the power generation in Bossvatn pumped storage power station is 700 MW. The number of hours/day of power generation and pumping and the start level (%) in Svartevatn are varied. Table 2.12 shows the filling time (days) to HRWL for Bossvatn under corresponding conditions. Table 2.5: Water level reduction and emptying time for Svartevatn when
Bossvatn pumped storage power station is generating 700 MW
Power generation (hours/day)
Pumping (hours/day)
Start level (%)
Reduction in 1 day (m)
Emptying (days)
24 0 100
2.6 45.6
75 34.2 50 22.8
18 0
75
2.0 45.6 6 1.4 62.2
12 0 1.3 68.4 6 0.8 114.0 12 0.3 342.0
Table 2.6: Filling time for Bossvatn when Bossvatn pumped
storage power station is generating 700 MW
Power generation (hours/day)
Pumping (hours/day)
Start level (%)
Filling (days)
24 0 25 6.0 50 4.0 75 2.0
18 0
50
5.3 6 7.2
12 0 8.0 6 13.3 12 39.8
PROJECT NO. 12X757
REPORT NO. TR A7195
VERSION 1.1
24 of 86
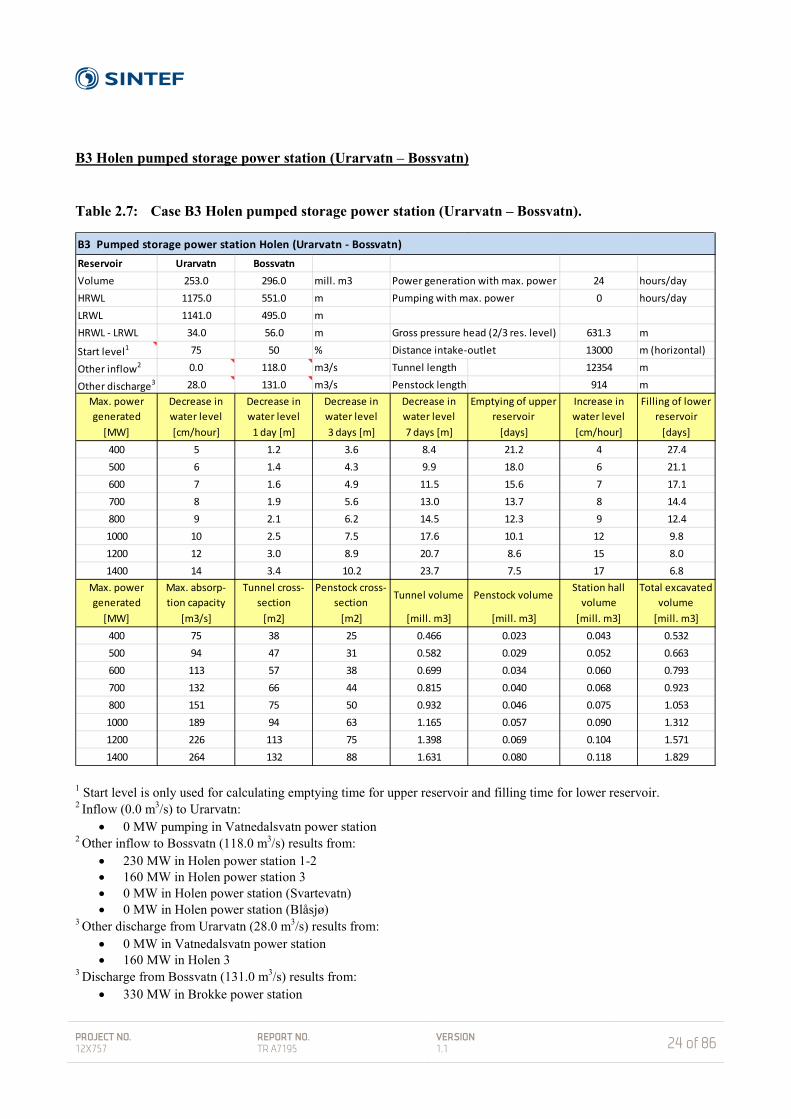
B3 Holen pumped storage power station (Urarvatn – Bossvatn) Table 2.7: Case B3 Holen pumped storage power station (Urarvatn – Bossvatn).
1 Start level is only used for calculating emptying time for upper reservoir and filling time for lower reservoir. 2 Inflow (0.0 m3/s) to Urarvatn:
• 0 MW pumping in Vatnedalsvatn power station 2 Other inflow to Bossvatn (118.0 m3/s) results from:
• 230 MW in Holen power station 1-2 • 160 MW in Holen power station 3 • 0 MW in Holen power station (Svartevatn) • 0 MW in Holen power station (Blåsjø)
3 Other discharge from Urarvatn (28.0 m3/s) results from: • 0 MW in Vatnedalsvatn power station • 160 MW in Holen 3
3 Discharge from Bossvatn (131.0 m3/s) results from: • 330 MW in Brokke power station
B3 Pumped storage power station Holen (Urarvatn - Bossvatn)Reservoir Urarvatn Bossvatn Volume 253.0 296.0 mill. m3 Power generation with max. power 24 hours/dayHRWL 1175.0 551.0 m Pumping with max. power 0 hours/dayLRWL 1141.0 495.0 m HRWL - LRWL 34.0 56.0 m Gross pressure head (2/3 res. level) 631.3 m
Start level1 75 50 % Distance intake-outlet 13000 m (horizontal)
Other inflow2 0.0 118.0 m3/s Tunnel length 12354 m
Other discharge3 28.0 131.0 m3/s Penstock length 914 mMax. power generated
Decrease in water level
Decrease in water level
Decrease in water level
Decrease in water level
Emptying of upper reservoir
Increase in water level
Filling of lower reservoir
[MW] [cm/hour] 1 day [m] 3 days [m] 7 days [m] [days] [cm/hour] [days]400 5 1.2 3.6 8.4 21.2 4 27.4500 6 1.4 4.3 9.9 18.0 6 21.1600 7 1.6 4.9 11.5 15.6 7 17.1700 8 1.9 5.6 13.0 13.7 8 14.4800 9 2.1 6.2 14.5 12.3 9 12.41000 10 2.5 7.5 17.6 10.1 12 9.81200 12 3.0 8.9 20.7 8.6 15 8.01400 14 3.4 10.2 23.7 7.5 17 6.8
Max. power generated
Max. absorp- tion capacity
Tunnel cross-section
Penstock cross-section
Tunnel volume Penstock volumeStation hall
volumeTotal excavated
volume[MW] [m3/s] [m2] [m2] [mill. m3] [mill. m3] [mill. m3] [mill. m3]
400 75 38 25 0.466 0.023 0.043 0.532500 94 47 31 0.582 0.029 0.052 0.663600 113 57 38 0.699 0.034 0.060 0.793700 132 66 44 0.815 0.040 0.068 0.923800 151 75 50 0.932 0.046 0.075 1.0531000 189 94 63 1.165 0.057 0.090 1.3121200 226 113 75 1.398 0.069 0.104 1.5711400 264 132 88 1.631 0.080 0.118 1.829

PROJECT NO. 12X757
REPORT NO. TR A7195
VERSION 1.1
25 of 86
Table 2.13 shows the water level decrease in Urarvatn (upper reservoir) and water level increase in Bossvatn (lower reservoir) in the event of maximum power generation for 24 hours/day in Holen pumped storage power station, when the design power output is 400 – 1,400 MW. The remaining inflow and discharge for these two reservoirs are indicated by the footnotes to the table. The start levels in the upper and lower reservoirs are 75 % and 50 %, respectively. Table 2.14 shows the water level reduction (m) per day and drawdown time (days) to LRWL for Urarvatn when the power generation in Holen pumped storage power station is 700 MW. The number of hours/day of power generation and pumping and the start level (%) in Urarvatn are varied. Table 2.15 shows the filling time (days) to HRWL for Bossvatn under corresponding conditions. Table 2.14: Water level reduction and emptying time for Urarvatn when
Holen pumped storage power station is generating 700 MW
Power generation (hours/day)
Pumping (hours/day)
Start level (%)
Reduction in 1 day (m)
Emptying (days)
24 0 100
1.9 18.3
75 13.7 50 9.2
18 0
75
1.4 18.3 6 1.0 25.0
12 0 0.9 27.5 6 0.6 45.8 12 0.2 137.3
Table 2.8: Filling time for Bossvatn when Holen pumped
storage power station is generating 700 MW
Power generation (hours/day)
Pumping (hours/day)
Start level (%)
Filling (days)
24 0 25 21.6 50 14.4 75 7.2
18 0
50
19.2 6 26.2
12 0 28.8 6 48.0 12 143.9

PROJECT NO. 12X757
REPORT NO. TR A7195
VERSION 1.1
26 of 86
B4 Vatnedalsvatn pumped storage power station (Urarvatn – Vatnedalsvatn) Table 2.9: Case B4 Vatnedalsvatn pumped storage power station (Urarvatn – Vatnedalsvatn).
1 Start level is only used for calculating emptying time for upper reservoir and filling time for lower reservoir. 2 Other inflow to Urarvatn og Vatnedalsvatn: 0.0 m3/s 3 Other discharge from Urarvatn (217.0 m3/s) results from:
• 160 MW in Holen power station 3 • 1,000 MW in Holen power station (Urarvatn)
3 Discharge from Vatnedalsvatn power station (90.0 m3/s) results from: • 230 MW in Holen power station 1-2
B4 Vatnedalsvatn pumped storage power station (Urarvatn - Vatnedalsvatn)Reservoir Urarvatn Vatnedalsvatn Volume 253.0 1150.0 mill. m3 Power generation with max. power 24 hours/dayHRWL 1175.0 840.0 m Pumping with max. power 0 hours/dayLRWL 1141.0 700.0 m HRWL - LRWL 34.0 140.0 m Gross pressure head (2/3 res. level) 370.3 m
Start level1 75 50 % Distance intake-outlet 4700 m (horizontal)
Other inflow2 m3/s Tunnel length 4259 m
Other discharge3 217.0 90.0 m3/s Penstock length 624 mMax. power generated
Decrease in water level
Decrease in water level
Decrease in water level
Decrease in water level
Emptying of upper reservoir
Increase in water level
Filling of lower reservoir
[MW] [cm/hour] 1 day [m] 3 days [m] 7 days [m] [days] [cm/hour] [days]100 12 2.9 8.7 20.2 8.8 -3 -115.0200 14 3.3 9.8 22.9 7.8 -1 -258.9300 15 3.6 10.9 25.5 7.0 0 1033.7400 17 4.0 12.0 28.1 6.4 2 172.5500 18 4.4 13.2 30.7 5.8 3 94.1600 20 4.8 14.3 33.3 5.4 5 64.7700 21 5.1 15.4 35.9 5.0 6 49.3800 23 5.5 16.5 38.5 4.6 7 39.8
Max. power generated
Max. absorp- tion capacity
Tunnel cross-section
Penstock cross-section
Tunnel volume Penstock volumeStation hall
volumeTotal excavated
volume[MW] [m3/s] [m2] [m2] [mill. m3] [mill. m3] [mill. m3] [mill. m3]
100 32 16 11 0.068 0.007 0.016 0.091200 64 32 21 0.137 0.013 0.028 0.178300 96 48 32 0.205 0.020 0.038 0.264400 129 64 43 0.274 0.027 0.048 0.349500 161 80 54 0.342 0.033 0.058 0.433600 193 96 64 0.411 0.040 0.067 0.517700 225 113 75 0.479 0.047 0.075 0.601800 257 129 86 0.548 0.053 0.084 0.685

PROJECT NO. 12X757
REPORT NO. TR A7195
VERSION 1.1
27 of 86
Table 2.16 shows the water level decrease in Urarvatn (upper reservoir) and water level increase in Vatnedalsvatn (lower reservoir) in the event of maximum power generation for 24 hours/day in Vatnedalsvatn pumped storage power station, when the design power output is 100 – 800 MW. The remaining inflow and discharge for these two reservoirs are indicated by the footnotes to the table. The start levels in the upper and lower reservoirs are 75 % and 50 %, respectively. Table 2.17 shows the water level reduction (m) per day and drawdown time (days) to LRWL for Urarvatn when the power generation in Vatnedalsvatn pumped storage power station is 400 MW. The number of hours/day of power generation and pumping and the start level (%) in Urarvatn are varied. Table 2.18 shows the filling time (days) to HRWL for Vatnedalsvatn under corresponding conditions. Tabell 2.10: Water level reduction and emptying time for Urarvatn when
Vatnedalsvatn pumped storage power station is generating 400 MW
Power
generation (hours/day)
Pumping (hours/day)
Start level (%)
Reduction in 1 day (m)
Emptying (days)
24 0 100
4.0 8.5
75 6.4 50 4.2
18 0
75
3.0 8.5 6 2.2 11.6
12 0 2.0 12.7 6 1.2 21.2 12 0.4 63.5
Tabell 2.11: Filling time for Bossvatn when Vatnedalsvatn pumped
storage power station is generating 400 MW
Power generation (hours/day)
Pumping (hours/day)
Start level (%)
Filling (days)
24 0 25 258.7 50 172.5 75 86.2
18 0
50
230.0 6 313.6
12 0 345.0 6 574.9 12 1724.8

PROJECT NO. 12X757
REPORT NO. TR A7195
VERSION 1.1
28 of 86
B5 Kvilldal pumped storage power station (Sandsavatn – Suldalsvatn) Table 2.12: Case B5 Kvilldal pumped storage power station (Sandsavatn – Suldalsvatn).
1 Start level is only used for calculating emptying time for upper reservoir and filling time for lower reservoir. 2 Inflow to Sandsavatn (173.3 m3/s) results from:
• 640 MW in Saurdal power station 2 Other inflow to Suldalsvatn (656.9 m3/s) results from:
• 1,240 MW in Kvilldal power station • 2,400 MW in Kvilldal power station (Blåsjø) • 160 MW in Suldal power station 1 • 150 MW in Suldal power station 2
3 Other discharge from Sandsavatn (263.0 m3/s) results from: • 1,240 MW in Kvilldal power station
3 Discharge from Suldalsvatn (269.0 m3/s) results from: • 160 MW in Hylen power station
B5 Kvilldal pumped storage power station (Sandsavatn - Suldalsvatn)Reservoir Sandsavatn Suldalsvatn Volume 228.0 44.0 mill. m3 Power generation with max. power 24 hours/dayHRWL 605.0 69.0 m Pumping with max. power 0 hours/dayLRWL 560.0 67.0 m HRWL - LRWL 45.0 2.0 m Gross pressure head (2/3 res. level) 521.7 m
Start level1 75 50 % Distance intake-outlet 3900 m (horizontal)
Other inflow2 173.3 656.9 m3/s Tunnel length 3407 m
Other discharge3 263.0 269.0 m3/s Penstock length 697 mMax. power generated
Decrease in water level
Decrease in water level
Decrease in water level
Decrease in water level
Emptying of upper reservoir
Increase in water level
Filling of lower reservoir
[MW] [cm/hour] 1 day [m] 3 days [m] 7 days [m] [days] [cm/hour] [days]300 11 2.7 8.1 18.9 12.5 7 0.6400 13 3.1 9.3 21.6 10.9 8 0.5500 14 3.5 10.4 24.3 9.7 8 0.5600 16 3.9 11.6 27.1 8.7 9 0.5700 18 4.3 12.8 29.8 7.9 9 0.5800 19 4.6 13.9 32.5 7.3 9 0.4900 21 5.0 15.1 35.2 6.7 10 0.41000 23 5.4 16.3 37.9 6.2 10 0.4
Max. power generated
Max. absorp- tion capacity
Tunnel cross-section
Penstock cross-section
Tunnel volume Penstock volumeStation hall
volumeTotal excavated
volume[MW] [m3/s] [m2] [m2] [mill. m3] [mill. m3] [mill. m3] [mill. m3]
300 68 34 23 0.117 0.016 0.036 0.168400 91 46 30 0.155 0.021 0.045 0.222500 114 57 38 0.194 0.027 0.054 0.275600 137 68 46 0.233 0.032 0.062 0.327700 160 80 53 0.272 0.037 0.070 0.380800 183 91 61 0.311 0.042 0.078 0.432900 205 103 68 0.350 0.048 0.086 0.4841000 228 114 76 0.389 0.053 0.094 0.535

PROJECT NO. 12X757
REPORT NO. TR A7195
VERSION 1.1
29 of 86
Table 2.19 shows the water level decrease in Sandsavatn (upper reservoir) and water level increase in Suldalsvatn (lower reservoir) in the event of maximum power generation for 24 hours/day in Kvilldal pumped storage power station, when the design power output is 300 – 1,000 MW. The remaining inflow and discharge for these two reservoirs are indicated by the footnotes to the table. The start levels in the upper and lower reservoirs are 75 % and 50 %, respectively. Table 2.20 shows the water level reduction (m) per day and drawdown time (days) to LRWL for Sandsavatn when the power generation in Kvilldal pumped storage power station is 500 MW. The number of hours/day of power generation and pumping and the start level (%) in Sandsavatn are varied. Table 2.21 shows the filling time (days) to HRWL for Suldalsvatn under corresponding conditions. Table 2.13: Water level reduction and emptying time for Sandsavatn when
Kvilldal pumped storage power station is generating 500 MW
Power generation (hours/day)
Pumping (hours/day)
Start level (%)
Reduction in 1 day (m)
Emptying (days)
24 0 100
3.5 12.9
75 9.7 50 6.5
18 0
75
2.6 12.9 6 1.9 17.7
12 0 1.7 19.4 6 1.0 32.4 12 0.3 97.1
Table 2.14: Filling time for Suldalsvatn when Kvilldal pumped
storage power station is generating 500 MW
Power generation (hours/day)
Pumping (hours/day)
Start level (%)
Filling (days)
24 0 25 0.8 50 0.5 75 0.3
18 0
50
0.7 6 0.9
12 0 1.0 6 1.7 12 5.1

PROJECT NO. 12X757
REPORT NO. TR A7195
VERSION 1.1
30 of 86
B6a Kvilldal pumped storage power station (Blåsjø – Suldalsvatn) Table 2.15: Case B6a Kvilldal pumped storage power station (Blåsjø – Suldalsvatn).
1 Start level is only used for calculating emptying time for upper reservoir and filling time for lower reservoir. 2 Other inflow to Suldalsvatn (354.9 m3/s) results from:
• 1,240 MW in Kvilldal • 0 MW in Kvilldal power station (Sandsavatn) • 160 MW in Suldal power station 1 • 150 MW in Suldal power station 2
3 Other discharge from Blåsjø (337.3 m3/s) results from: • 640 MW in Saurdal power station • 1,400 MW in power station in Jøsenfjorden • 0 MW in Holen power station
3 Discharge from Suldalsvatn (269.0 m3/s) results from: • 160 MW in Hylen power station
B6a Pumped storage power station Kvilldal (Blåsjø - Suldalsvatn), 1 400 MW in hydro storage power station JøsenfjordenReservoir Blåsjø Suldalsvatn Volume 3105.0 44.0 mill. m3 Power generation with max. power 24 hours/dayHRWL 1055.0 69.0 m Pumping with max. power 0 hours/dayLRWL 930.0 67.0 m HRWL - LRWL 125.0 2.0 m Gross pressure head (2/3 res. level) 945.0 m
Start level1 75 50 % Distance intake-outlet 20000 m (horizontal)
Other inflow2 354.9 m3/s Tunnel length 19137 m
Other discharge3 337.3 269.0 m3/s Penstock length 1220 mMax. power generated
Decrease in water level
Decrease in water level
Decrease in water level
Decrease in water level
Emptying of upper reservoir
Increase in water level
Filling of lower reservoir
[MW] [cm/hour] 1 day [m] 3 days [m] 7 days [m] [days] [cm/hour] [days]1000 7 1.6 4.8 11.3 58.2 3 1.21200 7 1.7 5.1 11.9 55.2 4 1.11400 7 1.8 5.4 12.5 52.5 4 1.01600 8 1.9 5.6 13.1 50.0 5 0.91800 8 2.0 5.9 13.7 47.8 5 0.82000 9 2.0 6.1 14.3 45.7 6 0.82200 9 2.1 6.4 15.0 43.9 6 0.72400 9 2.2 6.7 15.6 42.1 6 0.7
Max. power generated
Max. absorp- tion capacity
Tunnel cross-section
Penstock cross-section
Tunnel volume Penstock volumeStation hall
volumeTotal excavated
volume[MW] [m3/s] [m2] [m2] [mill. m3] [mill. m3] [mill. m3] [mill. m3]1000 126 63 42 1.205 0.051 0.083 1.3401200 151 76 50 1.446 0.061 0.096 1.6041400 176 88 59 1.688 0.072 0.109 1.8681600 202 101 67 1.929 0.082 0.121 2.1321800 227 113 76 2.170 0.092 0.133 2.3952000 252 126 84 2.411 0.102 0.145 2.6582200 277 139 92 2.652 0.113 0.156 2.9212400 302 151 101 2.893 0.123 0.168 3.183

PROJECT NO. 12X757
REPORT NO. TR A7195
VERSION 1.1
31 of 86
Table 2.22 shows the water level decrease in Blåsjø (upper reservoir) and water level increase in Suldalsvatn (lower reservoir) in the event of maximum power generation for 24 hours/day in Kvilldal pumped storage power station, when the design power output is 1,000 – 2,400 MW. The remaining inflow and discharge for these two reservoirs are indicated by the footnotes to the table. The start levels in the upper and lower reservoirs are 75 % and 50 %, respectively. Table 2.23 shows the water level reduction (m) per day and drawdown time (days) to LRWL for Blåsjø when the power generation in Kvilldal pumped storage power station is 1,400 MW. The number of hours/day of power generation and pumping and the start level (%) in Blåsjø are varied. Table 2.24 shows the filling time (days) to HRWL for Suldalsvatn under corresponding conditions. Table 2.16: Water level reduction and emptying time for Blåsjø when
Kvilldal pumped storage power station is generating 1,400 MW
Power generation (hours/day)
Pumping (hours/day)
Start level (%)
Reduction in 1 day (m)
Emptying (days)
24 0 100
1.8 70.0
75 52.5 50 35.0
18 0
75
1.3 70.0 6 1.0 95.4
12 0 0.9 104.9 6 0.5 174.9 12 0.2 524.7
Table 2.17: Filling time for Suldalsvatn when Kvilldal pumped
storage power station is generating 1,400 MW
Power generation (hours/day)
Pumping (hours/day)
Start level (%)
Filling (days)
24 0 25 1.5 50 1.0 75 0.5
18 0
50
1.3 6 1.8
12 0 1.9 6 3.2 12 9.7
PROJECT NO. 12X757
REPORT NO. TR A7195
VERSION 1.1
32 of 86
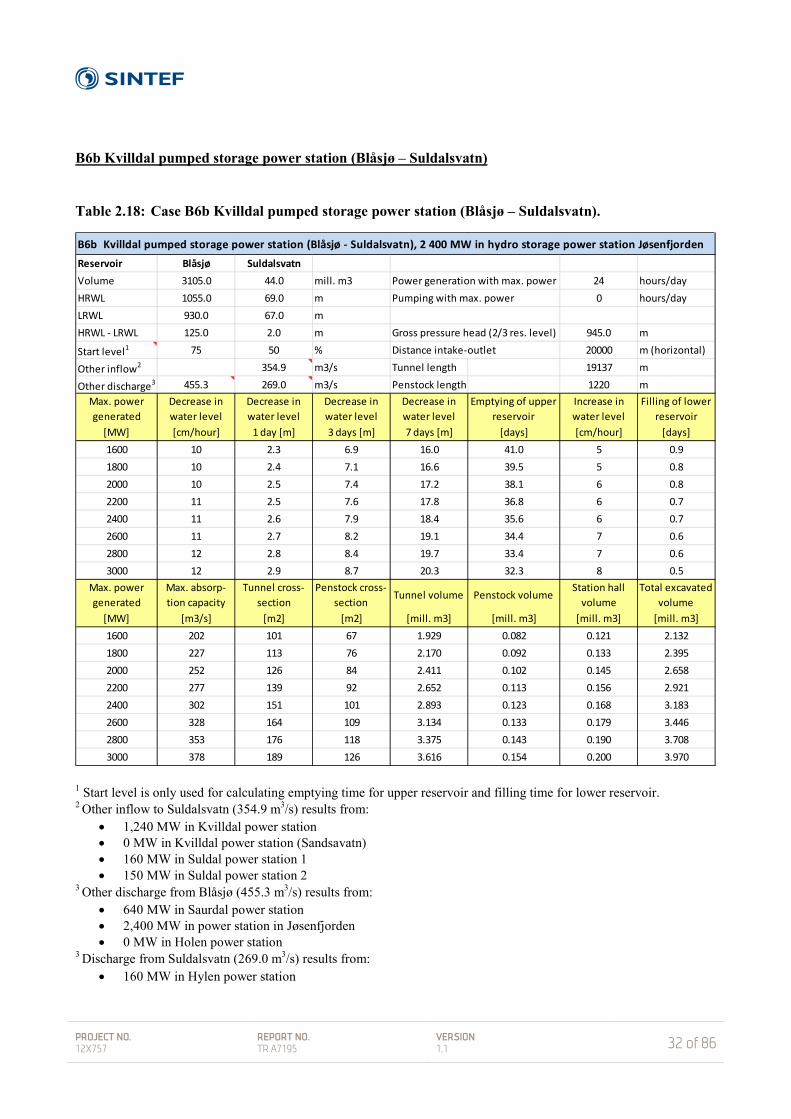
B6b Kvilldal pumped storage power station (Blåsjø – Suldalsvatn) Table 2.18: Case B6b Kvilldal pumped storage power station (Blåsjø – Suldalsvatn).
1 Start level is only used for calculating emptying time for upper reservoir and filling time for lower reservoir. 2 Other inflow to Suldalsvatn (354.9 m3/s) results from:
• 1,240 MW in Kvilldal power station • 0 MW in Kvilldal power station (Sandsavatn) • 160 MW in Suldal power station 1 • 150 MW in Suldal power station 2
3 Other discharge from Blåsjø (455.3 m3/s) results from: • 640 MW in Saurdal power station • 2,400 MW in power station in Jøsenfjorden • 0 MW in Holen power station
3 Discharge from Suldalsvatn (269.0 m3/s) results from: • 160 MW in Hylen power station
B6b Kvilldal pumped storage power station (Blåsjø - Suldalsvatn), 2 400 MW in hydro storage power station JøsenfjordenReservoir Blåsjø Suldalsvatn Volume 3105.0 44.0 mill. m3 Power generation with max. power 24 hours/dayHRWL 1055.0 69.0 m Pumping with max. power 0 hours/dayLRWL 930.0 67.0 m HRWL - LRWL 125.0 2.0 m Gross pressure head (2/3 res. level) 945.0 m
Start level1 75 50 % Distance intake-outlet 20000 m (horizontal)
Other inflow2 354.9 m3/s Tunnel length 19137 m
Other discharge3 455.3 269.0 m3/s Penstock length 1220 mMax. power generated
Decrease in water level
Decrease in water level
Decrease in water level
Decrease in water level
Emptying of upper reservoir
Increase in water level
Filling of lower reservoir
[MW] [cm/hour] 1 day [m] 3 days [m] 7 days [m] [days] [cm/hour] [days]1600 10 2.3 6.9 16.0 41.0 5 0.91800 10 2.4 7.1 16.6 39.5 5 0.82000 10 2.5 7.4 17.2 38.1 6 0.82200 11 2.5 7.6 17.8 36.8 6 0.72400 11 2.6 7.9 18.4 35.6 6 0.72600 11 2.7 8.2 19.1 34.4 7 0.62800 12 2.8 8.4 19.7 33.4 7 0.63000 12 2.9 8.7 20.3 32.3 8 0.5
Max. power generated
Max. absorp- tion capacity
Tunnel cross-section
Penstock cross-section
Tunnel volume Penstock volumeStation hall
volumeTotal excavated
volume[MW] [m3/s] [m2] [m2] [mill. m3] [mill. m3] [mill. m3] [mill. m3]1600 202 101 67 1.929 0.082 0.121 2.1321800 227 113 76 2.170 0.092 0.133 2.3952000 252 126 84 2.411 0.102 0.145 2.6582200 277 139 92 2.652 0.113 0.156 2.9212400 302 151 101 2.893 0.123 0.168 3.1832600 328 164 109 3.134 0.133 0.179 3.4462800 353 176 118 3.375 0.143 0.190 3.7083000 378 189 126 3.616 0.154 0.200 3.970

PROJECT NO. 12X757
REPORT NO. TR A7195
VERSION 1.1
33 of 86
Table 2.25 shows the water level decrease in Blåsjø (upper reservoir) and water level increase in Suldalsvatn (lower reservoir) in the event of maximum power generation for 24 hours/day in Kvilldal pumped storage power station, when the design power output is 1,600 – 3,000 MW. The remaining inflow and discharge for these two reservoirs are indicated by the footnotes to the table. The start levels in the upper and lower reservoirs are 75 % and 50 %, respectively. Table 2.26 shows the water level reduction (m) per day and drawdown time (days) to LRWL for Blåsjø when the power generation in Kvilldal pumped storage power station is 2,400 MW. The number of hours/day of power generation and pumping and the start level (%) in Blåsjø are varied. Table 2.27 shows the filling time (days) to HRWL for Suldalsvatn under corresponding conditions. Table 2.19: Water level reduction and emptying time for Blåsjø when
Kvilldal pumped storage power station is generating 2,400 MW
Power generation (hours/day)
Pumping (hours/day)
Start level (%)
Reduction in 1 day (m)
Emptying (days)
24 0 100
2.6 47.4
75 35.6 50 23.7
18 0
75
2.0 47.4 6 1.4 64.7
12 0 1.3 71.1 6 0.8 118.6 12 0.3 355.7
Table 2.20: Filling time for Suldalsvatn when Kvilldal pumped
storage power station is generating 2,400 MW
Power generation (hours/day)
Pumping (hours/day)
Start level (%)
Filling (days)
24 0 25 1.0 50 0.7 75 0.3
18 0
50
0.9 6 1.2
12 0 1.3 6 2.2 12 6.6
PROJECT NO. 12X757
REPORT NO. TR A7195
VERSION 1.1
34 of 86
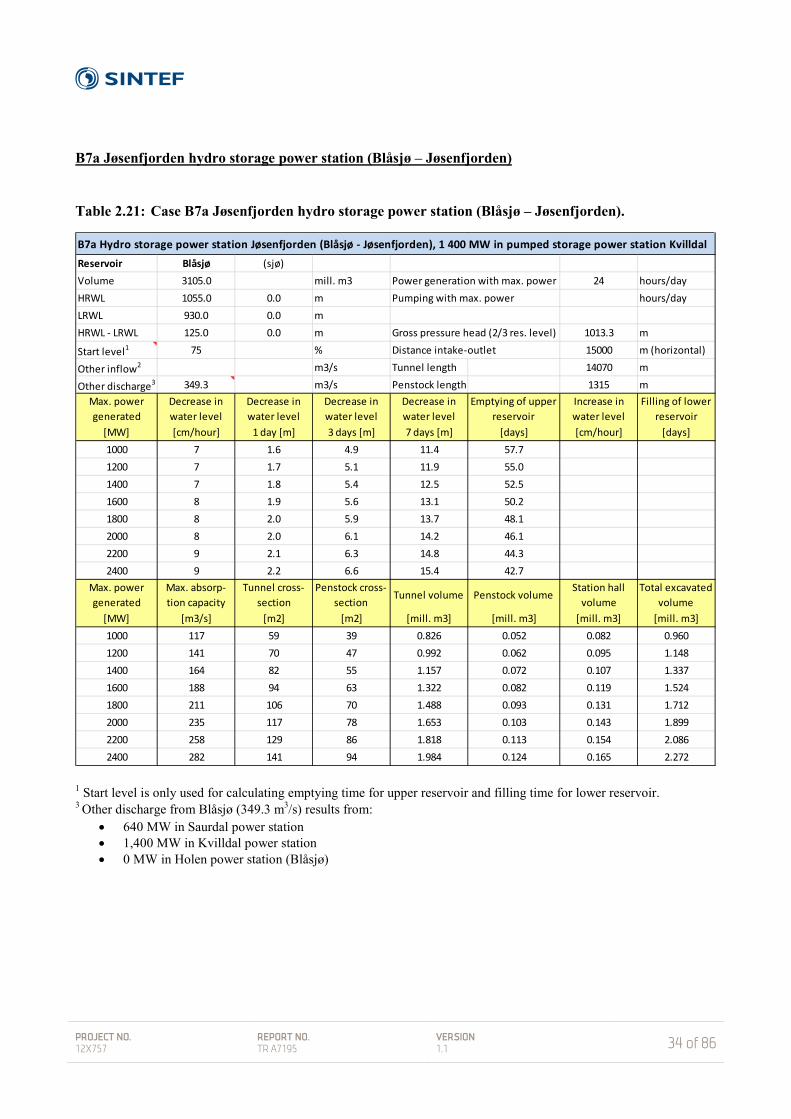
B7a Jøsenfjorden hydro storage power station (Blåsjø – Jøsenfjorden) Table 2.21: Case B7a Jøsenfjorden hydro storage power station (Blåsjø – Jøsenfjorden).
1 Start level is only used for calculating emptying time for upper reservoir and filling time for lower reservoir. 3 Other discharge from Blåsjø (349.3 m3/s) results from:
• 640 MW in Saurdal power station • 1,400 MW in Kvilldal power station • 0 MW in Holen power station (Blåsjø)
B7a Hydro storage power station Jøsenfjorden (Blåsjø - Jøsenfjorden), 1 400 MW in pumped storage power station KvilldalReservoir Blåsjø (sjø) Volume 3105.0 mill. m3 Power generation with max. power 24 hours/dayHRWL 1055.0 0.0 m Pumping with max. power hours/dayLRWL 930.0 0.0 m HRWL - LRWL 125.0 0.0 m Gross pressure head (2/3 res. level) 1013.3 m
Start level1 75 % Distance intake-outlet 15000 m (horizontal)
Other inflow2 m3/s Tunnel length 14070 m
Other discharge3 349.3 m3/s Penstock length 1315 mMax. power generated
Decrease in water level
Decrease in water level
Decrease in water level
Decrease in water level
Emptying of upper reservoir
Increase in water level
Filling of lower reservoir
[MW] [cm/hour] 1 day [m] 3 days [m] 7 days [m] [days] [cm/hour] [days]1000 7 1.6 4.9 11.4 57.71200 7 1.7 5.1 11.9 55.01400 7 1.8 5.4 12.5 52.51600 8 1.9 5.6 13.1 50.21800 8 2.0 5.9 13.7 48.12000 8 2.0 6.1 14.2 46.12200 9 2.1 6.3 14.8 44.32400 9 2.2 6.6 15.4 42.7
Max. power generated
Max. absorp- tion capacity
Tunnel cross-section
Penstock cross-section
Tunnel volume Penstock volumeStation hall
volumeTotal excavated
volume[MW] [m3/s] [m2] [m2] [mill. m3] [mill. m3] [mill. m3] [mill. m3]1000 117 59 39 0.826 0.052 0.082 0.9601200 141 70 47 0.992 0.062 0.095 1.1481400 164 82 55 1.157 0.072 0.107 1.3371600 188 94 63 1.322 0.082 0.119 1.5241800 211 106 70 1.488 0.093 0.131 1.7122000 235 117 78 1.653 0.103 0.143 1.8992200 258 129 86 1.818 0.113 0.154 2.0862400 282 141 94 1.984 0.124 0.165 2.272
PROJECT NO. 12X757
REPORT NO. TR A7195
VERSION 1.1
35 of 86
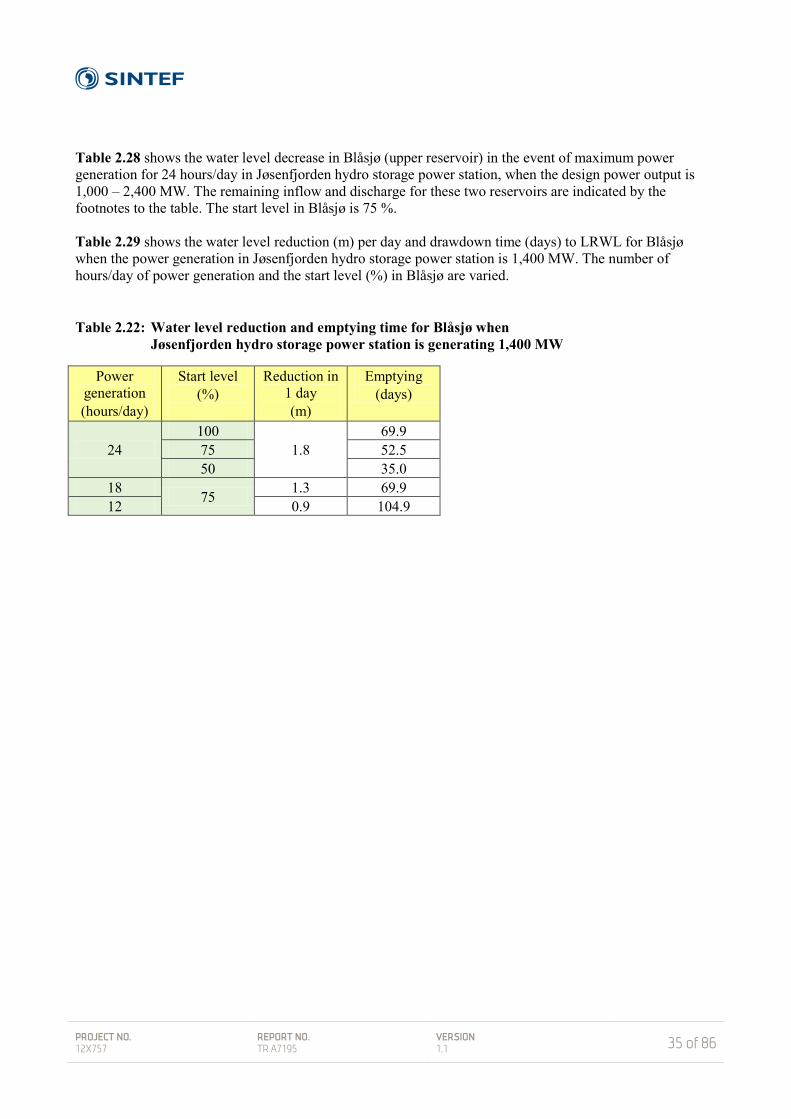
Table 2.28 shows the water level decrease in Blåsjø (upper reservoir) in the event of maximum power generation for 24 hours/day in Jøsenfjorden hydro storage power station, when the design power output is 1,000 – 2,400 MW. The remaining inflow and discharge for these two reservoirs are indicated by the footnotes to the table. The start level in Blåsjø is 75 %. Table 2.29 shows the water level reduction (m) per day and drawdown time (days) to LRWL for Blåsjø when the power generation in Jøsenfjorden hydro storage power station is 1,400 MW. The number of hours/day of power generation and the start level (%) in Blåsjø are varied. Table 2.22: Water level reduction and emptying time for Blåsjø when
Jøsenfjorden hydro storage power station is generating 1,400 MW
Power generation (hours/day)
Start level (%)
Reduction in 1 day (m)
Emptying (days)
24 100
1.8 69.9
75 52.5 50 35.0
18 75 1.3 69.9 12 0.9 104.9
PROJECT NO. 12X757
REPORT NO. TR A7195
VERSION 1.1
36 of 86
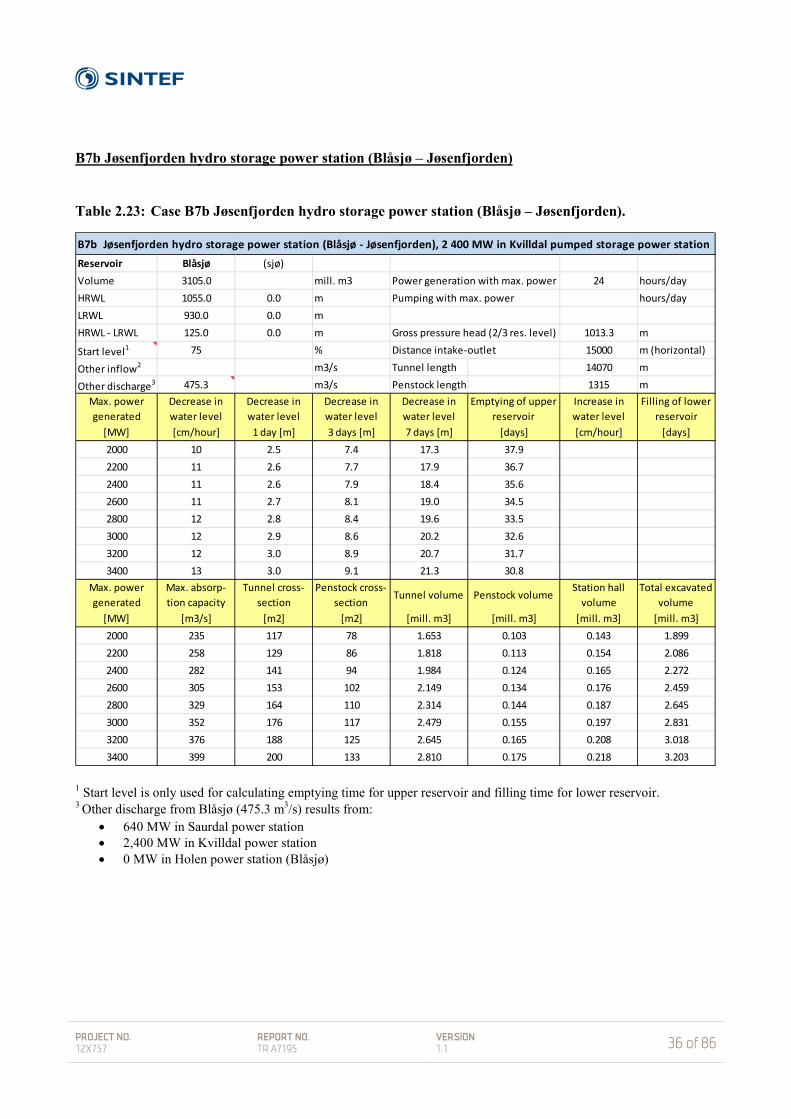
B7b Jøsenfjorden hydro storage power station (Blåsjø – Jøsenfjorden) Table 2.23: Case B7b Jøsenfjorden hydro storage power station (Blåsjø – Jøsenfjorden).
1 Start level is only used for calculating emptying time for upper reservoir and filling time for lower reservoir. 3 Other discharge from Blåsjø (475.3 m3/s) results from:
• 640 MW in Saurdal power station • 2,400 MW in Kvilldal power station • 0 MW in Holen power station (Blåsjø)
B7b Jøsenfjorden hydro storage power station (Blåsjø - Jøsenfjorden), 2 400 MW in Kvilldal pumped storage power station Reservoir Blåsjø (sjø) Volume 3105.0 mill. m3 Power generation with max. power 24 hours/dayHRWL 1055.0 0.0 m Pumping with max. power hours/dayLRWL 930.0 0.0 m HRWL - LRWL 125.0 0.0 m Gross pressure head (2/3 res. level) 1013.3 m
Start level1 75 % Distance intake-outlet 15000 m (horizontal)
Other inflow2 m3/s Tunnel length 14070 m
Other discharge3 475.3 m3/s Penstock length 1315 mMax. power generated
Decrease in water level
Decrease in water level
Decrease in water level
Decrease in water level
Emptying of upper reservoir
Increase in water level
Filling of lower reservoir
[MW] [cm/hour] 1 day [m] 3 days [m] 7 days [m] [days] [cm/hour] [days]2000 10 2.5 7.4 17.3 37.92200 11 2.6 7.7 17.9 36.72400 11 2.6 7.9 18.4 35.62600 11 2.7 8.1 19.0 34.52800 12 2.8 8.4 19.6 33.53000 12 2.9 8.6 20.2 32.63200 12 3.0 8.9 20.7 31.73400 13 3.0 9.1 21.3 30.8
Max. power generated
Max. absorp- tion capacity
Tunnel cross-section
Penstock cross-section
Tunnel volume Penstock volumeStation hall
volumeTotal excavated
volume[MW] [m3/s] [m2] [m2] [mill. m3] [mill. m3] [mill. m3] [mill. m3]2000 235 117 78 1.653 0.103 0.143 1.8992200 258 129 86 1.818 0.113 0.154 2.0862400 282 141 94 1.984 0.124 0.165 2.2722600 305 153 102 2.149 0.134 0.176 2.4592800 329 164 110 2.314 0.144 0.187 2.6453000 352 176 117 2.479 0.155 0.197 2.8313200 376 188 125 2.645 0.165 0.208 3.0183400 399 200 133 2.810 0.175 0.218 3.203
PROJECT NO. 12X757
REPORT NO. TR A7195
VERSION 1.1
37 of 86
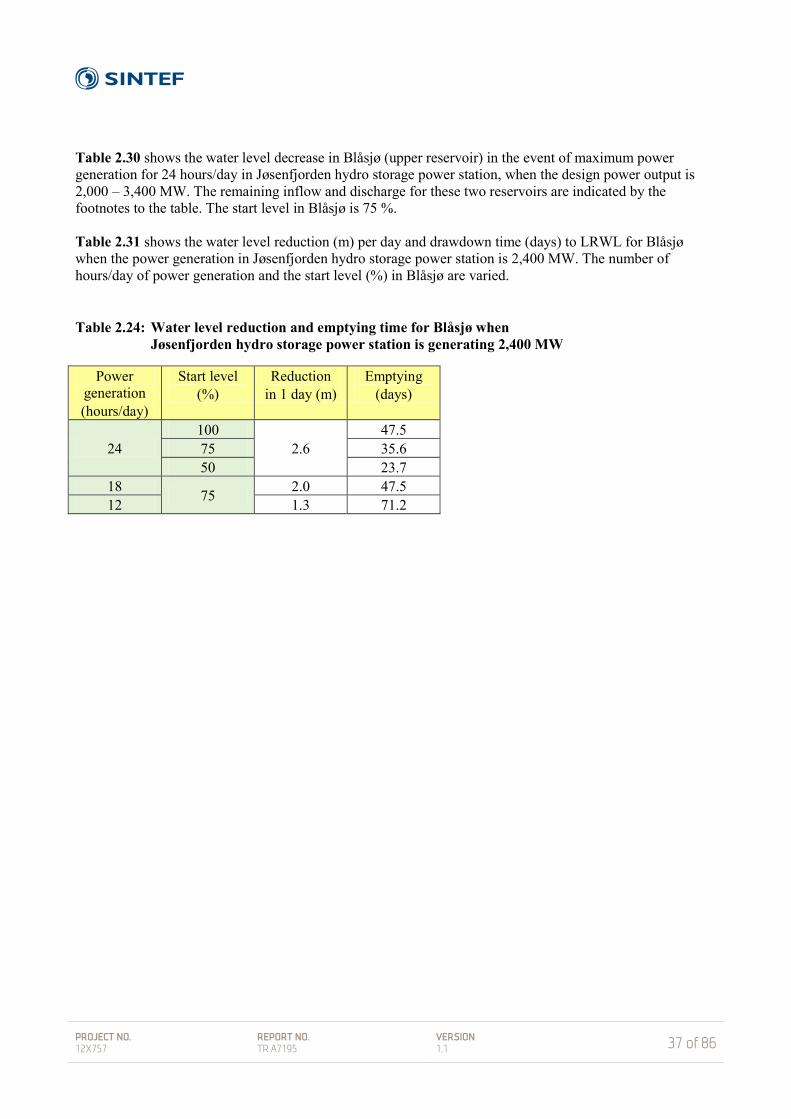
Table 2.30 shows the water level decrease in Blåsjø (upper reservoir) in the event of maximum power generation for 24 hours/day in Jøsenfjorden hydro storage power station, when the design power output is 2,000 – 3,400 MW. The remaining inflow and discharge for these two reservoirs are indicated by the footnotes to the table. The start level in Blåsjø is 75 %. Table 2.31 shows the water level reduction (m) per day and drawdown time (days) to LRWL for Blåsjø when the power generation in Jøsenfjorden hydro storage power station is 2,400 MW. The number of hours/day of power generation and the start level (%) in Blåsjø are varied. Table 2.24: Water level reduction and emptying time for Blåsjø when
Jøsenfjorden hydro storage power station is generating 2,400 MW
Power generation (hours/day)
Start level (%)
Reduction in 1 day (m)
Emptying (days)
24 100
2.6 47.5
75 35.6 50 23.7
18 75 2.0 47.5 12 1.3 71.2
PROJECT NO. 12X757
REPORT NO. TR A7195
VERSION 1.1
38 of 86
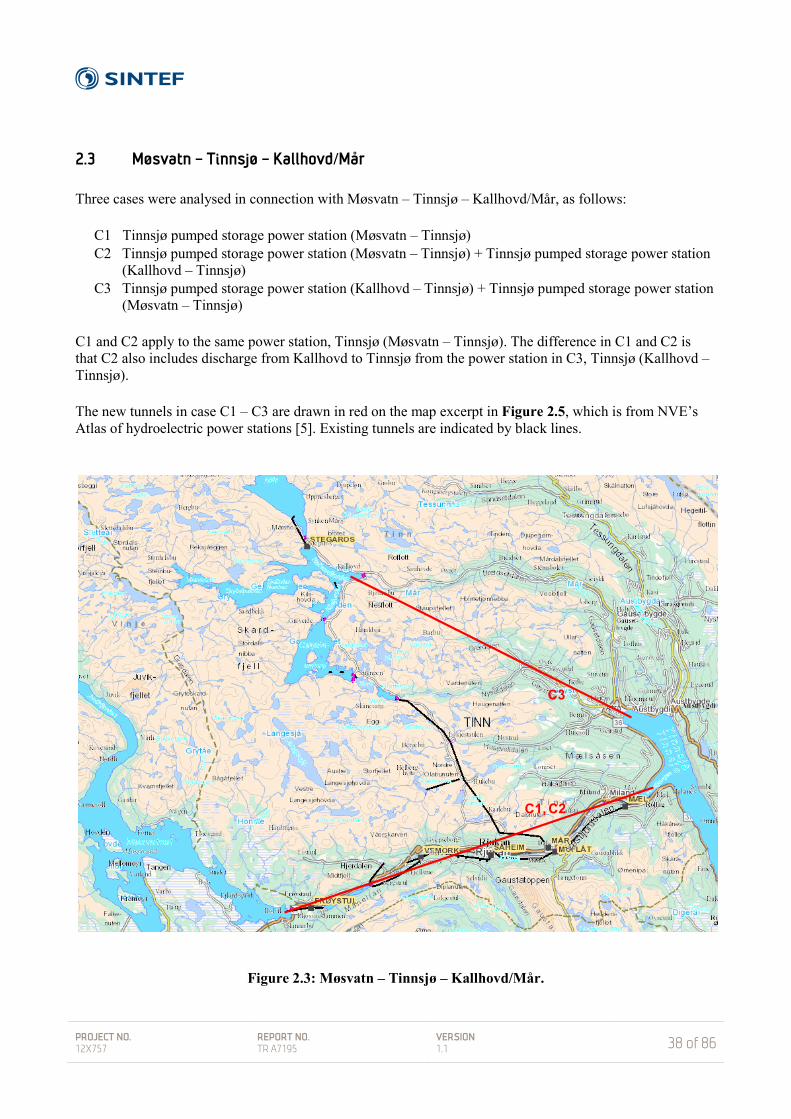
2.3 Møsvatn – Tinnsjø – Kallhovd/Mår Three cases were analysed in connection with Møsvatn – Tinnsjø – Kallhovd/Mår, as follows:
C1 Tinnsjø pumped storage power station (Møsvatn – Tinnsjø) C2 Tinnsjø pumped storage power station (Møsvatn – Tinnsjø) + Tinnsjø pumped storage power station
(Kallhovd – Tinnsjø) C3 Tinnsjø pumped storage power station (Kallhovd – Tinnsjø) + Tinnsjø pumped storage power station
(Møsvatn – Tinnsjø) C1 and C2 apply to the same power station, Tinnsjø (Møsvatn – Tinnsjø). The difference in C1 and C2 is that C2 also includes discharge from Kallhovd to Tinnsjø from the power station in C3, Tinnsjø (Kallhovd – Tinnsjø). The new tunnels in case C1 – C3 are drawn in red on the map excerpt in Figure 2.5, which is from NVE’s Atlas of hydroelectric power stations [5]. Existing tunnels are indicated by black lines.
Figure 2.3: Møsvatn – Tinnsjø – Kallhovd/Mår.
C1, C2
C3
PROJECT NO. 12X757
REPORT NO. TR A7195
VERSION 1.1
39 of 86
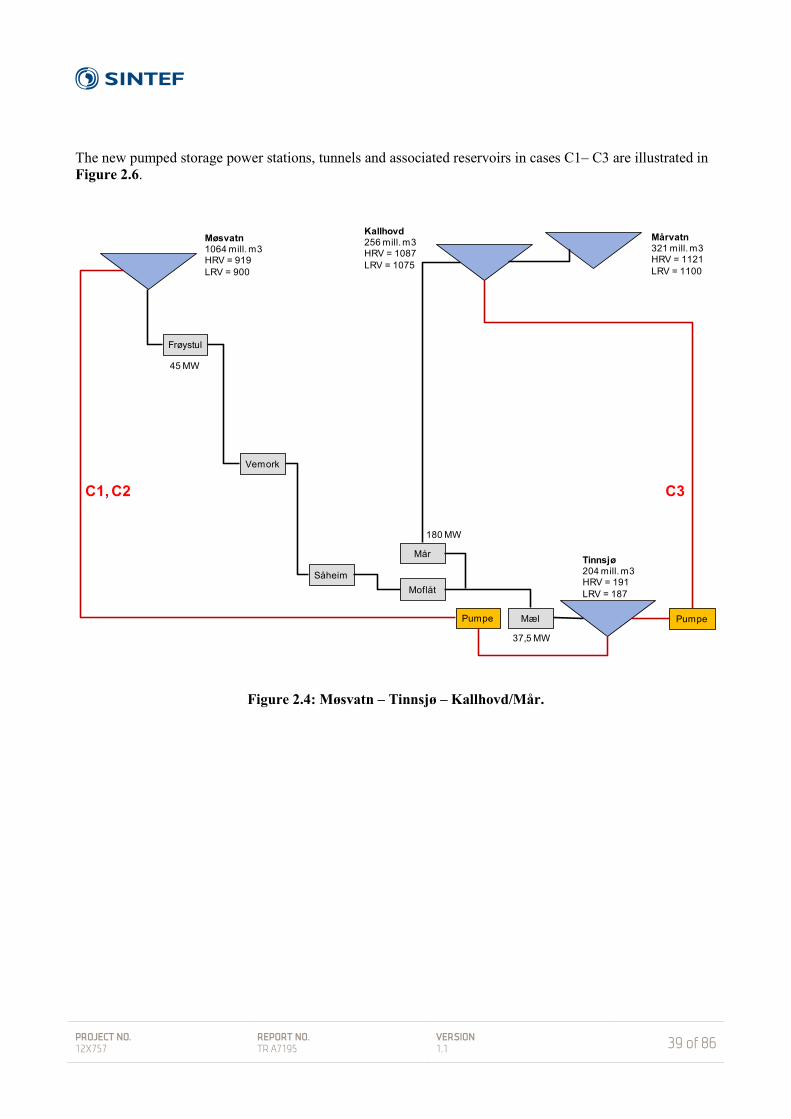
The new pumped storage power stations, tunnels and associated reservoirs in cases C1– C3 are illustrated in Figure 2.6.
Figure 2.4: Møsvatn – Tinnsjø – Kallhovd/Mår.
Pumpe
Moflåt
Mæl
Såheim
Vemork
Frøystul
Pumpe
Mårvatn321 mill. m3HRV = 1121LRV = 1100
Tinnsjø204 mill. m3HRV = 191LRV = 187
Kallhovd256 mill. m3HRV = 1087LRV = 1075
Møsvatn1064 mill. m3HRV = 919LRV = 900
Mår
C3
37,5 MW
C1, C2
180 MW
45 MW

PROJECT NO. 12X757
REPORT NO. TR A7195
VERSION 1.1
40 of 86
C1 Tinnsjø pumped storage power station (Møsvatn – Tinnsjø) Table 2.25: Case C1 Tinnsjø pumped storage power station (Møsvatn – Tinnsjø).
1 Start level is only used for calculating emptying time for upper reservoir and filling time for lower reservoir. 2 Other inflow to Tinnsjø (99.7 m3/s) results from:
• 37.5 MW in Mæl power station 3 Other discharge from Møsvatn (87.1 m3/s) results from:
• 45 MW in Frøystul power station 3 Dicharge from Tinnsjø (150.2 m3/s) results from:
• 22.2 MW in Årlifoss power station
C1 Pumped storage power station Tinnsjø (Møsvatn - Tinnsjø)Reservoir Møsvatn Tinnsjø Volume 1064.0 204.0 mill. m3 Power generation with max. power 24 hours/dayHRWL 919.0 191.0 m Pumping with max. power 0 hours/dayLRWL 900.0 187.0 m HRWL - LRWL 19.0 4.0 m Gross pressure head (2/3 res. level) 723.0 m
Start level1 75 50 % Distance intake-outlet 30000 m (horizontal)
Other inflow2 99.7 m3/s Tunnel length 29287 m
Other discharge3 87.1 150.2 m3/s Penstock length 1008 mMax. power generated
Decrease in water level
Decrease in water level
Decrease in water level
Decrease in water level
Emptying of upper reservoir
Increase in water level
Filling of lower reservoir
[MW] [cm/hour] 1 day [m] 3 days [m] 7 days [m] [days] [cm/hour] [days]700 1 0.3 0.9 2.2 45.6 0 18.2800 1 0.3 1.0 2.4 42.2 1 14.5900 2 0.4 1.1 2.5 39.3 1 12.11000 2 0.4 1.2 2.7 36.7 1 10.31100 2 0.4 1.2 2.9 34.4 1 9.01200 2 0.4 1.3 3.1 32.4 1 8.01300 2 0.5 1.4 3.3 30.7 1 7.21400 2 0.5 1.5 3.4 29.1 1 6.6
Max. power generated
Max. absorp- tion capacity
Tunnel cross-section
Penstock cross-section
Tunnel volume Penstock volumeStation hall
volumeTotal excavated
volume[MW] [m3/s] [m2] [m2] [mill. m3] [mill. m3] [mill. m3] [mill. m3]
700 115 58 38 1.688 0.039 0.066 1.793800 132 66 44 1.929 0.044 0.073 2.047900 148 74 49 2.170 0.050 0.081 2.3011000 165 82 55 2.411 0.055 0.088 2.5541100 181 91 60 2.652 0.061 0.095 2.8081200 198 99 66 2.893 0.066 0.102 3.0611300 214 107 71 3.135 0.072 0.108 3.3151400 231 115 77 3.376 0.077 0.115 3.568

PROJECT NO. 12X757
REPORT NO. TR A7195
VERSION 1.1
41 of 86
Table 2.32 shows the water level decrease in Møsvatn (upper reservoir) and water level increase in Tinnsjø (lower reservoir) in the event of maximum power generation for 24 hours/day in Tinnsjø pumped storage power station, when the design power output is 700 – 1,400 MW. The remaining inflow and discharge for these two reservoirs are indicated by the footnotes to the table. The start levels in the upper and lower reservoirs are 75 % and 50 %, respectively. Table 2.33 shows the water level reduction (m) per day and drawdown time (days) to LRWL for Møsvatn when the power generation in Tinnsjø pumped storage power station is 1,000 MW. The number of hours/day of power generation and pumping and the start level (%) in Møsvatn are varied. Table 2.34 shows the filling time (days) to HRWL for Tinnsjø under corresponding conditions. Table 2.26: Water level reduction and emptying time for Møsvatn when
Tinnsjø pumped storage power station is generating 1,000 MW
Power generation (hours/day)
Pumping (hours/day)
Start level (%)
Reduction in 1 day (m)
Emptying (days)
24 0 100
0.4 48.9
75 36.7 50 24.5
18 0
75
0.3 48.9 6 0.2 66.7
12 0 0.2 73.4 6 0.1 122.3 12 0.0 366.9
Table 2.27: Filling time for Tinnsjø when Tinnsjø pumped
storage power station is generating 1,000 MW
Power generation (hours/day)
Pumping (hours/day)
Start level (%)
Filling (days)
24 0 25 15.5 50 10.3 75 5.2
18 0
50
13.8 6 18.8
12 0 20.7 6 34.5 12 103.4

PROJECT NO. 12X757
REPORT NO. TR A7195
VERSION 1.1
42 of 86
C2 Tinnsjø pumped storage power station (Møsvatn – Tinnsjø) Table 2.28: Case C2 Tinnsjø pumped storage power station (Møsvatn – Tinnsjø).
1 Start level is only used for calculating emptying time for upper reservoir and filling time for lower reservoir. 2 Other inflow to Tinnsjø (419.7 m3/s) results from:
• 37.5 MW in Mæl power station • 2400 MW in Tinnsjø power station (Kallhovd – Tinnsjø)
3 Other discharge from Møsvatn (87.1 m3/s) results from: • 45 MW in Frøystul power station
3 Discharge from Tinnsjø (150.2 m3/s) results from: • 22.2 MW in Årlifoss power station
C2 Tinnsjø pumped storage power station (Møsvatn - Tinnsjø)Reservoir Møsvatn Tinnsjø Volume 1064.0 204.0 mill. m3 Power generation with max. power 24 hours/dayHRWL 919.0 191.0 m Pumping with max. power 0 hours/dayLRWL 900.0 187.0 m HRWL - LRWL 19.0 4.0 m Gross pressure head (2/3 res. level) 723.0 m
Start level1 75 50 % Distance intake-outlet 30000 m (horizontal)
Other inflow2 419.7 m3/s Tunnel length 29287 m
Other discharge3 87.1 150.2 m3/s Penstock length 1008 mMax. power generated
Decrease in water level
Decrease in water level
Decrease in water level
Decrease in water level
Emptying of upper reservoir
Increase in water level
Filling of lower reservoir
[MW] [cm/hour] 1 day [m] 3 days [m] 7 days [m] [days] [cm/hour] [days]1400 2 0.5 1.5 3.4 29.1 4 2.41600 2 0.5 1.6 3.8 26.3 4 2.21800 2 0.6 1.8 4.1 24.1 4 2.12000 3 0.6 1.9 4.5 22.2 4 2.02200 3 0.7 2.1 4.9 20.6 4 1.92400 3 0.7 2.2 5.2 19.2 5 1.82600 3 0.8 2.4 5.6 17.9 5 1.72800 4 0.8 2.5 5.9 16.8 5 1.6
Max. power generated
Max. absorp- tion capacity
Tunnel cross-section
Penstock cross-section
Tunnel volume Penstock volumeStation hall
volumeTotal excavated
volume[MW] [m3/s] [m2] [m2] [mill. m3] [mill. m3] [mill. m3] [mill. m3]1400 231 115 77 3.376 0.077 0.115 3.5681600 263 132 88 3.858 0.089 0.128 4.0741800 296 148 99 4.340 0.100 0.140 4.5802000 329 165 110 4.822 0.111 0.153 5.0862200 362 181 121 5.305 0.122 0.165 5.5912400 395 198 132 5.787 0.133 0.177 6.0962600 428 214 143 6.269 0.144 0.188 6.6012800 461 231 154 6.751 0.155 0.200 7.106

PROJECT NO. 12X757
REPORT NO. TR A7195
VERSION 1.1
43 of 86
Table 2.35 shows the water level decrease in Møsvatn (upper reservoir) and water level increase in Tinnsjø (lower reservoir) in the event of maximum power generation for 24 hours/day in Tinnsjø pumped storage power station, when the design power output is 1,400 – 2,800 MW. The remaining inflow and discharge for these two reservoirs are indicated by the footnotes to the table. The start levels in the upper and lower reservoirs are 75 % and 50 %, respectively. Table 2.36 shows the water level reduction (m) per day and drawdown time (days) to LRWL for Møsvatn when the power generation in Tinnsjø pumped storage power station is 2,000 MW. The number of hours/day of power generation and pumping and the start level (%) in Møsvatn are varied. Table 2.37 shows the filling time (days) to HRWL for Tinnsjø under corresponding conditions. Table 2.29: Water level reduction and emptying time for Møsvatn when
Tinnsjø pumped storage power station is generating 2,000 MW
Power generation (hours/day)
Pumping (hours/day)
Start level (%)
Reduction in 1 day (m)
Emptying (days)
24 0 100
0.6 29.6
75 22.2 50 14.8
18 0
75
0.5 29.6 6 0.4 40.3
12 0 0.3 44.4 6 0.2 73.9 12 0.1 221.8
Table 2.30: Filling time for Tinnsjø when Tinnsjø pumped
storage power station is generating 2,000 MW
Power generation (hours/day)
Pumping (hours/day)
Start level (%)
Filling (days)
24 0 25 3.0 50 2.0 75 1.0
18 0
50
2.6 6 3.6
12 0 3.9 6 6.6 12 19.7

PROJECT NO. 12X757
REPORT NO. TR A7195
VERSION 1.1
44 of 86
C3 Tinnsjø pumped storage power station (Kallhovd – Tinnsjø) Table 2.31: Case C3 Tinnsjø pumped storage power station (Kallhovd – Tinnsjø).
1 Start level is only used for calculating emptying time for upper reservoir and filling time for lower reservoir. 2 Inflow to Kallhovd (0 m3/s):
• Hva er bidraget fra Mårvatn? (sikkert mer enn det som 2.4 MW i Stegaros kraftverk gir) 2 Other inflow to Tinnsjø (428.7 m3/s) results from:
• 37.5 MW in Mæl power station • 2,000 MW in Møsvatn power station
3 Other discharge from Kallhovd (87.1 m3/s) (25.2 according to NVE-data base) results from: • 180 MW in Mår power station
3 Discharge from Tinnsjø (150.2 m3/s) results from: • 22.2 MW in Årlifoss power station
C3 Tinnsjø pumped storage power station (Kallhovd - Tinnsjø)Reservoir Kallhovd Tinnsjø Volume 256.0 204.0 mill. m3 Power generation with max. power 24 hours/dayHRWL 1087.0 191.0 m Pumping with max. power 0 hours/dayLRWL 1075.0 187.0 m HRWL - LRWL 12.0 4.0 m Gross pressure head (2/3 res. level) 893.3 m
Start level1 75 50 % Distance intake-outlet 25000 m (horizontal)
Other inflow2 428.7 m3/s Tunnel length 24112 m
Other discharge3 87.1 150.2 m3/s Penstock length 1256 mMax. power generated
Decrease in water level
Decrease in water level
Decrease in water level
Decrease in water level
Emptying of upper reservoir
Increase in water level
Filling of lower reservoir
[MW] [cm/hour] 1 day [m] 3 days [m] 7 days [m] [days] [cm/hour] [days]1800 6 1.3 4.0 9.3 6.8 4 2.32000 6 1.4 4.3 10.0 6.3 4 2.22200 6 1.5 4.6 10.8 5.8 4 2.12400 7 1.6 4.9 11.5 5.5 4 2.02600 7 1.8 5.3 12.3 5.1 4 1.92800 8 1.9 5.6 13.0 4.8 5 1.83000 8 2.0 5.9 13.8 4.6 5 1.73200 9 2.1 6.2 14.6 4.3 5 1.7
Max. power generated
Max. absorp- tion capacity
Tunnel cross-section
Penstock cross-section
Tunnel volume Penstock volumeStation hall
volumeTotal excavated
volume[MW] [m3/s] [m2] [m2] [mill. m3] [mill. m3] [mill. m3] [mill. m3]1800 240 120 80 2.892 0.100 0.135 3.1272000 267 133 89 3.213 0.112 0.146 3.4712200 293 147 98 3.535 0.123 0.158 3.8152400 320 160 107 3.856 0.134 0.169 4.1592600 346 173 115 4.177 0.145 0.181 4.5032800 373 187 124 4.499 0.156 0.192 4.8463000 400 200 133 4.820 0.167 0.203 5.1903200 426 213 142 5.141 0.179 0.213 5.533

PROJECT NO. 12X757
REPORT NO. TR A7195
VERSION 1.1
45 of 86
Table 2.38 shows the water level decrease in Kallhovd (upper reservoir) and water level increase in Tinnsjø (lower reservoir) in the event of maximum power generation for 24 hours/day in Tinnsjø pumped storage power station, when the design power output is 1,800 – 3,200 MW. The remaining inflow and discharge for these two reservoirs are indicated by the footnotes to the table. The start levels in the upper and lower reservoirs are 75 % and 50 %, respectively. Table 2.39 shows the water level reduction (m) per day and drawdown time (days) to LRWL for Kallhovd when the power generation in Tinnsjø pumped storage power station is 2,400 MW. The number of hours/day of power generation and pumping and the start level (%) in Kallhovd are varied. Table 2.40 shows the filling time (days) to HRWL for Tinnsjø under corresponding conditions. Table 2.32: Water level reduction and emptying time for Kallhovd when
Tinnsjø pumped storage power station is generating 2,400 MW
Power generation (hours/day)
Pumping (hours/day)
Start level (%)
Reduction in 1 day (m)
Emptying (days)
24 0 100
1.6 7.3
75 5.5 50 3.6
18 0
75
1.2 7.3 6 0.9 9.9
12 0 0.8 10.9 6 0.5 18.2 12 0.2 54.6
Table 2.33: Filling time for Tinnsjø when Tinnsjø pumped
storage power station is generating 2,400 MW
Power generation (hours/day)
Pumping (hours/day)
Start level (%)
Filling (days)
24 0 25 3.0 50 2.0 75 1.0
18 0
50
2.6 6 3.6
12 0 3.9 6 6.6 12 19.7
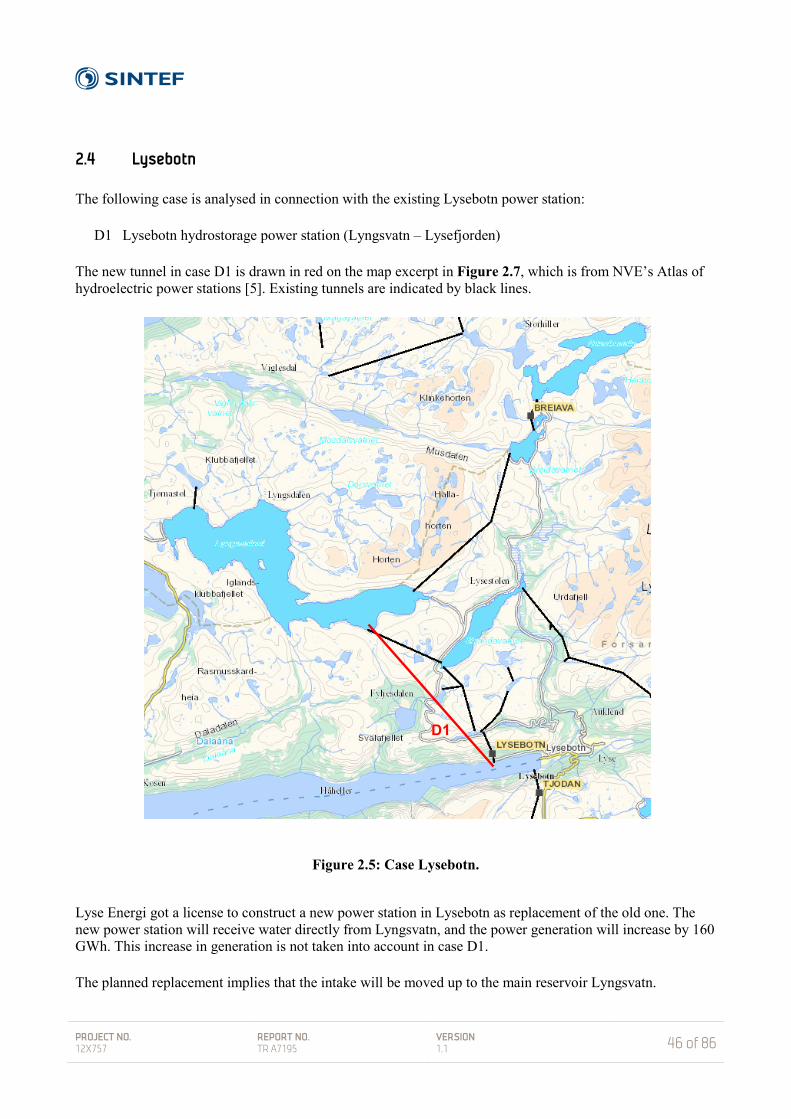
PROJECT NO. 12X757
REPORT NO. TR A7195
VERSION 1.1
46 of 86
2.4 Lysebotn The following case is analysed in connection with the existing Lysebotn power station: D1 Lysebotn hydrostorage power station (Lyngsvatn – Lysefjorden) The new tunnel in case D1 is drawn in red on the map excerpt in Figure 2.7, which is from NVE’s Atlas of hydroelectric power stations [5]. Existing tunnels are indicated by black lines.
Figure 2.5: Case Lysebotn.
Lyse Energi got a license to construct a new power station in Lysebotn as replacement of the old one. The new power station will receive water directly from Lyngsvatn, and the power generation will increase by 160 GWh. This increase in generation is not taken into account in case D1. The planned replacement implies that the intake will be moved up to the main reservoir Lyngsvatn.
D1

PROJECT NO. 12X757
REPORT NO. TR A7195
VERSION 1.1
47 of 86
According to NVE's assessment, the replacement will lead to minor disadvantages for the environment and other public interests. The current license with associated stipulations for the existing power station and regulations will also apply for the new power station named above. The new hydro storage power station, tunnel and associated reservoirs in case D1 are illustrated in Figure 2.8.
Figure 2.6: Case Lysebotn.
Lysebotn sjø
Strandavatn-Storetj.23 mill. m3HRV = 635LRV = 616
Lyngsvatn516 mill. m3HRV = 686LRV = 636
Eff.verk
BreiavaHRV = 693
Lysefjorden
D1
210 MW
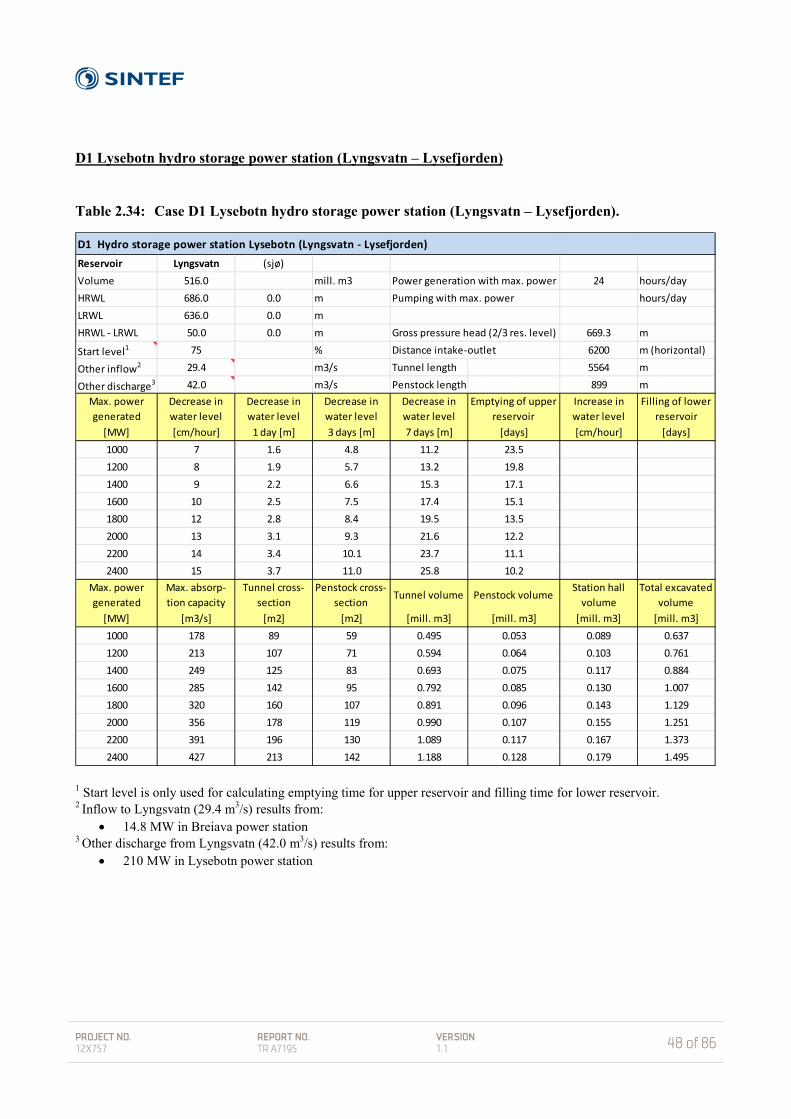
PROJECT NO. 12X757
REPORT NO. TR A7195
VERSION 1.1
48 of 86
D1 Lysebotn hydro storage power station (Lyngsvatn – Lysefjorden) Table 2.34: Case D1 Lysebotn hydro storage power station (Lyngsvatn – Lysefjorden).
1 Start level is only used for calculating emptying time for upper reservoir and filling time for lower reservoir. 2 Inflow to Lyngsvatn (29.4 m3/s) results from:
• 14.8 MW in Breiava power station 3 Other discharge from Lyngsvatn (42.0 m3/s) results from:
• 210 MW in Lysebotn power station
D1 Hydro storage power station Lysebotn (Lyngsvatn - Lysefjorden)Reservoir Lyngsvatn (sjø) Volume 516.0 mill. m3 Power generation with max. power 24 hours/dayHRWL 686.0 0.0 m Pumping with max. power hours/dayLRWL 636.0 0.0 m HRWL - LRWL 50.0 0.0 m Gross pressure head (2/3 res. level) 669.3 m
Start level1 75 % Distance intake-outlet 6200 m (horizontal)
Other inflow2 29.4 m3/s Tunnel length 5564 m
Other discharge3 42.0 m3/s Penstock length 899 mMax. power generated
Decrease in water level
Decrease in water level
Decrease in water level
Decrease in water level
Emptying of upper reservoir
Increase in water level
Filling of lower reservoir
[MW] [cm/hour] 1 day [m] 3 days [m] 7 days [m] [days] [cm/hour] [days]1000 7 1.6 4.8 11.2 23.51200 8 1.9 5.7 13.2 19.81400 9 2.2 6.6 15.3 17.11600 10 2.5 7.5 17.4 15.11800 12 2.8 8.4 19.5 13.52000 13 3.1 9.3 21.6 12.22200 14 3.4 10.1 23.7 11.12400 15 3.7 11.0 25.8 10.2
Max. power generated
Max. absorp- tion capacity
Tunnel cross-section
Penstock cross-section
Tunnel volume Penstock volumeStation hall
volumeTotal excavated
volume[MW] [m3/s] [m2] [m2] [mill. m3] [mill. m3] [mill. m3] [mill. m3]1000 178 89 59 0.495 0.053 0.089 0.6371200 213 107 71 0.594 0.064 0.103 0.7611400 249 125 83 0.693 0.075 0.117 0.8841600 285 142 95 0.792 0.085 0.130 1.0071800 320 160 107 0.891 0.096 0.143 1.1292000 356 178 119 0.990 0.107 0.155 1.2512200 391 196 130 1.089 0.117 0.167 1.3732400 427 213 142 1.188 0.128 0.179 1.495

PROJECT NO. 12X757
REPORT NO. TR A7195
VERSION 1.1
49 of 86
Table 2.41 shows the water level decrease in Lyngsvatn (upper reservoir) in the event of maximum power generation for 24 hours/day in Lyngsvatn hydro storage power station, when the design power output is 1,000 – 2,400 MW. The remaining inflow and discharge for these two reservoirs are indicated by the footnotes to the table. The start level in Lyngsvatn is 75 %. Table 2.42 shows the water level reduction (m) per day and drawdown time (days) to LRWL for Lyngsvatn when the power generation in Lyngsvatn hydro storage power station is 1,400 MW. The number of hours/day of power generation and the start level (%) in Lyngsvatn are varied. Table 2.35: Water level reduction and emptying time for Lyngsvatn when
Lyngsvatn hydro storage power station is generating 1,400 MW
Power generation (hours/day)
Start level (%)
Reduction in 1 day (m)
Emptying (days)
24 100
2.2 22.8
75 17.1 50 11.4
18 75 1.6 22.8 12 1.1 34.2

PROJECT NO. 12X757
REPORT NO. TR A7195
VERSION 1.1
50 of 86
2.5 Mauranger – Oksla – Tysso Three cases were analysed in connection with Mauranger – Oksla – Tysso, as follows:
E1 Mauranger hydro storage power station (Juklavatn – sjø) E2 Oksla hydro storage power station (Ringedalsvatn – sjø) E3 Tysso pumped storage power station (Langevatn – Ringedalsvatn)
The new tunnels in case E1 – E3 are drawn in red on the map excerpt in Figure 2.9, which is from NVE’s Atlas of hydroelectric power stations [5]. Existing tunnels are indicated by black lines.
Figure 2.7: Case Mauranger (E1) – Oksla (E2) – Tysso (E3).
E1
E2
E3
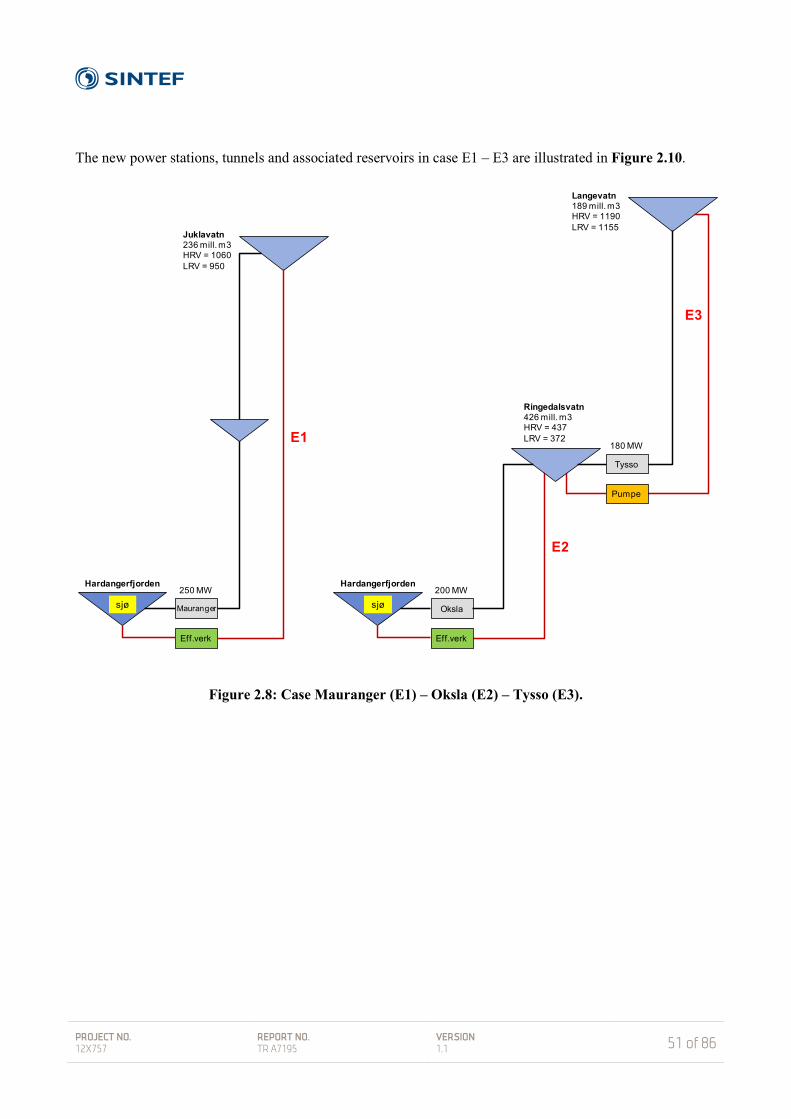
PROJECT NO. 12X757
REPORT NO. TR A7195
VERSION 1.1
51 of 86
The new power stations, tunnels and associated reservoirs in case E1 – E3 are illustrated in Figure 2.10.
Figure 2.8: Case Mauranger (E1) – Oksla (E2) – Tysso (E3).
Langevatn189 mill. m3HRV = 1190LRV = 1155
Mauranger
Juklavatn236 mill. m3HRV = 1060LRV = 950
Eff.verk
E1
250 MWHardangerfjorden
sjø Oksla
Eff.verk
E3
200 MWHardangerfjorden
sjø
Tysso
Pumpe
180 MW
Ringedalsvatn426 mill. m3HRV = 437LRV = 372
E2
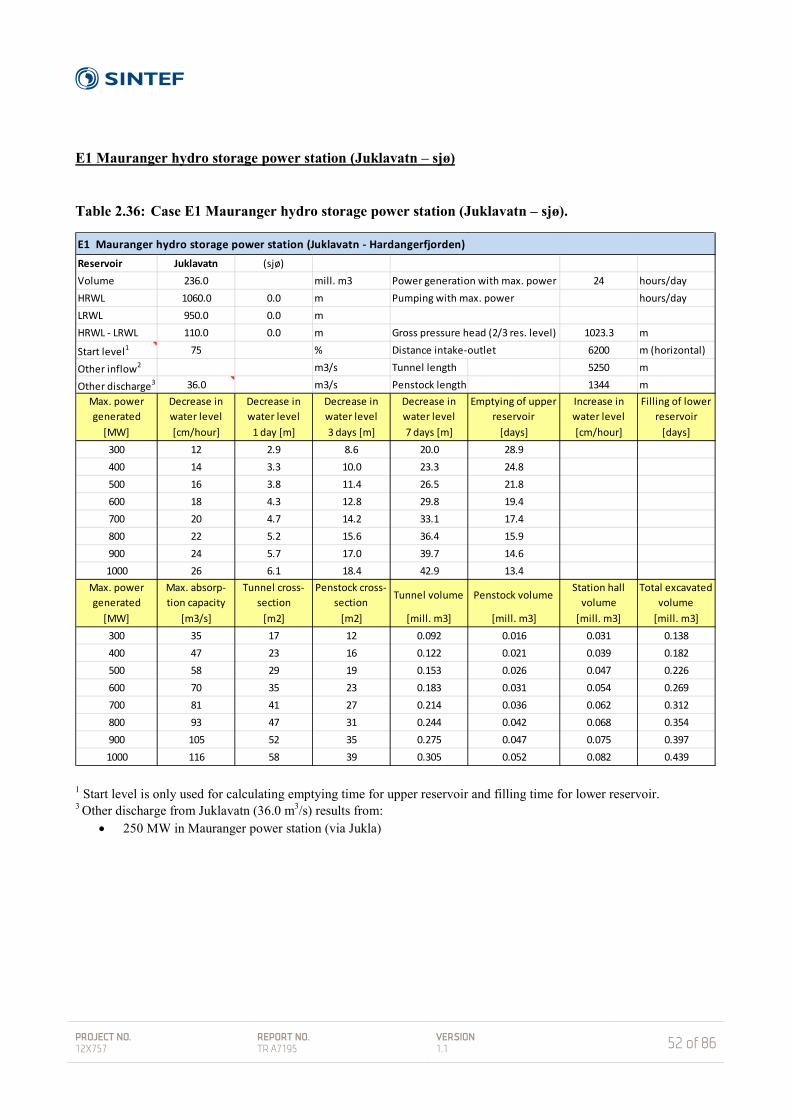
PROJECT NO. 12X757
REPORT NO. TR A7195
VERSION 1.1
52 of 86
E1 Mauranger hydro storage power station (Juklavatn – sjø) Table 2.36: Case E1 Mauranger hydro storage power station (Juklavatn – sjø).
1 Start level is only used for calculating emptying time for upper reservoir and filling time for lower reservoir. 3 Other discharge from Juklavatn (36.0 m3/s) results from:
• 250 MW in Mauranger power station (via Jukla)
E1 Mauranger hydro storage power station (Juklavatn - Hardangerfjorden)Reservoir Juklavatn (sjø) Volume 236.0 mill. m3 Power generation with max. power 24 hours/dayHRWL 1060.0 0.0 m Pumping with max. power hours/dayLRWL 950.0 0.0 m HRWL - LRWL 110.0 0.0 m Gross pressure head (2/3 res. level) 1023.3 m
Start level1 75 % Distance intake-outlet 6200 m (horizontal)
Other inflow2 m3/s Tunnel length 5250 m
Other discharge3 36.0 m3/s Penstock length 1344 mMax. power generated
Decrease in water level
Decrease in water level
Decrease in water level
Decrease in water level
Emptying of upper reservoir
Increase in water level
Filling of lower reservoir
[MW] [cm/hour] 1 day [m] 3 days [m] 7 days [m] [days] [cm/hour] [days]300 12 2.9 8.6 20.0 28.9400 14 3.3 10.0 23.3 24.8500 16 3.8 11.4 26.5 21.8600 18 4.3 12.8 29.8 19.4700 20 4.7 14.2 33.1 17.4800 22 5.2 15.6 36.4 15.9900 24 5.7 17.0 39.7 14.61000 26 6.1 18.4 42.9 13.4
Max. power generated
Max. absorp- tion capacity
Tunnel cross-section
Penstock cross-section
Tunnel volume Penstock volumeStation hall
volumeTotal excavated
volume[MW] [m3/s] [m2] [m2] [mill. m3] [mill. m3] [mill. m3] [mill. m3]
300 35 17 12 0.092 0.016 0.031 0.138400 47 23 16 0.122 0.021 0.039 0.182500 58 29 19 0.153 0.026 0.047 0.226600 70 35 23 0.183 0.031 0.054 0.269700 81 41 27 0.214 0.036 0.062 0.312800 93 47 31 0.244 0.042 0.068 0.354900 105 52 35 0.275 0.047 0.075 0.3971000 116 58 39 0.305 0.052 0.082 0.439

PROJECT NO. 12X757
REPORT NO. TR A7195
VERSION 1.1
53 of 86
Table 2.43 shows the water level decrease in Juklavatn (upper reservoir) in the event of maximum power generation for 24 hours/day in Mauranger hydro storage power station, when the design power output is 300 – 1,000 MW. The remaining inflow and discharge for these two reservoirs are indicated by the footnotes to the table. The start level in Juklavatn is 75 %. Table 2.44 shows the water level reduction (m) per day and drawdown time (days) to LRWL for Juklavatn when the power generation in Mauranger hydro storage power station is 400 MW. The number of hours/day of power generation and the start level (%) in Juklavatn are varied. Table 2.37: Water level reduction and emptying time for Juklavatn when
Mauranger hydro storage power station is generating 400 MW
Power generation (hours/day)
Start level (%)
Reduction in 1 day (m)
Emptying (days)
24 100
3.3 33.1
75 24.8 50 16.5
18 75 2.5 33.1 12 1.7 49.6
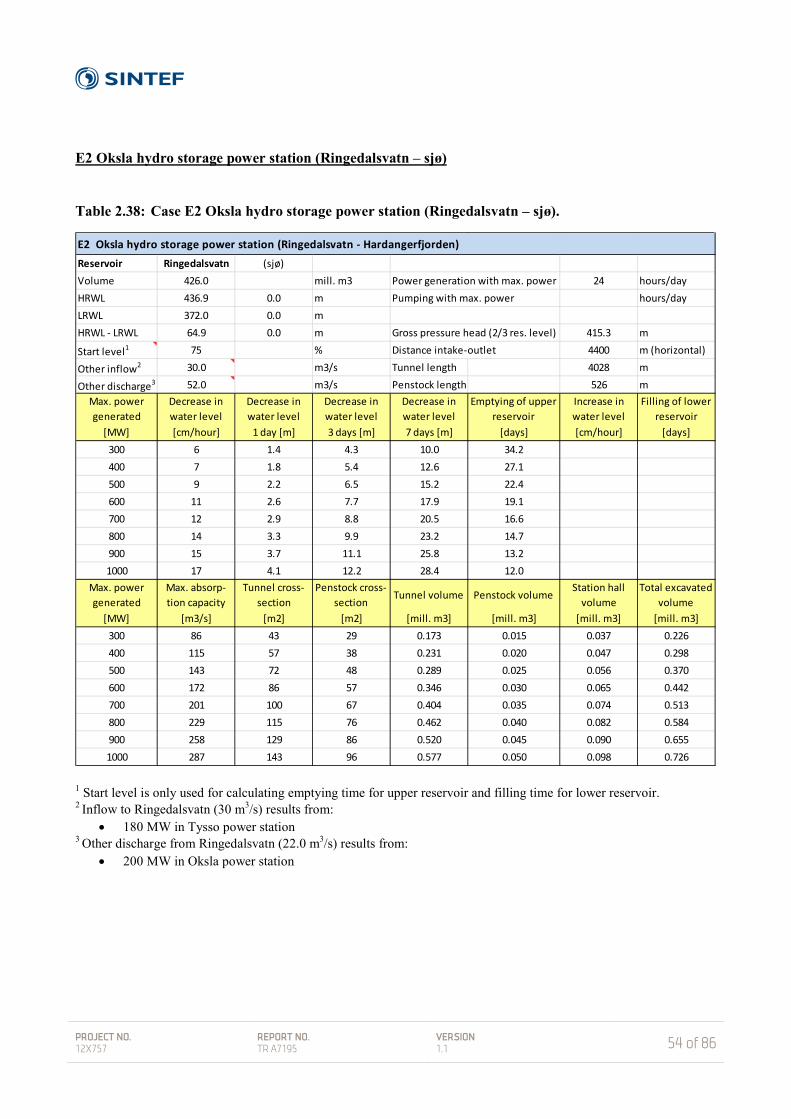
PROJECT NO. 12X757
REPORT NO. TR A7195
VERSION 1.1
54 of 86
E2 Oksla hydro storage power station (Ringedalsvatn – sjø) Table 2.38: Case E2 Oksla hydro storage power station (Ringedalsvatn – sjø).
1 Start level is only used for calculating emptying time for upper reservoir and filling time for lower reservoir. 2 Inflow to Ringedalsvatn (30 m3/s) results from:
• 180 MW in Tysso power station 3 Other discharge from Ringedalsvatn (22.0 m3/s) results from:
• 200 MW in Oksla power station
E2 Oksla hydro storage power station (Ringedalsvatn - Hardangerfjorden)Reservoir Ringedalsvatn (sjø) Volume 426.0 mill. m3 Power generation with max. power 24 hours/dayHRWL 436.9 0.0 m Pumping with max. power hours/dayLRWL 372.0 0.0 m HRWL - LRWL 64.9 0.0 m Gross pressure head (2/3 res. level) 415.3 m
Start level1 75 % Distance intake-outlet 4400 m (horizontal)
Other inflow2 30.0 m3/s Tunnel length 4028 m
Other discharge3 52.0 m3/s Penstock length 526 mMax. power generated
Decrease in water level
Decrease in water level
Decrease in water level
Decrease in water level
Emptying of upper reservoir
Increase in water level
Filling of lower reservoir
[MW] [cm/hour] 1 day [m] 3 days [m] 7 days [m] [days] [cm/hour] [days]300 6 1.4 4.3 10.0 34.2400 7 1.8 5.4 12.6 27.1500 9 2.2 6.5 15.2 22.4600 11 2.6 7.7 17.9 19.1700 12 2.9 8.8 20.5 16.6800 14 3.3 9.9 23.2 14.7900 15 3.7 11.1 25.8 13.21000 17 4.1 12.2 28.4 12.0
Max. power generated
Max. absorp- tion capacity
Tunnel cross-section
Penstock cross-section
Tunnel volume Penstock volumeStation hall
volumeTotal excavated
volume[MW] [m3/s] [m2] [m2] [mill. m3] [mill. m3] [mill. m3] [mill. m3]
300 86 43 29 0.173 0.015 0.037 0.226400 115 57 38 0.231 0.020 0.047 0.298500 143 72 48 0.289 0.025 0.056 0.370600 172 86 57 0.346 0.030 0.065 0.442700 201 100 67 0.404 0.035 0.074 0.513800 229 115 76 0.462 0.040 0.082 0.584900 258 129 86 0.520 0.045 0.090 0.6551000 287 143 96 0.577 0.050 0.098 0.726

PROJECT NO. 12X757
REPORT NO. TR A7195
VERSION 1.1
55 of 86
Table 2.45 shows the water level decrease in Ringeldalsvatn (upper reservoir) in the event of maximum power generation for 24 hours/day in Oksla hydro storage power station, when the design power output is 300 – 1,000 MW. The remaining inflow and discharge for these two reservoirs are indicated by the footnotes to the table. The start level in Ringeldalsvatn is 75 %. Table 2.46 shows the water level reduction (m) per day and drawdown time (days) to LRWL for Ringeldalsvatn when the power generation in Oksla hydro storage power station is 700 MW. The number of hours/day of power generation and the start level (%) in Ringeldalsvatn are varied. Table 2.39: Water level reduction and emptying time for Ringeldalsvatn when
Oksla hydro storage power station is generating 700 MW
Power generation (hours/day)
Start level (%)
Reduction in 1 day (m)
Emptying (days)
24 100
2.9 22.1
75 16.6 50 11.1
18 75 2.2 22.1 12 1.5 33.2
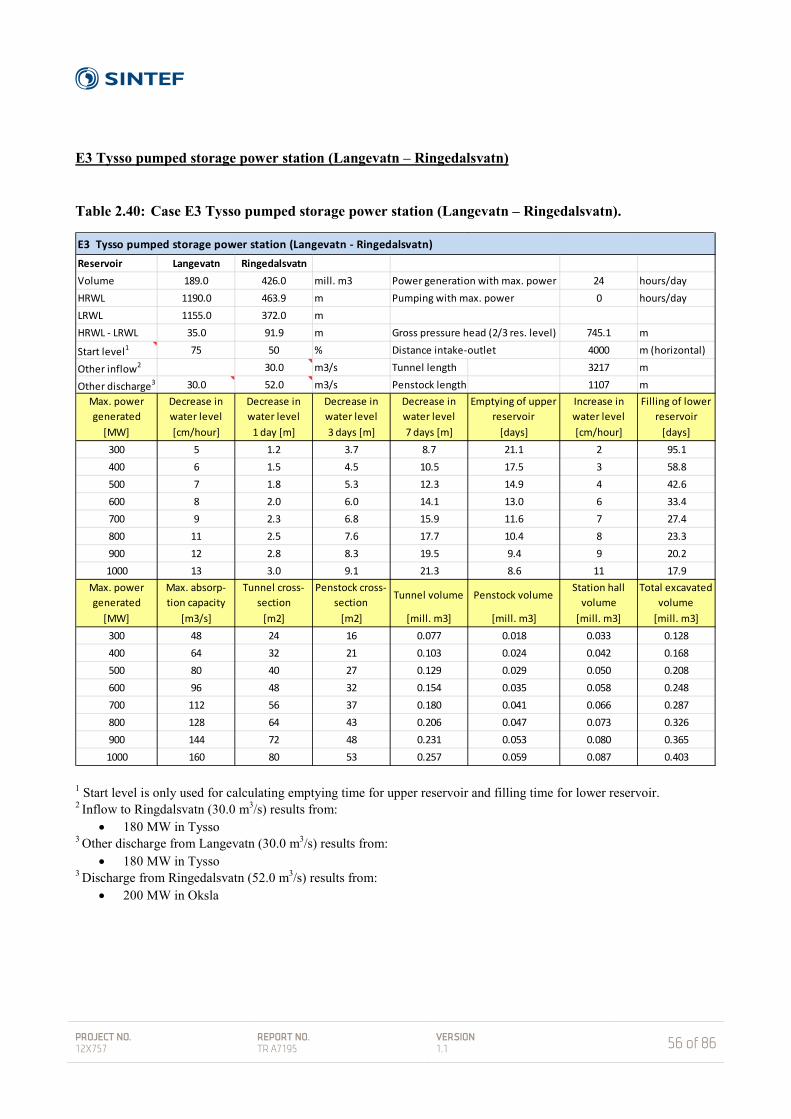
PROJECT NO. 12X757
REPORT NO. TR A7195
VERSION 1.1
56 of 86
E3 Tysso pumped storage power station (Langevatn – Ringedalsvatn) Table 2.40: Case E3 Tysso pumped storage power station (Langevatn – Ringedalsvatn).
1 Start level is only used for calculating emptying time for upper reservoir and filling time for lower reservoir. 2 Inflow to Ringdalsvatn (30.0 m3/s) results from:
• 180 MW in Tysso 3 Other discharge from Langevatn (30.0 m3/s) results from:
• 180 MW in Tysso 3 Discharge from Ringedalsvatn (52.0 m3/s) results from:
• 200 MW in Oksla
E3 Tysso pumped storage power station (Langevatn - Ringedalsvatn)Reservoir Langevatn Ringedalsvatn Volume 189.0 426.0 mill. m3 Power generation with max. power 24 hours/dayHRWL 1190.0 463.9 m Pumping with max. power 0 hours/dayLRWL 1155.0 372.0 m HRWL - LRWL 35.0 91.9 m Gross pressure head (2/3 res. level) 745.1 m
Start level1 75 50 % Distance intake-outlet 4000 m (horizontal)
Other inflow2 30.0 m3/s Tunnel length 3217 m
Other discharge3 30.0 52.0 m3/s Penstock length 1107 mMax. power generated
Decrease in water level
Decrease in water level
Decrease in water level
Decrease in water level
Emptying of upper reservoir
Increase in water level
Filling of lower reservoir
[MW] [cm/hour] 1 day [m] 3 days [m] 7 days [m] [days] [cm/hour] [days]300 5 1.2 3.7 8.7 21.1 2 95.1400 6 1.5 4.5 10.5 17.5 3 58.8500 7 1.8 5.3 12.3 14.9 4 42.6600 8 2.0 6.0 14.1 13.0 6 33.4700 9 2.3 6.8 15.9 11.6 7 27.4800 11 2.5 7.6 17.7 10.4 8 23.3900 12 2.8 8.3 19.5 9.4 9 20.21000 13 3.0 9.1 21.3 8.6 11 17.9
Max. power generated
Max. absorp- tion capacity
Tunnel cross-section
Penstock cross-section
Tunnel volume Penstock volumeStation hall
volumeTotal excavated
volume[MW] [m3/s] [m2] [m2] [mill. m3] [mill. m3] [mill. m3] [mill. m3]
300 48 24 16 0.077 0.018 0.033 0.128400 64 32 21 0.103 0.024 0.042 0.168500 80 40 27 0.129 0.029 0.050 0.208600 96 48 32 0.154 0.035 0.058 0.248700 112 56 37 0.180 0.041 0.066 0.287800 128 64 43 0.206 0.047 0.073 0.326900 144 72 48 0.231 0.053 0.080 0.3651000 160 80 53 0.257 0.059 0.087 0.403

PROJECT NO. 12X757
REPORT NO. TR A7195
VERSION 1.1
57 of 86
Table 2.47 shows the water level decrease in Langevatn (upper reservoir) and water level increase in Ringedalsvatn (lower reservoir) in the event of maximum power generation for 24 hours/day in Tysso pumped storage power station, when the design power output is 300 – 1,000 MW. The remaining inflow and discharge for these two reservoirs are indicated by the footnotes to the table. The start levels in the upper and lower reservoirs are 75 % and 50 %, respectively. Table 2.48 shows the water level reduction (m) per day and drawdown time (days) to LRWL for Langevatn when the power generation in Tysso pumped storage power station is 700 MW. The number of hours/day of power generation and pumping and the start level (%) in Langevatn are varied. Table 2.49 shows the filling time (days) to HRWL for Ringedalsvatn under corresponding conditions. Table 2.41: Water level reduction and emptying time for Langevatn when
Tysso pumped storage power station is generating 700 MW
Power generation (hours/day)
Pumping (hours/day)
Start level (%)
Reduction in 1 day (m)
Emptying (days)
24 0 100
2.3 15.4
75 11.6 50 7.7
18 0
75
1.7 15.4 6 1.2 21.0
12 0 1.1 23.1 6 0.7 38.6 12 0.2 115.7
Table 2.42: Filling time for Ringedalsvatn when Tysso pumped
storage power station is generating 700 MW
Power generation (hours/day)
Pumping (hours/day)
Start level (%)
Filling (days)
24 0 25 41.2 50 27.4 75 13.7
18 0
50
36.6 6 49.9
12 0 54.9 6 91.5 12 274.4
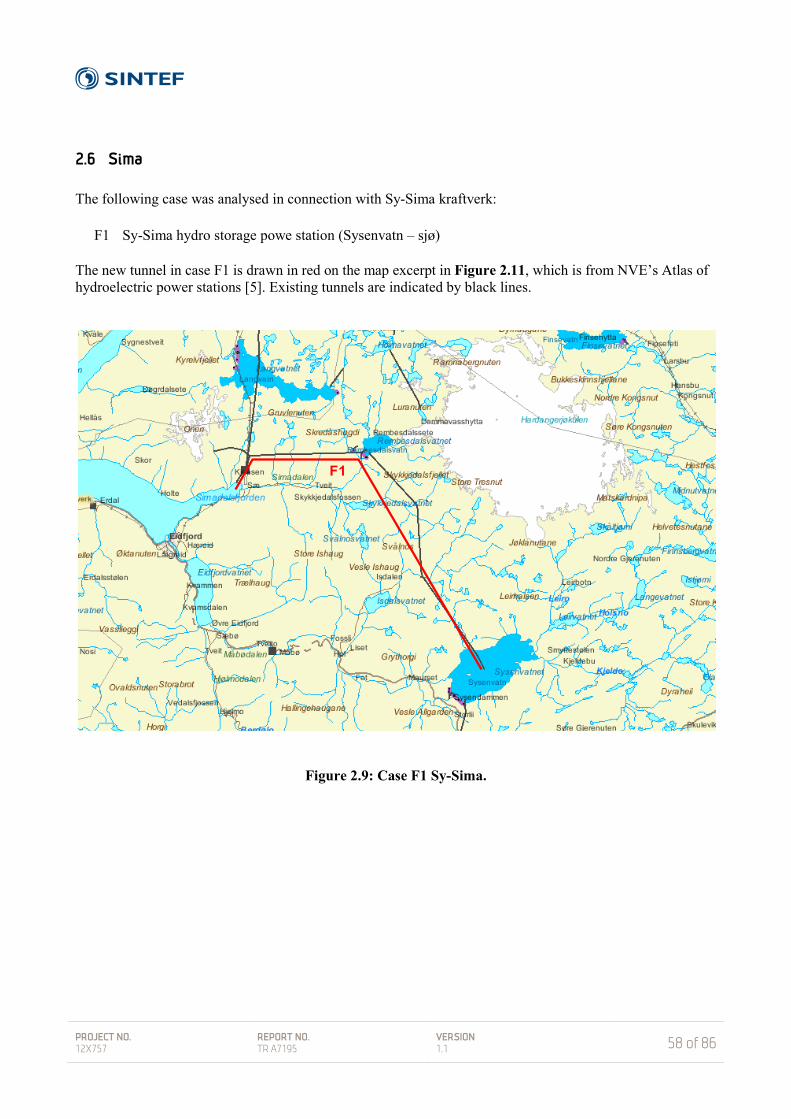
PROJECT NO. 12X757
REPORT NO. TR A7195
VERSION 1.1
58 of 86
2.6 Sima The following case was analysed in connection with Sy-Sima kraftverk:
F1 Sy-Sima hydro storage powe station (Sysenvatn – sjø) The new tunnel in case F1 is drawn in red on the map excerpt in Figure 2.11, which is from NVE’s Atlas of hydroelectric power stations [5]. Existing tunnels are indicated by black lines.
Figure 2.9: Case F1 Sy-Sima.
F1
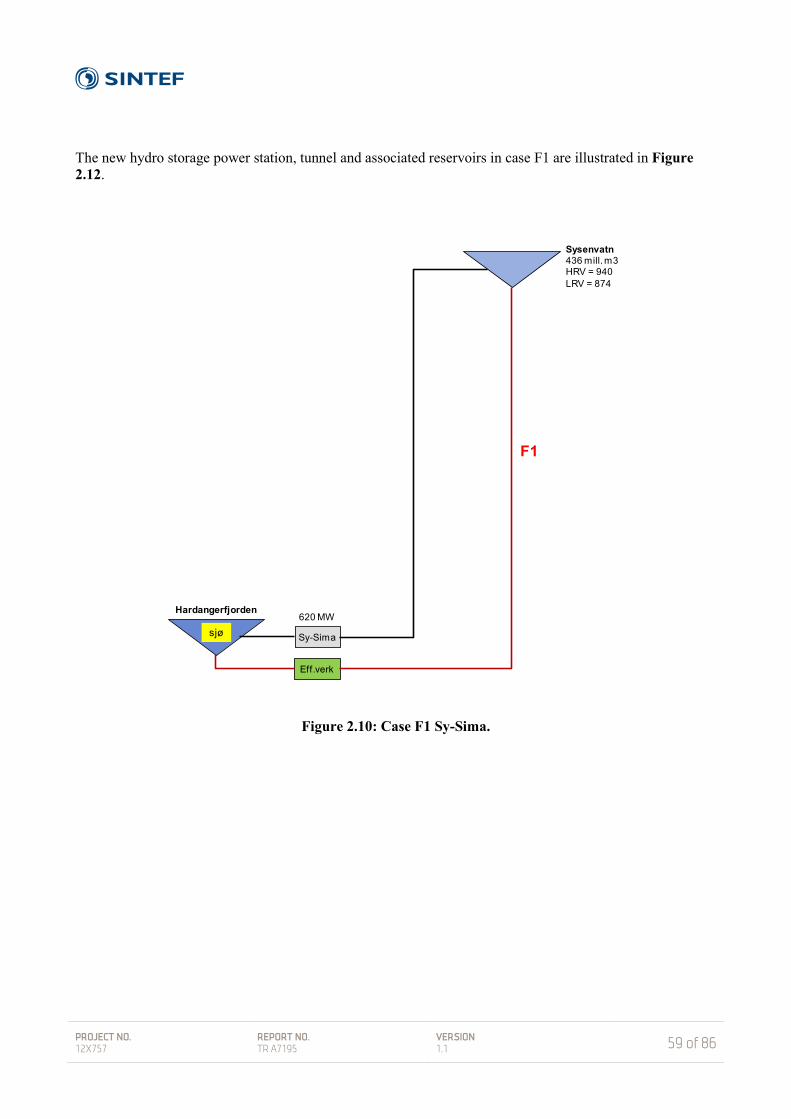
PROJECT NO. 12X757
REPORT NO. TR A7195
VERSION 1.1
59 of 86
The new hydro storage power station, tunnel and associated reservoirs in case F1 are illustrated in Figure 2.12.
Figure 2.10: Case F1 Sy-Sima.
Sy-Sima
Sysenvatn436 mill. m3HRV = 940LRV = 874
Eff.verk
F1
620 MWHardangerfjorden
sjø

PROJECT NO. 12X757
REPORT NO. TR A7195
VERSION 1.1
60 of 86
F1 Sy-Sima hydro storage power station (Sysenvatn – sjø) Table 2.43: Case F1 Sy-Sima hydro storage power station (Sysenvatn – sjø).
1 Start level is only used for calculating emptying time for upper reservoir and filling time for lower reservoir. 3 Other discharge from Sysenvatn (79.4 m3/s) results from:
• 620 MW i Sy-Sima
F1 Sy-Sima hydro storage power station (Sysenvatn - Hardangerfjorden)Reservoir Sysenvatn (sjø) Volume 436.0 mill. m3 Power generation with max. power 24 hours/dayHRWL 940.0 0.0 m Pumping with max. power hours/dayLRWL 874.0 0.0 m HRWL - LRWL 66.0 0.0 m Gross pressure head (2/3 res. level) 918.0 m
Start level1 75 % Distance intake-outlet 22600 m (horizontal)
Other inflow2 m3/s Tunnel length 21726 m
Other discharge3 79.4 m3/s Penstock length 1236 mMax. power generated
Decrease in water level
Decrease in water level
Decrease in water level
Decrease in water level
Emptying of upper reservoir
Increase in water level
Filling of lower reservoir
[MW] [cm/hour] 1 day [m] 3 days [m] 7 days [m] [days] [cm/hour] [days]300 6 1.5 4.6 10.8 32.0400 7 1.7 5.2 12.0 28.8500 8 1.9 5.7 13.2 26.2600 9 2.1 6.2 14.4 24.1700 9 2.2 6.7 15.6 22.2800 10 2.4 7.2 16.8 20.7900 11 2.6 7.7 18.0 19.31000 11 2.7 8.2 19.1 18.1
Max. power generated
Max. absorp- tion capacity
Tunnel cross-section
Penstock cross-section
Tunnel volume Penstock volumeStation hall
volumeTotal excavated
volume[MW] [m3/s] [m2] [m2] [mill. m3] [mill. m3] [mill. m3] [mill. m3]
300 39 19 13 0.423 0.016 0.032 0.471400 52 26 17 0.563 0.021 0.040 0.625500 65 32 22 0.704 0.027 0.048 0.779600 78 39 26 0.845 0.032 0.056 0.933700 91 45 30 0.986 0.037 0.063 1.086800 104 52 35 1.127 0.043 0.070 1.240900 117 58 39 1.268 0.048 0.077 1.3931000 130 65 43 1.409 0.053 0.084 1.546

PROJECT NO. 12X757
REPORT NO. TR A7195
VERSION 1.1
61 of 86
Table 2.50 shows the water level decrease in Sysenvatn (upper reservoir) in the event of maximum power generation for 24 hours/day in Sy-Sima hydro storage power station, when the design power output is 300 – 1,000 MW. The remaining inflow and discharge for these two reservoirs are indicated by the footnotes to the table. The start level in Sysenvatn is 75 %. Table 2.51 shows the water level reduction (m) per day and drawdown time (days) to LRWL for Sysenvatn when the power generation in Sy-Sima hydro storage power station is 700 MW. The number of hours/day of power generation and the start level (%) in Sysenvatn are varied. Table 2.44: Water level reduction and emptying time for Sysenvatn when
Sy-Sima hydro storage power station is generating 700 MW
Power generation (hours/day)
Start level (%)
Reduction in 1 day (m)
Emptying (days)
24 100
2.2 29.7
75 22.2 50 14.8
18 75 1.7 29.7 12 1.1 44.5

PROJECT NO. 12X757
REPORT NO. TR A7195
VERSION 1.1
62 of 86
2.7 Aurland - Tyin Two cases were analysed in connection with Aurland IV (Vangen) and Tyin power stations:
G1 Aurland/Vangen hydro storage power station (Viddalsvatn – sjø) G2 Tyin hydro storage power station (Tyin – Årdalsvatnet)
The new tunnel in case G1 is drawn in red on the map excerpt in Figure 2.13, which is from NVE’s Atlas of hydroelectric power stations [5]. Existing tunnels are indicated by black lines.
Figure 2.11: Case G1 Aurland/Vangen
G1
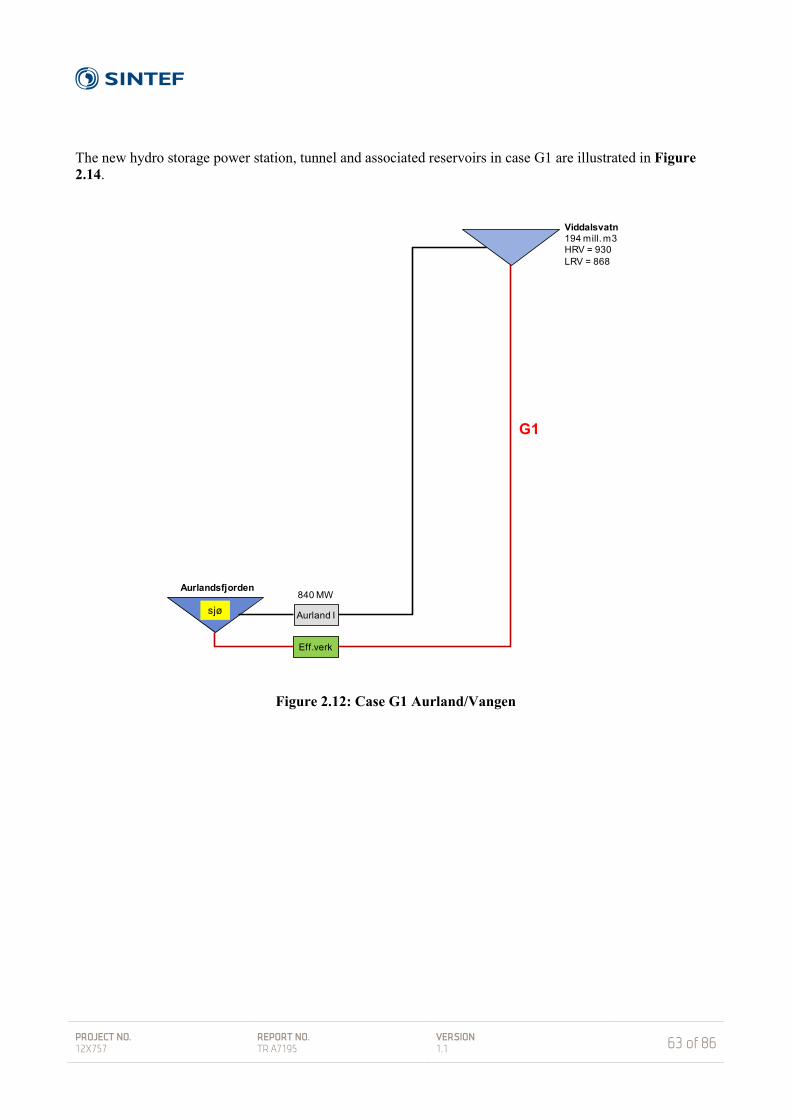
PROJECT NO. 12X757
REPORT NO. TR A7195
VERSION 1.1
63 of 86
The new hydro storage power station, tunnel and associated reservoirs in case G1 are illustrated in Figure 2.14.
Figure 2.12: Case G1 Aurland/Vangen
Aurland I
Viddalsvatn194 mill. m3HRV = 930LRV = 868
Eff.verk
G1
840 MWAurlandsfjorden
sjø
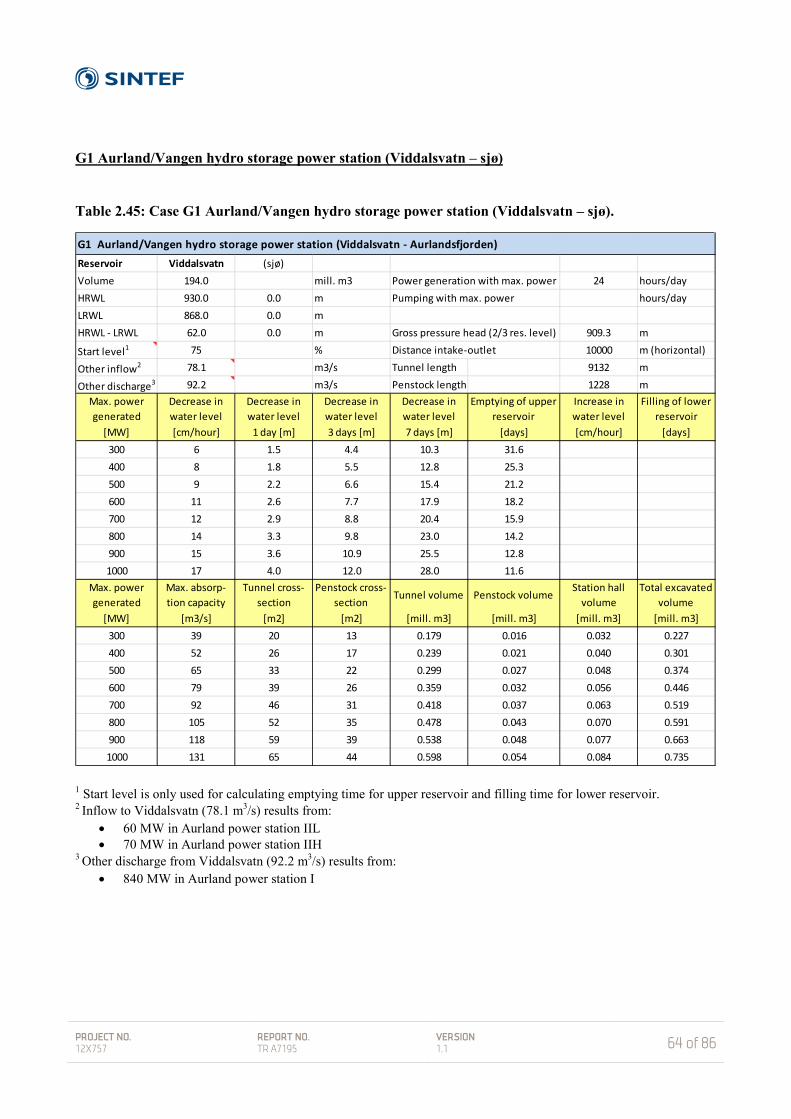
PROJECT NO. 12X757
REPORT NO. TR A7195
VERSION 1.1
64 of 86
G1 Aurland/Vangen hydro storage power station (Viddalsvatn – sjø) Table 2.45: Case G1 Aurland/Vangen hydro storage power station (Viddalsvatn – sjø).
1 Start level is only used for calculating emptying time for upper reservoir and filling time for lower reservoir. 2 Inflow to Viddalsvatn (78.1 m3/s) results from:
• 60 MW in Aurland power station IIL • 70 MW in Aurland power station IIH
3 Other discharge from Viddalsvatn (92.2 m3/s) results from: • 840 MW in Aurland power station I
G1 Aurland/Vangen hydro storage power station (Viddalsvatn - Aurlandsfjorden)Reservoir Viddalsvatn (sjø) Volume 194.0 mill. m3 Power generation with max. power 24 hours/dayHRWL 930.0 0.0 m Pumping with max. power hours/dayLRWL 868.0 0.0 m HRWL - LRWL 62.0 0.0 m Gross pressure head (2/3 res. level) 909.3 m
Start level1 75 % Distance intake-outlet 10000 m (horizontal)
Other inflow2 78.1 m3/s Tunnel length 9132 m
Other discharge3 92.2 m3/s Penstock length 1228 mMax. power generated
Decrease in water level
Decrease in water level
Decrease in water level
Decrease in water level
Emptying of upper reservoir
Increase in water level
Filling of lower reservoir
[MW] [cm/hour] 1 day [m] 3 days [m] 7 days [m] [days] [cm/hour] [days]300 6 1.5 4.4 10.3 31.6400 8 1.8 5.5 12.8 25.3500 9 2.2 6.6 15.4 21.2600 11 2.6 7.7 17.9 18.2700 12 2.9 8.8 20.4 15.9800 14 3.3 9.8 23.0 14.2900 15 3.6 10.9 25.5 12.81000 17 4.0 12.0 28.0 11.6
Max. power generated
Max. absorp- tion capacity
Tunnel cross-section
Penstock cross-section
Tunnel volume Penstock volumeStation hall
volumeTotal excavated
volume[MW] [m3/s] [m2] [m2] [mill. m3] [mill. m3] [mill. m3] [mill. m3]
300 39 20 13 0.179 0.016 0.032 0.227400 52 26 17 0.239 0.021 0.040 0.301500 65 33 22 0.299 0.027 0.048 0.374600 79 39 26 0.359 0.032 0.056 0.446700 92 46 31 0.418 0.037 0.063 0.519800 105 52 35 0.478 0.043 0.070 0.591900 118 59 39 0.538 0.048 0.077 0.6631000 131 65 44 0.598 0.054 0.084 0.735

PROJECT NO. 12X757
REPORT NO. TR A7195
VERSION 1.1
65 of 86
Table 2.52 shows the water level decrease in Sysenvatn (upper reservoir) in the event of maximum power generation for 24 hours/day in Sy-Sima hydro storage power station, when the design power output is 300 – 1,000 MW. The remaining inflow and discharge for these two reservoirs are indicated by the footnotes to the table. The start level in Sysenvatn is 75 %. Table 2.53 shows the water level reduction (m) per day and drawdown time (days) to LRWL for Sysenvatn when the power generation in Sy-Sima hydro storage power station is 700 MW. The number of hours/day of power generation and the start level (%) in Sysenvatn are varied. Table 2.46: Water level reduction and emptying time for Viddalsvatn when
Aurland hydro storage power station is generating 700 MW
Power generation (hours/day)
Start level (%)
Reduction in 1 day (m)
Emptying (days)
24 100
2.9 21.2
75 15.9 50 10.6
18 75 2.2 21.2 12 1.5 31.9

PROJECT NO. 12X757
REPORT NO. TR A7195
VERSION 1.1
66 of 86
The new tunnel in case G2 is drawn in red on the map excerpt in Figure 2.15, which is from NVE’s Atlas of hydroelectric power stations [5]. Existing tunnels are indicated by black lines.
Figure 2.13: Case G2 Tyin.
G2
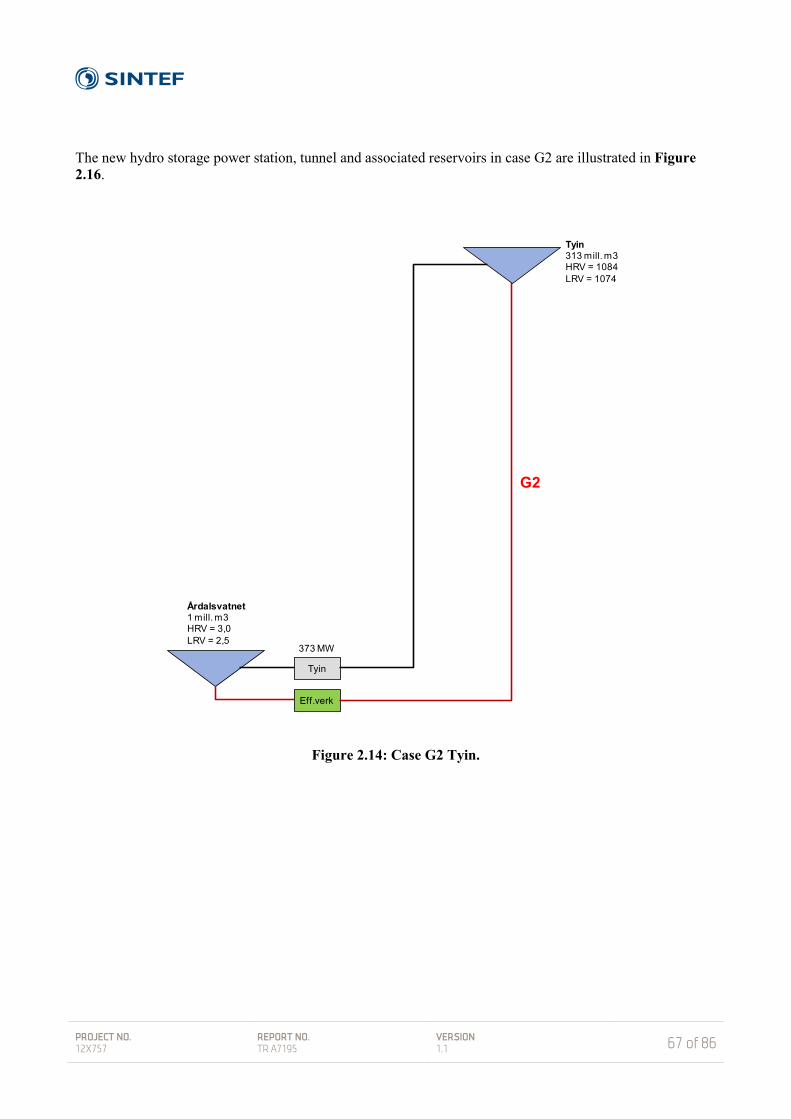
PROJECT NO. 12X757
REPORT NO. TR A7195
VERSION 1.1
67 of 86
The new hydro storage power station, tunnel and associated reservoirs in case G2 are illustrated in Figure 2.16.
Figure 2.14: Case G2 Tyin.
Tyin
Tyin313 mill. m3HRV = 1084LRV = 1074
Eff.verk
G2
373 MW
Årdalsvatnet1 mill. m3HRV = 3,0LRV = 2,5

PROJECT NO. 12X757
REPORT NO. TR A7195
VERSION 1.1
68 of 86
G2 Tyin hydro storage power station (Tyin – Årdalsvatnet) Table 2.47: Case G2 Tyin hydro storage power station (Tyin – Årdalsvatnet).
1 Start level is only used for calculating emptying time for upper reservoir and filling time for lower reservoir. 3 Other discharge from Tyin (40.0 m3/s) results from:
• 373 MW in Tyin power station There is a lack of information about the discharge to Årdalsvatnet and further discharge to Årdalsfjorden via Hæreidselva which is needed to calculate the increase in water level in Årdalsvatnet. Årdalsvatnet is not regulated.
G2 Tyin hydro storage power station (Tyin - Årdalsvatnet)Reservoir Tyin Årdalsvatnet Volume 313.0 1.0 mill. m3 Power generation with max. power 24 hours/dayHRWL 1083.9 3.0 m Pumping with max. power 0 hours/dayLRWL 1073.6 2.5 m HRWL - LRWL 10.3 0.5 m Gross pressure head (2/3 res. level) 1077.6 m
Start level1 75 50 % Distance intake-outlet 20000 m (horizontal)
Other inflow2 40.0 m3/s Tunnel length 18929 m
Other discharge3 40.0 40.0 m3/s Penstock length 1515 mMax. power generated
Decrease in water level
Decrease in water level
Decrease in water level
Decrease in water level
Emptying of upper reservoir
Increase in water level
Filling of lower reservoir
[MW] [cm/hour] 1 day [m] 3 days [m] 7 days [m] [days] [cm/hour] [days]300 1 0.2 0.6 1.5 37.1 6 0.2400 1 0.2 0.7 1.7 32.3 8 0.1500 1 0.3 0.8 1.9 28.5 10 0.1600 1 0.3 0.9 2.1 25.6 12 0.1700 1 0.3 1.0 2.3 23.2 14 0.1800 2 0.4 1.1 2.6 21.2 16 0.1900 2 0.4 1.2 2.8 19.5 18 0.11000 2 0.4 1.3 3.0 18.1 20 0.1
Max. power generated
Max. absorp- tion capacity
Tunnel cross-section
Penstock cross-section
Tunnel volume Penstock volumeStation hall
volumeTotal excavated
volume[MW] [m3/s] [m2] [m2] [mill. m3] [mill. m3] [mill. m3] [mill. m3]
300 33 17 11 0.314 0.017 0.031 0.361400 44 22 15 0.418 0.022 0.039 0.479500 55 28 18 0.523 0.028 0.047 0.597600 66 33 22 0.627 0.033 0.054 0.715700 77 39 26 0.732 0.039 0.061 0.832800 88 44 29 0.836 0.045 0.068 0.949900 99 50 33 0.941 0.050 0.074 1.0661000 110 55 37 1.046 0.056 0.081 1.182

PROJECT NO. 12X757
REPORT NO. TR A7195
VERSION 1.1
69 of 86
Table 2.54 shows the water level decrease in Tyin (upper reservoir) in the event of maximum power generation for 24 hours/day in Tyin hydro storage power station, when the design power output is 300 – 1,000 MW. The remaining inflow and discharge for these two reservoirs are indicated by the footnotes to the table. The start level in Tyin is 75 %. Table 2.55 shows the water level reduction (m) per day and drawdown time (days) to LRWL for Tyin when the power generation in Tyin hydro storage power station is 700 MW. The number of hours/day of power generation and the start level (%) in Tyin are varied. Table 2.48: Water level reduction and emptying time for Tyin when
Tyin hydro storage power station is generating 700 MW
Power generation (hours/day)
Start level (%)
Reduction in 1 day (m)
Emptying (days)
24 100
0.3 30.9
75 23.2 50 15.4
18 75 0.3 30.9 12 0.2 46.3
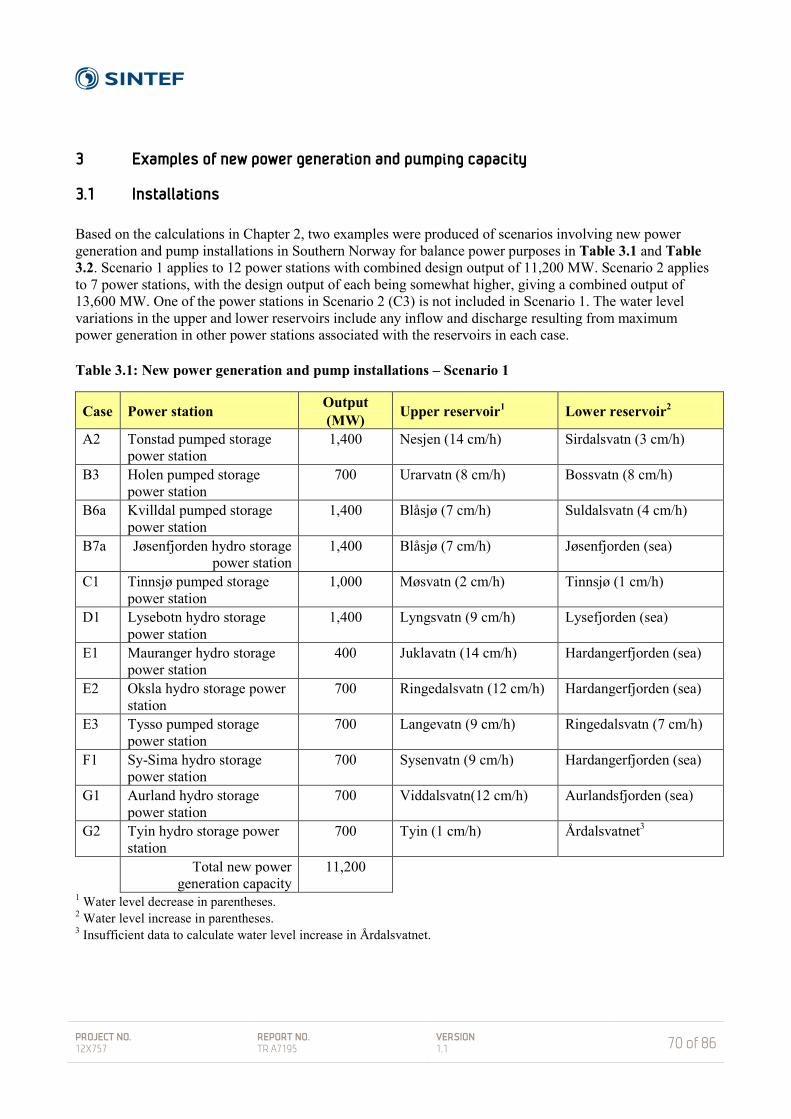
PROJECT NO. 12X757
REPORT NO. TR A7195
VERSION 1.1
70 of 86
3 Examples of new power generation and pumping capacity
3.1 Installations Based on the calculations in Chapter 2, two examples were produced of scenarios involving new power generation and pump installations in Southern Norway for balance power purposes in Table 3.1 and Table 3.2. Scenario 1 applies to 12 power stations with combined design output of 11,200 MW. Scenario 2 applies to 7 power stations, with the design output of each being somewhat higher, giving a combined output of 13,600 MW. One of the power stations in Scenario 2 (C3) is not included in Scenario 1. The water level variations in the upper and lower reservoirs include any inflow and discharge resulting from maximum power generation in other power stations associated with the reservoirs in each case. Table 3.1: New power generation and pump installations – Scenario 1
Case Power station Output (MW) Upper reservoir1 Lower reservoir2
A2 Tonstad pumped storage power station
1,400 Nesjen (14 cm/h) Sirdalsvatn (3 cm/h)
B3 Holen pumped storage power station
700 Urarvatn (8 cm/h) Bossvatn (8 cm/h)
B6a Kvilldal pumped storage power station
1,400 Blåsjø (7 cm/h) Suldalsvatn (4 cm/h)
B7a Jøsenfjorden hydro storage power station
1,400 Blåsjø (7 cm/h) Jøsenfjorden (sea)
C1 Tinnsjø pumped storage power station
1,000 Møsvatn (2 cm/h) Tinnsjø (1 cm/h)
D1 Lysebotn hydro storage power station
1,400 Lyngsvatn (9 cm/h) Lysefjorden (sea)
E1 Mauranger hydro storage power station
400 Juklavatn (14 cm/h) Hardangerfjorden (sea)
E2 Oksla hydro storage power station
700 Ringedalsvatn (12 cm/h) Hardangerfjorden (sea)
E3 Tysso pumped storage power station
700 Langevatn (9 cm/h) Ringedalsvatn (7 cm/h)
F1 Sy-Sima hydro storage power station
700 Sysenvatn (9 cm/h) Hardangerfjorden (sea)
G1 Aurland hydro storage power station
700 Viddalsvatn(12 cm/h) Aurlandsfjorden (sea)
G2 Tyin hydro storage power station
700 Tyin (1 cm/h) Årdalsvatnet3
Total new power generation capacity
11,200
1 Water level decrease in parentheses. 2 Water level increase in parentheses. 3 Insufficient data to calculate water level increase in Årdalsvatnet.

PROJECT NO. 12X757
REPORT NO. TR A7195
VERSION 1.1
71 of 86
Table 3.2: New power generation and pump installations – Scenario 2
Case Power station Output (MW) Upper reservoir1 Lower reservoir2
A2 Tonstad pumped storage power station
1,400 Nesjen (14 cm/h) Sirdalsvatn (3 cm/h)
B3 Holen pumped storage power station
1,000 Urarvatn (10 cm/h) Bossvatn (12 cm/h)
B6b Kvilldal pumped storage power station
2,400 Blåsjø (11 cm/h) Suldalsvatn (6 cm/h)
B7b Jøsenfjorden hydro storage power station
2,400 Blåsjø (11 cm/h) Jøsenfjorden (sea)
C2 Tinnsjø pumped storage power station
2,000 Møsvatn (3 cm/h) Tinnsjø (4 cm/h)
C3 Tinnsjø pumped storage power station
2,400 Kallhovd (7 cm/h) Tinnsjø (4 cm/h)
D1 Lysebotn hydro storage power station
2,000 Lyngsvatn (13 cm/h) Lysefjorden (sea)
Total new power generation capacity
13,600
1 Water level decrease in parentheses. 2 Water level increase in parentheses. The power generation outputs (design) in the two scenarios were chosen mainly so that the water level change in the upper and lower reservoirs does not exceed 13 cm/hour. For two of the reservoirs (Nesjen and Juklavatn) the rate is 14 cm/hour. According to research into the stranding of salmon in rivers, the water level should not sink by more than 13 cm/hour [8]. Although this is not directly applicable to lakes, we have used this as a rule of thumb for acceptable water level reduction in reservoirs. Scenario 2 shows how the capacity of the 7 largest power stations in Scenario 1 can be further increased to provide 2,400 MW higher output than all the 12 power stations in Scenario 1. Pumping/drawdown from Blåsjø and Svartevatn to Bossvatn (Cases B1 and B2) is not included in these scenarios since new generation facilities with discharge into Bossvatn in addition to 1,000 MW generation in Holen from Urarvatn will result in problematical water level increase in Bossvatn unless pumping is carried out during periods of power generation.
3.2 Potential for increased power generation and pumping capacity in Norway In CEDREN’s HydroPeak project, three scenarios are described with regard to the export of balance power from Norway [6]. The main scenario involves increasing output by 20,000 MW. Table 3.3 shows that the output of the power stations studied in Chapter 2 can be increased by 18,200 MW without the water level changes in the upper and lower reservoirs exceeding 14 cm/hour. How long the power stations are able to deliver this power output will depend among other things on the current regulations regarding highest and lowest regulated water levels (HRWL and LRWL), as well as what strategies are adopted with regard to pumping in the case of pumped storage power stations. The figures shown in Table 3.3 are from the tables in Chapter 2, and in the case of some of the power stations the capacity agrees with Scenario 1 or Scenario 2. By including more cases in Southern Norway in addition to some in Northern Norway, it will be possible to increase the output of existing hydroelectric reservoirs by a further 1,800 MW to give a total of 20,000 MW
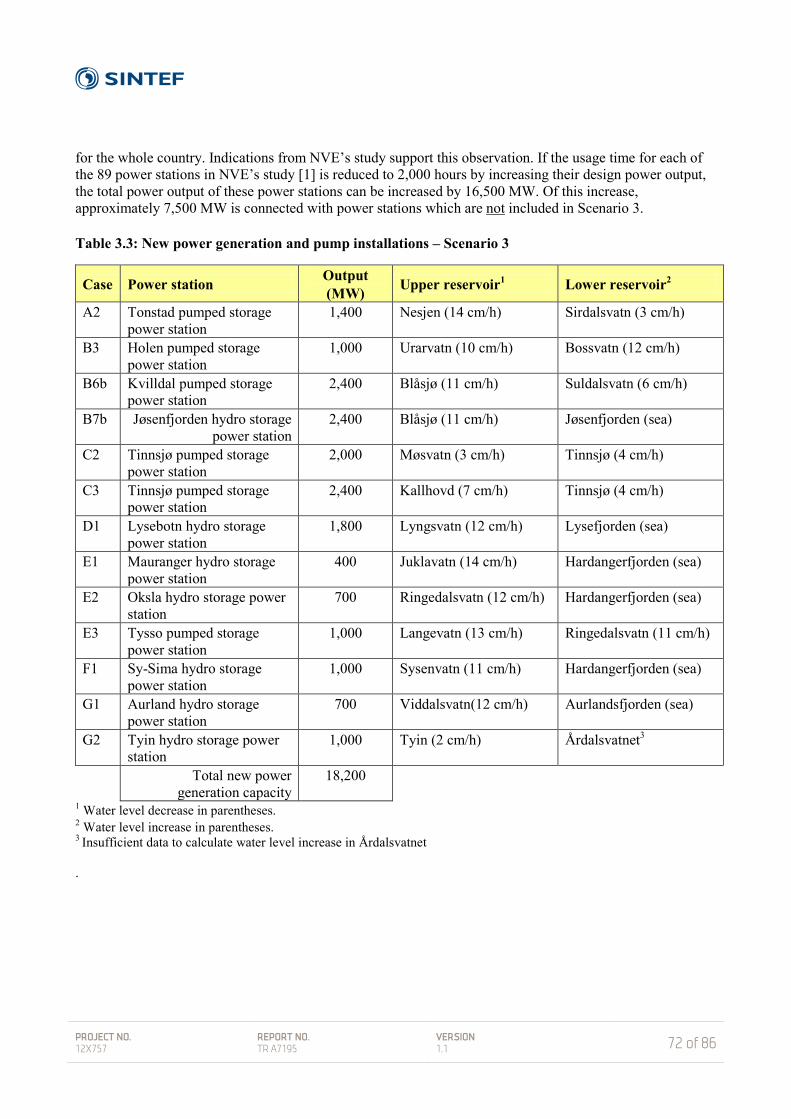
PROJECT NO. 12X757
REPORT NO. TR A7195
VERSION 1.1
72 of 86
for the whole country. Indications from NVE’s study support this observation. If the usage time for each of the 89 power stations in NVE’s study [1] is reduced to 2,000 hours by increasing their design power output, the total power output of these power stations can be increased by 16,500 MW. Of this increase, approximately 7,500 MW is connected with power stations which are not included in Scenario 3. Table 3.3: New power generation and pump installations – Scenario 3
Case Power station Output (MW) Upper reservoir1 Lower reservoir2
A2 Tonstad pumped storage power station
1,400 Nesjen (14 cm/h) Sirdalsvatn (3 cm/h)
B3 Holen pumped storage power station
1,000 Urarvatn (10 cm/h) Bossvatn (12 cm/h)
B6b Kvilldal pumped storage power station
2,400 Blåsjø (11 cm/h) Suldalsvatn (6 cm/h)
B7b Jøsenfjorden hydro storage power station
2,400 Blåsjø (11 cm/h) Jøsenfjorden (sea)
C2 Tinnsjø pumped storage power station
2,000 Møsvatn (3 cm/h) Tinnsjø (4 cm/h)
C3 Tinnsjø pumped storage power station
2,400 Kallhovd (7 cm/h) Tinnsjø (4 cm/h)
D1 Lysebotn hydro storage power station
1,800 Lyngsvatn (12 cm/h) Lysefjorden (sea)
E1 Mauranger hydro storage power station
400 Juklavatn (14 cm/h) Hardangerfjorden (sea)
E2 Oksla hydro storage power station
700 Ringedalsvatn (12 cm/h) Hardangerfjorden (sea)
E3 Tysso pumped storage power station
1,000 Langevatn (13 cm/h) Ringedalsvatn (11 cm/h)
F1 Sy-Sima hydro storage power station
1,000 Sysenvatn (11 cm/h) Hardangerfjorden (sea)
G1 Aurland hydro storage power station
700 Viddalsvatn(12 cm/h) Aurlandsfjorden (sea)
G2 Tyin hydro storage power station
1,000 Tyin (2 cm/h) Årdalsvatnet3
Total new power generation capacity
18,200
1 Water level decrease in parentheses. 2 Water level increase in parentheses. 3 Insufficient data to calculate water level increase in Årdalsvatnet .

PROJECT NO. 12X757
REPORT NO. TR A7195
VERSION 1.1
73 of 86
4 Environmental impact
4.1 General The environmental impact of increasing design power output and pumping capacity between existing reservoirs in Norway can be roughly divided into direct impact on the reservoirs in question and direct impact on affected land areas. Distinction can also be made between impact during the construction and operational phases. Impact on reservoirs and catchment areas results from the construction and operation of the power station facilities, while the impact on land areas is mainly due to infrastructure such as roads, rock dumps, connection facilities, transmission grids and other necessary installations. It is assumed that all water flow is routed through tunnels and that power stations are constructed in underground rock cavities. This report does not consider indirect environmental impacts such as the effect of replacing fossil-fuel based power generation with hydroelectric generation or those resulting from the manufacture of turbines. Initially, this report comments in general terms on some possible environmental impacts before dealing with each individual case. Only established knowledge has been used, including the results of two projects in the comprehensive “EFFEKT” programme which was carried out at the end of the 1990s under the auspices of the Research Council of Norway [7, 8], as well as a limited selection of documentation used for making a rough estimate of environmental impact. This report must not in any way be seen as either an exhaustive assessment of environmental impact or an impact study.
4.1.1 The construction phase In the construction phase, the majority of environmental impacts known from traditional power station operation and maintenance will be experienced, with the exception of all the impacts connected with the construction of dams and flooding, since it is assumed that reservoirs will only be used within the existing HRWL and LRWL constraints. Reservoirs and water systems In connection with tunnelling operations, construction work and the erection of other infrastructure, there may be some increase in erosion and sediment supply to reservoirs and water systems, but this cannot be considered a major environmental impact. We assume that modern principles of construction operations will be observed, with adequate environmental consideration. There may also be a need to adjust the operational pattern of existing installations for a period during construction operations, but we assume that in most cases the operation of existing installations will not be affected. Land areas Major construction operations will be needed, particularly in connection with tunnelling operations. SINTEF [9] has estimated the manpower requirements for tunnelling operations when constructing facilities for 20,000 MW of power generation and pumping power by 2030 at approximately 30,000 man-years. The construction phase will affect the natural environment, game and recreational activities in the affected land areas, where it will be particularly important to pay attention to vulnerable species such as reindeer as well as special types of landscape. This will depend strongly on the location and it will be necessary to carry out impact studies and surveys. It will be necessary to dispose of about 40 million m³ of excavated rock mass [9], preferably close to the construction sites. It will be of considerable benefit both to the environment and the project’s economics if

PROJECT NO. 12X757
REPORT NO. TR A7195
VERSION 1.1
74 of 86
an alternative use can be found for the excavated rock, for example in roads, quays, breakwaters, embankments and dam reinforcements and as fill for commercial or residential building sites, and so on. However, there is reason to believe that a lot of the rock mass must be dumped and planted on, which will have an impact on flora and fauna. The impact will vary, depending on local conditions, and it will be important to find good local solutions.
4.1.2 The operational phase Here we will not deal with the impact of existing water system regulation and encroachment, but with the additional impact of the expanded installation of power generation and pumping facilities. Reservoirs The environmental impact on reservoirs will generally be determined by their size and shape, combined with the size of the design output and the planned operational patterns adopted by the new hydro storage and pumped storage power stations. In all circumstances we anticipate an increased variation in water level from hour to hour and from day to day, while in many reservoirs to which water is pumped, the water level will be higher in the late winter and filling will probably occur slightly earlier in the spring. This is because wind-powered generation will be greatest in the winter, but it will also depend on many other factors, such as the market, grid connection and framework conditions. Increased use of hydro storage and pumped storage will in many cases result in increased erosion in the affected reservoir, especially so-called internal erosion resulting from relatively rapid changes in water pressure. In most cases the drawdown zone between HRWL and LRWL will be subject to rises and falls in water level more frequently than it is the case with existing installations. Although on average this may result in higher water levels, there will also be less predictable variations in water levels, which may lead to greater problems for public use in the form of recreation, fishing and boat traffic. Most regulated reservoirs are at present characterised by very moderate current flow rates. Larger installations with more pumping may lead to changes in current conditions which can have both positive and negative consequences. Increased current flow rates and increased through-flow can lead to better mixing of water bodies, more efficiently stirring up and transporting nutrients. In some cases this may locally result in increased erosion. It may result in changes in water stratification in reservoirs where this is normally established, and this in turn can affect water quality and temperature. Because most Norwegian reservoirs are generally nutrient-poor and cold, this is probably not of great significance, but in some low-lying water bodies which may be of interest as lower reservoirs in connection with pumped storage schemes, this may have consequences for the ecosystem. The water temperature in reservoirs is indirectly affected by changes in water flow and stratification, but the greatest effect may result from variations in power generation and pumping. Increased power generation, with water from a mountain reservoir being released in lowland areas, will result in reduced water temperature in a downstream reservoir. Since the growth of most species depends on temperature, this will be reduced in periods of increased power generation. Conversely, interruptions in operations or pumping will result in lower or no transfer of cold water and thence higher than normal water temperature in a downstream reservoir. In an upstream reservoir there will be a similar, converse effect. Ice cover may be strongly affected by increased power generation and pumping, and there is every reason to address this challenge very seriously. The existing operational pattern in which reservoirs are gradually drawn down in the course of the winter generally produces stable ice cover even though it may result in sloping ice layers and cracks in areas close to shore. A new operational pattern with alternating pumping and generation, and the possible transfer of sometimes warmer water combined with increased through-flow rates

PROJECT NO. 12X757
REPORT NO. TR A7195
VERSION 1.1
75 of 86
may result in reduced or non-existent ice cover in many places. This may represent a real danger to recreational access in winter and must be carefully evaluated in each case. A lack of ice cover may also have an effect on the behaviour of fish and result in increased energy consumption and reduced winter survival rate, but this must be studied in each individual reservoir. Changes in physical conditions as described above will also impact the ecosystem of plants, algae, domestic animals, fish and terrestrial species which are associated with fresh water (water birds, otters, beavers, etc.). However, a reservoir normally already has an ecosystem which has been significantly affected by water level variation, and it is difficult to make any general statements about the effects of increased installation of hydro storage and pumped storage power stations. These will depend on local conditions and must be studied in each case. In general the effect on the regulated reservoir may be either positive or negative. It is particularly important to study the effects in a downstream reservoir carefully, since species diversity, fertility and vulnerability are often greater in regulated reservoirs located in low-lying areas. Pumping water from a reservoir to a more elevated reservoir in the same catchment system may result in species from more low-lying areas of the catchment area being transported upstream to areas above their natural zone of distribution. This may threaten biological diversity. Similarly, pumping and generating flow between two reservoirs in different catchment areas may result in the transfer of alien species and impact biological diversity. Water systems downstream of affected reservoirs The above-mentioned changes in a reservoir will also have consequences for any river sections and water systems downstream, although these will be buffered and compensated to some extent. The potentially most serious negative impacts are probably the danger of increased sediment transport as a result of erosion in a reservoir, and changed temperature conditions. Reduced temperatures will also here lead to reduced population growth in most species, while increased temperature will have the opposite effect. The magnitude of the effects in downstream rivers and water systems will depend on local conditions and the nature of the regulating installations. Fjords In the case of power stations which discharge into fjords, the effects will to a certain extent be as for discharge into a reservoir, especially if the discharge takes place in relatively small and partly isolated fjord arms. Of course there will be no rapid changes in water level in a fjord, but certain impacts connected with through-flow pattern, water temperature and ice conditions (if the fjord becomes partly ice-covered) may be encountered. If increased power generation also results in increased erosion and sediment transport from upstream reservoirs and rivers, this will result in an increase in sediment transport to the fjord. Any changes in physical conditions can also have an impact on biological conditions. However, as long as increased output combined with reduced operating time does not entail an overall increase in water transport to the same point in the fjord, there is little reason to believe that increased power generation with water discharge into a fjord will lead to serious environmental consequences. Land areas In the operational phase there will be very little additional impact on land areas apart from that of infrastructure which was established during the construction phase, which in general means more, or more robust, transmission grids with larger masts and wider power line routes. These have direct impact on flora and fauna, as well as the resulting aesthetic impression and landscape appearance. Inspection, maintenance and other work at the installations will also result in more traffic in the area.

PROJECT NO. 12X757
REPORT NO. TR A7195
VERSION 1.1
76 of 86
4.2 Environmental impacts of selected cases Table 4.1 shows an overview of possible environmental impacts based on evaluations and general know-how, but with no location-specific background data. Evaluation was carried out for the hydro storage and pumped storage power stations included in Scenario 2. These are listed in Table 3.2 (A2, B3, B6a, B7a, C1, D1, E1, E2, E3, F1, G1 and G2). To enable description of environmental impacts during power generation and pumping in more detail, additional knowledge and more detailed studies of the individual reservoirs are needed. Research activities are going on in CEDREN which are contributing to improved knowledge of environmental impact and environmental design. Environmental impacts in specific reservoirs should be studied in more detail with regard to physical and biological conditions resulting from power generation and pumping.

PROJECT NO. 12X757
REPORT NO. TR A7195
VERSION 1.1
77 of 86
Table 4.1: Environmental impacts
Possible environmental impacts based on evaluations and general know-how, but with no location-
specific background data
Tons
tad
pum
ped
stora
ge
pow
er st
atio
n (N
esje
n –
Sird
alva
tn)
Hol
en p
umpe
d st
orag
e po
wer
stat
ion
(Ura
rvat
n –
Boss
vatn
)
Kvi
lldal
pum
ped
stora
ge
pow
er st
atio
n (B
låsj
ø –
Suld
alsv
atn)
Jøse
nfjo
rden
hyd
ro st
orag
e po
wer
stat
ion
(Blå
sjø
– Jø
senf
jord
en)
Tinn
sjø p
umpe
d st
orag
e po
wer
stat
ion
(Møs
vatn
– T
inns
jø)
Lyse
botn
hyd
ro st
orag
e po
wer
stat
ion
(Lyn
gsva
tn –
Lys
efjo
rden
)
Mau
rang
er h
ydro
stor
age
pow
er st
atio
n (J
ukla
vatn
–
Har
dang
erfjo
rden
) O
ksla
hyd
ro st
orag
e po
wer
st
atio
n (R
inge
dalsv
atn
– H
arda
nger
fjord
en)
Tyss
o pu
mpe
d st
orag
e po
wer
stat
ion
(Lan
gvat
n –
Rin
geda
lsva
tn)
Sy-S
ima
hydr
o sto
rage
po
wer
stat
ion
(Sys
enva
tn –
H
arda
nger
fjord
en)
Aur
land
hyd
ro st
orag
e po
wer
stat
ion
(Vid
dals
vatn
–
Aur
land
sfjo
rden
)
Tyin
hyd
ro st
orag
e po
wer
st
atio
n (T
yin
– Å
rdal
svat
net)
A2 B3 B6a B7a C1 D1 E1 E2 E3 F1 G1 G2 Encroachment on new, untouched land areas in the construction phase
Not very likely
Not very likely
Not very likely Yes Not very
likely Not very
likely Yes Not very likely Yes Not very
likely Some Some
Permanent encroachment in new, untouched land areas
Not very likely
Not very likely
Not very likely Likely Not very
likely Not very
likely Likely Not very likely Likely Not very
likely Not very
likely Not very
likely Water level changes in upper reservoir Some Some Small Small Small Small Small Small Small Small Small Small Erosion in upper reservoir Possible Some Not very
likely No Not very likely No Not very
likely Not very
likely Possible No Not very likely No
Ice conditions in upper reservoir Affected Affected Little impact
Little impact Affected Little
impact Little
impact Little
impact Affected Little impact
Little impact Little impact
Biological impacts in upper reservoir Affected Possible Affected Not very likely Small Not very
likely Not very
likely Not very
likely Affected Not very likely
Not very likely
Not very likely
Impact on water systems downstream of upper reservoir Possible Possible Not very
likely Not very
likely Not very
likely Not very
likely Not very
likely Not very
likely Not very
likely Not very
likely Not very
likely Not very
likely Water level changes in lower reservoir Small Affected Small N/A Small N/A N/A N/A Small N/A N/A Unknown2 Erosion in lower reservoir Local Likely Local N/A Not very
likely N/A N/A N/A Possible N/A N/A Unknown2
Ice conditions in lower reservoir Localised Affected Possible Very localised1 Localised Very
localised1 Very
localised1 Very
localised1 Affected Very localised1
Very localised1 Affected
Biological impacts in lower reservoir Affected Possible Possible N/A Possible N/A N/A N/A Possible N/A N/A Unknown2 Impact on water systems downstream of lower reservoir Possible Possible Possible Possible1 Possible Possible1 Possible1 Localised1 Possible Possible1 Possible1 Possible2
1 Impacts on the fjord (sea) 2 Discharge from hydro storage power station into an unregulated lake (Årdalsvatnet)
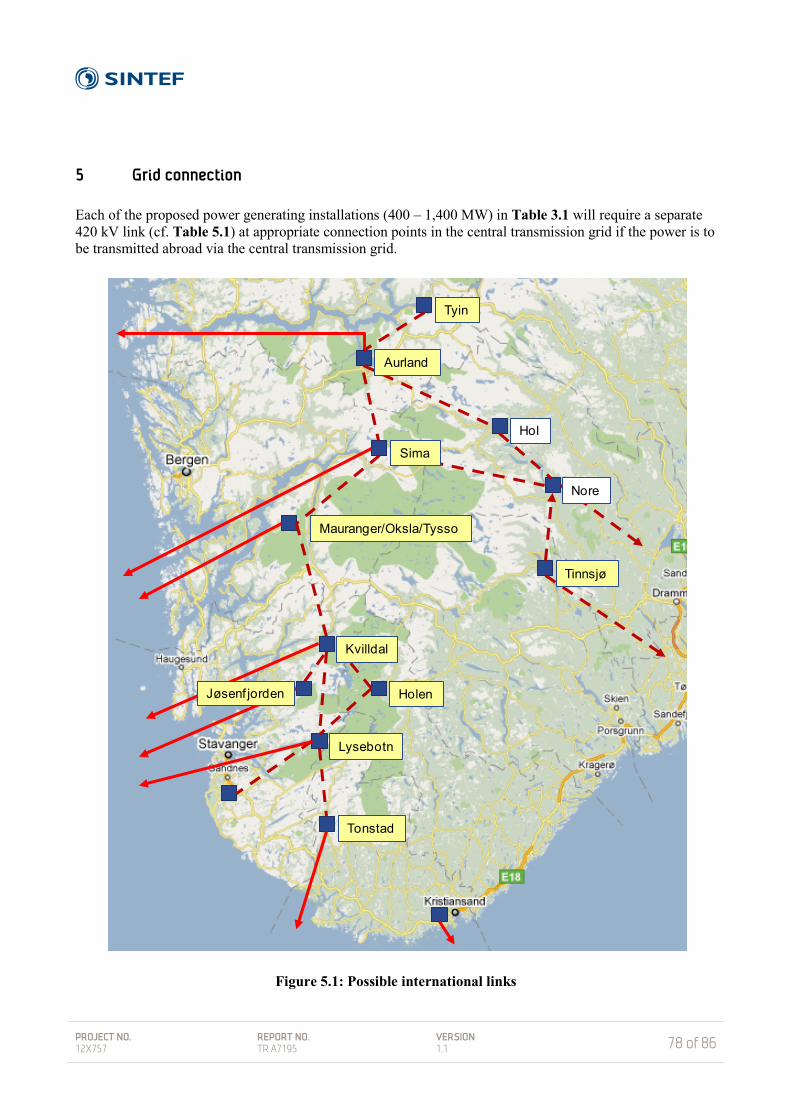
PROJECT NO. 12X757
REPORT NO. TR A7195
VERSION 1.1
78 of 86
5 Grid connection Each of the proposed power generating installations (400 – 1,400 MW) in Table 3.1 will require a separate 420 kV link (cf. Table 5.1) at appropriate connection points in the central transmission grid if the power is to be transmitted abroad via the central transmission grid.
Figure 5.1: Possible international links
Tyin
Holen
Tonstad
Hol
Jøsenf jorden
Tinnsjø
Nore
Mauranger/Oksla/Tysso
Kvilldal
Lysebotn
Sima
Aurland
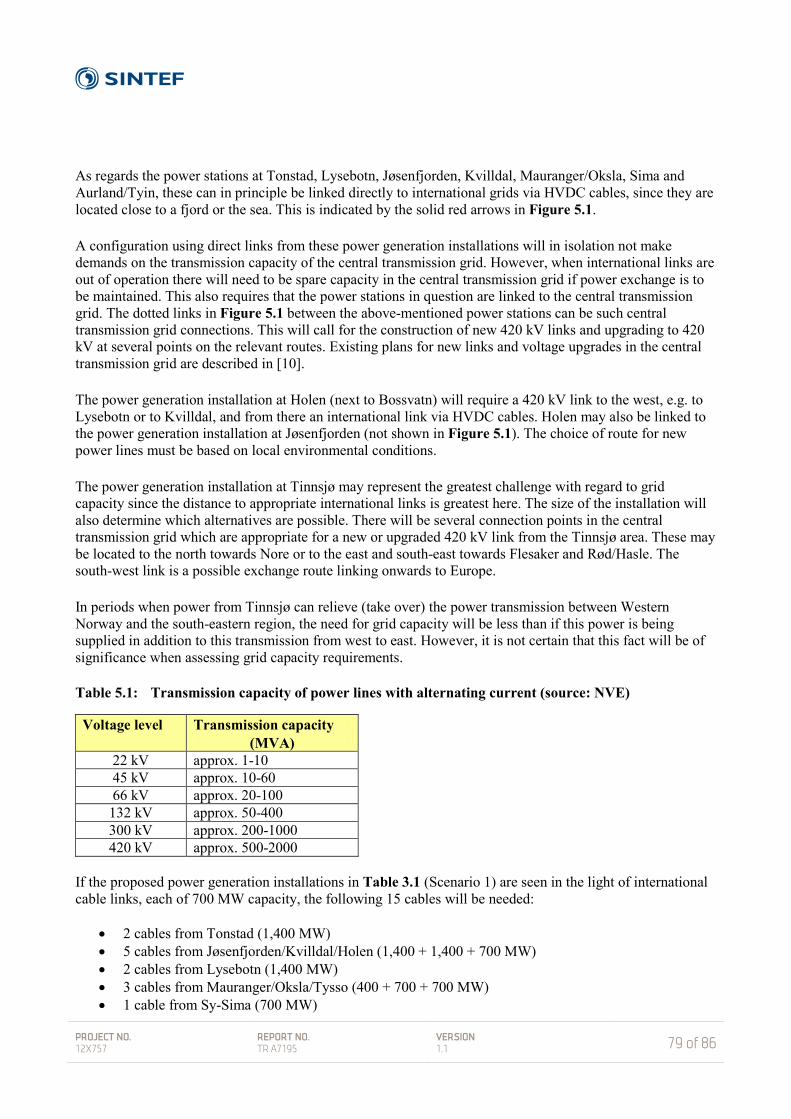
PROJECT NO. 12X757
REPORT NO. TR A7195
VERSION 1.1
79 of 86
As regards the power stations at Tonstad, Lysebotn, Jøsenfjorden, Kvilldal, Mauranger/Oksla, Sima and Aurland/Tyin, these can in principle be linked directly to international grids via HVDC cables, since they are located close to a fjord or the sea. This is indicated by the solid red arrows in Figure 5.1. A configuration using direct links from these power generation installations will in isolation not make demands on the transmission capacity of the central transmission grid. However, when international links are out of operation there will need to be spare capacity in the central transmission grid if power exchange is to be maintained. This also requires that the power stations in question are linked to the central transmission grid. The dotted links in Figure 5.1 between the above-mentioned power stations can be such central transmission grid connections. This will call for the construction of new 420 kV links and upgrading to 420 kV at several points on the relevant routes. Existing plans for new links and voltage upgrades in the central transmission grid are described in [10]. The power generation installation at Holen (next to Bossvatn) will require a 420 kV link to the west, e.g. to Lysebotn or to Kvilldal, and from there an international link via HVDC cables. Holen may also be linked to the power generation installation at Jøsenfjorden (not shown in Figure 5.1). The choice of route for new power lines must be based on local environmental conditions. The power generation installation at Tinnsjø may represent the greatest challenge with regard to grid capacity since the distance to appropriate international links is greatest here. The size of the installation will also determine which alternatives are possible. There will be several connection points in the central transmission grid which are appropriate for a new or upgraded 420 kV link from the Tinnsjø area. These may be located to the north towards Nore or to the east and south-east towards Flesaker and Rød/Hasle. The south-west link is a possible exchange route linking onwards to Europe. In periods when power from Tinnsjø can relieve (take over) the power transmission between Western Norway and the south-eastern region, the need for grid capacity will be less than if this power is being supplied in addition to this transmission from west to east. However, it is not certain that this fact will be of significance when assessing grid capacity requirements. Table 5.1: Transmission capacity of power lines with alternating current (source: NVE)
Voltage level Transmission capacity (MVA)
22 kV approx. 1-10 45 kV approx. 10-60 66 kV approx. 20-100
132 kV approx. 50-400 300 kV approx. 200-1000 420 kV approx. 500-2000
If the proposed power generation installations in Table 3.1 (Scenario 1) are seen in the light of international cable links, each of 700 MW capacity, the following 15 cables will be needed:
• 2 cables from Tonstad (1,400 MW) • 5 cables from Jøsenfjorden/Kvilldal/Holen (1,400 + 1,400 + 700 MW) • 2 cables from Lysebotn (1,400 MW) • 3 cables from Mauranger/Oksla/Tysso (400 + 700 + 700 MW) • 1 cable from Sy-Sima (700 MW)
PROJECT NO. 12X757
REPORT NO. TR A7195
VERSION 1.1
80 of 86
• 2 cables from Aurland/Tyin (700 + 700 MW) The outlined requirement for cable links is based on only very simplified reasoning to enable a rough estimate of cable requirements. Figure 5.2 is a schematic diagram showing cable links to the United Kingdom, the Netherlands, Germany and Denmark from the proposed power stations in South-Western Norway. The diagram does not indicate the likely terminal points in these countries or which cables link to which countries. With the exception of the distance from Kristiansand to Denmark (the Skagerrak cables), distances measured along straight lines from the connection points on the Norwegian side to the countries on the other side of the North Sea are comparable.
Figure 5.2: Schematic diagram showing cable links to the United Kingdom, the Netherlands,
Germany and Denmark (Google Maps)
A possible future “North Sea Supergrid”, based on multi-terminal HVDC links along the coast of Norway and in the North Sea opens up interesting possibilities with regard to the connection of onshore and offshore wind farms combined with sea cable links between the Norwegian terminal points for the cables to the United Kingdom, the Netherlands, Germany and Denmark. The links between these terminal points reduce the need for grid expansion on land with an eye to backup capacity in the event of the failure of international cables from the balance power generating stations. See [11, 12] for information about offshore wind power development and network connection in the North Sea.
Shetland
Orknøyene

PROJECT NO. 12X757
REPORT NO. TR A7195
VERSION 1.1
81 of 86
6 Costs Table 6.1 shows the results of a simplified estimate of costs for the various cases in Table 3.1. The figures are based on [1, 13] and cost levels in 2008, but are approximately adjusted to the level of detail of this study since we have only very rough indications of the factors that determine the costs. The figures for individual cost elements are very uncertain, but the total amounts can be used as a cost estimate. The costs referred to 2008 levels have been scaled up to the 2011 cost level on the basis of consumer price indices (annual average) for 2008 (123.1) and 2011 (130.4, which is the average for January to October). The financing costs comprise 6.5 % interest costs, rising linearly through the entire construction period, in accordance with [1, 13]. The following construction times and associated cost increases are used in Table 6.1: Stations with 1,400 MW output: 5 years Increased cost resulting from interest: 1+2.5×0.065 = 1.1625 Station with 1,000 MW output: 4.5 years Increased cost resulting from interest: 1+2.25×0.065 = 1.1463 Stations with 700 MW output: 4 years Increased cost resulting from interest: 1+2.0×0.065 = 1.1300 Station with 1,000 MW output: 3.5 years Increased cost resulting from interest: 1+1.75×0.065 = 1.1138 The total of all 12 cases (11,200 MW) is approximately NOK 28,000 million. This gives an average of approximately NOK 2.6 million per MW. The average for the pumped storage power stations is approximately 2.9 MNOK/MW and for hydro storage power stations approximately 2.3 MNOK/MW. The costs apply to output voltage from the stations up to 420 kV. Any costs for connection to the central transmission grid, and any necessary reinforcements or expansion of the central transmission grid will come in addition, as well as connection costs (HVDC converters, etc.) and HVDC cables for the international links.

Scenario 1
Uni
t
A2 P
umpe
d st
orag
e po
wer
stat
ion
Tons
tad
(Nes
jen
- Sird
alsv
atn)
B3 P
umpe
d st
orag
e po
wer
stat
ion
Hole
n (U
rarv
atn
- Bos
svat
n)
B6a
Pum
ped
stor
age
pow
er st
atio
n Kv
illdal
(Blå
sjø
- Sul
dalsv
atn)
, 1 4
00
MW
in h
ydro
stor
age
pow
er st
atio
n Jø
senf
jord
enB7
a Hy
dro
stor
age
pow
er st
atio
n Jø
senf
jord
en (B
låsj
ø - J
øsen
fjord
en),
1 40
0 M
W in
pum
ped
stor
age
pow
er
stat
ion
Kvilld
al
C1 P
umpe
d st
orag
e po
wer
stat
ion
Tinn
sjø
(Møs
vatn
- Ti
nnsj
ø)
D1 H
ydro
stor
age
pow
er st
atio
n Ly
sebo
tn (L
yngs
vatn
- Ly
sefjo
rden
)
E1 H
ydro
stor
age
pow
er st
atio
n M
aura
nger
(Juk
lava
tn -
Hard
ange
rfjo
rden
)
E2 H
ydro
stor
age
pow
er st
atio
n O
ksla
(R
inge
dalsv
atn
- Har
dang
erfjo
rden
)
E3 P
umpe
d st
orag
e po
wer
stat
ion
Tyss
o (L
ange
vatn
- Ri
nged
alsv
atn)
F1 H
ydro
stor
age
pow
er st
atio
n Sy
-Si
ma
(Sys
enva
tn -
Hard
ange
rfjo
rden
)
G1 H
ydro
stor
age
pow
er st
atio
n Au
rland
/Van
gen
(Vid
dalsv
atn
- Au
rland
sfjo
rden
)
G2 H
ydro
stor
age
pow
er st
atio
n Ty
in
(Tyi
n - Å
rdal
svat
net)
Tota
l
Installed power MW 1400 700 1400 1400 1000 1400 400 700 700 700 700 700 11200Number of units Count 4 2 4 4 3 4 2 2 2 2 2 2 33Approach/discharge tunnel length km 22.4 12.4 19.1 14.1 29.3 5.6 5.3 4.0 3.2 21.7 9.1 18.9 165.1Penstock length km 0.9 0.9 1.2 1.3 1.0 0.9 1.3 0.5 1.1 1.2 1.2 1.5 13.2Tunnel cross-section m2 128 66 88 82 82 125 23 100 56 45 46 39Penstock cross-section m2 85 44 59 55 55 83 16 67 37 30 31 26Tunnel volume mill. m3 2.853 0.815 1.688 1.157 2.411 0.693 0.122 0.404 0.180 0.986 0.418 0.732 12.459Penstock volume mill. m3 0.076 0.040 0.072 0.072 0.055 0.075 0.021 0.035 0.041 0.037 0.037 0.039 0.601Station hall volume mill. m3 0.117 0.068 0.109 0.107 0.088 0.117 0.039 0.074 0.066 0.063 0.063 0.061 0.971Construction period years 5.0 4.0 5.0 5.0 4.5 5.0 3.5 4.0 4.0 4.0 4.0 4.0Costs:Approach/discharge tunnel MNOK 995.5 333.6 631.5 443.2 922.5 244.8 73.5 147.0 78.5 447.6 188.1 350.2 4856.0Penstock MNOK 142.4 64.4 117.2 115.6 88.6 138.2 39.9 58.7 67.9 65.5 66.5 73.5 1038.5Station hall MNOK 218.2 126.2 202.7 199.9 163.4 217.2 73.2 137.2 122.1 117.1 117.3 113.4 1808.2Cross gallery to approach tunnel MNOK 29.9 10.0 18.9 13.3 27.7 7.3 2.2 4.4 2.4 13.4 5.6 10.5 145.7Access/cable tunnel + portal MNOK 30.0 30.0 30.0 30.0 30.0 30.0 30.0 30.0 30.0 30.0 30.0 30.0 360.0Intake MNOK 12.8 9.2 10.6 9.9 9.9 12.5 7.4 11.0 8.9 10.0 10.1 9.3 121.5Roads, places, landscape MNOK 5.0 5.0 5.0 5.0 5.0 5.0 5.0 5.0 5.0 5.0 5.0 5.0 60.0Rigging and operation of site MNOK 501.8 202.5 355.6 285.9 436.5 229.3 81.0 137.7 110.2 241.0 147.9 207.1 2936.5Total construction and infrastructure MNOK 1935.6 780.9 1371.5 1102.8 1683.6 884.3 312.2 531.1 425.0 929.6 570.7 799.0 11326.4Planning construction and infrastructure MNOK 7.3 5.3 7.3 7.3 6.3 7.3 5.3 5.3 5.3 5.3 5.3 5.3 72.0Total machines incl. planning MNOK 560.0 280.0 700.0 350.0 400.0 350.0 120.0 175.0 280.0 175.0 175.0 175.0 3740.0Total electro incl. planning MNOK 630.0 315.0 630.0 630.0 480.0 630.0 220.0 315.0 315.0 315.0 315.0 315.0 5110.0Site management MNOK 26.4 20.4 26.4 26.4 23.4 26.4 18.0 20.4 20.4 20.4 20.4 20.4 269.4Total constr./infrastr./machines/electro MNOK 3159.3 1401.5 2735.2 2116.5 2593.3 1898.0 675.5 1046.8 1045.6 1445.2 1086.3 1314.7 20517.8Building contractor costs MNOK 5.0 4.0 5.0 5.0 4.5 5.0 3.5 4.0 4.0 4.0 4.0 4.0 52.0Various/unpredictable costs (15 %) MNOK 473.9 210.2 410.3 317.5 389.0 284.7 101.3 157.0 156.8 216.8 162.9 197.2 3077.7Total costs before financing (2008) MNOK 3638.2 1615.8 3150.4 2438.9 2986.8 2187.7 780.3 1207.8 1206.4 1666.0 1253.3 1515.8 23647.4Total costs before financing (2011) MNOK 3853.9 1711.6 3337.3 2583.6 3163.9 2317.4 826.6 1279.4 1278.0 1764.8 1327.6 1605.7 25049.7Total costs incl. 6,5 % p.a. financing MNOK 4480.2 1934.1 3879.6 3003.4 3626.6 2694.0 920.6 1445.7 1444.1 1994.3 1500.2 1814.5 28737.2Total costs/MW incl. financing (2011) MNOK/MW 3.200 2.763 2.771 2.145 3.627 1.924 2.302 2.065 2.063 2.849 2.143 2.592 2.566
Table 6.1 Costs
PROJECT NO. 12X757
REPORT NO. TR A7195
VERSION 1.1
83 of 86
7 Conclusions It is not clear how great the demand for balance power in Europe and Scandinavia will be in the future, but there is definitely a need to balance generation and consumption on time scales ranging from minutes to weeks. An increased proportion of wind and solar power generation will probably create new demands and new market potential for Norwegian hydroelectricity. Our studies show that it will probably be technically feasible to increase the design power output of Norwegian hydroelectric power stations by 20,000 MW without using new regulated reservoirs or exceeding the current stipulations with regard to highest and lowest regulated water levels (HRWL and LRWL). The main scenario which has been considered consists of twelve new power stations in Southern Norway with a combined power output of 11,200 MW (cf. Table 3.1). It is envisaged that these power stations would be constructed with new tunnels to an upstream reservoir and for downstream outflow into a reservoir, a fjord or the sea. Five of the power plants are pumped storage power stations with a combined output of 5,200 MW, while the remainder are hydro storage power stations with a combined output of 6,000 MW, all but one of which discharge into a fjord or the sea. None of the selected power stations with increased design power output will result in water level variations exceeding 14 cm per hour in affected upstream or downstream reservoirs. For most upstream reservoirs, it will take 2-4 weeks of continuous power generation before the reservoir is drawn down from HRWL to LRWL, although in many cases there will be stricter restrictions related to a downstream reservoir. For the two largest reservoirs (Blåsjø and Møsvatn), it will take 10 and 7 weeks when power output from the two reservoirs is increased by 2,800 MW and 1,000 MW, respectively. It is assumed that the operation of existing power stations will remain unaffected. The output of the 12 power stations in the main scenario can be increased by 18,200 MW without the water level changes in the upper and lower reservoirs exceeding 14 cm/hour (cf. Table 3.3). How long the power stations are able to deliver this power output will depend among other things on the current regulations regarding highest and lowest regulated water levels (HRWL and LRWL), as well as what strategies will be adopted with regard to pumping in the case of pumped storage power stations. By including more cases in Southern Norway in addition to some in Northern Norway, it will be possible to increase the output of existing hydroelectric reservoirs by a further 1,800 MW to give a total of 20,000 MW for the whole country. The most serious environmental challenges affecting reservoirs resulting from increased power generation installation are connected with the risk of increased erosion, changes in circulation, changes in water temperature, reduced ice cover and increased danger of unsafe ice. All these physical changes can have an impact on ecosystems. In relatively large reservoirs these changes will probably only be localised. The ecosystems of many of the selected reservoirs are at present strongly affected by water level regulation. Here, increased design power output will not necessarily have additional impact on the ecosystem, as in reservoirs where regulation currently has moderate or insignificant impact. Good environmental design can reduce the detrimental impact and in some cases even improve conditions. Environmental consequences and environmental design must however be studied in detail with special focus on low-lying downstream reservoirs, since species diversity, fertility and vulnerability are often greatest in these. In reservoirs which receive pumped water from lower reservoirs or neighbouring water systems, environmental impacts can be considerable because transferred water can result in major changes in water chemistry and temperature, and a range of organisms may be transferred from the lower reservoir to the upper one. Knowledge of the possible effects of such water transfer is incomplete. The environmental challenges connected with balance power will vary from project to project and will depend on the type of

PROJECT NO. 12X757
REPORT NO. TR A7195
VERSION 1.1
84 of 86
operational pattern and restrictions implemented. Our ability to develop and use knowledge of environmental effects will determine what sort of local impacts balance power projects may have. Each of the power station installations studied will require connection through a separate 420 kV line to appropriate points in the central supply grid if power exchange with other countries is to take place by way of the central transmission grid. New power stations at Tonstad, Lysebotn, Jøsenfjorden, Kvilldal, Mauranger/Oksla, Sima and Aurland/Tyin can be linked directly to international grids via HVDC cables, since they are located close to a fjord or the sea. These aspects have not been considered in detail in this study. A system of direct international transmission links will in isolation not make demands on the transmission capacity of the central transmission grid, but operationally it will be an advantage for both the cable links and the transmission grid if these power stations are robustly connected to the central grid. However, when international links are out of operation there will need to be spare capacity in the central transmission grid if power exchange is to be maintained. This requires that the power stations in question are linked to the central transmission grid. This will call for the construction of new 420 kV links and upgrading to 420 kV at several points on the relevant routes. The power generation installation at Tinnsjø may represent the greatest challenge with regard to grid capacity since the distance to appropriate international links is greatest here. The size of the installation will also determine which alternatives are most appropriate. The south-west link is a possible exchange route linking to the continent. The themes described in this preliminary study must be followed up with research and more detailed studies before it will be possible to form an accurate picture of the balance power capacity of hydroelectric power plants at existing reservoirs in Norway. The selection of power generation output and pumping power capacity, as well as of an operational strategy for balance power generation in combination with existing power generation calls for detailed studies, using models and simulation tools developed for development planning and production optimisation in systems with predominantly hydroelectric generation. The need for national grid capacity for the purposes of balance power generation must be determined on the basis of thorough analysis of the central transmission grid in the areas affected. To enable description of environmental impacts during power generation and pumping in more detail, additional knowledge and more detailed studies of the individual reservoirs are needed. Research activities are going on in CEDREN which are contributing to improved knowledge of environmental impacts and environmental design. Environmental impacts in specific reservoirs should be studied in more detail with regard to physical and biological conditions resulting from power generation and pumping.
PROJECT NO. 12X757
REPORT NO. TR A7195
VERSION 1.1
85 of 86
8 References [1] NVE, Økt installasjon i eksisterende vannkraftverk, Potensial og kostnader [Increased installation at
existing hydroelectric power stations], NVE Report No. 10 – 2011, Oslo, 2011 (in Norwegian). [2] Norge som leverandør av fornybar fleksibilitet [Norway as a supplier of renewable flexibility], Energi
Norge, Oslo, 2011 (in Norwegian) [3] German Advisory Council on the Environment (SRU): Climate-friendly, reliable, affordable: 100%
renewable electricity supply by 2050, Statement No. 15, ISSN 1612-2968, Berlin, 2010 [4] German Advisory Council on the Environment (SRU): Pathways towards a 100 % renewable
electricity system, Special Report, Berlin, 2011 [5] NVE, Atlas – vannkraftverk [Atlas of hydroelectric power stations],
http://arcus.nve.no/website/vannkraftverk/viewer.htm [6] Catrinu, M.D., Solvang, E., Scenarios for hydropower development in Norway to cover peaking and
load balancing needs in Northern and Western Europe, SINTEF Energy Research, TR A7145, Trondheim, 2011
[7] Førde, E., Brodtkorb, E., Sluttrapport for FoU-prosjektet ”Effektregulering – Miljøvirkninger og
konfliktreduserende tiltak” [Concluding report of the R&D project “Power regulation – Environmental impact and conflict-reducing measures”], Report No. 20, Statkraft Grøner, 2001 (in Norwegian)
[8] Harby, A., Alfredsen, K., Arnekleiv, J.V., Flodmark, L.E.W., Halleraker, J.H., Johansen, S., Saltveit,
S.J., Raske vannstandsendringer i elver. Virkninger på fisk, bunndyr og begroing [Rapid water level variations. Impact on fish, benthic fauna and aquatic vegetation], SINTEF Energiforskning, TR A5932, Trondheim, 2004 (in Norwegian)
[9] Grøv, E., Bruland, A., Nilsen, B., Panthi, K., Lu, M., Developing future 20 000 MW hydro electric
power in Norway – Possible concepts and need of resources, SINTEF Building and infrastructure, SBF2011A0021, Trondheim, 2011
[10] Statnett, Nettutviklingsplan for sentralnettet [Grid development plan for the central transmission grid],
2010 (in Norwegian) [11] EU project, OffshoreGrid, www.offshoregrid.eu [12] EU project, Windspeed, www.windspeed.eu [13] NVE, Kostnadsgrunnlag for vannkraftanlegg [Cost basis for hydroelectric power facilities], 82-410-
0724-8 / 1502-3664, Oslo, 2010 (in Norwegian)

Technology for a better society
www.sintef.no