Embed Size (px)
Citation preview

BioFuel Crop Decision ImpactsBiomass
Kurt D. ThelenMichigan State University
NC Branch ASAIndianapolis INMarch 13, 2007
Current U.S.liquid fuel
consumption ~200 Billion
gallonsabout ½ of our
total oil use
World Oil
0
50
100
150
200
250
1900 1925 1950 1975 2000 2025 2050 2075 2100 2125
Mbb
l/day
Proven Reserves
Double ProvenReserves
Triple ProvenReserves
Projected EIAConsumption
Colored bars on the projected consumption curve indicate the years when proven reserves, double and tripleproven reserves are depleted at the current consumption growth rate. Source: C. Gray, EPA
Increasing Energy Demand
95% probability
50% probability
5% probability
Demand
Curr
ent Dem
and
Tren
d
Biomass Research &Development Act of 2000
• Established the Biomass R&D TechnicalAdvisory Committee:
By 2030 Biomass will supply:
- 5% of the nations power- 20% of the nations transportation fuels- 25% of its chemicals
The Goal is equivalent to 30% of the current USpetroleum consumption and will require 1 billiondry tons of biomass feedstock annually, a 5Xincrease over current consumption.
Energy Policy Act of 2005• Created the Renewable Fuels Standard (RFS)
which established for the first time anationwide baseline for renewable fuel use.
• Beginning in 2006, oil refiners are requiredto use at least 4 billion gallons of renewablefuel.
• That level increases incrementally to 7.5billion gallons per year in 2012.

Agriculture Sources:
428 million dt crop residue377 million dt perennial crops87 million dt grain (17.6 mil A)106 million dt manures, process residues
Requirements to reach goal ofdisplacing 30% of U.S. petroleumSource:USDA, USDoE
yields of corn, wheat, and other small grains were increased by 50%;the residue-to-grain ratio for soybean was increased to 2:1;harvest technology was capable of recovering 75% of annual crop residues;all cropland was managed with no-till methods;55 million acres of cropland, idle cropland, and cropland pasture were dedicated to theproduction of perennial bioenergy crops;all manure in excess of that which can be applied on-farm for soil improvement was used forbiofuel;all other available residues were utilized; Graham et al. 2007. Agron J. 99:1-11
System IA MN IL IN NE MI OH WI Totals
Current 13.4 11.7 10.1 5.4 5.2 2.8 2.6 1.5 52.7
All mulch 14.7 13.1 14.2 7.2 5.7 3.1 3.2 2.2 63.4
All no-till 19.9 13.9 18.3 8.8 12.6 3.7 4.6 4.1 85.9
Gross 35.9 19.4 31 15.3 23.5 5.1 9 8.1 147.3
Corn Stover (million dry Mg yr-1)
How muchcorn stover isavailable??
Graham et al. 2007. Agron J. 99:1-11
Available corn stover undercurrent tillage systems:
54 million Mg yr-1
59 million ton yr-1
Available corn stover underall no-till systems:95.9 million Mg yr-1
105.6 million ton yr-1
428 million ton goal-106 million ton corn stover 322 million ton deficit
Where will the 322 million toncome from????
Ethanol Production Capacity
January, 2007 update
Total operating plants: 109Under construction: 57Expansions 8
Total: 166
Capacity Million gal yr
Current 5,281.4Under Construct& Expansion 4,857.5
Total Capacity 10,138.9
What is the best we can do with corn grain……
Acreage availability and competing demands limit theamount of ethanol that can be produced from corn toapproximately 10% of U.S. motor gasoline needs.

Conclusion:
The U.S. will need cellulosicethanol production to meet our
renewable energy goals.
So ---- what’s holding cellulosicethanol production back?
A comparison of astarch-based ethanolproduction plant witha cellulose-basedethanol productionplant.Source: US DoE National Renewable Energy Lab
Source: USDOE
$0.60 costadvantage tostarch basedethanol
Basic similarities between starch & cellulose
25% Amylose alpha-linked1-4 D-glucose
75% Amylopectin
Cellulose- Beta linked 1-4 D-glucoseCellulose is somewhat similar to starchβ-(1 4)-D-glucopyranose units in 4C1 conformationCellobiose, which consists of a pair of glucose residues (oneright side up and one upside down is the repeating polymer ofcellulose).
Source: US DoE

Why cellulosic ethanolproduction may be closer than
you think
Two Primary Drivers• Energy Security• Environmental (GWP) Security
Petroleum Replacement Ratio:the Primary Energy Security Driver
12.5
20
0.84
0
5
10
15
20
25
Cellulosic
Ethanol
Biorefinery
Corn Ethanol Gasoline
Adapted from Farrell, et al (2006)
Petro leum Rep lacement Ratio (PRR) =Petro leum Energ y
Used
Liqu id Fuels Delivered to User
Fossil Energy Replacement Ratio:the Primary Climate Security Driver
5.3
1.40.8
0.4
0
1
2
3
4
5
6
Cellulosic
Ethanol
Biorefinery
Corn Ethanol Gasoline Electricity
Source: J. Sheehan & M. Wang (2003)
Fossil Energ y Ratio (FER) =Fossil Energ y Used
Energ y Delivered to Customer
Cellulosic ethanol closer than you think.• Better Technologies
– Better & cheaper pretreatments-AFEX for example– Better & cheaper enzymes– Better fermentation micros that ferment & produce enzymes– Consolidated bioprocessing (CBP) is coming right along– Better integration of these technologies
• Venture capital & (we hope) more research funding• Heightened awareness of oil “externalities”
– Potential for climate change– Economic development driver– 9/11 and terrorism
• RFS & other help from “big brother”: ethanol fromcorn
• Testing platforms: pulp mills & corn mills• $60 per barrel oil
Source: B. Dale, MSU

Impact of Processing Improvements: Oil’sPast & Future
• Historically, petrochemicalprocessing costs exceededfeedstock costs
• Petroleum processingefficiencies have increasedand costs have decreaseddramatically but reachingpoint of diminishing returns
• Petroleum raw materials havelong-term issues– Costs will continue to increase as
supplies tighten– High price variability– Impacts national security– Climate security concerns– Not renewable
• Not a pretty picture for ourpetroleum dependent society
Early Years Today's Mature
Processes
Future
Oil Processing
Relative Cost
Oil
Proc
essi
ng
From J. Stoppert, 2005
Impact of Processing Improvements: TheFuture of Biomass Conversion
• Processing is dominant costof biofuels today
• Cellulosic raw material costsshould be stable or decrease
• Processing costs dominatedby pretreatment, enzymes &fermentation
• Biomass processing costswill decrease: deserves highpriority to make it happensooner rather than later
• Much more attractive future– Domestically produced fuels– Environmental improvements– Rural/regional economic
development
Today Future
Proc
essi
ngG
rain
Ferm
enta
tion
Feed
stoc
ks
?
Relative Cost
Adapted from J. Stoppert, 2005
Learning Curve: Sugar Ethanol Production Cost
( Oct
. 200
2) U
S$ /
GJ
Accumulated Ethanol Production ( Million m3)
Ethanol Producers: Brazil
Gasoline:Rotterdam
0 50
(J. Goldemberg, 2003)
100 150 200 250
1
10
100
1980
1986
19901993
1996
1999
2002
RecentProcess
Improvementsfor
CellulosicEthanol
Production
Reactor Explosion
AmmoniaRecovery
BiomassTreatedBiomass
RecycleAmmonia
GaseousAmmonia
Reactor Explosion
AmmoniaRecovery
BiomassTreatedBiomass
AmmoniaGaseous
Ammonia
Heat
Biomass heated (~100 C) with concentrated ammonia
Rapid pressure release ends treatment
99% of ammonia is recovered & reused, remainder serves as N sourcedownstream for fermentation
Little sugar degradation, relatively mild conditions
Few sugar monomers, mostly xylooligomers formed
How does AFEX work?
Source: B. Dale, MSU
Pretreatment Economic Analysis:CAFI TeamSource: B. Dale, MSU
0.00
0.25
0.50
0.75
1.00
1.25
1.50
1.75
Dilute Acid Hot Water AFEX ARP Lime Corn Dry Mill
Net Stover Other Variable Fixed w/o Depreciation Depreciation Income Tax Return on Capital
CashCostPlantLevel
MESP
Proof Year: 4th Year of Operation$/gal EtOH
AFEX: $1.41/gal
Cost advantagefor starchethanol dropsfrom $0.60 to$0.36 per gallonwhen factor inco-products
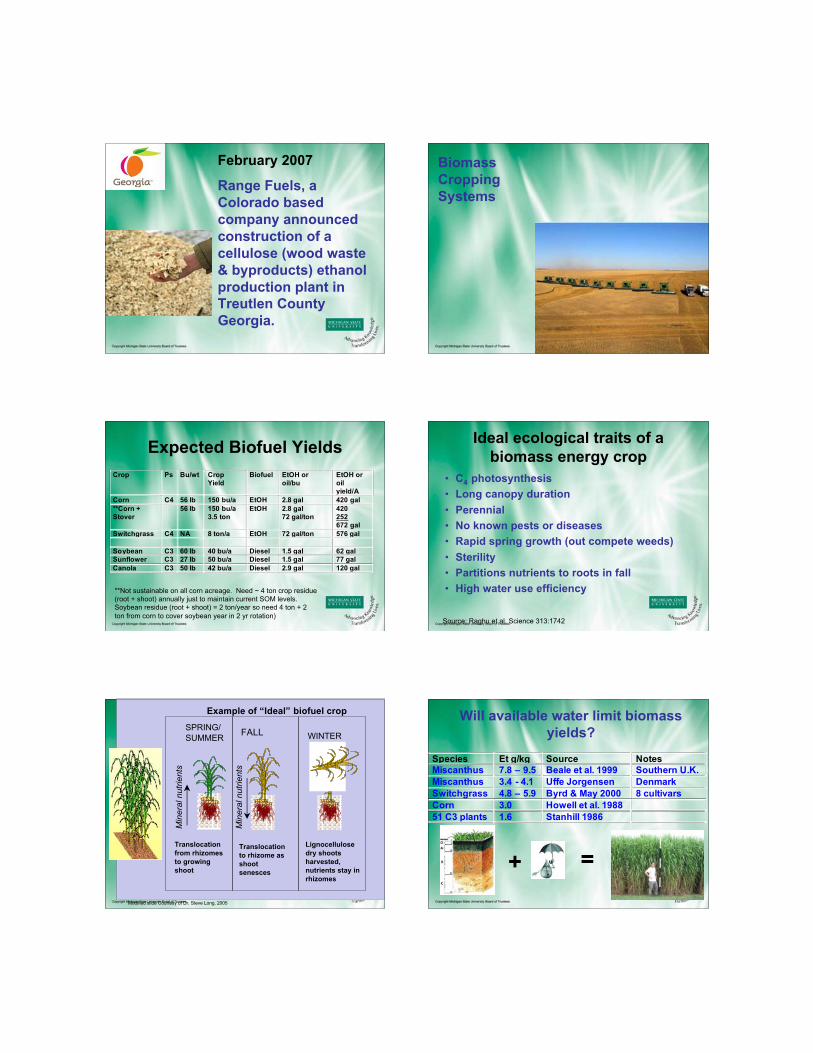
February 2007
Range Fuels, aColorado basedcompany announcedconstruction of acellulose (wood waste& byproducts) ethanolproduction plant inTreutlen CountyGeorgia.
BiomassCroppingSystems
Expected Biofuel YieldsCrop Ps Bu/wt Crop
Yield
Biofuel EtOH or
oil/bu
EtOH or
oil
yield/A
Corn C4 56 lb 150 bu/a EtOH 2.8 gal 420 gal
**Corn +
Stover
56 lb 150 bu/a
3.5 ton
EtOH 2.8 gal
72 gal/ton
420
252
672 gal
Switchgrass C4 NA 8 ton/a EtOH 72 gal/ton 576 gal
Soybean C3 60 lb 40 bu/a Diesel 1.5 gal 62 gal
Sunflower C3 27 lb 50 bu/a Diesel 1.5 gal 77 gal
Canola C3 50 lb 42 bu/a Diesel 2.9 gal 120 gal
**Not sustainable on all corn acreage. Need ~ 4 ton crop residue(root + shoot) annually just to maintain current SOM levels.Soybean residue (root + shoot) = 2 ton/year so need 4 ton + 2ton from corn to cover soybean year in 2 yr rotation)
Ideal ecological traits of abiomass energy crop
• C4 photosynthesis• Long canopy duration• Perennial• No known pests or diseases• Rapid spring growth (out compete weeds)• Sterility• Partitions nutrients to roots in fall• High water use efficiency
Source: Raghu et al. Science 313:1742
Min
eral
nut
rient
s
Min
eral
nut
rient
s
Translocation from rhizomes to growing shoot
SPRING/SUMMER
Translocation to rhizome as shoot senesces
FALL WINTER
Lignocellulose dry shoots harvested, nutrients stay in rhizomes
Example of “Ideal” biofuel crop
Modified slide Courtesy of Dr. Steve Long, 2005
Species Et g/kg Source Notes
Miscanthus 7.8 – 9.5 Beale et al. 1999 Southern U.K.
Miscanthus 3.4 - 4.1 Uffe Jorgensen Denmark
Switchgrass 4.8 – 5.9 Byrd & May 2000 8 cultivars
Corn 3.0 Howell et al. 1988
51 C3 plants 1.6 Stanhill 1986
Will available water limit biomassyields?
+ =
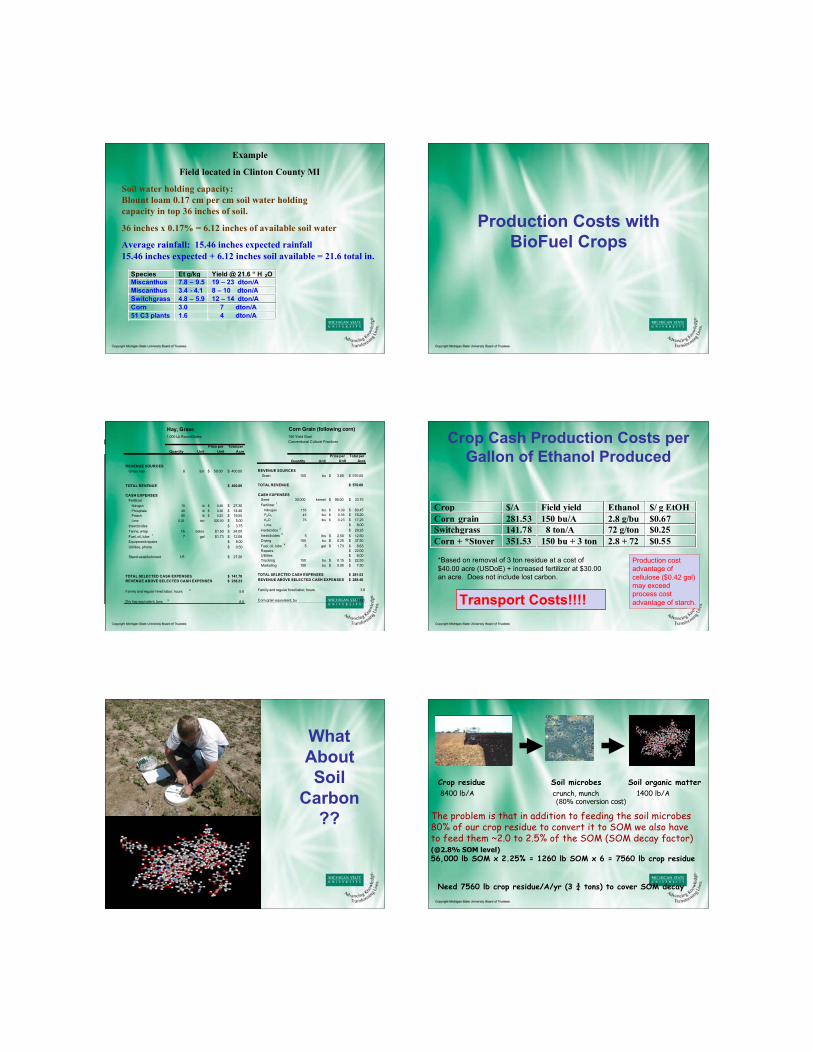
Example
Field located in Clinton County MI
Soil water holding capacity:Blount loam 0.17 cm per cm soil water holding capacity in top 36 inches of soil.
36 inches x 0.17% = 6.12 inches of available soil water
Average rainfall: 15.46 inches expected rainfall15.46 inches expected + 6.12 inches soil available = 21.6 total in.
Species Et g/kg Yield @ 21.6 “ H 2O
Miscanthus 7.8 – 9.5 19 – 23 dton/A
Miscanthus 3.4 - 4.1 8 – 10 dton/A
Switchgrass 4.8 – 5.9 12 – 14 dton/A
Corn 3.0 7 dton/A
51 C3 plants 1.6 4 dton/A
Production Costs withBioFuel Crops
Quantity Unit
Price per
Unit
Total per
Acre
REVENUE SOURCES
Grain 150 bu 3.80$ 570.00$
TOTAL REVENUE 570.00$
CASH EXPENSES
Seed 30,000 kernel 90.00$ 33.75$
Fertilizer1
Nitrogen 155 lbs 0.39$ 60.45$
P2O5 45 lbs 0.36$ 16.20$
K2O 75 lbs 0.23$ 17.25$
Lime 8.00$
Herbicides2
29.25$
Insecticides3
5 lbs 2.50$ 12.50$
Drying 150 bu 0.25$ 37.50$
Fuel, oil, lube4
5 gal 1.73$ 8.63$
Repairs 22.00$
Utilities 6.00$
Trucking 150 bu 0.15$ 22.50$
Marketing 150 bu 0.05$ 7.50$
TOTAL SELECTED CASH EXPENSES 281.53$
REVENUE ABOVE SELECTED CASH EXPENSES 288.48$
Family and regular hired labor, hours 3.6
Corn grain equivalent, bu 150.0
Conventional Cultural Practices
Corn Grain (following corn)
150 Yield Goal1,000 Lb Round Bales
Quantity Unit
Price per
Unit
Total per
Acre
REVENUE SOURCES
Grass hay 8 ton 50.00$ 400.00$
TOTAL REVENUE 400.00$
CASH EXPENSES
Fertilizer
Nitrogen 70 lb 0.39$ 27.30$
Phosphate 40 lb 0.36$ 14.40$
Potash 85 lb 0.23$ 19.55$
Lime 0.25 ton $20.00 5.00$
Insecticides 3.75$
Twine, wrap 16 bales $1.50 24.00$
Fuel, oil, lube1
7 gal $1.73 12.08$
Equipment repairs 8.00$
Utilities, phone 0.50$
Stand establishment 1/5 27.20$
TOTAL SELECTED CASH EXPENSES 141.78$
REVENUE ABOVE SELECTED CASH EXPENSES 258.23$
Family and regular hired labor, hours2
5.0
Dry hay equivalent, tons 38.0
Hay, Grass
Crop Cash Production Costs perGallon of Ethanol Produced
Crop $/A Field yield Ethanol $/ g EtOH
Corn grain 281.53 150 bu/A 2.8 g/bu $0.67
Switchgrass 141.78 8 ton/A 72 g/ton $0.25
Corn + *Stover 351.53 150 bu + 3 ton 2.8 + 72 $0.55
*Based on removal of 3 ton residue at a cost of$40.00 acre (USDoE) + increased fertilizer at $30.00an acre. Does not include lost carbon.
Production costadvantage ofcellulose ($0.42 gal)may exceedprocess costadvantage of starch.Transport Costs!!!!
WhatAboutSoil
Carbon??
Crop residue Soil microbes Soil organic matter8400 lb/A crunch, munch 1400 lb/A
(80% conversion cost)
The problem is that in addition to feeding the soil microbes80% of our crop residue to convert it to SOM we also haveto feed them ~2.0 to 2.5% of the SOM (SOM decay factor)(@2.8% SOM level)56,000 lb SOM x 2.25% = 1260 lb SOM x 6 = 7560 lb crop residue
Need 7560 lb crop residue/A/yr (3 ¾ tons) to cover SOM decay

Assume: Corn above ground biomass yield of 9 ton/AHarvest index: 50%Whole plant C content in corn of 43%Root rhizoshpere C deposition = 29% shoot CNeed 7560 lb to maintain current SOM level
Total residue root + shoot = 5220 lb root + 9000 lb stover = 14,220 lb/A14,220 lb/A – 7560 lb/A required = 6600 lb/A available for bioenergy harvest.
If corn soybean rotation: 3110 lb/A deficit in plant material3550 lb/A corn stover available for bioenergy harvest
Consistent with Nelson @ 1.4 ton/A and Purlack & Turhollow 2.5 ton/A.
Current equipment constraints limit maximum harvestable corn stover at70% (Schechinger and Hettenhaus) ---6300 lb/A
Perennialgrasslandsused forgrazing orforage net900 lb C(equivalentto 2093 lbresidue)annuallysource: CAST
Can SoilCarbon
Losses beCompensated
for withManagementPractices ???
Main effect means for Soil C GWP, soil GHG flux, input GHGflux, and net GWP at East Lansing in the SCS rotation
Trt Soil CGWP Res. C
SoilGHGflux
InputGHGflux
NetGWP
NetGWP
-R
-----------------------------g CO2 m-2 y-1---------------------------Cmpst -1999 -1358 988 1404 -964 394
Manure -1006 -2406 2234 19 -1159 1247None 36 -482 1459 10 1022 1505LSD 528 449 220 - 556 618
None -977 -1286 1217 476 -570 716Rye -1002 -1545 1904 479 -164 1381LSD NS NS 180 - NS 534
Great potential for improvedgenetics
• Soluble sugars in biomass cropssimilar to sugar cane.
• Low fiber content similar to brown mid-ribs.
• Oil expression outside the embryo.• Process enzymes (amylase and
hydrolosis enzymes) present in theplant tissue.
• etc.
Biomass ProcessingLogistics

R u m i n a n t A n i m a l s & B i o r e f i n e r i e s
LotsofHay
Mobile Cellulose Biorefinery(a.k.a. Cow)
Stationary Cellulose Biorefinery
RuminantBioreactor:
Capacity ~ 40 Gal Fermentor
Biomass Input ~ 26 Lb/Day*
SSCF Bioreactor:Biomass Input ~ 5,000 Dry Ton/Day
= 10 M Dry Lb/Day
Capacity ~ 45 M Gal Fermentor
*Rasby, Rick. “Estimating Daily Forage Intake of Cows” . University of Nebraska-LincolnInstitute of Agriculture and Natural Resources, http://beef.unl.edu/stories/200608210.shtml,10/02/06.
Cow is 3x more efficient than bioreactor
=
Source: B. Dale, MSU
Biomass Processing Challenges
• Water use ~ 3.5 g H2O per g EtOHRecycling lowers H2O use considerably
• Travel $ limit production area to 50 m.Pelletizing & on-farm pretreatment
• Truck traffic – 100 mil g biomass plant =200 trucks/day
Pelletizing & on-farm pretreatment
Conclusions• Both starch and cellulosic ethanol feedstocks are
needed to meet federal renewable fuel goals.
• Corn stover supply is limited by soil erosion and soilcarbon factors.
• Cellulosic ethanol processing improvements arecontinuing.
• Genetic improvement to energy crops is in itsinfancy.
Thank you
for your attention