Embed Size (px)
Citation preview
Increasing Outreach, Enrollment, and Retention in MHVI Programs Using QI Learning Collaboratives
August 4, 2016

Welcome!2

1. Describe the methodology used to implement the Fiscal Year 2016 MHVI Quality Improvement Learning Collaboratives.
2. Describe the outcomes of each Learning Collaborative based on measureable data and experience of participating teams.
3. Discuss any questions that audience members have regarding process or outcomes of the 2016 MHVI Quality Improvement Learning Collaboratives.
3
Session Goals

First, A Few Questions…
By raising your hands, let us know…
Who is familiar with Quality Improvement (QI) as a structured and formal methodology and process? Who has participated in at least one QI project?
Who is familiar with the concept/methodof QI Learning Collaboratives? Who has participated in a formal
QI Learning Collaborative?
4

A Few Definitions…
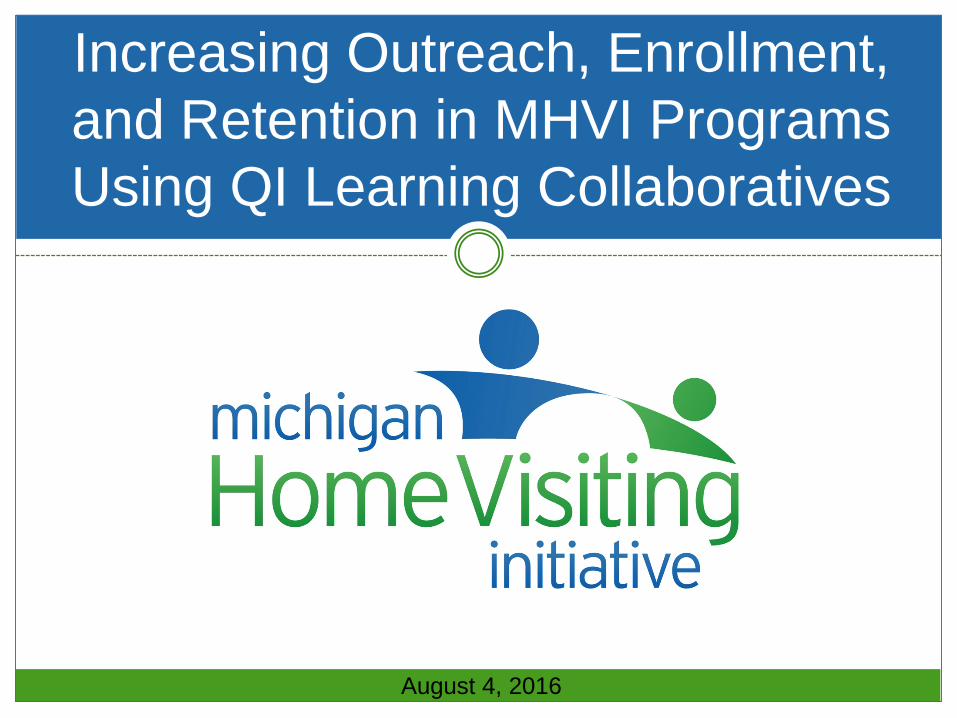
Quality Improvement is…“QI is the use of a deliberate and defined improvement process, such as Plan-Do-Study-Act, which is focused on activities that are responsive to community needs and improving population health. It refers to a continuous and ongoing effort to achieve
measurable improvements in the efficiency, effectiveness, performance, accountability, outcomes, and other indicators of quality in services or processes which achieve equity and
improve the health of the community.”Bialek, R., Beitsch, L. M., Cofsky, A., Corso, L., Moran, J., Riley, W., & Russo, P. (2009).
Proceedings from Accreditation Coalition Workgroup: Quality Improvement in Public Health.
PDSA is… A specific, formal method of conducting quality improvement. It is comprised
of 4 stages (Plan-Do-Study-Act) that include 9 repeatable steps.
QI Learning Collaboratives are… Learning systems that bring together different teams conducting PDSA
cycles around a common problem and shared overall aim.
5
The Model for Improvement6

Learning Collaborative Structure
Select a Topic
Gather Information
from Experts
Learning Session (LS) 1
Develop Change Package
Plan for LS1
Complete Pre-work
Participants
Learning Session (LS) 3
Learning Session (LS) 2
Sustain Gains
SupportsEmail Phone Monthly Data Tracking
Monthly Updates
AP 1 AP 2 AP 3
7
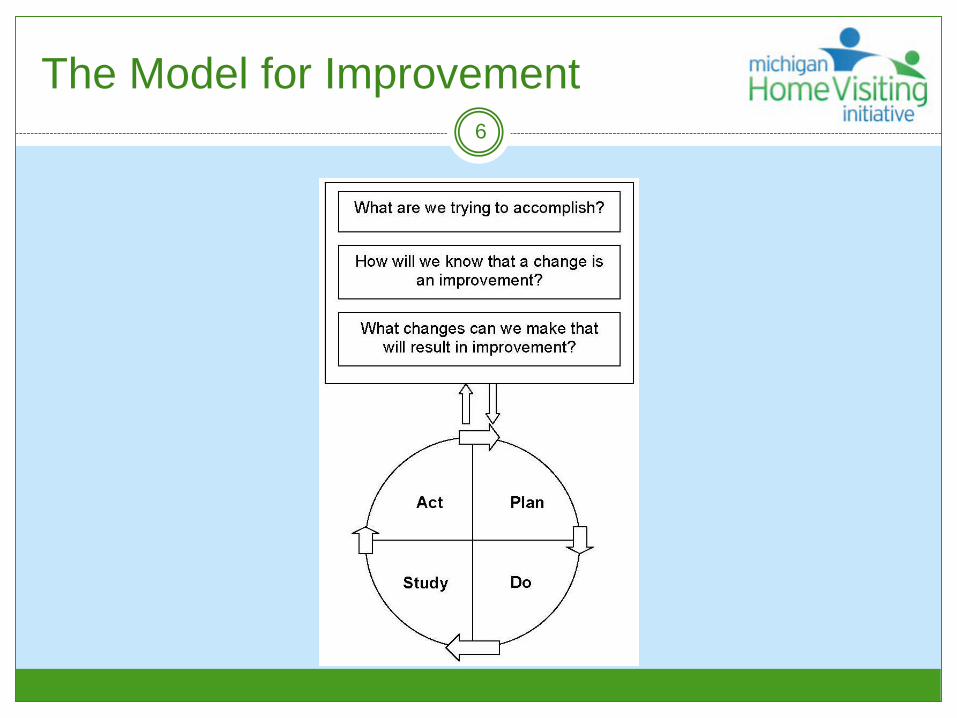
What is a Change Package?
Documents for a specific process improvement area that include: SMART Aim Statement – goal all teams in the learning collaborative
are working toward Change concepts (primary drivers) – common strategies that can be
put in place to address the root cause of the problem Key changes (secondary drivers) – specific areas within the change
concepts where key changes could be made to address the root cause Specific changes (change ideas) – specific improvement theories
(if/then statements) that could be implemented to work toward improvement
Measurement strategies – specific measures that all participating QI teams will collect and review to determine the impact of PDSA cycles
8
How is a Change Package Developed?
Research literature Input from experts Researchers Model developers Home visiting program staff Families
9
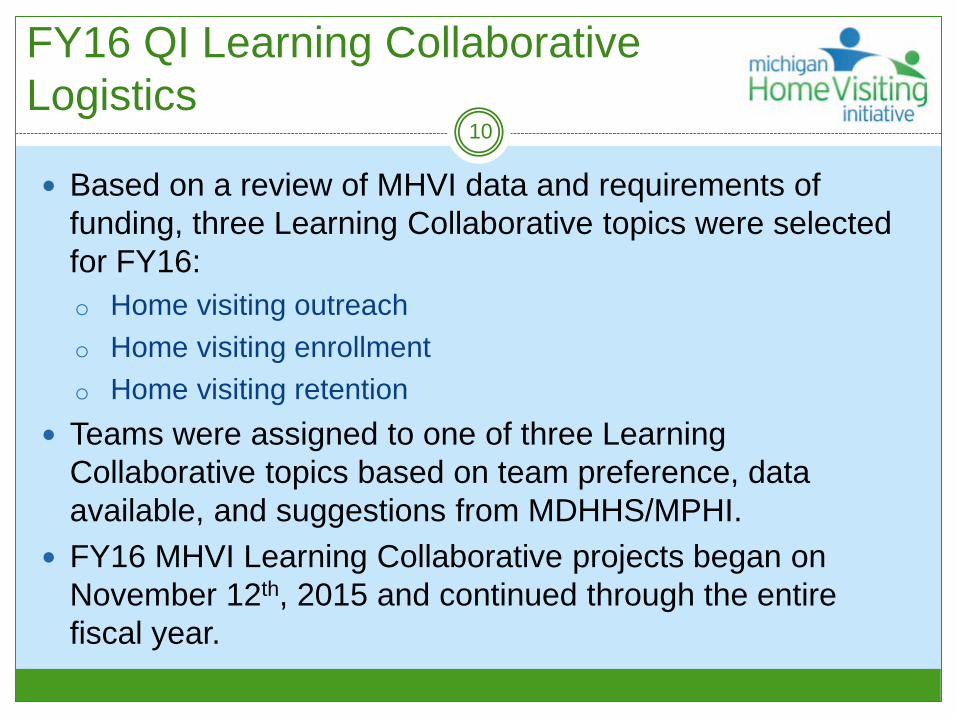
FY16 QI Learning Collaborative Logistics
Based on a review of MHVI data and requirements of funding, three Learning Collaborative topics were selected for FY16:o Home visiting outreacho Home visiting enrollmento Home visiting retention
Teams were assigned to one of three Learning Collaborative topics based on team preference, data available, and suggestions from MDHHS/MPHI.
FY16 MHVI Learning Collaborative projects began on November 12th, 2015 and continued through the entire fiscal year.
10

Learning Collaborative Spotlight11
Outreach

Outreach Collaborative Problem Statement
Collaborative Problem Statement:Outreach efforts to ensure enough
eligible referrals are coming into MHVI Local Implementing Agencies to fill
available capacity are not as robust as they could be.
12
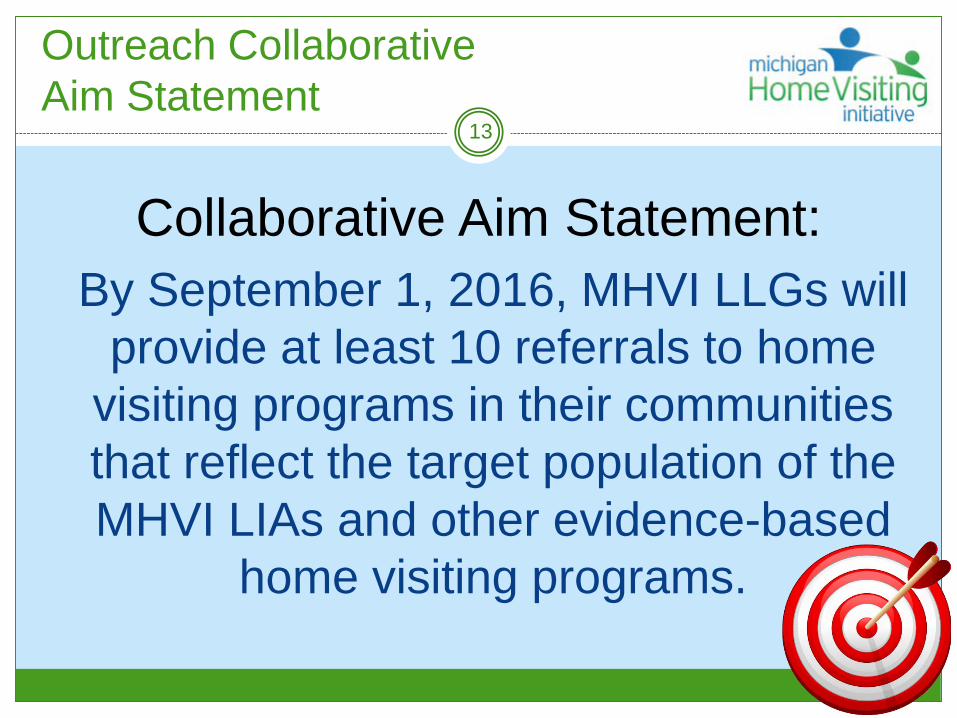
Collaborative Aim Statement:By September 1, 2016, MHVI LLGs will
provide at least 10 referrals to home visiting programs in their communities that reflect the target population of the MHVI LIAs and other evidence-based
home visiting programs.
13
Outreach Collaborative Aim Statement

Outreach Learning Collaborative: Key Driver Diagram
14
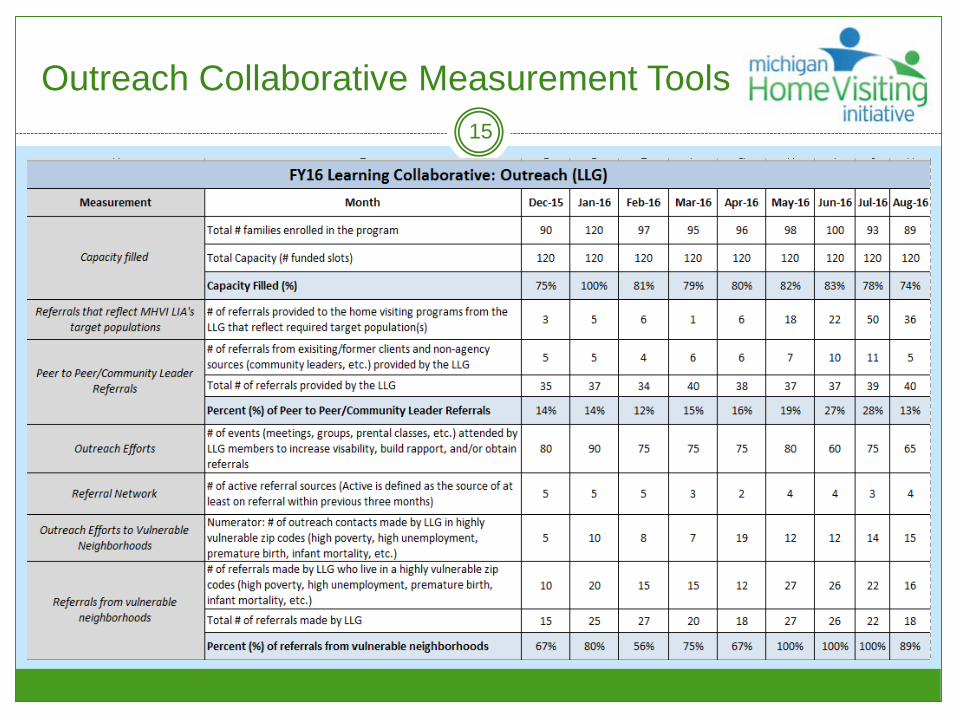
Outreach Collaborative Measurement Tools15
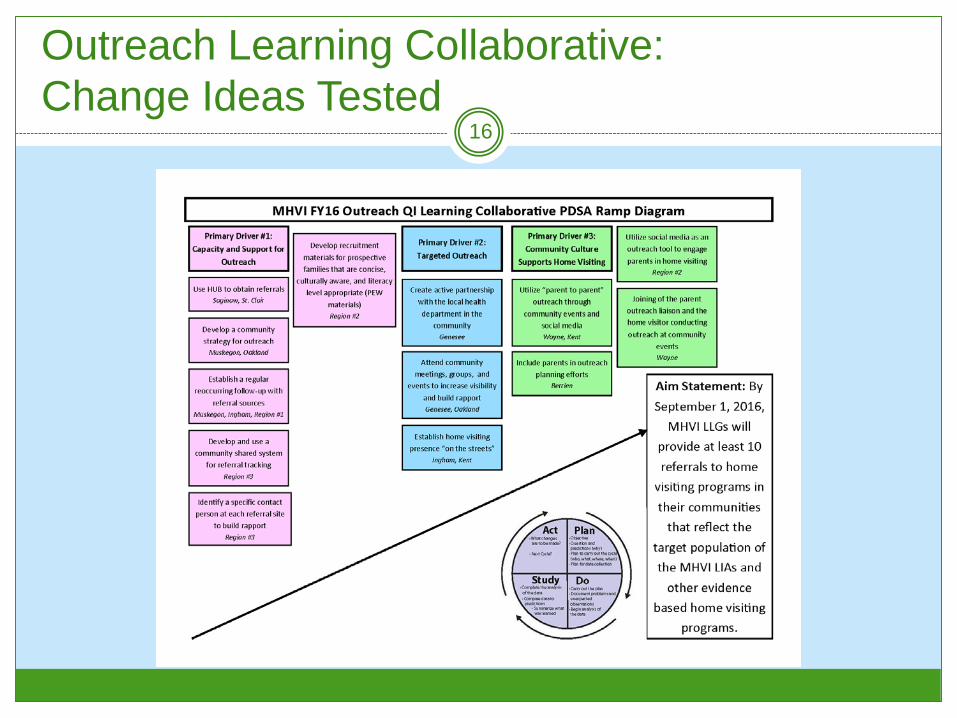
Outreach Learning Collaborative:Change Ideas Tested
16

Outreach Collaborative Progress17
70.9% 72.2% 72.3%79.7%
67.4%
0%
10%
20%
30%
40%
50%
60%
70%
80%
90%
100%
Dec-15 Jan-16 Feb-16 Mar-16 Apr-16
Per
cent
Average Percent Capacity Filled
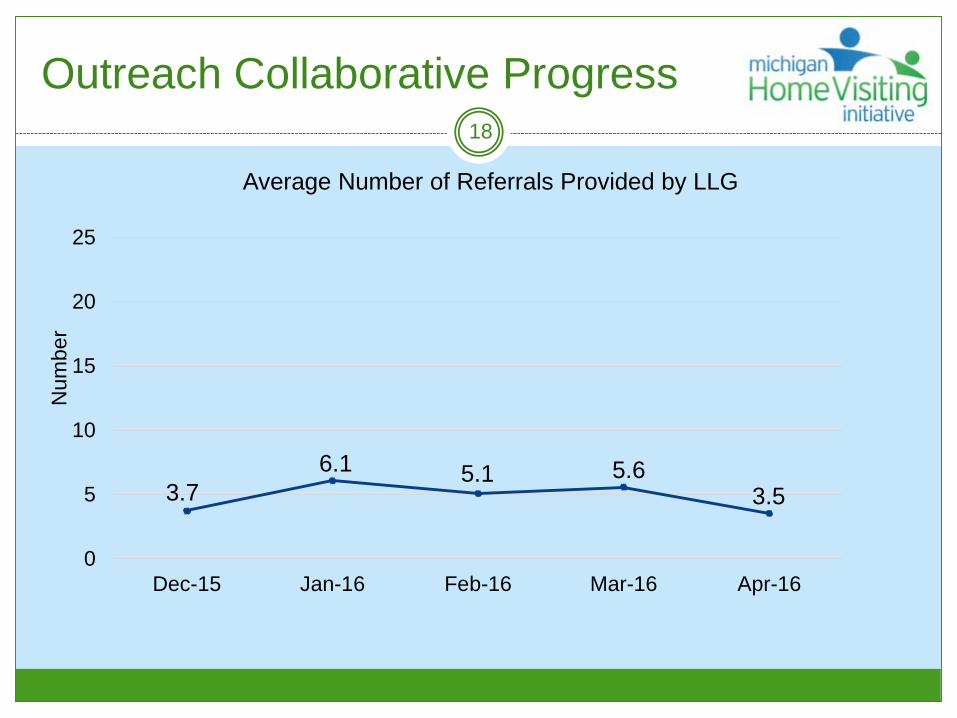
Outreach Collaborative Progress18
3.76.1 5.1 5.6
3.5
0
5
10
15
20
25
Dec-15 Jan-16 Feb-16 Mar-16 Apr-16
Num
ber
Average Number of Referrals Provided by LLG

Outreach Collaborative Progress19
4.1 4.8 5.7 5.9 6.6
02468
1012141618202224
Dec-15 Jan-16 Feb-16 Mar-16 Apr-16
Num
ber o
f Act
ive
Sou
rces
Average Number of Active Referral Sources

WAYNE COUNTY HOME VISITING LOCAL LEADERSHIP GROUP
3
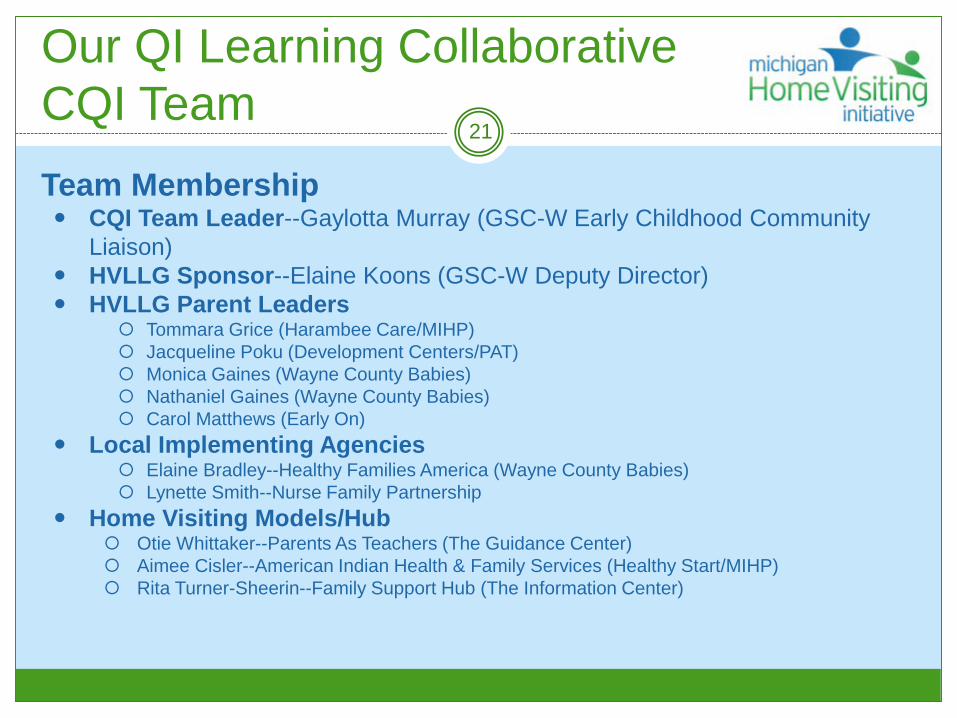
Our QI Learning CollaborativeCQI Team
21
Team Membership CQI Team Leader--Gaylotta Murray (GSC-W Early Childhood Community
Liaison) HVLLG Sponsor--Elaine Koons (GSC-W Deputy Director) HVLLG Parent Leaders
Tommara Grice (Harambee Care/MIHP) Jacqueline Poku (Development Centers/PAT) Monica Gaines (Wayne County Babies) Nathaniel Gaines (Wayne County Babies) Carol Matthews (Early On)
Local Implementing Agencies Elaine Bradley--Healthy Families America (Wayne County Babies) Lynette Smith--Nurse Family Partnership
Home Visiting Models/Hub Otie Whittaker--Parents As Teachers (The Guidance Center) Aimee Cisler--American Indian Health & Family Services (Healthy Start/MIHP) Rita Turner-Sheerin--Family Support Hub (The Information Center)
Why This Topic Matters to Us22
● Our participation in this Learning Collaborative coincided with the building of Wayne County Home Visiting Continuum of Care model.
● One of several key challenges has been the need to increase referrals thereby filling available HV slots.
● The Learning Collaborative provided an excellent tool/framework for identifying an outreach strategy to this end.
At the end of the day a successful strategy can potentially yield an increase in the number of referrals during the PDSA Cycles.
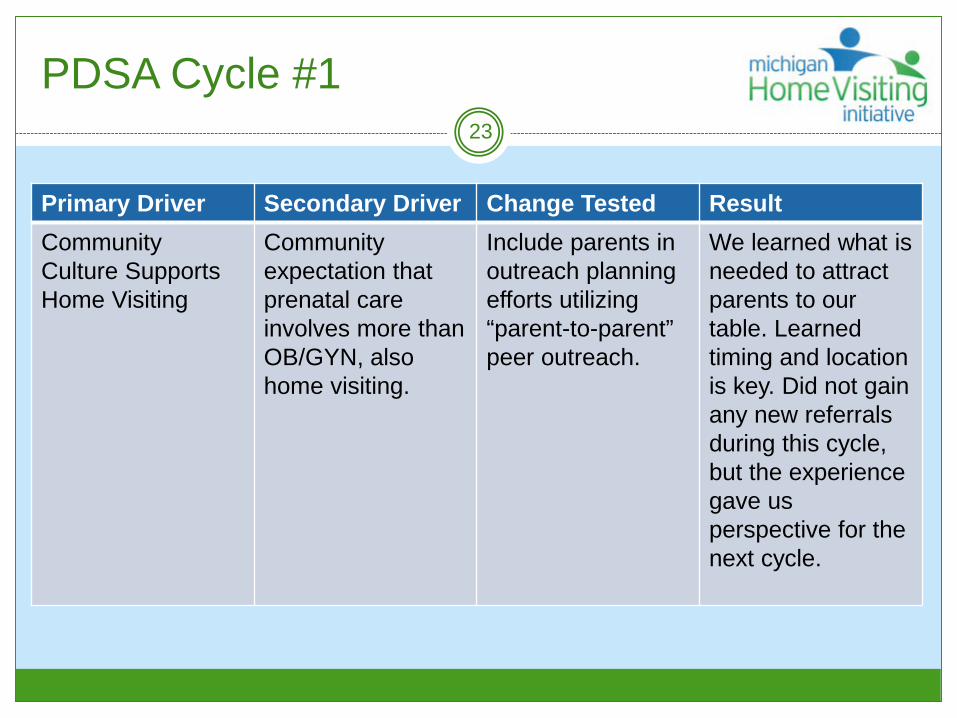
PDSA Cycle #123
Primary Driver Secondary Driver Change Tested ResultCommunity Culture Supports Home Visiting
Community expectation that prenatal care involves more than OB/GYN, also home visiting.
Include parents in outreach planning efforts utilizing “parent-to-parent” peer outreach.
We learned what is needed to attract parents to our table. Learned timing and location is key. Did not gain any new referrals during this cycle, but the experience gave us perspective for the next cycle.

PDSA Cycle #224
Primary Driver Secondary Driver Change Tested ResultCommunity Culture Supports Home Visiting
Community expectation that prenatal care involves more than OB/GYN, also home visiting.
Utilize “parent to parent” peer outreach.
Teaming parents and home visitors together at community events for optimal outreach and referrals.
Referrals increased during this cycle resulting from our strategy as well as referrals generated by staff at both LIAs.
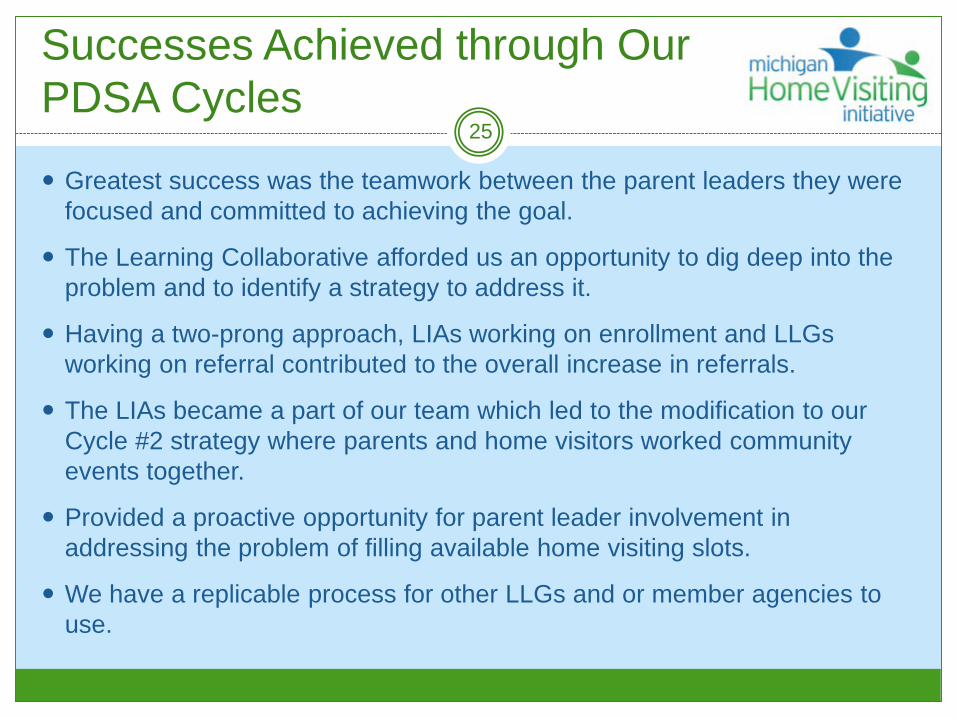
Successes Achieved through OurPDSA Cycles
25
Greatest success was the teamwork between the parent leaders they were focused and committed to achieving the goal.
The Learning Collaborative afforded us an opportunity to dig deep into the problem and to identify a strategy to address it.
Having a two-prong approach, LIAs working on enrollment and LLGs working on referral contributed to the overall increase in referrals.
The LIAs became a part of our team which led to the modification to our Cycle #2 strategy where parents and home visitors worked community events together.
Provided a proactive opportunity for parent leader involvement in addressing the problem of filling available home visiting slots.
We have a replicable process for other LLGs and or member agencies to use.
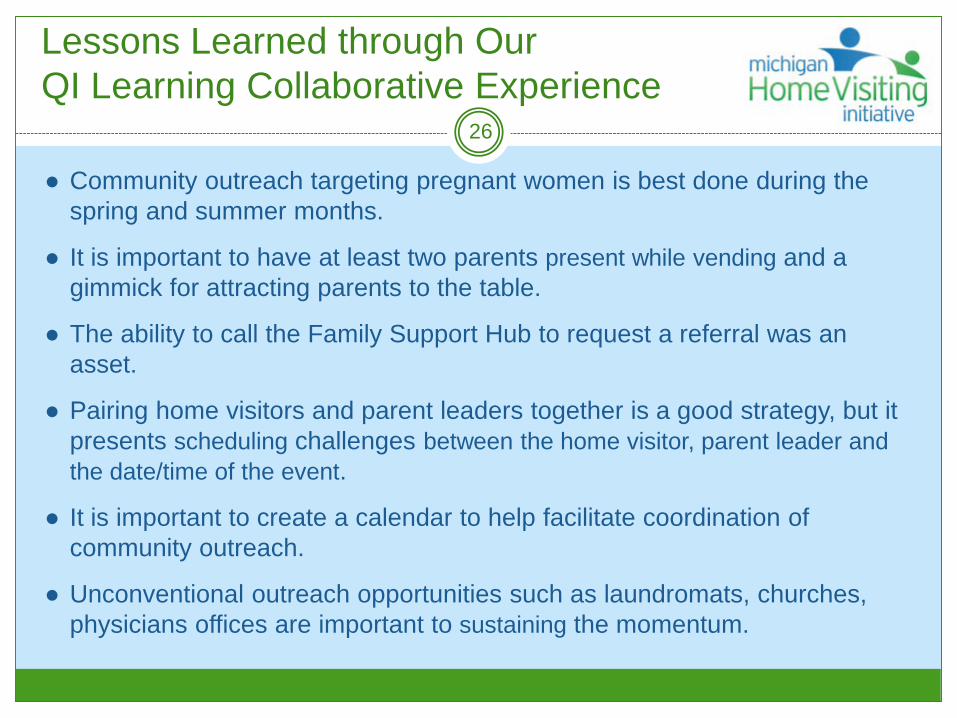
Lessons Learned through Our QI Learning Collaborative Experience
26
● Community outreach targeting pregnant women is best done during the spring and summer months.
● It is important to have at least two parents present while vending and a gimmick for attracting parents to the table.
● The ability to call the Family Support Hub to request a referral was an asset.
● Pairing home visitors and parent leaders together is a good strategy, but it presents scheduling challenges between the home visitor, parent leader and the date/time of the event.
● It is important to create a calendar to help facilitate coordination of community outreach.
● Unconventional outreach opportunities such as laundromats, churches, physicians offices are important to sustaining the momentum.

Plans for the Future27
● We will start with a celebratory meeting in August or October where we will reflect on lessons learned and celebrate achievements.
● This parent outreach process will be incorporated into our Home Visiting Continuum.

Contact Information
Gaylotta Murray-HVLLG CoordinatorWayne County Home Visiting Local Leadership
313-510-7967

Learning Collaborative Spotlight29
Enrollment

Enrollment Collaborative Problem Statement
Collaborative Problem Statement:Overall caseloads of MHVI Local
Implementing Agencies need to be filled closer to capacity.
30

Collaborative Aim Statement:By September 1, 2016, MHVI LIAs will
increase the percent of funded slots that are filled from 65% to 85%.
31
Enrollment Collaborative Aim Statement

Enrollment Learning Collaborative Key Driver Diagram
32
Enrollment Collaborative Measurement Tools
33
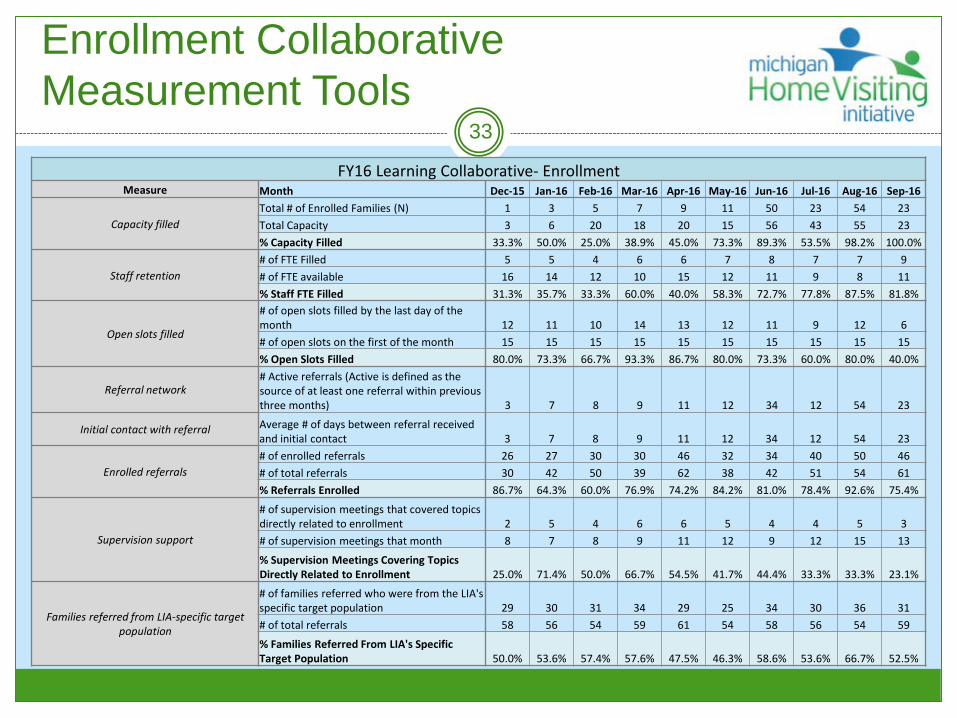
FY16 Learning Collaborative- EnrollmentMeasure Month Dec-15 Jan-16 Feb-16 Mar-16 Apr-16 May-16 Jun-16 Jul-16 Aug-16 Sep-16
Capacity filledTotal # of Enrolled Families (N) 1 3 5 7 9 11 50 23 54 23Total Capacity 3 6 20 18 20 15 56 43 55 23% Capacity Filled 33.3% 50.0% 25.0% 38.9% 45.0% 73.3% 89.3% 53.5% 98.2% 100.0%
Staff retention# of FTE Filled 5 5 4 6 6 7 8 7 7 9# of FTE available 16 14 12 10 15 12 11 9 8 11% Staff FTE Filled 31.3% 35.7% 33.3% 60.0% 40.0% 58.3% 72.7% 77.8% 87.5% 81.8%
Open slots filled
# of open slots filled by the last day of the month 12 11 10 14 13 12 11 9 12 6# of open slots on the first of the month 15 15 15 15 15 15 15 15 15 15% Open Slots Filled 80.0% 73.3% 66.7% 93.3% 86.7% 80.0% 73.3% 60.0% 80.0% 40.0%
Referral network# Active referrals (Active is defined as the source of at least one referral within previous three months) 3 7 8 9 11 12 34 12 54 23
Initial contact with referral Average # of days between referral received and initial contact 3 7 8 9 11 12 34 12 54 23
Enrolled referrals# of enrolled referrals 26 27 30 30 46 32 34 40 50 46# of total referrals 30 42 50 39 62 38 42 51 54 61% Referrals Enrolled 86.7% 64.3% 60.0% 76.9% 74.2% 84.2% 81.0% 78.4% 92.6% 75.4%
Supervision support
# of supervision meetings that covered topics directly related to enrollment 2 5 4 6 6 5 4 4 5 3# of supervision meetings that month 8 7 8 9 11 12 9 12 15 13
% Supervision Meetings Covering Topics Directly Related to Enrollment 25.0% 71.4% 50.0% 66.7% 54.5% 41.7% 44.4% 33.3% 33.3% 23.1%
Families referred from LIA-specific target population
# of families referred who were from the LIA's specific target population 29 30 31 34 29 25 34 30 36 31# of total referrals 58 56 54 59 61 54 58 56 54 59
% Families Referred From LIA's Specific Target Population 50.0% 53.6% 57.4% 57.6% 47.5% 46.3% 58.6% 53.6% 66.7% 52.5%

Enrollment Learning CollaborativeChange Ideas Tested
34

Enrollment Collaborative Progress35
65.0%
72.8%
0%
10%
20%
30%
40%
50%
60%
70%
80%
90%
100%
FY15 Q4 FY16 Q1
% C
apac
ity
Percent Capacity Filled at the Close of the Quarter

Enrollment Collaborative Progress36
24%14%
29%
11%
0%
10%
20%
30%
40%
50%
60%
70%
80%
90%
100%
Nov-15 Dec-15 Jan-16 Feb-16
% O
pen
Slo
ts F
illed
Percent Open Slots Filled by Month
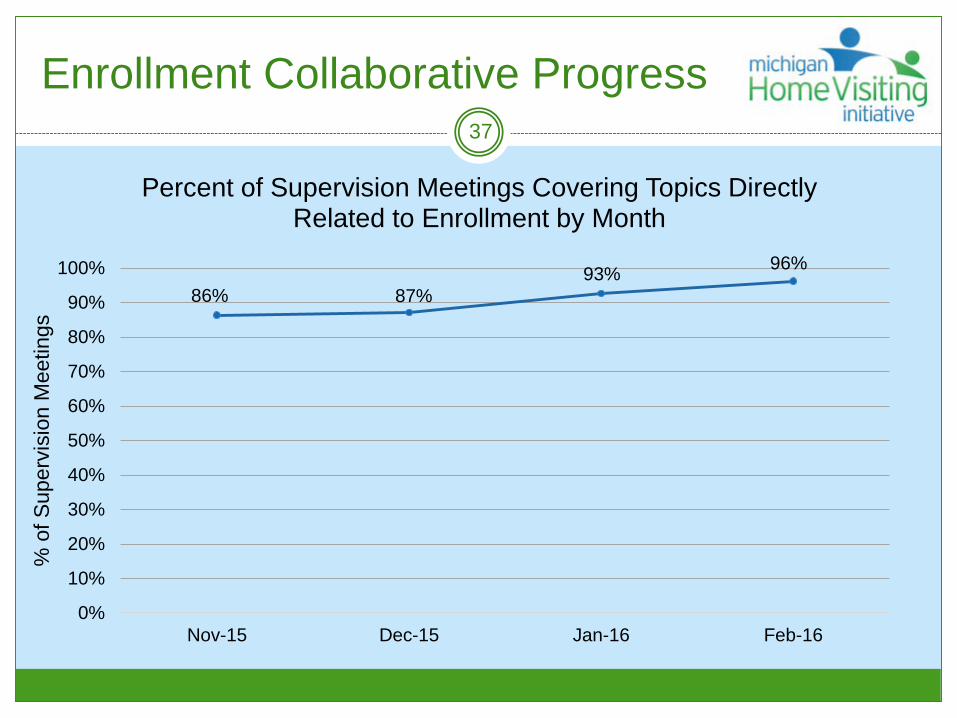
Enrollment Collaborative Progress37
86% 87%93% 96%
0%
10%
20%
30%
40%
50%
60%
70%
80%
90%
100%
Nov-15 Dec-15 Jan-16 Feb-16
% o
f Sup
ervi
sion
Mee
tings
Percent of Supervision Meetings Covering Topics Directly Related to Enrollment by Month

Enrollment Collaborative Progress38
79% 79%
90%
83%
0%
10%
20%
30%
40%
50%
60%
70%
80%
90%
100%
Nov-15 Dec-15 Jan-16 Feb-16
% F
amili
es
Percent of Families Referred From LIA's Specific Target Population by Month

Healthy Families Northern Michigan LIA
3

Our QI Learning CollaborativeCQI Team
Tricia Drenth Team Leader/Facilitator
Nicole Montgomery Team Scribe/Regions 2&3
Coordinator perspective
Britney Wright Region 3 Coordinator perspective
Annette Marvin (cycle #1) Region 2 HV perspective
Bianca Escamilla Region 3 HV
perspective/Creativity Expert
Amber Trout (cycle #2) Region 3 HV perspective
40

Why This Topic Matters to Us41
Officially kicked off our HFA program on June 8th, 2015. Our main focus has been engaging and enrolling families.
Several of our ten counties have elevated risk factors in many target areas compared to state averages (child maltreatment, substance abuse, unemployment, etc.).
We truly believe our communities can benefit and our local families can be healthier and more self-sufficient with the support from HFNM.
From June 2015 thru May of 2016 HFNM had: 914 completed screens (97% positive) 186 assessment visits (91% scored positive) 148 new enrollments 1,903 completed home visits (not including attempts and cancellations!)

PDSA Cycle #142
Primary Driver Secondary Driver Change Tested ResultDevelop Referral Process
Referred families are contacted in a timely manner
Follow-up with unenrolled referrals by writing handwritten, personal lettersand increase face-to-face encounters with families when able, with the hope of engaging more families in the assessment “get to know you” home visit.
HFNM had an increase in % of assessments completed with referred families in the 1st quarter and noticed a decrease in the 2nd quarter. Identified test was way too broad with too many variables. Team agreed there was a need to adapt for the second cycle.

PDSA Cycle #243
Primary Driver Secondary Driver Change Tested ResultDevelop Referral Process
Referred families are contacted in a timely manner
The HV in Ogemaw county will make face-to-face contacts and use a personalized flier with potential HFNM families in WIC clinics at least 2x/month. The hope is to engage at least two families in the assessment “get to know you” home visit as a direct result of these efforts.
Currently in the study phase. Made adaptations part-way through cycle to focus on one county instead of two due to unexpected home visitor vacancy.
Successes Achieved through OurPDSA Cycles
44
We have continued to grow or remain stable in our enrollments throughout participation in this learning collaborative.
We were able to use some success from the LLG Region 2 CQI team in our region to help us in our adaptation for cycle #2.
The PDSA cycles have given us a formal process to continually evaluate how we are doing and identify ways to guide us in enrolling families, as well as in our overall strive for a high-quality HFA program.

Lessons Learned through Our QI Learning Collaborative Experience
45
This formal process was new to many of us, as is working within a regional program. It became quite obvious that our initial focus was too broad and it was difficult to have the change process happen consistently across all ten counties.
We continue to grow as a CQI team and as an HFA program. Communication, follow-up, and flexibility have been key essential elements!
Plans for the Future46
We plan on incorporating the use of personalized fliers in our local county outreach efforts.
We plan on learning from our two LLG CQI teams, along with other LIA efforts, for new ideas and encouragement.
We were able to adapt our first LIA specific PDSA cycle and are in the middle of our second, with a program-specific focus based on staff input, and are really excited to see where this process takes us.
Learning Collaborative Spotlight48
Retention

Retention Collaborative Problem Statement
Collaborative Problem Statement:More families are discontinuing MHVI services prior to completion than the
Initiative would prefer.
49

Collaborative Aim Statement:By September 1, 2016, MHVI LIAs will
decrease the percent of families that stop services before completion from 23.2% to 18%.
50
Retention Collaborative Aim Statement

Retention Learning Collaborative Key Driver Diagram
51

Retention Collaborative Measurement Tools
52Learning Collaborative-Retention
Measurement Month Dec-15 Jan-16 Feb-16 Mar-16 Apr-16 May-16 Jun-16 Jul-16 Aug-16 Sep-16
Capacity filledTotal # families enrolled in the program 90 120 97 95 96 98 100 93 89 94Total Capacity (# funded slots) 120 120 120 120 120 120 120 120 120 120Capacity Filled (%) 75% 100% 81% 79% 80% 82% 83% 78% 74% 78%
Staff retention# of FTE available 3.00 3.00 3.00 3.00 3.00 3.00 3.00 3.00 3.00 3.00# of FTE filled 1.50 2.00 1.75 2.50 2.75 3.00 2.50 2.25 2.75 2.50% of FTE filled 50% 67% 58% 83% 92% 100% 83% 75% 92% 83%
Overall family retention
# of families who stopped services before completion 5 5 4 6 6 7 10 11 5 6
Total # of families who completed, are continuing, or stopped services before completion 35 37 34 40 38 37 37 39 40 40
% Families who stopped services before completion 14% 14% 12% 15% 16% 19% 27% 28% 13% 15%
3 month & 12 month family retention
# of families who have reached 3 months of enrollment (HFA/EHS) or the child's birth (NFP) 80 90 75 75 75 80 60 75 65 89
# of families who have reached 12 months of enrollment (HFA/EHS) or infancy 6 months (NFP) 75 65 80 76 55 68 80 88 65 50% families reaching 3 month retention 89% 75% 77% 79% 78% 82% 60% 81% 73% 95%% families reaching 12 month retention 83% 54% 82% 80% 57% 69% 80% 95% 73% 53%
Family goals are identified early
# of families who have goals identified by the end of the second home visit 5 5 5 3 2 4 4 3 4 2
# of families enrolled in the program within the last month 6 7 5 4 2 8 5 6 4 5
% families enrolled in the last month who have goals identified by the end of the second home visit 83% 71% 100% 75% 100% 50% 80% 50% 100% 40%
Family goals are revisited monthly
# of families whose goals were revisited at their last home visit 5 10 8 7 19 12 12 14 15 17# of families visited in the last month 10 15 10 15 20 16 16 17 18 20
% families whose goals were revisted at their last home visit in the past month 50% 67% 80% 47% 95% 75% 75% 82% 83% 85%
Home visit completion# of expected home visits 25 30 30 30 30 30 30 30 30 30# of completed home visits 15 25 27 20 18 27 26 22 18 26% home visits completed 60% 83% 90% 67% 60% 90% 87% 73% 60% 87%
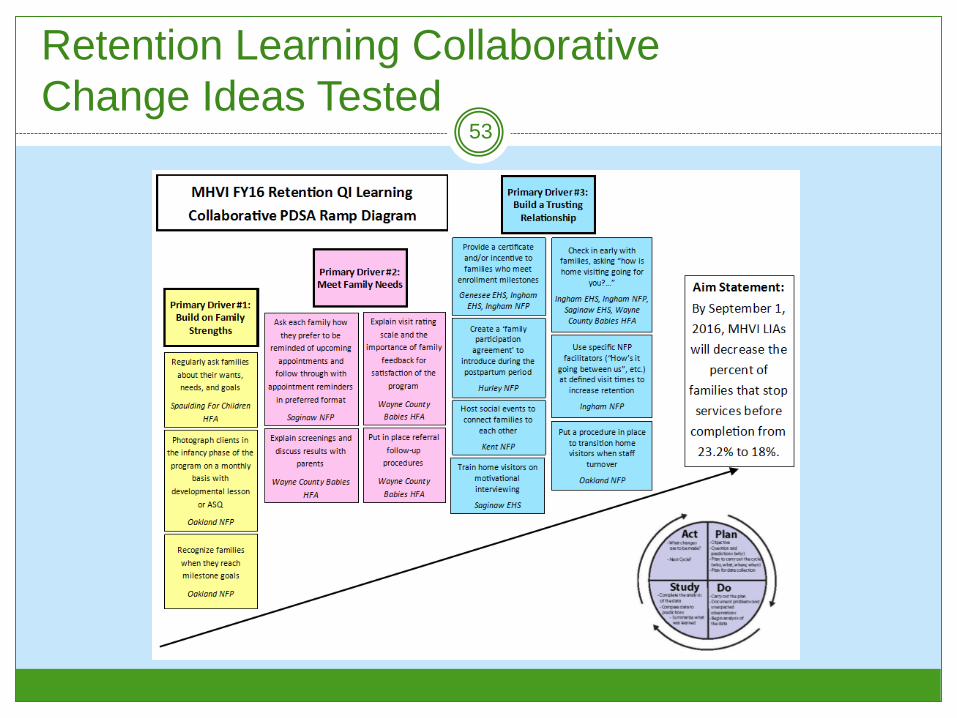
Retention Learning CollaborativeChange Ideas Tested
53
54
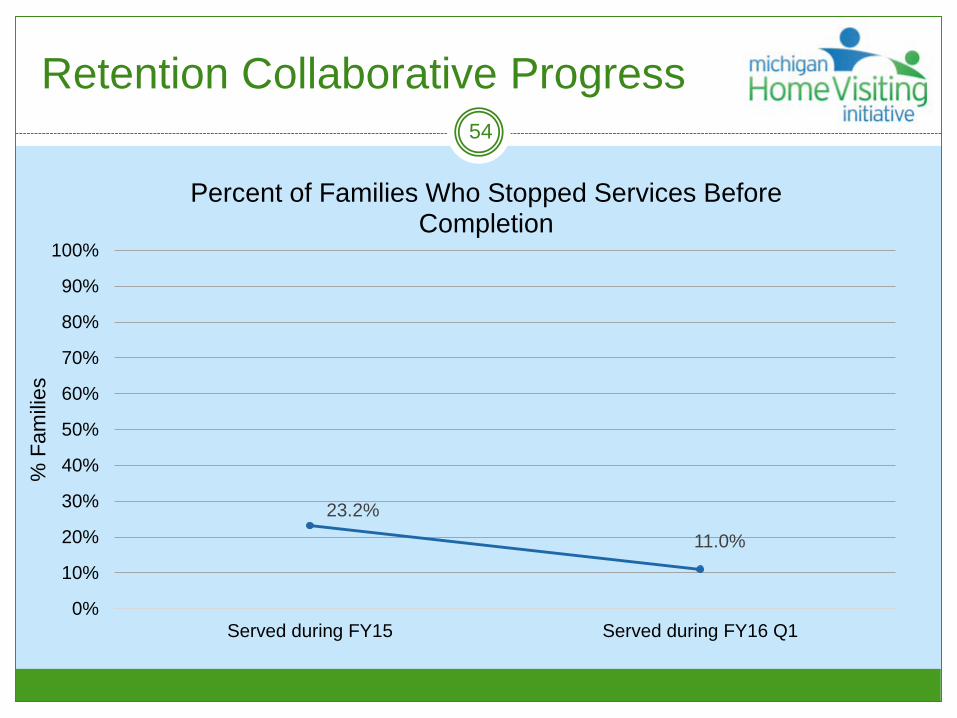
23.2%11.0%
0%
10%
20%
30%
40%
50%
60%
70%
80%
90%
100%
Served during FY15 Served during FY16 Q1
% F
amili
es
Percent of Families Who Stopped Services Before Completion
Retention Collaborative Progress

Retention Collaborative Progress55
75%79% 82% 84%
0%
10%
20%
30%
40%
50%
60%
70%
80%
90%
100%
Nov-15 Dec-15 Jan-16 Feb-16
% F
amili
es
Percent of Families Reaching 3 Month Retention
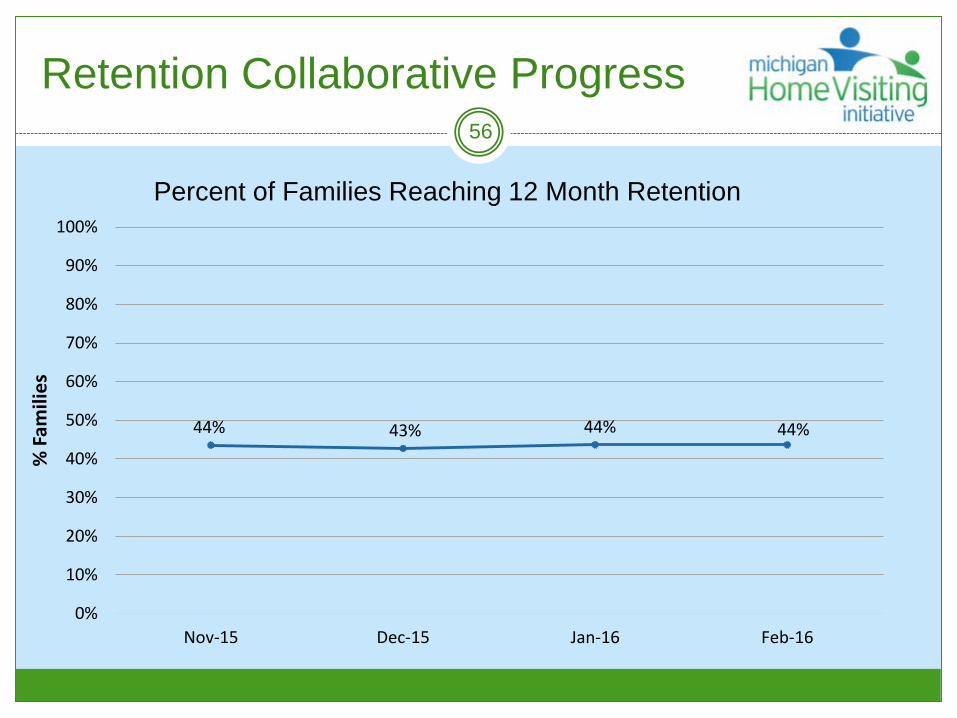
Retention Collaborative Progress56
44% 43% 44% 44%
0%
10%
20%
30%
40%
50%
60%
70%
80%
90%
100%
Nov-15 Dec-15 Jan-16 Feb-16
% F
amili
es
Percent of Families Reaching 12 Month Retention

Retention Collaborative Progress57
88%
96% 100% 100%
0%
10%
20%
30%
40%
50%
60%
70%
80%
90%
100%
Nov-15 Dec-15 Jan-16 Feb-16
% F
amili
es
Percent Families Enrolled in the Last Month who have Goals Identified by the End of the Second Month of Enrollment

Ingham EHS
3

Our QI Learning CollaborativeCQI Team
59
Our team consists of 4 people:
Wendy McBride, EHS manager;
Kelly Uhlmann, EHS Supervisor; and
Kim Thelen and Amanda Hull, Home Visitors.
This is our 3rd year as a team working on PDSA cycles
together.

Why This Topic Matters to Us60
In our program we do not experience challenges with recruitment/enrollment. We have a long waitlist and can always fill our open spots within EHS’s 30 day time frame.
We felt that the area of our focus should be retention. We can get the families enrolled, but at times have a hard time keeping them engaged in our program. Overall, we wanted to look at ways to keep the families enrolled in our program engaged for a longer period of time.
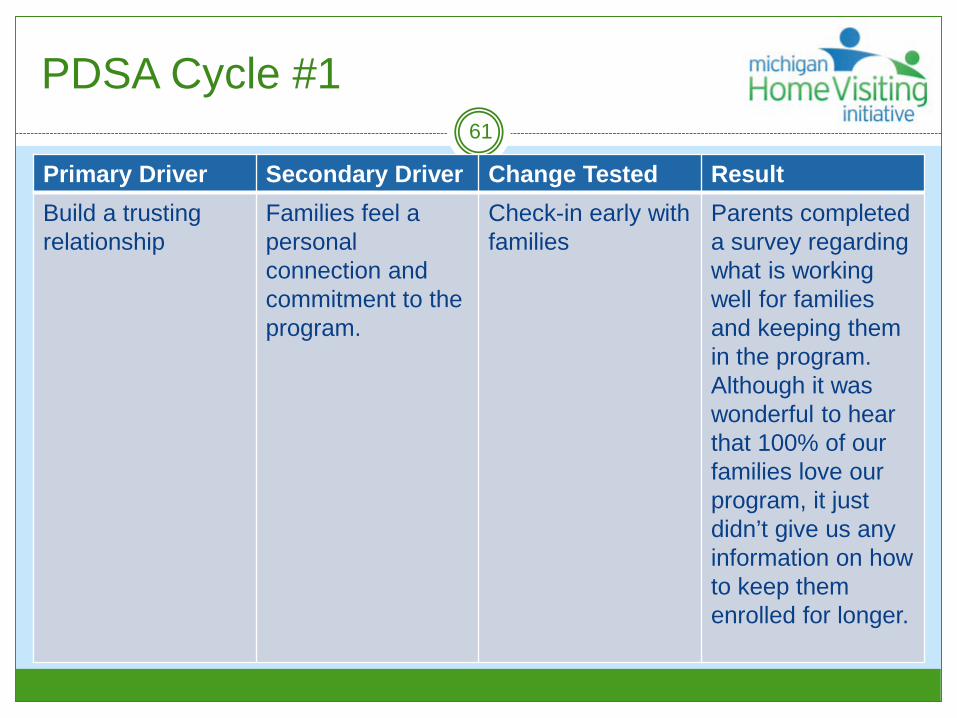
PDSA Cycle #161
Primary Driver Secondary Driver Change Tested ResultBuild a trusting relationship
Families feel apersonal connection and commitment to the program.
Check-in early with families
Parents completed a survey regarding what is working well for families and keeping them in the program. Although it was wonderful to hear that 100% of our families love our program, it just didn’t give us any information on how to keep them enrolled for longer.

PDSA Cycle #262
Primary Driver Secondary Driver Change Tested ResultBuild a trusting relationship
Families feel apersonal connection and commitment to the program.
Provide incentivesto families who meet enrollment milestones (every 6 months)
Developed a list of incentives to be provided to families when they reached milestones and purchased them. At milestone visit the family choose something for themselves and something for their child. 100% of the families who received the incentive are still enrolled!

Successes Achieved through OurPDSA Cycles
63
Through our first cycle, 21 out of 22 surveys handed out to families were returned (95%) and the early check ins with families confirmed that they enjoy our program and their home visitor was a good match for them.
Through our second cycle, 17 out 17 (100%) of families eligible for a milestone incentive received the incentive and are still enrolled in our program. Parents were able to get something for themselves and for their child that they otherwise may have not gotten on their own.

Lessons Learned through Our QI Learning Collaborative Experience
64
We have learned that the families enjoy our program and their home visitor.
Also, families leave for various reasons and the majority of them are because they move, they are too busy, or life circumstances get in the way.
The incentives are nice and the families enjoyed receiving them but February - June is not enough time to see if it truly made a difference in retention or not.

Plans for the Future65
We will continue to do an early check in a few months into the program year. It was nice to see that what we were doing was working well for families.
Continuation of early check ins will also help us to know when something isn’t working well so we can address it quickly.
We will not continue with the incentives. Although it was nice to give something out, we feel it does not impact families retention in our program.

Questions and Answers67