Embed Size (px)
Citation preview

INCREASING READING MOTIVATION IN ELEMENTARY AND MIDDLE SCHOOL
STUDENTS THROUGH THE USE OF MULTIPLE INTELLIGENCES
Mary E. Buschick, B.S. Tracey A. Shipton, B.S. Laurie M. Winner, B.S. Melissa D. Wise, B.S.
An Action Research Project Submitted to the Graduate Faculty of the
School of Education in Partial Fulfillment of the
Requirement for the Degree of Master of Arts in Teaching and Leadership
Saint Xavier University & Pearson Achievement Solutions
Field-Based Master’s Program
Chicago, Illinois
May 2007

i
TABLE OF CONTENTS ABSTRACT ……………………………………………………………………………. iii CHAPTER 1: PROBLEM STATEMENT AND CONTEXT ……………………………. 1 General Statement of the Problem ………………………………………………… 1 Immediate Context of the Problem ………………………………………………... 1 Local Context of the Problem ……………………………………………………..12 National Context of the Problem …………………………………………….….. 17 CHAPTER 2: PROBLEM DOCUMENTATION …………………………………….… 19 Evidence of the Problem ………………………………………………………. 19 Probable Causes ……………………………………………………………….. 34 CHAPTER 3: THE SOLUTION STRATEGY ……………………………………….. 41 Review of the Literature ……………………………………………………….. 41 Project Objective and Processing Statements ………………………………….. 49 Project Action Plan ……………………………………………………………… 50 Methods of Assessment …………………………………………………………. 52 CHAPTER 4: PROJECT RESULTS …………………………………………………… 54 Historical Description of the Intervention ………………………………………. 54 Presentation and Analysis of Results ……………………………………………. 66 Conclusions and Recommendations …………………………………………….. 78 REFERENCES ……………………………………………………………………………80 APPENDICES …………………………………………………………………………… 83 Appendix A: Observation Tally Sheet ………………………..……………….. 83

ii
Appendix B: Student Survey ………………………………………………….. 84 Appendix C: Teacher Survey ………………………………………...….……… 86 Appendix D: Venn Diagram…………………………………………………….. 87 Appendix E: Graphic Organizer………………………………………………… 88 Appendix F: Intrapersonal Activity……………………………………………... 89

iii
ABSTRACT
The problem is that with each passing year it becomes increasingly harder to maintain student motivation to read and improve reading comprehension. The purpose of this project was to increase reading motivation in elementary and middle school students through the use of multiple intelligences. This project was conducted by four teacher researchers who taught in the second, fourth, sixth, and eighth grade levels. The 2nd and 4th grade teachers taught all subjects while the 6th and 8th grade teachers taught reading and language arts. There were 26 second graders, 25 fourth graders, 46 sixth graders and 33 eighth graders used in this study, for a total of 133. The research study began on Monday, January 29, 2007 and concluded on Friday, May 11, 2007. There were three tools used in this project to document evidence of the problem. The first tool was the observation tally sheet. During four 15-minute sessions of SSR, teachers made tally marks when one of the 15 listed behaviors was observed. Out of the 15 listed behaviors, four behaviors made up more than half of the total observed. These behaviors were staring into space, fidgeting, lack of interest, and not paying attention. The second tool was the student survey, which gathered information on student reading habits. The survey included nine questions created to determine students’ feelings towards reading. Students were asked on a pictorial lichert scale to circle the expression that best suited their response. Although students believed they read well and enjoyed being read to by their teacher, the survey showed that students did not read at home, did not enjoy reading for fun, and were not comfortable visiting a library or reading new words. The third tool, the teacher survey, was used to gain insight on the lack of reading motivation and corrective strategies used by teachers at Sites A and B. This tool measured that the lack of reading motivation is common in other classrooms as well as the teacher researchers. It also showed that the two most common intelligences addressed in the classroom were verbal/linguistic and interpersonal, while the least common were intrapersonal and naturalistic intelligence. The teacher researchers chose to implement multiple intelligences as their primary solution to increasing reading motivation in elementary and middle school students. Multiple intelligences incorporate eight major intelligence areas. These areas, as defined by pioneering educators Howard Gardner and Thomas Armstrong, are titled: linguistic intelligence (word smart), logical-mathematical (number smart), spatial intelligence (picture smart), bodily-kinesthetic (body smart), musical intelligence (music smart), interpersonal intelligence (people smart), intrapersonal intelligence (self smart), and naturalist intelligence (nature smart) (Lash, n.d.). The intelligences reflect the structure of individual languages; the power restraints in yourself, expectations of others, cultural pressures, and accepted norms of thinking; and work to solve a problem or make a product (Chapman, 1993). Each person is born with all eight intelligences (Chapman, 1993) and it is therefore recommended that teachers use a variety of ways to teach a lesson (Safi, 1996). One of the most notable results of this study was a major decrease in non-movement and movement behaviors during SSR. Students became skilled in selecting books and choosing activities that suited their dominant intelligence. The results of the student survey showed that there was an increase of students reading at home, visiting a library, and feeling comfortable and confident when approaching a new word in reading. Through this study, the teacher researchers became more tolerant of students’ needs and behaviors that are attributed to their dominant intelligence.

1
CHAPTER 1
PROBLEM STATEMENT AND CONTEXT
General Statement of the Problem
With each passing year it is becoming increasingly harder to maintain student motivation
to read and improve reading comprehension. The behaviors that define the problem area and
contribute to poor academic achievement and learning environment are off-task behaviors such
as not paying attention, fidgeting, staring into space, and demonstrating a lack of interest. One of
the methods used by teacher researchers to provide evidence of this problem was a student
survey that assessed feelings on reading habits. Another method was an observation checklist
administered during several sessions of Silent Sustained Reading (SSR). The final method was a
teacher survey containing three sections which included a checklist of student behaviors
exhibited during reading instruction, teacher strategies related to multiple intelligences that can
be used in the classroom, and an area to report the multiple intelligence strategies that worked
most effectively.
Immediate Context of the Problem
This project was conducted by four teacher researchers. Two of the teacher researchers
taught sixth and eighth grade at Site A. The other two teacher researchers taught second and
fourth grade at Site B. The detailed information at each site can be seen in the subsection below:
Site A and Site B. All information in this subsection had been obtained from the appropriate
Illinois School Report Card, 2005, unless otherwise noted.

2
Site A
The teacher researchers at Site A taught middle school communications covering reading
and language arts. All data in this section is from the Illinois District Report Card, 2005, unless
otherwise specified. Site A is a middle school housing 787 students in sixth through eighth
grade. It is one of five middle schools in the district. Of the 787 students enrolled, the majority
were Hispanic. Refer to Table 1 for the percentage breakdown of racial/ethnic background.
Table 1 Racial/Ethnic Background by Percentage African Asian/
Hispanic American Caucasian Pacific Islander School 67 21.7 8.5 2.5 State 18.3 20.3 56.7 3.7 The majority of the student body had low-income status at 71.4% compared to the state which
had only 40%. However, according to teacher researchers, the mobility rates seem low.
The truancy, mobility and attendance rates are as follows:
Table 2
Attendance, Truancy, and Mobility Rates by Percentage
Attendance Truancy Mobility
School 94.5 8.6 8.3 State 93.9 2.2 16.1
According to the 2005 School Report Card, Site A’s district had 903 teachers out of
128,079 teachers for the state. Of the district’s 903 teachers, 227 were male and 676 were
female. Similar to the state, the majority of teachers are made up of Caucasian American with

3
77.4%. Refer to Table 3 for the percentage breakdown of teacher’s ethnicity in the District and
State.
Table 3
Teacher Racial/Ethnicity Information by Percentage
African Asian/ Caucasian Hispanic American Pacific Islander
District 77.4 12.1 8.1 2.4 State 84.3 4.5 9.9 1.2 The average district teacher salary was $49,607 compared to the state average salary of $55,558.
The education levels in the district vary with only 39.3% of teachers with a Master’s and above
in the district compared to 49.1% in the state. Refer to Table 4 for the breakdown of educational
experience.
Table 4 Teacher Educational Experience by Percentage
Average Teachers with Teachers with Teaching Experience bachelor’s degree masters & Above
District 11.3 years 60.6 39.3 State 13.6 years 50.1 49.1 The ratio of teachers to students in the District for secondary education was 22.2:1. The average
class size reported on the 2005 School Report Card was 15.5 for sixth grade and 15.9 for eighth
grade. However, according to the teacher researchers, these class sizes do not accurately
represent teacher experience.
The core subjects taught in grades sixth through eighth consist of mathematics, science,
social studies, and English/language arts. The curriculum followed the state standards and
4
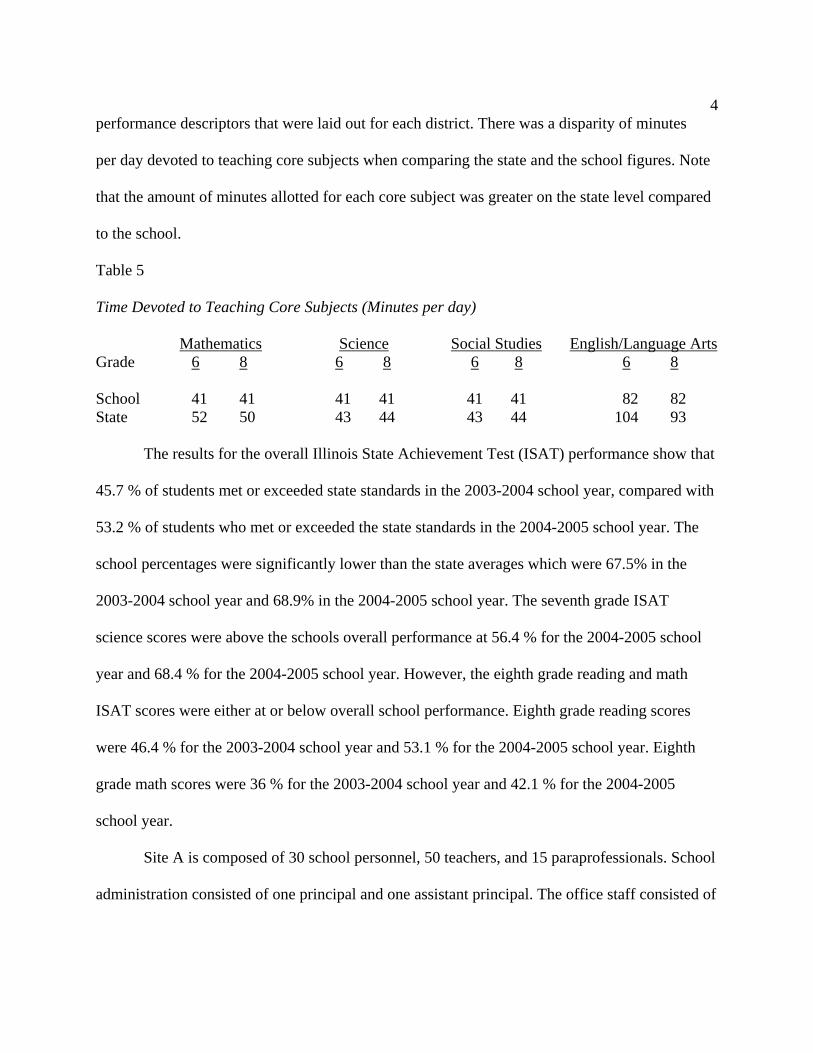
performance descriptors that were laid out for each district. There was a disparity of minutes
per day devoted to teaching core subjects when comparing the state and the school figures. Note
that the amount of minutes allotted for each core subject was greater on the state level compared
to the school.
Table 5
Time Devoted to Teaching Core Subjects (Minutes per day)
Mathematics Science Social Studies English/Language Arts Grade 6 8 6 8 6 8 6 8 School 41 41 41 41 41 41 82 82 State 52 50 43 44 43 44 104 93
The results for the overall Illinois State Achievement Test (ISAT) performance show that
45.7 % of students met or exceeded state standards in the 2003-2004 school year, compared with
53.2 % of students who met or exceeded the state standards in the 2004-2005 school year. The
school percentages were significantly lower than the state averages which were 67.5% in the
2003-2004 school year and 68.9% in the 2004-2005 school year. The seventh grade ISAT
science scores were above the schools overall performance at 56.4 % for the 2004-2005 school
year and 68.4 % for the 2004-2005 school year. However, the eighth grade reading and math
ISAT scores were either at or below overall school performance. Eighth grade reading scores
were 46.4 % for the 2003-2004 school year and 53.1 % for the 2004-2005 school year. Eighth
grade math scores were 36 % for the 2003-2004 school year and 42.1 % for the 2004-2005
school year.
Site A is composed of 30 school personnel, 50 teachers, and 15 paraprofessionals. School
administration consisted of one principal and one assistant principal. The office staff consisted of
5
two full-time secretaries. Other school personnel included three grade level counselors, one
part-time psychiatrist, one social worker, one bilingual liaison, one nurse, one truant officer, one
police officer, four security guards, four custodians, two librarians, one computer technician, and
seven cafeteria workers. The school was divided into teaching teams. The physical education
team had five teachers, and the fine arts team had two art teachers, two full-time music teachers
with a part-time band instructor. The sixth grade team consisted of five full-time and one part-
time teacher. The seventh grade team consisted of six teachers and the eighth grade team was
made up of four. The combo team consisted of six teachers, while the Gifted Accelerated
Program team had five full-time and one part-time teacher. The bilingual team consisted of five
teachers and the special education team has seven teachers. There are a total of 15
paraprofessionals which are dispersed amongst the building.
Site A is one of the original three middle schools in the district. Site A also housed the
middle school Gifted Program for the district. The only CBDIII special education program for
middle schools was also housed at Site A.
Site A is located on the south side of the town at the intersection of two busy roads. As
you enter the school, the parking lot is to the right and a circular drive runs through the front of
the school. Upon entering, you enter into the main hallway with the office directly to the right
and the main gym directly ahead. If you follow to the right, past the office, you will come to the
cafeteria on your left with other administrative and school personnel offices to the right. There is
a hallway to the left of the cafeteria that leads you to the fine arts hallway on the left, or the sixth
grade hallway to the right. If you return to the main entrance and head left, you will pass the
library, a computer lab, and a main hall of classrooms. At the end of that hallway there is another

6
computer lab to the left and the bilingual hallway is to the right. If you were to continue straight
you would continue through the main hallway passing seventh and eighth grade classrooms.
There are three entrances to go upstairs. One entrance is across from the library, another at the
beginning of the seventh and eighth grade hallway, and a third at the end of that hallway.
Upstairs houses the combo and GAP teams with some special education classrooms. On the
south side of the building is a large field used for various PE activities. In front of the building
there is a large grassy knoll.
Many students at the middle school level lack interest and motivation in reading.
Unfortunately too many students view reading as boring or a waste of time. It is becoming harder
to choose material that holds the interest of everyone and at the same time covers what is
necessary according to the curriculum. This brings in the issue of available funds. If material is
outdated, in order to have new, more interesting material for a group of students it most likely
will have to be purchased by us. However, in some cases not at all if the school or district is
unable to purchase it for us. This puts us in an awkward position and we sometimes have to settle
with what we were given. Maintaining student interest is hard in a large class because students,
especially middle schoolers, have differing interests. What part of the class may enjoy might be
of no interest to the rest of the class. Therefore, it is a struggle to motivate and keep all students
engaged in their reading. Since it is such a struggle to even get students motivated to read, you
can imagine the problems that surface in reading comprehension scores. We try to cover
curriculum and make sure Adequate Yearly Progress is met with students that are reading and
achieving below grade level, most of which have English as a second language. The problems
seem endless which is why we are taking a step towards improvement by incorporating lessons

7
designed around the students varying multiple intelligences. If we create lessons designed for
our students and stretch ourselves to teach using a variety of different methods, hopefully student
motivation will improve. Reading should start to become more enjoyable and something that
students actually look forward to. Once the students become more motivated, their
comprehension should improve over time. Incorporating multiple intelligences may be a small
step, but it is a step in the right direction.
Site B
The school had a total enrollment of 417 students. The state had a total enrollment of
2,062,912 students. The elementary building at Site B was made up of six different races. The
majority of the student body was Hispanic. Forty-nine point two percent of students at Site B
were Hispanic compared to 18.3% for the state. Refer to Table 6 below for a complete ethnicity
percentage breakdown.
Table 6 Student Ethnicity by Percentage African Caucasian Asian/Pacific Multiracial/ Native Hispanic American American Islander Ethnic American School 49.2 28.5 18.5 2.4 1.2 0.2 State 18.3 20.3 56.7 3.7 0.7 0.2 The socioeconomic status, referred to, as low-income rate in the school was 37.2% and the state
was 40.0%. Table 7 below shows the chronic truancy, mobility, and attendance rates.

8
Table 7 Chronic Truancy, Mobility, and Attendance Rates
Chronic Truancy Rate Mobility Rate Attendance Rate School 4.0 22.8 94.2 State 2.2 16.1 93.9 According to the 2005 Illinois School Report Card, Site B’s district had 903 teachers out
of 128, 079 teachers for the state. Of the district’s 903 teachers, 227 were male and 676 were
female. Similar to the state, the majority of teachers are made up of Caucasian American with
77.4%. Refer to Table 8 for the percentage breakdown of teacher’s racial/ethnicity in the district
and state.
Table 8 Teacher Racial/Ethnicity Information
Caucasian African Asian/Pacific American Hispanic American Islander
District 77.4 12.1 8.1 2.4 State 84.3 4.5 9.9 1.2
The average district teacher salary was $49,607 compared to the state average salary of
$55,558. The education levels in the district vary with only 39.3% of teachers with a master’s
and above in the district compared to 49.1% in the state. Refer to Table 9 for the breakdown of
educational experience.

9
Table 9 Teacher Educational Experience
Average Teaching Percent of Teachers Percent of Teachers Experience (Years) with Bachelor’s Degrees with Master’s & Above
District 11.3 60.6 39.3 State 13.6 50.1 49.1
According to the 2005 Illinois State Report Card, the district’s elementary student-to-
staff ratio was 21.5:1 compared to a ratio of 18.9:1 for the state. The average class size for
second and fourth grades at Site B was not available in the 2005 Illinois School Report Card.
Third grade was listed as 14.2 for the average class size. However, according to the teacher
researchers at Site B the average class size was almost double this amount.
Site B had an adequate amount of time devoted to teaching the core subject areas. Site B
spent 158 minutes per day teaching English/language arts as compared to the state spending 146
minutes per day. Mathematics was taught 90 minutes per day at Site B and the state spent 58
minutes per day. Science and social science was taught 21 minutes per day. The state spent 30
minutes per day in science and 31 minutes per day in social science. All of this came from the
third grade information in the 2005 Illinois School Report Card. The curriculum followed the
state standards and performance descriptors that were laid out for each district. For the academic
year 2004-2005, 78.1% of the elementary students met or exceeded the Illinois Learning
Standards according to their overall performance on the Illinois Standards Achievement Tests.
The states overall performance was 68.9% that met or exceeded the Illinois Learning Standards.
The students at Site B remained in the average overall in mathematics and science. However, the
10
reading scores at Site B showed only 61.1% of the students met or exceeded the Illinois
Learning Standards.
Site B had a principal, two secretaries, three maintenance staff, three cafeteria workers, a
nurse, a social worker, three speech/language pathologist, a psychologist, two interpreters, a
librarian, a technology assistant, a reading coach, a part time Title I teacher, 15
paraprofessionals, a band teacher, an orchestra teacher, a physical education teacher, an art
teacher, a music teacher, a language arts and literacy teacher, 11 full time regular education
classroom teachers, and 10 special education classroom teachers. Band and orchestra was only
provided for the fourth and fifth graders. The Title I teacher was assigned to first through third
grade. The reading coach worked closely with the kindergarteners and first graders. Music, art,
computers, and LAL are provided for 45 minutes intervals once a week. Library is 35 minutes
per week and physical education is 25 minutes twice a week. The social worker, speech/language
pathologist, and psychologist were available for students who have an IEP or for students that
have academic/behavioral concerns. The interpreters and paraprofessionals were designated to
special education classrooms for students who were in need of additional assistance.
Site B has met AYP for the last five years in a row as defined by the No Child Left
Behind legislation. Site B houses many of the special education programs at the elementary
level. Site B is the only school in the district that incorporates a yearly school wide field trip.
Site B is a two level structure. As you enter the front door, the gymnasium is to the right
and the administrative offices are straight ahead. As you make a right turn before hitting the
offices, you will see the nurse’s office on the right, followed by the staff lounge, kindergarten
room, and ending with the library. If you turn to the left, you will pass the large multipurpose

11
room on the left and shortly enter a circular hallway that houses the first and second grade
classrooms, along with a special education classroom. Directly above is another circular hallway
which houses the art room, and the fourth and fifth grade classrooms. If you were to enter the
building and walk slightly to the left, the offices will be on your right. You will enter a new
hallway that houses special education classrooms. If you take the stairs at the end of the hall to
the second level, you will notice the third grade regular education classrooms, more special
education classrooms, and all of the specialist offices. Located on the east side of the building are
a large playground, basketball court, soccer field, baseball diamond, and blacktop used for a
variety of sidewalk activities. Site B does not have any technology labs, and utilizes the
gymnasium as a cafeteria. The technology assistant travels around to each classroom with two
computer carts.
Even though Site B is an elementary school, the same problems with reading motivation
and comprehension occur as opposed to a middle school, Site A. We have to try and maintain
student interest in a classroom with students of various abilities and learning styles. Reading is
extremely important in the early years and to lose motivation and lack comprehension early on is
a huge problem that will only get worse as students get older. Limited materials and lack of
funds pose a similar problem as in Site A. So, in an effort to improve overall reading
comprehension we need to start at the root of the problem, which is lack of interest and
motivation.

12
Local Context of the Problem
Both Sites A and B are located in the same community. The community resides in the far
northeast portion of the state along a lake. Site A is on the south side of the community while
Site B is on the northwest side.
According to the 2000 census, the community had a total population of 87,901. It is the
ninth largest city in the state by population. Of the total population, males made up 50.8 % of the
population and females 49.2 % (American FactFinder, n.d., U.S. census bureau: General
characteristics). Recent findings suggest that the estimated total population for 2004 jumped to
91,602, which was a change of 4.2 % (City-Data.com, n.d.). The median age for residents of this
community was 29 years. The median household income in 1999 was $42,335, and the median
family income was $47,341. The percentage of individuals below poverty is 13.9 %. Families
below poverty level are 10.7 % (American FactFinder, n.d., U.S. census bureau: Economic
characteristics). Refer to Table 10 to view the age distribution of the community.
Table 10
Age Distribution of the Community
Under 5 yrs. *6-17 yrs. 18 and over 65 and over
Percentage 9.6 12.7 69.8 7.9 Total Number 8,457 11,149 61,348 6,947
* The percentage and total number for 6-17 years was calculated by the teacher researchers due
to absence of category.
13
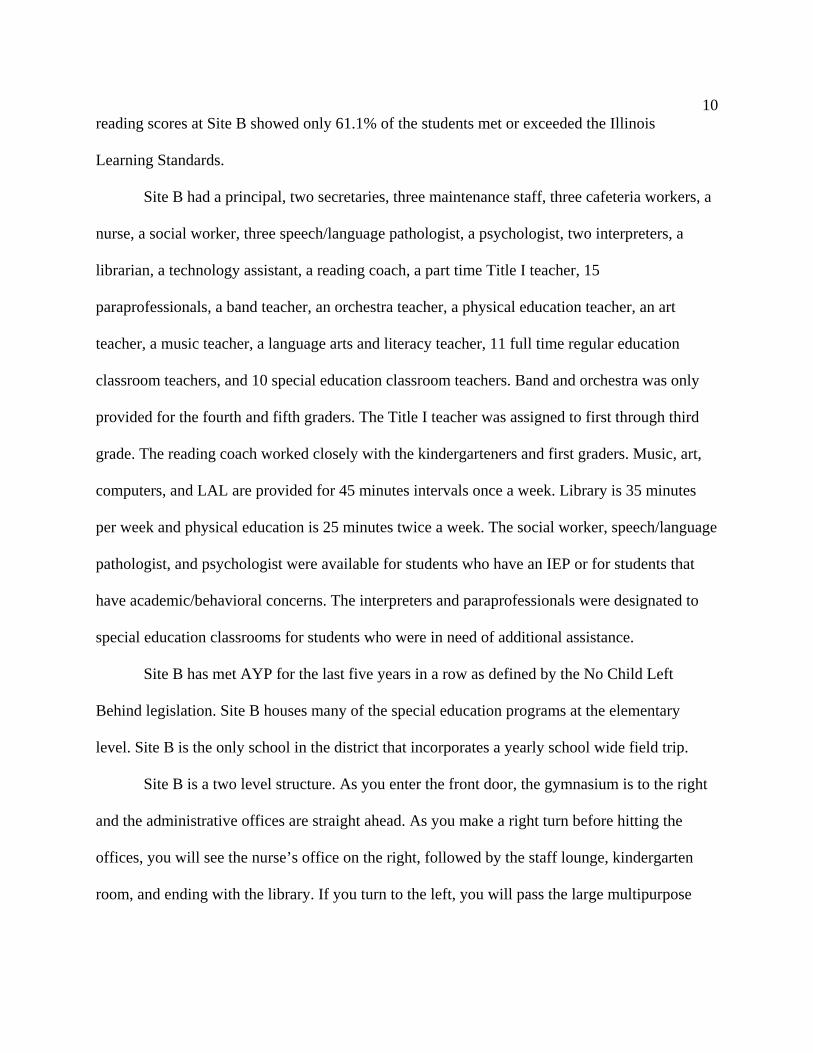
The breakdown of race/ethnicity for the community can be viewed in Table 11 below. Note
that the Hispanic population dominates the community; however teacher researchers believe that
the percentage is actually higher (City-Data.com, n.d.).
Table 11
Race/Ethnicity of the Community
Race Percentage
Hispanic 44.8 Caucasian Non-Hispanic 30.9 Other Races 23.0 African American 19.2 Two or more races 3.5 Filipino 2.1 American Indian 1.0 Asian Indian 0.6 The information found on educational attainment covers members of the community age 25 and
older. The individuals with at least a high school diploma make up 66.5 % of the community.
Those with at least a bachelor’s degree are 16.3 % and those with at least a graduate or
professional degree make up 5.5 % of the community.
There are 27,787 households and 19,450 families residing in the community. Out of
which, 40.4 % had children under the age of 18 living in them and 49.5 % were married couples
living together. Female householders with no husband present made up 14.6 %, 30 % were non-
families, 24.2 % of all households were made up of individuals, and 7.5 % had someone living
alone who was 65 or older. The average household size was 3.09 and the average family size was
3.68. The labor force population for 16 years and over is 42, 994, which is 67.6 % of the
population. On the other hand, the unemployment rate for the community is 9.7 %. Many of the
residents commute to other areas for work, so 5.3 % of the population is lost daily due to
14
commuting. Workers who live and work in this community make up 29.6 %. The main
industries providing employment in this community were manufacturing (26.9 %), educational,
health, and social service (14.6 %), professional, scientific, management, administrative, and
waste management services (11.8 %) (City-Data.com, n.d.). The crime rate in this community is
prevalent. Over the years, crime is becoming an increasing problem. Gang affiliation is an
ongoing issue in this community. A shocking recent article determined that gang members in this
community were estimated at 3,000 (MSNBC.com, 2006). However, a dispute was posted in
another article arguing that there were only 1,400 gang members and only 20 % of them were
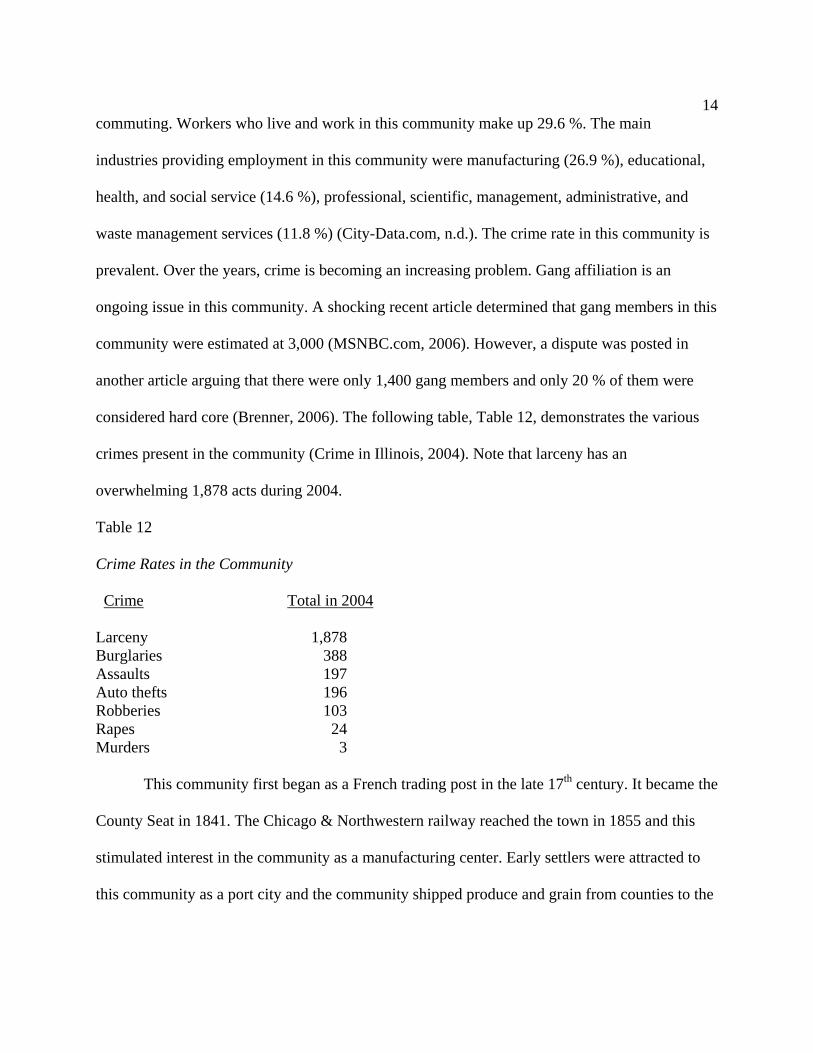
considered hard core (Brenner, 2006). The following table, Table 12, demonstrates the various
crimes present in the community (Crime in Illinois, 2004). Note that larceny has an
overwhelming 1,878 acts during 2004.
Table 12
Crime Rates in the Community
Crime Total in 2004
Larceny 1,878 Burglaries 388 Assaults 197 Auto thefts 196 Robberies 103 Rapes 24 Murders 3 This community first began as a French trading post in the late 17th century. It became the
County Seat in 1841. The Chicago & Northwestern railway reached the town in 1855 and this
stimulated interest in the community as a manufacturing center. Early settlers were attracted to
this community as a port city and the community shipped produce and grain from counties to the

15
city. The town was incorporated as a city in 1859. Current improvements were being made to
the harbor and lake front community and the downtown area. They were aiming for a reduction
in industrial and commercial use of the lakefront (Martin, 2002). Some recreational opportunities
include a large theatre in the downtown area providing a variety of entertainment to the
community, the YMCA, a center for the Arts, park district, BMX track, yacht club, golf club,
beach front area, youth sports programs, and a public library.
The community school district is composed of two early elementary schools, fourteen
elementary schools, five middle schools, and three high schools. The district is run by one
superintendent, one deputy superintendent and four associate superintendents involved with
different divisions of specialized instructional programs and services. Site A has two main feeder
schools, however Site A is a choice school so students from the entire community have the
option to attend. Site B’s attendance is determined by address location (Waukegan Community
Unit District 60, 2006, Schools). The district mission statement reads as follows:
Educating students for the world of tomorrow is our top priority. Through mobilization of
the entire community, we will challenge, teach, and inspire our students. We will provide
the resources to serve each of our students, expecting excellence from all involved. We
will deliver an exciting education in a safe learning environment that celebrates our
diversity and similarities in a spirit of unity and respect. (Waukegan Community Unit
District 60, 2006, Mission statement)
Technology access in the schools and district is somewhat limited. Site A has three
computer laboratories housing 20-30 computers in each and one traveling computer laboratory.
Site B only has one traveling computer lab. In both sites teachers have an average of one to two
16
computers per classroom. According to the 2005 Illinois School Report Card, the local
property taxes made up 47.1 % of the 2003-2004 revenue by source. The 2002 equalized
assessed valuation per pupil was $61,456. The 2002 total school tax rate per $100 was 5.93 and
the 2003-2004 instructional expenditure per pupil was $4,645.
We the teacher researchers deem that many of the problems we have with student
motivation and reading comprehension may be resulting from the demographics, culture, and
socioeconomic status of the community in which we live. The majority of the student population
comes from low-income families, and many also coming from single parent homes. This may be
attributed to reading typically not being viewed as a priority, families not utilizing the library,
and homes lacking print materials. Parental involvement in their child’s education may be
lacking for many. As much as teachers stress the importance of reading, it needs to be reinforced
at home as well. Language is an issue because too many students are coming in below grade
level with limited English proficiency. However, if the parents do not speak or read in English,
the students might not yet see the importance of it. With the community our students live in and
the many struggles they already must endure, it is no surprise that they do not view school as
something beneficial to their future. This makes our job as a teacher twice as hard. We need to
begin by improving motivation to learn and read and once we have that we can work on
improving their skills and comprehension. If we go above and beyond to make reading enjoyable
and interesting to all through multiple intelligences then we can begin to maintain student
motivation and move toward improving overall reading comprehension.
National Context of the Problem

17
Society and its members—families, individuals, employers, and governmental and
private organizations—provide support for education in various ways, such as spending time on
learning activities, encouraging and supporting learning, and investing money in education.
Parents contribute to the education of their children in the home through encouraging them to
learn and teaching them directly. Communities provide learning and values to their members
through various kinds of formal and informal modes (National Center on Educational Statistics,
2003). However, through all this, students of lower socio-economic status often do not receive
the same parental nurture and support of that of their white peers.
According to the National Center on Educational Statistics (2003), the poverty level of
students sets the social context for their progress and achievement in school. In the 4th, 8th, and
12th grades, the average mathematics scores of students decline as the percentage of students
who receive free or reduced-price lunch in the school increases. The percentage of students from
families below the poverty line is highest in central cities and lowest in the urban fringe or rural
areas within metropolitan areas (National Center on Educational Statistics, 2003).
In 1999, 16% of all children ages 5–17 lived in households where the annual income in
the previous year was below the poverty level. Compared with students in other types of
communities, students in school districts in central cities were more likely to be poor, and
students in the urban fringe or rural areas within metropolitan areas were less likely to be poor
(National Center on Educational Statistics, 2003).
Along with these conclusions, the differences in children's reading skills and knowledge
appear to be present when children enter kindergarten and persist or increase throughout the first
two years of school. For example, when children entered kindergarten (in fall 1998) and after
18
two years of school (in spring 2000), Caucasian children had higher assessment scores in
reading than African American and Hispanic children, and children from poor families had lower
scores than children from nonpoor families. Children with richer home literacy environments
demonstrated higher levels of reading skills and knowledge when they entered kindergarten in
1998-99 than did children with less rich literacy environments. Children’s home literacy
environment varied by their poverty level, with poor children scoring lower than nonpoor
children on a home literacy index. The percentage of poor and nonpooor children who
participated in literacy activities with a family member increased between 1993 and 2001.
Despite these increases, nonpoor children were more likely than poor children to engage
frequently in certain literacy activities in 2001, such as being read to by a family member or
being told a story (National Center on Educational Statistics, 2003). Without a positive learning
environment in the home, it is difficult for students to maintain and increase reading skills and
literacy in the classroom.

19
CHAPTER 2
PROBLEM DOCUMENTATION
Evidence of the Problem
The purpose of this research project was to increase reading motivation in elementary and
middle school students. There were 26 second graders, 25 fourth graders, 46 sixth graders and 33
eighth graders used in this study, for a total of 133. The second and fourth grade teachers taught
all general subjects and the sixth and eighth grade teachers taught communications (reading and
language arts). The three tools used to document the problem evidence included reading
observation tally sheet (Appendix A), a student survey (Appendix B), and a teacher survey
(Appendix C). These tools were used within a two week time frame beginning Monday, January
29, 2007 and concluding on Friday, February 9, 2007.
Observation Tally Sheet
The purpose of the observation tally sheet was to observe the frequency of problem
behaviors related to the lack of reading motivation. All participating students were observed by
each teacher researcher. The observation tally sheet was used during four 15 minute sessions of
silent sustained reading. The observation tally sheet was completed twice a week during the two
week period of January 29, 2007 through February 9, 2007. There were 15 listed behaviors that
were observed during each of these sessions (Appendix A).
There was a total of 723 behaviors observed, the data has been divided based upon
movement and is represented between Figures 1 and 2. Of 723 observed behaviors, 430 (n=59%)
were non-movement behaviors and the remaining 293 (N=41%) involved movement. Though the
behaviors are separated between the figures, percentage calculations are based upon the total of

20
723. Out of the 15 listed behaviors, four behaviors made up 54% (n= 723) of the total
observed. These behaviors were staring into space (n=119), fidgeting (n= 113), lack of interest
(n=81), and not paying attention (n=82). Three out of these four most prevalent behaviors are
non-movement behaviors.
Figure 1 demonstrates the frequency of occurrences for the non-movement behaviors
observed during silent reading. Overall, staring (n=119), not paying attention (n=82), and lack of
interest (n=81) were the highest percentage of the non-movement behaviors.
119
82 8170
57
21
00
20
40
60
80
100
120
140
Staring Notpaying
attention
Lackinterest
Head ondesk
Wastingtime
Indecisive Bored
Behaviors
Freq
uenc
y of
Occ
urre
nce
Figure 1: Silent Reading Behaviors: Non-Movement (n=430)
Figure 2 shows that fidgeting is the most pervasive movement behavior demonstrated in
the classroom with a total of 113 occurrences. This is followed by flipping pages (n=66) and
doing other work (n=44). Fidgeting, flipping pages, and doing other work represent 52% (n=223)
of the total movement behaviors.

21
113
66
44
25 2014
7 40
20
40
60
80
100
120
Fidgeting Flippingpages
Doing otherwork
Hands indesk
Out of seat Complaining Doodling Tappingpencil
Behaviors
Freq
uenc
y of
Occ
uren
ce
Figure 2: Silent Reading Behaviors: Movement (n=293)
Student Survey
The purpose of the student survey was to help the teacher researchers gather information
on student reading habits. The survey was given on Thursday, February 1, 2007. This
questionnaire was distributed to 33 eighth graders, 46 sixth graders, 25 fourth graders, and 26
second graders for a total of 133. All participating students completed the survey given to them
by the teacher researchers. The survey included nine questions created to determine students’
feelings towards reading (Appendix B). Students were asked to circle the facial expression that
best described the way they felt. The expressions were labeled love it, like it, leave it, or loathe
it. In each graph, the love it and like it data was grouped together and the leave it and loathe it
data was grouped due to the importance of the meaning.
In the student survey, question one asked students how they felt about reading a book in
school during free-time. Results showed that 51% (n=54) of students enjoyed reading during
free-time in school.

22
10%
41%30%
19%
Love it Like it Leave it Loathe it
Figure 3: Reading During Free Time (n=105)
In question two, students were asked how they felt about reading for fun at home. Results
showed that 66% (n=69) of students do not enjoy reading for fun at home.
11%
23%
38%
28%
Love it Like it Leave it Loathe it
Figure 4: Reading For Fun at Home (n=105)

23
Question three asked students how they feel about reading instead of playing. Results
showed that 79% (n=83) of students chose to play rather than read.
5%
16%
23%
56%
Love it Like it Leave it Loathe it
Figure 5: Reading Instead of Playing (n=105)
In question four, students were asked how they feel about reading different kinds of
books. The data reveals 70% (n=74) of students enjoyed having their choice of reading material.
29%
41%
22%
8%
Love it Like it Leave it Loathe it
Figure 6: Reading a Variety of Books (n=105)
24
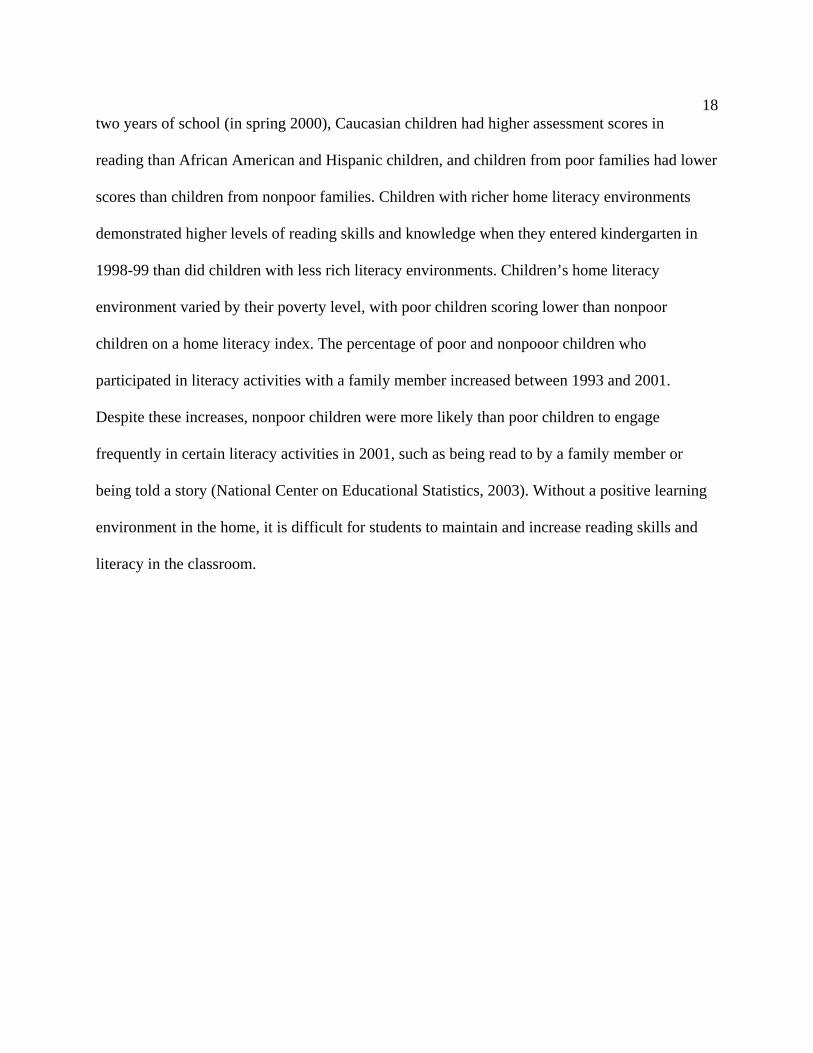
Question five asked students how they feel about how well they read. Overall, 81%
(n=85) of the students believe that they read well and only 19% (n=20) feel that they do not.
29%
52%
14%
5%
Love it Like it Leave it Loathe it
Figure 7: How Well Students Feel They Read (n=105)
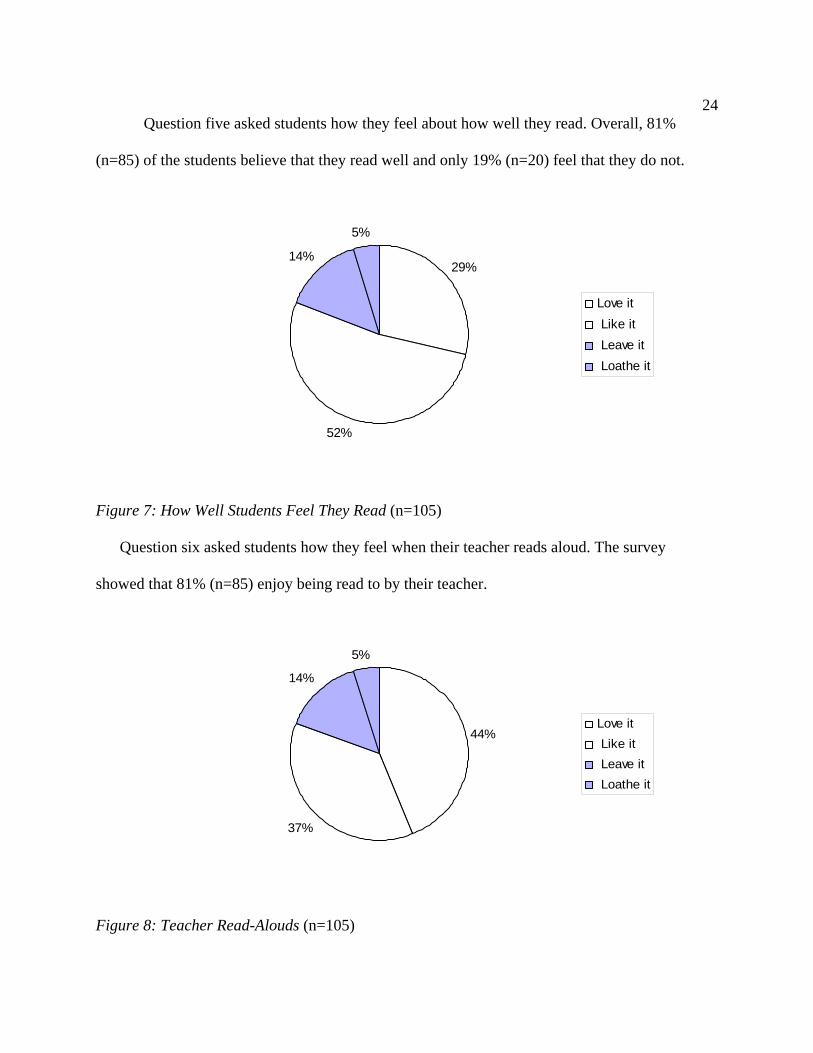
Question six asked students how they feel when their teacher reads aloud. The survey
showed that 81% (n=85) enjoy being read to by their teacher.
44%
37%
14%
5%
Love it Like it Leave it Loathe it
Figure 8: Teacher Read-Alouds (n=105)
25
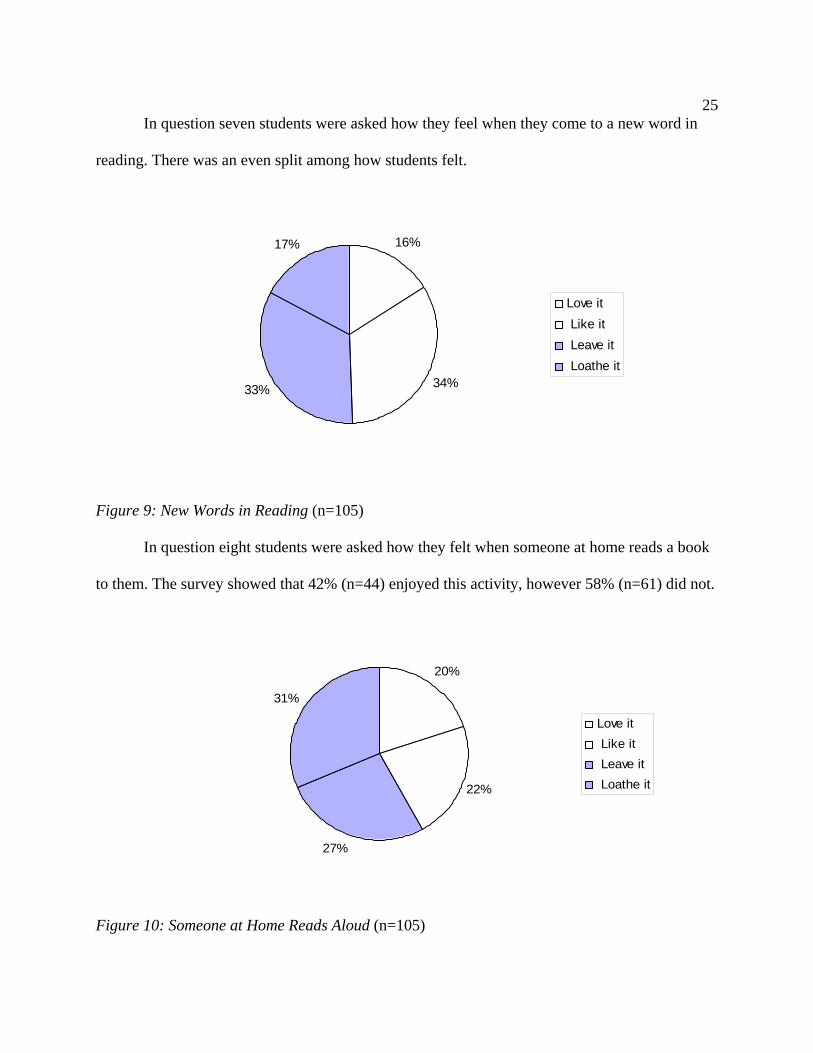
In question seven students were asked how they feel when they come to a new word in
reading. There was an even split among how students felt.
16%
34%33%
17%
Love it Like it Leave it Loathe it
Figure 9: New Words in Reading (n=105)
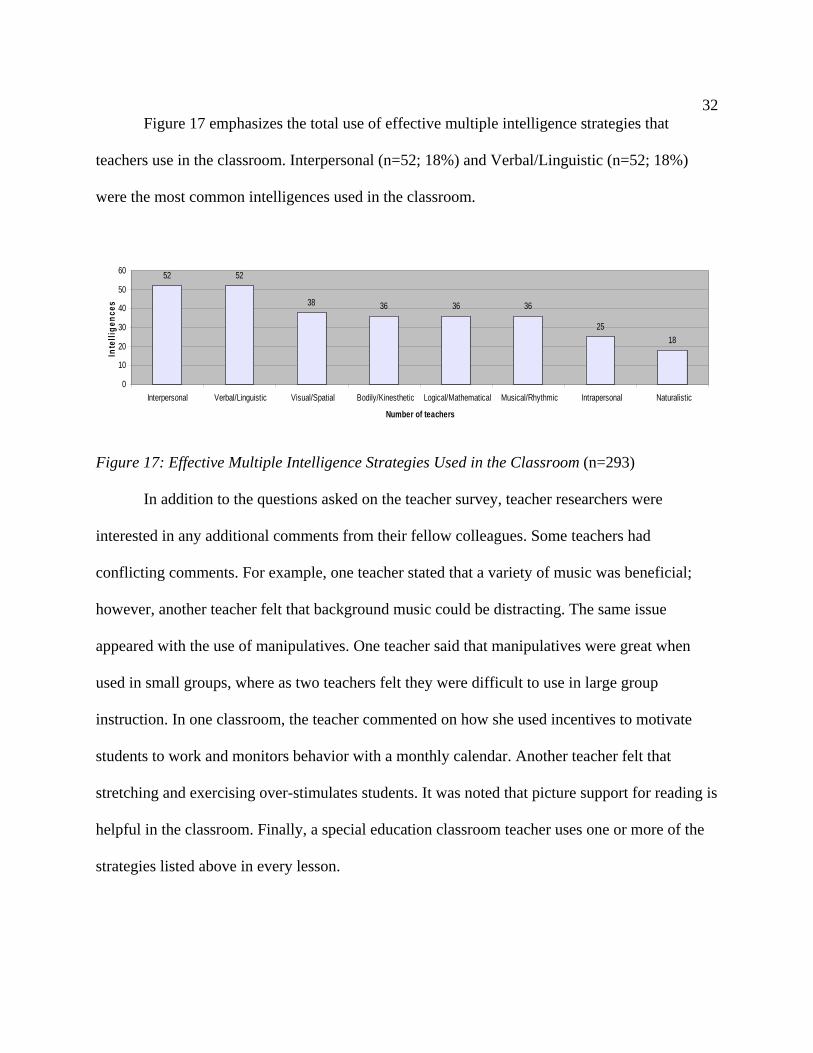
In question eight students were asked how they felt when someone at home reads a book
to them. The survey showed that 42% (n=44) enjoyed this activity, however 58% (n=61) did not.
20%
22%
27%
31%
Love it Like it Leave it Loathe it
Figure 10: Someone at Home Reads Aloud (n=105)

26
Finally, question nine asked students how they feel about visiting a library. There is a
marked difference in the number of students who enjoy visiting a library (n=69; 66%) as
opposed to those that do not (n=36; 34%).
36%
30%
21%
13%
Love it Like it Leave it Loathe it
Figure 11: Visiting a Library (n=105)
Teacher Survey
The purpose of the teacher survey was to gain teacher insight on the lack of reading
motivation and corrective strategies used by the teachers at Site A and Site B. The information
measured whether the lack of reading motivation is common in other classrooms as well as the
teacher researchers’ classrooms. The survey was given by teacher researchers to approximately
50 classroom teachers during a staff meeting on Wednesday, February 7, 2007 at Site A. That
same day the survey was given by teacher researchers to approximately 30 teachers at Site B.
The percent rate of return was 84% (n=42) at Site A and 80% (n=24) at Site B. There were a
total of three questions and a space for additional comments. The first two questions required
that the teachers circle options best suited to their classroom. The final question allowed them to

27
fill in strategies that have worked in their classroom. An optional open ended comment section
was offered (Appendix C).
Question one asked faculty to circle the behaviors they have seen students display in their
classroom during instruction, reading, and/or discussion time. Figures 12 and 13 report 553 total
behaviors observed in their classroom. There were 254 (46%) non-movement behaviors and
similarly 299 (54%) movement behaviors. The four most seen behaviors were not paying
attention (n=55; 10%), staring into space (n=48; 8%), tapping pencils (n=44; 8%), and wasting
time (n=41; 7%).
Figure 12 demonstrates the frequency of occurrences for the non-movement behaviors
observed through teacher classrooms. Overall, not paying attention (n=55; 22%), staring (n=48;
19%) and wasting time (n=41; 16%) were the highest.
55
4841
3733
28
12
0
10
20
30
40
50
60
Not payingattention
Staring Wastingtime
Lackinterest
Head ondesk
Bored Indecisive
Behaviors
Freq
uenc
y of
Occ
uren
ce
Figure 12: Silent Reading Behaviors: Non-Movement (n=254)

28
Figure 13 shows that tapping a pencil is the most frequently observed movement
behavior in the classroom with a total of 44 occurrences. This is followed by doodling (n=37;
12%) and fidgeting (n=35; 12%).
44
37 35 35 3429
25 25
05
101520253035404550
Tappingpencil
Doodling Fidgeting Complaining Out of seat Doing otherwork
Hands indesk
Flippingpages
Behaviors
Freq
uenc
y of
Occ
urre
nce
Figure 13: Silent Reading Behaviors: Movement (n=299)
Question two asked faculty to circle the strategies that they have used in their classroom.
The total number of responses was 531. Interpersonal (18%, n=93) and verbal/linguistic (17%,
n=92) were the most frequently used by the faculty. Conversely, naturalistic (6%, n=30) and
intrapersonal (10%, n=55) were the least used intelligences. The following chart demonstrated in
Figure 14 displays the breakdown of the multiple intelligences and the strategies used.

29
Intelligence n Total % Strategy n= Cooperative
Learning 53
Interpersonal
93 18 Creative Group Tasks
40
Manipulatives 50
Verbal/Linguistic
92 17 Student Centered Learning
42
Background Music 42
Musical/Rhythmic
69 13 Creating Songs 27
Cognitive Organizers
36
Visual/Spatial
69 13 Art Materials 33
Venn Diagram 34
Logical/Mathematical
63 12 Calculators 29
Role-Play 35
Bodily/Kinesthetic
60 11 Stretching 25
Journaling 28
Intrapersonal
55 10 Self Discovery 27
Science Experiments
19
Naturalistic
30 6 Nature Walks &
Talks 11
Figure 14: Multiple Intelligence Strategies Used in the Classroom (n=531)

30
Figure 15 emphasizes the breakdown of the total number of multiple intelligences used
by teachers in the classroom.
93 92
69 6963 60
55
30
0102030405060708090
100
Interpersonal Verbal/Linguistic Musical/Rhythmic Visual/Spatial Logical/Mathematical Bodily/Kinesthetic Intrapersonal Naturalistic
Intelligences
Freq
uenc
y of
Use
Figure 15: Multiple Intelligence Strategies Used in the Classroom (n=531)
Finally, question three asked faculty to fill in which strategies have worked in their
classroom from those they had circled in question two. Once again, the findings (n=293) showed
that interpersonal (n=93; 18%) and verbal/linguistic (n=92; 17%) were the intelligences that the
faculty reported worked best. Naturalistic (n=30; 6%) and intrapersonal (n=55; 10%) were
reported to work the least. The following chart demonstrated in Figure 16 displays the
breakdown of the multiple intelligences and the strategies that teachers felt were most effective.

31
Intelligence n Total % Strategy n= Cooperative
Learning 32
Interpersonal
52 18 Creative Group Tasks
20
Manipulatives 34
Verbal/Linguistic
52 18 Student Centered Learning
18
Art Materials 20
Visual/Spatial
38 13 Cognitive Organizers
18
Role-Play 23
Bodily/Kinesthetic
36 12 Stretching 13
Calculators 19
Logical/Mathematical
36 12 Venn-Diagrams 17
Background Music 18
Musical/Rhythmic
36 12 Creating Songs 18
Journaling 15
Intrapersonal
25 9 Self Discovery 10
Science Experiments
12
Naturalistic
18 6 Nature Walks &
Talks 6
Figure 16: Effective Multiple Intelligence Strategies Used in the Classroom (n=293)
32
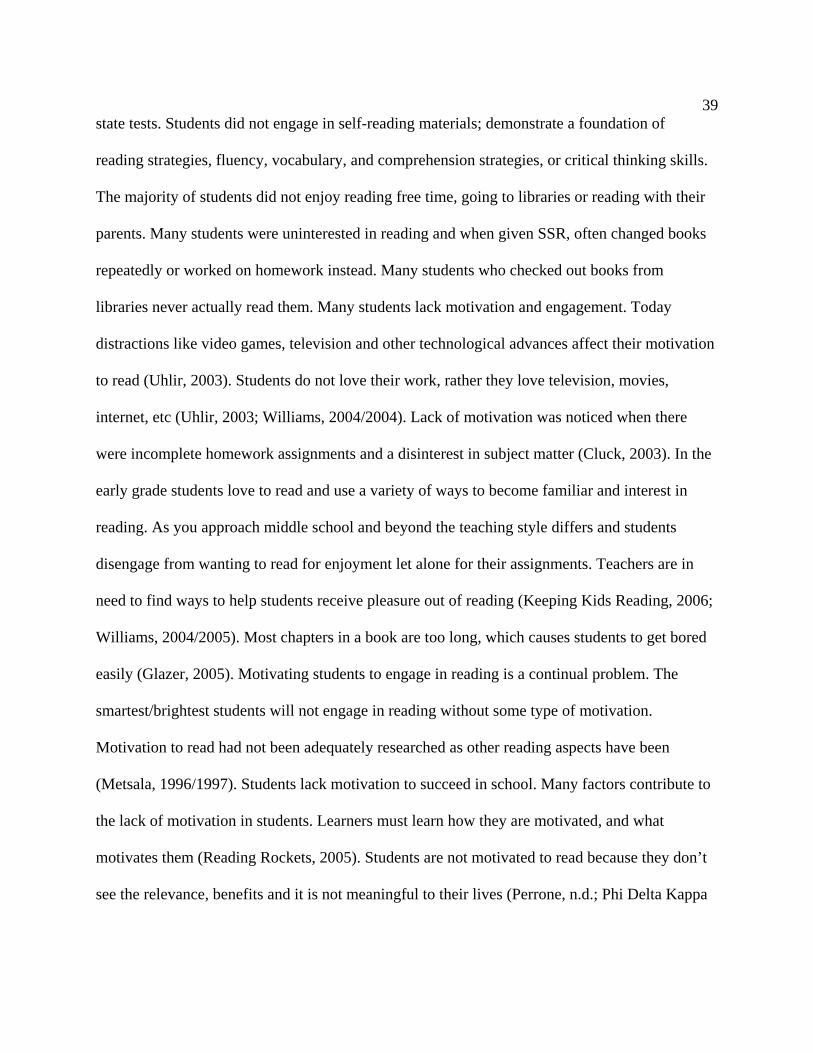
Figure 17 emphasizes the total use of effective multiple intelligence strategies that
teachers use in the classroom. Interpersonal (n=52; 18%) and Verbal/Linguistic (n=52; 18%)
were the most common intelligences used in the classroom.
52 52
38 36 36 36
2518
0
10
20
30
40
50
60
Interpersonal Verbal/Linguistic Visual/Spatial Bodily/Kinesthetic Logical/Mathematical Musical/Rhythmic Intrapersonal Naturalistic
Number of teachers
Inte
llige
nces
Figure 17: Effective Multiple Intelligence Strategies Used in the Classroom (n=293)
In addition to the questions asked on the teacher survey, teacher researchers were
interested in any additional comments from their fellow colleagues. Some teachers had
conflicting comments. For example, one teacher stated that a variety of music was beneficial;
however, another teacher felt that background music could be distracting. The same issue
appeared with the use of manipulatives. One teacher said that manipulatives were great when
used in small groups, where as two teachers felt they were difficult to use in large group
instruction. In one classroom, the teacher commented on how she used incentives to motivate
students to work and monitors behavior with a monthly calendar. Another teacher felt that
stretching and exercising over-stimulates students. It was noted that picture support for reading is
helpful in the classroom. Finally, a special education classroom teacher uses one or more of the
strategies listed above in every lesson.

33
Summary
Based upon the data collected in the observation tally sheet, the teacher researchers
learned that the most prevalent behaviors were non-movement behaviors such as staring into
space, lack of interest, and not paying attention (Figure 12). Most unmotivated students are
unnoticed because they are not being disruptive in the classroom. The student survey showed
that students are relating reading to school rather than a leisure activity at home (Figure 4).
Another interesting observation was that although most of our students feel that they read well,
they are not comfortable with new words. In both the observation tally sheet and teacher survey,
three out of the four highest reported behaviors were non-movement behaviors (Figure 1).
Overall, the two common non-movement behaviors (Figure 1) in both the observation tally sheet
and teacher survey (Figure 12) were staring into space and not paying attention. In both
questions two and three of the teacher survey (Figures 14 & 16), the results were similar due to
the high use of interpersonal and verbal/linguistic intelligence, on the other hand, the least used
intelligences were naturalistic and intrapersonal (Figures 14, 15, 16, & 17). If intelligences are
not being used frequently, students will be unable to be successful in those areas.
The results of the student survey showed that there was no strong preference between
whether the students enjoyed or did not enjoy reading during free-time (Figure 3). We also
concluded that students view reading as a school activity rather than something they prefer to do
at home (Figure 4). Overall, we determined that students prefer bodily/kinesthetic activities over
reading (Figure 5). While analyzing data we noticed that there was a discrepancy between
questions five and seven on the student survey (Figures 7 & 9). Although 81% of the students
feel they read well, only 50% of them felt comfortable approaching a new word when reading

34
(Figures 7 & 9). As seen in Figure 8, there was a 39% increase in those who enjoy being read
to by a teacher (81% as noted in question six) as opposed to by a parent (42%) (Figure 10). In
addition, this validates our conclusion from question two in which students felt reading was a
school activity rather than something they enjoy to do at home (Figures 3 & 4).
Overall from the teacher survey, the teacher researchers gained helpful perspectives into
fellow colleague’s strategies and opinions. We noticed that teachers focus mainly on traditional
teaching methods which include interpersonal and verbal/linguistic. This style of teaching does
not address the needs of students who have not fully developed these multiple intelligences
(Figures 14 & 15).
After reviewing all the data, we feel that we need to use a greater variety of intelligences
in our classrooms. This will help those students whose intelligences are not tapped to see reading
as more than just a school requirement. We also feel that we need to pay attention to those non-
movement behaviors our students display as a sign of their lack of motivation. To do so, we will
continuously circulate the room, model activities, observe more closely through SSR, and offer a
wider variety of appealing choices catering to gender, learning style, and reading ability. In
addition to that, we need to model and practice a variety of strategies to strengthen our students’
comfort level in new words and reading activities.
Probable Causes
For decades teachers, worldwide and from K-12th grade, have pondered the issue of lack
of motivation on the student’s part when it has come to reading. With each passing year this
issue seems to get increasingly harder to tackle. According to the literature on this pressing issue,
there seem to be an abundance of probable causes. These causes range from learning in a

35
traditional classroom, to students having different learning abilities, to students lacking skills,
and also children having decreased enjoyment in reading.
A major cause for the lack of motivation in reading is the traditional classroom. In a
traditional classroom, the teacher stands and lectures, writes on the board, assigns handouts
(Stanford, 2003), as well as expecting the children to memorize many vocabulary words and
their meanings for class (Safi, 1996). In a study observing more than 100 classrooms, 70% of the
time was filled with teachers talking, followed by students working on their written assignments
(Stanford, 2003). The emphasis in schools is on the logical/mathematical and verbal/linguistic
intelligences. This means the other types are overlooked and the students who have these
overlooked intelligences are at a disadvantage (Chapman, 1993; Ozdemir, 2006). Traditional
teaching methods are not focusing on individual learning styles (Cluck, 2003). Teachers cannot
continue to teach as they once learned. Teachers must work harder to keep up with the new
demands of technology to properly prepare the students for their future (Wells, 2006). The
greatest challenge is the time required in planning appropriate lessons and activities that reach
and assess all the different levels of interest, readiness, and individualized profiles for every
student. Classroom management becomes another issue because the teacher becomes a facilitator
and no longer just a dispenser of knowledge (Corley, 2005).
The problem that Armstrong discusses in his article is the war on reading. Educators,
researchers, and other stakeholders have been fighting over the best way to teach reading for
several decades. In his article Armstrong refers to this as the literacy lion. One educator may
believe that literacy is taught through whole words, another educator feels that literacy is best
taught by sounds, a third educator may think it should be taught through stories and songs, and

36
others may think that in order to teach literacy skills we should encompass whole cultures and
their triumphs and struggles. Each of these participants believes that their techniques are the
correct ones for all of their students. Each side of the argument seems to have some truth to it.
However, the main problem is that they are seeing only their side and not seeing the big picture.
In order to effectively teach reading that meets the needs of our diverse student populations we
must see the whole reading process. As long as we see the literacy lion in tunnel vision, we will
be hampered in our ability to provide different kinds of learners with the experiences they need
(Armstrong, 2004).
If reading is to become a motivational experience, we, the educators, must chip away at
the traditional classroom (get out of our comfort zone) and begin to sculpt a progressive
classroom. This classroom would allow the student to experience reading as a wonderful,
fulfilling, and motivating occurrence.
Each classroom also faces the problem of a wide range of learning abilities. Students
often have one intelligence they dominate in, where others may need a variety of intelligences
(Safi, 1996). Everyone has their own comfort level in the classroom (Safi, 1996). Each child is
born with a different capacity of the intelligences, is a unique individual, and sees the world in
their own individualized way (Chapman, 1993; Lash, n.d.). Some students grasp strategies while
others remain reliant on an isolated tactic (Marcell, 2005). Students who are failing, but not
qualifying for special education need an alternative program and differentiated small group
instruction (Rubado, 2002).
Another issue that many teachers have is the challenge of reaching and maximizing the
learning potential of all students while recognizing the differences between them (Corley, 2005).

37
When attempting to use whole-group instruction with a multilevel class it is impossible to
reach and even teach all the students (Saldana, 2005). Educators need to rethink their lessons due
to the different learning abilities of students (Safi, 1996). If a teacher decides to implement
differentiated instruction, they may face some challenges. Teachers need to be aware of the
various readiness levels, interests of students, and learning profiles for each. Teachers must
ensure that the needs of all their learners are valued and served equally. Teachers must
understand and know their learners skill levels, strengths, challenges, interests, needs,
preferences, and goals (Corley, 2005).
The U.S. Department of Education says school age boys read a grade and a half lower
than girls. This is attributed to the fact that boys read less than girls, teachers urge boys to read
the wrong books, boys only use half their brain at one time, and because of this boys need more
stimulation when reading to get the other half of the brain working. Many women teachers are
less respectful of boys’ book choices and therefore promote more books that appeal to girls
(Sullivan, 2004).
The changing demographics of family and community often determine the effects on the
students learning capabilities. Students enter districts at different times, at different ability levels
(Uhlir, 2003).
Many students tend to be inattentive, passive and disorganized. In a recent study
conducted by Uhlir, many students lacked interest in reading which directly effected their
reading growth. Students did not demonstrate a strong foundation of reading strategies, fluency,
vocabulary, comprehension strategies, and even critical thinking skills. Many students did not
see the relevance of the material being studied and were unable to relate it to their lives. Lack of

38
strategic reading skills caused many students to not participate in class or test well (Uhlir,
2003). Poor thinkers and poor problem solvers may have the skills to do it, but lack the use of
skills they need to be successful (Stanford, 2003). These characteristics may be related to their
failure to comprehend what they read (Uhlir, 2003). Reading and writing to some students can be
referred to as a chore (Perrone, n.d.; Phi Delta Kappa Fastbacks, 1999; Williams, 2004/2005).
Students have a tendency to be hesitant writers when they do not know the material (Glazer,
2005). Students struggle with deliberate decoding: cannot tell what happened or where it took
place while reading a story. Children cannot make sense of books while reading (Marcell, 2005).
Meaning is not always extracted from the text even though the words are being read (Kuersten,
n.d.). Teachers want to find a strategy to help students come alive and independent without
having to constantly prompt the student (Marcell, 2005). Students with learning disabilities show
a deficit in verbal/linguistic and logical/mathematical intelligences (Stanford, 2003). Middle and
high schoolers often lack skills to decipher more complex reading materials (Kuersten, n.d.).
In some cases, lack of motivation and skill continues to be a problem into adulthood. A
study discussed in Saldana’s article showed that even when individual work was required
approximately half the class slept instead. When asked to write, students groaned, complained
and many admitted that they were unable to write and some were unable to even spell or form
coherent words. Even though implementing differentiated instruction would take a lot of work
and energy, it was something that needed to be done (Saldana, 2005).
An additional probable cause for students’ lack of reading motivation is decreased
enjoyment. In a study documented by Uhlir, Students in a 5th grade classroom were not
motivated to meet or exceed expectations in reading comprehension on assignments, tests, and
39
state tests. Students did not engage in self-reading materials; demonstrate a foundation of
reading strategies, fluency, vocabulary, and comprehension strategies, or critical thinking skills.
The majority of students did not enjoy reading free time, going to libraries or reading with their
parents. Many students were uninterested in reading and when given SSR, often changed books
repeatedly or worked on homework instead. Many students who checked out books from
libraries never actually read them. Many students lack motivation and engagement. Today
distractions like video games, television and other technological advances affect their motivation
to read (Uhlir, 2003). Students do not love their work, rather they love television, movies,
internet, etc (Uhlir, 2003; Williams, 2004/2004). Lack of motivation was noticed when there
were incomplete homework assignments and a disinterest in subject matter (Cluck, 2003). In the
early grade students love to read and use a variety of ways to become familiar and interest in
reading. As you approach middle school and beyond the teaching style differs and students
disengage from wanting to read for enjoyment let alone for their assignments. Teachers are in
need to find ways to help students receive pleasure out of reading (Keeping Kids Reading, 2006;
Williams, 2004/2005). Most chapters in a book are too long, which causes students to get bored
easily (Glazer, 2005). Motivating students to engage in reading is a continual problem. The
smartest/brightest students will not engage in reading without some type of motivation.
Motivation to read had not been adequately researched as other reading aspects have been
(Metsala, 1996/1997). Students lack motivation to succeed in school. Many factors contribute to
the lack of motivation in students. Learners must learn how they are motivated, and what
motivates them (Reading Rockets, 2005). Students are not motivated to read because they don’t
see the relevance, benefits and it is not meaningful to their lives (Perrone, n.d.; Phi Delta Kappa

40
Fastbacks, 1999; Uhlir, 2003; Ozdemir, 2006). As a result of this, there are many students in
the classroom today who are not learning. These students are labeled at risk, low achievers or
unmotivated (Chapman, 1993). Students need to be further motivated to read without being told
or having it suggested (Coleman, 2005).
Some students are naturally motivated, while others expect the motivation to come
from their teachers. What is going on in the classroom, good or bad, will effect the motivation of
the students. There is no magic formula for motivating students. Many factors affect the
motivation level of students. Being self-motivated is not being taught in the classroom and
should (Davis, n.d.). Attitudes about reading and interest in reading vary. Motivational constructs
can influence reading engagement. Whether or not students like reading should effect how much
they are motivated to read. Lack of reading motivation could come from reading efficacy,
reading challenge, reading work avoidance, reading curiosity, reading involvement, the
importance of reading, competition in reading, reading recognition, reading for grades, social
reasons for reading, and reading compliance (Wigfield, 1997).
The probable causes for lack of reading motivation in elementary and middle school
students were found in the teaching methods used in the traditional classroom, the wide variety
of learning abilities, the lack of interest which leads to a lack of skill, and decreased reading
enjoyment.

41
CHAPTER 3
THE SOLUTION STRATEGY
Review of the Literature
After reviewing literature on reading motivation, the teacher researchers have determined
two major solutions. These solutions are multiple intelligences and differentiated instruction.
Multiple intelligences gives students an opportunity to tap into their dominant intelligences,
while differentiated instruction is based on providing learning opportunities at students’
individual skill levels.
Due to the abundance of literature covering multiple intelligences, the teacher researchers
have chosen to use this as their primary solution in increasing reading motivation in elementary
and middle school students. Multiple intelligences incorporate eight major intelligence areas.
These areas, as defined by pioneering educators Howard Gardner and Thomas Armstrong, are
titled: linguistic intelligence (word smart), logical-mathematical (number smart), spatial
intelligence (picture smart), bodily-kinesthetic (body smart), musical intelligence (music smart),
interpersonal intelligence (people smart), intrapersonal intelligence (self smart), and naturalist
intelligence (nature smart) (Lash, n.d.). The intelligences reflect the structure of individual
languages; the power restraints in yourself, expectations of others, cultural pressures, and
accepted norms of thinking; and work to solve a problem or make a product (Chapman, 1993).
Each person is born with all eight intelligences (Chapman, 1993) and it is therefore
recommended that teachers use a variety of ways to teach a lesson (Safi, 1996). This
recommendation is attributed to the fact that choosing how you learn has a beneficial outcome
(Cluck, 2003). All strengths and weaknesses can be separated into these eight multiple

42
intelligences. Teachers should create an inventory to help determine the mix of intelligences in
their classroom. Identifying an area of intelligence will further help teachers understand
themselves as well as others. It is essential to be aware of the reality that everyone has a unique
blend of the eight intelligences (Lash, n.d.).
Some schools have applied MI theory to their curricula and have reported success in
improving performance on achievement tests. According to Rettig (2005), there are four ways to
teach to the “whole brain”. First, immerse the children with toy and playthings that lend
themselves to the multiple intelligences. Second, incorporate the different multiple intelligences
into lesson planning. Third, introduce learning centers that focus on the multiple intelligences in
your classroom. Lastly, when using multiple intelligences spotlight the different careers which
use each intelligence (Rettig, 2005). In one study, utilizing the multiple intelligences in the
classroom led the students to better retention of knowledge (Ozdemir, 2006). In another study the
use of multiple intelligences in the classroom improved assignment completion, class
participation, and engagement of learners (Cluck, 2003). There has been increasing interest in the
role and assessment of multiple intelligences in relation to learning and achievement. Gardner’s
MI theory has created much interest in more diverse teaching strategies, balanced programming,
and matching instruction to learning styles (McMahon, 2004).
Teachers have the undaunting task of understanding, embracing, and mastering the many
facets of the multiple intelligence theory. Embrace in the contributions of multiple intelligence
teaching will allow teachers to see children in a different light. Instead of a “one size fits all”
mentality, teachers will be able to cultivate the complete child (Eisner, 2004). In a multiple
intelligence classroom, teachers continuously shift teaching styles (Stanford, 2003). They

43
respond to individual needs and remember that every child has a special ability. Educators
need to help find that special ability and design lessons to help everyone achieve their goal
(Chapman, 1993). Teachers also must make sure to tap into all of their students’ interests to
ensure engagement and persistent learning. Once teachers know their different learner profiles,
they are able to offer choices for demonstrating mastery (Corley, 2005). Teachers need to
continue to incorporate more intelligence rather than traditional verbal linguistic and logical-
mathematical (Ozdemir, 2006). Using multiple intelligences helps teachers broaden their range
of methods and techniques to reach a more diverse range of learners (Stanford, 2003).
After grasping the ideas of the Multiple Intelligence Theory, educators have the
challenging assignment of implementing appropriate strategies. These strategies are many,
endless, and lend to motivating learning. Teachers should build on the students’ interests and
curiosity (Metsala, 1996/1997). Encouraging students to write down what they are saying and
feeling at any moment helps class discussions, as well as involving the class to make
connections. This leads to students relate in and be in a part of the learning experience (Glazer,
2005). Intrapersonal learning also holds a valuable role in the reading process. Teachers should
be emphasizing reading as a technical skill as well as emotional, according to Armstrong (2004).
Teachers should be asking students to connect the text with their personal lives, their own
emotions, and memories. Armstrong proposes that phonics and blending be taught using comic
strip words that contain emotional vitality such as, thud, bonk, and scrunch. The multiple
intelligence teaching strategies can be used to increase reading achievement and reading skills.
Reading centers would be developed to use the multiple intelligences to provide student choice
and stimulate student motivation. Lesson plans will be designed around the use of multiple

44
intelligences (Uhlir, 2003). Finding something the child likes and uses helps create a form of
literacy that will help them feel successful. Keeping that in mind, teachers need to create a lesson
using familiar material they know and then help the students meet their challenges in reading and
writing. This way, every student should have the opportunity to be creative and to learn in their
own familiar way (Williams, 2004/2005; Metsala, 1996/1997). Designing lesson plans, surveys,
and checklists to measure reading skill achievement helps establish a multiple intelligence
reading center (Uhlir, 2003). More literacy experiences mean more pleasure for students in
reading and writing (Glazer, 2005).
Phi Delta Kappa Fastbacks state that poorest readers are peer oriented or bodily
kinesthetic. Allowing these children to read in pairs, or to move around while reading can be
very beneficial. For children that respond to bodily/kinesthetic learning, Armstrong suggests that
teachers use gestures to teach phonemes and have students act out the reading material (2004).
Another way to increase reading motivation is to allow the reader to choose their
material. Start by filling the classroom with high-interest books (Phi Delta Kappa Fastbacks,
1999). Finding books that display zingers within the first few words that grab the reader’s
attention, on the first couple of pages, is a motivational key for children (Coleman, 2005).
Promoting nonfiction, sports, adventure, and fantasy type books in the classroom helps give boys
the freedom to choose their own type of book (Sullivan, 2004). When the opportunity arrives,
take advantage of sporting events like the Olympics, World Series, Final Four, the Superbowl
and so on. Continue to complete the classroom library with some of these books to help grab the
students’ interests (Sullivan, 2004). The ideal reading environment for a boy is with peers,
through dancing, singing, and an activity afterwards that satisfies their need to build and create.

45
A multi sensory approach gives boys an opportunity to respond by acting out the story, writing
their own version of the story, or creating a mural. This keeps students motivated and interested
in the lesson (Sullivan, 2004).
There are a variety of ways to teach reading skills, one being to utilize nursery rhymes.
Print them for visual learners, chant them for auditory learners, and make plays for children that
are bodily kinesthetic learners. Design a tic-tac-toe game with words in each space as oppose to
the traditional X and O. Then have students read the word correctly to place an X or O in the
appropriate spot (Lombardo, 2005). Have children identify the parts of speech in a zinger,
illustrate it, or find their own way to identify the word.
Picturing words, performing calisthenics, using visuals, or singing the lesson will help the
lesson be remembered for some students (Safi, 1996). Armstrong states that in order to read we
have to “see” the words using visual spatial intelligence. The reader often needs to visualize the
word or passage to make meaning clear. Teachers can simply ask students to close their eyes and
visualize what they have just read. Reading comprehension would improve, especially for
picture-smart children (Armstrong, 2004).
Another idea is to create a beanbag game where you would write words in squares, have
the students throw a beanbag, and then have them read the word it lands on (Lombardo, 2005).
Use scented candles, plastic play food or small food samples in your centers to create a different,
yet fun environment (Lombardo, 2005).
Song, role play, posters and bookmarks are also some techniques that students enjoy
(Marcell, 2005). Armstrong also states that the act of reading is somewhat musical. Students can
learn to read through song lyrics (Armstrong, 2004). Armstrong also suggests that there be a

46
space for musical learners to read by singing or chanting while others are engaging in silent
reading.
Selecting short passages for lessons on poetry helps keep students interested (Glazer,
2005). A new reading strategy that was discovered was to have four animal puppets. Each animal
represented a reading strategy that helped the students remember clues in reading. There are also
suggestions for the newly named Naturalist. Armstrong believes that more reading should take
place outside and using nature-themed books (2004). Most of all use plenty of teacher modeling.
(Marcell, 2005).
Journals, graphic organizers, checklists, rubrics, and portfolios are a great alternative
assessment. Assessments that are beyond measuring knowledge and skills, but rather that are
measuring the use of knowledge and skills will better meet the needs of students (Stanford,
2003). Verbal praise instead of grades may build the students curiosity to learn.
It is important for educators to provide a variety of activities incorporating multiple
intelligences for students to choose from. This can help students play a role in how multiple
intelligences are used in the classroom. Students should have opportunities to take ownership and
create ideas on how they could incorporate all the intelligences into an activity or idea. Students
should also have choice when it comes to assignments. Over time, they can choose assignments
based on their strong intelligences, rather than on friends (Rubado, 2002). With that choice,
students should also have the option to work alone or in small groups, choosing from four or five
different products to create (Corley, 2005).
In another study, the results provided evidence that student learning is enhanced through
multiple intelligence instruction. These students were more involved during the instruction; they
47
gained more insights, and self efficacy (Ozdemir, 2006). According to Phi Delta Kappa
Fastbacks, students learn best when they are allowed to learn through their preferred learning
style. The article also states that accepting individuality is they key to success in reading (Phi
Delta Kappa Fastbacks, 1999).
There are countless creative ways that teachers can help motivate students to read
through the use of all eight multiple intelligences. In some cases, students wrote letters and e-
mails to authors or persons mentioned in the stories and they also wrote and performed skits
from their stories. That same article showed that 62% of 6th graders prefer teacher read-alouds.
Read-alouds motivate children to read the book again on their own time and it helps them
understand the material better. As a part of fostering Interpersonal learning Armstrong says that
students should become critical readers and begin thinking about the social meanings of the texts
they read. They should be asked to step into the shoes of the author, or a character in the story,
and take other points of view.
Logical learners can be encouraged to treat reading comprehension as a time for
hypothesis testing and logical problem solving. Students enjoy reading nonfiction because it
relates to real life situations (Meehan, 2006). Over time, students can build a portfolio system for
artifact collection of multiple intelligence activities to demonstrate their growth and show their
strengths (Uhlir, 2003).
Differentiated instruction is the solution to maximizing student learning potential while
recognizing individual differences. Through differentiated instruction, teachers plan and adjust
their lessons to meet the needs of their learners. Teachers must understand and know their
learners skill levels, strengths, challenges, interests, needs, preferences, and goals. Active
48
planning is essential in differentiated instruction while the teacher transforms into a facilitator
(Corley, 2005; Saldana, 2005). The students are then able to work individually, at their own
level. With students working hard individually, the teacher is allotted more time to work with
struggling students. Differentiated workshops prove to be beneficial and inspiring. Differentiated
instruction is a better form of teaching resulting in better students (Saldana, 2005).
The teacher strategically plans instruction that meets the learners where they are and
offers multiple avenues which students can take to access and apply their learning. One solution
to address the readiness levels of students is to have all students study the same concept, but
complete different activities based off their levels. Students also can partake in group sessions, or
one-on-one teacher or peer coaching. Teachers also must make sure to tap into all their students’
interests to ensure engagement and persistent learning. Once teachers know their different
learner profiles, they are able to offer choices for demonstrating mastery (Corley, 2005).
When more options are offered, students are more likely to complete their assigned tasks.
A key solution in differentiated instruction is flexible grouping. Students can be grouped by their
readiness, interest, or profiles and if the groups are varied, labeling will no longer occur. When
assigning final products, choices work best. Students should have the choice to work alone or in
small groups and choose from four or five products to create (Corley, 2005). As an example
using a typical writing assignment, rather than assigning everyone the same article and
assignment, students would have choices. They would choose a book or topic of interest to them
and have options as to how they could write the report. Higher level students could write a five
paragraph essay, where beginning learners could copy sentences from the book or even illustrate
pictures (Saldana, 2005). In addition to writing, teachers must foster within students that they can

49
read. Teachers should provide successful reading experiences for students. Choice should be
built into the student’s reading program (Metsala, 1996/1997). Teachers could use kids’
magazines to capitalize on children’s interest and curiosities with magazines that are at their
level (Motivating young minds, 2006).
Overall, a classroom that uses differentiated instruction challenges learners individually
by their abilities, interests, and preferred styles of learning, thus maximizing all learning
potential (Corley, 2005).
The literature has helped determine multiple intelligences as a primary solution to use as
a method to increase reading motivation. Although Differentiated Instruction offers feasible
solutions, the teacher researchers have found that Multiple Intelligences would better serve the
students. Multiple Intelligences provides a better opportunity for students to find out their
dominant intelligence and utilize it throughout their learning.
Project Objective and Processing Statements
As a result of using multiple intelligences, during the period of January 22 through May
11, 2007, the students of Teacher Researchers at Sites A and B were to increase their reading
motivation.
Processing Statements
Reading instruction was differentiated through the use of multiple intelligences. These
lessons were created prior to and during the intervention, as necessary. Self-discovery, venn
diagrams, a variety of art materials used in learning centers, frequent stretching/exercising
throughout structured classtime, thinking music during writing periods, nature walks and talks,
creative group tasks such as mobiles, and collages, a poetry unit.

50
Project Action Plan
The following were tasks that had to be accomplished during each week of the research
project.
Pre-Week: Week of January 22–January 26, 2007 • Design activities and lessons that incorporate the eight multiple intelligences. • Obtain parental consent to use students data research • Make copies of documentation tools.
Pre-Documentation Week: Week of January 29–February 2, 2007
• Administer, collect, and analyze students’ surveys. • Observe and tally student behaviors displayed in class during silent reading time.
(Twice a week) Pre-Documentation Week: Week of February 5–February 9, 2007
• Administer, collect, and analyze teachers’ surveys. • Observe and tally student behaviors displayed in class during silent reading time.
(Twice a week) Week of February 12–February 16, 2007
• Focus Intelligence: Intrapersonal Intelligence. The ability to understand your own feelings.
• Introduce the whole class to the Intrapersonal Multiple Intelligence. • Encourage self-discovery in the classroom. • Model and assign reflective journal writing. • Independently students will reflect on focused intelligence using journal log.
Week of February 19–February 23, 2007
• Focus Intelligence: Verbal/Linguistic Intelligence. The variety of using language. • Introduce the whole class to the Verbal/Linguistic Multiple Intelligence. • Model and practice using manipulatives in mathematics. • Create student-centered learning areas in the classroom. • Independently students will reflect on focused intelligence using journal log.
Week of February 26–March 2, 2007
• Focus Intelligence: Logical/Mathematical Intelligence. The ability to incorporate mathematics and reasoning.
• Introduce the whole class to the Logical/Mathematical Multiple Intelligence. • Introduce and stress the importance of Venn diagrams. • Familiarize students with several types of calculators and its possible uses. • Independently students will reflect on focused intelligence using journal log.

51
Week of March 5–March 9, 2007
• Focus Intelligence: Visual/Spatial Intelligence. The ability to see form, color, shape, and texture in your perspective.
• Introduce the whole class to the Visual/Spatial Multiple Intelligence. • Distribute the variety of art materials that can and will be used in the learning centers for
assignments. • Model cognitive organizers that can be a useful tool with vocabulary words. • Independently students will reflect on focused intelligence using journal log. Week of March 12–March 16, 2007 • Focus Intelligence: Bodily/Kinesthetic Intelligence. Incorporating movement into
lessons. • Introduce the whole class to the Bodily/Kinesthetic Multiple Intelligence. • Incorporate frequent stretching/exercising throughout structured class time. • Role play characters from stories • Independently students will reflect on focused intelligence using journal log.
Week of March 19–March 23, 2007
• Focus Intelligence: Musical/Rhythmic Intelligence. The ability to utilize one or more element of pitch, tone, or rhythm.
• Introduce the whole class to the Musical/Rhythmic Multiple Intelligence. • Create and use songs, poems, and raps for a variety of subject areas. • Incorporate “Thinking Music” during writing periods. • Independently students will reflect on focused intelligence using journal log.
Week of March 26-March 30, 2007
• Spring Break
Week of April 2–April 6, 2007 • Focus Intelligence: Naturalist Intelligence. Surrounded in one’s environment. • Introduce the whole class to the Naturalist Multiple Intelligence. • Enjoy a nature walk and talk around your school building. • Conduct a variety of science experiments. • Independently students will reflect on focused intelligence using journal log.
Week of April 9–April 13, 2007
• Focus Intelligence: Interpersonal Intelligence. The ability to understand others as individuals.
• Introduce the whole class to the Interpersonal Multiple Intelligence. • Design creative group tasks such as mobiles, collages, comic strips, and poems. • Model and practice think-pair-share activities. • Independently students will reflect on focused intelligence using journal log.

52
Week of April 16–April 20, 2007
• Introduce poetry unit with description of projects and due dates. • Incorporate all eight multiple intelligences into our poetry unit.
Week of April 23–April 27, 2007
• Introduce poetry unit with description of projects and due dates. • Incorporate all eight multiple intelligences into our poetry unit. • Allow students to choose an assessment from a list of choices that include all eight
multiple intelligences. Post-Documentation Week: Week of April 30–May 4, 2007
• Observe and tally student behaviors displayed in class during silent reading time. (twice a week)
Post-Documentation Week: Week of May 7–May 11, 2007 • Administer, collect, and analyze students’ surveys. • Observe and tally student behaviors displayed in class during silent reading time.
(twice a week)
Methods of Assessment
The first tool that the teacher researchers used for post documentation was the
observation tally sheet. The purpose of the observation tally sheet was to observe the frequency
of problem behaviors related to lack of reading motivation. The observation tally sheet was used
during four, 20 minute sessions of SSR, between the dates of April 30, 2007 and May 11, 2007.
During these sessions, teacher researchers at Sites A and B observed student behavior. Each time
a problem behavior was witnessed, the teacher researcher made a tally mark in the appropriate
column. The observation tally sheet was used to measure the amount of change in problem
behaviors related to lack of reading motivation. There was approximately 33 eighth graders and
45 sixth graders observed at Site A, and 26 second graders and 26 fourth graders observed at Site
B.

53
The second post documentation tool was the student survey. The student survey
contained nine questions designed to assess the students’ feelings towards reading. Each question
had a pictorial lichert scale in which the students circled whether they loved, liked, left, or
loathed reading. The purpose of the student survey was to help the teacher researchers gather
information on student reading habits. The student survey was used to measure the amount of
growth in participants reading motivation. The survey was administered on April 30, 2007. This
questionnaire was distributed to 32 eighth graders and 45 sixth graders at Site A. It was also
distributed to 26 second graders and 26 fourth graders at Site B.

54
CHAPTER 4
PROJECT RESULTS
The purpose of this research project was to increase reading motivation in elementary and
middle school students. The behaviors used to define this problem included movement and non-
movement behaviors. The movement behaviors that were observed are flipping through book
pages, tapping pencils, placing hands inside of desks, fidgeting, getting out of seat frequently,
complaining, doodling/drawing, and doing other work. The non-movement behaviors included
staring into space, placing head on desk, saying “I’m bored”, lack of interest, not paying
attention, wasting time, and students indecisive on book selection (Refer to Appendix A). The
interventions implemented were the use of Howard Gardner’s eight multiple intelligences. There
were 26 second graders, 25 fourth graders, 46 sixth graders and 33 eighth graders used in this
study, for a total of 133. The second and fourth grade teachers taught all general subjects and the
sixth and eighth grade teachers taught communications (reading and language arts). The research
study began on Monday, January 29, 2007 and concluded on Friday, May 11, 2007.
Historical Description of the Interventions
During weeks one and two the teacher researchers administered, collected, and analyzed
student and teacher surveys (Appendices B and C). Twice each week we observed and tallied
student behaviors displayed in class during silent reading time (Appendix A). From the
information gathered from the observation tally sheet, teacher researchers found it interesting
that there were more non-movement behaviors (n=430) demonstrated than movement behaviors
(n=293). Out of the 15 off-task behaviors, four behaviors made up 54% of the total behaviors
observed. These behaviors were staring into space, fidgeting, lack of interest, and not paying

55
attention. The student and teacher surveys provided positive insight in that we were more
aware of our student’s reading interest and we learned of the variety of strategies that other
teachers currently use. Conversely, the teacher survey showed that there was not an equal
distribution of intelligences being used in the classrooms. Therefore, students that were dominant
in a non-traditional intelligence were not getting the chance to reach their fullest potential.
During week three, the focus intelligence was intrapersonal, which is the ability to
understand your own feelings. We introduced self-discovery and reflective journal writing. Self-
discovery activities included self directed and critical thinking centers, i.e. puzzles and projects.
Journal writing included prompts and free writing. Table 13 below displays the positive,
negative, and interesting information observed during week three.
Table 13
Pluses (+) Minuses (-) Interesting (?)
Self-Discovery *Students learned at their own pace. *Students were able to see their progress.
*Students gave up easily when faced with something difficult. *Students struggled to think outside the box.
*Middle school girls put more effort into self-discovery.
Journal Writing *Early elementary students enjoyed journal writing. *Allowed students to be more creative.
*Some students did not like writing. *Some students struggled with free writing.
*Middle school girls enjoyed free writing more than boys.
During week four, the focus intelligence was verbal/linguistic, which is described as the
variety of using language. During this week we introduced manipulatives in mathematics as well
as creating students centered learning areas. Table 14 below displays the positive, negative, and
interesting information observed during week four.

56
Table 14
Pluses (+) Minuses (-) Interesting (?)
Manipulatives *Helped those students in need.
*Some students played with them instead of using them appropriately.
Student-Centered
Learning Areas
*Students enjoyed making their own choices. *We enjoyed seeing the students’ progress.
*Students lacked prior knowledge. *Difficult for some students to work independently.
During week five, the focus intelligence was logical/mathematical, which is the ability to
incorporate mathematics and reasoning. We introduced and stressed the importance of venn
diagrams and familiarized students with several types of calculators and its possible uses. Table
15 below displays the positive, negative, and interesting information observed during week five.
Table 15
Pluses (+) Minuses (-) Interesting (?)
Using Calculators *Students enjoyed using calculators. *Students were intrigued how numbers turned into words.
*Some students did not know how to properly use calculators. *Sometimes it was difficult to read/decode the words.
*Early elementary students thought that using calculators was cheating.
Venn Diagrams *Helps students list and organize better. *Opened some students’ eyes to differences.
*Students had done venn diagrams before. *Venn diagrams were not very effective in large groups.
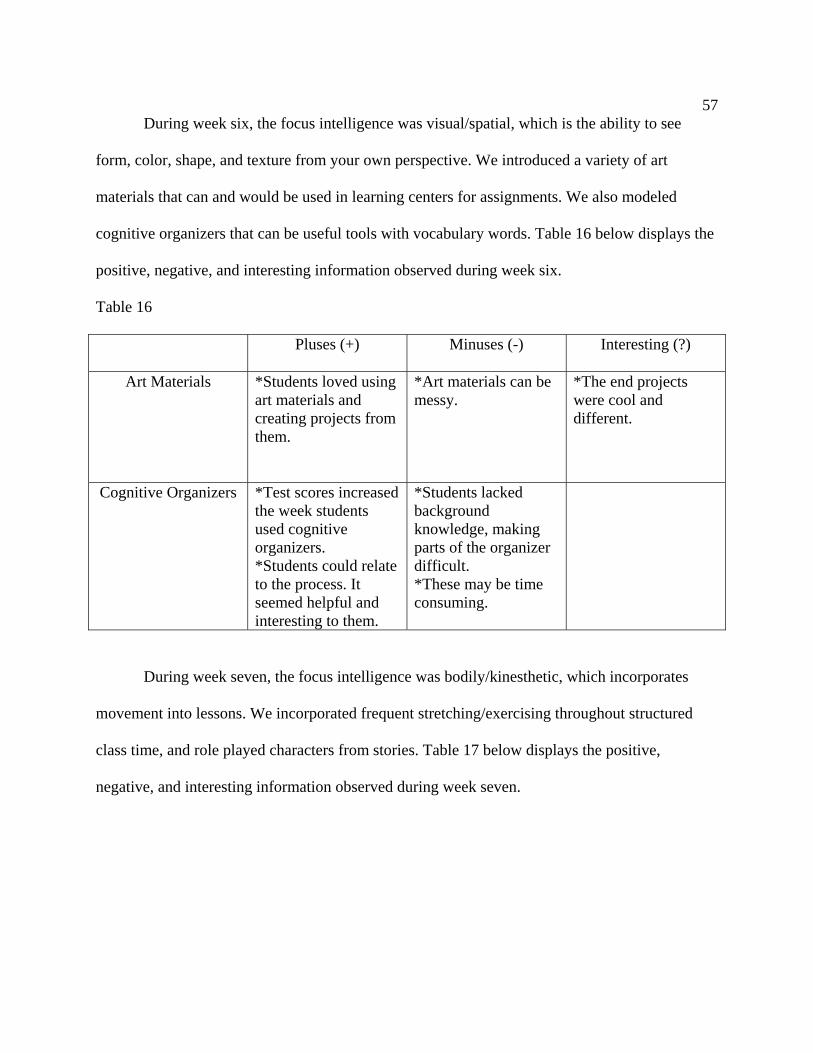
57
During week six, the focus intelligence was visual/spatial, which is the ability to see
form, color, shape, and texture from your own perspective. We introduced a variety of art
materials that can and would be used in learning centers for assignments. We also modeled
cognitive organizers that can be useful tools with vocabulary words. Table 16 below displays the
positive, negative, and interesting information observed during week six.
Table 16
Pluses (+) Minuses (-) Interesting (?)
Art Materials *Students loved using art materials and creating projects from them.
*Art materials can be messy.
*The end projects were cool and different.
Cognitive Organizers *Test scores increased the week students used cognitive organizers. *Students could relate to the process. It seemed helpful and interesting to them.
*Students lacked background knowledge, making parts of the organizer difficult. *These may be time consuming.
During week seven, the focus intelligence was bodily/kinesthetic, which incorporates
movement into lessons. We incorporated frequent stretching/exercising throughout structured
class time, and role played characters from stories. Table 17 below displays the positive,
negative, and interesting information observed during week seven.

58
Table 17
Pluses (+) Minuses (-) Interesting (?)
Stretching/Exercising *Students were less fidgety when given frequent exercise.
*The stretching was distracting for some students. *Difficult to transition back to work.
Role-playing *Students were attentive and engaged. *Role-play helped comprehension.
*Some middle school students were afraid or embarrassed to perform. *Some students lacked expression
*It was surprising that some quieter students used expression and had loud voices.
During week eight, the focus intelligence was musical/rhythmic, which is the ability to
utilize one or more elements of pitch, tone, or rhythm. We created and used songs, poems, and
raps for a variety of content and academic areas, and incorporated “thinking music” during
writing periods. Table 18 below displays the positive, negative, and interesting information
observed during week eight.
Table 18
Pluses (+) Minuses (-) Interesting (?)
Thinking Music *Helps creativity. *Relaxed students. *Set a volume and mood.
*Distracted some students. *Some students became disruptive during certain music styles.
*We believed that the music worked for most children.
Create songs, raps,
and poems
*Students had an opportunity to show their creative side.
*Some students wrote stories without anything interesting.

59
During week nine, the focus intelligence was naturalistic, which is surrounding one in
their environment. We enjoyed a nature walk and talk, as well as conducted a variety of science
experiments. Table 19 below displays the positive, negative, and interesting information
observed during week nine.
Table 19
Pluses (+) Minuses (-) Interesting (?)
Nature walk and talk *Students were engaged and on task during assignments.
*Inclimate weather and too many outdoor distractions.
*The middle school students could not handle being outside as well as the elementary students could, possibly due to recess.
Science experiments *More parental involvement. *Impressive end results. *Students were engaged and enthusiastic in these hands on activities.
*Students did not understand the different between an experiment and a demonstration. *Required a lot of work and materials.
During week 10, the focus intelligence was interpersonal, which is the ability to
understand other as individuals. We designed creative group tasks such as mobiles, collages,
comic strips, and poems, and also modeled and practiced think-pair-share activities. Table 20
below displays the positive, negative, and interesting information observed during week 10.

60
Table 20
Pluses (+) Minuses (-) Interesting (?)
Mobiles/Collages *Hands on and creative.
*Time consuming, messy, and required a lot of outside materials.
Think-pair-share *Student assessment increased within small group interactions. *Great social skill activity.
*Middle school students lacked social skills. *Students need practice in groups.
During weeks 11 and 12, we introduced poetry units that incorporated all eight multiple
intelligences. In week 12, we allowed students to choose an assessment from a list of choices that
included all eight multiple intelligences. Table 21 below displays the positive, negative, and
interesting information observed during weeks 11 and 12.
Table 21
Pluses (+) Minuses (-) Interesting (?)
Poetry Unit *Brought out individual creativity. *Helped students with rhyming and literary elements. *Students were dedicated and took ownership. *Students could pick and choose what poems they wanted to do. *Students put their thoughts and feelings into their poems.
*Students struggled with Concrete and Abstract Poem. *Students had difficulty following directions and patterns. *Students lacked prior knowledge. *Students lacked poetry reading.
*The end results were fantastic.
61
During weeks 13 and 14, twice each week we observed and tallied students behaviors
displayed in class during silent reading time. In week fourteen, we also administered, collected,
and analyzed students’ surveys.
One pattern that we noticed was that students who did not ordinarily excel in reading had
opportunities to shine when incorporating different intelligences other than traditional reading
styles. In addition to that, we found that when students were given more choices and able to
engage in a variety of hands on activities, they were more motivated, creative, dedicated, and
enthusiastic. This yielded a more creative product that students took pride and ownership of their
work. Through this research, we expected that students would find intelligences that they were
more successful with and that they would also progress and show positive growth in those
intelligences they were previous lacking.
We chose to use the theory of multiple intelligences as the intervention increase reading
motivation in elementary and middle school students. Multiple intelligences incorporate eight
major intelligence areas. These areas, as defined by pioneering educators Howard Gardner and
Thomas Armstrong (Lash, n.d.), are titled: linguistic intelligence (word smart), logical-
mathematical (number smart), spatial intelligence (picture smart), bodily-kinesthetic (body
smart), musical intelligence (music smart), interpersonal intelligence (people smart),
intrapersonal intelligence (self smart), and naturalist intelligence (nature smart). The following
table displays each intelligence and provides an example activity.
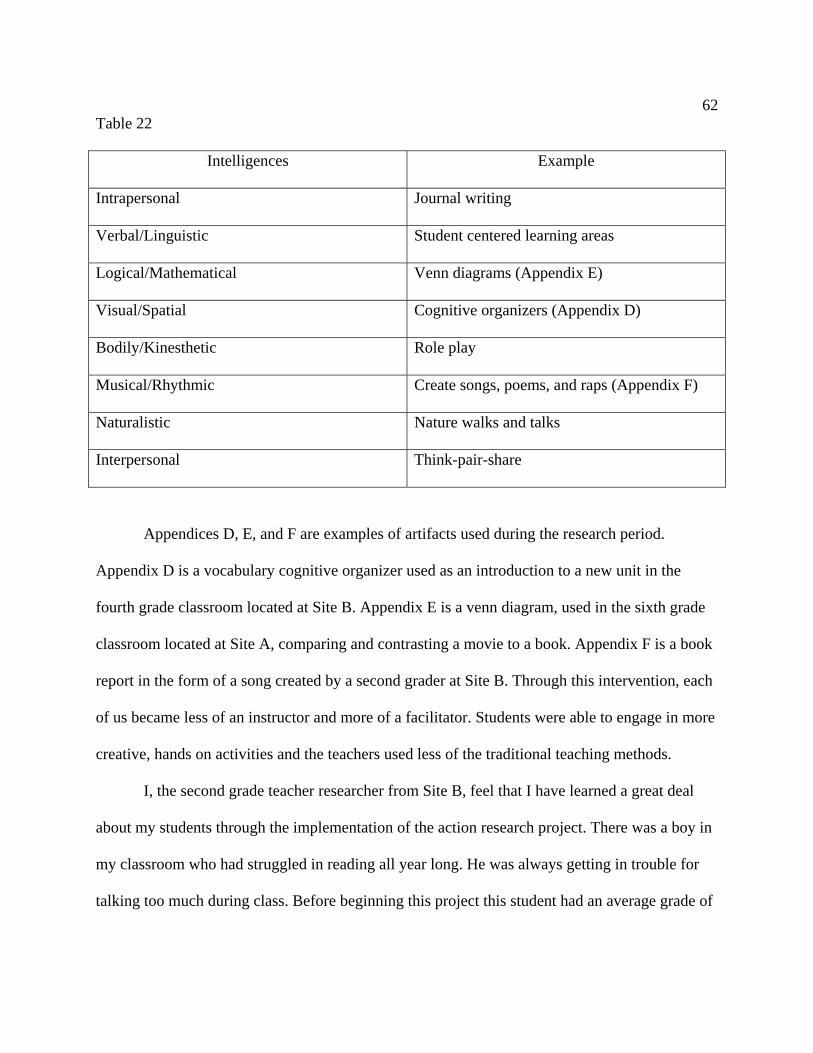
62
Table 22
Intelligences Example
Intrapersonal Journal writing
Verbal/Linguistic Student centered learning areas
Logical/Mathematical Venn diagrams (Appendix E)
Visual/Spatial Cognitive organizers (Appendix D)
Bodily/Kinesthetic Role play
Musical/Rhythmic Create songs, poems, and raps (Appendix F)
Naturalistic Nature walks and talks
Interpersonal Think-pair-share
Appendices D, E, and F are examples of artifacts used during the research period.
Appendix D is a vocabulary cognitive organizer used as an introduction to a new unit in the
fourth grade classroom located at Site B. Appendix E is a venn diagram, used in the sixth grade
classroom located at Site A, comparing and contrasting a movie to a book. Appendix F is a book
report in the form of a song created by a second grader at Site B. Through this intervention, each
of us became less of an instructor and more of a facilitator. Students were able to engage in more
creative, hands on activities and the teachers used less of the traditional teaching methods.
I, the second grade teacher researcher from Site B, feel that I have learned a great deal
about my students through the implementation of the action research project. There was a boy in
my classroom who had struggled in reading all year long. He was always getting in trouble for
talking too much during class. Before beginning this project this student had an average grade of
63
a 69% on class reading assessments. At the end of the project his average on class reading
assessments had increased to an astonishing 85%. When I stopped to analyze the data, the score
of 100% on the week eight assessment jumped out at me. After looking back at our project
action plan, the light bulb suddenly turned on. Week eight was the week that we introduced the
interpersonal intelligence (people smart). The majority of reading activities that week were done
in pairs or small groups. This child turned out to be from a close family with two other siblings
less than a year apart from him. He thrived on cooperative learning and being able to talk things
out with his peers. Through the implementation of this project, I have seen the effect of
motivating my students by making personal connections to their lives. I was able to take into
consideration the different learning styles of my students. I believe that I am more tuned into my
student’s body language and behaviors. I have also learned the benefits of greater preparation
with more time devoted to planning activities that include the different intelligences and take into
account student’s prior knowledge. The end result being increased motivation, which ultimately
leads to increased achievement.
I, the fourth grade teacher researcher from Site B, was very interested to see how engaged
most of my students were throughout this experience. Their responses on the student
questionnaire were much better, and during silent reading their behaviors decreased across the
board. I found myself revising a lot of my lesson plans to incorporate all eight multiple
intelligences after we finished our research. I began to reevaluate my teaching style and started to
utilize what I learned from the research and the data. I noticed my students were more involved,
ready for instruction, more engaged during the lessons, and had a positive attitude during group
activities. On a personal level, I am glad I was part of this experience. I now find myself making

64
sure I do my best to cover all eight intelligences throughout my daily curriculum to best fit the
needs of all of my students. I understand that all students have different abilities and learning
styles, and that they may need a variety of different instruction through the use of the eight
multiple intelligences. I plan to continue to change my curriculum to fit the needs of my students
to my best ability.
I, the 6th grade teacher researcher at Site A, have learned from this project that students
do not learn in the same way. I cannot rely on a single, universal multiple intelligence to educate
all my students. I have come to realize that if my students are to be successful, I will have to
implement all the multiple intelligences into my teaching. This realization has taught me to be a
more tolerant educator. In the past, I have always been a “traditional” teacher in that I tend to
lecture. I taught this way because that was the way I grew up and learned best. Implementing
these multiple intelligence interventions into my classroom allowed me to capture students who
had blank, cold stares on their faces. I saw my students come alive when given a lesson where
they could perform, create, or invent. This process took some time because my students have
also been rooted in “traditional” education, but eventually my students came to enjoy this
process and looked forward to working with the different intelligences. As a teacher, I realized
the importance of implementing the multiple intelligences into my lessons. I stopped
complaining about the extra time it took and began to see what else I could use in my lessons. I
will not go back to being just a “traditional” teacher. I will make it my goal to incorporate
several multiple intelligences into each of my lessons, so that I can touch as many of my students
as possible. I do not want to leave any child behind.

65
I, the 8th grade teacher researcher at Site A, have learned valuable information on the
various strengths and weaknesses of my students. Through the study of multiple intelligences it
became apparent that my students learn material in a variety of ways. A typical reading/language
arts class lends itself to learning through verbal/linguistic strategies; however, it turned out that
the majority of my students strengths dominated in the bodily/kinesthetic, musical/rhythmic, and
interpersonal intelligences. Therefore, in order to reach and teach them effectively, I had to
stretch myself creatively and focus on the best strategies to fit their needs. Through this process,
I was forced to take a look at what I had done in the past, what I was currently doing, and how I
could improve for the future. Although it may be more difficult or time consuming to teach to the
multiple intelligences, it proves to be beneficial in the long run. Not only are the students gaining
motivation and enjoying learning, I found my most creative lessons to be entertaining for me as
well. I was actually excited to create and teach the lessons I planned because I was proud of them
and felt that I was finally teaching in a way that my students preferred. Now that I have
completed this action research project, I plan to implement it in years to come. Knowing the
intelligence strengths of my students from the beginning will help me plan the year effectively.
Overall, I think the process of this research project had a positive effect on the students and
myself. Highlighting an intelligence each week was a great way to introduce them to the
students, engage in a variety of new activities, and recognize those students that excelled in that
area. Some intelligences were more popular than others, but overall it was a nice way to change
from the traditional teaching methods.

66
Presentation and Analysis of Results
In order to assess the impact of the interventions, we administered an observation tally
sheet (Appendix A) during SSR to record the frequency of behaviors, and a student survey
designed to assess the feelings students have towards reading. The purpose of this research
project was to increase reading motivation in elementary and middle school students. There were
26 second graders, 25 fourth graders, 46 sixth graders and 33 eighth graders used in this study,
for a total of 133. The second and fourth grade teachers taught all general subjects and the sixth
and eighth grade teachers taught communications (reading and language arts). The three tools
used to document the problem evidence included reading observation tally sheet (Appendix A), a
student survey (Appendix B), and a teacher survey (Appendix C). These tools were used within a
two week time frame beginning Monday, January 29, 2007 and concluding on Friday, February
9, 2007.
There was a total of 452 behaviors observed, the data has been divided based upon
movement and is represented between Figure 20 and Figure 21. Of 452 observed behaviors, 213
were non-movement behaviors and the remaining 239 involved movement. Though the
behaviors are separated between the figures, percentage calculations are based upon the total of
452. Overall, there was a 50% decrease in non-movement behaviors from pre-documentation to
post-documentation. Out of the 15 listed behaviors, the four most prevalent behaviors from pre-
documentation markedly decreased during post-documentation. Staring into space during pre-
documentation (n=119) decreased 58% during post-documentation (n=50). Fidgeting during pre-
documentation (n-113) decreased 36% during post-documentation (n=72). Lack of interest
during pre-documentation (n=81) decreased 48% during post-documentation (n=42). Not paying

67
attention during pre-documentation (n=82) decreased 35% during post-documentation (n=53).
Three out of these four most prevalent behaviors are non-movement behaviors.
Each behavior displayed in Figure 20 showed an overall decrease in occurrences. The
most noteworthy change occurred with students placing their head on their desk (n=70 pre-
documentation; n=15 post-documentation).
119
82 8170
57
21
0
50 5342
15
43
3 00
20
40
60
80
100
120
140
Staring Not PayingAttention
Lack Interest Head onDesk
WastingTime
Indecisive Bored
Behaviors
Freq
uenc
y of
Occ
uren
ce
PrePost
Figure 20: Silent Reading Behaviors: Non-Movement (n=213)
Figure 21 shows that all of the movement behaviors decreased from pre-documentation to
post-documentation with the exception of complaining (n=14 pre-documentation; n=20 post-
documentation) and tapping pencils (n=4 pre-documentation; n=24 post-documentation).
Although, tapping pencils increased by 600%, teacher researchers are more tolerant of this due to
the information researched on multiple intelligences.

68
113
66
44
25 20 14 7 4
7259
2615 20 20
3
24
0
20
40
60
80
100
120
Fidgetin
g
Flippin
g page
s
Doing ot
her w
ork
Hands i
n desk
Out of
seat
Complainin
g
Doodlin
g
Tapping
penc
il
Behaviors
Freq
uenc
y of
Occ
uren
ce
PrePost
Figure 21: Silent Reading Behaviors: Movement (n=239)
Student Survey
The purpose of the student survey was to help the teacher researchers gather information
on student reading habits. The survey was given on Thursday, February 1, 2007. This
questionnaire was distributed to 33 eighth graders, 46 sixth graders, 25 fourth graders, and 26
second graders for a total of 133. All participating students completed the survey given to them
by the teacher researchers. The survey included nine questions created to determine students’
feelings towards reading (Appendix B). Students were asked to circle the facial expression that
best described the way they felt. The expressions were labeled love it, like it, leave it, or loathe
it. In each graph, the love it and like it data was grouped together and the leave it and loathe it
data was grouped due to the importance of the meaning.
As seen in Figures 22 and 23, there was a 4% decrease in students loving or liking
reading during free-time, and a 10% increase in students leaving or loathing reading during free-
time.

69
10%
41%30%
19%
Love it Like it Leave it Loathe it
Figure 22: Reading During Free-Time (Pre-Documentation) (n=105)
10%
39%
31%
20%
Love it Like it Leave it Loathe it
Figure 23: Reading During Free-Time (Post-Documentation) (n=108)
Figures 24 and 25 demonstrate a 33% increase in students liking or loving to read for fun
at home. There was a 13% decrease in those that did not enjoy reading for fun at home.

70
11%
23%
38%
28%
Love it Like it Leave it Loathe it
Figure 24: Reading for Fun at Home (Pre-Documentation) (n=105)
11%
33%
27%
29%
Love it Like it Leave it Loathe it
Figure 25: Reading for Fun at Home (Post-Documentation) (n=108)
Figures 26 and 27 show a 23% decrease in those that love or like reading instead of
playing, and a 10% increase in those that would leave or loathe reading instead of playing.

71
5%
16%
23%
56%
Love it Like it Leave it Loathe it
Figure 26: Reading Instead of Playing (Pre-Documentation) (n=105)
5%11%
23%
61%
Love it Like it Leave it Loathe it
Figure 27: Reading Instead of Playing (Post-Documentation) (n=108)
There was a 4% increase in students that enjoy reading a variety of books displayed in
Figures 28 and 29. There was no change in those that would not enjoy reading a variety of books.

72
29%
41%
22%
8%
Love it Like it Leave it Loathe it
Figure 28: Reading a Variety of Books (Pre-Documentation) (n=105)
25%
46%
19%
10%
Love it Like it Leave it Loathe it
Figure 29: Reading a Variety of Books (Post-Documentation) (n=108)
Figures 30 and 31 showed a 6% increase in the number of students who felt comfortable
with how well they read, whereas there was a 10% decrease in students who felt uncomfortable
with how well they read.

73
29%
52%
14%
5%
Love it Like it Leave it Loathe it
Figure 30: How Well Students Feel They Read (Pre-Documentation) (n=105)
35%
48%
12%5%
Love it Like it Leave it Loathe it
Figure 31: How Well Students Feel They Read (Post-Documentation) (n=108)
Figures 32 and 33 show a 5% increase in students who enjoyed teacher read-alouds and a
5% decrease in those who did not enjoy when their teacher reads aloud to them.

74
44%
37%
14%
5%
Love it Like it Leave it Loathe it
Figure 32: Teacher Read-Alouds (Pre-Documentation) (n=105)
42%
40%
6%
12%
Love it Like it Leave it Loathe it
Figure 33: Teacher Read-Alouds (Post-Documentation) (n=108)
Figures 34 and 35 showed a 10% increase in students who felt comfortable when coming
to a new word in reading and a 4% decrease in those students who do not feel comfortable.

75
16%
34%33%
17%
Love it Like it Leave it Loathe it
Figure 34: New Words in Reading (Pre-Documentation) (n=105)
12%
41%31%
16%
Love it Like it Leave it Loathe it
Figure 35: New Words in Reading (Post-Documentation) (n=108)
Figures 36 and 37 display a 25% increase in students who enjoyed it when someone at
home read to them. On the other hand, there was a 13% decrease in those that did not enjoy
being read to at home.

76
20%
22%
27%
31%
Love it Like it Leave it Loathe it
Figure 36: Someone at Home Reads Aloud (Pre-Documentation) (n=105)
21%
30%19%
30%
Love it Like it Leave it Loathe it
Figure 37: Someone at Home Reads Aloud (Post-Documentation) (n=108)
Figures 38 and 39 show a 23% increase in students who enjoyed visiting a library,
whereas there was a 36% decrease in those that did not enjoy visiting a library.
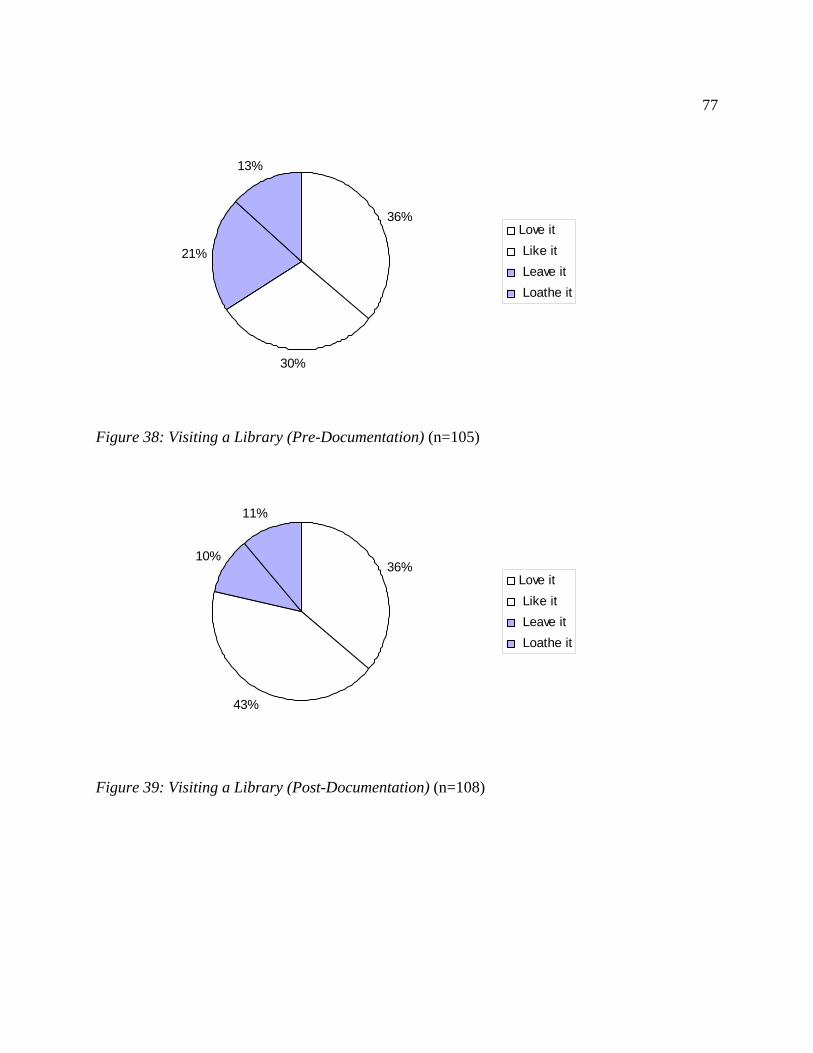
77
36%
30%
21%
13%
Love it Like it Leave it Loathe it
Figure 38: Visiting a Library (Pre-Documentation) (n=105)
36%
43%
10%
11%
Love it Like it Leave it Loathe it
Figure 39: Visiting a Library (Post-Documentation) (n=108)

78
Conclusions and Recommendations
After the analysis of pre-documentation and post-documentation data from the
observation tally sheet, we have observed and interpreted some notable changes. One major
change was the 50% decrease in non-movement behaviors (n=430, pre-documentation; n=213,
post-documentation) and the 18% decrease in movement behaviors (n=293, pre-documentation;
n=239, post-documentation). Now that the students have learned about the eight multiple
intelligences, they have become more skilled in selecting the type of book that suits their
intelligence. The students have developed the ability to choose activities and texts that suit their
dominant intelligence, therefore becoming more engaged in silent reading. Due to the vast
literature review we conducted on multiple intelligences, we feel that our increased
understanding of our students’ individual needs contributed to only a slight decrease in the
movement behaviors. We have become more tolerable of the need for students to engage in
movement during SSR.
There have also been some important changes shown through the analysis of the student
survey. First, we noticed that their feelings about how well they read (refer to Figures 30 and 31)
and how comfortable they feel when coming to a new word positively increased (refer to Figures
34 and 35). We feel that this is important because it helps literacy, fluency, and shows a growth
in their confidence. Another positive result is that students are no longer associating reading as a
school activity, but they are able to enjoy reading as a recreational activity at home (refer to
Figures 24, 25, 36, and 37). The survey also showed that students are now more willing and
enthusiastic about visiting a library (refer to Figure 38 and Figure 39) and choosing books that
appeal to their dominant intelligence.

79
In some instances, there was no recognizable change. For example, in the observation
tally sheet, students getting out of their seat frequently remained at 20 overall instances
throughout the pre-documentation and post-documentation (refer to Figure 21). Two other
behaviors that had a slight decrease was flipping through pages and doodling (refer to Figure 21).
Now that the research is concluded, we have decided to continue this intervention
strategy. Incorporating all eight multiple intelligences in the classroom will help students receive
a variety of instructional methods to best suit all of their abilities. Multiple intelligences can be
beneficial to all students as traditional classroom methods no longer serve the needs of our
diverse students. We realize that some students will need modifications, and one major
accommodation will be made in student assessment. In addition to creating lessons based on the
students’ individual intelligences, we will also create individualized self-assessments around
students’ intelligence strengths. Another modification would be to change some of the listed
behaviors on the observation tally sheet. We feel that some of the listed behaviors were difficult
to observe and some were very similar and could be compiled. There were also some questions
on the student survey that could be modified to better assess the interests and needs of our
students. Some of the questions were rather elementary so the 8th grade students mocked them,
therefore not providing proper assessment. Some of the elementary students liked the pictorial
representation of the lichert scale and circled based on that rather than the actual question.
Modifications may be adjusted per grade level. Overall, throughout this action research project
we learned about our students and the additional needs and modifications they individually
require.

80
REFERENCES
American FactFinder, (n.d.). U.S. census bureau: Economic characteristics, Retrieved June 28, 2006, from http://factfinder.census.gov/servlet/SAFFFacts?_event= Search&geo_id=&_ geoContext=&_street=&_county=Waukegan&_cityTown= Waukegan&_state=04000US17&_zip=&_lang=en&_sse=on&pctxt=fph&pgsl=010.
American FactFinder, (n.d.). U.S. census bureau: General characteristics, Retrieved
June 28, 2006, from http://factfinder.census.gov/servlet/SAFFFacts?_event= Search&geo_id=&_ geoContext=&_street=&_county=Waukegan&_cityTown= Waukegan&_state=04000US17&_zip=&_lang=en&_sse=on&pctxt=fph&pgsl=010.
Armstrong, T. (2004). Making the words roar. Educational Leadership, 78-81. Brenner, C. (2006, June 20). Cops: No surprises in gang report. The NewsSun. Retrieved
June 28, 2006, from http://www.suburbanchicagonews.com/newssun/top/5_1_WA20_ GANGREPORTREACT_S1.htm.
Chapman, C. (1993). If the shoe fits...How to develop multiple intelligences in the classroom. Glenview, Illinois: Pearson Professional Development. City-Data.com, (n.d.). Retrieved June 28, 2006, from http://www.city-data.com/. Cluck, M. & Hess, D. (2003). Improving student motivation through the use of the multiple intelligences. Illinois: Saint Xavier University. (ERIC Document Reproduction Service No. ED479864) Coleman, J. (2005). Ready, Set, Motivate. Library Media Connection, 30-32. Corley, M. A. (2005). Differentiated instruction: Adjusting to the needs of all learners. Focus on Basics, 7(C), 13-16. Crime in Illinois (2004), Illinois state police, Retrieved June 28, 2006 from
http://www.isp,state,il,us/crime/cii2004.cfm. Davis, B. (n.d.). Motivating students. Tools for Teaching, (1999). Retrieved November
19, 2006, from http://honolulu.edu/intranet/committees/FacDevCom/guidebk/Teachtip/motiv.htm.
Eisner, E.W. (2004). Multiple intelligences: Its tensions and possibilities. Teachers College Record, 106(1), 31-39. Glazer, S. M. (April 2005) The key is poetry. Teaching K-8, 80-81.

81
IASA Publications (2001), School referenda: 71 % pass, 29 % fail. Retrieved June 28, 2006 from http://www.iasaedu.org/publications/ref22701.htm.
Improving K-8 reading using multiple intelligences. Phi Delta Kappa Fastbacks (1999), 448, 7-
33. Kuersten, J. (n.d.). Are middle and high school students reading to learn or learning to
read? Retrieved November 19, 2006, from http://www.pta.org/archive_article_details 1118072738531.html.
Lash, M. D. (n.d.) Multiple intelligences and the search for creative teaching. Paths of Learning, 13-15. Lombardo, M. (2005). Rhythmic reading and role playing. Library Media Connection, 38-39. Marcell, B. (2005). What’s your strategy? Teaching K-8, 52-53. Martin, M. (2002, Fall). Envisioning a new lakefront. The Kiosk, (3)1. McMahon, S. D., & Rose, D. S. (2004). Multiple intelligences and reading achievement: An examination of the Teele Inventory and Multiple Intelligences. The Journal of Experimental Education, 73(1), 41(12). Meehan, J. (2006). Generating excitement for reading in the middle grades: Start with non-
fiction read-alouds! Illinois Reading Council Journal, 34(4), 13-16.
Metsala, J. L., & McCann, A. D. (1996/1997). Children’s motivations in reading. Reading Teacher, 50(4), 360-362. Motivating young minds. American Educator (2006), 34-37.
Motivation: The key to academic success. Reading Rockets, (2005). Retrieved November 19, 2006, from http://www.readingrockets.org/articles/5730?theme=print. MSNBC.com (2006, June 20). Report: Chicago gangs stronger, richer. Retrieved June 28, 2006
from http://www.msnbc.msn.com/id/13427318/.
National Center for Education Statistics. (2003). The Condition of Education 2003. Retrieved April 21, 2007 from http://nces.ed.gov.
Özdemir, P., Güneysu, S., & Tekkaya, C. (2006). Enhancing learning through multiple intelligences. Journal of Biological Education, 40(2), 74-78.
82
Perrone, S. (n.d.). Understanding the middle school reader. Retrieved November 19, 2006, from http://www.ed.psu.edu/Englishpds/inquiry/projects/PERRONE.htm. Rettig, M. (2005). Using the multiple intelligences to enhance instruction for young
children and young children with disabilities. Early Childhood Education Journal, 32(4), 255-259.
Rubado, K. (2002). Empowering students through multiple intelligences. Reclaiming Children and Youth, 10(4), 233(3). Safi, A.M. (1996). Ditch the dictionary: Finding a vocabulary comfort zone. Vocabulary, reading, and multiple intelligences in an English as a second language classroom. Rhode Island: Johnson and Whales University. (ERIC Document Reproduction Service No. ED394293)
Saldana, C. (2005). Differentiating instruction for a multilevel class. Focus on Basics, 7(C), 17-18. Stanford, P. (2003). Multiple intelligence for every classroom. Intervention in School and Clinic, 39(2), 80-85. Sullivan, M. (2004). Why Johnny won’t read. School Library Journal, 36-39.
Uhlir, P. (2003). Improving student academic reading achievement through the use of multiple
intelligence teaching strategies (Report No. CS 512 365). Chicago, IL: Saint Xavier University. (ERIC Document Reproduction Service No. ED 479 914)
Unknown Author. (2006). Keeping kid reading. New study shows drop after age 8, but parents help. Waukegan Community Unit District 60 (2006). Mission statement. Retrieved June 28, 2006 from
http://www.waukeganschools.org/district/mission. Waukegan Community Unit District 60 (2006). Schools. Retrieved June 28, 2006 from
http://www.waukeganschools.org/district/mission. Wells, L. (2006). Blog it: An innovative way to improve literacy. Reading Today, 40. Wigfield, A. (1997). Reading motivation: A domain-specific approach to motivation. Educational Psychologist, 32(2), 59-68. Williams, B. T. ( 2004/2005). Are we having fun yet? Students, social class and the pleasures of literacy. Journal of Adolescent & Adult Literacy, 48(4), 338-342.

1
APPENDICES

83
Appendix A: Observation Tally Sheet
Observation Tally Sheet
(The teacher will observe their students during a 15-minute period of
silent reading. They will be looking for behaviors that indicate a lack of motivation to read. The teacher will make a tally each time a listed
behavior is seen.)
Behavior
Frequency of Occurrence
Flipping through pages
Tapping/beating pencil
Staring into space
Placing hands inside of desk
Fidgeting
Placing head on desk
Saying “I’m bored”
Getting out of seat frequently
Lack of interest
Complaining
Doodling/drawing
Not paying attention
Doing other work
Wasting time
Indecisive on book selection
Total # of tally marks: ______
Date: __________

84
Appendix B: Student Survey

85

86
Appendix C: Teacher Survey
*Teacher Survey* Please answer the following questions based on your experiences in the last three academic years. 1. Circle the behaviors you have seen students display in your classroom
during instruction, reading, and/or discussion time. *placing head on desk *Lack of Interest *saying, AI=m bored.@ *getting out of seat frequently *placing hands in desk *tapping/beating pencils *staring into space *indecisive on book selection
*wasting time *doodling/drawing *working on other work *Flipping through book pages *fidgeting *not paying attention *complaining *following words, yet not understanding
2. Circle the strategies that you have USED in your classroom.
*student-centered learning *cooperative learning *using manipulatives *playing background music *journaling *self-discovery
*venn-diagrams *using calculators *variety of art material *cognitive organizers *role-playing/simulations *frequent stretching/exercising *science experiments *use of nature walks and talks *Creative group tasks such as mobiles, collages, comic strips, songs & poems
*Creating and using songs, raps, cheers, jingles, and poems 3. From the strategies you have circled above, which strategies have worked in your classroom? Please write them below.
______________ ______________ _____________ ______________ ______________ ______________ _____________ ______________
Additional Comments: (you may use the back if necessary)

87
Appendix D: Venn Diagram

88
Appendix E: Graphic Organizer

89
Appendix F: Intrapersonal Activity

90