Embed Size (px)
Citation preview

Increasing Schoolwide College Readiness through AVID
AVID data andimplications for school reform
Tucson, Arizona
Dr. Brandon Protas & NJ Utter

Session Overview
o Research Findings: the AVID Impact
o Data for Programmatic Decisions
o Data to Generate Support
o Research Findings: Fidelity & Exportability
o Schoolwide College Going Culture

Where to celebrate?

Context:
Sense of Urgency
“…access to a postsecondary education is not equal in America. Students historically underrepresented at the postsecondary level- students of color, those from low-income backgrounds, and first-generation students – are still less likely to prepare for, apply for, enroll in, and persist through postsecondary education.”
Swail, Cabrera, & Lee, 2004
First-generation students take rigorous coursework at rates that are less than half of their peers. They are less likely to take college entrance exams and when they do, they score lower than their peers: 15% of students with parents who graduated from college score in the lowest quartiles on SAT and ACT compared to 40% for first-generation college students.
Warburton, Bugarin, & Nunez, 2001
Degree completion is most influenced by academic resources of the high school student, followed by college entrance test scores and then class rank/GPA.
Adelman, 1999 &2006
Huber, Huidor, Malagón, Sánchez, & Solórzano, 2006

Context:Sunnyside Unified School District
• Implemented AVID in 2006 -2007 in all five middle schools and two traditional high schools
• Urban district in Pima County, AZ with approximately 18,000 students
• Demographics: 88% Hispanic, 6% White, 4% Native American, 2% African American, 1% Asian
• Free and reduced-price meals: 84%
• District graduation rate: 64.1% (2008) to 71.8% (2012)
• College-going rate (2 and 4 year): 54% (2010)
• Four-year university matriculation rate: 12% (2007)

Research Findings:
the AVID Impact
This study will determine the impact of the AVID program on Sunnyside Unified School District middle and high school students’ preparation for college readiness as measured by:
Scores on AIMS standardized exams for reading and math Grades in core subjects of English and math Grade Point Average

Research Findings:
the AVID Impact
Apollo MS Challenger MS
Chaparral MS Billy Lane Lauffer MS
Sierra MS Desert View HS
Sunnyside HS Total1.0
1.5
2.0
2.5
3.0
3.5
4.0
AIMS Reading Levels non-AVID AVID
Trend levelSignificant level
Middle School High School Total1.0
1.5
2.0
2.5
3.0
3.5
4.0
AIMS Reading Levels non-AVID AVID

Research Findings:
the AVID Impact
Trend levelSignificant level
Apollo MS Challenger MS
Chaparral MS Billy Lane Lauffer MS
Sierra MS Desert View HS
Sunnyside HS Total1.0
1.5
2.0
2.5
3.0
3.5
4.0
AIMS Math Levels non-AVID AVID
Middle School High School Total1.0
1.5
2.0
2.5
3.0
3.5
4.0
AIMS Math Levels non-AVID AVID

Research Findings:
the AVID Impact
Trend levelSignificant level
Apollo MS Challenger MS
Chaparral MS Billy Lane Lauffer MS
Sierra MS Desert View HS
Sunnyside HS Total1.0
1.5
2.0
2.5
3.0
3.5
4.0
English Grades non-AVID AVID
Middle School High School Total1.0
1.5
2.0
2.5
3.0
3.5
4.0
English Grades non-AVID AVID

Research Findings:
the AVID Impact
Trend levelSignificant level
Apollo MS Challenger MS
Chaparral MS Billy Lane Lauffer MS
Sierra MS Desert View HS
Sunnyside HS Total1.0
1.5
2.0
2.5
3.0
3.5
4.0
Math Grades non-AVID AVID
Middle School High School Total1.0
1.5
2.0
2.5
3.0
3.5
4.0
Math Grades non-AVID AVID

Research Findings:
the AVID Impact
Trend levelSignificant level
Apollo MS Challenger MS
Chaparral MS Billy Lane Lauffer MS
Sierra MS Desert View HS
Sunnyside HS Total1.0
1.5
2.0
2.5
3.0
3.5
4.0
Grade Point Average non-AVID AVID
Middle School High School Total1.0
1.5
2.0
2.5
3.0
3.5
4.0
Grade Point Average non-AVID AVID

Research Findings:
the AVID Impact
AIMS Reading
Level
AIMS Math Level
English Grade
Math Grade
Grade Point
AveragePearson Correlation AIMS
Reading Level
1 .469 .265 .114 .411Sig. (2-tailed) .000 .000 .029 .000N 374 374 370 369 374Pearson Correlation AIMS
Math Level
.469 1 .411 .307 .547Sig. (2-tailed) .000 .000 .000 .000N 374 374 370 369 374Pearson Correlation
English Grade
.265 .411 1 .412 .555Sig. (2-tailed) .000 .000 .000 .000N 370 370 370 365 370Pearson Correlation
Math Grade
.114 .307 .412 1 .501Sig. (2-tailed) .029 .000 .000 .000N 369 369 365 369 369Pearson Correlation Grade
Point Average
.411 .547 .555 .501 1Sig. (2-tailed) .000 .000 .000 .000 N 374 374 370 369 374
low to moderate measure of agreement
Correlation of Academic Measures

Data:
Programmatic Decisions
Students who take AP courses and exams are
much more likely than their peers to complete a
bachelor’s degree in four years or
less.Source: Camara, Wayne. (2003).
College Persistence, Graduation, and Remediation. College Board Research Notes (RN-19). New York, NY: College
Board.
0
10
20
30
40
50
60
70
29
45
61
Two+ AP
One AP
No AP
AP & College Success
Data:
Programmatic Decisions
2006-2007 2008-2009 2010-2011 2011-2012
Am. Indian/ Alaska Native 2 9 13 16
Asian American 11 9 21 24
Black or African American 0 6 2 14
Hispanic/Latino 48 100 262 267
White 7 10 30 31
Other 2 6 10 12
Total 70 140 338 417
Total Number of AP Exams TakenDesert View High School

AP Calculus
AP Language
AP Literature
AP Economics
AP Government
Desert View
5/26(31*)
17/95(119)
1/55(62)
10/53(64)
7/61(64)
Sunnyside 0/5(14)
14/20(26)
0/18(26)
0/0(0)
0/29(52)
*(Number of students enrolled in the class)
2012 Passing AP Scores (3, 4 or 5)
Data:
Programmatic Decisions

• AVID Summer Institute• AP Summer Institute• AP Teacher Summit• AVID Critical Reading for AP Teachers• Honors Program to AP Program• AP Summer Bridge Program• Adding a 10th Grade AP Option
Data:
Programmatic Decisions

Data:
Programmatic Decisions
28
58
2234
40
57 61
45 47
81
64
104
68
35
57
0
20
40
60
80
100
120
Apollo Lauffer Challenger Chaparral Sierra
8th Grade Algebra Enrollment
2007-2008
2009-2010
2012-2013

Data:
Generating Support
83
149186
211
0
50
100
150
200
250
2006-07 2007-08 2008-09 2009-10
Number of Trained AVID Teachers
good

46
76
53
2733
0 0
106112 113
59
30
80
99
116106 105
79
28
15
132139
125114
79
39
24
0
20
40
60
80
100
120
140
6th 7th 8th 9th 10th 11th 12th
2006-2007
2007-2008
2008-2009
2009-2010
Data:
Generating Support good
Number of students enrolled in the AVID elective
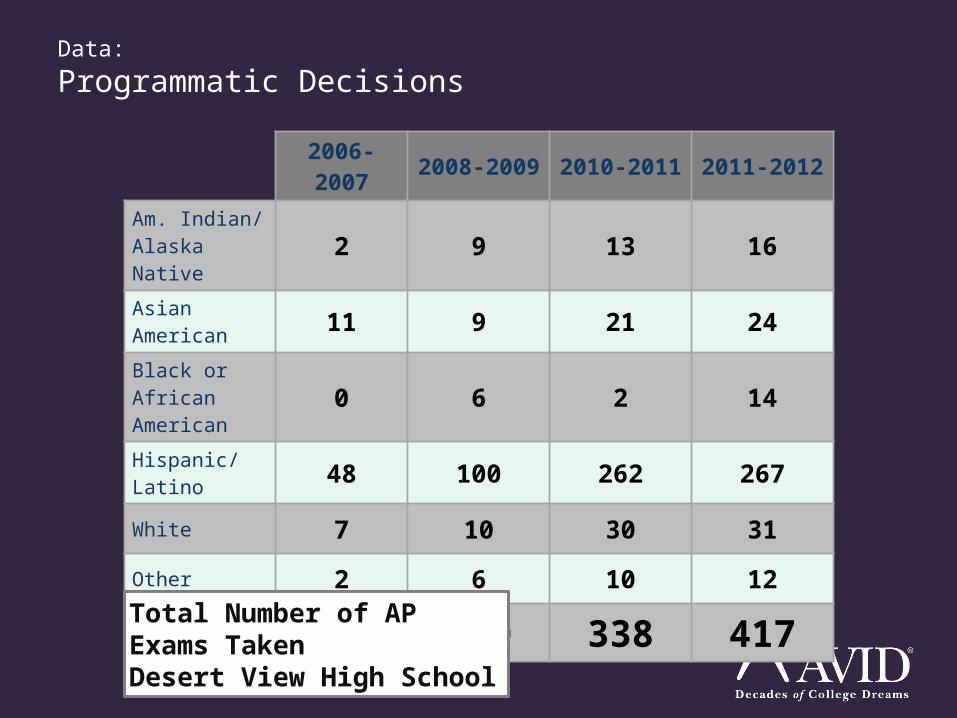
Summary report on AP
• The number of AP Courses has offered has doubled from 4 to 8 in the last four years
• There has been significant increase in the number of AP Exams taken from 70 exams in 2006-2007 compared to an all-time high of 418 exams in 2012, a growth of
500% in the past five years.
• In May of 2011, 189 students took 338 AP exams which was an increase of over 79% in students participating in the last four years
Data:
Generating Support better

36
7482
72
89
111
35
60
73 68
8493
32
56 59 55
7280
2030
47 4456 55
0
20
40
60
80
100
120
Applications
Completed
Admitted
Attending
Data:
Generating Support best

Desert View Sunnyside Total0
50
100
150
200
250
37
64
101
70
98
168
137
109
246
200820102012
best
Students admissible to a four year school
Data:
Generating Support

Data:
Generating Support
9.0%
15.7%
12.4%
17.4% 17.6% 17.5%18.2% 17.9% 18.1%
0.0%
5.0%
10.0%
15.0%
20.0%
Desert View Sunnyside SUSD District
200720102011
4-Year College Enrollment
best

Affective:
Generating Support best
AVID Video

Research Findings:
Fidelity and Exportability
The study will determine the relationship between the program implementation of AVID and the degree to
which a school is “AVIDized“
….meaning that the knowledge, appreciation and incorporation of AVID strategies extend beyond AVID
trained teachers and are adopted by non-AVID teachers in non-AVID classes.

Research Findings:
Fidelity and Exportability
Certification Self Study ResultsSchool Ess
1Ess2
Ess3
Ess4
Ess5
Ess6
Ess7
Ess8
Ess9
Ess10
Ess11 Total
Apollo MS 2 2 2 1 2 2 2 2 2 2 1 20Challenger MS 3 1 3 1 3 2 2 3 2 2 1 23Chaparral MS 3 3 2 3 3 3 3 1 3 2 2 28Billy Lane Lauffer MS 3 1 3 2 2 2 1 1 3 1 1 20Sierra MS 1 1 1 1 1 2 1 1 1 1 1 12Desert View HS 3 2 3 2 2 2 2 2 2 2 1 23Sunnyside HS 2 2 3 2 2 2 2 2 1 2 2 22
Fidelity

Research Findings:
Fidelity and Exportability
AVID Exportability
Survey
• I understand the goals and mission of the AVID Program.
• The AVID Program is a valuable asset to our school.
• The AVID Program is a regular topic at faculty meetings.
• I see a positive difference between AVID and non-AVID students in their academic classroom skills.
• I can recognize AVID students without knowing that they are in the AVID Program.
• I am aware of specific AVID academic methodologies used by students.
• I have participated in professional development activities on AVID strategies this year.
• I utilize AVID teaching strategies in my classroom.

Research Findings:
Fidelity and Exportability
Apollo MS Challenger MS
Chaparral MS
Billy Lane Lauffer MS
Sierra MS Desert View HS
Sunnyside HS
Total20
22
24
26
28
30
32
34
36
AVID Teacher Survey Total not AVID trained AVID trained
Exportability

Research Findings:
Fidelity and Exportability
AVID Teacher Survey & CSS Correlation
Mean Teacher Survey
ScoreMean CSS
Score
Pearson Correlation Mean Teacher Survey Score
1 -.176
Sig. (2-tailed) .706N 7 7
Pearson Correlation Mean CSS Score
-.176 1
Sig. (2-tailed) .706 N 7 7
reasonable measure of agreement

Schoolwide College Going Culture
Social & Cultural Capital
The Challenge:
How to expand a college going culture beyond AVID to maximize its impact.

Schoolwide College Going Culture
Social & Cultural Capital
A story of two twins
AVID scholarship
growth
Creating culture of college
Public celebrations
of college
The power of exposure

Schoolwide College Going Culture
Social & Cultural Capital
A story of two twins

Class of 2012$800,000
AVID Seniors$500,000
non-AVID$300,000
Schoolwide College Going Culture
Social & Cultural Capital
AVID scholarship
growth

Schoolwide College Going Culture
Social & Cultural Capital
Creating culture of college

Schoolwide College Going Culture
Social & Cultural Capital
Public celebrations
of college

Schoolwide College Going Culture
Social & Cultural Capital
The power of exposure

Schoolwide College Going Culture
AVID Strategies for All
Schoolwide organizational
strategies
Schoolwide college testing
FAFSA campaign
for all
Socratic seminar
strategies
Tutorials acrossschools

Schoolwide College Going Culture
AVID Integration
AVID elective for
college credit
AVID - CTE combo
AVID with
advisory
AVIDschoolwide
PD
AVID at all staff
meetings
Non-AVID teacher
recognition

Summary
Research:AVID works!
Use Data:Programmatically
Use Data:Generate Support
Take AVID schoolwide

Increasing Schoolwide College Readiness through AVID
AVID data andimplications for school reform
Tucson, Arizona
Dr. Brandon Protas
NJ Utter
http://www.susd12.org/AVID