Embed Size (px)
Citation preview

1
Increasing the mass accuracy of high-resolution LC-
MS data using background ions – a case study on the
LTQ-Orbitrap Richard A. Scheltema1, Anas Kamleh2, David Wildridge3, Charles Ebikeme3, David G. Watson2, Michael
P. Barrett3, Ritsert C. Jansen1 & Rainer Breitling*1
1. Groningen Bioinformatics Centre, Groningen Biomolecular Sciences and Biotechnology Institute,
University of Groningen, kerklaan 30, 9751 NN Haren, The Netherlands
2. Strathclyde Institute for Pharmacy and Biomedical Sciences, University of Strathclyde, Glasgow G4
0NR.
3. Institute of Biomedical and Life Sciences, Division of Infection and Immunity, Glasgow Biomedical
Research Centre, University of Glasgow, Glasgow G12 8TA.
* Corresponding author
Dr. Rainer Breitling
Kerklaan 30
9751 NN, Haren
The Netherlands
Tel: +31 50 363 8088
Fax: +31 50 363 7976
E mail: [email protected]
Abbreviations:
PPM Parts-per-million MMA Mass Measurement Accuracy
Keywords: high resolution, alignment and internal mass calibration, mass spectrometry, metabolomics,
software

2
With the advent of a new generation of high resolution mass spectrometers, the
fields of proteomics and metabolomics have gained powerful new tools. In this paper
we demonstrate a novel computational method that improves the mass accuracy of
the LTQ-Orbitrap mass spectrometer from an initial ±1–2 parts per million (ppm),
obtained by the standard software, to an absolute median of 0.21 ppm (standard
deviation 0.21 ppm). With the increased mass accuracy it becomes much easier to
match mass chromatograms in replicates and different sample types, even if
compounds are detected at very low intensities. The proposed method exploits the
ubiquitous presence of background ions in liquid chromatography mass
spectrometry profiles for accurate alignment and internal mass calibration, making
it applicable for all types of mass spectrometry equipment. The accuracy of this
approach will facilitate many downstream systems biology applications, including
mass-based molecule identification, ab initio metabolic network reconstruction, and
untargeted metabolomics in general.

3
In this paper we propose a pragmatic method for post-acquisition mass alignment and
internal mass calibration, achieving ultra-high mass measurement accuracy (MMA) of
high mass resolution liquid chromatography mass spectrometry (LC-MS) data.
Measurements in the lower mass region of 50–400 atomic mass units (amu) were
underperforming in our data, but this can be corrected with our method, leading to an
improvement of MMA that will be instrumental for mass-based metabolite
identification[1-7]. The subsequent mass chromatogram matching exploits the high
MMA for the robust retrieval of mass chromatograms, even when the shape of the mass
chromatogram cannot be defined reliably, as happens when the intensity is close to the
noise level. This approach is based on the fact that noise is not likely to occur at the same
location repeatedly in multiple profiles. Moreover, as the proposed method is
independent of mass range, it is equally suitable for metabolomics and proteomics
applications, with some restrictions as discussed below. In our method, the ubiquitous
presence of background ions in LC-MS profiles is exploited for the definition of
alignment and internal mass calibration functions, achieving an improvement of at least
one order of magnitude compared to the original accuracy. Although background ions
represent a major problem in traditional mass spectrometry (masking compounds of
interest), in this paper we demonstrate that they are useful in high-resolution
measurements. The resolving power of the machine easily separates the background ions
from most other compounds, and they can be utilized as free internal lock masses. We
focus our discussion on data from the recently introduced LTQ-Orbitrap [3, 8-15], which
has been reported to achieve an MMA of below 1 ppm in proteomics experiments under
optimized conditions [8, 13-17]. Routine operation, however, generally yields lower
performance.
The proposed method (outlined in Figure 1) starts with the selection of a suitable
reference LC-MS profile to which masses of the other profiles will be aligned.
Background ions in the reference are detected and identified based on their precise
median mass using a list of commonly occurring background ions (see Supplementary
Tables 1 and 2 online). This identification can be automated, although some manual
intervention is recommended to prevent misidentifications (for example by removing
outliers) and to extrapolate the mass range to areas not covered by identified background

4
ions. Using the difference between the observed and known masses of positively
identified background ions allows calculation of an internal mass calibration function.
Subsequently, all LC-MS profiles are automatically mass aligned with the reference by
using the detected background ions as landmarks, and the calibration function is applied.
Finally, mass chromatograms are detected and quantified across LC-MS profiles,
exploiting the accuracy of the aligned and calibrated masses. Additional mass accuracy is
attained by taking the intensity of mass measurements into account (see Supplementary
Figure 2 online).
MATERIALS AND METHODS Dataset
Data were acquired with a ZIC-HILIC HPLC (5 µm 150 × 4.6 mm acquired from
HiChrom, Reading U.K.) coupled to an LTQ-Orbitrap (Thermo Fisher Scientific) in both
positive and negative ionization centroid mode (for more information on the setup of the
equipment see [18]). The data was exported to a human readable text format with the File
Convertor tool (“Destination data type: Text Files (*.txt)“) supplied with Xcalibur 2.0.5
(Thermo Scientific). Each file is a complete tab-delimited description of the data from the
profile and approximately 50 MB in size, containing around 460,000 separate mass
measurements in 800 scans (approximately 3 sec per scan). Approximately 3,000 high-
quality mass chromatograms (potential metabolites) were found in each LC-MS profile.
Around 100 background ions were detected in each of the LC-MS profiles (background
ion detection settings: precision 2 ppm, present in at least 18% of scans). The detected
background ions typically cover a mass range of 60 – 750 amu, and 12 background ions
could be molecularly identified in a typical sample (using the list of common background
ions supplied in Supplementary Table 1 and 2 online).
Culture and extraction
Trypanosoma brucei procyclic form (PCF) strain 427 were cultivated in SDM79 [19] and
an SDM derived medium (SDM80), supplemented with either 10 mM glucose or 10 mM
proline [20], at 28 °C in an atmospheric incubator. SDM79 was supplemented with 10%
(v/v) heat-inactivated FCS (for SDM80, FCS was dialysed against 0.15 M NaCl with a

5
molecular mass cut-off of 10,000 Da). Initially, cells were grown in SDM79, before
being transferred to the glucose and proline enhanced SDM80 media. Cultures were
maintained in 150 cm2 cell culture flasks (CORNING®) to a maximum volume of 150 ml,
where they reached typical densities of between 1x10⁶ cells per ml (mid-log phase) and
1x10⁷ cells per ml (late-log phase). Prior to metabolite extraction, approximate cells
numbers (cell density) were determined using an improved Neubauer hemocytometer
(Weber Scientific). The flasks were pooled and cells were pelleted at 1,250 RCF at 4°C
for 10 minutes, re-suspended in 1 ml of serum free medium, and kept on ice whilst an
accurate cell density was determined as previously described. The volume was adjusted
to a final concentration of 1x10⁹ cells/ml, and the cells were incubated at 28°C for 30
minutes to allow them to recover from centrifugation and for ‘normal’ metabolism to
continue.
Total metabolites were extracted by adding 200 μl of concentrated cells at 1x10⁹
cells/ml to 800 μl of 80% Ethanol/20 mM HEPES at 80 °C for 2 minutes. Cells were
separated from the serum-free medium by centrifuging at 900 RCF at 4°C for 5 minutes.
The supernatant (approximately 200 μl), containing the extracellular metabolites, was
removed and metabolites were extracted for 2 minutes in 80% Ethanol/20 mM HEPES at
80°C. The cell pellet, containing intracellular metabolites, was re-suspended for 2
minutes in 80% Ethanol/20 mM HEPES at 80°C. Additionally, metabolites in 200 μl of
serum free medium (SDM80 + glucose, or SDM80 + proline) were extracted for 2
minutes in 80% Ethanol/20 mM HEPES at 80 °C. Samples were then chilled on ice for 5
minutes, vortexed briefly, and the supernatant was recovered by centrifugation at 16,000
RCF at 4°C for 2 minutes. The recovered supernatant was flash frozen in liquid nitrogen
and then stored at -80°C for further analysis.
Targeted reference selection
This procedure makes up step (0) of the procedure described in Figure 1. For the
alignment and internal mass calibration procedures, the most ‘central’ profile is
automatically selected as reference, which minimizes the amount of correction necessary
for the other profiles with the alignment procedure. The central profile is defined as the
one which on average takes the most central place for the identified background ion in

6
Figure 2b. This central profile is automatically identified by matching similar
background ions of all profiles with the procedure described in the paragraph Mass
alignment (including background ions with unknown molecular formula). The median
mass of each background ion across profiles is calculated and the mean deviation from
the median values is obtained for each profile. The profile with the smallest deviation is
selected as the reference.
Detecting background ions
This procedure makes up step (1) and (2) of the procedure described in Figure 1. After
collecting all the centroid peaks across scans in a single list and ordering this list on mass,
near-ubiquitous compounds are found with a sliding window search. Ubiquity is defined
by a threshold on the minimum fraction of scans in which a mass is detected within an
m/z window of specified precision in ppm (see Supplementary Figure 1 online for an
example of a detected background ion). No constraint is placed on the spread of the
centroid peaks across all scans for a detected background ion. As a result, the algorithm
occasionally picks up local stretches of signals which are spread across many scans, but
are not background ions in the strict sense (e.g. precipitating compounds). This does not
cause problems, as signals labeled as background ions are not removed from the profile
and the shorter artifacts can still provide useful information for the automatic alignment
procedure. In Figure 4b, all detected background ions are shown (using a sliding window
of 3 ppm and a ubiquity threshold of 18% of the scans). Almost all background ions were
detected with this sensitive setting, while leaving the mass chromatograms intact. 18%
equals 144 of 800 scans in our experiments, where a single intense mass chromatogram
spans about 30 scans. To improve the subsequent alignment, more stringent settings
should be applied. This reduces the number of detected background ions, improving the
robustness of the matching procedure employed here. The background ions are however
not removed in our method, because they can overlap with compounds of interest. Where
background ions overlap in mass with other sample-derived compounds, the sample-
derived compounds can still be detected by using the intensity of the matching
background ion as their local baseline.

7
Internal mass alignment with background ions
This procedure makes up step (3) of the procedure described in Figure 1. As an
automatic precursor to the internal mass calibration we introduce a mass alignment
method, which uses background ions of an LC-MS profile as its landmarks. Each
background ion in the reference is matched to the closest mass in the profile to be aligned
toward the reference, within a certain mass window. Additional filters, based on the
number of individual mass measurements and the scan where the background ion starts to
be detected, reduce spurious matches and make the technique more robust. The mass
difference between matched pairs of background ions is a descriptor of the misalignment
between the two profiles. As background ions are found in a large portion of the mass
range, they give a complete description of the misalignment. An appropriate function can
be fitted to the differences between the matched pairs and describes the transformation
needed to align the two profiles. For the dataset used for this paper a linear
transformation was performing well for the mass alignment; however more complex
functions can also be used with this method.
Internal mass calibration with identified background ions
This procedure makes up step (4) of the procedure described in Figure 1. Because a
background ion is, by definition, present almost ubiquitously in a large number of scans,
its mass is measured many times in a single LC-MS profile. Taking the median of all
observations yields a very precise mass estimate. To calibrate a profile, this observed
mass needs to be compared to the expected accurate mass. For the identification of
detected background ions we have compiled a comprehensive list of frequently occurring
background ions [21-23] (see Supplementary Tables 1 and 2 online). Their accurate
mono-isotopic mass was calculated using the most up-to-date atomic weight information
available [24]. The match between detected and commonly occurring background ions
was made using an initial window of ±20 ppm. The list of matches can be validated by
making MS/MS identifications or by exploiting the isotope patterns, which are available
for highly abundant background ions (where each isotopomer is itself a background ion).
We identified low-molecular weight polymers (polyethylene glycol, polypropylene
glycol), solvent derivatives (acetonitrile adducts), and phthalate plasticizers from the

8
laboratory equipment as prominent background ions in this dataset. By fitting a function
to the found biases, a calibration function is calculated. This function is used to calibrate
the masses in all profiles after alignment.
The list of common background ions for the negative ionization mode is much
shorter than that for the positive ionization mode (see Supplementary Tables 1 and 2
online). This can make identification of suitable ions for calibration more difficult for
negative ionization mode data. This is likely to change, once targeted effort is put into
identifying additional common background ions, as the number of detected (but still
unidentified) background ions is just as high for the negative as for the positive ionization
mode. For the time being, however, the iterative calibration strategy discussed below
could be used instead.
The calculated mass calibration function is used across all scans and for all
intensities. Based on the detected background ions we have found no compelling
evidence of a short-term mass drift across scans in our dataset. The supplied example of a
background ion (see Supplementary Figure 1 online) clearly shows a horizontal pattern
on the M/Z axis, indicating there is no substantial drift. In order to adapt the method to
deal with a drift in M/Z across scans, a linear model can be fitted to the detected
background ions and the mass information per scan used to correct for scan drift after
calculation of the mass calibration function. Additionally, for the LTQ Orbitrap there is
an intensity dependency of mass accuracy [13]; however, after internal mass calibration
as described here this dependency is taken into account by calculation of a weighted
mean mass for each chromatogram (see [14] and below).
Mass chromatogram detection
This procedure makes up step (5) of the procedure described in Figure 1. The relevant
information of an LC-MS profile consists of mass chromatograms, which correspond to
single molecules eluting from the LC across multiple scans. Due to properties of the LC,
the mass chromatograms have approximately a log-normal distribution when intensity is
plotted vs. retention time (see Supplementary Figure 2 online). Due to the high mass
precision of the LTQ-Orbitrap the following simple procedure can be employed for the
detection of mass chromatograms: local maxima are selected (most intense centroid

9
peaks) and additional signals are included from adjacent scans along the retention time
dimension, which show the same mass with high precision [14]. To crudely resolve
overlapping peaks, which are relatively rare in high-resolution data, a running mean
smoothing and a local minima detection method is applied: mass chromatograms are
broken up when the intensity of the local minimum lies below the baseline for the
detected mass chromatogram. In order to obtain the most accurate mass a weighted mean
is calculated, which takes the intensity of a centroid mass as an indicator of precision.
Low intensity masses display a greater deviation from the correct mass than highly
intense masses (see Supplementary Figure 2 online).
Mass chromatogram matching
This procedure makes up step (6) of the procedure described in Figure 1. After aligning
and calibrating the individual LC-MS profiles, a robust method can be applied for
matching corresponding mass chromatograms in different LC-MS profiles. With such an
approach, replicates can be combined to achieve an even higher MMA and metabolite
peak intensities in different sample types can be compared. Our algorithm starts out with
the most intense, unprocessed mass chromatogram of all LC-MS profiles and retrieves
the best match (based on the mass, intensity, and retention time) for that mass
chromatogram from each of the other profiles. The matched mass chromatograms are
collected and the procedure is repeated until all mass chromatograms have been matched.
This iterative approach yields reliable results even for low-intensity signals, due to the
mass alignment across samples.
Retention time alignment
For the retention time alignment profiles were shifted by a constant amount so as to
maximize the Pearson correlation coefficient between the total ion chromatograms. More
sophisticated warping was not required as no complex retention time drift was observed.
RESULTS Mass accuracy of the detected background ions

10
Tandem MS on two blank samples confirmed the identity of several of the detected
background ions. In Figure 2a the fragmentation pattern is shown of a background ion
detected at m/z=144.9811, putatively identified as acetonitrile (2M+Cu)+, caused by the
mobile phase (traces of Cu+ are likely to be derived from brass fittings in the laboratory
equipment). The molecule is partly fragmented into masses of m/z=103.9548 and
m/z=62.9293, corresponding to (M+Cu)+ and Cu+, confirming the identification.
In Figure 2b the mass bias is shown for molecularly identified background ions
found in all the available samples. The dots forming vertical clusters in this figure
correspond to the same background ion identified in different samples. A clear general
trend is observed: small molecules show a larger deviation from their expected mass than
the heavier molecules. This deviation approaches 2 ppm in this particular dataset. A
systematic mass shift between the samples is also evident, which also is in the range of 2
ppm for each ion background. This indicates a drift in mass precision even within this
small batch of 24 samples.
In Figure 2c the mass bias is shown for the identified background ions after
alignment with the selected reference. The alignment function is derived from matching
non-identified detected background ions between samples, making it independent of the
identifications. The spread of the masses for each identified background ion is markedly
reduced from 1.69 ppm (standard deviation 0.30 ppm) to 0.57 ppm (standard deviation
0.26 ppm).
The MMA for the same molecules after calibrating the aligned spectra using the
function indicated is improved to an absolute median of 0.11 ppm, much lower than
results reported previously for this type of equipment [9, 12-14]. The use of ubiquitous
background ions yields particularly precise mass estimates, hence this value indicates the
maximum precision that is currently possible using this instrumentation.
Mass accuracy of biomolecules in the samples
To further explore the achieved MMA, independently of the background ions, we
examined common amino acids, which are abundantly present in our cultured
trypanosome samples. In Table 1 we show that all 20 common amino acids are detected
using a mass window of ±30 ppm. The absolute median mass accuracy is an astonishing

11
0.18 ppm (standard deviation 0.10 ppm). We also extended the analysis to a larger set of
1142 common biochemicals taken from the KEGG database, which are potentially
present in our samples. We detected 94 (8%) of them in a mass window of 10 ppm in a
calibrated profile, and the MMA remains well within 0.4 ppm, with a absolute median
accuracy of 0.21 ppm (standard deviation 0.21 ppm).
Results of mass chromatogram matching
The excellent MMA, resulting from the described background-based calibration, also
facilitates mass chromatogram picking and matching across samples. For example, in the
dataset used for this paper two different sample types are compared: trypanosomes grown
in either glucose- or proline-enriched medium. These samples should show well-defined
differences in abundance for a set of compounds in central carbon and energy
metabolism. In Figure 3a and 3b the mass chromatogram comparisons are shown for
glucose and proline, after matching based on calibrated mass and retention time. It is
clear that both compounds are differentially abundant and that the direction of the
difference matches expectations (i.e., the proline samples contain more proline than the
glucose samples). In Figure 3c it is furthermore shown that the high MMA allows even
very low intensity peaks to be robustly found and compared. A peak found in all
replicates, within a very narrow mass and time window, can be considered to correspond
to a real compound. In Figure 3d/e the global metabolic difference profile of glucose-
and proline grown samples is shown. Two observations are important here: (1) most
metabolites are not differentially abundant (black circles), indicating that the samples are
correctly aligned. (2) On the other hand, the specific differentially abundant compounds
are highly informative about the respective metabolic pathways operative in these two
sample types. Almost all of the identified metabolites are linked to the two alternative
pathways of energy production used by glucose- or proline-grown cells [20].
DISCUSSION In LC-MS experiments, retention time alignment is a well-researched topic [25], while
alignment and internal mass calibration on the mass dimension are still largely
unexplored, although efforts in this field are currently starting [26]. The dataset used for

12
this paper clearly indicated the need for alignment and internal mass calibration, even
though good practices (such as use of internal calibration masses) were applied. For
larger datasets, acquired over a longer period, the variation will be even greater. We have
shown that the MMA of LC-MS data generated with the LTQ-Orbitrap can be radically
improved by applying a calibration function calculated from information provided by the
detected background ions. The near-ubiquity of these background ions in all scans
provides a large number of measurements allowing for very precise mass estimations and
robust landmarks for aligning and calibrating multiple LC-MS profiles. In order to make
full use of this method, the list of commonly occurring background ions can be extended
with compounds specific for a laboratory, resulting in an extension of the well-calibrated
mass range. In addition, iterative calibration based on identified mass chromatograms
will further improve the results. This is particularly relevant for proteomics data:
background ions, and in particular identified background ions for calibration, become
rarer in the higher mass range. This limitation can be overcome by intentionally adding
calibrants (e.g. series of high-molecular weight polymers), but is most suitably addressed
by using reliably identified peptides for iterative recalibration. The resulting accuracy
translates into improved alignment and quantification across spectra, and reproducibly
reaches a level that will be suitable for mass-based metabolite identification [5, 6, 27] and
metabolic network reconstruction [1, 2, 4].

13
ACKNOWLEDGEMENTS The authors would like to thank Matthias Mann, Morris Swertz, Martijn Dijkstra, Frans
Stellaard and Andries Bruins for many discussions on mass spectrometry and related
topics. This work was funded by the NWO-VICI (RAS) and BBSRC (MPB).
AUTHOR CONTRIBUTIONS R.B. conceived and supervised the study. R.A.S., R.C.J. and R.B. designed, implemented
and statistically evaluated the method. M.P.B., C.E. and D.W. provided the trypanosome
and serum samples. D.G.W. and M.H.K. performed the LTQ-Orbitrap measurements.
R.A.S. and R.B. wrote the manuscript.
COMPETING INTERESTS STATEMENT The authors declare no competing financial interests.

14
REFERENCES [1] Breitling, R., Pitt, A. R., Barrett, M. P., Trends in biotechnology 2006, 24, 543-548. [2] Breitling, R., Ritchie, S., Goodenowe, D., Stewart, M. L., Barrett, M. P., Metabolomics 2006, 2, 155-164. [3] Breitling, R., Vitkup, D., Barrett, M. P., Nat Rev Microbiol 2007. [4] Jourdan, F., Breitling, R., Barrett, M. P., Gilbert, D., Bioinformatics 2007. [5] Kind, T., Fiehn, O., BMC bioinformatics 2006, 7, 234. [6] Kind, T., Fiehn, O., BMC bioinformatics 2007, 8, 105. [7] Lu, W., Bennett, B. D., Rabinowitz, J. D., J Chromatogr B Analyt Technol Biomed Life Sci 2008. [8] Dunn, W. B., Broadhurst, D., Brown, M., Baker, P. N., et al., Journal of Chromatography B 2008, In press. [9] Erickson, B., Analytical chemistry 2006, 78, 2089. [10] Hu, Q., Noll, R. J., Li, H., Makarov, A., et al., J Mass Spectrom 2005, 40, 430-443. [11] Makarov, A., Analytical chemistry 2000, 72, 1156-1162. [12] Makarov, A., Denisov, E., Kholomeev, A., Balschun, W., et al., Analytical chemistry 2006, 78, 2113-2120. [13] Makarov, A., Denisov, E., Lange, O., Horning, S., Journal of the American Society for Mass Spectrometry 2006, 17, 977-982. [14] Olsen, J. V., de Godoy, L. M., Li, G., Macek, B., et al., Mol Cell Proteomics 2005, 4, 2010-2021. [15] Scigelova, M., Makarov, A., Proteomics 2006, 6 Suppl 2, 16-21. [16] Madalinski, G., Godat, E., Alves, S., Lesage, D., et al., Analytical chemistry 2008, In press. [17] Southam, A. D., Payne, T. G., Cooper, H. J., Arvanitis, T. N., Viant, M. R., Analytical chemistry 2007, 79, 4595-4602. [18] Kamleh, A., Barrett, M. P., Wildridge, D., Burchmore, R. J., et al., Rapid Commun Mass Spectrom 2008, 22, 1912-1918. [19] Brun, R., Schonenberger, Acta tropica 1979, 36, 289-292. [20] Lamour, N., Riviere, L., Coustou, V., Coombs, G. H., et al., The Journal of biological chemistry 2005, 280, 11902-11910. [21] Guo, X., Bruins, A. P., Covey, T. R., Rapid Commun Mass Spectrom 2006, 20, 3145-3150. [22] Guo, X., Bruins, A. P., Covey, T. R., Analytical chemistry 2007, 79, 4013-4021. [23] Objective, N., 2007. [24] Wieser, M. E., Pure Appl Chem 2006, 78, 1971-2192. [25] Hilario, M., Kalousis, A., Pellegrini, C., Muller, M., Mass spectrometry reviews 2006, 25, 409-449. [26] Mihaleva, V. V., Vorst, O., Maliepaard, C., Verhoeven, H. A., et al., Metabolomics 2008, 4. [27] Fiehn, O., Plant molecular biology 2002, 48, 155-171.

15
Figure 1 | Overview of the high-performance pre-processing method. (0) The method
selects the LC-MS profile best suited for use as a reference, (1) detects and annotates the
background ions in all profiles, and (2) derives an internal mass calibration function for
the reference profile using the identified background ions. (3) The other profiles are
automatically aligned towards the reference, using all detected background ions as
landmarks for the calculation of an alignment function. (4) Subsequently, all profiles are
calibrated using the calibration function of the reference. (5) Peaks are detected and (6)
matched for further analysis.

16
Figure 2 | Overview of the detected and identified background ions. (a) Example of a
tandem MS fragmentation pattern confirming the presence of (2*acetonitrile+Cu)+ in the
measurement. (b) The mass bias of each identified background ion in all the samples
(each vertical cluster corresponds to a single background ion). Each profile displays the
same general pattern, but a spread of about 2 ppm is apparent. (c) The mass bias of each
identified background ion after alignment. The original spread of 1.69 ppm is reduced to
less than 0.57 ppm. The red line indicates the internal mass calibration function
ultimately used to correct for the mass deviations. (d) The mass accuracy after alignment
and internal mass calibration. All compounds are measured with a median accuracy of
0.18 ppm (maximum deviation 0.42 ppm).

17
Figure 3 | Exploiting accurate mass information for matching mass chromatograms. (a
and b) By unambiguously matching mass chromatograms corresponding to the same
compound reliable comparisons of mass abundance become possible. In this experiment,

18
the metabolomes of glucose- and proline-grown trypanosomes were compared in three
biological replicates. Glucose and proline were found to have a differential abundance in
the correct direction. The heatmap representations at the bottom show the raw data,
within a mass window of ±20 ppm. These heatmap representations give information
about the context of a mass chromatogram. For instance, proline is eluting on top of a
background ion. (c) Using the accurate masses it is possible to detect very low intensity
signals with high sensitivity and specificity. This example shows a chromatographic peak
close to the absolute detection limit. As this is found reproducibly in 3 replicates within a
very narrow mass and retention time window, it is certain that it corresponds to a real
compound in the samples. (d) The global metabolic difference profile for glucose- and
proline-grown samples. The width of the circles indicates the maximum signal. The color
gradient indicates the differential abundance (red, enriched in proline-grown samples;
green, enriched in glucose-grown samples; black, unchanged). (e) Mapping of
differentially abundant mass peaks to their putative identities based on KEGG pathway
maps. Concerted changes of the metabolome in response to growth conditions can be
clearly seen. (2Ket, 2-ketoglutarate; 4-OH-methyl-Glut, 4-hydroxymethyl glutamate;
Fum, fumarate; Glut, glutamate; Glut-P, glutamate phosphate; Lac, lactate; Mal, malate;
NAG-P, N-acetyl glucosamine phosphate; Oxac, oxaloacetate; PEP, phosphoenol
pyruvate; Pyr, pyruvate; Suc, succinate; Succinate-SA, succinate semialdehyde; TCA,
tricarboxylic acid cycle).
19
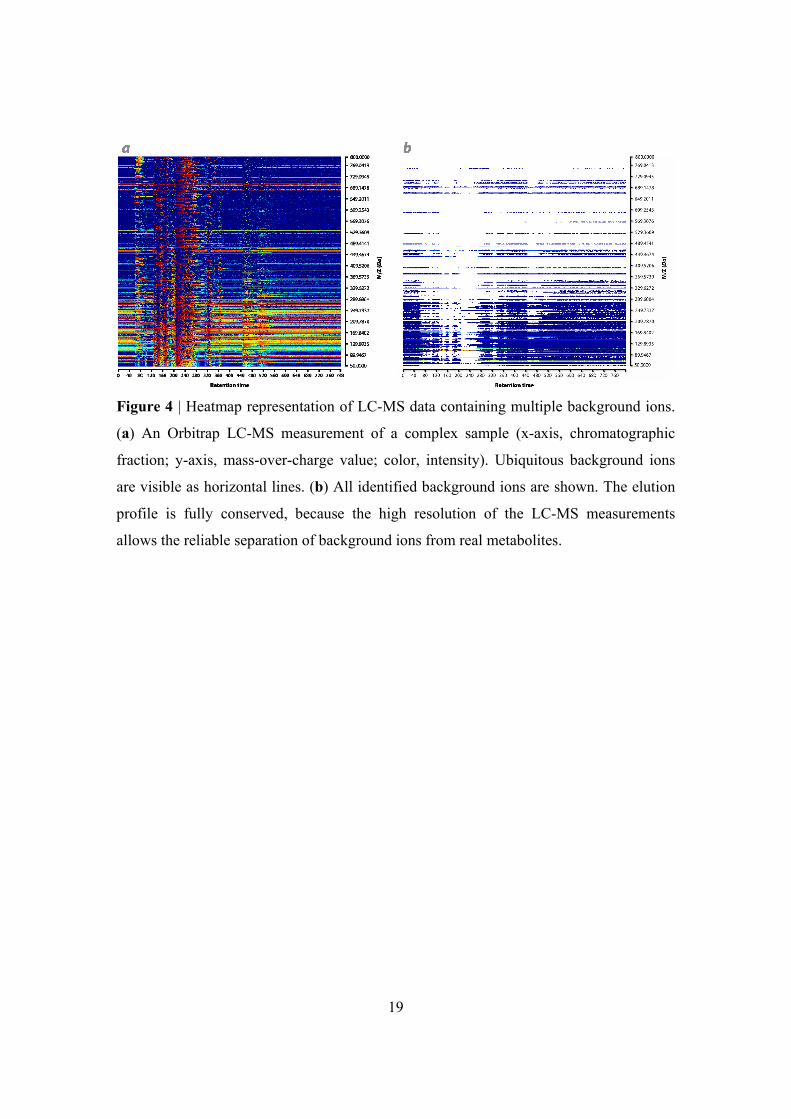
Figure 4 | Heatmap representation of LC-MS data containing multiple background ions.
(a) An Orbitrap LC-MS measurement of a complex sample (x-axis, chromatographic
fraction; y-axis, mass-over-charge value; color, intensity). Ubiquitous background ions
are visible as horizontal lines. (b) All identified background ions are shown. The elution
profile is fully conserved, because the high resolution of the LC-MS measurements
allows the reliable separation of background ions from real metabolites.

20
Table 1 | Mass accuracy of the essential amino acids. The table below lists all the
essential amino acids, with the addition of trypanothione which is a signature compound
in trypanosomes. All of the compounds are found in the sample with a median absolute
accuracy of 0.18 ppm (maximum deviation 0.42 ppm). Amino acid Retention
Time Chemical Formula
Expected Mass
Observed Mass
Difference (ppm)
L-Alanine 180 C3H7NO2 89.0476 89.0477 -0.19 L-Arginine 324 C6H14N4O2 174.1116 174.1117 0.09 L-Asparagine 202 C4H8N2O3 132.0534 132.0522 0.19 L-Aspartic acid 205 C4H7NO4 133.0375 133.0375 -0.13 L-Cysteine 270 C3H7NO2S 121.0197 121.0198 -0.07 L-Glutamic acid 180 C5H9NO4 147.0531 147.0532 0.04 L-Glutamine 188 C5H10N2O3 146.0691 146.0691 0.00 L-Glycine 190 C2H5NO2 75.0320 75.0320 0.32 L-Histidine 313 C6H9N3O2 155.0694 155.0695 -0.19 L-Leucine 147 C6H13NO2 131.0946 131.0947 -0.25 L-Isoleucine 152 C6H13NO2 131.0946 131.0947 -0.25 L-Lysine 333 C6H14N2O2 146.1055 146.1056 -0.28 L-Methionine 154 C5H11NO2S 149.0510 149.0511 -0.18 L-Phenylalanine 134 C9H11NO2 165.0789 165.0789 0.42 L-Proline 172 C5H9NO2 115.0633 115.0633 -0.07 L-Serine 203 C3H7NO3 105.0425 105.0426 0.08 L-Threonine 182 C4H9NO3 119.0582 119.0582 -0.04 L-Tryptophan 148 C11H12N2O2 204.0898 204.0899 -0.09 L-Tyrosine 165 C9H11NO3 181.0738 181.0739 -0.21 L-Valine 165 C5H11NO2 117.0789 117.0790 -0.08 Oxidized trypanothione 346 C27H47N9O10S2 721.2887 721.2890 -0.41