Embed Size (px)
Citation preview
Incumbents and Protectionism: The Political Economy of Foreign Entry Liberalization
*Anusha Chari **Nandini Gupta University of Michigan Indiana University
August 2007
Abstract
This paper investigates the influence of incumbent firms on the decision to allow foreign direct investment into an industry. Based on data from India’s economic reforms, the results suggest that firms in concentrated industries are more successful at preventing foreign entry, that state-owned firms are more successful at stopping foreign entry than similarly placed private firms, and that profitable state-owned firms are more successful at stopping foreign entry than unprofitable state-owned firms. These findings continue to hold after controlling for industry characteristics such as the presence of natural monopolies and the size of the workforce. The pattern of foreign entry liberalization supports the private interest view of policy implementation.
Contact Information: * Anusha Chari, Department of Economics, University of Michigan, 611 Tappan Street, Ann Arbor, MI 48109. Internet: [email protected]. ** Nandini Gupta, Kelley School of Business, Indiana University, 1309 East 10th Street Bloomington, IN 47405. Internet: [email protected]. We thank the editor, Bill Schwert, an anonymous referee, Utpal Bhattacharya, Ray Fisman, Galina Hale, Rick Harbaugh, Peter Henry, Simon Johnson, Diana Kirk, Randy Kroszner, Francisco Perez Gonzalez, Enrico Perotti, Jeff Smith, Ramana Sonti, TCA Srinivasa Raghavan, and Luigi Zingales for helpful comments. We have also benefited from the comments of participants at the NBER’s International Financial Markets Fall Meeting, 2005; the Darden/JFE/World Bank Emerging Markets Conference, Indiana and Michigan finance department workshops; the Summer Conference at the Indian School of Business, 2006; and the 6th International Conference on Financial Market Development in Emerging and Transition Economies, Moscow 2005. Chari thanks the Center for International Business Education for financial support.
2
1. Introduction
Liberalizing international capital flows can increase economic growth (Bekaert, Harvey, and
Lundblad, 2005). Yet, many countries restrict the inflow of foreign investment that can benefit their
economies. Recent evidence suggests that incumbent firms that receive preferential treatment may oppose
financial market reforms that threaten their favored status.1 In particular, Rajan and Zingales (2003a, b)
and Stulz (2005) argue that entrenched incumbent firms have an incentive to oppose the liberalization of
international capital flows if liberalization limits their ability to extract monopoly rents. This paper
investigates incumbent firm influence on the decision to liberalize foreign direct investment.
Specifically, we examine the Indian government’s decision to selectively reduce barriers to
foreign direct investment in a subset of industries after a balance-of-payments crisis in 1991. The Indian
corporate sector is characterized by the concentrated control of assets by state- and family-owned firms,
much like the rest of the world (La Porta, Lopez de Silanes, Shleifer, and Vishny, 1999). We adopt a
political economy approach to ask the following questions: Did incumbent firms influence the state’s
decision to liberalize foreign direct investment in some industries and not others? If so, which incumbent
firms had the most to lose from foreign entry and the ability to oppose it?
To investigate these issues, we use a rich firm-level data set that provides detailed balance sheet
and ownership information for more than 2,100 firms that account for over 70% of India’s industrial
output. The data are classified into state-owned, group-owned, and privately owned firms. We investigate
whether pre-liberalization characteristics such as industry structure and the ownership of incumbent firms
can explain the government’s decision to selectively open up some industries to foreign entry.
The private interest and public interest views of policymaking suggest possible explanations for
the government’s decision to liberalize some industries and not others. The private interest view
characterizes the policy process as one where special interest groups lobby the government to influence
1 The evidence suggests that (1) banking deregulation is delayed in U.S. states where incumbent banks have the most to lose from entry (Kroszner and Strahan, 1999); (2) entrenched firms lobby to restrict access to credit after a crisis, forcing poorer entrepreneurs to exit (Feijen and Perotti, 2005); and (3) post-1500, Western European countries with monarchies opposed free entry in profitable industries (Acemoglu , Johnson, and Robinson, 2005).
3
policy decisions in their favor, which may result in non-welfare-maximizing outcomes.2 The public
interest view assumes that governments enact welfare-maximizing policy changes to achieve socially
efficient outcomes and correct market failures, without regard for private interests (Joskow and Noll,
1981).
Using data on industry structure and firm characteristics, we investigate whether the government
randomly liberalized industries, or whether the private or the public interest views better explain the
pattern of liberalization. For instance, the private interest view holds that the probability of foreign entry
liberalization will be inversely related to industry concentration. According to Olson (1965), Stigler
(1971), and Peltzman (1976), incumbent firms in these industries have a greater ability to lobby the
government and prevent policy changes, such as foreign entry, that could adversely affect them. Further,
Stigler (1971) argues that incumbent firms in profitable, concentrated industries have a greater incentive
to prevent entry in order to protect their monopoly profits. In contrast, from a public interest perspective
the government would liberalize entry to reduce deadweight losses in concentrated industries that earn
monopoly profits (Pigou, 1938).
The government also may be more receptive to the interests of particular incumbents, such as
state-owned firms that occupy a prominent position in many economies around the world (Megginson,
2005).3 Politicians obtain private benefits from state-owned firms, such as the ability to hire surplus
workers (Shleifer and Vishny, 1994). Moreover, the earnings of state-owned firms directly accrue to the
government. Therefore, policy makers may have an incentive to protect industries with large or profitable
state-owned firms from competition.
Our main results are as follows. First, consistent with the private interest view, the likelihood of
foreign entry liberalization in an industry is inversely related to its concentration. On average, the
probability of liberalization decreases by 27% for a one standard deviation increase in the Herfindahl
2 Olson (1965), Peltzman (1976) and Becker (1983) describe the regulatory process as one of interest group competition in which compact, well-organized groups are able to use the coercive power of the state to capture rents at the expense of more dispersed groups. 3 According to Gupta (2005), Indian state-owned firms account for over 40% of the total capital stock in the economy.
4
index from its sample mean of 0.45.4 Second, consistent with the hypothesis that firms in concentrated
industries have an incentive to protect their monopoly profits, the likelihood of foreign entry liberalization
is significantly lower for profitable, concentrated industries. Third, regional variation in firm location
reveals a negative and significant relationship between geographic concentration and the likelihood of
foreign entry liberalization.
Fourth, the results show that industries with a sizable state-owned firm presence are significantly
less likely to be liberalized. Whereas industries with state-owned monopolies face a 14% chance of being
liberalized, industries with no state-owned firms face a 52% probability, making them nearly four times
as likely to be liberalized. Also consistent with the private interest hypothesis, the evidence suggests that
the government is more likely to protect profitable state-owned firms. The results are robust to industry
size, concentration, and workforce.
Four methodological issues may be raised in the context of our empirical analysis. First, the
pattern of liberalization may reflect underlying technologies that determine scale rather than barriers to
entry created by incumbent firm influence. We examine the difference between Indian and U.S.
concentration in the same industries where U.S. concentration captures the ‘natural’ level of concentration
in an industry and find that the likelihood of liberalization is negatively correlated with our measure of
“excess concentration.” Consistent with Rajan and Zingales (2003a, b), this result suggests that past
industrial policies in India created powerful incumbent firms that used their market power to oppose
financial market reforms. Second, while industry concentration may proxy for natural monopolies or
industries of strategic importance, we find that concentration continues to be significantly and negatively
correlated with the probability of liberalization after controlling for industries in these two categories.
Third, industry concentration may proxy for the political connections of certain incumbents like
family-owned firms. We find that industry concentration continues to be significantly and negatively
related to the probability of liberalization with the inclusion of controls for the stake of privately-owned
4 The Herfindahl index is an indicator of the degree of competition among firms in an industry. It is defined as the sum of the squares of the market shares of each firm in an industry. The value of the Herfindahl index can range from zero in perfectly competitive industries to one in single-producer monopolies.
5
and state-owned firms in an industry, which are proxies for the political influence of these firms. A
limitation of this approach is that there may be heterogeneity in the influence of private firms arising out
of family connections that are not captured by ownership categories.
Fourth, our methodology is related to the literature on the political economy of trade, where
politically organized groups use campaign contributions to influence politicians as in Grossman and
Helpman (1994).5 For instance, Goldberg and Maggi (1999) and Bandhyopadhyay and Gawande (2000)
find that tariffs are higher in industries that are represented by organized lobbies. However, as Gawande
and Krishna (2004) point out, one concern in this literature is that industry characteristics are an
endogenous outcome of differences in tariff barriers across industries. Our data have the advantage that
before 1991, draconian restrictions on foreign entry were uniformly applied across all industries so that
foreign investment inflows were negligible.6 We also estimate an instrumental variable specification
using industry concentration in the United States as an instrumental variable for the Herfindahl index in
India to capture influence arising out of market power rather than past protection. Industry concentration
remains inversely correlated with the probability of liberalization.
Our findings contribute to the literature that documents the relation between financial constraints
and product market competition (Cetorelli and Strahan, 2006) as well as the relation between financial
market development and economic growth (Rajan and Zingales, 1998; Bekaert, Harvey, and Lundblad,
2005). Given the widely documented inefficiencies of state-owned enterprises (Megginson, 2005) and the
deadweight loss associated with industry concentration, selective entry liberalization to protect these
incumbent firms may inhibit economic growth. Because entrenched state-owned firms are likely to hinder
financial market reforms, a policy implication of our results is that it may be necessary to reduce the
influence of these firms, for example, through privatization, to optimally implement reforms.
5 We do not observe more direct measures of influence such as parliamentary voting records or lobbying contributions because the former are not available for the liberalization measure studied here, and the latter are illegal in India. A potential concern with using data on lobbying contributions, if available, is that the contributions and the policy positions of politicians may be simultaneously determined. It is difficult to make a similar claim for the ex-ante stake of incumbent firms, which lies at the core of the identification strategy in this paper. 6 In the four years preceding liberalization foreign investment inflows accounted for less than 0.3% of gross capital formation on average in India (World Bank, 1991).
6
Section 2 discusses the economic reforms and industrial structure in India. Section 3 provides
summary statistics and describes our methodology. Section 4 describes the data. Section 5 discusses the
relation between industry and firm characteristics, and the likelihood of foreign direct investment
liberalization. Section 6 provides additional robustness checks, and Section 7 concludes.
2. Reforms and Industrial Structure
2.1. Liberalizing Foreign Entry in India
In response to a balance-of-payments crisis in 1991, India undertook sweeping economic reforms.
A key reform involved reducing restrictions on foreign direct investment in a subset of industries.
Specifically, according to the Industrial Policy Resolution of 1991, automatic approval was granted for
foreign direct investment of up to 51% in 46 of 96 three-digit industrial categories (Office of the
Economic Advisor, 2001). In the remaining 50 industries, the state continued to require that foreign
investors obtain approval for entry. Table A1 in the Appendix provides a list of liberalized industries.
Before 1991, ownership and industry concentration patterns in India were an outcome of state-led
industrialization policies rather than of market forces. A chronology of industrial policies since India’s
independence shows that these policies restricted the participation of private and foreign firms in the
economy (Appendix, Table A2). For example, the Industrial Policy Resolution of 1956 reserved certain
industries for state-owned firms, prohibiting the entry of all private firms. Until 1991, government
approval was required for foreign direct investment in all industries, severely curtailing FDI flows.
To establish that barriers to entry rather than technological factors which determine scale explain
the pattern of industrial concentration in India before 1991, we compare the pre-reform industrial
structure in India with that of the United States. As an economy with more developed financial markets
and fewer regulations than most countries, U.S. data offer a benchmark of industry characteristics that
represent underlying technologies rather than regulatory constraints, as in Rajan and Zingales (1998).
Panel A of Table 1 shows that in 1990, a year before the reforms, the average Herfindahl index in India
was significantly higher (40%) than in the United States (24%) for the same three-digit SIC industries.

7
From Panel B we note that industry concentration in Indian industries that remained protected was
significantly higher than their U.S. counterparts (54% versus 22%), suggesting that entrenched incumbent
firms in India may have successfully opposed foreign entry in these industries.
Firms in profitable, concentrated industries may have a particular incentive to oppose foreign
entry liberalization. First, around the world, foreign investment and industry concentration are positively
correlated (Caves, 1996) and multinational enterprises (MNEs) tend to compete in industries with high
seller concentration (Caves, 1971). Second, Aitken and Harrison (1999) and Caves (1996) argue that
MNEs have deeper pockets and access to superior technology which allow them to overcome entry
barriers in concentrated industries. Third, Caves (1996) shows that entry by MNEs can reduce the market
share of domestic incumbents, which Aitken and Harrison (1999) refer to as the “market stealing” effect.
Moreover, Caves (1996) argues that foreign entry can lead to the exit of domestic firms because of
increased competition in product and labor markets. Lastly, Geroski (1991) argues that the negative
impact of FDI on incumbent firm profits and market share explains why incumbents spend more profits to
forestall entry by foreign rather than domestic firms.
Describing the politics of FDI liberalization in the Indian print media industry, a newspaper
article states, “The monopoly interests of the bigger Indian publishing houses now stand
threatened…trying their best to thwart the entry of bigger foreign players, were the biggies of the Indian
publishing world, each with its carefully-nurtured turf to protect” (Asia Times Online, 2004).7 Thus,
foreign multinationals posed a greater threat to Indian incumbents in profitable, concentrated industries
than potential entrants from the over-regulated and capital-starved domestic private sector.8
Since foreign firms were granted automatic approval of up to 51%, the primary mode of foreign
entry post-liberalization was in the form of joint ventures with domestic partners. As a result there was
also considerable heterogeneity in support for liberalization among incumbent firms. For instance, state-
7 “Media Giants See Dollar Signs in India,” Asia Times Online, 2004. 8 Foreign entry is typically opposed more vigorously than domestic entry for nationalistic reasons. For example, Malaysia’s Prime Minister Mahathir, opposing foreign entry liberalization measures proposed by the IMF declared, “If we are not careful, we will be re-colonized” (Televised speech, October 1998).
8
owned firms may have opposed foreign entry since foreign entrants were unlikely to seek out these firms
as the local partner in joint venture deals.9 In contrast, a subset of private firms supported liberalization
because of the opportunity to form joint ventures—80% of the joint venture deals with foreign firms had a
domestic private partner.
However, other private firms opposed liberalization if they viewed multinational companies as
direct competitors. A newspaper article describes opposition from an incumbent: “Kishore Biyani [chief
executive of the largest retailer in India] argues that the retail sector…should not be given away to foreign
players while it is too young to compete on a level playing field…He lacks the capital to build even
average-sized Wal-Mart stores of 200,000 square feet - four times larger than his flagship Big Bazaar”
(India Daily, July 24, 2005).10
Kochanek (1996a, b) explains that the heterogeneity in support for reforms extended to family-
owned business groups. Tripathi (2004) provides evidence that an organization of business groups known
as the “Bombay Club” vigorously lobbied for greater protection against MNEs. In contrast, the Tatas and
Birlas were the domestic partner in 45 of 652 joint venture deals with foreign firms.
The 1991 reforms included the removal of barriers to domestic entry such as de-licensing and the
de-reservation of sectors exclusively reserved for state-owned firms. Most domestic incumbents did not
oppose these reforms (Tripathi, 2004). For example, the “Bombay Club,” which opposed foreign-entry
liberalization, welcomed the end of the licensing and reservation policies because it allowed them access
to sectors previously kept off-limits to private firms. Prior to the economic reforms the Birla group
invested in Southeast Asia to protest restrictions on private business (Tripathi, 2004). Moreover as
Ahluwalia (2005) argues, by the 1980s it was widely recognized that the licensing system had failed and
de-licensing ended the red-tape and corruption associated with the lengthy bureaucratic approval process.
9 Access to government subsidies and the political influence of state-owned firms would allow them to prevail over domestic entrants but would not be a match for the superior capital and technological resources of MNEs. Evidence suggests that the Chinese government also protects state-owned firms from foreign competition as in Branstetter and Feenstra (2002). 10 “Wal-Mart Assault,” India Daily, July 24, 2005.
9
Finally, it was not politically feasible for state-owned firms to oppose de-reservation because of public
disillusionment with the dismal performance of these firms (Tripathi, 2004).
2.2 The Lobbying Process in India
A prominent example of an industry that lobbied successfully to keep out foreign competition is
the print media, which is highly concentrated with a sample concentration ratio of 0.89. A fierce
campaign was waged against foreign investment by major national newspapers and news agency
employees’ organizations who urged the government to ban foreign entry in this sector. Their efforts
included campaigning ministers and formal testimony in parliament. A memorandum to the Prime
Minister from industry representatives stated, “The poison of FDI must never be allowed to pollute the
Indian press” (The Hindu, November 27, 2004).11 Ramachandra (1999) also documents lobbying against
foreign entry liberalization in other industries that remained protected, including the petrochemicals and
steel industries, which are highly concentrated and dominated by state-owned firms.
State-owned firms are controlled by the government and therefore have a direct influence on the
policymaking process. Given that corporate lobbying contributions are illegal, legal channels for lobbying
by private industry include statements in the media, testimony and memoranda to parliament, and the use
of industry associations as lobbying vehicles. The three main industry associations that lobby the
government on behalf of their members are the Federation of Indian Chambers of Industry and Commerce
(FICCI), the Confederation of Indian Industry (CII), and the National Association of Software and
Service Companies (NASSCOM). FICCI represents the traditional business groups,12 whereas CII and
NASSCOM represent the newer technology and service sectors that favor foreign entry liberalization and
were influential in the introduction of the 1991 economic reforms (Pedersen, 2000). CII is a prominent
participant in the debate on the economic reforms (Pedersen, 2000), and the Indian government has been
11 “Major media employees' forums oppose FDI,” The Hindu, November 27, 2004. 12 Khanna and Palepu (2004) argue that Indian business groups are also politically connected conglomerates that lobby the government to influence policy like other business groups around the world, as in Fisman (1998) and Morck, Wolfenzon, and Yeung (2004).

10
receptive to the organization’s advice due to its close connections to the Ministry of Finance (Kochanek,
1996a, b).
3. Hypotheses and Evidence
3.1. Descriptive Statistics
Table 2 presents results from tests comparing liberalized industries with those in which foreign
entry barriers are retained, revealing some distinct patterns in the data. On several counts, the
liberalization of foreign entry appears to be anything but random. First, liberalized industries are
significantly less concentrated with an average Herfindahl Index of 29% compared to protected industries,
which have an average Herfindahl index of 59% (Table 2, Panel A). Second, Table 2 also shows that firm
profits are also significantly lower on average in liberalized industries (8.4%) compared to protected
industries (27.1%). Third, concentration and profitability are positively and significantly correlated in
protected industries (Table 1, Panel C).13 Taken together, these facts suggest that protected industries have
fewer and more profitable firms than liberalized industries.
Looking across ownership categories in Table 2 reveals that state-owned firms in protected
industries have significantly higher market share and are also more profitable than state-owned firms in
liberalized industries. If the removal of barriers to foreign entry was not random, what factors drove the
government to selectively liberalize some industries and not others? The private and public interest views
of policymaking offer possible explanations.
The private interest view described by Olson (1965), Stigler (1971), Peltzman (1976, 1989), and
Becker (1983) characterizes the policy process as one of interest group competition where compact, well-
organized special interest groups lobby the government to influence policy decisions in their favor. The
13 The results in Table 1, Panel C suggest that concentration and profitability are negatively correlated in liberalized industries. This is because more profitable liberalized industries are less concentrated than the less profitable liberalized industries. Specifically, the Herfindahl index for liberalized industries with above the sample median profitability is equal to 0.22 and the Herfindahl index for liberalized industries with below the median profitability is equal to 0.33, with the difference being significant at the 10% level.

11
public interest view assumes that governments enact policy changes to achieve socially efficient
outcomes and correct market failures without consideration for private interests.
In the subsections that follow we develop testable hypotheses based on the public and private
interest views about industry and firm characteristics that may explain the pattern of selective
liberalization. The null hypothesis is that the industry selection was random—industries that were
liberalized do not differ in any systematic way from those that were not. We begin with the role of
industry concentration.
3.2. The Role of Industry Concentration
Collective action theory predicts that the ability of specific industries to resist foreign entry
liberalization should be positively related to industry concentration. Incumbent firms in concentrated
industries have a greater ability to organize and oppose policy changes that could adversely affect them as
in Olson (1965), Stigler (1971) and Peltzman (1976). Under this view, the likelihood of effective
coordination in an industry increases with a decrease in the number of firms. If the private interest view
has any empirical bite, foreign entry barriers are more likely to be retained in concentrated industries.
On the other hand, concentrated industries are associated with greater deadweight loss (higher
prices and lower output) compared with more competitive industries. Therefore, a welfare-maximizing
government would enact policies to promote competition by removing entry barriers in concentrated
industries. Therefore, if, the data are consistent with the public interest view, foreign entry barriers are
less likely to be retained in concentrated industries.
While industry concentration measures the ability of incumbent Indian firms to organize, what
incentive did these firms have to oppose foreign entry? We explore the role of industry profitability next.
3.3. The Role of Industry Profitability
Neoclassical theory predicts that firms in imperfectly competitive industries are more likely to
earn supernormal or monopoly profits (Tirole, 1988). Applied to the Indian context, under the private
12
interest view, firms in profitable, concentrated industries have an incentive to lobby against foreign entry
to protect monopoly profits (Stigler, 1971).14 If the private interest view holds, profitable, concentrated
industries are less likely to be liberalized. The public interest view predicts the opposite—a welfare-
maximizing government would liberalize imperfectly competitive industries that earn supernormal or
monopoly profits.
To investigate whether the government was more receptive to the interests of certain groups of
incumbent firms we turn to the subject of state ownership.
3.4. The Role of Firm Ownership: State-Owned Firms
Like many countries around the world, India has a large state-owned sector. Backed by
government support, state-owned firms expanded into many industries, relegating the private sector to a
secondary role in the economy. In the case of state-owned firms, the special interests include politicians
and bureaucrats who have a stake in these firms.
Since politicians directly control state-owned firms, they are in a position to extract many private
benefits such as securing employment for their supporters or expropriating funds from these firms as
suggested by Boycko, Shleifer, and Vishny (1996) and Shleifer and Vishny (1998). Liberalization would
reduce these benefits if foreign entry has an adverse impact on the performance of state-owned firms. For
example, government revenues would fall if foreign entry reduces state-owned firm revenues. Indian
state-owned firms also tend to be overstaffed, and their employees belong to powerful labor unions.
Foreign entry could result in layoffs or lower wages for these workers. From a private interest
perspective, both politicians and state-owned firm employees have an incentive to oppose liberalization.15
14 Kroszner and Strahan (1999) argue that cash-rich firms in high-growth and profitable industries also have a greater ability to successfully lobby the government relative to cash-poor firms in declining industries. 15 State-owned firms were also far less likely to benefit from foreign entry compared to private firms because foreign firms rarely formed joint-venture partnerships with state-owned firms.
13
The public interest perspective does not offer a straightforward prediction about why a welfare-
maximizing government would take into account the ownership of incumbent firms.16
3.5 The Role of Industry Location
While the liberalization policy was enacted by the federal government, these politicians are likely
to respond to the interests of the electorate in their home states because of the potential electoral impact of
these policies. Anecdotal evidence suggests that electoral support at the local level mattered to the
policymakers at the federal level. “The PM [Prime Minister] was highly sensitive to the impact of reform
on India’s voters. [Prime Minister] Rao felt that an electoral setback even in one state could be interpreted
as a verdict against the economic reforms nationwide” (Tharoor, 1997, p. 173).
Politicians seeking reelection also may have a greater incentive to preserve private benefits from
state-owned firms in their home states, such as securing employment for supporters. For example, Dinc
and Gupta (2006) find that Indian state-owned firms are less likely to be privatized if they are located in a
state where the governing party faces more electoral competition from the opposition, and no state-owned
firm located in the home state of the Cabinet Minister in charge is ever privatized.
Industries that are geographically concentrated may have a greater ability to lobby politicians
from their home state and successfully oppose policy changes such as foreign entry that could adversely
affect them. To test this hypothesis, we investigate whether the relative size, concentration, and
employment share of an industry in a state, and the employment, sales, and asset shares of state-owned
firms in that state have an effect on the probability of liberalization of that industry.
4. The Data
We use firm-level data from the Prowess database collected by the Centre for Monitoring the
Indian Economy from company balance sheets and income statements. Prowess covers both publicly
16 While state-owned firms may fulfill welfare objectives by hiring surplus workers and providing benefits, these objectives may be more effectively pursued through social programs rather than by protecting inefficient firms.
14
listed and unlisted firms from a wide cross-section of manufacturing, services, utilities, and financial
industries. About one-third of the firms in Prowess are publicly listed firms. The companies covered
account for more than 70% of industrial output, 75% of corporate taxes, and more than 95% of excise
taxes collected by the Government of India (Centre for Monitoring the Indian Economy). Prowess covers
firms in the organized sector, which refers to registered companies that submit financial statements.17
The data provide information on a range of variables such as sales, profitability, employment, and
assets for 2,187 firms.18 For all the variables used in the estimations we construct averages for the three
fiscal years, 1988-1990, which precede the liberalization of foreign entry in 1991. Therefore, these data
do not reflect the consequences of any of the economic reforms undertaken in 1991. The variables used in
this analysis are described in Appendix Table A3.
The main advantage of firm-level data is that detailed balance sheet and ownership information
permit an investigation of whether the presence of certain types of incumbent firms in an industry affects
the probability of liberalization. In contrast, industry-level databases usually do not provide information
about sales, assets, profits, and employment by different ownership categories. The firms in the data
belong to two main ownership categories: state-owned firms and private firms. Private firms include
family-owned business groups and unaffiliated private firms.
Another advantage of using India as the empirical context is the considerable regional variation in
industrial, demographic, and political characteristics across the different Indian states. Using data on firm
location, we look at the effect of geographic industrial concentration and state-ownership stake on the
probability of liberalization. Prowess has financial data on 536 industry-state observations. Industry
location and geographic concentration depends on proximity to natural resources, product markets, and
17 According to the government, “The organised sector comprises enterprises for which the statistics are available from the budget documents or reports etc. On the other hand the unorganised sector refers to those enterprises whose activities or collection of data is not regulated under any legal provision or do not maintain any regular accounts” (Informal Sector in India: Approaches for Social Security, Government of India, page 2). 18 Since firms are not required to report employment in their annual reports, we observe employment data for only 241 firms. To avoid attrition bias, the estimations do not require that the data be balanced.
15
infrastructure. For example, firms in the basic chemicals industry are located in 19 different states,
whereas the mining of lignite is concentrated in the state of Gujarat, close to the ore deposits.
The Industrial Policy Resolution of 1991 (Office of the Economic Advisor, 2001) provides
information about the list of industries in which the state liberalized foreign entry. The firms in the sample
belong to 96 three-digit industrial categories, of which foreign entry restrictions were reduced in 46
industries. The Indian National Industrial Classification (NIC) (1998) system is used to classify firms in
the Prowess dataset into industries. The data include firms from a wide range of industries including
mining, basic manufacturing, financial and real estate services, and energy distribution.
The Prowess database provides four- and five-digit industry classifications for most firms.
However, because the liberalization policy was enacted at the three-digit level, the explanatory variables
such as industry concentration are computed at the three-digit level. As a robustness check we also
estimate regressions using concentration at the four-digit industry level.
Table 3 reports average values of the concentration measures and the stakes of the two ownership
groups (state-owned firms and private firms) across industrial categories. For expositional purposes, the
table collapses the three-digit industrial categories used in the empirical analysis into two-digit industrial
categories. The regression analysis employs the three-digit classification. From Table 3 note that the
Herfindahl index and the proportion of output produced by state-owned firms varies across the different
industrial categories. The cross-sectional variation in industry concentration and the market share of
different ownership categories allow us to identify the relative effects of concentration and ownership.
Lastly, we use the SDC Thomson’s Joint Ventures database to calculate the number of joint
ventures involving domestic incumbents with foreign firms in the five years following liberalization. The
names of the Indian partners in the SDC database are used to determine the number of state- and privately
owned Indian partner firms in foreign joint ventures.
16
4.1. Coverage in Prowess
Our measures of industrial structure, such as the Herfindahl index and concentration ratios, rely
on firm-level data. It is therefore important to investigate the proportion of industrial activity in the
economy covered by Prowess.
To do this we compare the Prowess data with the Annual Survey of Industries (ASI) conducted
by the Government of India. The ASI is an annual census collected on a sampling basis of factories
employing 100 or more workers. Although the overlap in the list of industries covered by the two datasets
is not perfect, the ASI data nevertheless provide a useful cross-industry benchmark for the coverage in
Prowess. For instance, the ASI data focus primarily on the manufacturing sector, whereas Prowess covers
several additional service sectors including defense, restaurants, hotels, and computer services. We find
that in 41 of the 51 three-digit industries covered by both databases, total industry sales in Prowess is on
average 77% of the value of total sales for the same industry in the ASI.
Examining the implication of the coverage in Prowess relative to the ASI, we find that eight of
the ten industries with low coverage in Prowess liberalized foreign entry (low coverage refers to
industries in which the Prowess data cover less than 10% of ASI output). In these industries actual
industrial output is larger than that recorded in Prowess. Since the concentration measures calculated
using Prowess data are likely to be higher than actual industrial concentration in these industries
(Veermani, 2001), this would bias us against finding a negative correlation between concentration and the
probability of liberalization.
We compare industry concentration in India with that in the United States using Compustat data
on U.S. firms. Compustat is restricted to publicly listed firms in the United States. However, the
advantage is that disclosure requirements require that the publicly available financial data for listed firms
are comprehensive. Similarly, Prowess reports data on firms in the organized sector in India, which are
also governed by regulations and tax laws that require comprehensive financial information. Whereas
Compustat excludes private firms in the United States, Prowess excludes firms in the unorganized sector.
17
The main difference in the types of firms covered in Compustat and Prowess is that there are few state-
owned firms in the United States.
5. Results
5.1. Do Concentrated Industries Influence the Pattern of Foreign Entry Liberalization?
This section addresses the following question: Does the strength of incumbents measured by
industry concentration affect the probability that barriers to foreign direct investment will be removed in
an industry? We begin with the following probit specification to investigate whether the pattern of
industry concentration across liberalized and protected sectors is more consistent with the private or
public interest views:
0 1 2Pr( 1) ( ) , (1)j j j jEntry Liberalization Concentration Xα α α ε= = Φ + + +
where Φ represents the standard normal cumulative distribution, j indicates the industry, and
jX represents a matrix of firm- and industry-level characteristics that includes industry sales, wages, and
measures of openness to trade.
The Herfindahl index, calculated as the sum of the squares of the market shares of the firms in an
industry, provides a proxy for industry concentration (Concentrationj).19 All the specifications correct for
heteroskedasticity using the Huber-White estimator of variance, and standard errors are corrected for
clustering at the three-digit industry level. Note that we report the marginal probit coefficients and
standard errors of the coefficients from the probit regression throughout.
Consistent with the private interest hypothesis, the results reported in Table 4 suggest that the
state is significantly less likely to remove foreign entry barriers in concentrated industries. This result is
robust to a wide range of industry characteristics including size, profitability, productivity, and
employment measures. From the specification reported in Column (1) we estimate that the probability of
entry liberalization decreases by 27% (from 49% to 22%) for a one standard deviation increase in the
19 We provide results using alternative measures of industry concentration in Section 6.2.
18
Herfindahl index from the sample mean of 0.45 to 0.75. In the case of monopolies, the probability of
liberalization decreases even further to 8.2%, where the remaining covariates in Column (1) are evaluated
at their mean value.20
The finding that entry barriers are more likely to be retained in concentrated industries leads to the
question of why incumbent firms in these industries oppose the liberalization of foreign direct investment.
In particular, is the government more likely to protect profitable or declining industries? The next
subsection addresses this question.
5.2. Why Do Firms in Concentrated Industries Oppose Foreign Entry Liberalization? Foreign entry may reduce the monopoly profits of incumbent firms in concentrated industries,
which according to the private interest hypothesis gives them an incentive to oppose liberalization.
Therefore, if the private interest view holds, foreign entry barriers are more likely to be retained in
profitable, concentrated industries, while the public interest view predicts the opposite.
From the results reported in Columns (2) and (3) of Table 4 it appears that the state is more likely
to retain foreign entry barriers in more profitable and productive industries. Profitability is measured as
the ratio of EBITDA to sales for the four firms with the highest sales in an industry (Profit of 4 Largest
Firms), and productivity is measured as output per worker (Average Product) defined as the ratio of
aggregate sales to aggregate employment in each industry. The estimation in Column (4) shows that entry
barriers are significantly less likely to be removed in industries that have higher contemporaneous growth
rates (Sales Growth), suggesting that declining industries face a higher probability of being liberalized.
Table 4 also shows that the estimated coefficient of the Herfindahl index retains its magnitude
and significance when the profitability variables are included in the regression. This suggests that
profitability and industry concentration capture two different factors that are correlated with the
probability of foreign entry liberalization. While the Herfindahl index captures the effective coordination
20 The industry concentration result is consistent with Baldwin (1985) who finds that protection from trade is lower for industries with a greater number of firms (an inverse measure of concentration).
19
ability of incumbent firms to organize and influence government policy, profitability measures the
incentive of incumbent firms to oppose foreign entry, which may reduce profits.
To investigate the interaction between industry concentration and profitability, the following
regressions examine the effect of industry concentration on the probability of liberalization for two sub-
samples:
0 1 2
0 1 2
Pr 1 , (2)
Pr 1 , (3)j j j j j median
j j j j j median
(Entry Liberalization ) Φ(α α Concentration α X ε ) if
(Entry Liberalization ) Φ(α α Concentration α X ε ) if
π π
π π
= = + + + >
= = + + + <
where jπ is average profitability of firms in industry j and medianπ is the median profitability across all
industries, j medianπ π> represents industries with above-sample-median profitability, and j medianπ π<
represents industries with below-sample-median profitability. Profitability is measured as the ratio of
EBITDA to sales averaged across all firms in an industry.
Column (5) of Table 4 shows that for industries with profitability below the sample median, the
coefficient of the Herfindahl index is equal to –0.660 and is statistically significant at the 10% level. In
contrast, the results in Column (6) show that for industries with profitability above the sample median, the
coefficient of the Herfindahl index is more negative at –1.505 and significant at the 1% level. A
likelihood ratio test suggests that the estimated coefficients are significantly different across these two
sub-samples and the chi-squared test statistic reported in Column (6) is significant at the 5% level.
We also report results from a specification using the full sample where we interact the right hand
side variables with a dummy variable that is equal to one if the industry belongs to the above median
profitability sample (Table 4, Column (7)). The coefficient of the interaction between the Herfindahl
index and the dummy variable is negative and statistically significant, which confirms that more
profitable firms in concentrated industries have a greater incentive to oppose foreign entry.
In sum, the results in Columns (5)-(7) suggest that as the profitability of concentrated industries
increases, the probability of liberalization falls. These results support the private interest view: Barriers to
20
foreign entry are more likely to be retained in industries with a few profitable firms that seek to protect
their monopoly profits.
5.3. Does Labor Influence Foreign Entry Liberalization?
To investigate whether the Herfindahl index is a proxy for other sources of interest group
influence, such as organized labor, we include total employment, capital intensity, and wages per worker
in the regressions. From the results reported in Columns (8)–(10) of Table 4, it appears that neither total
employment nor average wages per worker have a significant impact, and that capital-intensive rather
than labor-intensive industries are more likely to be protected. This need not imply that organized labor
has no influence. For example, part of the influence of the largest firms may be that they are also the
largest employers in an industry.
Note that we observe employment in a smaller subset of firms. Also, most manufacturing sector
workers are employed in the “small-scale industry” sector (firms with 50 or fewer workers), which is
protected from both domestic and foreign entry. Since we do not observe firms of this size in our data, we
may be underestimating the impact of employment on the liberalization decision.
5.4. Does the Influence of Incumbent Firms Vary by Ownership Category?
Next, we investigate whether the government is more likely to protect state-owned firms. We
estimate the following probit specification to investigate the relative influence of state-owned firms
compared to private firms on the liberalization decision:
) ()1 Pr( 210 jjjj XStakeSOEtionLiberalizaEntry εααα +++Φ== , (4)
where Φ represents the standard normal cumulative distribution, j represents the industry with a total of
i=1…I firms, a subset of which are state-owned firms. The estimations are corrected for
heteroskedasticity using the Huber-White estimator for variance, and the standard errors are clustered at
the three-digit industry level.

21
The SOE Stake variables measure the stake of state-owned firms relative to private firms in an
industry, which includes business groups and unaffiliated private firms. These include the ratio of total
sales, assets, employment, and wages produced by state-owned firms in an industry to aggregate sales,
assets, employment, and wages in that industry, respectively. The relative shares of state-owned firms in
an industry, which are likely to be correlated, provide proxies for the influence of these firms on the
probability of liberalization. Under the private interest view, we expect the coefficient of SOE Stake, α1,
to be negative—industries with a large state-owned firm presence are less likely to be liberalized. We also
include the profitability of state-owned firms in an industry. The jX vector of control variables includes
the Herfindahl index, industry sales, assets, wages, employment, and measures of trade openness.
The results are presented in Table 5. Column (1) shows that the greater the proportion of an
industry’s output produced by state-owned firms relative to privately owned firms, the lower the
probability of foreign entry liberalization. The same result holds for the share of assets controlled by
state-owned firms relative to privately owned firms (Column (2)). These results are robust to industry
concentration, sales, wages, and industry trade openness.
The effect of state-owned firms on the probability of foreign entry liberalization is also
economically significant. From the specification reported in Column (1), we estimate that industries with
state-owned monopolies face a 14% chance of being liberalized, whereas industries with no state-owned
firms face a probability nearly four times as high at 52%, where the remaining covariates are evaluated at
their mean values.21
Does the government protect state-owned firms from foreign competition because they earn
monopoly profits or because they are inefficient? The results in Column (3) of Table 5 suggest the
former: SOE Firm Profits is significantly negatively related to the probability of liberalization. However,
SOE Average Product does not appear to have a significant effect on the probability of liberalization
(Table 5, Column (4)).
21 Consistent with these results, Branstetter and Feenstra (2002) find that in the case of trade liberalization in China, the government places twice the weight on the welfare of state-owned firms than it does on consumer welfare.
22
The results also suggest that state-owned firm workers may be more influential than employees of
private firms (Table 5, Columns (5)-(7)). The probability of foreign entry liberalization is significantly
lower the greater the proportion of an industry’s workers employed in state-owned firms (SOE Labor
Share), the higher the share of total industry wages paid by state-owned firms (SOE Wage Share), and
higher the wages per worker in these firms (SOE Wages per Worker). However, we note that labor and
wage shares may be a proxy for state-owned firm presence in an industry.
We also investigate the effect of group-owned firms on the probability of liberalization. Due to
the heterogeneity of support for the reforms among business groups, there is no straightforward prediction
about the influence of these firms on liberalization. We find that relative to unaffiliated private firms, the
group-owned firm stake variables have a negative and significant effect on the probability of
liberalization. Relative to state-owned firms, however, group-owned firms do not significantly reduce the
probability of liberalization. To save space, we do not report these results.
To investigate the interaction between state-owned firm stake and profitability and its effect on
probability of liberalization, we estimate the specification in Column (1) of Table 5 for two sub-samples:
industries with above-median firm profitability and industries with below-median firm profitability. We
do not include industry concentration in these regressions because the multicollinearity between the
Herfindahl index and SOE Sales Share in the smaller sub-samples makes inference difficult. The
results reported in Column (8) show that for industries with below-median state-owned firm profitability,
the coefficient of SOE Sales Share is not significant. In contrast, the results in Column (9) show that for
industries with above-median firm profitability, the effect of state-ownership stake on the probability of
liberalization is negative and significant at the 1% level. Comparing the coefficient estimates across the
two sub-samples, the reported likelihood ratio test statistic has a p-value of 0.013, which shows that the
estimated coefficients in columns (8) and (9) differ significantly across the two sub-samples. These
results are consistent with the private interest hypothesis that the government has an incentive to protect
large state-owned firms that earn monopoly profits.
23
In Column (10) we report results from a specification using the full sample where the right hand
side variables are interacted with a dummy variable that is equal to one if the industry belongs to the
above median profitability sample. The coefficient of SOE Sales Share interacted with the dummy
variable is negative and statistically significant at the 5% level, suggesting that the state has a greater
incentive to protect profitable state-owned firms.22
5.5. Does Industry Location Explain the Pattern of Liberalization?
An advantage of Indian data is the considerable regional variation in industrial, demographic, and
political characteristics across the different Indian states. We can use this variation to investigate whether
the decision to liberalize is influenced by the location of the incumbent firms likely to be affected by this
policy. Using data on 26 states and 96 industries, we estimate the following specification:
0 1 , 2 , 3 ,
4 , ,
Pr( 1) (
)
j j k j k j k
j k j k
Entry Liberalization Industry Share Concentration SOE Share
X
α α α α
α ε
= = Φ + + +
+ + (5)where Φ represents the standard normal cumulative distribution, j indicates the industry, and k indicates
the state. The Industry Share variables measure the proportion of output (workers, assets, and wages)
produced by each three-digit industrial category in each state as a share of total output (workers, assets,
and wages) across all industries in that state. This captures the relative importance of a particular industry
in each state. The Concentration and SOE Share variables capture the geographic concentration and stake
of state-owned firms in each state by industry. Finally, jkX represents a matrix of industry- and state-
level characteristics, including state-wise industry profitability and size, state per capita income, and
industry trade openness. Prowess has financial data on 536 industry-state observations, but including the
additional industry and state control variables in the regressions reduces the number to 469 industry-state
observations, and adding industry employment further reduces the number to 141 observations.
22 We also find that SOE Sales Share continues to be negatively correlated with the probability of liberalization when we control for industry assets and industry employment. We do not report these results to save space.
24
From the results reported in Table 6 we note that the probability of entry liberalization is
negatively correlated with the share of total state industrial output produced by an industry. The same
result is obtained for the asset, wage, and employment shares, Herfindahl index, and the profitability of an
industry in a state. We also find that the stake of state-owned enterprises in each state by industry has a
negative and highly significant impact on the probability of liberalization. These results suggest that the
influence of incumbent firms may depend on their location: If an industry is a significant employer and
producer in a state, it is less likely to be liberalized.
6. Additional Tests and Robustness Checks
6.1. The Impact of Contemporaneous Reforms
Foreign entry liberalization was implemented as part of a broader reform package in 1991. It is
therefore important to control for the effects of other aspects of the 1991 reforms. Trade liberalization in
particular can affect the competitive dynamics in industries and the viability of state-owned firms.
We include two measures to control for trade liberalization. The first variable (Industry Trade
Openness) is the ratio of exports plus imports to total sales in an industry, which captures the degree of
trade openness at the three-digit industry level. The second variable (Industry Change in Tariffs)
measures the percentage decrease in tariffs at the three-digit industry level between 1986-1990 and 1991-
1995.23 Tariff levels were reduced in 38 three-digit NIC categories, and foreign direct investment was
liberalized in 28 of these categories.
Controlling for trade liberalization at the industry level, the probability of liberalization remains
significantly negatively related to industry concentration (Table 4), to state-owned firm presence in an
industry (Table 5), and to geographic concentration (Table 6). The coefficient of Industry Change in
Tariffs is positive and significant (Tables 4 and 5, Column (11)), suggesting that industries in which tariff
23 Tariff barriers measure changes in tariffs between 1986–1990 and 1991–1995. Data on tariff changes are from Das (2003) and are based on: (1) Customs Tariff Working Schedule, Central Excise and Customs, Government of India and (2) Input-Output Transaction Table: 1983–1984 and 1989–1990, Central Statistical Organization, Government of India.
25
barriers are reduced are also more likely to be liberalized to foreign entry. Furthermore, industry
concentration and state ownership have a more pronounced impact on the probability of liberalization in
profitable industries after controlling for trade openness in Tables 4 and 5.
Two other reforms implemented in 1991 were the removal of licensing requirements allowing
domestic entry (de-licensing) and allowing private-sector firms to enter industries previously reserved for
state-owned firms (de-reservation). Licensing and reservation requirements were relaxed in nearly all
industries so the limited cross-sectional variation does not allow us to test whether particular industries
opposed these policy changes.
6.2. Alternative Measures of Industry Concentration
One issue that may arise is that the pre-reform industrial structure is a function of the past
political influence of industries. In this case our results may be capturing protection given by the state to
industries that were protected in the past, rather than the ability of these firms to keep out foreign
competition based on their current market power and ownership. To capture influence arising out of
industry concentration rather than past political ties, we use industry concentration in the United States as
an instrumental variable for industry concentration in India. Column (1) of Table 7 shows that the
coefficient of the Herfindahl index remains negative and significant when we treat it as endogenous in an
instrumental variable specification.
An alternative approach is to use “excess concentration,” the difference between Indian
concentration and U.S. concentration in the same industries, which measures market power above the
natural level of concentration in a well-developed financial market, such as the United States. Column (2)
of Table 7 examines whether excess concentration has explanatory power in determining the pattern of
liberalization in India. We find that the greater the excess concentration in India, the less likely it is that
an industry will be liberalized. Consistent with Rajan and Zingales (2003a, b), the results in Columns (1)
26
and (2) suggest that the state-led industrial policies of the past have created powerful incumbent firms that
use their current market power to oppose liberalization of foreign entry. 24
Table 7 also uses the four-firm sales concentration ratio and the four-firm asset concentration
ratio as alternative measures of industry concentration (Columns (3) and (4)). The results are similar to
those described previously: The estimated coefficients of the four-firm sales and the four-firm asset
concentration ratios are negative and statistically significant.
Although the liberalization policy was implemented at the 3-digit level of industry classification,
our data provide industry classification at the 4-digit level for many firms. As a robustness check, we
compute industry concentration disaggregated at the 4-digit level. The results are reported in column (5)
of Table 7 where the variable 4-digit Herfindahl Index remains negative and statistically significant. By
adjusting the standard errors for clustering at the 3-digit level, we are able to estimate unbiased
coefficients for the relationship between industry concentration at the 4-digit level and the probability of
liberalization at the 3-digit level.
As a final robustness check of our industry concentration measure, we construct the Herfindahl
index based on the four largest firms in a particular industry. Column (6) of Table 7 presents the results.
Industry concentration continues to be negatively correlated with the probability that an industry is
liberalized. The coefficient is significant at the 1% level.
6.3. Natural Monopolies and Strategic Industries
Finally, it also may be that the state does not reduce entry restrictions in some concentrated
industries because they are natural monopolies or of strategic national interest. As an additional
robustness check, we investigate the effect of concentration on the likelihood of entry liberalization by
excluding industries that belong to these categories from the estimations. Specifically, the estimations
24 In both the excess concentration measure and the instrumental variable specification, the U.S. measure is used to capture lobbying ability arising out of industry concentration, or the ability to overcome the free-rider problem in industries with fewer firms as in Olson (1969). Peltzman (1977) and Curry and George (1983) show that industry concentration is highly correlated with market power in U.S. industries.
27
exclude firms belonging to the electric, gas, and water utility companies; financial services industries; and
industries on the government’s strategic list. The results reported in Column (1) of Panels A and B of
Table 8 show that industry concentration continues to have a significant and negative effect on the
probability of entry liberalization when natural monopolies and strategic industries are excluded. Note
that in both panels of Table 8 the effect of industry concentration on the probability of liberalization is
more negative in more profitable industries (Columns (2) and (3)).
The result that state ownership reduces the likelihood of liberalization is robust to excluding
natural monopolies and strategic industries (Column (1)). Controlling for the presence of natural
monopolies and strategic industries, the results in Table 8 also confirm that the probability of
liberalization is significantly lower in industries with profitable state-owned firms (Columns (4) and (5)).
The inverse relation between entry liberalization and industry concentration continues to hold
when we include a dummy for strategic industries in the full sample. These results are not reported to
save space. A dummy for natural monopolies cannot be included in the regressions because no natural
monopolies were liberalized, and the dummy variable would perfectly predict the probability of
liberalization.
7. Concluding Remarks
A large theoretical and empirical literature characterizes foreign direct investment as the “good
cholesterol” in international capital flows (Hausmann and Fernandez-Arias, 2000; Albuquerque, 2003).
Yet many governments delay or fail to liberalize foreign direct investment. Political economy
explanations suggest that governments make socially suboptimal choices when policymakers face
pressures other than that of welfare maximization (Olson, 1965; Stigler, 1971; Peltzman, 1976). In
democracies, for instance, private interests may hijack the policy process to maintain their status or to
secure concessions in the face of big changes (Dahl, 1961; Tocqueville, 1835).
In 1991, the Government of India granted automatic approval for foreign direct investment of up
to 51% in 46 of 96 three-digit industrial categories. The liberalization of foreign direct investment is
28
likely to invoke considerable opposition from domestic firms and presents an ideal opportunity to
examine the effect of domestic incumbents on the policy process.
Our results suggest that the concentrated control of industrial assets and output by a few firms, as
well as the identity of incumbent firms, has a statistically significant influence on the pattern of entry
liberalization. Specifically, the state is more likely to retain foreign entry barriers in concentrated
industries and in industries with substantial state-owned presence. The results also suggest that incumbent
firms seek to protect monopoly profits because the likelihood of foreign entry liberalization is
significantly lower in concentrated industries that are profitable and in industries with profitable state-
owned firms.
In the last decade, many economies have implemented economic and financial sector reforms,
including stock market liberalization, privatization, and the liberalization of foreign direct investment.
There is a large literature that evaluates the effects of these reforms on firm performance and economic
growth. Thus, the question arises whether these reforms are random, as assumed by much of the literature,
or are an outcome of incumbent firm characteristics as shown in this paper.
29
References
Acemoglu, Daron, Simon Johnson, and James Robinson, 2005. “The Rise of Europe: Atlantic Trade, Institutional Change, and Economic Growth,” American Economic Review, 95(3), 546-579.
Ahluwalia, Montek S., 2005. “Lessons from India's Economic Reforms” in Development Challenges in
the 1990s–Leading Policymakers Speak from Experience, World Bank and Oxford University Press: Washington DC and Oxford, U.K.
Aitken, Brian and Ann Harrison, 1999. “Do Domestic Firms Benefit from Direct Foreign Investment?
Evidence from Venezuela," American Economic Review, 89(3), 605-618. Albuquerque, Rui, 2003. "The Composition of International Capital Flows: Risk Sharing through Foreign
Direct Investment," Journal of International Economics, 61, 353-383.
Baldwin, Robert E., 1885. The Political Economy of US Import Policy, MIT Press: Cambridge, MA. Bandhyopadhyay, Usree and Kishore Gawande, 2000. “Is Protection for Sale? A Test of the Grossman-
Helpman Theory of Endogenous Protection,” Review of Economics and Statistics, 82(1), 139-152.
Becker, Gary S., 1983. “A Theory of Competition among Pressure Groups for Political Influence,”
Quarterly Journal of Economics, 98(3), 371-400. Bekaert, Geert, Campbell Harvey, and Christian Lundblad, 2005. “Does Financial Liberalization Spur
Growth?” Journal of Financial Economics, 77, 3-56.
Boycko, Maxim, Andrei Shleifer, and Robert W. Vishny, 1996. “A Theory of Privatization,” The Economic Journal, 106(435), 309-319.
Branstetter, Lee and Robert Feenstra, 2002. "Trade and Foreign Direct Investment in China: A Political
Economy Approach," Journal of International Economics, 58(2), 335-358. Caves, Richard E., 1971. “International Corporations: The Industrial Economics of Foreign Investment,”
Economica, 38, 1-27.
Caves, Richard E., 1996. Multinational Enterprise and Economic Analysis, Cambridge University Press: Cambridge, U.K.
Cetorelli, Nicola and Philip E. Strahan, 2006. “Finance as a Barrier to Entry: Bank Competition and
Industry Structure in Local US Markets,” Journal of Finance, 61 (1), 437-461. B. Curry and K. D. George, 1983. “Industrial Concentration: A Survey,” Journal of Industrial Economics,
31 (3), 203-255. Dahl, Robert A., 1961. Who Governs? Democracy and Power in the American City, Yale University
Press: New Haven, CT. Das, Deb K., 2003. “Quantifying Trade Barriers: Has Protection Declined Substantially in Indian
Manufacturing?” Working Paper No. 105, ICRIER, New Delhi, India.

30
Dinc, I. Serdar and Nandini Gupta, 2006. “The Decision to Privatize: Finance, Politics, and Patronage,” Indiana University working paper.
Feijen, Erik and Enrico Perotti, 2005. “Lobbying on Exit: The Political Economy of Financial Fragility,”
working paper, University of Amsterdam.
Fisman, Raymond, 1998. “Estimating the Value of Political Connections,” American Economic Review, 91(4), 1095-1102.
Gawande, Kishore and Pravin Krishna, 2004. “The Political Economy of Trade Policy: Empirical
Approaches,” in E. K. Choi and James Hartigan (Eds.), Handbook of International Trade (Vol 2), Blackwell Publishing, Boston.
Geroski, P., 1991. “Domestic and Foreign Entry in the United Kingdom 1983-1984,” in P. A. Geroski and
J. Schwalbach (eds.), Entry and Market Contestability, 63-88, Blackwell: Oxford. Goldberg, Pinelopi K. and Giovanni Maggi, 1999. “Protection for Sale: An Empirical Investigation,”
American Economic Review, 89(5), 1135-1155. Grossman, Gene M. and Elhanan Helpman, 1994. “Protection for Sale,” American Economic Review,
84(4), 833-850.
Gupta, Nandini, 2005. “Partial Privatization and Firm Performance,” Journal of Finance, 60(2), 987-1015.
Hausmann, Ricardo and Eduardo Fernandez-Arias, 2000. "Foreign Direct Investment: Good
Cholesterol?" Inter-American Development Bank Working Paper No. 417. Joskow, Paul and Roger Noll, 1981. "Regulation in Theory and Practice: A Current Overview" in G.
Fromm (ed.), Studies in Public Regulation, MIT Press: Cambridge, MA.
Khanna, Tarun and Krishna Palepu, 2004. “The Evolution of Concentrated Ownership in India: Broad Patterns and a History of the Indian Software Industry,” NBER Working Paper No. 10613.
Kochanek, Stanley A., 1996a. “The Transformation of Interest Politics in India,” Pacific Affairs, 68(4),
529-550.
Kochanek, Stanley A., 1996b. “Liberalization and Business Lobbying in India,” Journal of Commonwealth and Comparative Politics, 34(3), 155-173.
Kroszner, Randall S. and Philip E. Strahan, 1999. “What Drives Deregulation? Economics and Politics of
the Relaxation of Bank Branching Restrictions,” Quarterly Journal of Economics, 114(4), 1437-1467.
La Porta, Rafael, Florencio Lopez-de-Silanes, Andrei Shleifer, and Robert Vishny, 1999. “Corporate
Ownership Around the World,” Journal of Finance, 54(2), 471-517. Megginson, William L., 2005. The Financial Economics of Privatization, Oxford University Press: NY.
Morck, Randall, Daniel Wolfenzon, and Bernard Yeung, 2004. “Corporate Governance, Economic
Entrenchment and Growth,” Journal of Economic Literature, 43, 657-722.
31
Office of the Economic Advisor, 2001. Handbook of Industrial Policy and Statistics, Government of India: New Delhi, India.
Olson, Mancur, 1965. The Logic of Collective Action: Public Goods and the Theory of Groups, Harvard
University Press: Cambridge, MA.
Pedersen, Jorgen D., 2000. “Explaining Economic Liberalization in India: State and Society Perspectives,” World Development, 28(2), 265-282.
Peltzman, Sam, 1976. “Toward a More General Theory of Regulation,” Journal of Law and Economics,
19, 109-148. Peltzman, Sam (1977). “The Gains and Losses from Industrial Concentration,” Journal of Law and
Economics, 20 (2), 229-263. Peltzman, Sam, 1989. “The Economic Theory of Regulation after a Decade of Deregulation,” Brookings
Papers: Microeconomics, Special Issue, 1-41.
Pigou, Alfred, 1938. The Economics of Welfare, 4th ed., Macmillan: London, U.K.
Rajan, Raghuram and Luigi Zingales, 1998. “Financial Dependence and Growth,” American Economic Review, 88, 559-586.
Rajan, Raghuram and Luigi Zingales, 2003a. “The Great Reversals: The Politics of Financial
Development in the Twentieth Century,” Journal of Financial Economics, 69, 5-50.
Rajan, Raghuram, and Luigi Zingales, 2003b. Saving Capitalism from the Capitalists, Random House: New York, NY.
Ramachandra, Usha, 1999. “Liberalisation Policies and Industrial Structure: The Petrochemical Industry
in India,” Finance India, 13, 931-934. Shleifer, Andrei and Robert Vishny, 1998. The Grabbing Hand: State Pathologies and Their Cures,
Harvard University Press: Cambridge, MA.
Shleifer, Andrei and Robert W. Vishny, 1994. “Politicians and Firms,” Quarterly Journal of Economics, 109(4), 995-1025.
Sivadasan, Jagadeesh, 2004. “Barriers to Entry and Productivity: Micro-evidence from Indian
Manufacturing Sector Reforms,” mimeo, University of Michigan.
Stigler, George J., 1971. “The Theory of Economic Regulation,” Bell Journal of Economics, 2(1), 3-21.
Stulz, René M., 2005. “Presidential Address: The Limits of Financial Globalization,” Journal of Finance,
60, 1595-1638. Tharoor, Shashi, 1997. India: From Midnight to the Millennium, Penguin Books: India. Tirole, Jean, 1988. The Theory of Industrial Organization, MIT Press: Cambridge, MA.
32
Tocqueville, Alexis de, 1835. Democracy in America. The Library of America, pp. 928.
Tripathi, Dwijendra, 2004. The Oxford History of Indian Business, Oxford University Press: New Delhi.
Veermani, Choorikkad, 2001. “Analysing Trade Flows and Industrial Structure of India: The Question of Data Harmonisation,” Centre for Development Studies Working Paper No. 321, Trivandrum, India.
The World Bank, 1991. World Development Indicators Database, World Bank: Washington, DC.
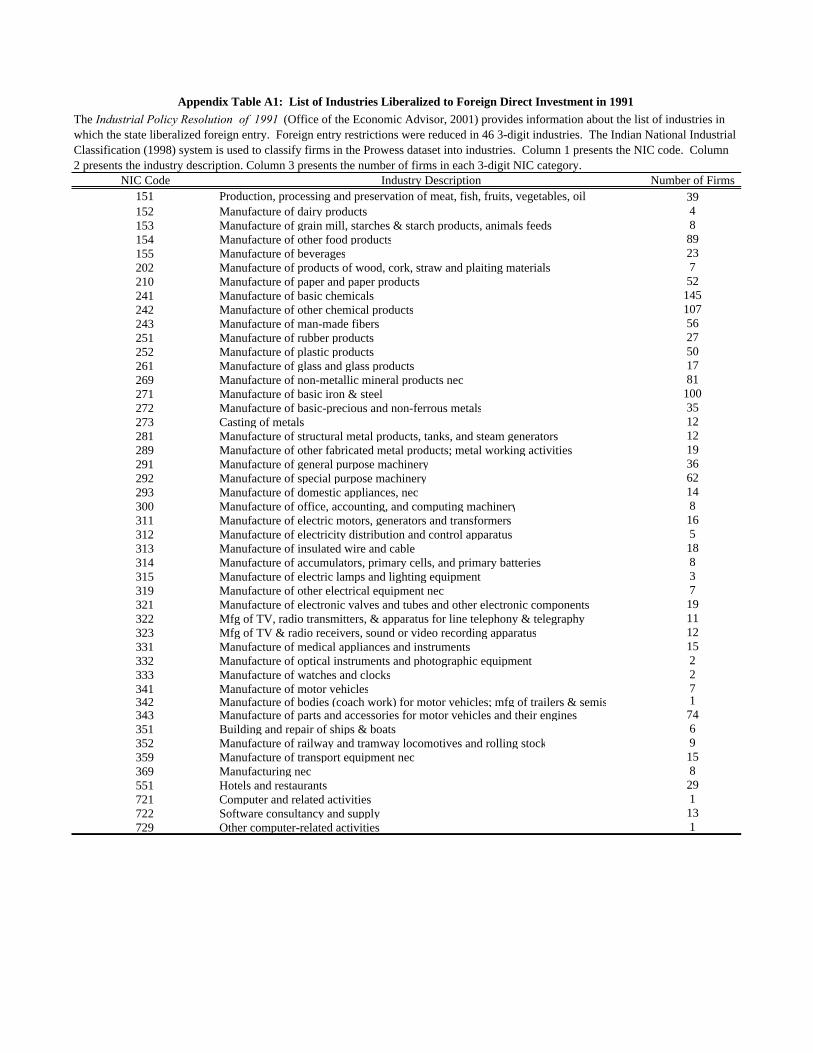
NIC Code Industry Description Number of Firms151 Production, processing and preservation of meat, fish, fruits, vegetables, oil 39152 Manufacture of dairy products 4153 Manufacture of grain mill, starches & starch products, animals feeds 8154 Manufacture of other food products 89155 Manufacture of beverages 23202 Manufacture of products of wood, cork, straw and plaiting materials 7210 Manufacture of paper and paper products 52241 Manufacture of basic chemicals 145242 Manufacture of other chemical products 107243 Manufacture of man-made fibers 56251 Manufacture of rubber products 27252 Manufacture of plastic products 50261 Manufacture of glass and glass products 17269 Manufacture of non-metallic mineral products nec 81271 Manufacture of basic iron & steel 100272 Manufacture of basic-precious and non-ferrous metals 35273 Casting of metals 12281 Manufacture of structural metal products, tanks, and steam generators 12289 Manufacture of other fabricated metal products; metal working activities 19291 Manufacture of general purpose machinery 36292 Manufacture of special purpose machinery 62293 Manufacture of domestic appliances, nec 14300 Manufacture of office, accounting, and computing machinery 8311 Manufacture of electric motors, generators and transformers 16312 Manufacture of electricity distribution and control apparatus 5313 Manufacture of insulated wire and cable 18314 Manufacture of accumulators, primary cells, and primary batteries 8315 Manufacture of electric lamps and lighting equipment 3319 Manufacture of other electrical equipment nec 7321 Manufacture of electronic valves and tubes and other electronic components 19322 Mfg of TV, radio transmitters, & apparatus for line telephony & telegraphy 11323 Mfg of TV & radio receivers, sound or video recording apparatus 12331 Manufacture of medical appliances and instruments 15332 Manufacture of optical instruments and photographic equipment 2333 Manufacture of watches and clocks 2341 Manufacture of motor vehicles 7342 Manufacture of bodies (coach work) for motor vehicles; mfg of trailers & semis 1343 Manufacture of parts and accessories for motor vehicles and their engines 74351 Building and repair of ships & boats 6352 Manufacture of railway and tramway locomotives and rolling stock 9359 Manufacture of transport equipment nec 15369 Manufacturing nec 8551 Hotels and restaurants 29721 Computer and related activities 1722 Software consultancy and supply 13729 Other computer-related activities 1
Appendix Table A1: List of Industries Liberalized to Foreign Direct Investment in 1991The Industrial Policy Resolution of 1991 (Office of the Economic Advisor, 2001) provides information about the list of industries in which the state liberalized foreign entry. Foreign entry restrictions were reduced in 46 3-digit industries. The Indian National Industrial Classification (1998) system is used to classify firms in the Prowess dataset into industries. Column 1 presents the NIC code. Column 2 presents the industry description. Column 3 presents the number of firms in each 3-digit NIC category.
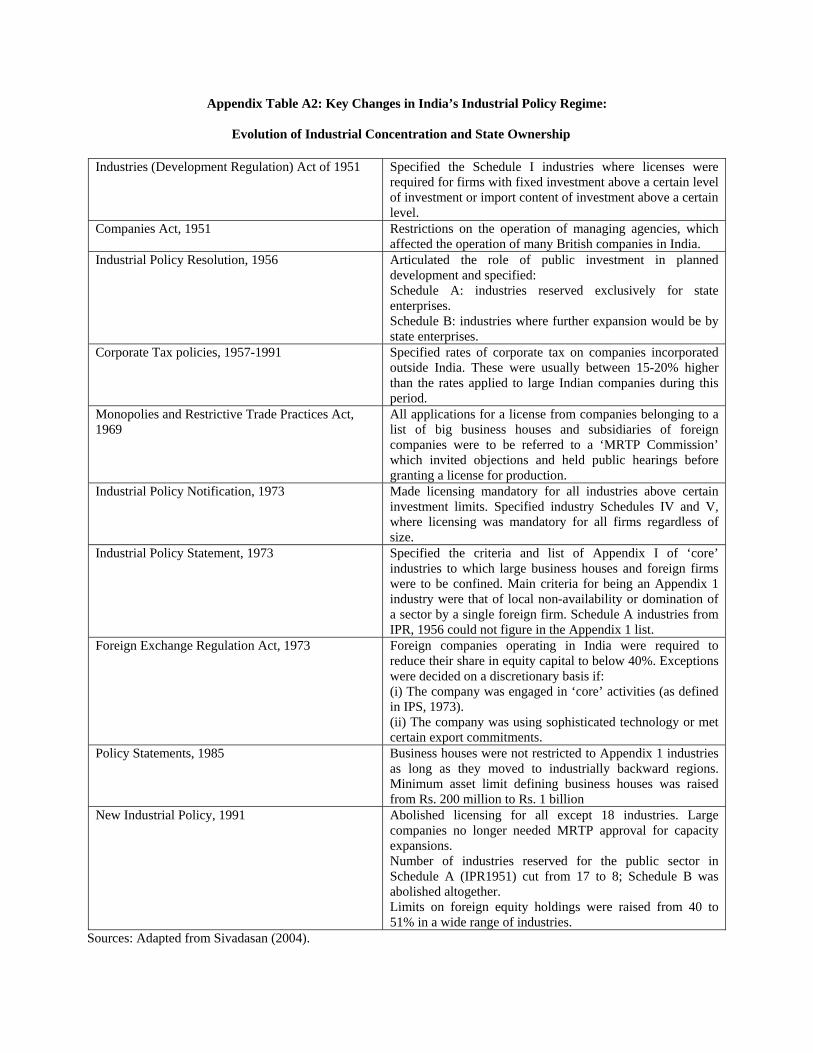
Appendix Table A2: Key Changes in India’s Industrial Policy Regime:
Evolution of Industrial Concentration and State Ownership Industries (Development Regulation) Act of 1951 Specified the Schedule I industries where licenses were
required for firms with fixed investment above a certain level of investment or import content of investment above a certain level.
Companies Act, 1951 Restrictions on the operation of managing agencies, which affected the operation of many British companies in India.
Industrial Policy Resolution, 1956 Articulated the role of public investment in planned development and specified: Schedule A: industries reserved exclusively for state enterprises. Schedule B: industries where further expansion would be by state enterprises.
Corporate Tax policies, 1957-1991 Specified rates of corporate tax on companies incorporated outside India. These were usually between 15-20% higher than the rates applied to large Indian companies during this period.
Monopolies and Restrictive Trade Practices Act, 1969
All applications for a license from companies belonging to a list of big business houses and subsidiaries of foreign companies were to be referred to a ‘MRTP Commission’ which invited objections and held public hearings before granting a license for production.
Industrial Policy Notification, 1973 Made licensing mandatory for all industries above certain investment limits. Specified industry Schedules IV and V, where licensing was mandatory for all firms regardless of size.
Industrial Policy Statement, 1973 Specified the criteria and list of Appendix I of ‘core’ industries to which large business houses and foreign firms were to be confined. Main criteria for being an Appendix 1 industry were that of local non-availability or domination of a sector by a single foreign firm. Schedule A industries from IPR, 1956 could not figure in the Appendix 1 list.
Foreign Exchange Regulation Act, 1973 Foreign companies operating in India were required to reduce their share in equity capital to below 40%. Exceptions were decided on a discretionary basis if: (i) The company was engaged in ‘core’ activities (as defined in IPS, 1973). (ii) The company was using sophisticated technology or met certain export commitments.
Policy Statements, 1985 Business houses were not restricted to Appendix 1 industries as long as they moved to industrially backward regions. Minimum asset limit defining business houses was raised from Rs. 200 million to Rs. 1 billion
New Industrial Policy, 1991 Abolished licensing for all except 18 industries. Large companies no longer needed MRTP approval for capacity expansions. Number of industries reserved for the public sector in Schedule A (IPR1951) cut from 17 to 8; Schedule B was abolished altogether. Limits on foreign equity holdings were raised from 40 to 51% in a wide range of industries.
Sources: Adapted from Sivadasan (2004).
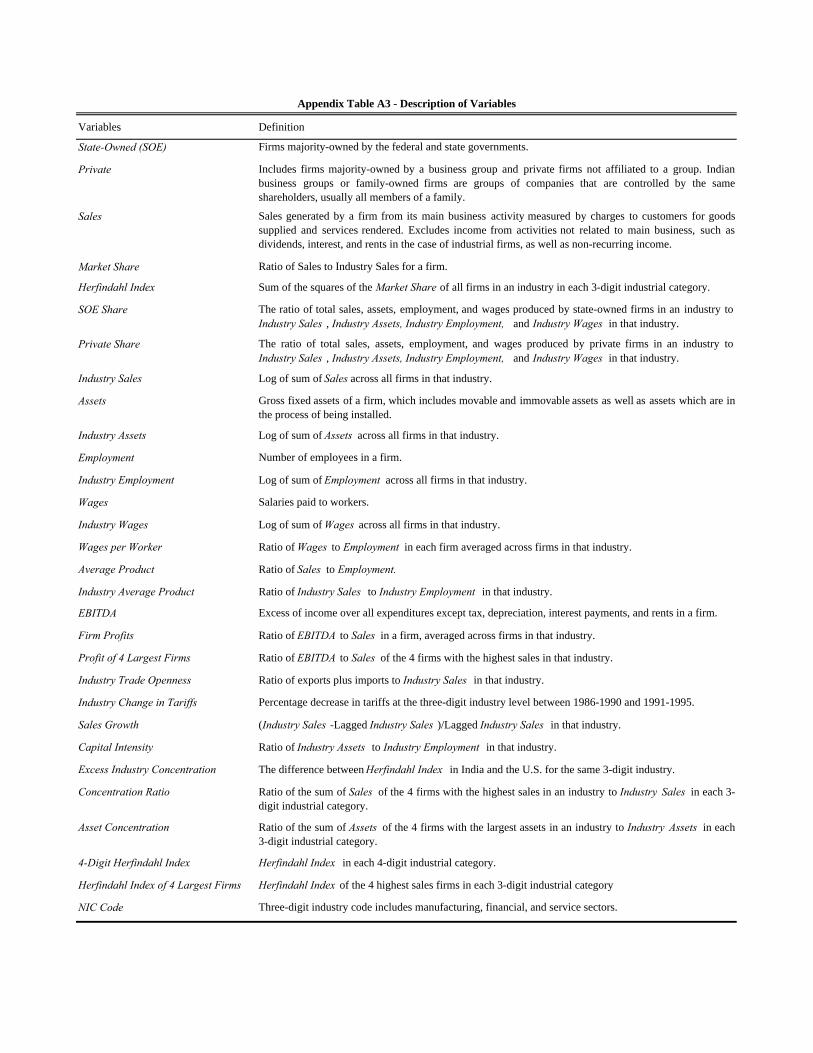
Variables Definition
State-Owned (SOE) Firms majority-owned by the federal and state governments.
Private Includes firms majority-owned by a business group and private firms not affiliated to a group. Indianbusiness groups or family-owned firms are groups of companies that are controlled by the sameshareholders, usually all members of a family.
Sales Sales generated by a firm from its main business activity measured by charges to customers for goodssupplied and services rendered. Excludes income from activities not related to main business, such asdividends, interest, and rents in the case of industrial firms, as well as non-recurring income.
Market Share Ratio of Sales to Industry Sales for a firm.
Herfindahl Index Sum of the squares of the Market Share of all firms in an industry in each 3-digit industrial category.
SOE Share The ratio of total sales, assets, employment, and wages produced by state-owned firms in an industry toIndustry Sales , Industry Assets, Industry Employment, and Industry Wages in that industry.
Private Share The ratio of total sales, assets, employment, and wages produced by private firms in an industry toIndustry Sales , Industry Assets, Industry Employment, and Industry Wages in that industry.
Industry Sales Log of sum of Sales across all firms in that industry.
Assets Gross fixed assets of a firm, which includes movable and immovable assets as well as assets which are inthe process of being installed.
Industry Assets Log of sum of Assets across all firms in that industry.
Employment Number of employees in a firm.
Industry Employment Log of sum of Employment across all firms in that industry.
Wages Salaries paid to workers.
Industry Wages Log of sum of Wages across all firms in that industry.
Wages per Worker Ratio of Wages to Employment in each firm averaged across firms in that industry.
Average Product Ratio of Sales to Employment.
Industry Average Product Ratio of Industry Sales to Industry Employment in that industry.
EBITDA Excess of income over all expenditures except tax, depreciation, interest payments, and rents in a firm.
Firm Profits Ratio of EBITDA to Sales in a firm, averaged across firms in that industry.
Profit of 4 Largest Firms Ratio of EBITDA to Sales of the 4 firms with the highest sales in that industry.
Industry Trade Openness Ratio of exports plus imports to Industry Sales in that industry.
Industry Change in Tariffs Percentage decrease in tariffs at the three-digit industry level between 1986-1990 and 1991-1995.
Sales Growth (Industry Sales -Lagged Industry Sales )/Lagged Industry Sales in that industry.
Capital Intensity Ratio of Industry Assets to Industry Employment in that industry.
Excess Industry Concentration The difference between Herfindahl Index in India and the U.S. for the same 3-digit industry.
Concentration Ratio Ratio of the sum of Sales of the 4 firms with the highest sales in an industry to Industry Sales in each 3-digit industrial category.
Asset Concentration Ratio of the sum of Assets of the 4 firms with the largest assets in an industry to Industry Assets in each3-digit industrial category.
4-Digit Herfindahl Index Herfindahl Index in each 4-digit industrial category.
Herfindahl Index of 4 Largest Firms Herfindahl Index of the 4 highest sales firms in each 3-digit industrial category
NIC Code Three-digit industry code includes manufacturing, financial, and service sectors.
Appendix Table A3 - Description of Variables
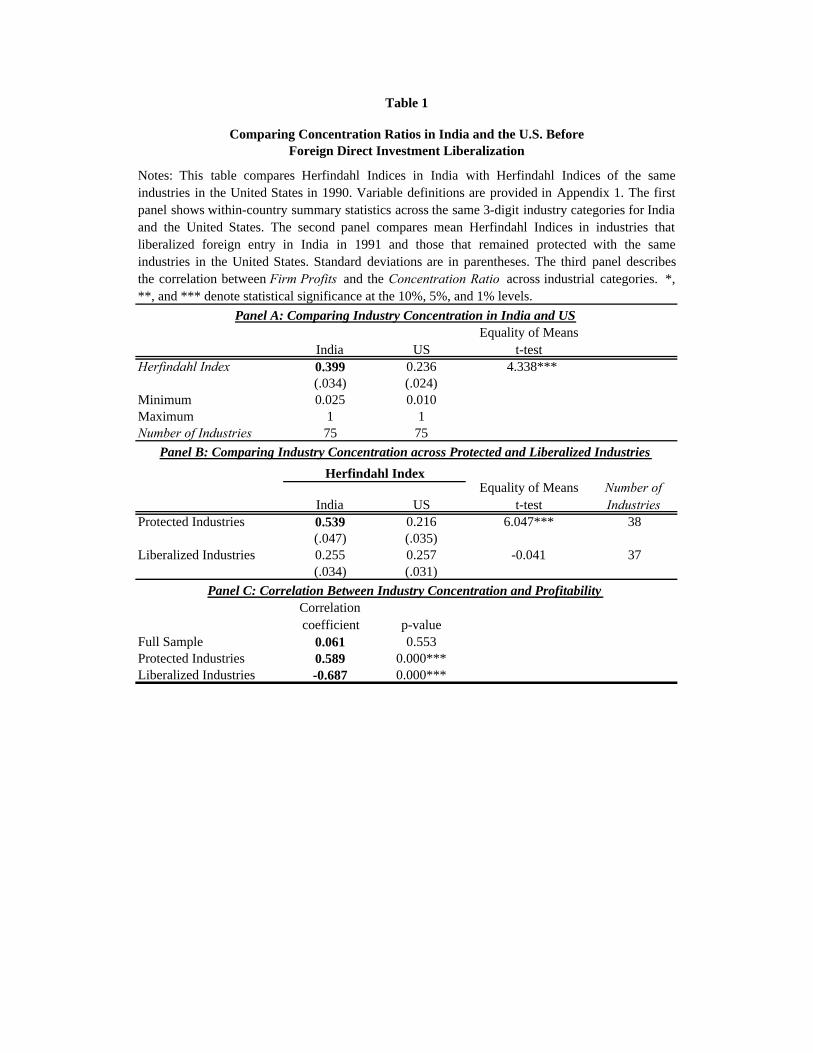
India USEquality of Means
t-testHerfindahl Index 0.399 0.236 4.338***
(.034) (.024)Minimum 0.025 0.010Maximum 1 1Number of Industries 75 75
India USEquality of Means
t-testNumber of Industries
Protected Industries 0.539 0.216 6.047*** 38(.047) (.035)
Liberalized Industries 0.255 0.257 -0.041 37(.034) (.031)
Correlation coefficient p-value
Full Sample 0.061 0.553Protected Industries 0.589 0.000***Liberalized Industries -0.687 0.000***
Herfindahl IndexPanel B: Comparing Industry Concentration across Protected and Liberalized Industries
Panel A: Comparing Industry Concentration in India and US
Panel C: Correlation Between Industry Concentration and Profitability
Table 1
Comparing Concentration Ratios in India and the U.S. Before Foreign Direct Investment Liberalization
Notes: This table compares Herfindahl Indices in India with Herfindahl Indices of the sameindustries in the United States in 1990. Variable definitions are provided in Appendix 1. The firstpanel shows within-country summary statistics across the same 3-digit industry categories for Indiaand the United States. The second panel compares mean Herfindahl Indices in industries thatliberalized foreign entry in India in 1991 and those that remained protected with the sameindustries in the United States. Standard deviations are in parentheses. The third panel describesthe correlation between Firm Profits and the Concentration Ratio across industrial categories. *,**, and *** denote statistical significance at the 10%, 5%, and 1% levels.
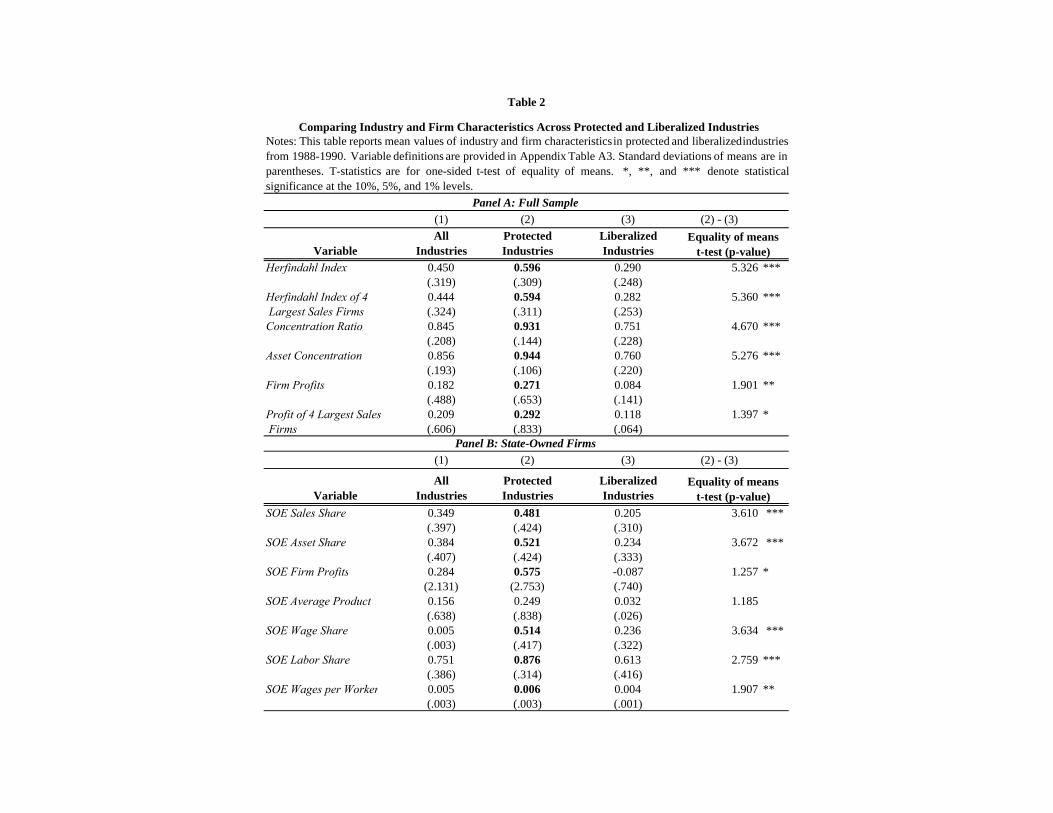
(1) (2) (3) (2) - (3)
VariableAll
IndustriesProtected Industries
Liberalized Industries
Herfindahl Index 0.450 0.596 0.290 5.326 ***(.319) (.309) (.248)
Herfindahl Index of 4 0.444 0.594 0.282 5.360 *** Largest Sales Firms (.324) (.311) (.253)Concentration Ratio 0.845 0.931 0.751 4.670 ***
(.208) (.144) (.228)Asset Concentration 0.856 0.944 0.760 5.276 ***
(.193) (.106) (.220)Firm Profits 0.182 0.271 0.084 1.901 **
(.488) (.653) (.141)Profit of 4 Largest Sales 0.209 0.292 0.118 1.397 * Firms (.606) (.833) (.064)
(1) (2) (3) (2) - (3)
VariableAll
IndustriesProtected Industries
Liberalized Industries
SOE Sales Share 0.349 0.481 0.205 3.610 ***(.397) (.424) (.310)
SOE Asset Share 0.384 0.521 0.234 3.672 ***(.407) (.424) (.333)
SOE Firm Profits 0.284 0.575 -0.087 1.257 *(2.131) (2.753) (.740)
SOE Average Product 0.156 0.249 0.032 1.185(.638) (.838) (.026)
SOE Wage Share 0.005 0.514 0.236 3.634 ***(.003) (.417) (.322)
SOE Labor Share 0.751 0.876 0.613 2.759 ***(.386) (.314) (.416)
SOE Wages per Worker 0.005 0.006 0.004 1.907 **(.003) (.003) (.001)
Equality of means t-test (p-value)
Equality of means t-test (p-value)
Table 2
Comparing Industry and Firm Characteristics Across Protected and Liberalized IndustriesNotes: This table reports mean values of industry and firm characteristicsin protected and liberalizedindustriesfrom 1988-1990. Variable definitions are provided in Appendix Table A3. Standard deviations of means are inparentheses. T-statistics are for one-sided t-test of equality of means. *, **, and *** denote statisticalsignificance at the 10%, 5%, and 1% levels.
Panel A: Full Sample
Panel B: State-Owned Firms

(1) (2) (3) (2) - (3)
VariableAll
IndustriesProtected Industries
Liberalized Industries
Private Sales Share 0.651 0.519 0.795 -3.610 ***(.397) (.424) (.310)
Private Asset Share 0.616 0.479 0.766 -3.672 ***(.407) (.424) (.333)
Private Firm Profits 0.165 0.222 0.112 2.642 ***(.198) (.263) (.082)
Private Average Product 0.241 0.096 0.299 -0.531(.900) (.068) (1.067)
Private Wage Share 0.619 0.486 0.764 -3.634 ****(.398) (.417) (.322)
Private Labor Share 0.249 0.124 0.387 -2.759 ***(.386) (.314) (.416)
Private Wages per Worker 0.009 0.005 0.010 -0.637(.019) (.002) (.023)
Equality of means t-test (p-value)
Table 2 continued
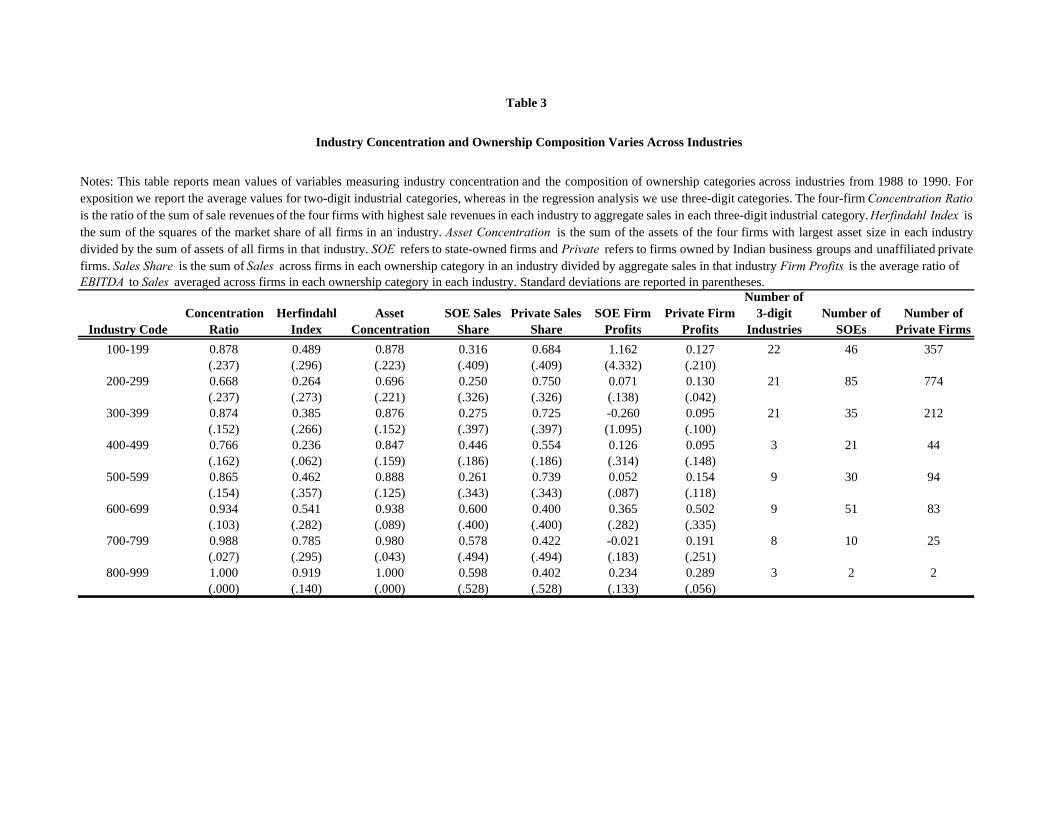
Industry CodeConcentration
RatioHerfindahl
IndexAsset
ConcentrationSOE Sales
SharePrivate Sales
ShareSOE Firm
ProfitsPrivate Firm
Profits
Number of 3-digit
IndustriesNumber of
SOEsNumber of
Private Firms100-199 0.878 0.489 0.878 0.316 0.684 1.162 0.127 22 46 357
(.237) (.296) (.223) (.409) (.409) (4.332) (.210)200-299 0.668 0.264 0.696 0.250 0.750 0.071 0.130 21 85 774
(.237) (.273) (.221) (.326) (.326) (.138) (.042)300-399 0.874 0.385 0.876 0.275 0.725 -0.260 0.095 21 35 212
(.152) (.266) (.152) (.397) (.397) (1.095) (.100)400-499 0.766 0.236 0.847 0.446 0.554 0.126 0.095 3 21 44
(.162) (.062) (.159) (.186) (.186) (.314) (.148)500-599 0.865 0.462 0.888 0.261 0.739 0.052 0.154 9 30 94
(.154) (.357) (.125) (.343) (.343) (.087) (.118)600-699 0.934 0.541 0.938 0.600 0.400 0.365 0.502 9 51 83
(.103) (.282) (.089) (.400) (.400) (.282) (.335)700-799 0.988 0.785 0.980 0.578 0.422 -0.021 0.191 8 10 25
(.027) (.295) (.043) (.494) (.494) (.183) (.251)800-999 1.000 0.919 1.000 0.598 0.402 0.234 0.289 3 2 2
(.000) (.140) (.000) (.528) (.528) (.133) (.056)
Table 3
Industry Concentration and Ownership Composition Varies Across Industries
Notes: This table reports mean values of variables measuring industry concentration and the composition of ownership categories across industries from 1988 to 1990. Forexposition we report the average values for two-digit industrial categories, whereas in the regression analysis we use three-digit categories. The four-firm Concentration Ratiois the ratio of the sum of sale revenues of the four firms with highest sale revenues in each industry to aggregate sales in each three-digit industrial category. Herfindahl Index is the sum of the squares of the market share of all firms in an industry. Asset Concentration is the sum of the assets of the four firms with largest asset size in each industrydivided by the sum of assets of all firms in that industry. SOE refers to state-owned firms and Private refers to firms owned by Indian business groups and unaffiliated privatefirms. Sales Share is the sum of Sales across firms in each ownership category in an industry divided by aggregate sales in that industry. Firm Profits is the average ratio of EBITDA to Sales averaged across firms in each ownership category in each industry. Standard deviations are reported in parentheses.
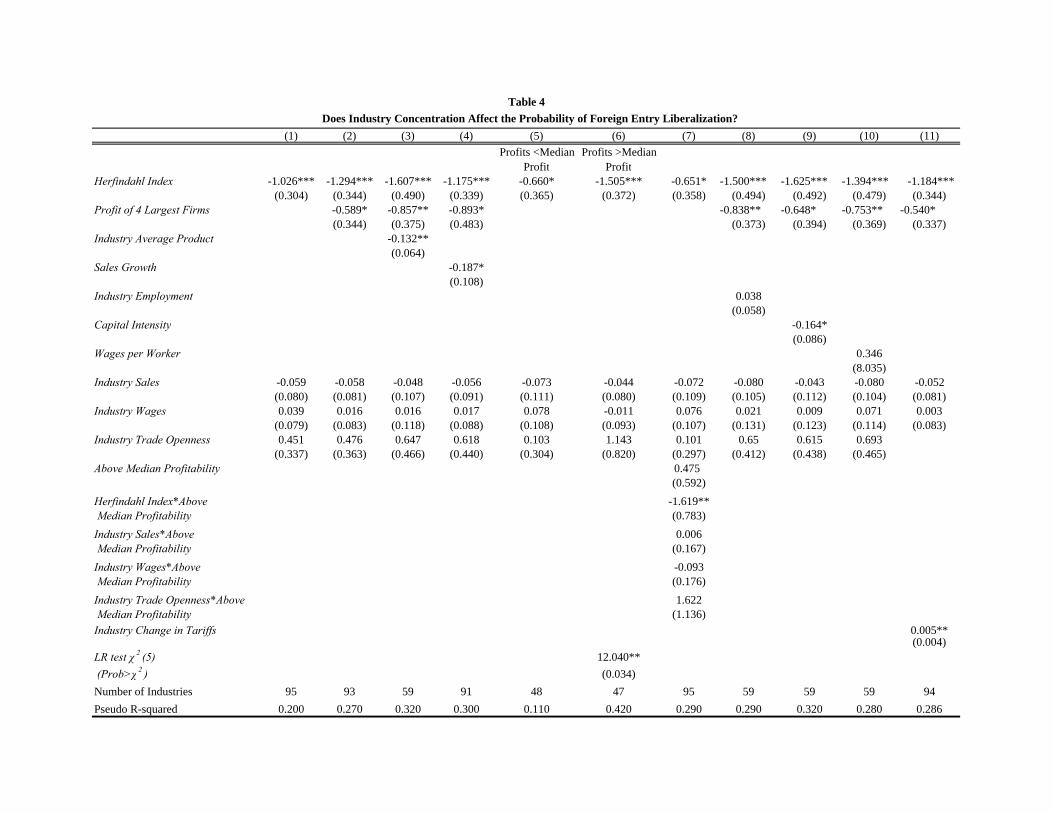
(1) (2) (3) (4) (5) (6) (7) (8) (9) (10) (11)Profits <Median
ProfitProfits >Median
ProfitHerfindahl Index -1.026*** -1.294*** -1.607*** -1.175*** -0.660* -1.505*** -0.651* -1.500*** -1.625*** -1.394*** -1.184***
(0.304) (0.344) (0.490) (0.339) (0.365) (0.372) (0.358) (0.494) (0.492) (0.479) (0.344)Profit of 4 Largest Firms -0.589* -0.857** -0.893* -0.838** -0.648* -0.753** -0.540*
(0.344) (0.375) (0.483) (0.373) (0.394) (0.369) (0.337)Industry Average Product -0.132**
(0.064)Sales Growth -0.187*
(0.108)Industry Employment 0.038
(0.058)Capital Intensity -0.164*
(0.086)Wages per Worker 0.346
(8.035)Industry Sales -0.059 -0.058 -0.048 -0.056 -0.073 -0.044 -0.072 -0.080 -0.043 -0.080 -0.052
(0.080) (0.081) (0.107) (0.091) (0.111) (0.080) (0.109) (0.105) (0.112) (0.104) (0.081)Industry Wages 0.039 0.016 0.016 0.017 0.078 -0.011 0.076 0.021 0.009 0.071 0.003
(0.079) (0.083) (0.118) (0.088) (0.108) (0.093) (0.107) (0.131) (0.123) (0.114) (0.083)Industry Trade Openness 0.451 0.476 0.647 0.618 0.103 1.143 0.101 0.65 0.615 0.693
(0.337) (0.363) (0.466) (0.440) (0.304) (0.820) (0.297) (0.412) (0.438) (0.465)Above Median Profitability 0.475
(0.592)Herfindahl Index*Above -1.619** Median Profitability (0.783)Industry Sales*Above 0.006 Median Profitability (0.167)Industry Wages*Above -0.093 Median Profitability (0.176)Industry Trade Openness*Above 1.622 Median Profitability (1.136)Industry Change in Tariffs 0.005**
(0.004)LR test χ 2 (5) 12.040** (Prob>χ 2 ) (0.034)Number of Industries 95 93 59 91 48 47 95 59 59 59 94Pseudo R-squared 0.200 0.270 0.320 0.300 0.110 0.420 0.290 0.290 0.320 0.280 0.286
Table 4Does Industry Concentration Affect the Probability of Foreign Entry Liberalization?
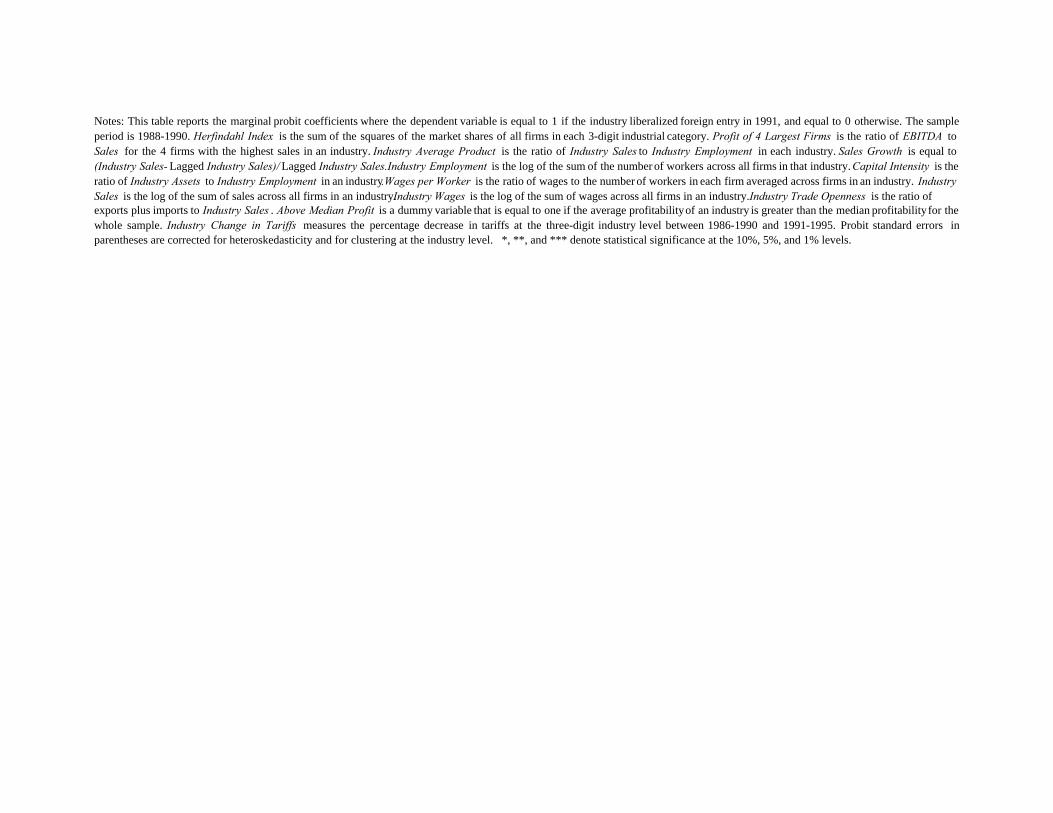
Notes: This table reports the marginal probit coefficients where the dependent variable is equal to 1 if the industry liberalized foreign entry in 1991, and equal to 0 otherwise. The sampleperiod is 1988-1990. Herfindahl Index is the sum of the squares of the market shares of all firms in each 3-digit industrial category. Profit of 4 Largest Firms is the ratio of EBITDA toSales for the 4 firms with the highest sales in an industry. Industry Average Product is the ratio of Industry Sales to Industry Employment in each industry. Sales Growth is equal to(Industry Sales- Lagged Industry Sales)/ Lagged Industry Sales.Industry Employment is the log of the sum of the number of workers across all firms in that industry. Capital Intensity is theratio of Industry Assets to Industry Employment in an industry.Wages per Worker is the ratio of wages to the number of workers in each firm averaged across firms in an industry. Industry Sales is the log of the sum of sales across all firms in an industry. Industry Wages is the log of the sum of wages across all firms in an industry. Industry Trade Openness is the ratio of exports plus imports to Industry Sales . Above Median Profit is a dummy variable that is equal to one if the average profitabilityof an industry is greater than the median profitability for thewhole sample. Industry Change in Tariffs measures the percentage decrease in tariffs at the three-digit industry level between 1986-1990 and 1991-1995. Probit standard errors inparentheses are corrected for heteroskedasticity and for clustering at the industry level. *, **, and *** denote statistical significance at the 10%, 5%, and 1% levels.
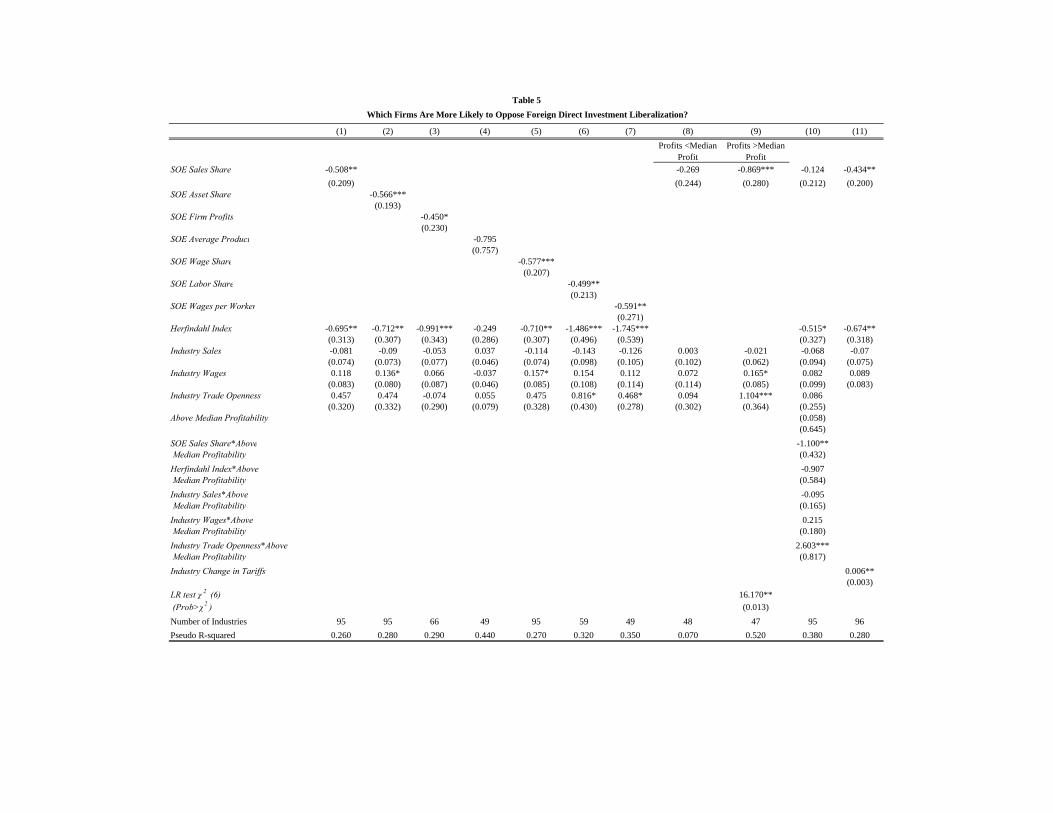
(1) (2) (3) (4) (5) (6) (7) (8) (9) (10) (11)Profits <Median
ProfitProfits >Median
ProfitSOE Sales Share -0.508** -0.269 -0.869*** -0.124 -0.434**
(0.209) (0.244) (0.280) (0.212) (0.200)SOE Asset Share -0.566***
(0.193)SOE Firm Profits -0.450*
(0.230)SOE Average Product -0.795
(0.757)SOE Wage Share -0.577***
(0.207)SOE Labor Share -0.499**
(0.213)SOE Wages per Worker -0.591**
(0.271)Herfindahl Index -0.695** -0.712** -0.991*** -0.249 -0.710** -1.486*** -1.745*** -0.515* -0.674**
(0.313) (0.307) (0.343) (0.286) (0.307) (0.496) (0.539) (0.327) (0.318)Industry Sales -0.081 -0.09 -0.053 0.037 -0.114 -0.143 -0.126 0.003 -0.021 -0.068 -0.07
(0.074) (0.073) (0.077) (0.046) (0.074) (0.098) (0.105) (0.102) (0.062) (0.094) (0.075)Industry Wages 0.118 0.136* 0.066 -0.037 0.157* 0.154 0.112 0.072 0.165* 0.082 0.089
(0.083) (0.080) (0.087) (0.046) (0.085) (0.108) (0.114) (0.114) (0.085) (0.099) (0.083)Industry Trade Openness 0.457 0.474 -0.074 0.055 0.475 0.816* 0.468* 0.094 1.104*** 0.086
(0.320) (0.332) (0.290) (0.079) (0.328) (0.430) (0.278) (0.302) (0.364) (0.255)Above Median Profitability (0.058)
(0.645)SOE Sales Share*Above -1.100** Median Profitability (0.432)Herfindahl Index*Above -0.907 Median Profitability (0.584)Industry Sales*Above -0.095 Median Profitability (0.165)Industry Wages*Above 0.215 Median Profitability (0.180)Industry Trade Openness*Above 2.603*** Median Profitability (0.817)Industry Change in Tariffs 0.006**
(0.003)LR test χ 2 (6) 16.170** (Prob>χ2 ) (0.013)Number of Industries 95 95 66 49 95 59 49 48 47 95 96Pseudo R-squared 0.260 0.280 0.290 0.440 0.270 0.320 0.350 0.070 0.520 0.380 0.280
Table 5Which Firms Are More Likely to Oppose Foreign Direct Investment Liberalization?
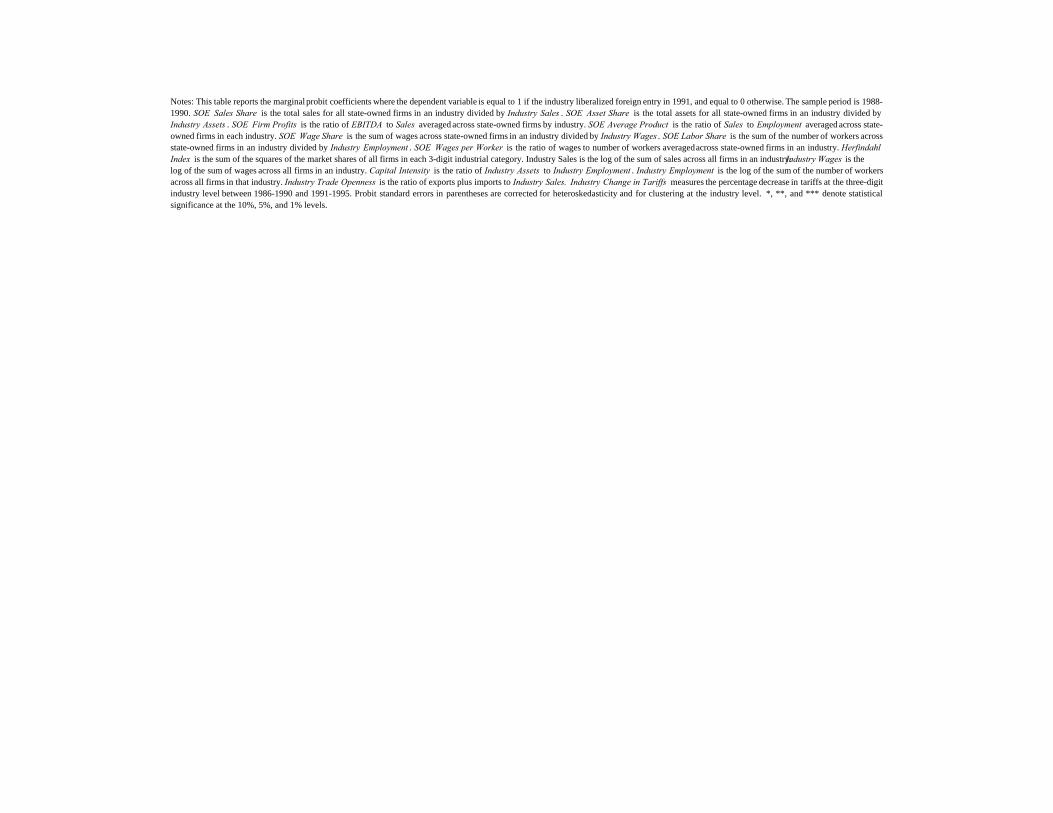
Notes: This table reports the marginalprobit coefficients where the dependent variable is equal to 1 if the industry liberalized foreign entry in 1991, and equal to 0 otherwise. The sample period is 1988-1990. SOE Sales Share is the total sales for all state-owned firms in an industry divided by Industry Sales . SOE Asset Share is the total assets for all state-owned firms in an industry divided byIndustry Assets . SOE Firm Profits is the ratio of EBITDA to Sales averaged across state-owned firms by industry. SOE Average Product is the ratio of Sales to Employment averaged across state-owned firms in each industry. SOE Wage Share is the sum of wages across state-owned firms in an industry divided by Industry Wages . SOE Labor Share is the sum of the number of workers acrossstate-owned firms in an industry divided by Industry Employment . SOE Wages per Worker is the ratio of wages to number of workers averagedacross state-owned firms in an industry. Herfindahl Index is the sum of the squares of the market shares of all firms in each 3-digit industrial category. Industry Sales is the log of the sum of sales across all firms in an industry. Industry Wages is the log of the sum of wages across all firms in an industry. Capital Intensity is the ratio of Industry Assets to Industry Employment . Industry Employment is the log of the sum of the number of workersacross all firms in that industry. Industry Trade Openness is the ratio of exports plus imports to Industry Sales. Industry Change in Tariffs measures the percentage decrease in tariffs at the three-digitindustry level between 1986-1990 and 1991-1995. Probit standard errors in parentheses are corrected for heteroskedasticity and for clustering at the industry level. *, **, and *** denote statisticalsignificance at the 10%, 5%, and 1% levels.
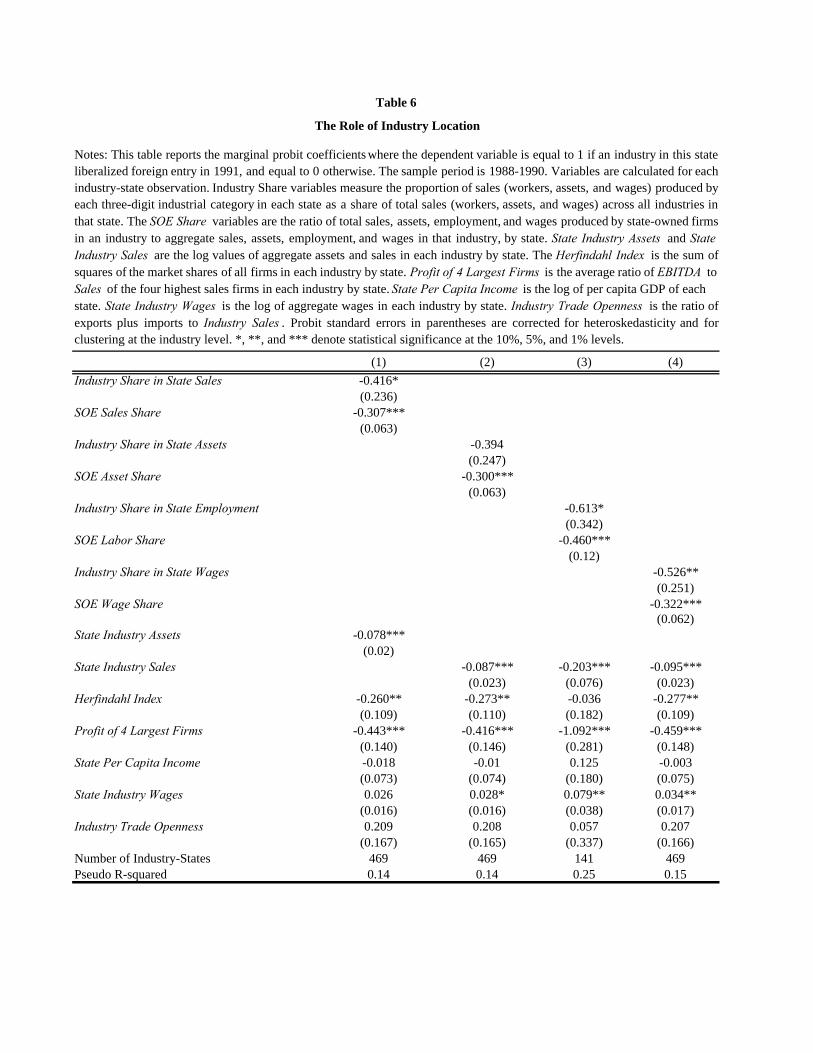
(1) (2) (3) (4)Industry Share in State Sales -0.416*
(0.236)SOE Sales Share -0.307***
(0.063)Industry Share in State Assets -0.394
(0.247)SOE Asset Share -0.300***
(0.063)Industry Share in State Employment -0.613*
(0.342)SOE Labor Share -0.460***
(0.12)Industry Share in State Wages -0.526**
(0.251)SOE Wage Share -0.322***
(0.062)State Industry Assets -0.078***
(0.02)State Industry Sales -0.087*** -0.203*** -0.095***
(0.023) (0.076) (0.023)Herfindahl Index -0.260** -0.273** -0.036 -0.277**
(0.109) (0.110) (0.182) (0.109)Profit of 4 Largest Firms -0.443*** -0.416*** -1.092*** -0.459***
(0.140) (0.146) (0.281) (0.148)State Per Capita Income -0.018 -0.01 0.125 -0.003
(0.073) (0.074) (0.180) (0.075)State Industry Wages 0.026 0.028* 0.079** 0.034**
(0.016) (0.016) (0.038) (0.017)Industry Trade Openness 0.209 0.208 0.057 0.207
(0.167) (0.165) (0.337) (0.166)Number of Industry-States 469 469 141 469Pseudo R-squared 0.14 0.14 0.25 0.15
Table 6
The Role of Industry Location
Notes: This table reports the marginal probit coefficients where the dependent variable is equal to 1 if an industry in this stateliberalized foreign entry in 1991, and equal to 0 otherwise. The sample period is 1988-1990. Variables are calculated for eachindustry-state observation. Industry Share variables measure the proportion of sales (workers, assets, and wages) produced byeach three-digit industrial category in each state as a share of total sales (workers, assets, and wages) across all industries inthat state. The SOE Share variables are the ratio of total sales, assets, employment, and wages produced by state-owned firmsin an industry to aggregate sales, assets, employment, and wages in that industry, by state. State Industry Assets and State Industry Sales are the log values of aggregate assets and sales in each industry by state. The Herfindahl Index is the sum ofsquares of the market shares of all firms in each industry by state. Profit of 4 Largest Firms is the average ratio of EBITDA to Sales of the four highest sales firms in each industry by state. State Per Capita Income is the log of per capita GDP of eachstate. State Industry Wages is the log of aggregate wages in each industry by state. Industry Trade Openness is the ratio ofexports plus imports to Industry Sales . Probit standard errors in parentheses are corrected for heteroskedasticity and forclustering at the industry level. *, **, and *** denote statistical significance at the 10%, 5%, and 1% levels.
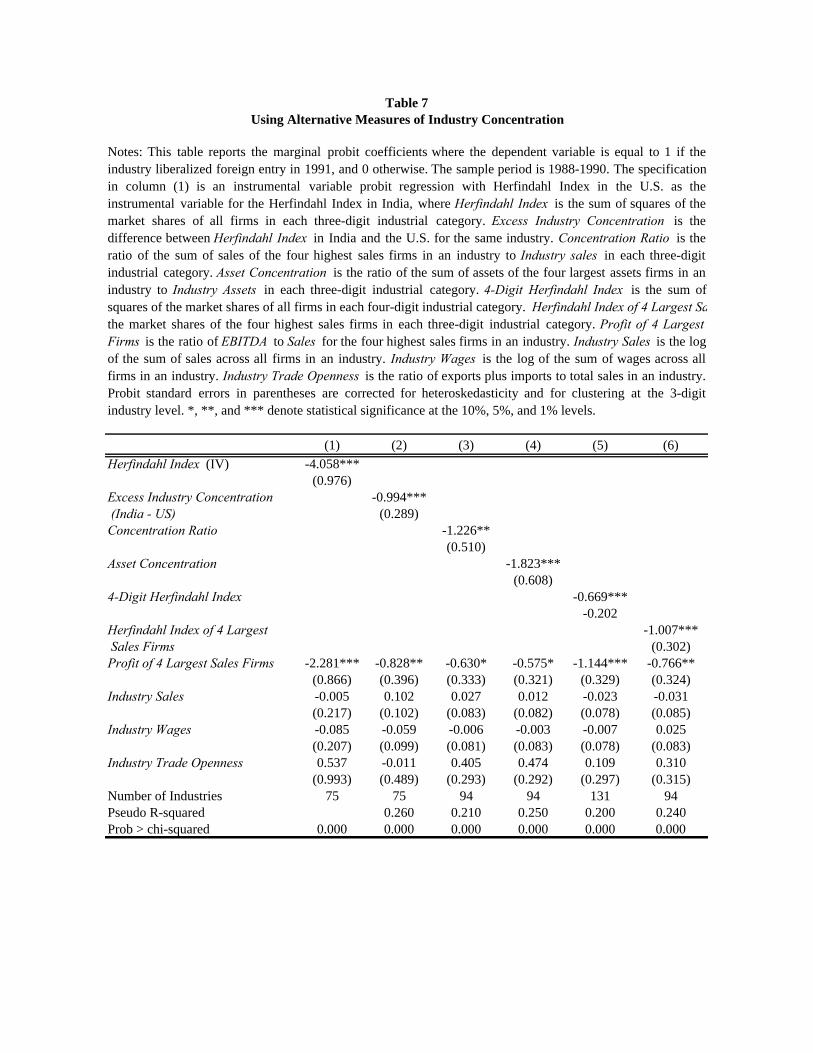
(1) (2) (3) (4) (5) (6)Herfindahl Index (IV) -4.058***
(0.976)Excess Industry Concentration -0.994*** (India - US) (0.289)Concentration Ratio -1.226**
(0.510)Asset Concentration -1.823***
(0.608)4-Digit Herfindahl Index -0.669***
-0.202Herfindahl Index of 4 Largest -1.007*** Sales Firms (0.302)Profit of 4 Largest Sales Firms -2.281*** -0.828** -0.630* -0.575* -1.144*** -0.766**
(0.866) (0.396) (0.333) (0.321) (0.329) (0.324)Industry Sales -0.005 0.102 0.027 0.012 -0.023 -0.031
(0.217) (0.102) (0.083) (0.082) (0.078) (0.085)Industry Wages -0.085 -0.059 -0.006 -0.003 -0.007 0.025
(0.207) (0.099) (0.081) (0.083) (0.078) (0.083)Industry Trade Openness 0.537 -0.011 0.405 0.474 0.109 0.310
(0.993) (0.489) (0.293) (0.292) (0.297) (0.315)Number of Industries 75 75 94 94 131 94Pseudo R-squared 0.260 0.210 0.250 0.200 0.240Prob > chi-squared 0.000 0.000 0.000 0.000 0.000 0.000
Table 7Using Alternative Measures of Industry Concentration
Notes: This table reports the marginal probit coefficients where the dependent variable is equal to 1 if theindustry liberalized foreign entry in 1991, and 0 otherwise. The sample period is 1988-1990. The specificationin column (1) is an instrumental variable probit regression with Herfindahl Index in the U.S. as theinstrumental variable for the Herfindahl Index in India, where Herfindahl Index is the sum of squares of themarket shares of all firms in each three-digit industrial category. Excess Industry Concentration is thedifference between Herfindahl Index in India and the U.S. for the same industry. Concentration Ratio is theratio of the sum of sales of the four highest sales firms in an industry to Industry sales in each three-digitindustrial category. Asset Concentration is the ratio of the sum of assets of the four largest assets firms in anindustry to Industry Assets in each three-digit industrial category. 4-Digit Herfindahl Index is the sum ofsquares of the market shares of all firms in each four-digit industrial category. Herfindahl Index of 4 Largest Sathe market shares of the four highest sales firms in each three-digit industrial category. Profit of 4 LargestFirms is the ratio of EBITDA to Sales for the four highest sales firms in an industry. Industry Sales is the logof the sum of sales across all firms in an industry. Industry Wages is the log of the sum of wages across allfirms in an industry. Industry Trade Openness is the ratio of exports plus imports to total sales in an industry.Probit standard errors in parentheses are corrected for heteroskedasticity and for clustering at the 3-digitindustry level. *, **, and *** denote statistical significance at the 10%, 5%, and 1% levels.
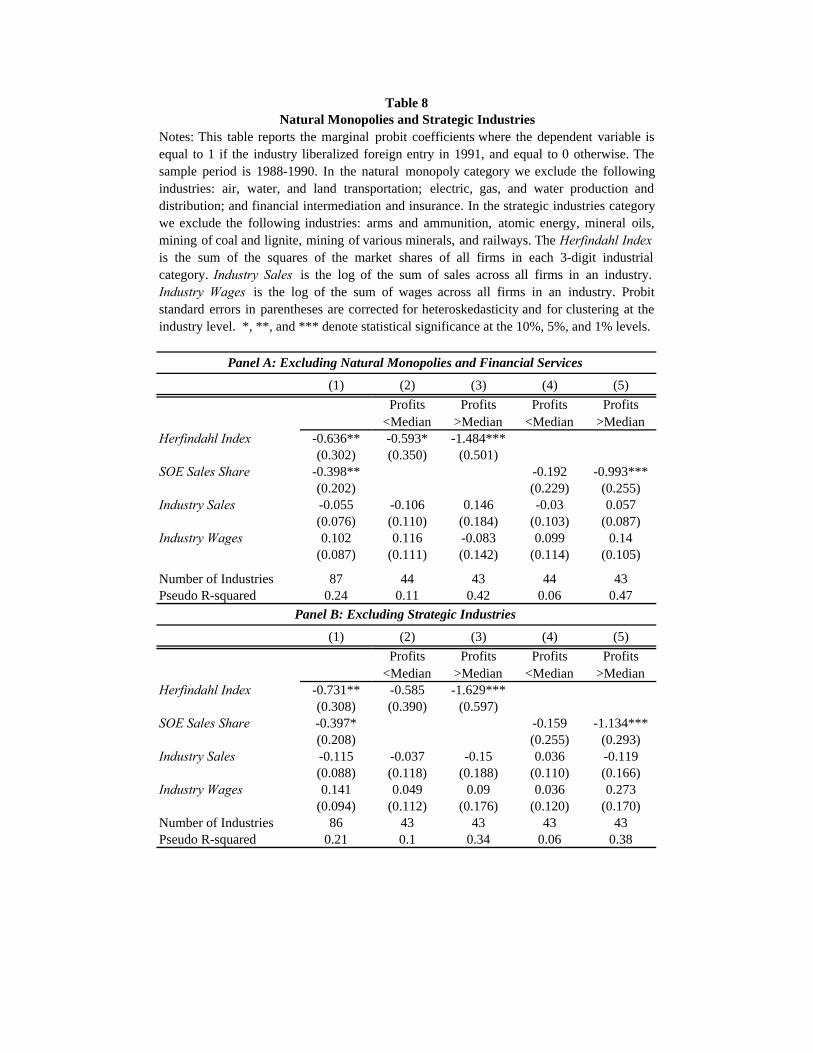
(1) (2) (3) (4) (5)Profits
<Median Profits
>Median Profits
<Median Profits
>Median Herfindahl Index -0.636** -0.593* -1.484***
(0.302) (0.350) (0.501)SOE Sales Share -0.398** -0.192 -0.993***
(0.202) (0.229) (0.255)Industry Sales -0.055 -0.106 0.146 -0.03 0.057
(0.076) (0.110) (0.184) (0.103) (0.087)Industry Wages 0.102 0.116 -0.083 0.099 0.14
(0.087) (0.111) (0.142) (0.114) (0.105)
Number of Industries 87 44 43 44 43Pseudo R-squared 0.24 0.11 0.42 0.06 0.47
(1) (2) (3) (4) (5)Profits
<Median Profits
>Median Profits
<Median Profits
>Median Herfindahl Index -0.731** -0.585 -1.629***
(0.308) (0.390) (0.597)SOE Sales Share -0.397* -0.159 -1.134***
(0.208) (0.255) (0.293)Industry Sales -0.115 -0.037 -0.15 0.036 -0.119
(0.088) (0.118) (0.188) (0.110) (0.166)Industry Wages 0.141 0.049 0.09 0.036 0.273
(0.094) (0.112) (0.176) (0.120) (0.170)Number of Industries 86 43 43 43 43Pseudo R-squared 0.21 0.1 0.34 0.06 0.38
Panel B: Excluding Strategic Industries
Table 8Natural Monopolies and Strategic Industries
Notes: This table reports the marginal probit coefficients where the dependent variable isequal to 1 if the industry liberalized foreign entry in 1991, and equal to 0 otherwise. Thesample period is 1988-1990. In the natural monopoly category we exclude the followingindustries: air, water, and land transportation; electric, gas, and water production anddistribution; and financial intermediation and insurance. In the strategic industries categorywe exclude the following industries: arms and ammunition, atomic energy, mineral oils,mining of coal and lignite, mining of various minerals, and railways. The Herfindahl Indexis the sum of the squares of the market shares of all firms in each 3-digit industrialcategory. Industry Sales is the log of the sum of sales across all firms in an industry.Industry Wages is the log of the sum of wages across all firms in an industry. Probit standard errors in parentheses are corrected for heteroskedasticity and for clustering at theindustry level. *, **, and *** denote statistical significance at the 10%, 5%, and 1% levels.
Panel A: Excluding Natural Monopolies and Financial Services