Embed Size (px)
Citation preview

REPORTIND
2014
Kerala Forest Department
STATUS OF TIGERS Co-Predators and Prey in the Wayanad Wildlife Sanctuary STATUS OF TIGERS Co-Predators and Prey in the Wayanad Wildlife Sanctuary

AuthorsRavi Kumar Narasimen, Ashok Kumar M, Peter Prem Chakravarthi Jayam,Sakthivel Chinnaiyan, Mohanraj Nagarathinam and Ajay A. Desai
Suggested citationNarasimen, R.K, Kumar, A.M, Jayam, P.P.C, Chinnaiyan, S, Nagarathinam, M and Desai, A. A (2013),Status of Tigers, Co-Predators and Prey in the Wayanad Wildlife Sanctuary, Kerala, India.
Designed byAspire Design | aspiredesign.inCover Photo Credit: Vijay Kumar/WWF-India
© WWF-India 2014
Published by WWF-IndiaAny reproduction in full or part of this publication must mention the title and credit the mentioned publisher as the copyright owner.

STATUS OF TIGERS Co-Predators and Prey in the Wayanad Wildlife Sanctuary

© W
WF-
InD
Ia
Tigers photographed during camera trapping
© W
WF-
InD
Ia

CONTENTSFOREWORD v
ACkNOWlEDGEmENT vI
INTRODUCTION 1
STUDy AREA 3
mEThODS 5 Density & Abundance of Tigers 5
DATA ANAlySIS 9
RESUlTS 11
ESTImATES OF TIGER AbUNDANCE & DENSITy 11
AbUNDANCE & DENSITy 12 Closure 12 Abundance Estimate 12 Tiger Density Estimate 12
DISCUSSION 15
REFERENCES 17
APPENDICES 19 Appendix 1 19 Details of pictures from camera traps 19 Appendix 2 21 Aspatial density estimates using ½ mmDm method 21 Appendix 3 22 human-carnivore conflict 22 Appendix 4 23 Training on the field survey 23 Appendix 5 24 Tiger individuals photographed during camera trapping. 24 Appendix 5 48 leopards individuals photographed during camera trapping. 48

© M
er
aj
an
Wa
r /
WW
F-In
DIa

FOREWORD
The tiger is the pride of India. Its feline grace and majestic presence have long defined the jungle experience. However, tigers continue to face many threats that pose challenges to their long-term survival. From poaching to habitat loss and blockage of movement corridors to human-tiger conflict, the challenges are many. But there are solutions. For long term survival of tiger populations, effective management that takes into account regular scientific monitoring, protection and enforcement is needed.
The Wayanad Wildlife Sanctuary of Kerala is located in one of the most important tiger landscapes in the world harbouring perhaps the largest contiguous tiger population in India. Apart from tigers, these forests are home to a diverse array of floral and faunal species underlining the status of the Western Ghats as a global Biodiversity Hotspot.
This report provides the results of a tiger monitoring study undertaken jointly by the Kerala Forest Department and WWF-India. The results of the study throw up some surprises with the unexpectedly high density of tigers found in the Sanctuary being the most interesting one. But as the authors rightly point out further intensive monitoring in the surrounding Reserve Forests will be needed to understand the attributes of such high density of tigers in the Sanctuary. Steps will also need to be taken to address the potential threat of human-wildlife conflict in an effective manner.
I congratulate the untiring efforts of the dedicated staff of the Kerala Forest Department in protecting the wildlife of these forests. The partnership between the Forest Department and WWF-India is an excellent example of collaboration for the larger cause of tiger conservation. I hope that the partnership will continue to yield rich dividends and ultimately benefit the local communities while ensuring a safe and secure future for the tigers of the region.
Ravi SinghSecretary General and CEOWWF-India
v

ACkNOWlEDGEmENTWe are thankful to the Kerala Forest Department for providing us the requisite permission and cooperation in the field to conduct this study successfully. We thank the Ministry of Environment and Forests, Government of India and National Tiger Conservation Authority (NTCA) for allowing us to monitor tigers in Wayanad.
We sincerely thank Shri. N.V. Trivedi Babu, IFS (then CWLW) and Shri V. Gopinathan, IFS, PCCF for their support and permission for the study. We extend our gratitude to Chief Conservator of Forests (Wildlife), North Circle Palakad, Shri O.P. Kaler, IFS for making this a collaborative effort between Kerala Forest Department and WWF India, and for his continuous support throughout the study. We are also thankful to Shri Roy P. Thomas, IFS,Wildlife Warden, Wayanad, Wildlife Sanctuary, for his constant support.
We would like to thank the former Wildlife Warden of Wayanad Wildlife Sanctuary, Shri K. K. Sunil Kumar, and, Shri Sreevalsan for their continuous support throughout the project. We extend our sincere gratitude to Dr. Arun Zachariah, Assistant Forest Veterinary Officer, Wayanad, for all assistance provided during the project.
We are grateful to the Assistant Wildlife Warden, Mr. G. Pradeep Kumar of Muthanga, Mr. P. Ravi of Bathery Range, Mr. K. Joshil of Kuruchiat Ranges, Mr. R.T. Roy, Deputy Ranger of Bathery, Deputy Ranger Arulash and Mr. Dinesh Shankar of Kurichiat. We also are thankful to the Assistant Wildlife Wardens, Mr. P. K. Anoop Kumar and Ms. Shajana of Tholpetty for logistic support in field.
We would like to thank the following for helping us throughout the study and supporting us at various camps during our field work: Mr. Sasi, Forester; K.C. Manoj, Forest Guard, Mr. P.K. Rajiv; Forest Watcher and Mr. K. Vasu, Anti-Poaching Watcher of Muthanga range; Foresters Mr. P. Amjit, Mr. N.N. Unni, Mr. T.P. Pramod Kumar and Mr. T. Rameshan of Bathery Range; Mr. Iqbal, Mr. Lathish, Mr. Sridharan and Mr. Sajee M. Joseph and Forest Guards Mr..Krishnan,Mr. Prakasan, Mr. Dinesh and Mr. Manoj of Kurichiat Range and Foresters, Mr. Bijunath, Mr. V.R. Shaji, Mr. Nijesh, Forest Guards Mr. Madavan, Mr. O. Rajiv, Mr. Manoj Kumar, Mr. K.A. Ramakrishnan and Mr. Joseph and plot watcher Mr. Sivaraj.
We are grateful to Mr. Sudhagar, Field Biologist, for carrying out the field survey along with the team. Mr. Gopalan, elephant mahout Mr. Babu, Mr. Sisubalan, Mr. Balraj, Field Trackers, helped us in the field surveys and also took care of camp duties. We would also like to thank Mr. Selvaraj, Accountant, who helped us in maintaining the accounts.
From WWF-India, our sincere thanks to Mr. Ravi Singh, SG & CEO, Dr. Sejal Worah, Director, Programmes for their support throughout the project. We thank Dr. Dipankar Ghose, Director, Species & Landscapes Programme and Mr. Joseph Vattakaven, Tiger Conservation Advisor, WWF-TAI and Dr. Jimmy Borah, Tiger Coordinator for technical guidance, dealing with donors and in assisting with budgeting and getting equipment. We would also like to thank Dr. Bivash Pandav for constantly encouraging us and providing technical support during the initial phases
vi | STATUS OF TIGERS, CO-PREDATORS AND PREy IN ThE WAyANAD WIlDlIFE SANCTUARy, kERAlA

of the project. We are grateful to Dr. Rashid Raza for his specific inputs in improving the technical analysis of the report. We thank Mr. Anil Cherukupalli, Communications Manager, Species & Landscapes Programme for his help in editing the report. We are deeply grateful to Mr. Paul Peter Predit and Mr. Veluswamy for all the support in carrying out the fi eld surveys as well as for other logistic assistance.
An earlier draft of this report was carefully reviewed by Dr. Ullas Karanth and his colleagues which led to improvement and convergence of analytical methods. We thank Dr. Karanth, Dr. Samba Kumar, Mr Devchran Jethana and Mr. Narendra Patil, of Wildlife Conservation Society-India & Centre for Wildlife Studies, for their efforts.Finally, we would like to sincerely thank WWF-UK for funding the project without which the tigers of Wayanad Wildlife Sanctuary would not have come to light.
vii

© W
WF-
InD
Ia
approximately
50% of the world's wild tiger population and western ghats landscape is one of the most important tiger landscapes in the world
India supports

INTRODUCTION
Tigers (Panthera tigris) function as flagship species, generating significant public and government support for their conservation. This directly benefits the conservation of all biodiversity that co-exists within their habitat. Further, they also function as a good umbrella species for conservation as they are habitat generalists with large spatial re-quirements and range from the colder climates of Siberia (in Russia) to the dry and hot semi-arid regions of western India and the parts of peninsular India. They are there-fore present in many of the eco-regions in Asia and their conservation facilitates the conservation of such biota. The role of top predators in an ecosystem in maintaining biodiversity has been highlighted by several food web modelling studies, highlighting that additional extinctions are triggered by extermination of top predators (Borrvall and Ebenman, 2006; Chesson and Kuang, 2008). Therefore, they can also be consid-ered as keystone species critical to maintain ecosystem processes.
Despite its large human population of over a billion people, India supports approxi-mately 50% of the world’s wild tiger population. Tigers require large forest habitats for their conservation, as they are large solitary territorial carnivores, which require a large prey base to support them. A majority of the Tiger Reserves (TRs) and Pro-tected Areas (PAs) in India are less than 1000 km2 and this may be too small an area to support genetically viable populations for long-term conservation. While it is almost certain that there may be only a handful of sites with populations large enough to make them suitable for long term conservation, it is possible to overcome such issues through meta-population management.
The Western Ghats were historically a good habitat for the tiger, which was distributed throughout its forests (Jhala et al. 2011). The northern parts of the Western Ghats have lost most of their tigers and at present tigers mainly persist in the southern part. The Western Ghats are recognized as a global Biodiversity Hotspot (Mittermeier, et al., 1999; Myers et al., 2000). In the southern part of the Western Ghats, at the tri-junction of the three southern states of India, namely Tamil Nadu, Karnataka and Kerala, lies the Nilgiri Biosphere Reserve (NBR). NBR is the first Biosphere Reserve to be declared in India (in September 1986) under the UNESCO’s Man and Biosphere program. The NBR landscape covers a significant part of two Global 200 Ecoregions (Olson and Dinerstein, 2002), South Western Ghats Moist Forests and the West-ern Ghats Rivers and Streams (both listed as critically endangered). The NBR has a significant number of endemic species (248 species) and supports most of the large mammals found in peninsular India, including a host of Red Data Book species; 55 Critically Endangered species and 148 Endangered species, and 127 species listed as Vulnerable (CEPF, 2004).
The NBR also has the distinction of supporting the world’s largest Asian elephant population, an estimated ~ 8000 - 9000 elephants (Rangarajan et al., 2010). To safe-
WAyNAD FORmS AN ImPORTANT PART
OF ONE OF ThE mOST ImPORTANT
TIGER lANDSCAPES
1

guard the elephant population in this landscape, Wayanad Elephant Reserve has been established, the Wayanad Wildife Sanctuary forms a part of the elephant reserve.
For this forest complex, Jhala et al (2011) have reported tiger occupancy of 11,100 km2, holding the largest contiguous tiger population in India (estimate 382, 95% CI 354-411) and perhaps the world. The Wayanad Wildlife Sanctuary is a part of this large forest complex and it is also part of a PA cluster consisting of Nagarhole, Mudumalai and Bandipur Tiger Reserves and Wayanad Wildlife Sanctuary.
The Wayanad Wildlife Sanctuary lies within Kerala and tiger occupancy in this land-scape was reported to be 2387 km2 with an estimated population of 40 (37-43) tigers (Jhala et al., 2011).
The Wayanad Wildlife Sanctuary shares its north-eastern border with Karnataka and is contiguous with parts of Bandipur and Nagarhole Tiger Reserves of Karnataka and on the south- eastern side it is contiguous with Mudumalai Tiger Reserve of Tamil Nadu. Wayanad also has connectivity to the Silent Valley National Park in Kerala through the Mudumalai Tiger Reserve and Mukurthi NP in Tamil Nadu (Figure 1).
Though Wayanad is part of Nilgiri Biosphere Reserve and is adjacent to Nagarhole, Bandipur and Mudumalai Tiger Reserves, not much attention has been paid to system-atic evaluation of status of tigers. Since Wayanad forms an important part of arguably one of the most important tiger landscapes, it is vital to systematically sample the tiger population to establish baselines for monitoring of conservation efforts.
Thus the primary objective of the study was;
• To estimate the population abundance and density of tigers in the Wayanad Wild-life Sanctuary
A linked objective was;
• To build the capacity of the Kerala State Forest Department staff at different levels for sustaining future monitoring exercises (details of the training are provided in Appendix 4)
The tiger density and abundance assessment carried out in Wayanad Wildlife Sanctuary is a collaborative effort between the Kerala State Forest Department, WWF– India and the National Tiger Conservation Authority (NTCA). This study is the first to systematically sample tiger population in Wayanad.
2 | STATUS OF TIGERS, CO-PREDATORS AND PREy IN ThE WAyANAD WIlDlIFE SANCTUARy, kERAlA

The Wayanad Wildlife Sanctuary (hereafter referred to as “Wayanad”) was established in 1973 and encompasses an area of 344.44 km2. Wayanad is located between 76° 02’ and 76° 27 ‘ E longitude and 11°35’ and 11° 51’ N latitude.
Wayanad is made up of two discontinuous parts; the larger part, which lies to the south, consists of Muthanga Range, Sulthan Bathery Range and Kurichiat Range (hereafter referred to as “Wayanad South”) of Wayanad Wildlife Division and con-tributes approx. 77% of the area. Disconnected from these three ranges and further to the north, lies the Tholpetty Range of Wayanad Wildlife Division. The two parts are not connected by forests on the Kerala side of the border. The intervening area on the Kerala side of the border consists of agricultural land, coffee estates, and settlements but also patches of Reserve Forest. The two patches are approximately 12 km apart at the closest. Connectivity between the two patches, however, exists through the Bandi-pur Tiger Reserve and the Nagarhole Tiger Reserve on the Karnataka side of the border (Figure 1).
Wayanad is contiguous to several large Protected Areas (PA). To the east and north, it is contiguous with Bandipur Tiger Reserve and Nagarhole Tiger Reserve of Karnataka, and on the south east it is contiguous with Mudumalai Tiger Reserve of Tamil Nadu
STUDy AREA
FIGURE 1 Wayanad WlS and surrounding
Protected Areas
Kurlchiat
3

The altitude in Wayanad ranges from 650m to 1158m above mean sea level, the high-est peak being Karottimala at 1158m. The terrain is gently undulating with small hills interspersed with many swampy valleys. Several perennial streams drain it. Wayanad receives fairly high rainfall of 3000 mm to 4000 mm annually, mostly from the south-west monsoon. High velocity winds are common during the southwest monsoon. Rela-tive humidity reaches it maximum at 95% during the southwest monsoon period. The slightly higher elevations are fairly cold during the winter (November-December).
Two types of vegetation dominate Wayanad - South Indian Tropical Moist Deciduous Forest and Semi-evergreen Forest (Champion and Seth, 1968). The moist deciduous forests are dominated by the Tectona-Dillenia-Lagerstroemia species composition. The other main species here are Dalbergia latifolia, Pterocarpus marsupium, Termi-nalia paniculata and Bambusa arundinacea. Semi evergreen forests are dominated by tree species such as Veteria indica, Lagerstroemia lanceolata and Termianalia paniculata. About 110 km2 (approximately 30%) of the sanctuary is under plantations of Teak and Eucalyptus.
Wayanad supports an impressive assemblage of herbivore prey species; elephant El-ephas maximus, gaur Bos gaurus, chital Axis axis, sambar Rusa unicolor, barking deer Muntiacus muntjak, wild pig Sus scrofa and two species of primates: common langur Semnopithecus entellus and bonnet macaque Macaca radiata. Large predators present here are tiger, leopard Panthera pardus and Asiatic wild dog Cuon alpinus. Sloth bear Melursus ursinus, is the other large mammal found in this area. Smaller mammals like civets, mongooses, porcupine, black-naped hare, squirrels, etc. are also common. Apart from the impressive mammalian fauna, Wayand is also rich in avifauna, with more than 300 species of birds reported. Among the larger reptiles, the marsh crocodile, monitor lizard and rock python occur.
Wayanad also has its share of problems and the management is faced with the chal-lenging task of protecting wildlife and its habitat. Wayanad (other than Tholpetty Range) is highly fragmented and has a large human population living inside. There are 57 enclaves having 107 settlements with 10,604 people living in 2,613 families in an area of 4.96 km2 (Anon, 2012). The native tribes mainly consist of Paniya, Kuruma, Adiyar, Kurichya, Oorali and Kattunaikkan tribes. The major challenge is protection and managing human pressure on the habitat. Human wildlife conflict is also a chal-lenge given the high densities of wildlife and people living in close proximity to each other (Annon,2012).
4 | STATUS OF TIGERS, CO-PREDATORS AND PREy IN ThE WAyANAD WIlDlIFE SANCTUARy, kERAlA
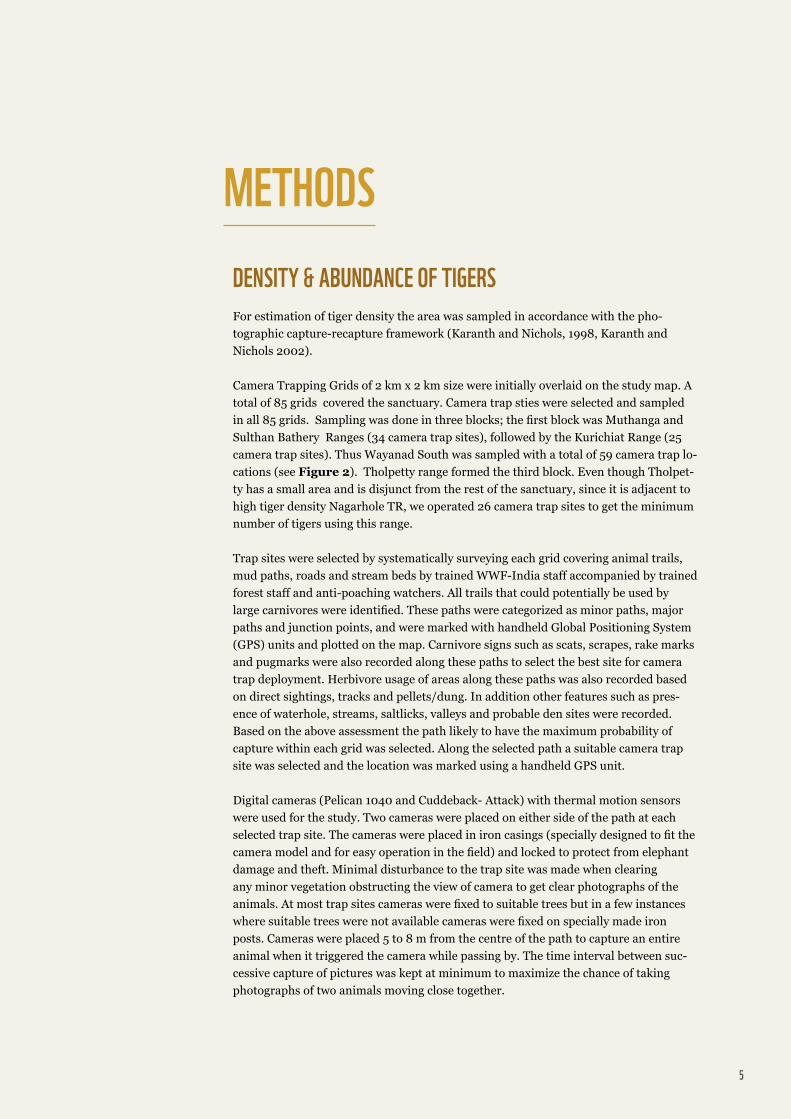
DENSITy & AbUNDANCE OF TIGERSFor estimation of tiger density the area was sampled in accordance with the pho-tographic capture-recapture framework (Karanth and Nichols, 1998, Karanth and Nichols 2002).
Camera Trapping Grids of 2 km x 2 km size were initially overlaid on the study map. A total of 85 grids covered the sanctuary. Camera trap sties were selected and sampled in all 85 grids. Sampling was done in three blocks; the first block was Muthanga and Sulthan Bathery Ranges (34 camera trap sites), followed by the Kurichiat Range (25 camera trap sites). Thus Wayanad South was sampled with a total of 59 camera trap lo-cations (see Figure 2). Tholpetty range formed the third block. Even though Tholpet-ty has a small area and is disjunct from the rest of the sanctuary, since it is adjacent to high tiger density Nagarhole TR, we operated 26 camera trap sites to get the minimum number of tigers using this range.
Trap sites were selected by systematically surveying each grid covering animal trails, mud paths, roads and stream beds by trained WWF-India staff accompanied by trained forest staff and anti-poaching watchers. All trails that could potentially be used by large carnivores were identified. These paths were categorized as minor paths, major paths and junction points, and were marked with handheld Global Positioning System (GPS) units and plotted on the map. Carnivore signs such as scats, scrapes, rake marks and pugmarks were also recorded along these paths to select the best site for camera trap deployment. Herbivore usage of areas along these paths was also recorded based on direct sightings, tracks and pellets/dung. In addition other features such as pres-ence of waterhole, streams, saltlicks, valleys and probable den sites were recorded. Based on the above assessment the path likely to have the maximum probability of capture within each grid was selected. Along the selected path a suitable camera trap site was selected and the location was marked using a handheld GPS unit.
Digital cameras (Pelican 1040 and Cuddeback- Attack) with thermal motion sensors were used for the study. Two cameras were placed on either side of the path at each selected trap site. The cameras were placed in iron casings (specially designed to fit the camera model and for easy operation in the field) and locked to protect from elephant damage and theft. Minimal disturbance to the trap site was made when clearing any minor vegetation obstructing the view of camera to get clear photographs of the animals. At most trap sites cameras were fixed to suitable trees but in a few instances where suitable trees were not available cameras were fixed on specially made iron posts. Cameras were placed 5 to 8 m from the centre of the path to capture an entire animal when it triggered the camera while passing by. The time interval between suc-cessive capture of pictures was kept at minimum to maximize the chance of taking photographs of two animals moving close together.
mEThODS
5

The details of sampling period, days of camera trapping, number of trap locations and total trapping effort in the sampling area are given in Table 1. The overall effort was 3,182 trap days.
Variables Sampling blocks
Muthanga and Bathery
Kurichiat Tholpetty
Sampling period 1st Oct 2011 to 13th Nov 2011
16th Nov 2011 to 22nd Dec 2011
4th Dec 2011 to 10th Jan 2012
Days camera traps were operational
42 37 38
No. of trap location 34 25 26
Total number of trap days (Sampling effort)
1313a 896 a 973 b
a-Excluding the days when the camera trap did not work and date of camera fixed and taken- Trap sites (Grid 23 and 24) did not work for 19 days and 6 days respectively in Muthanga; b- Two trap sites (11 and 11A) did not work for 5 days and 6 days in Thol-petty
TAblE 1 Details of sampling period, days
of camera trapping, number of trap locations and total trapping
effort
FIGURE 2location of camera traps in
Wayanad Wildlife Sanctuary. (camera trap polygon covers an
area of 168.7 km2)
6 | STATUS OF TIGERS, CO-PREDATORS AND PREy IN ThE WAyANAD WIlDlIFE SANCTUARy, kERAlA

However, we used a 44 day subset of this larger data set to analyse density of tigers for Wayanad South (incorporating Muthanga, Sulthan Bathery and Kurichiat Ranges). Since Tholpetty range has a small area we did not analyse the tiger photo capture data for density or abundance estimation, though the minimum numbers of animals identi-fied during the entire period is reported.
Individual tiger pictures from both left and right flanks were compared and segregated into different individuals. For tigers, the stripe pattern on the flanks, limbs, forequar-ters and sometimes the tail (Schaller, 1967; McDougal, 1977; Karanth, 1995), was used in identification of individual tigers. Every tiger captured was given a unique identifi-cation number e.g. WT_MB_1_M, or WT_K_1_M or WT_T_1_F where the first two alphabets ‘WT’ stand for ‘Wayanad Tiger’ and the next one or two alphabets stand for the Range (i.e. MB stands for Muthanga and Sulthan Bathery, K stands for Kurichiat and T stands for Tholpetty). The number at the end then represents a unique tiger in each of these areas. Beyond that the last alphabet represents the sex of the animal (M = male and F = female). For example, WT_MB_1_M represents ‘WayanadTiger_Muth-anga- Bathery_number 1_Male, and WT_T_1_F represents ‘WayanadTiger_Thol-petty_number 1_Female.
We also captured leopards in our camera traps. Spot patterns were used for identifica-tion of leopard individuals to get an estimate of minimum numbers.
Sexes were segregated by the presence or absence of testicles. Capture histories for tigers were created in a standard ‘X-matrix format’ (Otis et al, 1978; Nichols, 1992) for aspatial analysis. Data in format specific for spatial analysis incorporating animal cap-ture, trap location, sampling occasion and trap operation by occasion was prepared for program ‘secr’ (Efford 2013) and ‘SPACECAP’ (Gopalswamy et al 2012) implemented in ‘R version 3.01’ (R core Team 2013). The functional status of each camera trap was explicitly incorporated, thus incorporating the block sampling design as well as camera malfunctions.
mEThODSSTATUS OF ThE TIGERS
IN WAyANAD WIlDlIFE SANCTUARy, kERAlA
7

© W
WF-
InD
Ia

Abundance was estimated by closed population Mark-recapture models outlined by Otis et al (1978), using program MARK (White et al 1999). The capture matrix was ‘folded’ to accommodate sampling in blocks. This corresponds to sampling design Type IV of Nichols and Karnath (2002)
Density was analysed using Bayesian methods using R package SPACECAP (Gopalswa-my et al 2012) as well as by Maximum Likelihood Spatially Explicit Capture Recapture method (MLSECR) using the R package ‘secr’ (Efford 2013) which is an enhancement of the software DENSITY 4.4.5 (Efford et al 2004, Efford et al 2009).
For both the analysis a 10 km buffer was used. A habitat mask grid (500m X500m, 0.25 km2) was prepared for this area where habitat and non-habitats were indicated with a 1, 0 code. The total habitat area in the habitat mask grid was 1833 km2.
An assumption common to these methods is that the sampled population is assumed to be demographically and geographically closed. (Otis et al. 1978; see also Karanth 1995; Karanth & Nichols 1998 for traditional aspatial methods). Closure was tested us-ing the program CAPTURE (Rexstad & Burnham 1999)
Density estimates using the traditional ½ MMDM (Mean Maximum Distance Moved) buffer (Wilson and Anderson, 1985, see also Karanth & Nichols 2002 for details) is provided in the appendix 2. These methods typically over-estimate density and are no longer recommended (Royle et al 2009a & b). These estimates are provided in this report to allow comparison with earlier studies conducted before advanced spatial capture-recapture methods were available.
DATA ANAlySIS
9

© W
WF-
InD
Ia

ESTImATES OF TIGER AbUNDANCE & DENSITyThe details of tigers individually identified during the entire duration (117 days) of the camera trapping study in Wayanad Wildlife Sanctuary are given in Table 2. It is to be noted that for all further analysis a 44 day period from Wayanad South (Muthanga, Bathery & Kurichiat) ranges is used. As noted above, this meets the ‘closure’ assump-tion, critical to all further analysis, data for Tholpetty are not analysed due to its small area.
Species Total no. of individually identified animals No. of breeding females
Area Male Female Un-classed
Cubs Total
Muthanga & Bathery
Tiger 9 18 4 2* 31 1
Leopard 11 4 1 16 -
Kurichiat Tiger 8 8 2 1* 18 2**
Leopard 4 3 1 8 -
Tholpetty Tiger 8 8 10 26 2
Leopard 3 2 2 7 -
Total Tiger 25 34 16 3* 75 5
Leopard 18 9 4 31 -
* Cubs less than 1 year old;**One adult female with prominent teats captured but cubs were not captured
A total of 75 individually identified tigers and 3 cubs< 1year old were recorded in Wayanad Wildlife Sanctuary. Two of the three tiger cubs were from Muthanga and one cub was from Kurichiat range, these were not included in the analysis as they were less than one year old. Five tigresses (12.2%) were reportedly breeding during the study pe-riod in Wayanad, four females were recorded with cubs and one with prominent teats indicating that it was either lactating or in an advanced stage of pregnancy. The photo-graphs of both flanks of individually identified tigers are provided in the Appendix 5.In addition, 31 individually identified leopards were recorded during the sampling period. No leopard cubs were recorded during the camera trapping exercise. The indi-vidually identified leopard photographs are provided in Appendix 6
RESUlTS
TAblE 2Details of number of
individually identified tigers from the camera traps in
Wayanad Wildlife Sanctuary
11

AbUNDANCE & DENSITyClosureThe statistical test for population closure in program CAPTURE indicated that the population was closed during the sampling period (z = -0.95, p = 0.17).
Abundance EstimateA total of 44 individually identified tigers were captured in Wayanad South on 22 oc-casions with a total of 160 captures. The model Mh had a high support (AICc weight = 0.81) and was selected as the top model.
The model Mh gave an estimate of 48 tigers (47.86 ±3.08 , 95% C.I 44.97- 59.30).
Model AICc Δ AICc
AICc Weights
Model Likelihood
Number of Parameters
Deviance
Mh - π(.) p(g), c=p, N(.)
599.13 0 0.81 1 4 515.31
Mbh - π(.) p(g) c(g) N(.)
602.08 2.95 0.19 0.23 6 514.21
Mh- heterogeneity model, Mbh – behaviour & heterogeneity model, 2 groups mixture was used.π- heterogeneity parameter, p(g) – capture probability varies by group, c(g) – repacture prob-ability varies with group, N –population size, (.) implies parameter not varying across groups
Parameter Estimate SE LCI UCI
π 0.29 0.10 0.14 0.52
p (g1) 0.3 0.04 0.23 0.39
p (g2) 0.09 0.02 0.06 0.14
47.86 3.08 44.97 59.30
Mt+1 44
π- heterogeneity parameter, p(g) – capture probability of group 1 & 2. - estimated population size Mt+1- number of individuals photographed in camera traps
Tiger Density Estimates Densities estimated using Maximum Likelihood or Bayesian methods were very simi-lar. ‘secr’ estimate was 11.2 ± 1.7 S.E (95% C.I 8.3-15.2) /100km2, whereas SPACECAP estimated density per 100 km2 was 11.3 ±1.5 (95% C.I 8.3-14.1), results are given in Table 5.
TAblE 3 model selection for Tiger abundance for muthanga,
Sulthan bathery and kurichiat Ranges
TAblE 4 Parameter Estimates for model
mh (AICc weight 0.81)
12 | STATUS OF TIGERS, CO-PREDATORS AND PREy IN ThE WAyANAD WIlDlIFE SANCTUARy, kERAlA

Parameter SecrEstimate ±S.E (95% Confidence Interval)
SPACECAP Posterior means ±S.D (95% lower & higher HPD*)
Density/100 km2 11.24±1.74 (8.32-15.2) 11.33±1.49 (8.35 – 14.14)
g0/λ0 0.08±0.01 (0.06 – 0.1) 0.05±0.01 (0.03 – 0.07)
σ (in km) 1.73±0.09 (1.56-1.91) 1.93±0.14 (1.67 – 2.2)
Estimated Sampled Area (km2)
391.16±11.57 (369.12 – 414.5) N.A
Realized N/ Nsuper 206.13±28.44 (159.26 – 272.07) 207.76±27.24 (153 – 259)
ψ N.A 0.71±0.1 (0.52 – 0.9)
p1 (probability of capture) 0.05±0.01 (0.03 – 0.07)
p2 (probability of recapture) 0.53±0.09 (0.33 – 0.71)
* Highest posterior Density LevelResults from the Maximum Likelihood (Secr) and Bayesian (SPACECAP) methods are very similar.
SPACECAP was run with option to model behavioural response, 52,000 iterations were run, discarding the first 2000 as ‘burn-in”, 300 was used as the data augmentation value.g0/λ0 - expected encounter rate of a hypothetical individual whose activity centre is exactly at the trap location, σ -ranging parameter, Realized N (secr) or Nsuper (SPACECAP) is the estimated numbers of “activity centres” located in the entire area included in the 10 km buffer i.e.1833 km2, ψ-proportion of data augmentation value in Nsuper.‘Secr’ was run with ‘intercept only’ options.Half-normal detection function was used in both analyses.
TAblE 5 Tiger density estimates from
Spatial Capture-Recapture methods.
FIGURE 3Camera trap layout and Tiger
density in Wayanad South and surrounding areas.
RESUlTSSTATUS OF ThE TIGERS
IN WAyANAD WIlDlIFE SANCTUARy, kERAlA
13

Data for Wayanad from this study, Nagarhole from Royle et al (2009a), all others from Jhala et al (2011). Estimates for Nagarhole are from Bayesian analysis, all others MLSECR. Bars are numbers/100 km2, error bars ± S.E.
FIGURE 4Comparison of tiger density in
tiger conservation areas.
14 | STATUS OF TIGERS, CO-PREDATORS AND PREy IN ThE WAyANAD WIlDlIFE SANCTUARy, kERAlA

The tiger densities estimated using spatially explicit methods for Wayanad South (Muthanga, Sulthan Bathery, Kurichiat Ranges) is 11 tigers /100 km2, putting Wayanad among some of the best tiger areas in the country. Tiger density of Wayanad South ranks among the top ten tiger conservation areas (Figure 4 ).
We did not calculate density of tigers in Tholpetty Range as this Range is disjunct from other Ranges of the Sanctuary and has a small area (78 km2); density estimates can be biased upwards if sampled area is small (Gaston et al 1999). At the time of sampling, eight large sub-adult/young adult tigers were present (which were likely to disperse soon). Large sub-adult or young adult tigers, which still occupy the mother’s home range prior to dispersal, create spot specific high densities. Where the number of such sub-adult or young adult tigers is large and where the sampling area is small it can result in significant changes in densities in presence of these sub-adults/young adults and when they disperse out.
Although Wayanad Wildlife Sanctuary is split into two disconnected parts, at the land-scape level it is an integral part of the larger and well-connected tiger habitat. Hence the tiger habitat in Wayanad needs to be viewed in the larger landscape perspec-tive. For example, even though Tholpetty Range covers just 78 km2 it is a part of the Wayanad-Nagarhole-Bandipur-Mudumalai conservation landscape. In this scenario it is reasonable to expect that some tigers will be common to the adjacent areas as Wayanad is contiguous with other PAs (Nagarhole, Bandipur and Mudumalai Tiger Reserves) and adjoining Reserve Forests. Tigers from Wayanad are therefore likely to have home-ranges incorporating adjoining areas and vice-versa. This is clearly seen in the estimated ‘activity centres’ of the 44 tigers photo-captured in Wayanad South (estimated by ‘secr’, plotted in Figure 3.) Fourteen ‘activity centres’ are located just outside the boundary of Wayanad (within 2 km) and in fact, are mostly in Bandipur (11) with which Waynad South shares the longest boundary, or Mudumalai (1) Tiger Reserves. This means that these tigers have home ranges overlapping two Protected Areas and hence are common to both. This is a likely scenario in any large contiguous tiger landscape. Bulk of the tiger habitat in Wayanad Wildlife Sanctuary adjoins high quality tiger habitat thus forming an important unit of the larger tiger conservation landscape. This situation highlights the importance of and need for coordinated and simultaneous sampling of large contiguous tiger habitats for a better understanding of tiger populations.
Tiger occupancy within Kerala in the Nagarhole-Mudumalai-Wayanad landscape as per the 2010 countrywide tiger estimation report was 2,387 km2 with an estimated population of 40 (37-43) tigers (Jhala et al., 2011). This covers all areas of Kerala in the Nilgiris-Eastern Ghats landscape (including Nilambur and Silent Valley). The present estimate of tigers shows that the population in Wayanad Wildlife Sanctuary alone is much higher than that estimated for a much larger area (2387 km2) of Kerala. There
DISCUSSION
15

is a clear need to assess tiger distribution and densities in the Reserve Forest areas adjoining the Wayanad Wildlife Sanctuary.
While we identified 75 tigers using Tholpetty Range and Waynad South (Muthanga, Sulthan Bathery and Kurichiat Ranges), it is assumed that some tigers would be com-mon between the PA’s in the larger landscape. This would be more so in Tholpetty range where several of the tigers would be common to the larger landscape.
The large number of settlements within the Wayanad Wildlife Sanctuary area and on its periphery put significant anthropogenic pressure on the park. Despite this, prey species and predators flourish, the most important reason for this being the protec-tion given by the Kerala Forest Department which ensures that prey depletion does not happen and large carnivores are protected. This highlights the need to focus on protection as the primary driver for large carnivore conservation. Despite high density of tigers, human-large carnivore conflict is much lower than other high tiger density reserves, e.g. around the Corbett Tiger Reserve just 15 villages lost 1733 cattle heads during 2006-10, on average 23 cattle heads annually (Bose et al 2011). Though human-large carnivore conflict is at lower limits at present, given the surrounding habitation, it is likely to emerge as a challenge for wildlife managers (Appendix 3). The present situation presents a window of opportunity to manage large carnivore-human conflict by constituting effective measures.
16 | STATUS OF TIGERS, CO-PREDATORS AND PREy IN ThE WAyANAD WIlDlIFE SANCTUARy, kERAlA

Annon, (2012). Wayanad Wildlife Sanctuary Management Plan 2012, Kerala Forest Department, Trivandram.
Bose, J.; Kandpal, K. D.; Anwar, M.; Guleria, H.; Vattakaven, J.; Ahmed, A. & Ghose, D. (2011), ‘Interim Relief Scheme for Cattle Depredation by Tigers’, WWF-India.
Borrvall, C. and Ebenman, B. (2006) Early onset of secondary extinctions in ecological communities following the loss of top predators. Ecology Letters.9: 435 – 442.
CEPF(2004).www.cepf.net/xp/cepf/where_we_work/western_ghats/eco_profile/profilesection.xml
Champion, H. G. and Seth, S. K. (1968). A Revised Survey of the Forest Types of India.Oxford& IBH Publishers, New Delhi.
Chesson, P. and Kuang,J. J. (2008).The interaction between predation and competi-tion. Nature.456: 235 – 238.
Efford, M.; Dawson, D. & Robbins, C. (2004), DENSITY: software for analysing capture-recapture data from passive detector arrays, Animal Biodiversity and Conser-vation27(1), 217--228.
Efford M.G., Borchers D.L. andByrom A.E.(2009). Density estimation by spatially explicit capture-recapture likelihood-based methods. Pages 255–269 in D. L. Thom-son, E. G. Cooch and M. J. Conroy eds. Modeling demographic processes in marked populations. Springer, New York.
Efford, M. G. (2013). secr: Spatially explicit capture-recapture models. R package ver-sion 2.6.1.
Gaston, K. J.; Blackburn, T. M. & Gregory, R. D. (1999), ‹Does variation in census area confound density comparisons?›,Journal of Applied Ecology36(2), 191--204.
Gopalaswamy, A. M.; Royle, A. J.; Hines, J. E.; Singh, P.; Jathanna, D.; Kumar, N. S. & Karanth, K. U. (2012), ‹A Program to Estimate Animal Abundance and Density using Bayesian Spatially-Explicit Capture-Recapture Models›, R package version 1.0.6.
Jhala, Y.V., Qureshi, Q., Gopal,R and Sinha, P. R. (eds.). (2011). Status of the Tigers, Co-predators and Prey in India. National Tiger Conservation Authority, Govt. of India, New Delhi, Wildlife Institute of India, Dehradun.TR 2011/003 pp-302.
Karanth, K.U. (1995). Estimating tiger populations from camera-trap data using capture-recapture models. Biological Conservation.71: 333-338.
Karanth, K. U. and Nichols, J.D. (1998). Estimation of tiger densities in India using
REFERENCES
17

photographic captures and recaptures. Ecology.79: 2852-2862.
Karanth, K.U. and Nichols, J.D. (Eds). (2002). Monitoring tigers and their prey.A manual for researchers, managers and conservationists in tropical Asia.Wildlife Con-servation Society, India. Pp 193.
McDougal, C. (1977). The face of the tiger. Rivington Books, London.
Mittermeier, R.A., Myers, N., Mittermeier, C.G. and Gill, P.R. (1999). Hotspots: Earth’s Biologically Richest and Most Endangered Terrestrial Eco regions. CEMEX and Con-servation International, Washington, D.C.
Myers, N., Mittermeier,R.A.,Mittermeier, C.G., Donseca, G.A.B. da and Kent, J. (2000). Biodiversity hotspots for conservation priorities. Nature, 408: 853 – 858.
Nichols, J.D. (1992). Capture-recapture models: using marked animals to study popu-lation dynamics. BioScience 42: 94-102.
Olson, D.M. and Dinerstein, E. (2002). The Global 200: Priority Eco-regions for Global Conservation. Annals of Missouri Botanical Garden.89: 199-224.
Otis, D. L., Burnham, K. P., White, G. C. and Anderson, D. R. (1978). Statistical infer-ence from capture data on closed animal populations. Wildlife Monographs62: 1-135.
R Core Team (2013), ‹R: A Language and Environment for Statistical Computing›, R Foundation for Statistical Computing, Vienna, Austria.
Rangarajan, M. Desai, A., Sukumar, R et al.(2010). Gajah: Securing the future for elephants in India. Report of the Elephant Task Force, Ministry of Environment and Forests, Govt. of India
Rexstad, E. & Burnham, K. P. (1991), User›s guide for interactive program CAPTURE, Color. Cooperative Fish and Wildlife Research Unit.
Royale, J.A., Nichols, J.D., Karanth, K.U. and Gopalaswamy, A.M. (2009a). A hierar-chical model for estimating density in camera-trap studies.Journal of Applied Ecology 46: 118-127.
Royle, J. A.; Karanth, K. U.; Gopalaswamy, A. M. & Kumar, N. S. (2009b), ‹Bayesian inference in camera trapping studies for a class of spatial capture-recapture models›, Ecology 90(11), 3233--3244.
Schaller, G.B. 1967. The deer and the tiger. University of Chicago Press, Chicago.
White, G. C. & Burnham, K. P. (1999), Program MARK: survival estimation from popu-lations of marked animals, Bird study 46(S1), S120--S139.
Wilson, K.R. and Anderson, D.R., 1985. Evaluation of two density estimators of small mammal population size. Journal of Mammalogy. 66, 13–21.
18 | STATUS OF TIGERS, CO-PREDATORS AND PREy IN ThE WAyANAD WIlDlIFE SANCTUARy, kERAlA
APPENDIx 1
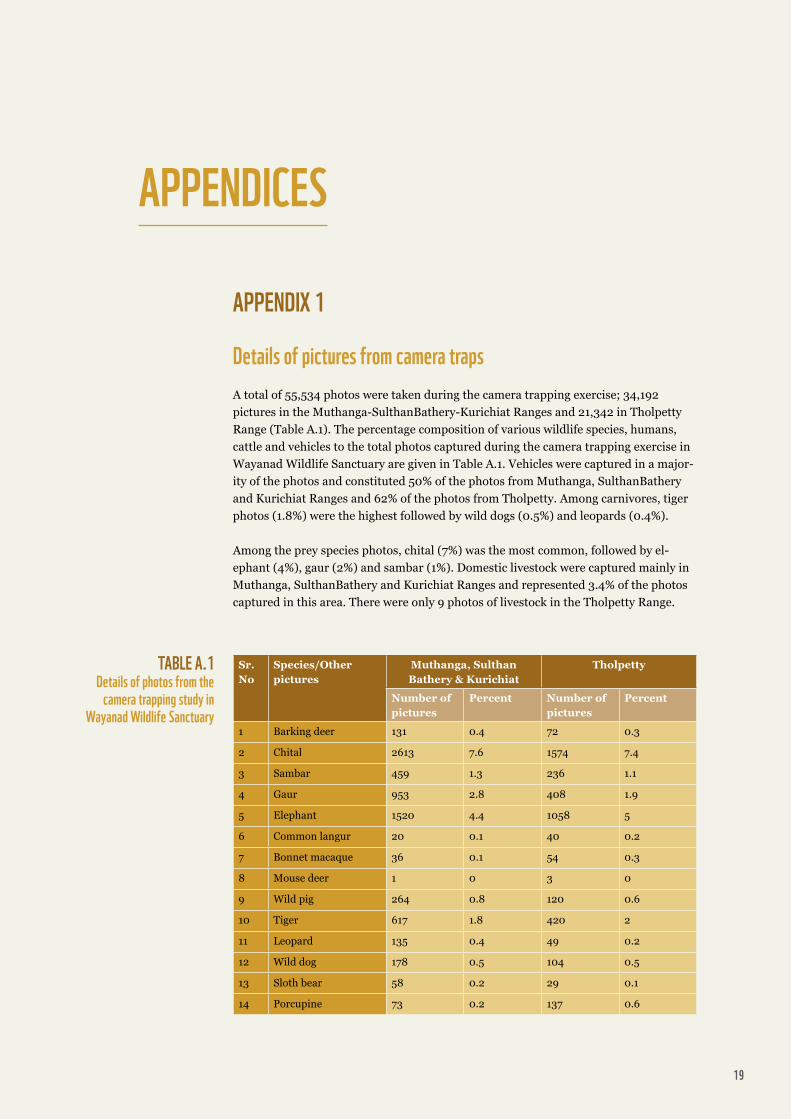
Details of pictures from camera trapsA total of 55,534 photos were taken during the camera trapping exercise; 34,192 pictures in the Muthanga-SulthanBathery-Kurichiat Ranges and 21,342 in Tholpetty Range (Table A.1). The percentage composition of various wildlife species, humans, cattle and vehicles to the total photos captured during the camera trapping exercise in Wayanad Wildlife Sanctuary are given in Table A.1. Vehicles were captured in a major-ity of the photos and constituted 50% of the photos from Muthanga, SulthanBathery and Kurichiat Ranges and 62% of the photos from Tholpetty. Among carnivores, tiger photos (1.8%) were the highest followed by wild dogs (0.5%) and leopards (0.4%).
Among the prey species photos, chital (7%) was the most common, followed by el-ephant (4%), gaur (2%) and sambar (1%). Domestic livestock were captured mainly in Muthanga, SulthanBathery and Kurichiat Ranges and represented 3.4% of the photos captured in this area. There were only 9 photos of livestock in the Tholpetty Range.
Sr. No
Species/Other pictures
Muthanga, Sulthan Bathery & Kurichiat
Tholpetty
Number of pictures
Percent Number of pictures
Percent
1 Barking deer 131 0.4 72 0.3
2 Chital 2613 7.6 1574 7.4
3 Sambar 459 1.3 236 1.1
4 Gaur 953 2.8 408 1.9
5 Elephant 1520 4.4 1058 5
6 Common langur 20 0.1 40 0.2
7 Bonnet macaque 36 0.1 54 0.3
8 Mouse deer 1 0 3 0
9 Wild pig 264 0.8 120 0.6
10 Tiger 617 1.8 420 2
11 Leopard 135 0.4 49 0.2
12 Wild dog 178 0.5 104 0.5
13 Sloth bear 58 0.2 29 0.1
14 Porcupine 73 0.2 137 0.6
APPENDICES
TAblE A.1 Details of photos from the
camera trapping study in Wayanad Wildlife Sanctuary
19

15 Mongoose 1 0 6 0
16 Pea fowl/jungle fowl 9 0 18 0.1
17 Leopard cat 1 0 9 0
18 Jungle cat 6 0
19 Civets 0 0 9 0
20 Black naped hare 1 0 78 0.4
21 Pangolin 1 0
22 Cattle 1178 3.4 9 0
23 Human 3517 10.3 759 3.6
24 Stray dog 58 0.2 0
25 Blank picture 1864 5.5 538 2.5
26 Camera checking 3281 9.6 2260 10.6
27 Vehicle 17178 50.2 13315 62.4
28 Unidentified pictures 39 0.1 37 0.2
29 Total 34192 100 21342 100
20 | STATUS OF TIGERS, CO-PREDATORS AND PREy IN ThE WAyANAD WIlDlIFE SANCTUARy, kERAlA

APPENDIx 2Aspatial density estimates using ½ mmDm methodWhile analyzing, data for Muthanga and Sulthan Bathery Ranges block and Kurichiat Range block were pooled together for analysis, such that first day of sampling in either of the blocks formed the first occasion. This provided a dataset of 22 ‘occasions’ after pooling 44 days of sampling. This corresponds to type 4 of survey designs of Nichols and Karanth (2002).
We considered following models outlined by Otis et al, (1978) for estimation of closed populations and widely used for population estimation of tigers and other large cats (Karanth and Nichols 2002). These models allow for varying capture and recapture probabilities based on time, behaviour and heterogeneity in the population or combi-nations of these. The following models were fitted in program MARK 7.1 (White and Burnham 1999).
M0 - Capture probability is the same for all animals; Mh - Capture probabilities were heterogeneous for individual animals; Mb - Capture probabilities differed between pre-viously caught and uncaught tigers due to trap-response behaviour, and combination of heterogeneity and trap response; Mbh. The heterogeneity models were fitted with a two mixture finite mixture model (Pledger 2000).
We estimated the effective Sample Area (Â) by drawing a buffer area around a bound-ing polygon drawn around the outermost trap sites with a width (Ŵ) of ½ MMDM (Mean Maximum Distance Moved). The area enclosed by the polygon formed by the outermost camera traps was 168.7 km2. MMDM was derived by estimating the mean maximum distance moved by individual tigers captured in more than one trap site dur-ing the study (for details, see Wilson and Anderson, 1985, Nichols and Karanth 2002). The ½ MMDM was 1.68 km (± 0.25 S.E), and was added as a buffer to the polygons formed by the outermost traps. After removing non-habitat areas, the total Estimated Sampled Area was 298.2 km2 (± 14.86 S.E). The estimated density was 16.0/ 100 km2 (± 1.3 S.E).
Density estimates from the ½ MMDM methods are provided only for comparison with earlier published studies before MLSECR methods came into practice. This method is no longer recommended or in wide practice as it typically over-estimates densities.
APPENDICESSTATUS OF ThE TIGERS
IN WAyANAD WIlDlIFE SANCTUARy, kERAlA
21

APPENDIx 3
human-carnivore conflictWayanad Wildlife Sanctuary has 57 enclaves having 107 settlements with an estimated population of 10,604 people living in them. These settlements have cattle, which graze in the forest areas and are exposed to the large predator population.
Data gathered from four villages inside Wayanad Wildlife Sanctuary showed that large carnivore-human conflict was present and this is to be expected given the high density of large carnivores and the large number of human enclaves and settlements inside and along the periphery of Wayanad Wildlife Sanctuary. Out of a total of 63 house-holds sampled, 21 households or 33.3% of them reported cattle kills. Nearly 75% of the kills were reported as having happened in the forest when cattle were out grazing. The remaining 25% happened at night when cattle were in sheds or tied close to the house. Of these, they claimed that tigers were responsible for 46.9% of the kills and leopards were responsible for 10.9% of the kills while wild dogs were responsible for 7.8% of the kills. They were unable to identify the predator in the remaining 34.5% of the kills. In terms of livestock, cattle composed 61.5% of the kills and goats composed 38.5% of the kills.
Cattle kills by large carnivores are compensated by the Forest Department and when this is coupled with protection it minimizes retaliatory killing of large carnivores. Data on cattle kills recorded by the Forest Department are based on compensation paid and hence this is a very conservative estimate of the conflict that exists (Figure A.1).
Even this limited data on cattle kills gathered by the Forest Department shows a dramatic increase in cattle kills starting from 2005. This may not directly correlate to increase in conflict but may reflect increased payment of compensation or increases in compensation amount in recent years. Resolving human-large carnivore conflict will be a major challenge in Wayanad given the large number of settlements and people inside and outside the PA. Additionally, the surrounding coffee, tea and rubber planta-tions facilitate increased conflict as large carnivores can use them as cover.
2000
2001
2002
2003
2004
2005
2006
2007
2008
2009
2010
45
40
35
30
25
20
15
10
5
0
Cat
tle
kill
ing
by
carn
ivor
e
Year
FIGURE A.1Number of cattle death cases in different years in Wayanad
Wildlife Sanctuary
22 | STATUS OF TIGERS, CO-PREDATORS AND PREy IN ThE WAyANAD WIlDlIFE SANCTUARy, kERAlA

APPENDIx 4
Training on the field surveyFor tiger and leopard monitoring field methods, 8 staff from Wayanad Wildlife Sanctu-ary was given a one week intense training in grid survey and camera trapping skills in the Sigur Range of Nilgiris North Forest Division. In addition, 20 additional staff was given similar training in the Wayanad Wildlife Sanctuary (3 day course). A further 15 staff were given hands on training in the field by WWF-India researchers during the camera trapping operation. Figure 4 shows training in classrooms and in the field.
To estimate prey species densities using the line transect method, a total of 75 field staff from all four ranges of Wayanad Wildlife Sanctuary were trained by WWF-India staff. Training in effectively walking transects was given so that assumptions of tran-sect method were not violated. Training in the use of GPS, range finders and compass-es was also given. Basic map reading skills were also imparted.
Basic skills in filling data sheets for various types of data were also given to all the staff that attended the various training courses.
FIGURE A.2Training program for the forest field staff and volunteers from
NGOs
APPENDICESSTATUS OF ThE TIGERS
IN WAyANAD WIlDlIFE SANCTUARy, kERAlA
© W
WF-
InD
Ia
23

APPENDIx 5
Tiger individuals photographed during camera trapping.
WT_k_3R_FWT_k_3l_F
WT_k_2R_FWT_k_2l_F
WT_k_1R_mWT_k_1l_m
24 | STATUS OF TIGERS, CO-PREDATORS AND PREy IN ThE WAyANAD WIlDlIFE SANCTUARy, kERAlA

'WT’ stand for ‘Wayanad Tiger’ and the next one or two alphabets stand for the Range (i.e. MB stands for Muthanga and Sulthan Bathery, K stands for Kurichiat and T stands for Tholpetty). The number at the end then represents a unique tiger in each of these areas. Beyond that the last alphabet represents the sex of the animal (M = male and F = female)
WT_k_6R_mWT_k_6l_m
WT_k_5l_mWT_k_5R_m
WT_k_4R_FWT_k_4l_F
APPENDICESSTATUS OF ThE TIGERS
IN WAyANAD WIlDlIFE SANCTUARy, kERAlA
25

WT_k_12R_mWT_k_12l_m
WT_k_11R_mWT_k_11l_m
WT_k_10R_FWT_k_10l_F
26 | STATUS OF TIGERS, CO-PREDATORS AND PREy IN ThE WAyANAD WIlDlIFE SANCTUARy, kERAlA

WT_k_9R_FWT_k_9l_F
WT_k_8R_FWT_k_8l_F
WT_k_7R_mWT_k_7l_m
APPENDICESSTATUS OF ThE TIGERS
IN WAyANAD WIlDlIFE SANCTUARy, kERAlA
27

WT_k_15R_FWT_k_15l_F
WT_k_14R_UCWT_k_14l_UC
WT_k_13R_mWT_k_13l_m
28 | STATUS OF TIGERS, CO-PREDATORS AND PREy IN ThE WAyANAD WIlDlIFE SANCTUARy, kERAlA

WT_k_18R_UCWT_k_18l_UC
WT_k_17R_mWT_k_17l_m
WT_k_16R_FWT_k_16l_F
APPENDICESSTATUS OF ThE TIGERS
IN WAyANAD WIlDlIFE SANCTUARy, kERAlA
29

WT_mb_3R_FWT_mb_3l_F
WT_mb_2R_mWT_mb_2l_m
WT_mb_1R_mWT_mb_1l_m
30 | STATUS OF TIGERS, CO-PREDATORS AND PREy IN ThE WAyANAD WIlDlIFE SANCTUARy, kERAlA

WT_mb_6R_FWT_mb_6l_F
WT_mb_5R_mWT_mb_5l_m
WT_mb_4R_FWT_mb_4l_F
APPENDICESSTATUS OF ThE TIGERS
IN WAyANAD WIlDlIFE SANCTUARy, kERAlA
31

WT_mb_12R_mWT_mb_12l_m
WT_mb_11R_FWT_mb_11l_F
WT_mb_10R_UCWT_mb_10l_UC
32 | STATUS OF TIGERS, CO-PREDATORS AND PREy IN ThE WAyANAD WIlDlIFE SANCTUARy, kERAlA

WT_mb_9R_FWT_mb_9l_F
WT_mb_8R_FWT_mb_8l_F
WT_mb_13R_FWT_mb_13l_F
APPENDICESSTATUS OF ThE TIGERS
IN WAyANAD WIlDlIFE SANCTUARy, kERAlA
33
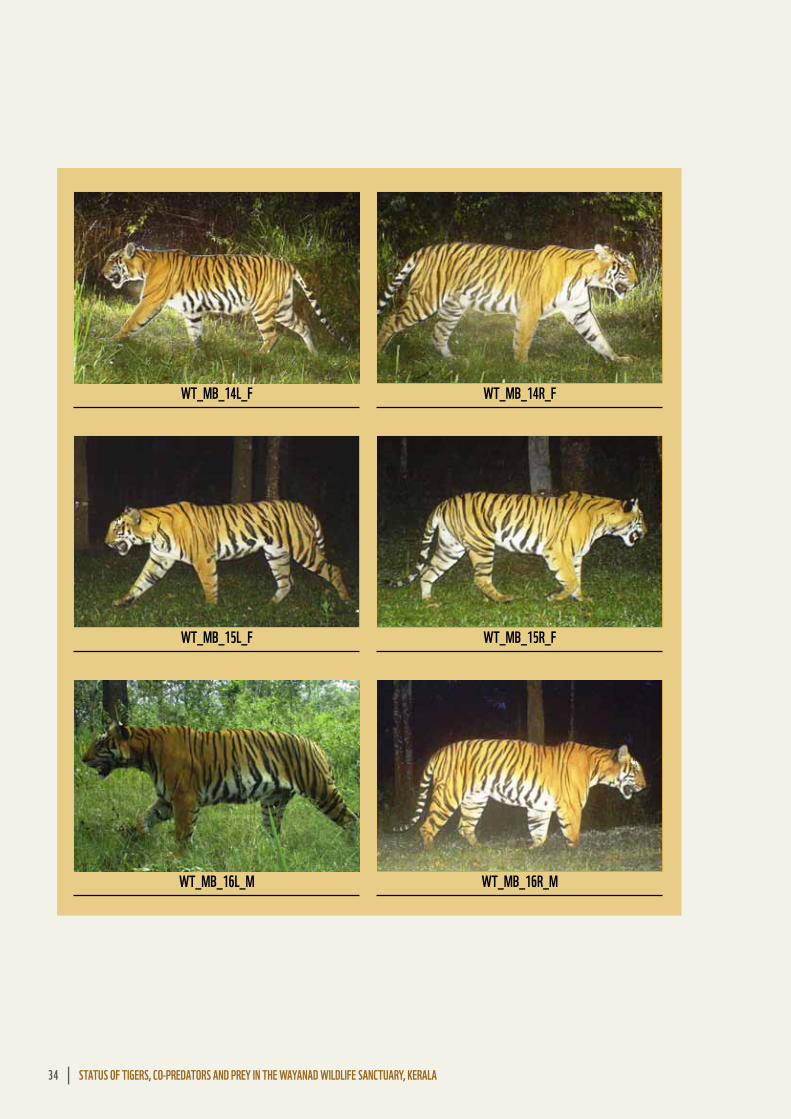
WT_mb_16R_mWT_mb_16l_m
WT_mb_15R_FWT_mb_15l_F
WT_mb_14R_FWT_mb_14l_F
34 | STATUS OF TIGERS, CO-PREDATORS AND PREy IN ThE WAyANAD WIlDlIFE SANCTUARy, kERAlA

WT_mb_19R_FWT_mb_19l_F
WT_mb_18R_FWT_mb_18l_F
WT_mb_17R_UCWT_mb_17l_UC
APPENDICESSTATUS OF ThE TIGERS
IN WAyANAD WIlDlIFE SANCTUARy, kERAlA
35

WT_mb_22R_FWT_mb_22l_F
WT_mb_21R_mWT_mb_21l_m
WT_mb_20R_UCWT_mb_20l_UC
36 | STATUS OF TIGERS, CO-PREDATORS AND PREy IN ThE WAyANAD WIlDlIFE SANCTUARy, kERAlA

WT_mb_25R_mWT_mb_25l_m
WT_mb_24R_mWT_mb_24l_m
WT_mb_23R_FWT_mb_23l_F
APPENDICESSTATUS OF ThE TIGERS
IN WAyANAD WIlDlIFE SANCTUARy, kERAlA
37

WT_mb_28l_RWT_mb_28l_F
WT_mb_27R_mWT_mb_27l_m
WT_mb_26R_UCWT_mb_26l_UC
38 | STATUS OF TIGERS, CO-PREDATORS AND PREy IN ThE WAyANAD WIlDlIFE SANCTUARy, kERAlA

WT_T_1R_FWT_T_1l_F
WT_mb_31R_FWT_mb_30R_F
WT_mb_29R_FWT_mb_29l_F
APPENDICESSTATUS OF ThE TIGERS
IN WAyANAD WIlDlIFE SANCTUARy, kERAlA
39

WT_T_4R_mWT_T_4l_m
WT_T_3R_FWT_T_3l_F
WT_T_2R_mWT_T_2l_m
40 | STATUS OF TIGERS, CO-PREDATORS AND PREy IN ThE WAyANAD WIlDlIFE SANCTUARy, kERAlA
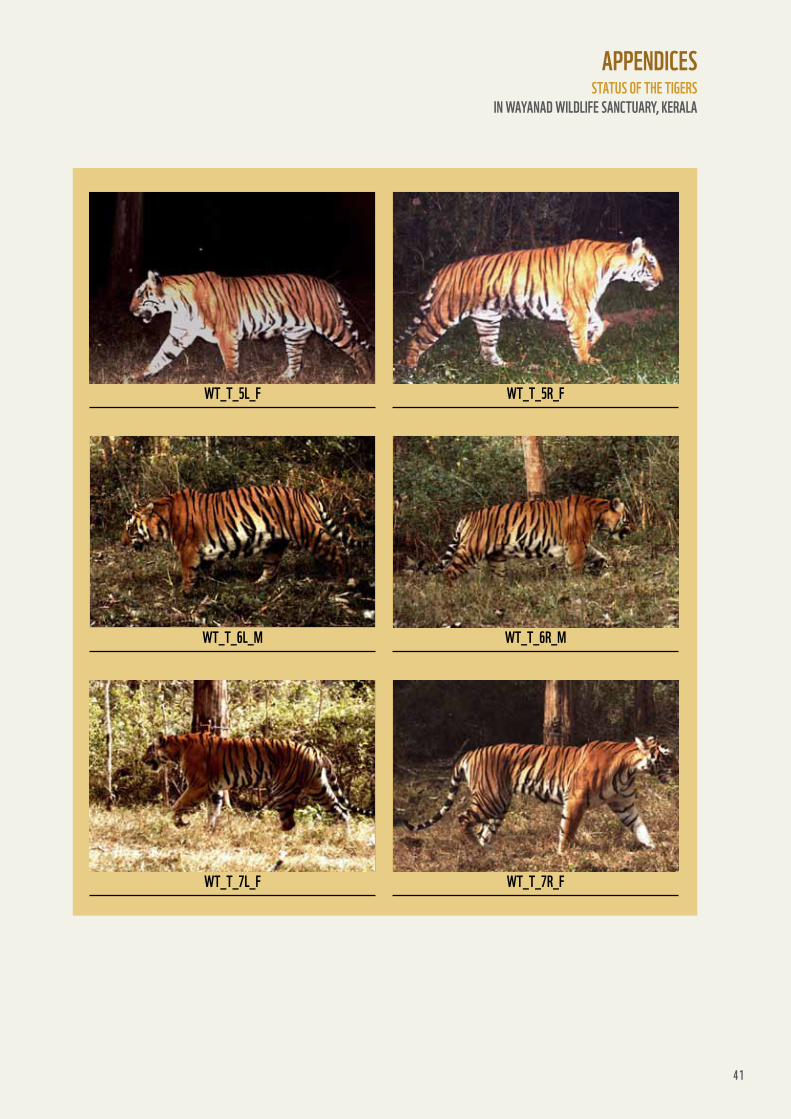
WT_T_7R_FWT_T_7l_F
WT_T_6R_mWT_T_6l_m
WT_T_5R_FWT_T_5l_F
APPENDICESSTATUS OF ThE TIGERS
IN WAyANAD WIlDlIFE SANCTUARy, kERAlA
41

WT_T_12R_mWT_T_12l_m
WT_T_11R_FWT_T_11l_F
WT_T_10R_mWT_T_10l_m
42 | STATUS OF TIGERS, CO-PREDATORS AND PREy IN ThE WAyANAD WIlDlIFE SANCTUARy, kERAlA

WT_T_9R_mWT_T_9l_m
WT_T_8R_mWT_T_8l_m
WT_T_13R_FWT_T_13l_F
APPENDICESSTATUS OF ThE TIGERS
IN WAyANAD WIlDlIFE SANCTUARy, kERAlA
43

WT_T_16R_mWT_T_16l_m
WT_T_15R_FWT_T_15l_F
WT_T_14R_FWT_T_14l_F
44 | STATUS OF TIGERS, CO-PREDATORS AND PREy IN ThE WAyANAD WIlDlIFE SANCTUARy, kERAlA

WT_T_20R_UCWT_T_20l_UC
WT_T_19l_UCWT_T_18R_UC
WT_T_17R_UCWT_T_17l_UC
APPENDICESSTATUS OF ThE TIGERS
IN WAyANAD WIlDlIFE SANCTUARy, kERAlA
45

WT_T_25l-WT_T_24l-WT_T_25l_all UCWT_T_23R-WT_T_24R-WT_T_25R_all UC
WT_T_22R_UCWT_T_22l_UC
WT_T_21R_UCWT_T_21l_UC
46 | STATUS OF TIGERS, CO-PREDATORS AND PREy IN ThE WAyANAD WIlDlIFE SANCTUARy, kERAlA

WT_T_26R_UC
APPENDICESSTATUS OF ThE TIGERS
IN WAyANAD WIlDlIFE SANCTUARy, kERAlA
47

APPENDIx 5leopards individuals photographed during camera trapping.
Wl_k_3RWl_k_3l
Wl_k_2RWl_k_2l
Wl_k_1RWl_k_1l
48 | STATUS OF TIGERS, CO-PREDATORS AND PREy IN ThE WAyANAD WIlDlIFE SANCTUARy, kERAlA

Wl_k_7RWl_k_6R
Wl_k_5RWl_k_5l
Wl_k_4RWl_k_4l
APPENDICESSTATUS OF ThE TIGERS
IN WAyANAD WIlDlIFE SANCTUARy, kERAlA
49

Wl_mb_3lWl_mb_2R
Wl_mb_2lWl_mb_1R
Wl_mb_1lWl_k_8R
50 | STATUS OF TIGERS, CO-PREDATORS AND PREy IN ThE WAyANAD WIlDlIFE SANCTUARy, kERAlA

Wl_mb_6lWl_mb_5R
Wl_mb_5lWl_mb_4R
Wl_mb_4lWl_mb_3R
APPENDICESSTATUS OF ThE TIGERS
IN WAyANAD WIlDlIFE SANCTUARy, kERAlA
51

Wl_mb_6RWl_mb_12l
Wl_mb_11RWl_mb_11l
Wl_mb_10RWl_mb_10l
52 | STATUS OF TIGERS, CO-PREDATORS AND PREy IN ThE WAyANAD WIlDlIFE SANCTUARy, kERAlA
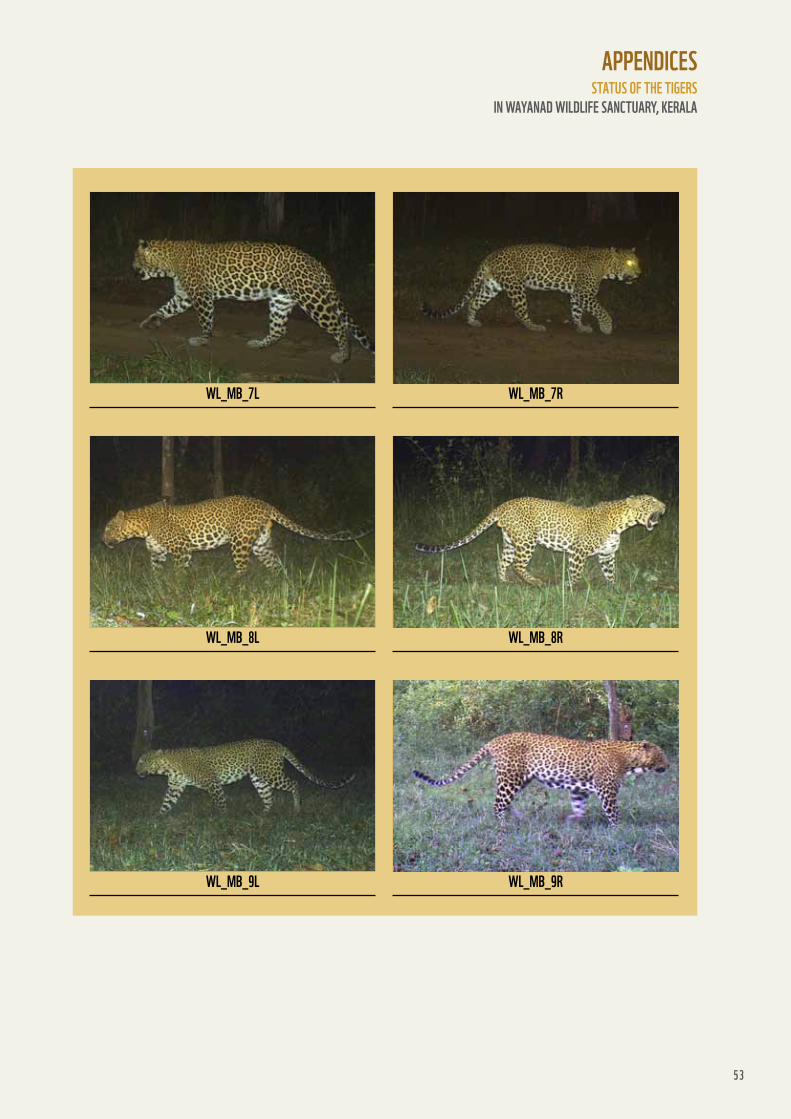
Wl_mb_9RWl_mb_9l
Wl_mb_8RWl_mb_8l
Wl_mb_7RWl_mb_7l
APPENDICESSTATUS OF ThE TIGERS
IN WAyANAD WIlDlIFE SANCTUARy, kERAlA
53

Wl_mb_15lWl_mb_14R
Wl_mb_14lWl_mb_13R
Wl_mb_13lWl_mb_12R
54 | STATUS OF TIGERS, CO-PREDATORS AND PREy IN ThE WAyANAD WIlDlIFE SANCTUARy, kERAlA

Wl_T_2RWl_T_2l
Wl_T_1RWl_T_1l
Wl_mb_16RWl_mb_15R
APPENDICESSTATUS OF ThE TIGERS
IN WAyANAD WIlDlIFE SANCTUARy, kERAlA
55

Wl_T_5RWl_T_5l
Wl_T_4RWl_T_4l
Wl_T_3RWl_T_3l
56 | STATUS OF TIGERS, CO-PREDATORS AND PREy IN ThE WAyANAD WIlDlIFE SANCTUARy, kERAlA

Wl_T_7R
Wl_T_6RWl_T_6l
APPENDICESSTATUS OF ThE TIGERS
IN WAyANAD WIlDlIFE SANCTUARy, kERAlA
57

© V
Ijay
Ku
Ma
r /
WW
F-In
DIa


© 1986 Panda Symbol WWF-World Wide Fund For nature (Formerly World Wildlife Fund)WWF-India Secretariat172-B Lodi estatenew Delhi 110003Tel: 011 4150 4814 Fax: 011 4150 4779
85 Camera trap locations
3182 trap days of sampling effort for tigers and leopards, 18 Transects, 196 km of transect walks for prey species.
Tiger density in Waynad WLS sanctuary compares well with some of the best tiger habitats. Together with Nagarhole, Bandipur, Mudumalai and other protected areas, this sanctuary forms one of the largest tiger habitats in the world.
57 Prey species/ km2
Chital, Sambar, Gaur are the main prey species and are found in good densities in Waynad WLS to support a large tiger population.
75 tiger and 31 leopard individuals were identified from unique stripe or spot patterns. An estimated 83 tigers and 32 leopards occur in Waynad WLS.
Waynad holds more tigers than any other Protected area in Kerala.
75 Tigers, 31 leopards
1st baseline Estimate of Tigers in Waynad
11 Tigers5 leopards/100 km2
www.wwfindia.orgIND
STATUS OF TIGERS, CO-PREDATORS AND PREy IN ThE WAyANAD WIlDlIFE SANCTUARy
STe
nc
IL P
ho
To c
re
DIT
: jo
Se
Ph
VaT
TaK
aVe
n /
WW
F-In
DIa


![kstakerala.inkstakerala.in/wp-content/uploads/downloads/2013/02/IEDSS...WAYANAO KANNI]R Wayanad Wayanad Wayanad Wayanad Wayanad Wayanad Kannur Thalassery GVHSS Mananthavadv GVHSS Arnbalavayal](https://img.pdfslide.net/doc/110x75/5acdeed77f8b9a63398eab10/kannir-wayanad-wayanad-wayanad-wayanad-wayanad-wayanad-kannur-thalassery-gvhss.jpg)