Embed Size (px)
Citation preview
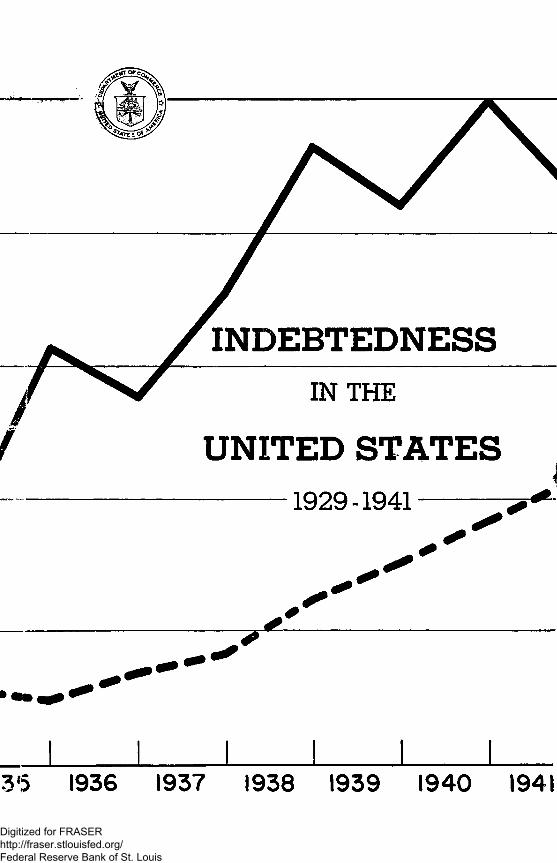
INDEBTEDNESSIN THE
f UNITED STATESI
-----------------------------------1929 -1941-----------
I I I_______I_______I_______I_____35 1936 1937 1938 1939 1940 1941
Digitized for FRASER http://fraser.stlouisfed.org/ Federal Reserve Bank of St. Louis

U. S. DEPARTMENT OF COMMERCEJesse H. Jones, Secretary
BUREAU OF FOREIGN AND DOMESTIC COMMERCECarroll L. Wilson. D ire c to r
+Economic Series—No. 21
INDEBTEDNESS IN THE UNITED STATES
1929-41
UNITED STATES
GOVERNMENT PRINTING OFFICE
WASHINGTON : 1942
For sale by the Superintendent of Documents, Washington, D. C. Price 15 cents
Digitized for FRASER http://fraser.stlouisfed.org/ Federal Reserve Bank of St. Louis

Digitized for FRASER http://fraser.stlouisfed.org/ Federal Reserve Bank of St. Louis

PageForeword_______________________________________________________________________ vnChapter I. Concepts of debt and problems of its measurement__________ 1
The nature of debt____________ _________________________________________ 1Area covered by this report__ _________________________________________ 2Varying quality of debt statistics_______________________________________ 2Basic concepts of debt_______ __________________________________________ 3Concepts employed in this study . _____________________________________ 4Various concepts of duplicating debt___________________________________ 5Long- and short-term indebtedness_____________________________________ 7Treatment of defaulted obligations______________________________________ 8Debt estimates affected by changing financial organization___________ 8Significance of changes in outstanding debt____________________________ 9Limitations of the estimates_____________________ ______________________ 10Suggestions concerning interpretation of the estimates________________ 11Relation to other studies_________________________________________________ 12
Chapter II. The volume of outstanding debt______________________________ 13Combined public and private debt______________________________________ 13
Net public and private debt up 18 billions in 1941_______________ 13Comparative changes in private debt______________________________ 13Timing of public-debt expansion___ _____________________________ 15Private-debt increase a result of business expansion______________ 15Net debt 12.6 billion dollars higher in 1941 than in 1929_________ 15Gross debt above 1929 level____________ ________________________ 18
Public debt_______________________________________________________________ 20Trend of public debt upward_______________________________________ 20Composition of gross Federal debt_________________________________ 22State and local government debt___________________________________ 24
Private debt_______________ _________ ___________________________________ 27Trends in net private debt, 1929-41_______________________________ 27Gross private debt___________________________________________________ 29Short-term private debt____________________________________________ 31
Short-term credit for commercial purposes__________________ 32Trends in the volume of consumer credit_____________________ 33
Duplicating debt_________________________________________________________ 34Duplicating debt of the United States Government and Federal
agencies___________________________________ ________________________ 35Duplicating debt of State and local governments_________________ 36
Chapter III. The components of private debt_____________________________ 39Debts of corporations____________________________________________________ 39
Railway debt________________________________________________________ 43Public utility debt___________________________________________________ 44Debts of industrial and financial corporations_____________________ 45Debts of holding companies______ ________________________________ 47
Indebtedness on urban residential property____________________________ 48Farm-mortgage debt reduced yearly since 1929________________________ 51Short-term farm debt____________________________________________________ 53Short-term debts of individuals__________________________________________ 54
Commercial debts declined sharply from 1929 through 1933_____ 54Consumer debt in 1941 higher than in 1929_______________________ 57
Chapter IV. The changing structure of domestic indebtedness___________ 61Investment holdings of banks and insurance companies_______________ 61Debt and interest_________________________________________________________ 65
Interest payable_____________________________________________________ 65Average interest rates_______________________________________________ 70
Public debt ________________________ ____________________________ 71Private debt____________________________________________________ 71
CONTENTS
in
Digitized for FRASER http://fraser.stlouisfed.org/ Federal Reserve Bank of St. Louis

Chapter IV— Continued.Relation of interest payable to interest paid________________________________ 75Refinancing and refunding activities, 1929-40____ _____________________ 75Defaulted debt, 1929-40________________________ _____ __________________ ____ 77
Chapter V. The significance of a changing debt structure________________ ____ 79Consequences of an expanding Government debt______________________ ____ 79Areas of tension in the private-debt structure__________________________ ____ 80The outlook for future debt developments__________________________________ 81The significance of debt financing__________________1____________________ ____ 82
A P P E N D IX
Sources and methods of estimation___________________________________________ _____85General_________________________________________________________________________85Debts of the United States Government and Federal corporations
and agencies------------------------------------------------------------------------------------------ ------- 85Debts of State and local governments________________________________________86Debts of private corporations________________________________________________ 86Farm-mortgage and other farm debt____________________________________ _____88Urban real-estate mortgage debt________________________________________ _____89Business and commercial debts of individuals__________________________ ____ 90Interest payable----------------------------------------------------------------------------------------- -------91
T E X T TABLES
1. Net debt in the United States, 1929-41_________________________________ 162. Gross debt in the United States, 1929-41_______________________________ 193. Gross and net debt of the United States Government and Federal cor
porations and agencies, 1929-41______________________________________ 214. Gross and net debt of State and local governments, 1929-41__________ 245. Outstanding debts of selected special districts, as of June 30, 1940
and 1941__________________________ ____________________________________ 276. Gross and net corporate debt, 1929-41__________________________________ 417. Deposit liabilities of all banks in the United States, 1929-41__________ 468. Reserves and other selected liabilities of life-insurance companies to
policyholders, 1929-40________________________________________________ 469. Urban residential real-estate mortgages, 1929-41_______________________ 48
10. Urban real-estate mortgages owed by individuals and other noncorporate borrowers, 1929-41_____________________________________________ 49
11. Farm mortgages and short-term debts of farmers, by lending agencies,1929-41__________________________________________________________________ 52
12. Loans to farmers’ cooperative organizations by selected Federal lending agencies in the United States, 1929-41___________________________ 54
13. Short-term debts of individuals and other noncorporate borrowers,1929-41__________________________________________________________________ 56
14. Net public debt and net private long-term debt held by banks, life-insurance companies, and other investors, 1929, 1939, and 1940____ 61
15. Estimated distribution of tax-exempt securities, by class of holder,as of June 30, 1937-40__________________________________________________ 63
16. Estimated outstanding mortgage loans on urban 1- to 4-family homes,by type of lender, 1929-41_____________________________________________ 65
17. Net public and net long-term private interest-bearing debt, averageinterest rates, and interest payable in the United States, 1929-41 __ 68
18. Gross public and gross long-term private interest-bearing debt, averageinterest rates, and interest payable in the United States, 1929-41__ 73
19. Corporate bonds and notes in default, by major groups, 1929-40_____ 78
A P P E N D IX TABLE
I. Number of consolidated and unconsolidated returns filed by activecorporations, 1929-38____________________________________________________ 87
ILLU STR ATIO NS
1. Percentage changes, 1941 from 1940 and 1940 from 1939, in netpublic and private debt, by classes____________________________________ 14
2. Net debt in the United States, by types, 1929-41______________________ 183. Gross and net public debt in the United States, 1929-41______________ 20
IV CONTEXTS
Digitized for FRASER http://fraser.stlouisfed.org/ Federal Reserve Bank of St. Louis

Page4. Long-term private debt in the United States, by types, 1929-41______ 285. Indexes of components of long-term private debt in the United States,
1929-41_________________________________________________________________ 306. Short-term private debt in the United States, by types, 1929-41_____ 317. Indexes of components of short-term private debt in the United States,
1929-41______________________________ ___________________________________ 328. Short-term farm debt to Government farm-credit agencies, 1929-41__ 539. Indexes of consumer debt in the United States, 1929-41______________ 58
10. Indexes of interest payable on components of long-term private debt,1929-41__________________________________________________________________ 66
11. Indexes of interest payable on components of public debt, 1929-41___ 6712. Average interest rate on components of public debt, 1929-41_________ 7013. Average interest rate on components of long-term private debt, 1929-
41___________________________________________ ___________________________ 7214. Corporate bonds and notes in default, 1929-41_________________________ 77
CONTENTS V
Digitized for FRASER http://fraser.stlouisfed.org/ Federal Reserve Bank of St. Louis

Digitized for FRASER http://fraser.stlouisfed.org/ Federal Reserve Bank of St. Louis

FOREWORD
This bulletin is one of the many basic economic studies which the Department of Commerce is making to provide reliable guides to business and governmental policy during the war and post-war periods. It presents an a lalysis of the composition of the domestic debt structure and the shifts in that structure during the past decade. It thus furnishes background data that should prove helpful in appraising the significance of future developments.
The sudden plunge of tins country into war on December 7, 1941, marked the end of a defir ite economic period and the inauguration of a new phase of industrial expansion based on arms output. The war as it progresses is bound to produce striking economic changes which will alter the financial structure inherited from the pre-war period. As yet, the type of financial changes which will accompany the war effort cannot be predicted in detail with accuracy. Certain inferences, however, may oe drawn from current information when projected against the background material presented in this bulletin. Only by studying the behavior of the credit structure over the past decade can we truly understand and appraise the financial trends being formed in the present period of economic transition.
The debt structure not only is a heritage of past economic activity but also is a factor modifying and conditioning present and future commercial and industrial expansion. Changes in the duration and terms of credit, as well as in the service and amortization charges required to support loans, may exercise a strong influence in determining the character and structure of economic development. Failure of the network of domestic indebtedness to fall in line with changing economic conditions may cause frictions which temporarily interrupt or retard the smooth flow of business activity.
Changes in the aggregate volume of private indebtedness are directly associated with major changes in business activity and national income, though movements in debt volume tend to lag somewhat behind the trends in these basic series, particularly during the downward phase of the business cycle. Both quantitative and qualitative changes in the structure of private indebtedness are important not only because they throw 1 ght upon the mobilization of savings and allocation of funds for capital formation but also because the conditions attending financial transfers may influence the distribution of income and wealth.
The volume of public debt is controlled by governmental fiscal policy as well as by changing economic conditions. Important changes in the uses and sources of public credit have occurred in the period since 1929 and these changes have affected the entire area of private as well as public finance. The expansion of the functions of government and the recognition that appropriate use of the public credit may be a necessary adjunct to positive economic policy during
VII
Digitized for FRASER http://fraser.stlouisfed.org/ Federal Reserve Bank of St. Louis

depression periods have resulted in a steady growth in outstanding public debt over the past decade. The implications of this trend, together with the interrelations between public indebtedness and the structure of private lending activities, are treated in this report.
This study was prepared in the Bureau of Foreign and Domestic Commerce under the general supervision of M. Joseph Meehan and R. R. Nathan. The tables and manuscript were prepared by J. Wesley Sternberg prior to his transfer to another Government department. Revisions to bring the manuscript up to date were made by Robert B. Bangs and Milton Gilbert. The original Bureau study in this field, undertaken by Donald C. Horton, covered long-term debts only. The present bulletin covers both long- and short-term indebtedness and employs slightly different concepts than did the earlier study.
Acknowledgment is gratefully made for the assistance given by the individuals in many Government agencies who furnished materia] for this report.
C a r r o l l L. W il s o n , Director, Bureau of Foreign and Domestic Commerce.
M a y 1942.
VIII FOREWORD
Digitized for FRASER http://fraser.stlouisfed.org/ Federal Reserve Bank of St. Louis

INDEBTEDNESS IN THE UNITED STATES 1929 41C h a p t e r I
CONCEPTS OF DEBT AND PROBLEMS OF ITS MEASUREMENT
As the American economy in 1942 is being converted from a peacetime to a wartime basis, numerous economic changes of a fundamental character are apparent. War production is causing tremendous shifts in the composition of output and in the balance among industries. The allocation of labor both industrially and geographically is changing and similar changes are occurring in connection with industrial facilities. In the financial sphere new sources of funds are being tapped, and the uses of funds are very different from those in normal peacetime activity.
In part, these financial changes are being reflected in the structure of indebtedness under which our economy operates. Public expenditure is accelerating at a r ipid rate and the fiscal demands of modern war are sharply increasing the public debt. Business indebtedness is shifting in industrial composition, in duration, and in ownership. Consumer debt is decreasing in volume as consumer durable goods become scarcer and as fiscil policy requires more drastic limitation of installment selling.
The developments now taking place in the credit structure of the American economy can best be appraised and analyzed against the background of financial experience over the past decade. In the following pages that part of this financial history which pertains to the relations of debtors and creditors is traced for the period 1929-41. This period was featured by difficult debt adjustments during the years of dee]) depression but by the emergence at the decade’s close of a credit structure rather well adjusted to the current economic situation and tin is able to absorb many of the stresses of war finance.
THE NATURE OF DEBT
Debts arise from the numerous financial transfers which accompany the processes of production, distribution, and consumption of goods and services in the modern economy. From the standpoint of the borrower, debts consist of legal liabilities owed by individuals, by business enterprises, or by governments. From the standpoint of the lender, debts constitute receivables or assets signifying claims against the resources or income of the debtor. Every debt is thus a two-sided affair and implies a contractual relationship between debtor and creditor based on financial transfers.
The lending and borrowing operations which give rise to debt take place under a variety of circumstances and result in many distin-
1
Digitized for FRASER http://fraser.stlouisfed.org/ Federal Reserve Bank of St. Louis

2 INDEBTEDNESS IN THE UNITED STATES
guishable types of contractual relationships between borrowers and their creditors. The generic term “debt” thus comprehends a wide range of both formal and informal obligations differing with respect to circumstances of origin, duration, and provisions for settlement.
In the broadest sense, debts may be defined as all recognized obligations to pay definite sums of money either on demand or at some future stated or determinable date. Thus defined, debts encompass liabilities varying in form from personal obligations on open accounts to claims evidenced by formal notes or indentures and varying in duration from contracts repayable on demand to those extending over many years. Though many debts arise out of actual transfers of funds, others result from the provision of services, from purchases, or from judgments or reorganization proceedings.
AREA COVERED BY THIS REPORT
The comprehensive debt totals presented in this report are estimates of the aggregate volume of all types of indebtedness outstanding in the United States, exclusive of the debts owed by certain financial institutions, such as banks and insurance companies, and excepting certain comparatively minor items specifically indicated below which must be omitted because the relevant primary statistics are too sketchy to permit significant estimation. The figures include short- and longterm debts and interest and non-interest-bearing obligations. In view of the significant difference between public and private finance, the debt aggregates are broken down into public and private debt.
Public debt includes Federal debt, which comprises the outstanding bonds, notes, and bills of the United States Government, plus the obligations of the Reconstruction Finance Corporation, agencies in the farm-loan system and the home-loan system, and the other Federal corporations and agencies. Public debt also includes the debts of States, counties, municipalities, school districts, and all other local governmental divisions and authorities.
Private debt, as defined for purposes of this study, is composed of the debts of corporations, other than credit institutions, and the obligations of unincorporated businesses, nonprofit associations, and individuals. Long-term private debt is represented largely by bonds, notes, and mortgages, while short-term private debt is evidenced chiefly by notes and open accounts. An obligation without maturity elate falls within the meaning of debt as here employed only when it contains provisions which call for fixed interest payments and which give to the lender creditor claims on the assets of the debtor for the principal amount in the event of default on interest payments or in case of nonperformance of other contractual provisions.
VARYING QUALITY OF DEBT STATISTICS
The accuracy of aggregate debt estimates depends to an important degree upon the completeness and availability of primary debt information. Unfortunately, statistics are not equally complete for all types of outstanding debt. Figures which are available for several classes of debt, for example, the debts of the United States Government, represent the full and exact amount of outstanding indebtedness as of a given date, since the data are taken directly from
Digitized for FRASER http://fraser.stlouisfed.org/ Federal Reserve Bank of St. Louis

DEBT AND PROBLEMS OF ITS MEASUREMENT 3
financial statements. Figures for other debt categories, for example, certain classes of debts owed by individuals, are not complete accounting totals but are estimates based upon incomplete basic data. These estimates are naturally subject to varying margins of error, the amount of error being determined by the completeness and applicability of the available information. For certain relatively minor types of debt, such as obligations owed by individuals to other individuals and by unincorporated firms to other unincorporated firms, information is so fragmentary that these figures are omitted from the estimates. In view of such omissions the aggregates understate slightly the total amount of indebtedness outstanding.
The ever-increasing abundance of primary data available during the last several years 1 as appreciably improved the quality of the estimates for certain debt categories and lias permitted the general estimates to be extended so as to cover several of the classes of debt excluded in the previous debt study of this Department.1 The appearance of new information has necessitated frequent revisions of the debt figures and ha* caused some changes to be made in the concepts underlying the estimates. Though these revisions have not increased the accuracy of all the individual series carried into the aggregates, they have materially improved the quality and the coverage of the over-all estim ites.
BASIC CONCEPTS OF DEBT
The size of an aggregate debt estimate is in part determined by the concept of indebtedness employed. Statistics "of debt may be compiled in accordance with concepts ranging from a gross debt aggregate, encompassing all forms of negotiable and nonnegotiable debt obligations, to a net debt concept in wThich duplications are eliminated.
In its broadest sense, gross debt includes, in addition to the debts of final borrowers, the liabilities of all intermediaries who assemble the savings of individuals, corporations, and other initial lenders and who in turn make loans directly or through other intermediaries to home owners, businessn en, consumers, and other ultimate borrowers. For example, when the Federal Government or a Federal corporation issues bonds which pro 'ide funds to purchase mortgages on residential buildings, these debts, which are liabilities of either the Federal Government or its ere lit corporation or of both, are included in the gross debt totals almg with the original mortgage debts. Obligations of banks to de xxsitors and of insurance companies to their policyholders likewise might be said to fall within the definition of gross debt in this inchu ive sense. We have, however, excluded these liabilities from the gross debt totals on the ground that they are not contracts providing for repayment of principal at any certain time. Debts of issuer* held alive by such issuers, for example, in sinking funds, or held by their affiliates comprising a “system” or "'unit” constitute another class of obligations which are included in gross debt.
1 H orton, D onald C., Long-Term Debts in the United S'tates, D epartm ent o f Commerce, D om estic Commerce Series, Bu letin No. 96 (1 98 7 ).
Digitized for FRASER http://fraser.stlouisfed.org/ Federal Reserve Bank of St. Louis

4 INDEBTEDNESS IN THE UNITED STATES
As used in this report, net debt consists of the debts remaining after deductions have been made for the duplicating debts of intermediaries. Duplicating debts are liabilities which have been incurred or recorded at two or more successive stages in the process of investment but which all refer to a single loan of funds to an ultimate borrower.
The magnitude of the deductions from gross debt on account of duplications depends to a considerable extent upon the definition of the basic economic unit adopted for purposes of compiling debt statistics. In the case of private corporations, if the unit consists of a single corporation, then the negotiable and nonnegotiable debt instruments of that corporation issued and held alive as treasury securities or as sinking-fund investments should be deducted for purposes of determining the net outstanding debt of that corporate unit. I f the unit is a corporate system rather than a single corporation, then all liabilities of the parent company and its subsidiaries which are held by any unit within the corporate system should be eliminated in calculating net debt. In other words, purely nominal indebtedness should logically be excluded from the compilations.
For government units, also, amounts of duplicating debt deductible vary in accordance with the definition given a government unit. I f the unit consists, for example, of a municipality, then the debt instruments issued and held by the municipality for its sinking, trust, and investment funds may be considered deductible from its total issued and outstanding debt. I f the unit is defined to consist of a State and all its subdivisions, or of all States and their subdivisions, or of the United States Government and its agencies and all States and their subdivisions, then the debt instruments issued and held by divisions within the indicated unit comprise the obligations to be deducted from the total issued and outstanding debts of that unit. Obviously, the meaning which may be attached to debt estimates, in both absolute amount and trend, varies according to the concepts selected for statistical purposes.
CONCEPTS EMPLOYED IN THIS STUDY
In this survey the gross debt totals include all types and classes of debts irrespective of form, origin, duration, or ownership, except the debts of banks to depositors and the liabilities of insurance companies to policyholders, which are presented and analyzed separately. In the net debt totals, which are more significant from an economic standpoint, duplicating corporate and government debt is eliminated. The unit used in calculating net corporate debt for private corporations is the “corporate system,” composed of companies bound together by a common management. For governmental debts two units are employed. One unit comprises the United States Government and its corporations and credit agencies and the other consists of all State and local governments. The net debt totals of each of these two units represent the debts remaining after obligations issued and held within that unit have been eliminated. Federal debt appears in the combined public and private net debt totals after adjustment for the intermediary debt of the Federal Government and its agencies. .
Digitized for FRASER http://fraser.stlouisfed.org/ Federal Reserve Bank of St. Louis

DEBT AXD PROBLEMS OF ITS MEASUREMENT 5VARIOUS CONCEPTS OF DUPLICATING DEBT
Since the nature and purpose of the various sinking, trust, and investment funds of Federal, State, and local government units are not identical, it follows that the propriety of deducting the security holdings of one class oJ funds in reaching net debt may not apply to other classes of funds. Security holdings of sinking funds are generally considered deductible because in a large majority of cases they consist almost exclusively of issues originated by the government unit establishing the fund, and such securities are held virtually without exception for c irrent or ultimate retirement, in accordance with provisions of the debt contracts.
For example, in 1937, out of total security holdings of 256 million dollars in the sinking fin ds of the 94 cities having a population each of more than 100,000, all but 11 million dollars represented debt obligations of the issuer creating the sinking fund. In the case of State sinking funds, a smaller part of the security holdings consists of debt obligations of the State having jurisdiction over the sinking fund, but, if the securities of local divisions within that State are added, the proport on of such holdings to total holdings, likewise, is large.
Trust and investment funds differ in some respects from sinking funds both in nature *.nd in purpose. Some of these funds, for example, retirement and pension funds, are subject to large ultimate withdrawals, and the accumulation of securities and other assets is for the purpose of providing, in addition to an income, a means of meeting expected outlays. Withdrawals from these funds are controlled not by the rate at which the agency issuing the securities desires to retire its debt but by the disbursement provisions of legislation creating the retirement or pension system.
Certain other trust and investment funds, for example, endowments for libraries, hospitals, and schools, constitute a source of income without which the functioning of the recipients might be impaired. It may be argued, therefore, that such holdings should not be deducted in determining the debt of the issuer administering the fund. However, si] ice no new or additional net liabilities arise from securities issued 'vhen acquired by an agency of the issuer, they are, like sinking-fund holdings, deducted in obtaining net debt in this study.
Under the concept employed in this study, that part of duplicating debt which measures the duplications involved in sinking, trust, and investment funds is restricted to debts issued and held by issuers and their affiliates. Only debts of this character are deducted from gross debt in obtaining net debt.2 Somewhat different results would be obtained if the concept were broadened to include under duplicating debt all debt obligations held, irrespective of the issuer, or if it were broadened still further 1o include all assets of the sinking, trust, and investment funds. By applying each of these concepts to specific cases, the difference in volume of duplicating debt obtained under each concept becomes s ibstantial. For 1937, the sinking funds of
3 Thus, no deduction is made for sec urities issued by the U. S. Governm ent and held in trust or investm ent funds o f Sti te and local governm ents.
Digitized for FRASER http://fraser.stlouisfed.org/ Federal Reserve Bank of St. Louis
6 INDEBTEDNESS IN THE UNITED STATES
the 94 largest cities in the United States contained securities of the respective cities administering the funds to the amount of 245 million dollars. This sum constitutes duplicating debt when each city is defined as the debtor unit. These sinking funds also held other securities in the amount of more than 10 million dollars, bringing the security holdings up to nearly 256 million dollars, a total which constitutes duplicating debt under the first alternative concept. These funds also held cash and other assets of 26 million, bringing the total assets of the sinking funds up to nearly 282 million, which is the amount of duplicating debt under the second alternative concept. It may be contended that the total assets of sinking funds rather than just the debt obligations held in the funds should be used as the figure representing duplicating debt. For sinking funds, it appears that this contention has some merit, particularly since normally all sinking-fund assets are used ultimatelv for debt retirement.
When the two broader concepts of duplicating debt are applied to trust and investment funds, however, their shortcomings as meaningful concepts applicable to all classes of debt become apparent. For example, in 1937, the investment funds of these identical 94 cities held debt securities owed by their own respective city governments to the amount of 5 million dollars and other securities totaling 4 million. In addition, these investment funds held real estate and other assets valued at 698 million. If total assets of investment funds were made deductible from gross debt in obtaining net debt, some governmental units would show no net debt. Thus, totally different results are obtained upon the application of each of the three concepts of duplicating debt.
Net debt, in effect, acquires an entirely different and not wholly unambiguous meaning when the concept of duplicating debt is broadened to include total assets of public investment funds. It can be contended, moreover, that this alternative concept of duplicating debt is less significant in an economic sense since the debt securities of investment funds are held for investment purposes, and since the assets of these funds, consisting as they do of real estate and other property, are seldom used for the reduction of debt.
Similarly, an entirelv different meaning attaches to net debt of private business establishments if either (1) all debt obligations owned or (2) all assets are deducted from outstanding debt obligations. Assume, for the sake of illustration, a private corporation with debts of 100 million dollars, which holds 10 million of its own obligations. 50 million of debt obligations of nonaffiliated companies, and has assets in the amount of 300 million. Under the concepts employed in this study, the duplicating debt is 10 million and the net debt is 90 million; under the first alternative concept in which all debts held are counted as duplicating debt, the duplicating debt wTould be 60 million and the net debt 40 million; under the second alternative concept in which all assets are deductible from gross debt, no outstanding net debt would be shown. Thus, when applied broadly to the entire debt area such deductions as the last two prove useless in measuring duplicating debt and in determining net debt. The concept which restricts duplicating debt to the debt of issuers held by them or by their affiliates is uniformly applicable to all debt areas and results in net debt figures which are useful for analytical purposes.
Digitized for FRASER http://fraser.stlouisfed.org/ Federal Reserve Bank of St. Louis

DEBT AND PROBLEMS OF ITS MEASUREMENT 7
Estimates of the volume of duplicating debt and of net debt are also influenced by the meaning given the term “affiliate.” Stated differently, the amount of debt regarded as “duplicating” depends upon the size of the area embraced by a “unit” of related debtors. Instead of employing two units— (1) the United States Government and Federal corporations and agencies and (2) State and local government divisions—one might consider government, Federal, State, and local alike, as a single unit within which all holdings of government securities by governmental divisions would constitute duplicating debt. The employment of this concept for purposes of arriving at net public debt would result in totals slightly lower than those presented in this study. For example, in 1940, a reduction of 815 million dollars in net debt would be shown since in that year the Federal Government and its agencies held State .md local securities in the amount of 479 million dollars, and State and local units held Federal and Federal agency securities totaling 336 million.
Governmental divisions could also be divided into units so that each of the 48 States and its subdivisions wTould constitute a separate unit. Under this concept only the debts of a State held in funds of the same State would be deducted in calculating net debt. While such a definition differs slightly from the one used in this study, which treats all State and local divisions as a unit, its employment would not greatly change the net debt totals since the bulk of the holdings of State and of local government sinking and trust funds is composed of the debts of units controlling these funds. In practice, the more restrictive concept could not easily ha^e been employed in the present study since current debt statistics do not fully separate securities held in State funds into those issued by the particular State and those owed by some other State.
LONG- AND SHORT-TERM INDEBTEDNESS
In this study, all debts with maturity dates of less than 1 year from date of issue are defined as short-term obligations and most of those with maturity dates beyond 1 year as long-term. This dividing line corresponds with that commonly used by accountants in separating current and fixed liabilities. Because of the nature of the source materials, however, it has not always been possible to adhere rigidly to this classification. For example, the financial statements of steam railways show debts with maturities of 2 years or less as short-term obligations, and some of the governmental credit agencies do not give separate figures for short-term debts—principally because they have few7, if any, of this class of obligations outstanding. Debts of individuals originating from installment purchases of household furniture, refrigerators, automobiles, and so on, even though such debts may be liquidated by periodical payments extending considerably beyond a year, are also classed as short-term. In the main, however, obligations classed as short-term are those which have maturity dates of 1 year or less from the date of their contraction. The classification of debt into long- and short-term has been applied only to private indebtedness.
Digitized for FRASER http://fraser.stlouisfed.org/ Federal Reserve Bank of St. Louis

8 INDEBTEDNESS IN THE UNITED STATES
TREATMENT OF DEFAULTED OBLIGATIONS
Debts of corporations in receivership, together with interest accruals on defaulted obligations, and also obligations of individuals and unincorporated businesses in default are retained in the debt totals until final disposition is made through reorganization or liquidation. Though from a legal standpoint long-term debts in default and unpaid interest accruals on these obligations are considered to be short-term debts, the adoption of such a concept in this study would blur the significant distinction existing between long-term and shortterm obligations. For example, if one followed the strict legal rule in the case of corporate receiverships, all long-term debts in default would become short-term obligations, again to become, in part, longterm debts upon reorganization. Though defaulted debts generally appear along with other outstandings in debt statistics, the precise amount in default is often not ascertainable. Thus, no comprehensive compilation of indebtedness in default has been attempted. Whenever possible, necessary adjustments have been made in primary data to retain defaulted debts in predefault duration categories.
The volume of defaulted debt on any given date is contingent upon the conditions which must obtain before debts are legally declared to be in default, and these conditions vary. For example, building and loan associations may not consider a note secured by real estate to be in default provided payments are adequate to meet interest charges, even though these payments be less than those specified in the contract; in many cases, a default is not declared until interest payments have been in arrears for a certain period of time. Among corporations where many classes of creditors are ordinarily affected, receivership proceedings are typically filed at the time of default on either interest or principal. During the period 1929-41, both the absolute and relative amounts of defaulted debt have varied greatly among different classes of industries and governmental divisions, ranging all the way from no defaults on United States Government obligations to comparatively large defaults in the cases of farm and urban real-estate mortgages and bonds and notes of some industrial and railroad corporations.
Aside from the capacity of the debtor to meet interest charges and to make payments on maturing debt, the principal factor affecting the quantity of defaulted debt is the time elapsing before either reorganization or liquidation is effected. During the decade under review, receiverships of real-estate mortgage companies generally lasted from1 to 3 years, and receiverships of industrial corporations from 2 to 5 years. Railway receiverships extend over an even longer period. All major steam railways in receivership at the beginning of the decade and also those placed in receivership during the decade were still in receivership at the end of 1939.
DEBT ESTIMATES AFFECTED BY CHANGING FINANCIAL ORGANIZATION
As trusts, endowments, and such intermediaries as banks, insurance companies, corporate holding-cbmpany systems, and public lending agencies become more or less important in the economy, they assume a proportionately larger or smaller role in assembling and
Digitized for FRASER http://fraser.stlouisfed.org/ Federal Reserve Bank of St. Louis

DEBT AND PROBLEMS OF ITS M EASUREMENT 9
investing the savings of individuals. Such changes in financial organization tend to be- reflected in the debt structure. Thus, when intermediary institutions, acting as borrowers in assembling savings and as lenders in making investments, become more important, the gross debt totals become larger than would be the case if initial lenders made loans directly to ultimate borrowers. To illustrate, if an initial saver lo med $1,000 directly to an ultimate borrower, the $1,000 would appear only once in the gross debt totals. On the other hand, if an initial lender purchased a Federal agency bond and if that agency in turn lo med the proceeds to an ultimate borrower, then .the debt would appear twice in the gross debt totals. Manifestly, if these intermediary financial institutions become less important as a means of m )bilizing savings, the gross debt totals will show a proportionate decline and will be relatively closer to the net debt figures. While the gross debt totals are thus importantly affected by the structure of intermediary lending agencies, the net debt totals, which exclude debts of intermediaries, remain unaffected.
Changes in financial oi ganization, accompanied as they are by the rise or fall in importance of such agencies as trusts and endowments, not only may affect the amount of accumulated national savings invested m debt obligations but also may exercise an influence on the type of obligations issued to conform to the requirements and preferences of these intermediary investing agencies. A further growth of such agencies, similar to that experienced during the last decade, may result in actual shortages of certain grades and types of public- and private-debt instruments or ultimately may necessitate modifications of investment restrictions some of which modifications would require extensive legislation to permit a wider range of choice in investments by institutional lenders.
SIGNIFICANCE OF CHANGES IN OUTSTANDING DEBT
Changes in the volume of debt from one period to another must be evaluated in the light of the principal factors which bring about economic expansion or contraction. Changes in the volume of aggregate net debt outstanding usually result from many specific developments. For example, debts may be reduced during periods of declining business activity (1) by the consequent lessening in need for financing and (2) by foreclosures and cc rporate reorganizations. During periods of low employment and earn ing power, additional debts may be incurred by some consumers for the acquisition of food, clothing, and other essentials, but this influence is usually more than offset, insofar as total consumer debt is concerned, by the reduction in installment purchases occasioned by a lower level of income.
The fact that aggregaie private debt declines during a period of depression thus does not alter the fact that many new loans may be granted during such period. For example, individuals may mortgage their property, thus adding to the total outstanding debt. Business enterprises may borrow to obtain funds essential to continued operation.
Public debt is, of course, less directly related to the level of economic activity than is private debt since public expenditure is more a matter of governmental policy than a reflection of government need. Thus, during a period when piivate debt is declining, governmental units
464252°—42-------2
Digitized for FRASER http://fraser.stlouisfed.org/ Federal Reserve Bank of St. Louis

10 INDEBTEDNESS IN THE UNITED STATES
may greatly increase their indebtedness for the purpose of building roads, schools, dams, and other public assets which can be built more cheaply in periods of depression and which, at the same time, serve to provide employment for the jobless.
In periods of expansion and prosperity, changes in the aggregate debt volume likewise represent the net effect of many increases and decreases in various classes of debt and in the obligations of different groups of debtors. Some consumers pay off their accumulated debts while others, in anticipation of continued or expanding earnings, buy heavily on credit. Some individuals use their increased earnings to pay off home mortgages; others, to purchase new homes, borrowing additional funds for this purpose. Some business enterprises retire debts, but many require funds for expansion of plant facilities. Increased revenues may permit government units to retire part of their obligations. In general, the tendency is for economic expansion to be accompanied by an increasing volume of private debt, since the increased rate of newr borrowing more than offsets the increased rate of retirement of old obligations.
LIMITATIONS OF THE ESTIMATES
To be significant, interpretations and analyses of debt figures must be made with a full realization of the nature of the estimates, the incompleteness of the figures for certain areas, and the unavoidable delects in some of the statistical methods employed.
There still are numerous gaps in the available source materials for certain debt classes. A case in point is the incompleteness of the records of debts incurred through consumers’ installment purchases. Despite the marked improvement in the available information from the retail trade on accounts and notes receivable, there are many areas in the retail purchases by consumers for which estimates must be made from incomplete debt information, such as, for example, figures covering open accounts of only a sample of the sellers. This is true also, but to a lesser extent, of consumer durable goods purchased on an installment basis.
In the real-estate mortgage field the estimates of the mortgage debt on farms and on unincorporated urban residential and commercial property owed to individuals are based upon substantial but nonetheless incomplete information. Sample studies made by the Bureau of Agricultural Economics covering recorded farm mortgages and by the Federal Home Loan Bank Board of recordings of new mortgages up to $20,000 issued against urban residential real estate have, however, appreciably improved the quality of these debt estimates for recent years. Such studies have also made possible revisions for the earlier years of the decade.
In the large category of corporate debt, intercorporate debt of non- railway companies is based primarily upon a study covering the year 1934, from which date both intercorporate and net corporate debt are estimated by employing the trend of net nonrailway corporate debt, measured by a sample of companies making consolidated statements, compared with the trend of gross nonrailwav corporate debt, shown since 1934 in compilations of the Bureau of Internal Revenue. Even in the field of State and local public debt, extrapolation and inter
Digitized for FRASER http://fraser.stlouisfed.org/ Federal Reserve Bank of St. Louis

DEBT AND PROBLEMS OF ITS MEASUREMENT 11
polation are necessary to develop estimates for the gross debt and net debt totals and for debt holdings in various State and local government funds during intercensal years. In all these categories, however, the development of estimates was aided materially by the existence of a substantial part of the data for noncensus years. Although the inadequacy of data in some areas has made necessary certain broad assumptions, such as those involved in the estimates mentioned above, it is believed that the error in most instances is relatively small and that the estimates can be us<‘d for most purposes.
SUGGESTIONS CONCERNING INTERPRETATION OF THE ESTIMATES
In interpreting the estimates particular attention should be paid to the relative changes in gross and net debt. If the volume of gross outstanding indebtedness doubles during a stated period of time, the meaning of such an increase is entirely different if the increase is due to the growth in debts of end-borrowers owed directly to the initial savers of capital from what it is if the increase is due to a doubling of the debt of intermediary financing agencies. In the former case, the growth in gross debt is matched by an equal dollar increase in net debt; in the latter case, the increase does not result in any increase in net debt. The gross debt increase in the second case reflects merely the fact that more intermediaries have intervened between the lender and the ultimate borrower.
Similarly, an increase in the gross debts owed by one class of intermediaries does not necessarily result in an increase in either the aggregate gross or net debt outstanding provided the increase is offset by a decrease in debts ow ed by other types of intermediaries, i.e., if the debt change is merely a transfer from one intermediary to another. The fact that these transactions were originally transfers does not mean that no increase in gross debt occurred as a result of the transfers. In the case of the Home Owners’ Loan Corporation for example, an increase in gross debt occurred because of the increase in the number of intermediary lenders w7hile some increase in net debt doubtless resulted from the effect wrhich the Home Owners’ Loan Corporation had on the availability of credit for the purchase of housing.
In the field of private debt, an increase or decrease in the number of steps from holding company to operating subsidiary generally results in a corresponding increase or decrease in gross debt while net debt remains unaffected. Even though the financial structure of holding companies remains unchanged, a growth or decline in the assets controlled by them may have some influence on the gross debt total. Similarly, a change in t ie policy of a holding company or any other unit of the corpoiate system with respect to procurement of funds for lending to other units of the system causes a corresponding growth or decline in gross but not in net corporate debt outstanding. The general tendency toward simplification in corporate structure during the decade has resulted in bringing gross and net corporate debt somewhat nearer together through a reduction in intercorporate debt.
It should be observed that increases or decreases in interest rates may greatly alter the total amount of interest payable though the
Digitized for FRASER http://fraser.stlouisfed.org/ Federal Reserve Bank of St. Louis

12 INDEBTEDNESS IN THE UNITED STATES
volume of outstanding obligations may be unchanged. When declines in interest rates result in wide-scale refundings at lower rates, as has been the case in recent years, the amount of interest payable may increase but slowly or even decline in the face of a substantial increase in the principal amount of outstanding gross indebtedness. Finally, it should be noted that the estimates herein presented are expressed in terms of the unpaid face amount of the obligations outstanding, the repayment of which is affected not only by the economic activities of debtors but also by changes in the purchasing power of the dollar.
RELATION TO OTHER STUDIES
The concept of net debt which is employed in the present study differs somewhat from that employed in certain other studies. The only deductions made from total indebtedness in arriving at our estimates of net debt are nominal obligations and the intermediary obligations of financial institutions. In contrast to this concept, the net debt position of any group might be shown in terms of the relation of debts receivable to debts payable. This second concept of “netness” has been employed in a study made by the Twentieth Century Fund, covering the years 1929-37.3
In contrast to the previous debt study of the Department of Com- merce, which covered long-term indebtedness only, the present report also includes short-term corporate and noncorporate debt. The earlier study did not distinguish between gross and net debt in all cases and thus the figures are not strictly comparable with those presented in this report.
8 Debts and Recovery, 1038.
Digitized for FRASER http://fraser.stlouisfed.org/ Federal Reserve Bank of St. Louis

C h a p t e r II
THE VOLUME OF OUTSTANDING DEBT
In this chapter, summary figures on domestic indebtedness covering the period 1929-41 are presented and analyzed. Particular attention is paid to the changing composition of the debt aggregates and to the pattern of change irom year to year in the various series.
COMBINED PUBLIC AND PRIVATE DEBT
Despite the dissimilarity between public and private indebtedness, considerable interest attaches to the combined total and for certain purposes the two may be added together. Any interpretation of this combined total should be qualified, however, since the significance of a change in public debt is quite different from that attending a change in private indebtedness.
NET PUBLIC AND PRIVATE DEBT UP 18 BILLIONS IN 1941
Net indebtedness of individuals, business firms, nonprofit associations, and governmental units in the United States reached an estimated total of 185.1 billion dollars as of December 31, 1941, 18.5 billion, or 11 percent, more than the amount outstanding at the end of 1940. Increases in Federal, State, and local public debt accounted for 12.0 billion, or 65 percent of the rise, while the remainder of the increase was represented by private debt.
Gross indebtedness, consisting of net debt plus duplicating debt, rose during 1941 by 19.6 billion dollars to a year-end total of 219.5 billion.4 Public debt accounted for 13.3 billion and private debt for 6.3 billion of this increase. Corporations and individuals alike contributed to the increase in gross private debt, both their long-term and short-term obligations rising moderately during the year.
The year 1941 was characterized by rapid expansion of war industries and by growing governmental outlays for war purposes. These outlays produced a sharp increase in the indebtedness of the Federal Government, which dwarfed the moderate rise in private debt.
As may be seen from figure 1, changes in the domestic debt structure during 1941 formed a markedly different pattern from that in the previous year. Whereas, in 1940, private debt had for the first time since 1929 increased more than had public debt, in 1941, with the increasing tempo of Government expenditure, this situation was reversed.
COMPARATIVE CHANGES IN PRIVATE DEBT
The comparative patterns of private-debt expansion during 1940 and 1941 have several noteworthy features. Whereas, in 1940, outstanding consumer credit rose markedly as a result of the expansion
4 Not including deposit liabilities o f banks or liabilities o f life-insurance com panies to policyholders.
13
Digitized for FRASER http://fraser.stlouisfed.org/ Federal Reserve Bank of St. Louis

14 INDEBTEDNESS IN THE UNITED STATES
1940 FROM 1939 CLASS 1941 FROM 1940
TO T AL FOR THE PREV IOUS YEAR
Figure 1.— Percentage changes, 1941 from 1940 and 1940 from 1939, in net public and privatedebt, by classes.
Digitized for FRASER http://fraser.stlouisfed.org/ Federal Reserve Bank of St. Louis

VOLUME OF OUTSTANDING DEBT 15
of consumer purchases, in 1941, this series increased only moderately. The curtailment of production of consumers’ durable goods, plus the control of installment credit which became effective on September 1, 1941, had the effect of preventing any great expansion of consumer credit despite the sharp rise in consumer income during the year.
Since increases in the short-term debt of business establishments typically accompany expansion in the volume of trade, the growth of short-term private indebtedness during 1940 and 1941 is indicative of the marked expansion in the dollar volume of business activity which occurred during this period as a result of the mobilization of economic resources for a war effort.
TIMING OF PUBLIC-DEBT EXPANSION
The bulk of the increase in outstanding debt during 1940 occurred during the latter half of the year, mainly because of the financial expansion required by the national defense program. Of the increase of 3 billion dollars in Federal obligations during the entire year 1940, the United States Government incurred 2 billion in the last 6 months of the year to meet, along with its other expenditures, greatly enlarged outlays arising from (1) increases in Army, Navy, and other defense personnel, (2) larger purchases and production of war materials and equipment, and (3) loans and advances made to private business establishments to assist them in financing the expansion of productive facilities.
Throughout 1941 the defense program continued to grow in size and Federal expenditure for rearmament continued to accelerate, thus adding to the deficit and enlarging the Federal debt. Despite the imposition of new and heavier taxes the outlook is for continued expansion of Federal borrowing as the war effort continues.
PRIVATE-DEBT INCREASE A RESULT OF BUSINESS EXPANSION
The expansion of private debt during 1940 was also confined largely to the latter half of the year, about two-thirds of the increase being concentrated in that period. This increase in debt of business enterprises took place through the sale of new bond and note issues and through the securing of new loans from banks and other lenders. It was intended both to finance plant expansion and to provide additional working capital for an increased volume of business, largely induced by national defense activities. During 1941, however, the expansion of private dett was continuous, though the increasing scarcities of many materials, together with the curtailment of many types It was intended both to finance plant expanskm and to provide advances over the previous year. Naturally, the largest increases in debt of business enterprises occurred in those industries of manufacturing and transport where the war-induced expansions in output and capacity have been greatest.
NET DEBT 12.6 BILLION DOLLARS HIGHER IN 1941 THAN IN 1929
Net public and private indebtedness of 185.2 billion dollars outstanding at the end of 1941 was 12.7 billion above the net debt of 172.5 billion outstanding in 1929. Coupled with the increase in population, however, this increase in total net debt was reflected in a level of about the same net indebtedness per capita in 1941 as in 1929.
Digitized for FRASER http://fraser.stlouisfed.org/ Federal Reserve Bank of St. Louis

Table 1.—Net Debt in the United States, 1929-411
Item 1929 1930 1931 1932 1933 1934 1935 1936 1937 1938 1939 1940 1941
Millions of dollars
Total net public and private debt_____________ _____________ 172,522 173,182 166,031 156, 584 150,641 150,1871
151,659 i155, 696 159, 552 158, 289 162,195 167,041 185, 231
Net public debt_________________ ________ ________________ _______ 29, 412 30,097 33,009 35, 507 37, 835 38, 996 41, 897 45, 503 47,134 48, 300 50,765 52, 608 64,667Federal and Federal agencies_______ ____ ________________ ___ 15, 698 15,391 17,091 18, 713 21,028 23,081 25,964 29,470 31. 310 32,618 34, 762 36,397 48,653State and local governm ents_______ __________________________ 13, 714 14,706 15,918 16, 794 16,807 15,915 15,933 16,033 15,824 15.682 16,003 16, 211 16,014
Net private debt_____ _________ __________________ ______________ 143,110 143,085 133,022 121,077 112,806 111, 191 109, 762 110,193 112,418 109, 989 111, 430 114,433 120, 564Long-term debt. -------- ------- ---------------------------------------------------- 86, 565 91,033 89,128 85, 517 80,687 77,275 75,140 73, 214 74, 747 76,110 76, 327 77,361 78,663
Corporate----- ----------------------- ------------------------------ 45,316 48,937 48,027 46,845 45,444 42,828 41, 637 40,361 42,086 43, 428 43, 355 43, 723 44,243Individual and noncorporate _____________ __________ 41,249 42,096 41,101 38,672 35, 243 34, 447 33, 503 32, 853 32, 661 32, 682 32,972 33,638 34,420
Farm mortgage__________ _________ ____ _____________ 9,631 9,458 9, 214 8,638 7,887 7, 786 7,639 7,390 7, 214 7,071 6,910 6,821 6, 787Urban real-estate mortgage ___________________________ 31,618 32, 638 31,887 30,034 27,356 26, 661 25, 864 25, 463 25, 447 25, 611 26,062 26,817 27,633
Short-term debt _______________ __________________ ________ 56, 545 52,052 43, 894 35, 560 32,119 33, 916 34, 622 36,979 37, 671 33, 879 35,103 37,072 41,901Corporate^ ______ ____ _ ____________________ ______ ___ 28, 609 26,119 23,229 20,365 19,199 21,094 21, 164 21, 924 21, 392 18, 447 19, 250 20, 599 22,928Individual and other noncorporate . ______________ 27, 936 25, 933 20,665 15, 195 12, 920 12, 822 13, 458 15,055 16, 279 15, 432 15,853 16,473 18,973
Commercial and for purchase of securities ___________ 19, 794 18, 533 14, 295 10, 472 8, 483 7,840 7, 598 7, 780 8,154 7, 668 7, 548 7, 623 9,380Consumer.----------- ---------- ---------------------------- ------- -------- 8,142 7, 430 6,370 4, 723 4, 437 4,982 5, 860 7, 275 8,125 7, 764 8, 305 8,850 9,593
1'ercentages of total net debt
Total net public and private debt ____________ _______ _ 100.0 100.0 100.0 100.0 100.0 100.0 100, 0 100.0 100.0 100.0 100.0 100.0 100.0
Net public debt _ ................................ __ _____________________ 17 0 17.4 19.9 22.7 25.1 26.0 27.6 29.2 29.5 30.5 31.3 31.4 34.9Federal and Federal agencies_______________ ______ ___________ 9.1 8.9 10. 3 12.0 14.0 15. 4 17.1 18.9 19. 6 20.6 21.4 21.7 26.3State and local governm ents__________________________________ 7.9 8.5 9.6 10.7 11.2 10.6 10.5 10.3 9 9 9. 9 9.9 9.7 8.7
Net private debt______________________________ - ------------------------- 83.0 82.6 80.1 77 3 74.9 74 0 72.4 70.8 70.5 69. 5 68.7 68. 6 65.1Long-term d e b t ------- --------------------------------------------------------------- 50.2 52.6 53. 7 54. 6 53.6 51 5 49.5 47.0 46.8 48. 1 47.1 46.4 42.4
Corporate___________ ____ _____. . . --------------- ------Individual and noncorporate ___________________________
26.3 28.3 28.9 29. 9 30.2 28.5 27.5 25.9 26.4 27.4 26.7 26.2 23.823.9 24.3 24.8 24. 7 23. 4 22.9 22.1 21.1 20.5 20.6 20.3 20.2 18.6
Farm mortgage_______________________________________ 6.6 5.5 5.5 5.5 5.2 5.2 5.0 4.7 4.5 4.5 4.3 4.1 3.7Urban real-estate mortgage _____________ ____ ________ 18.3 18.8 19. 2 19.2 18.2 17.8 17.1 16.4 15.9 16.2 16.1 16.1 14.9
Short-term d e b t ..----------- ----------------------------------- -------------------- 32.8 30.1 26.4 22.7 21.3 22.6 22.8 23.8 23.6 21.4 21.6 22.2 22.6Corporate............ ................... .................................................. 16. 6 15.1 14.0 13.0 12.7 14.0 14.0 14. 1 13.4 11.7 11.9 12.4 12.4Individual and other noncorporate --------------------------------- 16. 2 15.0 12.4 9.7 8.6 8.5 8.9 9.7 10.2 9.7 9.8 9.9 10.2
Commercial and for purchase of securities_____________ 11.5 10.7 8.6 6.7 5.6 5.2 5.0 5.0 5.1 4.8 4.7 4.6 5.1Consumer_____ -------------------------------------------------- 4.7 4.3 3.8 3.0 2.9 3.3 3.9 4.7 5.1 4.9 5.1 5.3 5.2
IND
EB
TED
NE
SS IN
THE U
NITED
STATE
S
Digitized for FRASER http://fraser.stlouisfed.org/ Federal Reserve Bank of St. Louis

Index numbers (1935-39=100)
Total net public and private debt...... ...............
Net public debt___________________________ _________Federal and Federal agencies .................. ...............State and local governments ____ ___________
Net private debt_____ _____ ______ _________________Long-term debt_________________________________
Corporate____________ ______ _______________Individual and noncorporate________________
Farm mortgage__________________ ______Urban real-estate mortgage______________
Short-term debt___ _____ ________ ______________Corporate____________ _____ _________________Individual and other noncorporate__________
Commercial and for purchase of securities. Consumer_______________________________
109.6
63.0 50. 986.3
129.2115.3107.5 125. 213.3
123. 1158.6 140.0183.6 255. 410. 9
110. 0 105. 4 99. 4 95. 7 95. 4 96.3 98. 9 101. 3 100. 5 103.0 105.9 117.664. 4 70. 7 76. 0 81. 0 83. 5 89.7 97. 4 100. 9 103. 4 108.7 112.1 136.849. 9 55. 4 60. 7 68. 2 74. 9 84.2 95. 6 101. 6 305. 8 112.8 117 3 155. 492. 5 100. 1 105. 7 105. 7 100. 1 100.2 100. 9 99. 6 98. 7 100.7 102. 0 100.7
129. 2 120. 1 109. 3 101. 8 100. 4 99.1 99. 5 101. 5 99. 3 100.6 103.3 108.8121. 2 118. 7 113. 9 107. 4 102. 9 100.0 97. 5 99. 5 101. 3 101.6 103.0 104.6116. 0 113. 9 111. 1 107. 8 101. 6 98.7 95. 7 99. 8 103. 0 102.8 103. 7 104.7127. 8 124. 8 117. 4 107. 0 101. 6 101.7 99. 8 99. 2 99. 2 100.1 102.1 104.513. 1 12. 7 11. 9 10. 9 10. 7 10.5 10. 2 10. 0 9. 8 9.5 9.4 9.4
127. 0 124. 1 116. 9 106. 5 103. 8 100.7 99. 1 99. 1 99. 7 101.5 104.4 107.6146. 0 123. 1 99. 7 90. 1 95. 1 97.1 103. 7 105. 7 95. 0 98.5 104.0 117.5127. 8 113. 7 99. 7 94. 0 103. 2 103.6 107. 3 104. 7 90. 3 94.2 100.8 112.2170. 8 135. 8 99. 9 84. 9 84. 3 88.5 98. 9 107. 0 101. 4 104.2 108.3 124.7239, 1 184. 5 135. 1 10. 9 10. 1 9.8 10. 0 10. 5 9. 9 9.7 9.8 12. 1
9. 9 8. 5 6. 3 5. 9 6. 7 7.8 9. 7 10. 9 10. 4 11. 1 11.9 12.8
1 In general, the totals present indebtedness outstanding at the end of the calendar year. Net debt consists of the debts of end-borrowers. Except for minor unavoidable inclusions, it excludes the debts of intermediary financing agencies incurred in assembling savings and making loans to end-borrowers. It excludes, also, the debt obligations of
the Federal Government and Federal agencies held in Federal sinking, trust, and investment funds, the debts of State and local government divisions held in State and local government sinking, trust, and investment funds, and intercorporate debts held by units of a corporate system.
VOLUM
E OF
OU
TSTAND
ING
D
EB
T
Digitized for FRASER http://fraser.stlouisfed.org/ Federal Reserve Bank of St. Louis

18 INDEBTEDNESS IN THE UNITED STATES
After remaining relatively unchanged through 1930, aggregate net debt fell one-eighth to 150.6 billion dollars in 1933. From 1930 through1933, the large decreases in private debt (resulting from payment, foreclosure, and liquidation) and a greatly diminished rate of new borrowing much more than offset increases in public debt. Prominent among the types of debt which decreased rapidly from 1929 through 1933 were brokers’ loans, bank loans, consumer installment obligations, and other short-term debt.
During 1934, the net debt aggregate continued to recede to 150.2 billion, the lowest year-end total for the 12-year period, in spite of the fact that an upward trend in business, which is often attended by an increase in debts of business enterprises, had been in progress since the spring of 1933. The continued decline in outstandings during 1933 and 1934 resulted primarily from delayed debt deductions taking place through mortgage foreclosures and through the termination of corporate receiverships.
Legislation enacted to relieve distressed mortgage conditions existing in 1933 sharply reduced foreclosures of mortgages on urban resi-BILLIONS OF DOLLARS 2 5 0
200
150
100
5 0
PUBLICSH O R T-TER M PRIVATE LO NG -TERM PRIVATE
t f i r r t T i n
i t t t tIII III II II
1920 1930 1931 1932 1933 1934 1935 1936 1937 1938 1939 1940 19410.0. 41-369
Figure 2.— Net debt in the United States, by types, 1929-41.
dential property and farm land by 1934, but debt reductions arising from liquidation or readjustment of corporate debt continued in volume until 1937. After 1934, these reductions, together with retirements by payment, were more than offset by increases in other debt categories, and aggregate net debt rose annually from 1935 until the end of 1941, with the single exception of 1938.
GROSS DEBT ABOVE 1929 LEVEL
Gross public and private debt, after increasing from 194.8 to 195.9 billion dollars during 1930, declined to 175 billion by 1933, a slightly smaller percentage decline than experienced by net debt during the same years. Unlike net debt, which continued to decline moderately during 1934, gross debt increased more than 7 billion to total 182.4
Digitized for FRASER http://fraser.stlouisfed.org/ Federal Reserve Bank of St. Louis

VOLUME OF OUTSTANDING DEBT 19
billion at the close of that year. This increase in aggregate gross debt is attributable in the main to the enlarged volume of debts incurred by Federal agencies for the purpose of obtaining funds to refinance farm and urban residential real-estate mortgages in distress. The intermediary debt thus created by this refinancing of existing mortgages appears in gross debt, but is excluded from net debt since the debts of end-borrowers were not increased in the refinancing process. The fact that these debts of Federal agencies were incurred to finance already-existing private debts does not mean that the portion of Federal debt arising from this type of expenditure can be entirely neglected. The total Federal debt and the interest payments thereon both were increased by these refinancing operations, which in effect involved the substitution of public for private credit. After 1934, aggregate gross debt continued to show annual increases, except for 1938, and at the end of 1941 totaled 219.4 billion dollars, 24.6 billion more t*han the gross debt outstanding in 1929.
Table 2.— Gross Debt in the United States, 1929-41[M illio n s o f dollars]
Item 1929 1930 1931 ! 1932 ; 1933 1934 1935
Total gross public and private debt 194,839 195,873 187,711 178, 840 1174, 966 182, 353 184, 289
Gross public debt . . . -------------- 35, 404 36,375 1 39,182 43, 154 1 48, 176 57,274 60, 882Federal and Federal agencies .. ______ - 18, 170 17, 916 19, 648 i 23,350 | 28, 191 37, 988 . 41,453
Federal. ___________ 16, 301 16, 026 17, 826 20, 805 1 23,815 1 28,480 1 30,557Federal agencies ____________ 1,869 1, 8S0 1,822 2,545 4, 376 9, 508 [ 10,896
State and local governm ents____ _. 17, 234 18, 459 19, 534 19, 804 19,985 19,286 19, 429Gross private debt _ . . _ - -------------- - 159, 435 159, 498 148, 529 135, 686 126, 790 125, 079 123,407
Long-term debt . _ ______ . -------------- 96, 597 301,865 99, 715 95,818 90, 653 1 86,658 84, 252Corporate. ________ 55, 348 59, 769 58, 614 57, 146 55,410 . 52,211 50, 749Individual and noncorporate _____ 41,249 42, 096 41, 101 38, 672 35, 243 34, 447 33, 503
Farm mortgage ______ 9, 631 9, 458 9, 214 8, 638 7, 887 7, 786 7, 639Urban real-estate mortgage_____ 31,618 32, 638 31,887 30, 034 27, 356 26, 661 25, 864
Short-term debt_._ . . . . .. 62, 838 57, 633 48,814 39, 868 36, 137 38, 421 39,155Corporate... . 34, 943 31.901 28,350 24, 842 23, 409 25, 716 25, 796Individual and other noncorporate _ 27, 895 25, 732 20, 464 15,026 12, 728 12, 705 13, 359
Commercial and for purchase ofsecurities _____ 19, 753 18,332 14, 094 10,303 8, 291 7, 723 7, 499
C o n s u m e r _____ . . . _ . 8, 142 7. 400 6, 370 4, 723 4,437 4,982 5, 860
Item 1936 1937 1938 1939 1940 j 1941
Total gross public and private debt 188,011 192,727 189, 177 193, 215 199, 954 219, 508
Gross public debt. . . -------------- . 64, 732 67, 354 67, 033 69,896 73, 343 86, 598Federal and Federal agencies.. . _______ 45, 070 47, 760 47, 457 49,900 53, 097 66, 415
Federal .. .. ______________ 34, 406 37, 286 39, 439 41, 961 45, 024 57, 938Federal agencies ________ . . . 10, 664 10, 474 8, 018 7,939 8, 073 8, 477
State and local governments _ _______ 19, 662 19, 594 19, 576 19, 996 20, 246 20,183Gross private debt. _______ ______ ______ 123, 279 125, 373 122,144 123,319 126, 611 132, 910
Long-term d e b t_____ ___ _ _ _____ .. 81, 783 83, 445 84, 815 84, 772 85, 638 86, 860Corporate . _ _ ________ 48, 930 50, 784 52,133 51,800 52, 000 52, 440Individual and noncorporate _. . 32, 853 32, 661 32, 682 32, 972 33, 638 34, 420
Farm mortgage _______ 7, 390 7, 214 7, 071 6,910 6, 821 6, 787Urban real-estate mortgage. ____ 25. 463 25, 447 25, 611 26, 062 26,817 27, 633
Short-term debt . . . . . . . . _ _________ 41, 496 41, 928 37, 329 38, 547 40,973 46,050Corporate.. . . ......... 26. 579 25, 813 22,146 23, 000 24, 500 27, 077Individual and other noncorporate___ 14,917 16,115 15,183 15, 547 16, 473 18, 973
Commercial and for purchase of securities __________________________ 7, 642 7, 990 7,419 7, 242 7, 623 9, 380
Consumer_______________________ 7, 275 8, 125 7, 764 8. 305i
8, 850 9, 593
Thus, at the end of 1941, an intermediary or duplicating debt of 34.3 billion dollars was outstanding, against a net indebtedness of 185.1 billion by end-borrowers, a ratio of 1 to 5.4. This compares
Digitized for FRASER http://fraser.stlouisfed.org/ Federal Reserve Bank of St. Louis

2 0 INDEBTEDNESS IN THE UNITED STATES
with 22 billion of intermediary debt and 173 billion of net debt for 1929, a ratio of 1 to 8. This change in ratios indicates a very marked change in the financial organization of society—a marked change in the methods of mobilizing savings. It indicates that a smaller number of savers made loans directly to end-borrowers in 1941 than in 1929 and other earlier years. Instead, more savers placed their accumulations with intermediaries for safekeeping and investment. A larger proportion of the Nation’s savings was held in unemployment insurance funds, pension funds, or by intermediary financial agencies.
PUBLIC DEBT
TREND OF PUBLIC DEBT UPWARD
Net public debt, that is, the balance of obligations outstanding against all government divisions in the United States but not held in government funds or offset by loans receivable from the public,
1929 1930 1931 1932 1933 1934 1935 1936 1937 1938 1939 1940 1941
Figure 3.— Gross and net public debt in the United States, 1929-41.
increased in each year of the 1929-41 period, from 29.4 billion at the beginning of the decade to 64.7 billion at the close of 1941. Federal debt accounted for the bulk of this increase by rising from 15.7 billion to 48.7 billion, but State and local government debt also increased by about 2.5 billion dollars during the period. The increase in public debt daring the thirties was the result of a rapid expansion in the number and scale of government services, most of which were undertaken to mitigate the social and economic effects of the depression and were aimed at promoting business recovery and economic readjustment.
Gross public debt rose from 35.4 billion dollars in 1929 to 86 6 billion dollars in 1941, an increase of more than 50 billion for the12-year period. Owing to substantial increases in the intermediary debt of Federal, State, and local governmental units, this increase was larger both in amount and in percent than the increase in net
Digitized for FRASER http://fraser.stlouisfed.org/ Federal Reserve Bank of St. Louis

VOLUME OF OUTSTANDING DEBT 21
public debt. Except for 1938, gross public debt increased in each year from 1929 through 1940, the largest increases occurring in 1933,1934, and 1941, when year-end outstandings were increased by 5, 9, and 13 billion dollars, respectively.
Of the three major classes of public debt, gross Federal debt made the largest increase during the period 1929-41 in rising from 16 to 58 billion dollars. Increases of 4.7 billion in 1934, 4 billion in 1936, and 13 billion in 1941 were the largest yearly changes in gross Federal debt. In 1933, the United States Government made large outlays for relief and large advances to its established and newly created agencies. Both these activities required the issuance of an increased volume of new debt obligations. In 1936, Federal expenditures were augmented by payment of the adjusted service certificates. Following the passage of the Social Security Act in 1935, gross Federal debt began to increase appreciably as a result of the issuance of debt obligations designated as “special issues.” These issues were placed and held in the unemplovment-insurance and old-age pension funds in accordance with provisions of the Social Security Act. In 1939, the addition of Federal debt obligations to these funds exceeded 1 billion dollars. The rise in Government expenditures, especially in those outlays occasioned by the national defense program, resulted in an increase of 3 billion dollars in gross Federal debt in the calendar year 1940. This increase was small, however, compared with the13-billion-dollar rise in gross Federal debt during 1941.
Table 3.— Gross and Net Debt of the United States Government and Federal Corporations and Agencies, 1929-41
[Millions of dollars]
Item 1929 1930I
1931 1932 1933 1934 1935
Total gross Federal debt_____________ 18,170 17,916 19, 648 23, 350 28,191 37, 988 41,453
United States Governm ent_________________ 16,301 16,026 17, 826 20, 805 23, 815 28, 480 30, 557Interest-bearing_________________________ 16, 029 15, 774 17, 528 20, 448 23,450 27, 944 29, 596
Public issues.------------------------------- - 15, 401 14, 993 17,135 20,097 23,079 27, 386 28,868Bonds_________ . . ____________ 12,110 12,113 14, 298 14, 223 15, 569 16, 245 14, 672Notes_______ - ----- 1,885 1, 561 600 3,075 4, 880 9,187 11, 792Certificates of indebtedness and
Treasury bills . . . ___ - - 1,406 1,319 2,237 2, 799 2, 630 1,954 2,404Special issues to Government agencies
and trust funds. _________ _____ 628 781 393 351 371 558 728Non-interest-bearing____________________ 272 252 298 357 365 536 961
Debt bearing no interest. ______ 232 230 244 293 300 4i>5 737Matured debt on which interest has •
ceased........................... - ------- ---------- 40 22 54 64 65 51 224Federal agencies ........... ............................ . 1,869 1,890 1,822 2, 545 4, 376 9,508 10,896
Farm loan system ______________________ 1,869 1,890 1,822 1, 735 1,819 3, 267 3,693Homo loan system _____ 27 2,407 2,855Reconstruction Finance Corporation 810 2, 530 3,834 4, 348Other Federal corporations and agencies ____ ■ __
Total duplicating debt________________ 2, 472 2, 525 2, 557 4, 637 7,163 14, 907 15,489
United States Government and Federalagency holdings of United States Government securities_______ __ ______ ___ . . 928 704 503 611 953 2, 840 1,731
United States Government and Federalagency holdings of Federal agency securities--- -------------------- --------------------------------- 116 116 111 918 2, 459 4, 653 5, 322
Loans receivable held by Federal agencies___ 1,428 1,705 1, 943 3,108 3, 751 7,414 8, 436
Total net Federal debt________________ 15, 698 15, 391 17,091 18, 713 21,028 23,081 25,964
Digitized for FRASER http://fraser.stlouisfed.org/ Federal Reserve Bank of St. Louis

2 2 INDEBTEDNESS IN THE UNITED STATES
Table 3.— Gross and Net Debt o the United States Government and Federal Corporations and Agencies, 1929-41— Continued.
Item 1936 1937 1938 1939 1940 1941
Total gross Federal d e b t____________ ____ ____ 45.070 47, 760 47, 457 49, 900 53, 097 66, 415
United States Government ______ _________________ 34, 406 37, 286 39, 439 41, 961 45, 024 57, 938Interest-bearing . _____________________________ 33, 699 36, 715 38, 911 41, 465 44. 458 57, 451
Public issues___________ __________________ _ 33,067 34, 488 35, 754 37, 234 41, 544 50, 470Bonds__ ________ ______ ____ __________ 20. 575 21, 989 25,952 29, 576 32,101 40. 000Notes_____________________. . . . _________ 10, 289 10, 547 8, 496 6,203 6, 178 8,468Certificates of indebtedness and Treasury
bills___________ . . _____ 2,203 1,952 1,306 1,455 3, 265 2,002Special issues to Government agencies and
trust funds . __ _________________________ 632 2. 227 3,156 4, 231 2,914 6,981Non-interest-bearing _ _ _____________________ 707 571 528 496 566 487
Debt bearing no interest _ _ _ _______ ____ 554 472 427 398 377 362Matured debt on which interest has ceased___ 153 99 101 98 189 125
Federal agencies . __________________ . ___________ 10, 664 10, 474 8, 018 7, 939 8,073 8. 477Farm loan system_______________________________ 3, 732 3, 557 3, 464 3, 356 3,922 3, 925Home loan system. _ ___ _ ____ ______________ 2,995 3, 015 2, 988 2, 800 3,034 2. 729Reconstruction Finance Corporation __________ 3, 937 3, 902 1,264 1,107 1,097 1,802Other Federal corporations and agencies ________ 302 676 20 21
Total duplicating debt__________________ _____ 15.600 16, 450 14, 839 15,138 16, 700 17, 762
United States Government and Federal agency holdings of United States Government securities . _
United States Government and Federal agency holdings of Federal agency securities. ._ .................. .......
Loans receivable held by Federal agencies __________
Total net Federal debt________________________
2, 528
4,910 8,162
3.800
4.801 7, 849
4, 990
1,985 7, 864
6,166
1,222 7, 750
7, 542
1,212 7, 946
8, 352
9238,487
29, 470 31.310 32, 618 34, 762 36, 397 48, 653
Source- Reports of the Treasury Department and Federal corporations and agencies.
COMPOSITION OF GROSS FEDERAL DEBT
Of the gross Federal interest-bearing debt of 57.9 billion dollars outstanding at the end of 1941, bonds accounted for 40 billion dollars; notes, 8.5 billion; certificates of indebtedness and Treasury bills, 2 billion; and special issues, nearly 7 billion. Treasury bonds comprise obligations with maturity dates of 5 or more years from date of issue; notes consist of obligations with maturity dates of between 1 and 5 years; and Treasury bills consist of debt instruments with maturity dates of less than 1 year from date of issue. In governmental finance, short-term obligations do not necessarily signify short-term needs for funds. Instead, the relative uses made of shortterm and long-term obligations are determined by such factors as differentials in long-term and short-term interest rates, the conditions of the financial and security markets, and the fiscal policies of the Treasury.
A small part of the gross debt of the United States Government represents non-interesjt-bearing debt. At the end of 1941, non- interest-bearing debt totaled 487 million dollars, or approximately 0.8 percent oi the total Federal Government indebtedness. Non- interest-bearing debt consists of obligations, such as United States notes, which are required to be reissued when redeemed. It also includes obligations that will be retired upon presentation, such as national bank notes and Federal Reserve bank notes assumed by the United States on deposit of lawful money for their retirement, as well as fractional currency, thrift stamps, and Treasury savings stamps. A third class of Federal non-interest-bearing indebtedness
Digitized for FRASER http://fraser.stlouisfed.org/ Federal Reserve Bank of St. Louis

VOLUME OF OUTSTANDING DEBT 23
consists of matured debt on which interest has ceased. The last- mentioned item totaled 125 million dollars as of December 31, 1941.
Gross debts of Federal corporations and agencies outstanding in 1929 consisted of obligations of the Federal land banks and other agricultural credit agencies which in that year totaled 1,869 million dollars. All of these obligations, except to an amount of 116 million dollars, were held by nongovernment investors. The volume of Federal agency outstandings was increased by the creation of the Reconstruction Finance Corporation in 1932, by the absorption of the joint-stock land banks, and by the development of Land Bank Commissioner and other agricultural loans. In the period immediately following its organization, the Reconstruction Finance Corporation obtained its funds from, and issued its debt obligations to, the United States Government, which in turn raised the needed funds by the sale of its own issues of bonds and notes. In the later years of the period under review, the Reconstruction Finance Corporation made public offerings of its own debt issues. The largest year-end outstandings of Reconstruction Finance Corporation debt obligations were 4,348 million dollars for 1935, of which obligations in the amount of 4,095 million were held by the United States Government or by its agencies. As of June 30, 1940, Reconstruction Finance Corporation debts totaled 1,103 million dollars. All of these debts, except obligations in the amount of 7 million, were held by nongovernmental investors. As of December 31, 1941, the outstanding debt of the Reconstruction Finance Corporation had risen to 1,802 million dollars.5
Outstandings of Federal agencies were further augmented during these years by the creation of new agencies, chief among which, from the viewpoint of debt obligations issued, was the Home Owners’ Loan Corporation established in 1933. To provide funds with which to refinance distress mortgages on nonfarm homes, this agency issued debt obligations which reached a vear-end peak of 3,015 million dollars in 1937. By June 30, 1940, Home Owners’ Loan Corporation outstandings had receded to 2,652 million dollars, and they continued to fall to a figure of 2,416 millon at the end of 1941.
Since 1934, the larger part of the debt issues of Federal agencies has been guaranteed by the United States Government. At the end of 1940, guaranteed issues held by nongovernmental investors amounted to 5,917 million dollars. These consisted of 696 million dollars of Commodity Credit Corporation notes, 1,269 million of Federal Farm Mortgage Corporation bonds, 13 million of Federal Housing Administration debentures, 2,600 million of Home Owners’ Loan Corporation bonds, 1,097 million of Reconstruction Finance Corporation notes, and 226 million of United States Housing Authority notes. When the United States Government enacted legislation to guarantee outstanding Federal agency issues, the yield of these agency securities naturally found a level approximating that of United States Government obligations. In 1940, Federal land bank issues were the only ones outstanding in substantial volume not guaranteed by the United States Government.
• Bonds, notes, and debentures, exclusive o f accrued interest, in the hands o f the public.
Digitized for FRASER http://fraser.stlouisfed.org/ Federal Reserve Bank of St. Louis

24 INDEBTEDNESS IN THE UNITED STATES
STATE AND LOCAL GOVERNMENT DEBT
The net indebtedness of State and local governments in the United States increased most rapidly during the years 1930-33, when these government divisions were forced to make heavy outlays for relief as a result of the rapid increase in unemployment. In 1933, the bulk of this burden was assumed by the Federal Government and, consequently, State and local governmental net debt remained fairly stable at about 16 billion dollars all during the 1934-41 period.
Gross debt of State and local governments rose from 17.2 billion dollars in 1929 to 20.2 billion in 1941. Unlike the figures for the debts of the United States Government and Federal agencies, these figures as an aggregate do not refer to any specific date. The fiscal years of the more than 180,000 State and local governmental units fall on many different dates throughout the calendar year, although the fiscal years of a large majority end either on December 31 or on June 30. In this bi-modal distribution of fiscal periods, nearly two- thirds of the States have fiscal years ending June 30, while a rather large number of the cities have fiscal years ending December 31. Some State and local governments changed their fiscal periods during 1929-41.
Table 4.— Gross and Net Debt of State and Local Governments, 1929-41 1[Millions of dollars]
Item 1929 1930 1931 1932 1933 1934 1935
Total gross d eb t____________________ 17, 234 18, 459 19, 534 19,804 19,985 19, 286 19,429
Interest-bearing 2_--------- ------------------------N on-interest-bearing___________________ 1
Local government___________ ___________ -Interest-bearing______________ _______Non-interest-bearing................................ i
2. 300 2, 233
67 14, 934 14, 527
407
2, 4442, 377
6716,015 15, 608
407
2, 666 2, 599
67 16, 868 16, 461
407
2,896 2,829
67 16, 908 16, 501
407
3,018 2,958
60 16,967 16, 560
407
3,201 3,148
5316,085 15, 679
406
3,331 3, 286
4516,098 15, 693
405
C o u n ty .- .......................................... .......... 'Municipal 3__----------------------------------------School district__________________________Special district-______ _________________
2, 270 9, 259 1.956 1, 449
2, 4349,929 2,098 1, 554
2, 564 10, 458 2, 210 1,636
2, 565 10, 483 2, 207 1, 653
2, 521 10, 577 2,142 1, 727
2, 4779, 730 2, 078 1,800
2,433 9, 778 2,013 1, 874
Total duplicating debt........... ................ 3, 520 3, 753 3,616 3.010 3,178 3, 371 3,496State and local government:
Sinkine fund__________________ ________ 2, 281 2,4181,335
2,141 1, 475
1,399 1, 417 1,761
1,436 1, 935
1,454 2,042Investment and trust fund______________ 1, 239 1, 611
State__________________ ________ __________ - 1,143 402
1,204412
1,290 1, 403 471
1,525496
1, 663 521
1, 763Sinking fu n d .............. ................................- 446 546Investment ana trust fund_____________
Local government__________________________Sinking fund___________________________Investment and trust fund______________
7412, 377 1,879
498
792 2, 549 2,006
543
844 2, 326 1,695
631
9321,607
928679
1,029 1, 653
921 732
1,142 1, 708
915 793
1,217 1, 733
908 825
Total net debt......................................... 1 13,714 14, 706 15,918 16, 794 16, 807 15,915 15,933
State - ______________________________ 1,157 12, 557
1,240 13, 466
1,376 | 14,542
1,493 15,301
1,493 15,314
1, 538 14,377
1, 568 14,365Local covernment_______ _______ - .......... -
i Adapted from reports of the Bureau of the Census and the Treasury Department, i Excludes State loans to local government units.* Municipal divisions include cities, towns, villages, boroughs, and townships.
Digitized for FRASER http://fraser.stlouisfed.org/ Federal Reserve Bank of St. Louis

VOLUME OF OUTSTANDING DEBT 25
Tabl^ 4.— Gross and Net Debt of State and Local Governments, 1929-41— Con.
Item 1936 1937 1938 1939 1940 1941
Total gross debt............................... ..................... . 19, 662 19, 594 19, 576 19,996 20, 246 20,183
State_______ ____________ _____ _____________ ______ 3,318 3,276 3, 309 3, 343 3, 526 3,370Interest-bearing 2.... ............ . . . ______ ________ . 3, 277 3, 242 3, 277 3,313 3,498 3,334Non-interest-bearing______ ______________ ___ 41 34 32 30 28 36
Local government - _______________ ________________ 16, 344 16, 318 16, 267 16. 653 16, 720 16,813Interest-bearing __________ _______ _______ _ 1.5,941 15, 918 15, 887 16,298 16, 393 16,476Non-interest-bearing. __________________________ 403 400 380 355 327 337
County________ _______ ________________________ 2, 389 2, 345 2, 282 2, 219 2,156 2,046M unicipal3______________________________________ 10,058 10, 067 9, 923 10, 215 10,189 10,210School district___________________________________ 1, 949 1,884 1,860 1,837 1, 813 1, 787Special district_________________________________ 1,948 2,022 2,202 2, 382 2, 562 2, 770
Total duplicating debt___________ ____________ 3, 629 3, 770 3, 894 3, 993 4,035 4,169
State and local govemment:Sinking fund____________________________ ________ 1, 473 1,491 1,501 1,530 1, 535 1,649Investment and trust fund________ _____________ 2,156 2, 279 2, 393 2, 463 2, 500 2, 520
State_____________________ __________________________ 1,868 1, 979 2,056 2,107 2,137 1,826Sinking fund___________ __________ ____ ________ 571 596 606 632 637 416Investment and trust fund______________________ 1,297 1, 383 1, 450 1,475 1, 500 1,410
Local government - ____ _________________ ____ . . . 1,761 1,791 1,838 1,886 1,898 2,343Sinking fund____________________________________ 902 895 895 898 898 1, 233Investment and trust fund______________________ 859 896 943 988 1,000 1,110
Total net d e b t..____________ __________________ 16,033 15,824 15, 682 16,003 16, 211 16,014
State ________________ ____________ _________________ 1, 450 1,297 1, 253 1,236 1, 389 1,544Local govemment ________ ______ ____ ____________ 14, 583 14,527 14,429 14, 767 14,822 14,470
2 Excludes State loans to local government units.3 Municipal divisions include cities, towns, villages, boroughs, and townships.
Gross State and local government debts experienced their most pronounced rise in the early part of the period 1929-41, when they advanced more than 2.7 billion dollars during the 4 years 1929-33. This increase in gross debt was slightly smaller than the increase in net State and local government debt over the same period. Some of the State and local government outlays during these years were met by nonmaintenanc'e of sinking, trust, and investment funds rather than by resorting to new borrowing. From 1933 through 1938, gross debts of State and local governments receded slightly because of reduced outlays for public works and relief following increased outlays by the United States Government. This shifting of the relief load enabled the State and local governments to add to the securities in their debt-retirement and special-purpose funds, thus producing the slight decrease in outstanding debt during this 5-year period. From 1939 through 1940, debts both at gross and net levels rose moderately following resumption by State and local governments of a somewhat larger share of relief costs, together with enlarged outlays for public improvements. In 1941, State and local government debt declined slightly. This change is a result of the increase in State and local government revenue accompanying the rise in national income plus the fact that expenditures had not risen appreciably.
The gross debts of States aggregated 3.4 billion dollars in 1941— equal to approximately one-sixth of total State and local government debt. This represents a somewhat larger share than that obtaining in1929, when State debt outstandings comprised slightly less than one- seventh of State and local government debt. Enlarged payments for
464252°— 42-------3
Digitized for FRASER http://fraser.stlouisfed.org/ Federal Reserve Bank of St. Louis

26 INDEBTEDNESS IN THE UNITED STATES
direct relief, grants and advances to local subdivisions, pensions, and public works were the principal factors instrumental in bringing about this relatively moderate increase in the gross debt of States.
Since the difference between gross and net State and local government debts consists of securities held in sinking, trust, and investment funds, it should be kept in mind that both State and local government securities are included in the holdings of the various funds of either State or local government units and that the holdings in a State fund need not consist entirely of the debt issues of the State having jurisdiction over the fund. In most cases, however, especially in the case of sinking funds, holdings consist almost entirely of liabilities of the issuer creating and controlling the funds. Thus, though the securities in State and local government funds are not exclusively nominal debt, the error in so regarding these funds is relatively small.
Of the four local governmental divisions—municipalities, school districts, counties, and special districts—outstanding debts of three registered declines during recent years. Municipalities (including townships), the largest debtors in the local group, decreased their debts from 10.5 billion dollars in 1932 to 10.2 billion in 1941. Counties lowered their outstandings from 2.6 billion in 1932 to 2.0 billion in 1941. School districts decreased their outstanding obligations from 2.2 billion dollars in 1932 to 1.8 billion in 1941. It should be remembered that the debts of school districts do not comprise the entire school debt of local government divisions. Municipalities, townships, and counties, particularly in instances w7here school districts have not been created, issue their own debt obligations for the construction of school buildings and for other school purposes. In 1940, outstanding indebtedness of municipalities and counties for educational purposes amounted to 1,024 million dollars, substantially the same as the amount outstanding in 1932.
Beginning in 1933, financial aid from Federal agencies to local governments for the purpose of partially defraying the cost of public works and relief lessened the need of these local divisions for new funds from traditional sources and thus made possible a decrease in the rate of new borrowing. Similarly, larger sums received from States enabled local government divisions to carry on relief work and other activities without proportionate increases in debt. From 1932 through 1940, State aid, including grants and the share of local government divisions in State-collected taxes, rose from 600 million dollars to more than 1.5 billion dollars. An increase of approximately 350 million dollars in locally collected taxes during the same period further tended to reduce the need for the issuance of debt obligations.
Only special districts showed an increase in outstanding debt from1932 through 1941. Under special districts are included a wide variety of overlapping local governmental divisions, such as drainage, levee, and irrigation districts; sewage and sanitary districts; and public utility, port, tunnel, and local housing authorities. On June 30, 1940, the local housing authorities had outstanding debts of 318 million dollars. Both the variety of functions performed and the many localities served by these special districts are reflected in the following list of the 18 largest districts. The various local housing authorities are referred to but not individually listed.
Digitized for FRASER http://fraser.stlouisfed.org/ Federal Reserve Bank of St. Louis

VOLUME OF OUTSTANDING DEBT 27Table 5.—Outstanding Debts of Selected Special Districts, as of June 30, 1940 and
1941[Thousands of dollars]
Special district
229, 431 190,985168, 588 187,110110, 583 114, 56898, 500 98, 50097, 598 98. 59757, 235 55, 60563, 320 51, 53341, 800 40, 80040,116 45,11638, 550 11,00037,054 36, 60035,000 35,00030, 632 29,11625,000 25,00023,183 45,14623,161 26, 54020, 300 0)19, 793 0)
317, 638 0)
Port of New York Authority__________________________Metropolitan Water District of Southern California___Chicago Sanitary District--------------------------------------------Triborough Bridge Authority---------------------- ----------------Chicago Park District_______________ _______ _________East Bay Municipal Utility District__________________Boston Metropolitan District_____________ ___________Pennsylvania Turnpike Commission.____ ____________New York City Tunnel Authority____________________Coachella Irrigation D istrict_______________________Delaware River Joint Commission_________ ______ ___Golden Gate Bridge and Highway District____________Los Angeles County Flood Control District___________Northern Colorado Water Conservancy District_______Imperial Irrigation District____________________________Salt River Valley Water Users’ Association____________Lower Colorado River Authority______________________Central Nebraska Public Power and Irrigation District Various local housing authorities___________________ _
1 Not available.
As shown in table 4, a small part of State and local government debt is non-interest-bearing. The largest item of this long-term non- interest-bearing debt consists of 40-year bonds of western land reclamation districts held by the United States Bureau of Reclamation. Short-term non-interest-bearing debt of State and local governments consists mainly of accounts due but unpaid. A part of the decline shown in State and local government non-interest-bearing debt in recent years has been due to a change in the definition of debt. Current bills, in earlier years frequently treated as debt, more recently have not been classed as debt until the accounts became overdue.
PRIVATE DEBTTRENDS IN NET PRIVATE DEBT, 1929-41
Net private debt, composed of all long- and short-term obligations of final borrowers other than governments, stood at 143.1 billion dollars at the end of 1929. (See table 1.) Of this aggregate more than 60 percent, or 87 billion, was long-term while the remainder had been contracted, at least nominally, mainly for a period of 1 year or less. All during the 1929-41 period, changes in net private longterm debt were smaller than those taking place in short-term obligations. This is to be expected since short-term obligations can be adjusted to changing economic conditions much more readily than can long-term debts.
In 1930, net private debt held to the previous year’s level. Even though short-term obligations fell by 4% billion dollars, because of declines of more than 2 billion each in corporate and noncorporate obligations, the increase in long-term debt of corporations and the higher debt of individuals on real-estate mortgages approximately offset the reduction of short-term indebtedness.
In 1931, however, net private debt fell precipitously, by 10 billion dollars, 8 billion dollars of this being the decrease in short-term indebtedness. Similar decreases of 12 and 8 billion in net private debt
Digitized for FRASER http://fraser.stlouisfed.org/ Federal Reserve Bank of St. Louis

28 INDEBTEDNESS IN THE UNITED STATES
followed in 1932 and 1933, respectively. At the end of 1933, shortterm private debt was only 32 billion, compared with the 56 billion outstanding at the close of 1929. Meanwhile, long-term debt, though lower each year after 1930, had fallen less than 6 billion below its 1929 level. Thus, by the end of 1933, short-term private debt had fallen, in dollar terms, about four times as far as had long-term private debt, and considerably more than that in relative terms.
Beginning in 1934, short-term private debt rose in accompaniment to the business recovery, but long-term obligations continued to be reduced. Thus, though short-term outstandings rose by nearly 2 billion in 1934, long-term debts were reduced nearly 3y2 billion, largely through reorganizations and repayments. Corporations were still adjusting their financial structures to depression conditions, even though recovery was well under way by December 31,1934.
The years 1935 and 1936 saw the same pattern—long-term private debt falling, but short-term obligations rising, as the recovery pro-BILLIONS OF DOLLARS 120
100
8 0
60
40
20
01929 1930 1931 1932 1933 1934 1935 1936 1937 1938 1939 1940 1941
D.D. 41-367
Figure 4.— Long-term private debt in the United States, by types, 1929-41.
gressed. By the end of 1936, however, long-term debt had reached a final low and in 1937 it rose iy2 billion, against an increase of only 700 million in short-term obligations. Adjustment in the long-term debt structure had reached a point where new capital financing was in sufficient volume to more than offset the retirement and cancellation of old debt contracts.
The year 1938 saw private long-term net debt continuing to advance by more than 1 billion but the business recession of that year was reflected in a sharp 4-billion-dollar decrease in the short-term debts of final corporate and individual borrowers. In 1939, both short- and long-term private debt increased, and in 1940 and 1941, under the stimulus of the defense program, the rate of increase in both types of obligations was accelerated. At the end of 1941, however, long-term private debt was still 8 billion dollars below the level for 1929 while short-term obligations were nearly 15 billion below the 1929 short-term figure.
Digitized for FRASER http://fraser.stlouisfed.org/ Federal Reserve Bank of St. Louis

VOLUME OF OUTSTANDING DEBT 29GROSS PRIVATE DEBT
Private indebtedness, as tabulated in this study, is composed of the long-term and short-term debts of corporations, of individuals, and of other noncorporate borrowers. Continuing the upward movement inaugurated in 1939, gross private debt increased in 1941 to a year- end total of 132.9 billion dollars, up 6.3 billion for the year and up 10.8 billion from 1938, when gross private debt reached its low for the 1929-41 period. The 1941 total, however, was nearly 27 billion dollars, or IT percent, lower than that at the end of 1929. Aggregating close to 160 billion in 1929, gross private debt was maintained at that level through 1930 before dropping abruptly to 127 billion at the close of 1933. It continued to decline in the period 1934-36 but at a much slower rate. Thus, beginning in 1931, gross private debt decreased for 6 consecutive years. Then, in 1937, it rose moderately, only to decline to a new low of 122.1 billion dollars in 1938. The annual advances since that year have been relatively small.
There was a marked difference during the period in the behavior of gross long-term private debt, compared with gross short-term. In contrast with the drop in short-term obligations, long-term outstandings rose 5.3 billion dollars—from 96.6 to 101.9 billion—during1930. An increase from 55.3 to 59.8 billion dollars in the bonded and other long-term debt of corporations accounted for four-fifths of the rise, while increases in urban real-estate mortgages owed by individuals and noncorporate groups acounted for the remainder. A part of the difference in trend between long-term and short-term outstandings was due to the funding of short-term debt incurred originally to finance construction programs begun before 1930. At the end of 1931, long-term outstandings were still 3 billion dollars above the 1929 total. Though business activity had declined and construction in many lines had fallen off appreciably, public utilities carried on a substantial construction program through 1930 and 1931. To finance this construction these companies increased their long-term outstandings by the close of 1932 to 16 billion dollars, the high point for the period. During the latter part of 1930 and in 1931 and 1932, the investment and security markets no longer readily absorbed bond issues, and, accordingly, a large part of these public-utility debt increases took the form of long-term loans from affiliates or from banks. The debts of both holding and operating companies increased as a result of the above-mentioned construction program. Obligations of public-utility holding companies, however, reached their peak in 1931, while those of operating companies moved to a slightly higher level in 1932.
Urban real-estate mortgages owed by individuals and noncorporate groups constitute the remaining class of long-term debt to rise from 1929 to 1930. This category increased 1 billion dollars in 1930, largely as a result of office building, hotel, and apartment house construction, much of which was begun in 1929. By the end of 1932, urban real-estate-mortgage outstandings had receded to a level slightly below 1929, in contrast with the net debts of private corporations as a whole, which were still above the 1929 level, and with those of public utility corporations, which were still moving upward. Farm-mortgage debt, shown in table 12, w as the only class of longterm debt to move lower in 1930. During that year, farm-mortgage
Digitized for FRASER http://fraser.stlouisfed.org/ Federal Reserve Bank of St. Louis

30 INDEBTEDNESS IN THE UNITED STATES
outstandings were reduced 200 million dollars, from 9.6 billion dollars to 9.4 billion.
Beginning in 1931, gross corporate and noncorporate long-term debt began to decline at an accelerated pace. It did not reach its low of 81.8 billion dollars for the 12-year period until 1936—3 years after gross private short-term debt had reached its minimum for the period. One factor delaying the start of the decline and accelerating the rate of decline when it did begin was delayed action relating to the disposition of debts, including interest accruals on defaulted obligations, of corporations in receivership.
1929 1930 193! 1932 1933 f934 1935 1936 1937 1938 1939 1940 1941D.D. 41-475
Figure 5.— Indexes of components of long-term private debt in the United States, 1929-41.
From 1936 through 1941, total private long-term debt, at both the gross and net levels, moved narrowly higher. Attention is called to the fact that gross and net long-term private debts are identical in composition except for the intercorporate obligations of corporate systems under a common management.
Other long-term private debts, such as farm mortgages and urban real-estate mortgages, are deb.ts of end-borrowers and accordingly appear at the same level in both the net and gross debt totals.
Gross private long-term debt during 1936-41 moved from 85 percent to 90 percent of the 1929 figure, or from 81.8 billion dollars to 86.8 billion. More than 3 million of this increase was in corporate longterm debt—an increase that merits special examination. Two factors are mainly responsible for this increase in long-term debts of corporations. In the first place, bank loans of short duration, commonly renewed at maturity, were to some extent replaced by loans drawn for a period of 1 year or more. In the second place, since 1937, more detailed income-tax returns have been submitted by corporations and in these statements notes payable are segregated into (1) those with maturity dates of less than a year and (2) those with maturity dates of more than a year from date of issue. This additional information has resulted in the classification as long-term of many obligations
Digitized for FRASER http://fraser.stlouisfed.org/ Federal Reserve Bank of St. Louis

VOLUME OF OUTSTANDING DEBT 31
previously tabulated as short-term. Undoubtedly this second factor is primarily responsible for the increase in gross long-term corporate debt from 49 billion dollars to 50.8 billion in 1937.
SHORT-TERM PRIVATE DEBT
Private short-term debts, as here defined, consist of debt obligations, with maturity dates generally of less than a year from date of issue, owed by private corporations, individuals, and noncorporate groups. In tables 1 and 2 the latter are grouped into noncorporate short-term debts (a) arising from commercial and financial activities and (b) originating in the purchase of consumer goods on a def erred-payment basis. Since these classes represent the debts of end-borrowers, their gross and net debt totals are identical. Only in the case of short-term corporate debt is there a difference in the gross and net aggregates. Gross short-term corporate debt consists of liabilities owed to creditors outside a corporate system plus intercorporate debts held by the issuer
BILLIONS OF DOLLARS6 o -------------------------------------------------------------------------------------------
5 0
4 0
3 0
2 0
10
01929 1930 1931 1932 1933 1934 1935 1936 1937 1938 1939 1940 1941
D.D. 41-368
Figure 6.— Short-term private debt in the United States, by types, 1929-41.
or by affiliates within a corporate system. Net short-term corporate debt consists only of those obligations owed to creditors outside the corporate system. The volume of gross private short-term debt measured by year-end outstandings dropped from 62.9 billion dollars in 1929 to 57.6 billion in 1930. This trend was in contrast with increases in gross private long-term debt in that year.
Gross private short-term debts continued to drop sharply and in1933 reached a low of 36.1 billion, 43 percent below the 1929 total and the low point for the entire period 1929-41. These debts then rose to 42 billion by December 31, 1937. After dropping sharply in 1938, they recovered to a 46-billion level at the end of 1941. The sharp drop in i938 was caused in part by the slackening in business activity during the second half of 1937 and during 1938 and by a further reduction in commercial and financial debts of individuals; but the major part of the decline was due to an improved method of reporting notes pay
CONSUMERNONCORPORATE COMMERCIAL
CORPORATE
II III I 1 I 1 1 1 i
1
I I 1 1 1 1 1 1 1 I I I
Digitized for FRASER http://fraser.stlouisfed.org/ Federal Reserve Bank of St. Louis

32 INDEBTEDNESS IN THE UNITED STATES
able. As a result of these changes in the method of reporting notes payable, a part of the debts previously shown as short-term was allocated to long-term in 1938 and subsequent years. Another fact worth noting is that bank loans, which formerly were made on a 3- or 6-month basis and not infrequently renewed at maturity, have, in recent years, been more commonly made into initial loans of a duration of 1 year or more.
S h o r t -T e r m C r e d it f o r C o m m e r c ia l P u r p o s e s
Of the three classes of short-term private debts, those incurred for business or commercial purposes, including loan balances for the purchase of securities, experienced the largest and most sustained decline. Totaling 19.8 billion dollars in 1929, these debts fell to 7.7 billion in 1934, a figure equal to only 40 percent of their 1929 total, and then continued to recede moderately to a new low of 7.2 billion by 1939. One important reason for the sharp decline in the early years of the
1929 1930 1931 1932 1933 1934 1935 1936 1937 1938 1939 1940 1941
Figure 7.— Indexes of components of short-term private debt in the United States, 1929-41.
period and the continued decline later is that these figures contain customers’ obligations owed to brokers—obligations which amounted to 5 billion dollars at the end of 1929, but which fell to only 906 million dollars at the close of 1939, reaching a low of 606 million in 1941. This class of short-term debt also contains balances owed by individuals to banks on loans secured by bonds and stocks. The volume of these bank loans on securities was particularly large in 1929 and 1930, when the banks were furnishing credit for speculation, but, since bank loans against securities were not segregated from those made for other purposes, it is not possible to separate speculative debt from other bank loans. A part of the loans from banks represents borrowings used to finance the purchase of consumer goods, but the exact portion of the loans made for this purpose cannot be determined. The desire of business establishments—corporate and noncorporate alike—to increase the rate of inventory turn-over and, accordingly, to reduce
Digitized for FRASER http://fraser.stlouisfed.org/ Federal Reserve Bank of St. Louis

VOLUME OF OUTSTANDING DEBT 33
the need for cash and credit in financing a given volume of business also has contributed to the low level, compared wTith that of 1929, of this series during recent years.
Despite a further drop in brokers’ loans to customers in 1940, the figures indicate that borrowing by individuals and unincorporated firms for business purposes during the latter half of the year was in sufficient volume to arrest an uninterrupted 10-year decline beginning in 1929 and to bring about a small upturn in the loans incurred for commercial and financial purposes. This trend was strongly reinforced during 1941 and by the end of the year these outstandings had risen by 23 percent.
T r e n d s i n t h e V o l u m e o f C o n s u m e r C r e d it
Debts arising from the purchase of consumer goods and services, covering both open-account and installment types of credit financed either by vendors or by banks and financing companies, also declined sharply during the early part of the decade. These obligations, as measured by year-end outstandings, dropped from 8.1 billion dollars in 1929 to 4.4 billion in 1933, a decrease of 45 percent. Unlike the series comprising debts incurred for commercial and investment purposes, consumer outstandings were as responsive to the rise in the volume of business as they had been to the earlier decline. They advanced steadily from 1933 and in 1937 regained their 1929 level. Reflecting the downward trend in business and employment which began in 1937, consumer debts fell 360 million dollars in 1938. With improving trade and employment, consumer outstandings recovered in 1939, and in 1940 exceeded by more than 700 million dollars the level established in 1937. The year 1941 saw a continued advance in outstanding consumer credit despite the fact that the trend in this series was sharply downward during the last quarter.
In addition to the uplift from business improvement, the rise in consumer debt in recent years has been due in part to a broader use of credit by consumers. This has taken the forms (a) of lengthening the time of payment on charge-account and installment-payment plans and (b) of extension of credit selling to more lines of retailing. I f allowance is made for the rising trend resulting from more general use of installment selling, fluctuations in outstanding consumer credit have paralleled very closely the changes in national income.
As might be expected, gross short-term corporate debts were much more responsive than were long-term corporate debts to a decline in the volume of business, but they fell less rapidly from their 1929 level than did the short-term debts of individuals. Totaling 35 billion dollars in 1929, gross short-term corporate debts declined to 23 billion in 1933. Responding only partially to a larger volume of business, they recovered to a moderately higher level during the 4 following years, but fell to a new low for the period in 1938. As previously explained, improved methods of reporting revealed that a substantial part of the debts formerly classed as short-term were more properly long-term since they had maturity dates of 1 year or more from date of issue. Accordingly, the figures for 1938-41 reflect this change, the transfer of probably as much as a billion dollars of short-term to longterm corporate debt being effected. Though consideration was given
Digitized for FRASER http://fraser.stlouisfed.org/ Federal Reserve Bank of St. Louis

34 INDEBTEDNESS IN THE UNITED STATES
to the question of revising the figures for corporate short-term and long-term debt for 1929-37 as a result of the findings, it was decided that in this instance unrevised figures would give a better portrayal of debt information. However, in certain other instances, adjustments and corrections which are described in detail in the appendix were made in the corporate debt information for 1929-41.
Two other factors have contributed to the reduction of gross shortterm debts in recent years. Many corporations have carried on a given volume of business with smaller inventories and lower outlays, thus necessitating smaller loans, and others have made their purchases on more nearly a cash basis than formerly. For these reasons, gross short-term corporate debts, while still highly responsive to changes in the volume of business, moved in a range substantially below the 1929 level. From 1938 through 1941, they moved upward by 22.6 percent to a total of 27.1 billion dollars—a total which was only 78 percent of that for 1929.
DUPLICATING DEBT
Duplicating debt, as previously described, consists of the debt issued and held by issuers or their affiliates and debt incurred by intermediaries in assembling savings and making them available to ultimate users of capital funds. At the end of 1941, duplicating debt totaled 34 billion dollars, compared with net indebtedness of 185 billion owed by end-borrowers, a ratio of $1 of duplicating debt to each $5.40 of net debt. This constitutes a substantial increase from 1929, when duplicating debt was 22 billion and net debt 173 billion, a ratio of $1 to $8. Such a change indicates a marked variation both in the financial organization of the economy and in the investment habits of savers. In 1929, a larger proportion of accumulated savings was represented by loans directly to home owners, owners of business property, farmers, and operating corporations than in 1941. During the thirties, a growing proportion of savings reached industry through intermediaries, since these savings were placed in unemployment insurance and pension funds, or were used to purchase life-insurance policies, or were deposited in checking or savings accounts.
Adding the liabilities of banks and life-insurance companies to duplicating debt, as defined in this study, there existed, in 1940, $1 of such combined duplicating debt for each $1.38 of outstanding net debt of end-borrowers, compared with a ratio of $1 to $1.88 for 1929. This is indicative not only of the very large amount of intermediary debt outstanding but also of the pronounced trend away from direct loans by savers to end-borrowers and toward the indirect transfer of individual savings through intermediaries to end-borrowers.
A pronounced increase took place in all classes of duplicating debt except intercorporate debt, which, in response to an offsetting trend toward simplification of the structure of corporate systems, showed a moderate shrinkage during the period 1929-41. An examination of the figures given in table 6 reveals that short-term and long-term intercorporate debt holdings declined 25 percent, from 16.4 billion dollars in 1929 to 12.3 in 1941. Since gross corporate debt including railway obligations declined only 15 percent and gross corporate debt excluding railway obligations declined 20 percent, it is apparent that intercorporate debt was a somewhat smaller component of gross cor
Digitized for FRASER http://fraser.stlouisfed.org/ Federal Reserve Bank of St. Louis

VOLUME OF OUTSTANDING DEBT 35
porate debt in 1941 than in 1929. The greater part of the decline in intercorporate debt occurred during the more recent years of the period when many industrial and public utility corporate systems reduced the number of their subsidiaries by consolidation, thus diminishing the volume of their intercorporate obligations.
DUPLICATING DEBT OF THE UNITED STATES GOVERNMENT AND FEDERALAGENCIES
As described in chapter I, for purposes of measuring duplicating debt and determining net debt governmental divisions and their agencies have been combined into two major units: (1) The Federal Government with its corporations and agencies and (2) State and local governments. Intergovernmental holdings by divisions within each unit, together with debts incurred by governments when acting as financial intermediaries, constitute the duplicating debt of government. In 1929, intergovernmental holdings of Federal debt and Federal intermediary debt amounted to 2,472 million dollars, as shown in table3. Of this sum, 928 million consisted of United States Government obligations held by the United States Government and Federal agencies, the agencies at that time comprising Federal land banks only. Another 116 million consisted of Federal land-bank bonds held by the United States Government and its agencies and a final 1,428 million consisted of intermediary debt of the Federal land banks as calculated by referring to their loans receivable from end-borrowers. These loans to final borrowers duplicate the debts of Federal land banks, which totaled 1,869 million in 1929. Since only one purpose was served in this chain of loans, namely, that of providing funds to farmers, the 1,428 million dollars loaned to end-borrowers must be deducted from Federal land-bank outstandings of 1,869 million to obtain net debt. In addition, there must be deducted 116 million, which represents the volume of Federal land-bank bonds held by the United States Government and its agencies. This leaves 325 million of Federal land-bank bonds held outside the Federal Government that were not offset by receivables, and this figure appears in the net debt totals for 1929.
The volume of duplicating debt of the Federal Government and its agencies remained almost stationary until 1932, when it rose by2 billion dollars, to 4.6 billion, a rise due principally to the lending program of the Reconstruction Finance Corporation established in that year. From 1932 to 1935 duplicating debt mounted rapidly, to 15.5 billion, chiefly because of the enlarged financial aid extended to borrowers by lending agencies of the farm-credit system, by the Reconstruction Finance Corporation, and by the Home Owners’ Loan Corporation. After 1935, duplicating debt represented by intragovernmental holdings of the securities of Federal corporations and agencies fell substantially, the drop being due in part to the reduction of Federal-agency debt outstanding and in part to the sale to nongovernmental investors of Federal-agency securities previously held by the Federal Government or by its agencies.
Starting in 1935, the United States Government began to enlarge its holdings of Federal obligations because of the provisions of the Social Security Act, thus offsetting the decline in duplicating debt of Federal agencies. Special issues of the United States Government,
Digitized for FRASER http://fraser.stlouisfed.org/ Federal Reserve Bank of St. Louis

36 INDEBTEDNESS IN THE UNITED STATES
that is, issues placed in the unemployment and old-age pension funds, increased the amount of direct Federal Government obligations held by the funds of the United States Government and its agencies from 1.7 billion dollars in 1935 to 8.4 billion as of December 31, 1941. At the end of 1941, Federal and Federal-agency duplicating debt stood at 17.8 billion dollars, a gain of more than 1 billion during the year and a figure more than seven times that for 1929. Deducting duplicating debt from the combined gross debt of the United States Government and its agencies, which totaled 66.4 billion dollars as of December 31, 1941, leaves a net debt of 48.7 billion outstanding for the Federal Government and Federal agencies on that date.
DUPLICATING DEBT OF STATE AND LOCAL GOVERNMENTS
State and local government duplicating debt, comprised of obligations of State and local governments held by those divisions in their various funds, totaled 4.2 billion dollars in 1941, equal to nearly one-fourth of the net, and approximately one-fifth of the gross, State and local government debt. In that year, as shown in table4, 1.6 billion, or approximately three-eighths of the duplicating debt, consisted of sinking-fund holdings, more than 74 percent of which was held by sinking funds of municipalities and other local government units.
The sinking funds maintained by State and local government units are of two classes, those containing investment holdings and those not containing such holdings. The sinking funds without security holdings are maintained primarily to purchase and retire serial bonds or to amortize debt obligations by repurchase prior to their maturity. These objectives are usually accomplished without the accumulation of securities or other assets in large amounts since the governmental unit by its sinking-fund provisions merely reduces its own indebtedness. The sinking funds with security holdings are also established and maintained primarily to purchase and hold for redemption at maturity securities of the issue for which they were created, but the securities held need not be those issued by the governmental division establishing the fund. One principal purpose of converting accumulated cash into securities is to increase the earning powder of the funds intended for debt retirement.
The remaining class of State and local government duplicating debt consists of securities of those divisions held in their public trust and investment funds. In 1941, these holdings aggregated 2.5 billion dollars, or five-eighths of the volume of duplicating debt. Under public trust and investment funds are included all funds other than sinking funds. Public trust funds are established by States, cities, and other local government divisions to administer moneys and other forms of wealth that come to them by donation, bequest, or otherwise, under such conditions that the recipient becomes a trustee charged with the administration of the fund and with disbursements for designated public uses from it or out of income derived from its principal. The most common purposes for w7hich these funds are created are the support of schools and libraries, the maintenance of health and hospital services, the care of defectives, and the provision of pensions for teachers and other employees. Some of these funds have become large in recent years.
Digitized for FRASER http://fraser.stlouisfed.org/ Federal Reserve Bank of St. Louis

VOLUME OF OUTSTANDING DEBT 37
The designation “investment funds” includes a wide variety of funds established for many different purposes. They may be funds created to acquire assets in consideration of financial aid or grants to railroads or other public service corporations. They may consist of funds securing rents or of bonds and mortgages received in exchange for real property and held as investments awaiting maturity or a favorable market. Some are accordingly of relatively short duration, existing until such time as the assets remaining in the fund can be turned over to the general treasury. Funds accumulated for the purchase, construction, or equipment of buildings or other permanent properties of State and local governments, and invested in income-bearing obligations during the period of accumulation, are also treated as investment funds. These funds sometimes have large holdings in real estate, corporate stocks and bonds, and assets* other than State and local government securities. In calculating net debt, only securities of State and local governments appearing as assets in these funds are deducted from the gross debt totals. Other assets cannot rightly be deducted, as such assets, unlike those of sinking funds, are ordinarily not applied to debt retirement.
The volume of State and local government securities held by governmental sinking funds and by trust and investment funds, and the ratio of these holdings to gross and net State and local government debt, varied greatly from 1929 through 1941. In 1929, State and local government securities held in sinking funds of those divisions totaled 2,281 million dollars, almost twice the holdings of trust and investment funds. Four-fifths of these sinking-fund holdings were those of local division funds. From 1930 through 1932, the holdings of local government sinking funds dropped from 2,006 million to 928 million. This pronounced reduction was occasioned chiefly by the retirement at maturity of securities to the value of 728 million dollars in various sinking funds of New York City. From 1933 through 1940, holdings of local government sinking funds remained steady at a level approximating 900 million dollars. In 1941, these sinking- fund assets rose sharply to 1,233 million. Holdings of State sinking funds rose from 402 million in 1929 to 416 million in 1941, but this comparatively small increase represented a much smaller relative change than did the decline in the holdings of local government funds. Holdings of State and local government sinking funds considered as a unit declined appreciably during 1929-41. Conversely, holdings of State and local government trust and investment funds doubled during the period, totaling 2.5 billion in 1941.
It should be pointed out that the quality of State and local government debt statistics varies somewhat for different years. Census figures, or those obtained from joint questionnaire surveys of the Bureau of the Census and the Treasury Department which show State debts as separate from local government debts, are available only for 1929-1932, 1937, 1940, and 1941. For the remaining years, special compilations were made of State debts from the financial reports of each of the 48 States. When questions arose relating to whether borderline debts should be classed as State or local government, the basis of classification used in the census years was followed. The margin of error in the State debt totals for these intercensal years probably does not exceed 1 percent. For intercensal years,
Digitized for FRASER http://fraser.stlouisfed.org/ Federal Reserve Bank of St. Louis

38 INDEBTEDNESS IN THE UNITED STATES
figures on the debts of local governmental divisions were obtained by deducting the State debt from the State and local government debt as estimated by the Department of the Treasury. In order to arrive at figures on net State and local government debt, special studies for intercensal years were made of State and local government debts held in the sinking, trust, and investment funds of these government divisions. The studies covered all States, and all cities with a population of 100,000 or more, plus a sample of smaller cities. They make possible reasonably good estimates of securities held in these funds, and thus permit calculation of net debt for the intercensal years.
Digitized for FRASER http://fraser.stlouisfed.org/ Federal Reserve Bank of St. Louis
C h a p t e r III
THE COMPONENTS OF PRIVATE DEBT
This chapter presents somewhat more detailed estimates of the major components of the private-debt structure than those presented in chapter II. For many purposes these detailed figures are more significant.
DEBTS OF CORPORATIONS
In table 6; corporations are classified as railway, public utility, and industrial, financial, and miscellaneous. A more detailed industry classification of corporations on a strictly comparable basis, by years, for 1929-41 is not possible owing to changes in industry classification arising from modifications in the revenue acts and to changes in classification made by the Bureau of Internal Revenue. Provisions in the Revenue Act of 1934, requiring all corporations except steam railroads to file unconsolidated tax returns, produced major shifts in industry classifications. Modifications in the Revenue Acts of 1932 and 1935, relating to consolidated returns, likewise affected industry grouping though to a lesser extent.
In classifying consolidated returns industrially, a corporation was assigned to an industry on the basis of the predominant industrial activity of the consolidated group. In classifying unconsolidated returns for each subsidiary or unit of the consolidated group, each corporation was classified according to its own predominant industrial activity, which in many instances differed from the predominant industrial activity of the affiliated group of corporations of which it was a member. A special tabulation of 1934 returns showed that the effect of the shift from consolidated to unconsolidated returns was to reduce the number of firms in the manufacturing group, and to increase the number in the extractive and merchandising classifications. Many corporate systems engaged jointly in extractive activities, in manufacturing, and in trade were classified under consolidated returns as manufacturers since this was their predominant activity. But when each unit filed an unconsolidated return, the return was classified according to the predominant activity of that unit.
I f no other difficulties existed the classifications for 1929-33 could be adjusted with reasonable accuracy to an unconsolidated basis in accordance with the findings of the special tabulation of 1934 returns, since 1929-33 was virtually a standstill period in corporate organization. However, two other difficulties stand in the way of such a reclassification, insofar as studies of indebtedness are concerned. In the first place, the change from consolidated to unconsolidated returns resulted in the appearance of a large new sum of intercorporate debt in the unadjusted debt totals. This intercorporate debt, an undetermined proportion of which is the debt of holding companies, aver
39
Digitized for FRASER http://fraser.stlouisfed.org/ Federal Reserve Bank of St. Louis

40 INDEBTEDNESS IN THE UNITED STATES
aged $1,640,300 per consolidated return and approximately one-fourth that sum for each unconsolidated return. But since the size of the corporate systems and the volume of intercorporate debt manifestly vary greatly from industry to industry, it would be virtually impossible to apportion accurately the aggregate intercorporate debt for all industries to different industry classifications. To determine from existing data how much below or above the average per return the intercorporate debt was in specific industries is likewise difficult. In the second place, the compilations for 1934 and for all other years prior to 1938 do not contain information which makes possible an apportionment of holding-company debts to specific industries.
These deficiencies in the primary source material, which lead to errors when minor industry classifications are attempted, do not, however, mar the quality of classifications when only broad groupings are undertaken.
Digitized for FRASER http://fraser.stlouisfed.org/ Federal Reserve Bank of St. Louis

Table 6.— Gross and Net Corporate Debt, 1929-41 1[Millions of dollars]
Item 1929 1930 1931 1932 1933 1934 1935 1936 1937 1938 1939 1940 1941
GROSS CORPORATE DEBT
Total, all corporations................ .............................................. . _ 90, 291 91, 670 86, 964 81,988 78, 819 77, 927 76, 545 75, 509 76, 597 74, 279 74,800 76, 500 79, 517Long-term_________________________________ _____ _____ 55, 348 59, 769 58, 614 57,146 55,410 52, 211 50, 749 48,930 50,784 52,133 51, 800 52, 000 52, 440Short-term_ _................. .................. ................. ................. . 34, 943 31, 901 28, 350 24,842 23, 409 25, 716 25, 796 26, 579 25, 813 22,146 23,000 24, 500 27,077
Railway corporations____________________________________________ 14, 638 14,885 14, 838 14,968 15,011 15, 052 15, 037 15, 508 15, 532 15, 683 15,833 15,900 15,968 OLong-term_____________ _____________________________________ 13, 415 13, 709 13, 690 13,831 13, 786 13, 788 13, 662 13, 993 13,964 13, 969 13, 963 13, 963 13, 963 OShort-term_____________ __________________________ ______ _ 1,223 1,176 1,148 1,137 1,225 1, 264 1,375 1,515 1,568 1, 714 1, 870 1,937 2,005 g
Nonrailway corporations________________________________________ 75, 653 76, 785 72,126 67,020 63, 808 62, 875 61,508 60, 001 61, 065 58, 596 58,967 60, 600 63, 549Long-term ..._____________ ___________________________________ 41, 933 46,060 44, 924 43,315 41, 624 38, 423 37, 087 34, 937 36, 820 38,164 37,837 38,037 38, 477 oShort-term.......... ................... .......................... ............ ...................... 33, 720 30, 725 27, 202 23, 705 22,184 24, 452 24, 421 25, 064 24, 245 20, 432 21,130 22, 563 25,072 3Public utilities____________________ ____ ________ _________ ___ 17, 213 18, 648 18, 307 18, 386 17, 710 17,097 16, 742 15, 871 16,136 16,197 16,005 15,993 15, 991 a
Long-term _____ _________________________________________ 14, 467 15, 665 15, 839 16,071 15,874 15,135 14, 776 14, 241 14, 427 14, 469 14, 324 14, 338 14, 355 t—3Short-term_____ ___ _____________________________________ 2, 746 2,983 2, 468 2,315 1, 836 1, 962 1,966 1,630 1,709 1,728 1,681 1,655 1,636 XSl
Operating companies_______________________________ ____ 14, 693 15,828 15, 387 15, 566 14, 940 14, 377 14,122 13, 331 13, 633 13, 716 13, 536 13, 536 13, 546 oLong-term___________________________________________ 12, 267 13,165 13, 239 13, 571 13, 424 12, 735 12, 476 12, 021 12, 242 12, 304 12,169 12,193 12, 220 hr*Short-term_____ ______________________________________ 2, 426 2, 663 2,148 1,995 1,516 1,642 1,646 1,310 1, 391 1, 412 1,367 1,343 1,326
Holding companies___________ ____ _______________________ 2, 520 2, 820 2, 920 2, 820 2, 770 2, 720 2, 620 2, 540 2,503 2, 481 2, 469 2,457 2,445Long-term________ ______________________________ .. 2,200 2,500 2,600 2,500 2, 450 2, 400 2, 300 2,220 2,185 2,165 2,155 2,145 2,135 S3Short-term________ _ _______________________ 320 320 320 320 320 320 320 320 318 316 314 312 310
Industrial, financial, and miscellaneous._____ _________________ 58, 440 58,137 53, 819 48, 634 46, 098 45, 778 44, 766 44,130 44, 929 42, 399 42, 962 44, 607 47, 558 >Long-term ...____ ________________ _____ _________________ 27, 466 30, 395 29, 085 27, 244 25, 750 23, 288 22, 311 20, 696 22, 393 23, 695 23, 513 23, 699 24,122 HShort-term_____ __________________ ________ ______ ______ 30, 974 27, 742 24, 734 21, 390 20, 348 22, 490 22, 455 23, 434 22, 536 18. 704 19,449 20,908 23,436
0 perating companies_____________ ______ __________ ______ 55, 861 55,374 51, 218 46, 220 43, 796 43, 639 42, 704 42,181 42, 870 40, 301 40,879 42,491 45, 390 OLong-term_____________________________________ ____ _.! 25,310 28,011 26, 822 25,123 23, 727 21, 457 20, 556 19, 068 20, 641 21,851 21,693 21,864 22, 254 ft!Short-term___________________________________________ 30, 551 27, 363 24, 396 21,097 20, 069 22,182 22,148 23,113 22, 229 18,450 19,186 20, 627 23,136 W
Holding companies________ _______________________ _____ 2, 579 2, 763 2, 601 2,414 2, 302 2,139 2, 062 1,949 2, 059 2,098 2, 083 2,116 2,168Long-term___________________________ ________________ 2,156 2,384 2, 263 2,121 2, 023 1,831 1, 755 1,628 1,752 1,844
2541,820 1,835 1, 868
Short-term________________ _____ _______ ____ _____ 423 379 338 293 279 308 307 321 307 263 281 300
INTERCORPORATE DEBT
Total, all corporations__________________________ _________ 16,366 16,614 15, 708 14,778 14,176 14, 005 13, 744 13, 224 13,119 12, 404 12,195 12,178 12,346Long-term--------------------------------------------- ---------------------- 10,032 10, 832 10, 587 10,301 9,966 9, 383 9,112 8, 569 8, 698 8, 705 8,445 8, 277 8,197Short-term______ ____________ ____ _______________ - 6, 334 5,782 5,121 4,477 4, 210 4, 622 4, 632 4,655 4,421 3,699 3, 750 3,901 4,149
Railway corporations_______________________ ______________ ______ 2,045 2,079 2,073 2,091 2,097 2,103 2,101 2,166 2,170 2,191 2, 212 1,951
2, 221 2,234Long-term______ ________________ ____ _____________ ____ _ . 1, 874 1,914 1,912 1,931 1, 925 1,926 1,909 1,955 1,951 1,951 1,949 1,950Short-term_____________________ ____ _________________________ 171 165 161 160 172 177 192 211 219 240 261 272 284i Adapted from reports of the Bureau of Internal Revenue and the Interstate Commerce Commission.
Digitized for FRASER http://fraser.stlouisfed.org/ Federal Reserve Bank of St. Louis
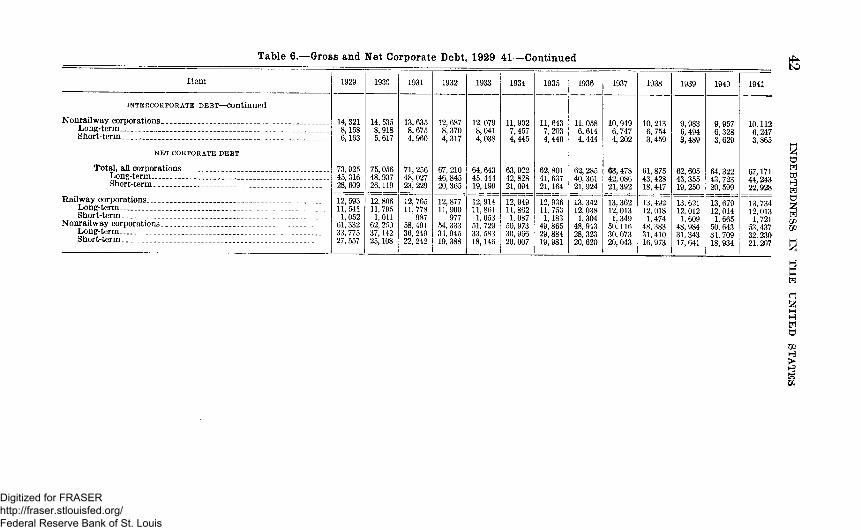
Table 6.— Gross and Net Corporate Debt, 1929-41— Continued
Item 1929 1930 1931 1932 1933 1934 1935 1936 1937 1938 1939 1940 1941
i n t e r c o r p o r a t e d e b t — continued
Nonrailway corporations________________ ________ 14,321 8,158 6,163
14, 535 8,918 5, 617
13, 635 8, 675 4, 960
12, 687 8, 370 4, 317
12, 079 8,041 4, 038
11,902 7,457 4,445
11, 643 7, 203 4, 440
11, 058 6,614 4,444
10,949 6. 747 4, 202
10, 213 6, 754 3,459
9,983 6,494Q AQO
9,957 6, 328 3, 629
10,112 6,247 3,865
Long-term....... .......... ................Short-term.......... .......... ........ ...
n e t c o r p o r a t e d e b t
Total, all corporations_________________ 73,925 45, 316 28,609
75,056 48,937 26,119
71, 256 48,027 23, 229
67, 210 46, 845 20, 365
64, 643 45, 444 19,199
63,922 42,828 21,094
62, 801 41, 637 21,164
62, 285 40, 361 21,924
63,47842,086 21, 392
61,875 43, 428 18,447
62, 605 43,355 19, 250
64,322 43, 723 20, 599
67,171 44,243 22,928
Long-term................................ ................Short-term_______ ____ _______________
Railway corporations________ _____ _____Long-term____________________ ___Short-term______________________
Nonrailway corporations______________Long-term______________________ .Short-term_____________________________ _
12, 593 11,541 1,052
61,332 33, 775 27, 557
12, 806 11, 795 1,011
62, 250 37,142 25,108
12, 765 11, 778
987 58, 491 36, 249 22, 242
12, 877 11, 900
977 54,333 34, 945 19,388
12, 914 11, 861 1,053
51, 729 33, 583 18,146
12, 949 11, 862 1,087
50, 973 30, 966 20, 007
12, 936 11, 753 1,183
49, 865 29, 884 19, 981
13,342 12,038 1,304
48, 943 28, 323 20,620
13,362 12, 013 1,349
50,116 30, 073 20,043
13, 492 12, 018 1,474
48, 383 31, 410 16,973
13, 621 12, 012 1,609
48, 984 31, 343 17,641
13, 679 12, 014 1, 665
50, 643 31, 709 18,934
13,734 12,013 1,721
53, 437 32, 230 21, 207
IND
EB
TED
NE
SS IN
THE U
NITED
STATE
S
Digitized for FRASER http://fraser.stlouisfed.org/ Federal Reserve Bank of St. Louis

COMPONENTS OF PRIVATE DEBT 43
More than 400,000 active corporations submit balance sheets when filing their annual income tax returns. In the railway and public utility industries and in some lines of manufacturing the corporation is the only or substantially the only form of organization used. In other lines of endeavor the corporation is extensively, though not exclusively, used. Even in farming and in holding and operating residential real estate the corporate form of organization is used to some extent. It is to be expected, therefore, that the outstanding debts of all corporations in the United States will be large. In 1941 gross corporate long-term and short-term debt totaled 79.4 billion dollars and amounted to 60 percent of gross private debt and 36 percent of gross public and private debt. In 1929, corporate debt comprised a somewhat smaller part of private debt but a larger part of total public and private debt.
RAILWAY DEBT
Of the three major classes of corporations presented in table 6, only railways showed an increase in gross debts during the period 1929-41. Their gross debts advanced from 14.6 billion dollars in 1929 to nearly 16 billion in 1941, small annual increases being registered for all but 2 years. Two factors were chiefly responsible for this increase. First, a considerable number of railways were obliged to borrow to raise funds for the purchase of equipment and to meet interest and other charges. A substantial part of these loans was obtained from the Reconstruction Finance Corporation, especially during the period 1932-35. Second, interest accrued and unpaid on defaulted debt accounted for a substantial part of the rise in railway debt. Railway debt in default rose from 99 million dollars in 1929 co 3.2 billion dollars in 1940, the lastest year for which statistics are available. During 1936-40, interest accrued and unpaid, which was added to the outstanding railway debt, averaged approximately 125 million dollars a year.
A factor contributing to the large volume of accrued interest unpaid was the long duration of the default period. For some railways in receivership this period continued throughout 1929-41. Receiverships of industrial and public utility corporations generally were of shorter duration. In comparing unpaid interest accruals of railways with those of other corporations, the fact must be kept in mind that such accruals are included in the outstanding debt of railways but are not always promptly or fully added to the debt of industrial corporations because of irregular and incomplete reporting by receivers of those corporations.
Only about 10 percent of railway debt is short-term. This low percentage obtains despite the fact that in railway accounting all debts with maturity dates of less than 2 years from date of issue are classified as short-term, and despite the further fact that interest accrued and unpaid on short-term and long-term debt alike is treated as a short-term obligation. Long-term debt comprises the bulk of railway debt because railways have relied heavily on long-term bonds to finance the outlays for roadway and equipment which constitute the bulk of railway investment.
Digitized for FRASER http://fraser.stlouisfed.org/ Federal Reserve Bank of St. Louis
44 INDEBTEDNESS IN THE UNITED STATES
Intercorporate railway debt remained slightly above the 2-billion- dollar level during the entire period 1929-41. In 1941, it totaled2.2 billion. A part of this intercorporate debt, possibly as much as a billion dollars, bears no interest or only a nominal rate. The main purpose of such indebtedness is to evidence existing obligations between units of a railway system. Railway intercorporate debt, as measured in this study, consists of the difference between the debts reported to the Interstate Commerce Commission by railways on unconsolidated statements and, with certain adjustments, the debts shown on consolidated statements submitted in connection with the filing of income tax returns.
PUBLIC UTILITY DEBT
Public utility corporations, as here defined, comprise electric light and power companies, natural and manufactured gas companies, pipeline companies, telephone and telegraph companies, water companies, radio broadcasting companies, and companies engaged in the operation of terminal stations, toll bridges, toll roads, and irrigation systems. Included also are companies, other than steam railways, engaged in furnishing various forms of ocean and fresh-water transportation services. The designation, public utility corporations, also covers docking, drawbridge, wharfage and salvaging, electric railway and aerial transportation, autobus, taxicab, cartage, storage, shipping, and packing services. This utility group includes, finally, Pull- man-car, refrigerator, stock, poultry, and fruit-car companies, not owned by steam railroads.
The gross debts of public utility corporations totaled nearly 16 billion dollars at the end of 1941, an amount approximately equal to the gross railway debt outstanding on that date and to about one- fifth of the total gross debt of all corporations. The debts of public utility corporations moved in a comparatively narrow range during the period 1929-41. They advanced from 17.2 billion dollars in 1929 to 18.6 billion in 1930, registering by far their largest annual change in the latter year because of the financing and funding operations occasioned by the expansion programs carried on then, particularly by the electric light and power and natural gas companies. From 1931 through 1936 they declined by 2.4 billion to total 15.9 billion, the decrease being due principally to the fact that retirements by payment exceeded the very low volume of debts incurred to obtain new capital. The receivership and reorganization of a large electric utility system, together with the reorganizations of bridge, warehouse, water-transportation, and other corporations which resulted in a smaller debt structure for those companies, also contributed to the decline. In 1937 and 1938, outstanding public utility debts reversed their trend and registered small increases. Debt reduction by reorganization was small in these years and moderate increases in new capital issues more than offset retirements by payment. The small declines which followed in the years from i939 through 1941 were due both to the reorganization of several street railway companies and to repayment of some debts by several public utility systems, following sales of property to Federal and local power authorities.
Digitized for FRASER http://fraser.stlouisfed.org/ Federal Reserve Bank of St. Louis

COMPONENTS OF PRIVATE DEBT 45
As in the case of railroads, the short-term debts of public utilities comprise only a small portion of their total debt. In 1941 their short-term debts amounted to 1.6 billion dollars, or slightly more than 10 percent of total debt. The figure 1.6 billion dollars is in contrast with the 2.7 billion for 1929, when short-term borrowings were more extensively made in financing construction programs undertaken in advance of funding operations.
The volume of debt shown as owed by public utility holding companies, as distinguished from operating companies, depends to a considerable extent upon the definitions employed. * In this study, holding companies are defined as corporations “who at any time during the taxable year owned 50 percent or more of the voting stock of another corporation and whose income from such stock was 50 percent or more of the amount of dividends received.” This definition is the same as that used by the Bureau of Internal Revenue in its statistical compilations for 1938.6 Defined in this manner, there were, in 1938, 199 such public utility holding companies, whose assets amounted to 9.1 billion dollars and whose debts totaled nearly 2.5 billion, equal to one-seventh of the debts of holding and operating companies combined. All but 316 million dollars of the debts of the holding companies consisted of long-term obligations. The portion of public utility debt allocated to holding companies for years other than 1938 was determined somewhat arbitrarily by assuming a trend for the holding companies similar to that experienced by all public utilities and by taking into consideration specific instances of increases or decreases in the debts of holding companies in the cases where such data were available.
DEBTS OF INDUSTRIAL AND FINANCIAL CORPORATIONS
Industrial, financial, and miscellaneous corporations, whose gross debts are presented in table 6, comprise the third and largest class of corporations, as grouped in this study. Industrial corporations comprise companies engaged in all lines of manufacturing, mining and quarrying, construction, agriculture, and trade. They include corporations owning and operating theatres, hotels, restaurants, office buildings, and residential properties. Financial corporations include loan companies and associations, investment companies, investment trusts, and holding companies. Finally, under financial corporations are included companies (other than investment trusts and investment companies) owning industrial, railway, public utility, or financial securities “who (a) at no time during the taxable year owned 50 percent or more of the voting stock of another corporation or (b) at any time during the taxable year owned 50 percent or more of the voting stock of another corporation but whose income from such stock was less than 50 percent of the amount of dividends received.” 7 Liabilities of banks to depositors and liabilities of insurance companies to policyholders are not included in these figures, but are shown separately in tables 7 and 8.
6 Statistics of Income for 1938, part 2, p. 146.7 Ibitl., p. 146.
Digitized for FRASER http://fraser.stlouisfed.org/ Federal Reserve Bank of St. Louis

46 INDEBTEDNESS IN THE UNITED STATES
Table 7.— Deposit Liabilities of All Banks in the United States, 1929-41[Millions of dollars]
Year Total, all banks
Nationalbanks
Other than national banks
TotalState
(commercial)
Mutualsavings Other
1929..1930..1931..1932..1933.. 1934._1935.. 1936__1937.. 1938_.1939.. 1940__1941..
55, 289 53,039 45,821 41,642 38, 505 44, 771 48,964 53, 702 52,440 54,054 58,344 65,021 70, 792
20, 290 20,138 17, 271 16,101 15, 386 18,519 20, 886 23,107 22, 655 23,497 25, 661 29, 214 32, 672
34, 999 32,90128, 550 25,54123.119 26, 252 28,078 30, 59529, 785 30,557 32, 683 35,80738.120
13, 575 12, 422 10,161
8 , 701 8,385
10,424 11,273 12,786 12,155 12,714 14,269 16, 793 18, 520
8,916 9,507
10,105 10,022 9, 708 9,828 9,963
10,143 10,257 10, 365 10,613 10, 658 10, 525
12,508 10, 972 8,284 6 . 818 5,026 6,0006 , 8427, 6 6 67, 373 7,478 7,8018 , 356 9,075
Source: Reports of the Federal Reserve Board and the Comptroller of the Currency.
Table 8.— Reserves and Other Selected Liabilities of Life-Insurance Companies toPolicyholders, 1929-40
[Millions of dollars]
Year ReservesLosses and claims not
paidClaimsresisted
Dividends unpaid and left to accumulate
Total liabilities to
policyholders
Loans to policy
holders 1
Net liabilities to policyholders
1929________ ______ _ 14,948 113 1 0 267 15,338 2,379 12,9591930........................... - 16, 231 135 11 303 16,680 2,807 13,8731931......................... . 17,384 153 17 316 17,870 3,369 14, 5011932.... ....................... ... 17,839 157 21 323 18,340 3,806 14,5341933.................. ........... 18,077 162 25 337 18,601 3,769 14,8321934....................... . 19,030 154 25 344 19, 553 3,658 15,8951935........................... . 20,404 153 24 366 20,947 3, 540 17,4071936............................... 21,800 1 1 2 2 0 371 22, 303 3,411 18,8921937............................... '23,202 111 18 401 23,732 3,399 20, 3331938_________ _______ 24,495 117 17 432 25,061 3,389 21,6721939............... ............. 25,827 124 18 467 26,436 3,248 23,1881940............ ................. 27,238 125 16 539 27,918 3,091 24,827
1 Including premium notes.Source: The Spectator Insurance Year Book.
In 1941 the gross debts of industrial and financial corporations aggregated 47.6 billion dollars, equal to almost three-fifths of total gross corporate debt. The 1941 total was greater by 4.6 billion dollars and 3 billion dollars, respectively, than the 1939 and 1940 totals, but less by 10.8 billion than the debts of industrial and financial corporations outstanding in 1929. From 1929 through 1938 the outstandings of this group of corporations followed a downward trend since new capital issues were exceeded by retirements by payment. In addition, reorganization and liquidation were responsible for large reductions in debt during this period. The important part that corporate reorganization and liquidation had in debt reduction is shown by a special analysis of the indebtedness of 792 industrial corporations, selected without reference to their solvency, for the 1934-37 period. Sixty-eight of these companies were in receivership and were reorganized or liquidated by the end of 1937. Principally because of the liquidation or the terms of reorganization, the outstanding long-term debt of these 68 corporations was reduced from 511 million dollars to 275 million, a decline of 46 percent. This compares with a decline of only 8 percent in outstanding longterm debt of the 724 solvent corporations for the 3-year period.
Digitized for FRASER http://fraser.stlouisfed.org/ Federal Reserve Bank of St. Louis

COMPONENTS OF PRIVATE DEBT 47
In sharp contrast with the situation respecting railway and public utility corporations, the short-term obligations of industrial and financial corporations comprise a large part of their gross debt. Corporations in this group quite commonly purchase their inventories on a deferred-payment basis or borrow from banks on a shortterm basis to pay for inventory purchases and to make other current outlays. In 1941 gross short-term debts of these corporations totaled 23.4 billion dollars, or nearly 50 percent of their gross debt. In 1929 the ratio of short-term to total debt among these corporations was even higher. In that year, gross short-term debts totaled 31 billion dollars, equal to 53 percent of total gross corporate debt. Generally, short-term debts fluctuate more widely with changes in the volume of business than do long-term debts. Since approximately one-half of the debts of industrial and financial corporations are short-term, it follows that changes in their total outstandings were larger than those of corporations whose debts were composed principally of bonds and other long-term debt. Another noteworthy feature of the corporate debt picture is that industrial corporations in more recent years have handled a larger volume of business on a given volume of debt. Factors making this possible include a more rapid turn-over of inventories and better transportation and delivery facilities.
DEBTS OF HOLDING COMPANIES
Holding companies, a subclass in the industrial, financial, and miscellaneous group of corporations, are defined in the same manner as are the public utility holding companies discussed above, that is, companies “who at any time during the taxable year owned 50 percent or more of the voting stock of another corporation and whose income from such stock was 50 percent or more of the amount of dividends received.” Under this restricted definition there were 128 industrial holding companies in 1938 with outstanding short-term and long-term debts of 553 million dollars and 32 companies holding bank securities with outstanding debts of 20 million. Another and much larger group of corporations conforming to the definition of holding companies, but whose securities were not classified, was composed of 643 companies with outstanding debts of 1.5 billion dollars.
Corporations, other than investment trusts and investment companies holding less than 50 percent of the voting stock of another corporation, or if holding more than 50 percent of the voting stock receiving less than 50 percent of its dividends from such stocks, numbered 4,275 and had outstanding debts totaling 2.2 billion dollars. It can safely be assumed that a substantial part of the holdings of these companies consisted of the securities of corporations in the public utility or industrial fields of enterprise. But these corporations do not come within the scope of holding companies as defined in this study, and accordingly neither these corporations nor their outstanding debts are allocated to the industries with which the corporations whose securities they hold are identified. These facts should be remembered when the volume of holding company debt, in the strict sense, is compared with that of the operating companies.
Intercorporate debt, as distinguished from holding company debt, consists of the debts of an issuer held by that issuer or by other mem
Digitized for FRASER http://fraser.stlouisfed.org/ Federal Reserve Bank of St. Louis

48 'INDEBTEDNESS IN THE UNITED STATES
bers of the same corporate system. It may consist of the debts of a subsidiary or affiliate held by a parent company, or of the debts of a parent company held by a subsidiary, or of both. Thus, if a holding company has a bond issue outstanding, part of which is publicly held and part of which is held by an affiliate, that part held by the affiliate comprises intercorporate debt. Owing to the difficulties involved in making a detailed breakdown from available data, intercorporate debt is classified in the present study into railwray and nonrailway categories only. As stated previously, intercorporate debt of railways has ranged slightly above the 2-billion-dollar level in recent years. Nonrailway intercorporate debt totaled slightly more than 10 billion dollars in 1941, compared with 14.3 billion in 1929. Since 1935 intercorporate debt has declined at a somewhat faster pace than has net corporate debt, largely as a result of the trend toward reducing, by consolidation or sale, the number of affiliates or subsidiaries within a corporate system.
A comparatively small number of corporations do not submit balance sheets when filing tax returns. This results in some understatement of corporate debt. But since the companies not submitting balance sheets are typically small and frequently have no outstanding debt obligations, the omissions probably do not exceed 1 or 2 percent of total corporate indebtedness.
INDEBTEDNESS ON URBAN RESIDENTIAL PROPERTY
Indebtedness on urban or nonfarm residential property is composed principally of the mortgage notes of individuals and other noncorporate persons, but includes also the mortgage bonds of incorporated companies. In addition, it includes a small quantity—estimated to be less than 1 percent of total outstandings—of debenture bonds and unsecured notes of corporations owning and operating residential real estate. Inasmuch as the unsecured debt of real-estate corporations is generally small and since a mortgage lien may ordinarily be obtained by unsecured creditors in event of default, the aggregates are referred to as mortgage indebtedness.
Table 9.— Urban Residential Real-Estate Mortgages, 1929-41[Millions of dollars]
All residential properties Multifamily 1- to 4-family
YearTotal Corpor Noncor Total Corpor Noncor Total Corpor Noncor
ate porate ate porate ate 1 porate
1929____________ 29, 390 2,789 26,601 7,831 1,711 6 ,1 2 0 21,058" 1,053 20,0051930____________ 30, 314 2,839 27, 475 8 , 473 1,747 6 , 726 21, 259 1,063 20,1961931............. ......... 29, 571 2, 763 26,808 8,291 1, 699 6 , 592 20,685 1,034 19,6511932____________ 27,843 2,620 25, 223 7,993 1, 627 6 , 366 19/242 962 18, 2801933____________ 25, 796 2, 458 23,338 7,478 1,542 5,936 17,878 894 16,9841934____________ 24,933 2, 309 22, 624 6,944 1,410 5, 534 17,857 893 16,9641935____________ 24, 232 2,161 22,071 6 , 548 1, 277 5,271 17, 510 876 16, 6341936____________ 23, 660 2,096 21, 564 6,311 1, 229 5,082 17, 225 861 16, 3641937____________ 23,595 2,075 21,520 6,191 1,205 4,986 17, 344 867 16,4771938____________ 23, 792 2,079 21,713 6,071 1,193 4,878 17, 646 882 16,7641939....... ............ - 24, 385 2,090 22, 295 5,970 1,169 4,801 18,216 911 17, 3051940____________ 25, 307 2,127 23,180 5,907 1,157 4, 750 19,123 956 18,1671941_............... . 25,878 2,145 23,733 5,870 1,145 4,725 20,008 1 , 0 0 0 19,008
1 Twenty-five percent of bonded debt of domestic corporations.Source: Division of Research and Statistics, Federal Home Loan Bank Board, for figures on 1 - to 4-family
urban residential real-estate mortgages.
Digitized for FRASER http://fraser.stlouisfed.org/ Federal Reserve Bank of St. Louis

COMPONENTS OF PRIVATE DEBT 49
Table 9 classifies urban residential mortgage obligations by type of property pledged as debts on 1- to 4-family dwelling properties and debts on multifamily properties (of 5 or more families), and shows the amount and trend of total outstandings as well as the debts for each of the two classes from 1929 through 1941. Comprising the largest item of long-term consumer debt, indebtedness of individuals on urban residential properties aggregated 26.1 billion dollars in 1929. (See table 10.) Of this amount 20 billion, or approximately three- fourths of the total, represented debts on 1- to 4-family properties.
Following the general pattern of several other types of long-term debt, outstanding mortgages on 1- to 4-family properties rose moderately in 1930 to 21.3 billion. After 1930, outstandings on this class of urban residential property dropped for 6 consecutive years, receding to a 17.2-billion level in 1936—the low mark for the 12-year period. The most rapid declines occurred in 1931 and in 1932, when ordinary debt reduction by payment was greatly augmented by forced reduction through foreclosure or through surrender or transfer of title to avoid foreclosure. In these years unemployment was widespread and the income of residential property owners was small compared with that of earlier years or compared with their fixed payments of principal and interest. Loans were difficult to arrange and maturation of mortgages frequently resulted in defaults and foreclosures.
Following the enactment of debtor-relief legislation in 1933, marfy distress mortgages on 1- to 4-family properties were refinanced and mortgage reduction by foreclosure declined sharply.
Table 10.— Urban Real-Estate Mortgages Owed by Individuals and Other Noncorporate Borrowers, 1929-41
[Millions of dollars]
Year Total Residential
Commercial
1929 ____________ 31,618 26,125 5,4931930 ____________ 32,638 26,922 5, 7161931_________ . . . 31.887 26, 243 5,6441932______________ 30,034 24,646 5, 3881933 ____________ 27, 356 22,920 4,4361934 _____________ 26,661 22,498 4,1631935______________ 25,864 21,905 3,959
Year Total Residential
Commercial
1933 _____________ 25, 463 21,446 4,0171937 ____________ 25,447 21,463 3,9841938 _____________ 25, 611 21, 642 3,9691939 __________ .. 26,062 22,106 3,9561910 _____________ 26, 817 22, 917 3,9001941______________ 27,633 23,733 3,900
By 1937, new mortgage indebtedness, created to finance a marked growth in residential construction engendered in part by the National Housing Act, more than offset mortgage reductions by payment and foreclosure. Consequently, urban residential mortgage outstandings since 1937 have made annual advances. Mortgages of 19.1 billion dollars outstanding in 1940 on 1- to 4-family properties wTere only about 10 percent below the 1929 total of 21.1 billion. At the end of 1941, the volume of these mortgages had risen to 20 billions of dollars.
Mortgage outstandings on multifamily property followed a course markedly different from that taken by those secured by the 1- to 4- family properties. From 1929 to 1930, they followed the general pattern of most classes of long-term debt by rising from 7.8 to 8.5 billion dollars, but from 1930 they registered successive declines for 11 consecutive years. At the end of 1941, the multifamily mortgage-debt
Digitized for FRASER http://fraser.stlouisfed.org/ Federal Reserve Bank of St. Louis

50 INDEBTEDNESS IN THE UNITED STATES
index (1929 = 100) stood at 75, compared with 95 for debts against 1- to 4-family residences.
The larger percentage decline registered by debts on multifamily property is due partly to the fact that legislation to refinance distress mortgages did not apply to this type of property. Hence, outstandings continued to shrink because of foreclosure actions or reorganizations during 1933-36, when declines in the 1- to 4-family group had abated. Another cause contributing to the continued decline of debts on multifamily property is the fact that recovery in apartment-house construction had been relatively slight. Hence, the new debt issued to finance this construction has been less than retirements made on outstanding obligations.
For recent years, statistical estimates of outstanding mortgages against multifamily and 1- to 4-family property have been materially improved in quality by better classification of real-estate loans in the statements of banks and by questionnaire surveys conducted by life-insurance companies. Formerly, these financial institutions divided loans secured by real estate into farm and nonfarm loans. Recently, nonfarm loans have been divided into 1- to 4-family, multifamily, and other real-estate loans. In applying this breakdown to earlier years, somewhat arbitrary procedures are required, and it follows that the distribution shown in earlier years is subject to some error.
* Other statistical data much needed in this field consist of information showing the extent of the mortgage bonded indebtedness of corporations owning residential real estate, especially in the multifamily group, where, because of the larger capital requirements per unit, the corporate form of organization is more common than in the 1- to 4-family group. A sample study made by the Department of Commerce of Internal Revenue statistics of corporations owning business and residential real estate in 1937, together with a questionnaire survey covering the larger cities, provided the basis for an estimate of1.2 billion dollars as the outstanding mortgage debt of corporations owning multifamily residential property in that year. This was equal to one-fifth of the entire amount of mortgage debt outstanding against this class of residential real estate. Predicated upon the 1937 estimate, the outstandings for other years were based on the year-to-year trend for the comparatively few corporations holding residential real estate that publish financial statements.
The debt of corporations owning 1- to 4-family residential property was placed arbitrarily at 5 percent of total outstandings. Holdings of residential real estate by financial corporations, that is, banks, insurance companies, and so on, assumed considerable proportions in some years of the 1929-41 period, but the debt outstanding on these properties generally was quite small because many of the properties were acquired by foreclosure or by transfer of title to avoid foreclosure, and, consequently, were often free or nearly free of debt at the time of such acquisition.
From the foregoing it is evident that the debts of individuals and other noncorporate borrowers comprise almost the entire indebtedness on 1- to 4-family properties and the bulk of the mortgage indebtedness on multifamily residential real estate. It should be noted that “ individuals and other noncorporate persons” is a broad category
Digitized for FRASER http://fraser.stlouisfed.org/ Federal Reserve Bank of St. Louis

COMPONENTS OF PRIVATE DEBT 51
which includes not only individuals and unincorporated businesses, but trust and investment funds, and eleemosynary corporations or associations which may have mortgages outstanding on a wide variety of property held by them for investment or for use in their activities.
The debts of individuals and other noncorporate borrowers owed on urban real property are presented in table 10. In addition to the debts against residential property discussed above, this table gives the debts secured by commercial or business real estate owed by individuals and other noncorporate persons. Commercial property, as here defined, includes business and professional office buildings, hotels, restaurants, theaters, and retail and wholesale store buildings. Debts of individuals on these classes of property aggregated5.5 billion dollars in 1929. After rising moderately in 1930 to 5.7 billion, they responded to the depression years by declining to a level slightly below 4 billion dollars by 1935. From 1936 they moved narrowly lower to a year-end total of 3.9 billion in 1941. This represents a decline of 29 percent from 1929, compared with declines of 25 percent and 5 percent in the amounts owed by individuals and others on multifamily and 1- to 4-family residential property, respectively. All in all, the debts of individuals and others on urban commercial and residential real estate combined totaled 27.6 billion dollars in 1941, compared with 31.6 billion in 1929.
Although primary statistics relating to the debts owed by individuals and other noncorporate persons on commercial real estate are still lacking in completeness and quality, marked improvements in these data have been made in recent years. The breakdown of nonfarm real-estate loans of banks and insurance companies referred to above permits approximations of the total loans made by these institutions against commercial real estate. The studies which have been made of the debts secured by commercial real estate make possible approximations of the portions of such loans that are corporate and noncorporate. Further advances in primary data must be made, however, before estimates in this area approach the quality of those for other debt categories. As additional data become available, revisions in this and in related groups of debt estimates are to be expected.
FARM-MORTGAGE DEBT REDUCED YEARLY SINCE 1929
It will be observed from table 11 that there was a continuous decrease in the volume of outstanding farm-mortgage debt from 1929 through 1941. At the end of the latter year, estimated debt secured by liens on farm real estate totaled 6.8 billion dollars. This figure is 2.8 billion, or 29 percent, below the 1929 total of 9.6 billion, and 3.9 billion below the peak amount of 10.8 billion outstanding at the end of 1922.
Digitized for FRASER http://fraser.stlouisfed.org/ Federal Reserve Bank of St. Louis
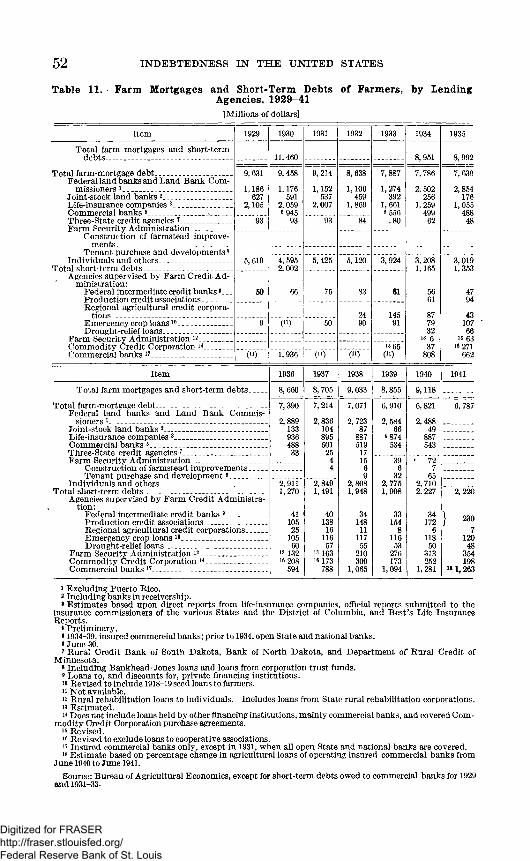
52 INDEBTEDNESS IN THE UNITED STATES
Table 11.— Farm Mortgages and Short-Term Debts of Farmers, by LendingAgencies, 1929-41
[Millions of dollars]
Item 1929 1930 1931 1932 1933 1934 1935
Total farm mortgages and short-term d e b t s _________________ _________ 11, 460 8,951 8,992
Total farm-mortgage debt________ ____ ______Federal land banks and Land Bank Com
missioners 1_______ __ ________________Joint-stock land banks 2_________________Life-insurance companies 3 ........ ................Commercial banks «
9,631
1,186 627
2,105
9,458
1,176 591
2,059 «945
93
9, 214
1,152537
2,007
8,638
1,106459
1,869
7,887
1,274 392
1,661 6 556
.80
7,786
2,502256
1,25949962
7,639
2,854 176
1,055 488 48Three-State credit agencies *_____________
Farm Security Administration___93 93 84
Construction of farmstead improvements__ _________ ____ ____ _____
Tenant purchase and developments8.Individuals and others__________________
Total short-term debts _ _______ ____5, 619 4, 595
2 , 0 0 2
6 6
5, 425 5,120 3,924 3,2081,165
5661
877932
13 6
37808
3,019 1,353
4794
43107
6 6 is 63
16 271 662
Agencies supervised by Farm Credit Administration:
Federal intermediate credit banks . Prod uction credit associations____
60 75 83 61
Regional agricultural credit corporations ______ ____ _____________ 24
9014591Emergency crop loans10_____________
Drought-relief loans _ _ _ - ______9 0 1) 50
Farm Security Administration 12________Commodity Credit Corporation 1 4 _____ 15 65
09Commercial banks 17_________ _________ (“ ) 1,936 (“ ) (“ )
Item 1936 1937 1938 1939 1940 1941
Total farm mortgages and short-term debts____
Total farm-mortgage debt______ ___________________Federal land banks and Land Bank Commis
sioners1-- _______ - ________ _______________ ___
8 , 660 8 , 705 9,033 8,855 9,118 ----------
7, 390
2,88913393648833
7, 214
2,8361048955012544
2,849 1,491
40 138 16
116 57
13163 16173
788
7,071
2 , 723 87
887 519 17 15
6 9
2,8081,948
34148
1111755
2 1 0309
1,065
6,910
2, 584 6 6
4 874 534
6,821
2, 488 49
887 543
6 , 787
Joint-stock land banks 2____________________ ____Life-insurance companies 3_......................................Commercial banks 6___ _______________ ____ ____Three-State credit agencies 7._ .................... .............Farm Security Administration__________ _ ____ 39
632
2,775 1,908
33 154
811653
276173
1,094
' 72 7
65 2 , 710 2, 227
34172
611850
313252
1,281
Construction of farmstead improvements____Tenant purchase and development8_________
Individuals and others___________ ______________Total short-term debts____________ ______________ .
Agencies supervised by Farm Credit Administration:
Federal intermediate credit banks 9__________Production credit associations _ ___ ________Regional agricultural credit corporations_____Emergency crop loans 10_____________________Drought-relief loans______ __________________
Farm Security Administration 12 ______ ________Commodity Credit Corporation 14_______________Commercial banks 17_______ ___________________
2, 911 1,270
41 105 25
105 60
13 132 16 208
594
2, 220
} 2307
120 48
354 198
i* 1,263
* Excluding Puerto Rico.2 Including banks in receivership.• Estimates based upon direct reports from life-insurance companies, official reports submitted to the
insurance commissioners of the various States and the District of Columbia, and Best’s Life Insurance Reports.
4 Preliminary.• 1934-39, insured commercial banks; prior to 1934, open State and national banks.8 June 30.7 Rural Credit Bank of South Dakota, Bank of North Dakota, and Department o f Rural Credit of
Minnesota.* Including Bankhead-Jones loans and loans from corporation trust funds.9 Loans to, and discounts for, private financing institutions.10 Revised to include 1918-19 seed loans to farmers.11 Not available.12 Rural rehabilitation loans to individuals. Includes loans from State rural rehabilitation corporations.13 Estimated.14 Does not include loans held by other financing institutions, mainly commercial banks, and covered Com
modity Credit Corporation purchase agreements.16 Revised.1P Revised to exclude loans to cooperative associations.17 Insured commercial banks only, except in 1931, when all open State and national banks are covered.18 Estimate based on percentage change in agricultural loans of operating insured commercial banks from
June 1940 to June 1941.Source: Bureau of Agricultural Economics, except for short-term debts owed to commercial banks for 1929
and 1931-33.
Digitized for FRASER http://fraser.stlouisfed.org/ Federal Reserve Bank of St. Louis
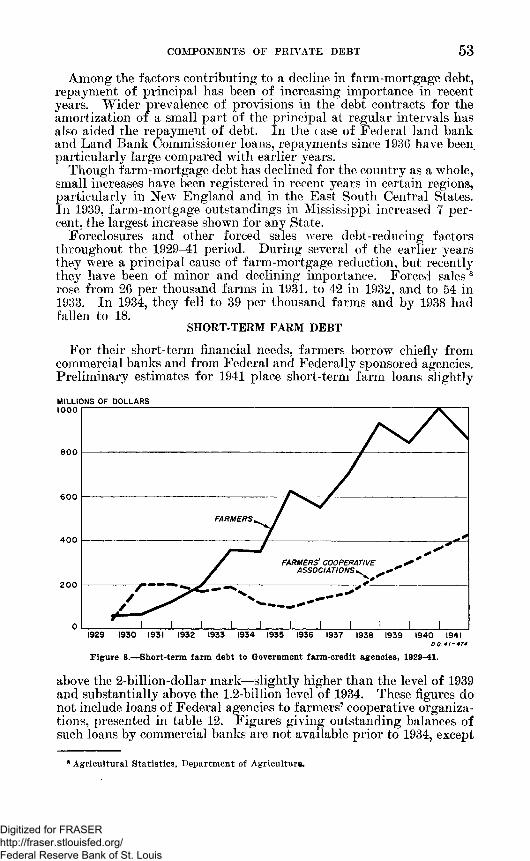
COMPONENTS OF PRIVATE DEBT 53
Among the factors contributing to a decline in farm-mortgage debt, repayment of principal has been of increasing importance in recent years. Wider prevalence of provisions in the debt contracts for the amortization of a small part of the principal at regular intervals has also aided the repayment of debt. In the case of Federal land bank and Land Bank Commissioner loans, repayments since 1936 have been particularly large compared with earlier years.
Though farm-mortgage debt has declined for the country as a whole, small increases have been registered in recent years in certain regions, particularly in New England and in the East South Central States. In 1939, farm-mortgage outstandings in Mississippi increased 7 percent, the largest increase shown for any State.
Foreclosures and other forced sales were debt-reducing factors throughout the 1929-41 period. During several of the earlier years they were a principal cause of farm-mortgage reduction, but recently they have been of minor and declining importance. Forced sales 8 rose from 26 per thousand farms in 1931, to 42 in 1932, and to 54 in 1933. In 1934, they fell to 39 per thousand farms and by 1938 had fallen to 18.
SHORT-TERM FARM DEBT
For their short-term financial needs, farmers borrow chiefly from commercial banks and from Federal and Federally sponsored agencies. Preliminary estimates for 1941 place short-term farm loans slightly
1929 1930 1931 1932 1933 1934 1935 1936 1937 1938 1939 1940 19410 0. 4!~474
Figure 8.— Short-term farm debt to Government farm-credit agencies, 1929-41.
above the 2-billion-dollar mark—slightly higher than the level of 1939 and substantially above the 1.2-billion level of 1934. These figures do not include loans of Federal agencies to farmers’ cooperative organizations, presented in table 12. Figures giving outstanding balances of such loans by commercial banks are not available prior to 1934, except
8 Agricultural Statistics, Department of Agriculture.
Digitized for FRASER http://fraser.stlouisfed.org/ Federal Reserve Bank of St. Louis
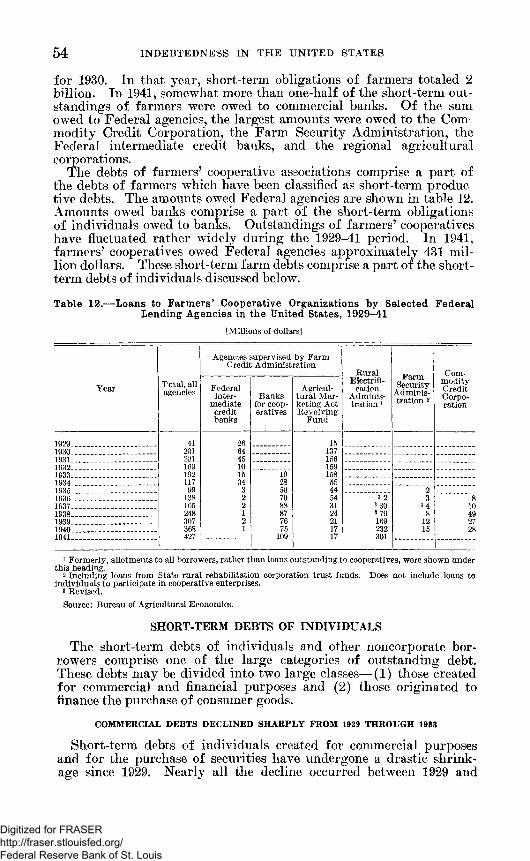
54 INDEBTEDNESS IN THE UNITED STATES
for 1930. In that year, short-term obligations of farmers totaled 2 billion. In 1941, somewhat more than one-half of the short-term outstandings of farmers were owed to commercial banks. Of the sum owed to Federal agencies, the largest amounts were owed to the Commodity Credit Corporation, the Farm Security Administration, the Federal intermediate credit banks, and the regional agricultural corporations.
The debts of farmers’ cooperative associations comprise a part of the debts of farmers which have been classified as short-term productive debts. The amounts owed Federal agencies are shown in table 12. Amounts owed banks comprise a part of the short-term obligations of individuals owed to banks. Outstandings of farmers’ cooperatives have fluctuated rather widely during the 1929-41 period. In 1941, farmers’ cooperatives owed Federal agencies approximately 431 million dollars. These short-term farm debts comprise a part of the shortterm debts of individuals discussed below.
Table 12.— Loans to Farmers’ Cooperative Organizations by Selected Federal Lending Agencies in the United States, 1929-41
[Millions of dollars]
Agencies supervised by Farm Credit Administration
Rural Farm Security
Administration 2
Com
Year Total, all agencies Federal
intermediatecreditbanks
Banks for cooperatives
Agricultural Marketing Act Revolving
Fund
Electrification
Administration 1
modityCreditCorporation
1929...................................... 41 26 151930 ........................ .......... 201 64 1371931 ________ ______ ___ 201 45 1561932 ___________________ 169 10 1591933 _____ _____________ 192 15 19 1581934. ____________________ 117 34 28 551935 _____ _____________ 99 3 50 44 21936_____________________ 138 2 70 54 3 2 3 81937._____ ______ ______ 165 2 8 8 31 3 30 3 4 101938 ............................ ....... 248 1 87 24 3 79 8 491939................................ 307 2 76 21 169 12 271940...................................... 368 1 75 17 232 15 281941 ............... . 427 109 17 301
1 Formerly, allotments to all borrowers, rather than loans outstanding to cooperatives, were shown under this heading.
2 Including loans from State rural rehabilitation corporation trust funds. Does not include loans to individuals to participate in cooperative enterprises.
8 Revised.Source: Bureau of Agricultural Economics.
SHORT-TERM DEBTS OF INDIVIDUALS
The short-term debts of individuals and other noncorporate borrowers comprise one of the large categories of outstanding debt. These debts may be divided into two large classes— (1) those created for commercial and financial purposes and (2) those originated to finance the purchase of consumer goods.
COMMERCIAL DEBTS DECLINED SHARPLY FROM 1929 THROUGH 1933
Short-term debts of individuals created for commercial purposes and for the purchase of securities have undergone a drastic shrinkage since 1929. Nearly all the decline occurred between 1929 and
Digitized for FRASER http://fraser.stlouisfed.org/ Federal Reserve Bank of St. Louis

COMPONENTS OF PRIVATE DEBT 55
1933 when the volume of these outstandings decreased from 19.8 to 8.3 billion dollars. From 1933, they moved narrowly but irregularly lower to a year-end total of 7.6 billion dollars in 1940, a decline of 62 percent from 1929. Forced liquidation of investment and speculative loans secured by marketable collateral undoubtedly contributed most heavily to the decrease in this class of debt. Customers’ debts to brokers fell sharply from an estimated year-end total of 5 billion in 1929 to 800 million in 1932. After rising to 1.4 billion by 1936, they receded to a new low when they stood at 677 million at the end of 1940. In 1941, loans for the purchase of securities continued to fall slightly but this trend was much more than offset by a sharp rise in the obligations of individuals to banks on account of short-term borrowing. These commercial loans have expanded rapidly as business activity has advanced and as new working capital has been required.
Digitized for FRASER http://fraser.stlouisfed.org/ Federal Reserve Bank of St. Louis

Table 13.— Short-Term Debts of Individuals and Other Noncorporate Borrowers, 1929-41 Cn
Item 1929 1930 | 1931 | 1932 1933 || 1934 1935 1936 1937 1938 1939 1940 1941
Millions of dollars
Total short-term debt................................................................... . . 27,895 25, 732 20, 464 15,026 12,428 12, 705 13, 359 14,917 16,115 15,183 15, 547 16, 473 18, 973
Commercial and financial________ ______ ________ ________ — ........ 19,753 18,332 14,094 10,303 7, 991 7,723 7,499 7, 642 7,990 7,419 7,242 7, 623 9,380Owed to banks................. ........................... ........... ......................... 14,654 15,266 12,469 9,136 6,469 6,085 5, 514 5,557 6,128 5, 247 5,190 5,578 7,486Owed to brokers________________ ______________ ___________ - 5,000 2,800 1,300 800 1, 270 1,170 1,258 1,395 985 991 906 677 606Owed to Government credit agencies (farm)_________ _______ 99 266 325 367 552 468 727 690 877 1,181 1,146 1,368 1,288
Farmers_____________________________ __________ ___ _____ _ 59 66 124 197 361 352 629 552 712 932 840 1,000 857Farmers’ cooperative associations......... .................................. 40 200 201 170 191 116 98 138 165 249 306 368 431
Consumer . . ___________________________ _______________ _______ 8,142 7,400 6,370 4, 723 4, 437 4,982 5,860 7, 275 8,125 7,764 8,305 8,850 9,593Owed to retail merchants 1. _............... ....... .................................... 4,564 4,261 3,734 2,925 2,878 3,010 3, 221 3, 566 3, 818 3,572 3,668 3,840 4,136Owed to service creditors __ ............................................... 585 560 520 480 450 440 465 510 550 500 540 590 603Intermediary financing agencies.......................................... ............ 1,343 981 817 325 261 602 1,049 1, 777 1,979 1,950 2,165 2,210 2,442Cash-lending agencies 1_____ __________ _________ ________ , . . . 1,650 1,598 1,299 993 848 930 1,125 1,422 1, 778 1,742 1,932 2,210 2,412
Percentages of total
Total short-term d eb t.................. .............. ................................ . 100.0 100.0 100.0 100.0 100.0 100.0 100.0 100.0 100.0 100.0 100.0 100.0 100.0
Commercial and financia l........ .......................................... .................... 70.8 71.2 68.9 68.6 65.1 60.8 56.1 51.2 49.6 50.1 47.3 45.5 49.4Owed to banks...................... ................... ........................................... 52.5 59.3 60.9 60.8 50.8 47.9 41.3 37.2 38.0 35.4 33.9 33.4 39.5Owed to brokers_______________ __________________ _____ ____ 17.9 10.9 6.4 5.3 10.0 9.2 9.4 9.4 6.1 6.7 5.9 4.0 3.2Owed to Government credit agencies (farm )............................... .4 1.0 1.6 2.5 4.3 3.7 5.4 4.6 5.5 8.0 7.5 8.1 6.8
Consumer__________ . . . ____________________ ___________ _____ 29.2 28.8 31.1 31.4 34.9 39.2 43.9 48.8 50.4 49.9 52.7 54.5 50.6Owed to retail merchants................................... ................... ............ 16.4 16.6 18.3 19.4 22.6 23.7 24.1 23.9 23.7 24.1 24.0 23.0 21.8Owed to service creditors.__ ............. ........................................... 2.1 2.2 2.5 3.2 3.5 3.5 3.5 3.4 3.4 3.4 3.5 3.5 3.2Intermediary financing agencies.............. ............ ................... ........ 4.8 3.8 4.0 2.2 2.1 4.7 7.9 11.9 12.3 13.2 14.1 13.2 12.9Cash-lending agencies................... ........................ .......... .......... ........ 5.9 6.2 6.3 6.6 6.7 7.3 8.4 9.6 11.0 11.8 12.6 13.2 12.7
Index numbers 1935-39=100
Total short-term debt................................................................... 187.2 172.7 137.3 100.8 85.4 85.3 89.6 100.1 108.1 99.4 102.7 112.2 124.0
Commercial and financial ______ _____ ____________ ________ _____ 261.4 242.6 186.5 136.3 109.7 102.2 99.2 101.1 105.7 98.2 95.8 100.9 124.1Owed to banks________________________________________________ 265.1 276.2 225.6 165.3 117.0 110.1 99.8 100.5 110.9 94.9 93.9 100.9 135.4Owed to brokers_____________________________________________ _ 451.7 252.9 117.4 72.3 114.7 105.7 113.6 126.0 89.0 89.5 81.8 61.2 54.7Owed to Government credit agencies (farm)_______ _______ ___ 10.7 28.8 35.2 39.7 59.7 50.6 78.7 74.7 94.9 127.8 . 124.0 147.9 139.4
Farmers......... ............. ... ...... ............................................. 8.0 9.0 16.9 26.9 49.2 48.0 85.8 75.3 97.1 127.1 114.6 136.4 116.9Farmers’ cooperative associations......................................... . 20.9 104.7 105.2 89.0 100.0 60.7 51.3 72.3 86.4 130.4 160.2 192.7 225.7
Consumer_________ ___ __________________________ _______ ___ 109.1 99.1 85.3 63.3 59.4 66.7 78.5 97.4 108.8 104.0 111.2 118.5 128.5Owed to retail merchants_____ ________ _______________________ 127.9 119.4 104.6 82.0 80.6 84.3 90.2 99.9 107.0 100.1 102.8 107.6 115.9Owed to service creditors.. _ ...... ..................................................... 114.0 109.2 101.4 93.6 87.7 85.8 90.6 99.4 107.2 97.5 105.3 115.0 117.5Intermediary financing agencies........ ................... ....................— 75.3 55.0 45.8 18.2 14.6 33.7 58.8 99.6 110.9 109.3 121.4 123.9 136.9Cash-lending agencies....................... ................................................ 103.1 99.9 81.2 62.1 53.0 58.1 70.3 88.9 111.1 108.9 120.8 138.1 150.8
i Consumer Credit and Economic Stability, by Rolf Nugent, Russell Sage Foundation, for figures, 1929-37.
IND
EB
TE
DN
ESS
IN TH
E U
NITE
D
ST
AT
ES
Digitized for FRASER http://fraser.stlouisfed.org/ Federal Reserve Bank of St. Louis

COMPONENTS OF PRIVATE DEBT 57
During the period under review, individuals and other noncorporate borrowers liquidated a large part of their debts owed to banks and incurred for investment and speculative purposes. As stated previously, statements of condition filed by banks with the Comptroller of the Currency do not segregate loans made to corporate and those to noncorporate borrowers nor, prior to 1938, do they separate loans made for commercial purposes from those made for the “purpose of carrying or purchasing securities."
The breakdown into corporate and noncorporate bank loans, as elsewhere described, was the product of a special study. No similar breakdown of the loans of individuals into those incurred for commercial as distinguished from investment and speculative purposes has been attempted. However, taking into consideration the changing volume of general business activity, the probable shift of some businesses to the corporate form of organization, and the lower volume of loans needed to finance a given volume of sales because of more efficient marketing methods, it appears probable that not more than from two-fifths to one-half of the decline of 9 billion dollars in bank loans to individuals represented declines in loans for business purposes. The remaining portion represented debt reduction of financial loans by sale of collateral or by payment. It is evident that shrinkages in the volume of debts incurred for investment and speculative purposes, including reductions in obligations to brokers, accounted for a large part of the decline in the outstanding obligations of individuals and other noncorporate borrowers incurred for both commercial and financial purposes.
Because of deficiencies in primary statistics, the debts of unincorporated businesses owed to other such businesses, to individuals, and to corporations other than banks are not included in the totals presented above.
CONSUMER DEBT IN 1941 HIGHER THAN IN 1929
Debts incurred to finance the purchase of consumer goods, measured by year-end outstandings, followed a course during the period 1929 to 1941 quite different from that taken by commercial and financial debts of individuals. Moving generally in direct association with the volume of retail sales, consumer debts fell abruptly from a level of 8.1 billion dollars outstanding in 1929 to 4.4 billion by 1933, recovered to approximately the 1929 level in 1937 and 1939, and, in 1940, reached a new peak level of nearly 9 billion. In 1941, consumer debt continued to rise for the first three quarters but under the Federal Reserve restriction declined in the final quarter to a level only 750 million above that of the previous year-end.
The pronounced expansion of consumer debt wThich had taken place in the twenties came to an end soon after the severe decline in security prices that occurred in the fall of 1929.9 Consumer-debt reduction was first reflected in the receivables of installment finance companies which financed the sale of durable consumers’ goods, then among open-book credit establishments in both the merchandise and professional groups, and finally among the cash-lending agencies.
Liquidation of consumer debt continued at an accelerated rate until the spring of 1933, when some types of consumer debt abruptly
0 Nugent. R olf, Consum er Credit and E conom ic S tability, Russell Sage Foundation. 464252°— 42-------5
Digitized for FRASER http://fraser.stlouisfed.org/ Federal Reserve Bank of St. Louis

reversed their downward trend. It was at this time that the movement to reopen closed banks began, that legislation was passed to relieve strained farm mortgage and urban residential mortgage debt conditions, and that extensive outlays for work relief were undertaken. These and other happenings made possible the diversion of a larger proportion of many individuals’ incomes to long-postponed purchases of consumer goods. National income assumed an upward trend and commodity sales in many lines began to rise markedly, thus providing the circumstances that produce increases in consumer debt.
Beginning in the late spring of 1933, automobile sales led the expansion in the sale of consumer goods. Other consumer durable
58 INDEBTEDNESS IN THE UNITED STATES
1929 1930 1931 1932 1933 1934 1935 1936 1937 1938 1939 1940 1941
Figure 9.— Indexes of consumer debt in the United States, 1929-41.
goods of comparatively high unit cost also were sold in enlarged volume. These included washing machines, vacuum cleaners, and mechanical refrigerators. Sales of the latter soon exceeded past peaks, since the mechanical refrigerator was a comparatively new product in 1929.
These goods typically were bought on long-term contracts with low down payments. Thus, rapid increases in sales were accompanied by concomitant increases in the volume of debt owed to mstallment-finance companies. Increases in debts due merchants on open account soon followed, though in some lines the downward trend continued for a time. For cash-lending agencies as a group, outstandings due from borrowers did not rise until during 1934. Outstandings due on professional services also did not show increases until that year.
Once under way, the expansion in consumer debt, as measured by year-end outstandings, continued through 1937, the peak being reached in the spring of that year. Outstandings dropped in 1938 in response to lower sales in 1937 and 1938, but rose again in 1939 and, reflecting record sales in some lines, reached a new high level of 9.6 billion dollars in 1941. Reductions in the amount of down payments* lengthening of the debt contract, and extension of install
Digitized for FRASER http://fraser.stlouisfed.org/ Federal Reserve Bank of St. Louis

COMPONENTS OF PRIVATE DEBT 59
ment and charge-account systems to more retail outlets, as well as increases in sales volume, contributed to the increases in consumer- debt outstandings.
Since consumer debts are compiled largely from information supplied by creditors, they are broken down into obligations owed to (1) retail merchants, (2) service creditors, (3) installment-finance companies, and (4) cash-lending agencies. All four classes of debt followed a pattern roughly similar to changes in the dollar volume of trade, declining in the early thirties and expanding in the later thirties, but there were marked differences in the timing and amplitude of these fluctuations. Fluctuations in consumer outstandings are numerous and differ greatly from commodity to commodity, from one period to another, and among different types of financing agencies. In this analysis, only the broader movements will be given brief treatment.
Under the retail-merchant classification are included apparel, food, drug, hardware, and jewelry stores, general merchandise stores, furniture and household-equipment stores, fuel and ice dealers, automotive dealers, and miscellaneous retail outlets. The service creditors include physicians, surgeons, dentists, and others engaged in the curative services, funeral directors and embalmers, hospitals, lawyers, laundries, and cleaning and pressing establishments. The third group of consumer creditors is comprised of installment-finance companies. The fourth group is made up of credit unions, industrial- banking companies, regulated and unregulated small-loan companies, pawn brokers, and miscellaneous lending agencies.
Beginning in 1930, sales of automobiles, refrigerators, gas and electric stoves, radios, furniture, other household appliances, and other types of consumer durable goods soon declined to a level where the debts incurred on new purchases were below the collections payable on existing installment accounts. This process continued through 1932 with the result that the unpaid amounts due installment-finance companies were reduced to two-fifths of their 1929 outstandings. Reductions in the sums due merchants on open-book accounts occurred more gradually. Purchases on a deferred-payment basis were continued for a time at clothing and department stores.
Contributing also to the delay in reduction of this class of consumer debt was the virtual absence of any specific requirements for periodic payments in many open-book credit accounts. Differences in the time and degree of reduction in outstandings also arose from changes in the character of the goods purchased in this manner. Purchases of certain durable commodities, such as automobiles or refrigerators, could often be postponed. Other products, such as food and drugs, were more nearly indispensable. Consequently, the debts that consumers owed food and drug stores continued to increase during 1930 and 1931, after most other consumer debts had declined. Taken as a whole, however, year-end outstandings of open-charge accounts of retail merchants showed annual declines for 4 consecutive years following 1929, as shown in table 13.
Similarly, a decline in the debts owed service creditors set in after 1929 and continued through 1933, despite the fact that payments on many individual accounts were delayed. Even in the curative services, many consumers, faced with diminished incomes, dispensed with all but what they deemed immediately essential dental, medical,
Digitized for FRASER http://fraser.stlouisfed.org/ Federal Reserve Bank of St. Louis

6 0 INDEBTEDNESS IN THE UNITED STATES
and surgical services. There were fewer new accounts to replace those that were being paid off or written off and outstandings accordingly declined until this condition was reversed in 1934. Debts owed cash-lending agencies declined from 1929 through 1932. It is noteworthy that when loans at low rates of interest were made available in 1931 on veterans’ bonus certificates, they had the effect of reducing outstandings with cash-lending agencies but, by providing the means of making down payments on automobiles or other durable commodities, they stimulated installment-company financing. Such new financing, however, was short-lived and insufficient to offset the downward trend in outstandings under way at that time.
The consumer-debt aggregates presented in this study contain a small amount of producer debt which cannot easily be excluded, especially when, as in the case of automobiles, a product may be used for both production and consumption purposes. Such producer debt is believed, however, to be a relatively small part of the total consumer debt.
It is perhaps quite significant, when viewed from the standpoint of economic stability, that once the downward trend in consumer-debt outstandings set in during 1930 it proceeded at an accelerated rate. The decline of 9 percent in 1930 was followed by declines of 14 percent in 1931, 26 percent in 1932, and 6 percent in 1933. Similarly, once the upward movement started, it gained momentum, expanding 12 percent in 1934, 18 percent in 1935, and 24 percent in 1936. After expanding at an unabated rate during the first quarter of 1937, consumer debts declined later in that year and during 1938. The year-end outstandings for 1937, which show a gain of 12 percent over 1936, conceal the marked expansion and contraction occurring within the year. The decline which began in April or May seems to have gained momentum late in 1937 and early in 1938. This downward movement was followed by an upturn in consumer debt which amounted to 7 percent both in 1939 and in 1940, and to 8 percent in 1941.
The consumer-debt totals presented in this study are carried over into the net debt aggregates shown in table 1. This leads to some overstatement of outstanding net debt, since, under our definition of net debt, debts are to be included only once in the net debt totals even though they may be incurred and recorded at several stages in the flow of savings to the end-borrower. Insofar as the cash-lending agencies are concerned, the duplicating debt has been for the most part excluded, since the liabilities of all banks, including all private banks reporting to the Comptroller of the Currency, are not included in the gross debt totals.
The extent to which professional service practitioners, merchants, and installment companies have gone into debt specifically to obtain funds to finance purchases by consumers cannot, except possibly in the case of installment companies, be established beyond a rough approximation. For this reason, it was decided to carry the consumer-debt figures into the net debt totals, though this inclusion may result in an overstatement of net debt by about 5.5 billion dollars for 1929 and 6 billion for 1940, equal to two-thirds of total consumer debt for those years. These figures, however, probably do not exceed those omitted, on account of inadequate statistics, from other categories of individuals’ indebtedness. Since consumer debt is included for all the years, the error for trend is comparatively small.
Digitized for FRASER http://fraser.stlouisfed.org/ Federal Reserve Bank of St. Louis
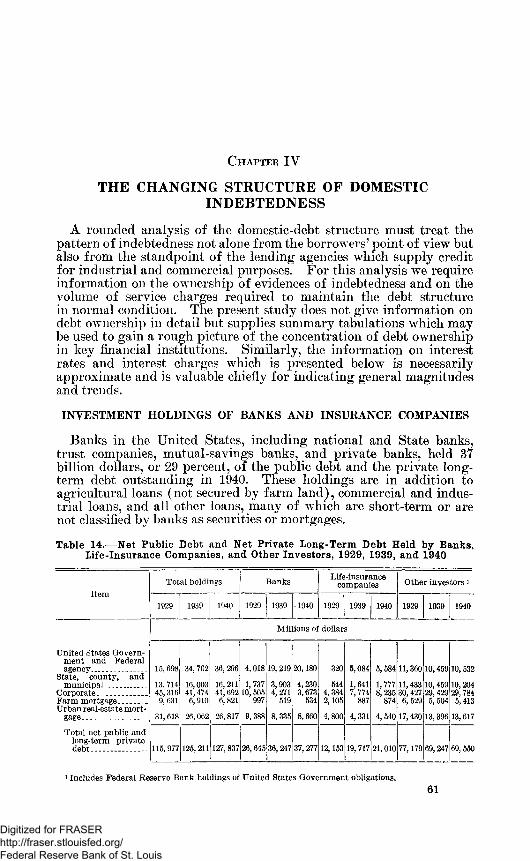
C h a p t e r IV
THE CHANGING STRUCTURE OF DOMESTIC INDEBTEDNESS
A rounded analysis of the domestic-debt structure must treat the pattern of indebtedness not alone from the borrowers’ point of view but also from the standpoint of the lending agencies which supply credit for industrial and commercial purposes. For this analysis we require information on the ownership of evidences of indebtedness and on the volume of service charges required to maintain the debt structure in normal condition. The present study does not give information on debt ownership in detail but supplies summary tabulations which may be used to gain a rough picture of the concentration of debt ownership in key financial institutions. Similarly, the information on interest rates and interest charges which is presented below is necessarily approximate and is valuable chiefly for indicating general magnitudes and trends.
INVESTMENT HOLDINGS OF BANKS AND INSURANCE COMPANIES
Banks in the United States, including national and State banks, trust companies, mutual-savings banks, and private banks, held 37 billion dollars, or 29 percent, of the public debt and the private longterm debt outstanding in 1940. These holdings are in addition to agricultural loans (not secured by farm land), commercial and industrial loans, and all other loans, many of which are short-term or are not classified by banks as securities or mortgages.
Table 14.— Net Public Debt and Net Private Long-Term Debt Held by Banks, Life-Insurance Companies, and Other Investors, 1929, 1939, and 1940
ItemTotal holdings Banks Life-insurance
companies Other investors 1
1929 j 1939 1940 1929 1939 -1940 1929 1939 1940 1929 1939 1940
United States Government and Federalagency______________
State, county, andmunicipal _________
Corporate. ................Farm mortgage_______Urban real-estate mort
gage-------------------------
Total net public and long-term private debt______________
Millions of dollars
15,698
13. 714 45,316 9,631
31, 618
34, 762
16,003 41,474 6,910
26.062
36, 296
16,211 41,692 6,821
26,817
4,018
1,737 10,505
997
9,388
19, 219
3,9034,271
519
8,335
20,180
4,230 3,673
534
8,660
320
5444,3842,105
4,800
5,084
1,641 7,774
887
4,331
5,584
1,777 8,235
874
4, 540
11,360
11,433 30,427 6, 529
17,430
10.459
10.459 29,4295,504
13,396
10,532
10,204 29,784 5,413
13,617
115,977 125, 211 127, 837 26,645 36,247 37,277 12,153 19, 717 21,010 77,179 69, 247 69,550
1 Includes Federal Reserve Bank holdings of United States Government obligations.61
Digitized for FRASER http://fraser.stlouisfed.org/ Federal Reserve Bank of St. Louis

62 INDEBTEDNESS IN THE UNITED STATES
Table 14.—Net Public Debt and Net Private Long-Term Debt Held by Banks, Life-Insurance Companies, and Other Investors, 1929,1939, and 1940— Continued.
ItemTotal holdings Banks Life-insurance
companies Other investors
1929 1939 1940 1929 1939 1940 1929 1939 1940 1929 1939 1940
Percentages of total holdings
United States Govern-ernment and Federalagency____ _________ 100.0 100.0 100.0 25.6 55.3 55.6 2.0 14.6 15.4 72.4 30.1 29.0
State, county, andmunicipal..... ............ . 100.0 100.0 100.0 12.7 24.4 26.1 4.0 10.2 11.0 83.3 65.4 62.9
Corporate ___________ 100.0 100.0 100.0 23.2 10.3 8.8 9.7 18.7 19.8 67.1 71.0 71.4Farm mortgage_______ 100.0 100.0 100.0 10.4 7.5 7.8 21.8 12.8 12.8 67.8 79.7 79.4Urban real-estate mort
gage----- ------- ------------ 100.0 100.0 100.0 29.7 32.0 32.3 15.2 16.6 16.9 55.1 51.4 50.8
Total net public andlong-term privatedeb t--........- ............ 100.0 100.0 100.0 23.0 28.9 29.1 10.5 15.7 16.4 66.5 55.4 54.5
Bource: Reports of the Federal Reserve Board, Comptroller of the Currency, and Association of Life Insurance Presidents.
In 1940, banks held 32 percent of outstanding urban real-estate mortgages, 26 percent of the net State and local debt, and 56 percent of the net debt of the Federal Government and Federal agencies. Banks held a larger proportion of the total outstandings of each of these debt classes in 1940 than in 1939 and 1929. Their proportion of urban real-estate mortgages held in 1940 showed a small increase over 1929, while the ratio of holdings to net outstandings of Federal, State, and local government securities in 1940 was twice that of 1929. In absolute amount, bank holdings of United States Government and Federal agency securities increased from 4 billion dollars in 1929 to 20 billion in 1940. For the same years, State and local government security holdings increased from 1.7 billion to 4.2 billion.
Bank holdings of corporate securities and farm mortgages in 1940 were smaller than in 1929, both in proportion to total outstandings and in absolute amount. It should be noted, however, that a part of the decline shown in corporate-security holdings is due to a change in the basis of reporting by banks and to an increasingly common banking practice of making direct long-term loans to corporations. These are classified as commercial and industrial loans. Such obligations of corporations appear, however, in the net corporate debt outstandings presented in table 6, since long-term corporate debt embraces both funded and unfunded long-term debt. In absolute amount, bank holdings of urban real-estate mortgages also were lower in 1940 than in 1929, though relative holdings were somewhat higher.
Digitized for FRASER http://fraser.stlouisfed.org/ Federal Reserve Bank of St. Louis

CHANGING STRUCTURE OF DOMESTIC INDEBTEDNESS 63Table 15.— Estimated Distribution of Tax-Exempt Securities, by Class of Holder,
as of June 30, 1937-40 1[In billions of dollarsl2
Wholly tax-exempt securities Partially tax-exempt securities
Item and year
Alltax-ex
emptsecurities
Total
Securities of
the United States Govern
ment
Securities of
Federal instrumental
ities guaranteed by
the United States
Government
Securities of State
and local governments and of territories
and insular
possessions
Total
Securities of
the United States Govern
ment
Securities of
Federal instrumental
ities guaranteed by
the United States
Government
Securities of
Federal instrumentalities not guaranteed by
the United States
Government
TOTAL AMOUNT OUTSTANDING
1937 .................. ........ ............... 65.6 36.6 15.1 2.2 19.3 29.0 20.7 8 .31938 ............................. ............. 63.9 35.0 13.5 2 .2 19.3 28.9 23.1 5 .7 0.11939 ............................................. 67.7 34.7 12.8 2.1 19.8 33.0 27.1 5.7 .21940 ................................................ 70.2 35.0 12.9 2.1 20.0 35.2 29.5 5.5 .2
HELD BY GOVERNMENTAL FUNDS, ETC.3
1937 .................. ............................- 15.1 8 .6 3.5 .8 4.3 6.5 2.5 4.01938 ..................................- 13.8 9 .9 4 .6 .8 4.5 3.9 2.7 1.21939 . . . ........................... .......... 14.3 10.8 5.5 .8 4.5 3.5 2 .9 .61940 ................................. ............. 15.4 11.4 6.0 .8 4.6 4.0 3.6 .3 . 1
TOTAL AMOUNT PRIVATELY HELD
1937 ................................... .......... 50.5 28.0 11.6 1.4 15.0 22.5 18.2 4.31938 ...................................... .......... 50.1 25.1 8 .9 1.4 14 8 25.0 20.4 4.5 .11939 ____________ ______________ 53.4 23.9 7.3 1.3 15.3 29.5 24.2 5.1 .21940 __________________________ 54.8 23.6 6.9 1.3 15.4 31.2 25.9 5.2 .1
HELD BY ALL ACTIVE BANKS, EXCEPT MUTUAL SAVINGS BANKS
1937 ________________________ 17.7 9.0 5.9 .3 2.8 8. 7 6.5 2.21938 ................ - .............................. 17.3 7.7 4.6 .3 2.8 9.6 7.1 2.4 .11939 .................................... ............. 19.4 7.3 3.8 .3 3.2 12.1 8.7 3.2 .21940 - .................. - .......................... 20.7 7 .6 3.7 .3 3.6 13.1 9. 5 3.5 . 1
HELD BY MUTUAL SAVINGS BANKS
1937 ............................................... 3.2 1.1 .3 .8 2.1 1.9 .21938 ____________ ______________ 3.4 .9 .2 .7 2. 5 2.2 .31939 . __________________ 3.7 .9 .3 .6 2. 8 2.4 .41940 - - - - - - - _____________ 3.7 .9 .3 .6 2.8 2.3 .5
HELD BY INSURANCE COMPANIES
1937 .............................................. 6.8 3.1 1.3 1.8 3. 7 3.1 .61938 _____ ____________ _______ 7.1 2.7 .8 1.9 4.4 3. 7 .71939 .........................- .......... 7.8 2.6 .6 2.0 5. 2 4.6 .61940 ________________________ 8.2 2.5 .4 2.1 5. 7 5.2 .5
1 Tax-exempt securities comprise all securities the interest on which is wholly or partially exempt from the Federal income tax. The total amount outstanding of tax-exempt securities of the several borrowers differs from the gross indebtedness of these borrowers in that the former excludes noninterest debt and taxable interest-bearing debt, both of which are included in the gross indebtedness of the borrowers. The total amount privately held differs from the net indebtedness of the borrowers in several additional respects. The former is derived by deducting from the total amount of tax-exempt securities outstanding the amount of all tax-exempt securities held by governmental funds, and so on. Net indebtedness, on the other hand, is derived by deducting from the gross indebtedness an amount equivalent to the total volume of sinking- fund assets of the respective borrowers, but makes no allowance for any other public assets.
2 Because the figures in this table are rounded to hundreds of millions of dollars, they will not necessarily agree with other published figures on tax-exempt securities.
3 Comprises securities held by (1) U. S. Government, (2) Federal agencies and trust funds, including Exchange Stabilization Fund but excluding individual Indian trust funds, (3) Federal Reserve banks, (4) joint-stock land banks, and (5) sinking, trust, and investment funds of State and local governments and of territories and insular possessions.
Source: Treasury Department.
Digitized for FRASER http://fraser.stlouisfed.org/ Federal Reserve Bank of St. Louis

64 INDEBTEDNESS IN THE UNITED STATES
Table 15.—Estimated Distribution of Tax-Exempt Securities, by Class of Holder, as of June 30, 1937-40— Continued
Wholly tax-exempt securities Partially tax-exempt securities
Item and year
Alltax-ex
emptsecurities
Total
Securities of
the United States Govern
ment
Securities of
Federal instrumental
ities guaranteed by
the United States
Government
Securities of State
and local governments and of territories
and insular
possessions
Total
Securities of
the United States Government
Securities of
Federal instru
mentalities
guaranteed by
the United States
Government
Securities of
Federal instru
mentalities not guaranteed by
the United States
Government
HELD BY C O R P O R A T IO N S OTHER THAN BANKS AND INSURANCE COMPANIES
1937 _______ ________________ 2.8 1.8 1.1 . 1 .6 1.0 .7 .31938 __________________ _______ 2. 6 1.5 .8 . 1 .6 1.1 .8 .31939______________________________ 2.5 1.3 .6 . 1 .6 1.2 .9 .31940 _______________________ 2 .4 1.2 . 6 . 1 . 5 1.2 1.0 . 2
HELD BY TAX-EXEMPT INSTITUTIONS OTHER THAN MUTUAL SAVINGS BANKS
1937 _________________________ 1.0 .6 . 1 .5 .4 .3 . 11938 __________________________ 1.0 . 6 . 1 .5 .4 .3 . 11939 __________________ ________ 1.3 .8 . 1 .7 .5 .4 . 11940 - ________________ 1.3 .8 .1 .7 .5 .4 . 1
HELD BY INDIVIDUALS
1937 ___________________________ 19.0 12. 4 2.9 1.0 8 .5 6.6 5.7 .91938 ___________________________ 18. 7 11.7 2 .4 1.0 8.3 7.0 6 .3 . 71939 __________________________ 18. 7 11. 0 1.9 .9 8. 2 7.7 7.2 .51940 __________________________ 18.5 10.6 1.8 .9 7.9 7.9 7.5 .4
In 1940, investment holdings of net public debt and net long-term private debt by the larger life-insurance companies, representing about 95 percent of the holdings of all life-insurance companies, totaled 21 billion dollars, or 16.4 percent of total outstandings. This compares with 37 billion, or 29 percent of outstandings, held by banks. In absolute amount, holdings of life-insurance companies in 1940 were below those of 1929 in only two categories—farm mortgages and urban real-estate mortgages, but the percent of holdings to total outstandings of the latter for 1940 was slightly above that for 1929.
In each of the other classes of securities presented in table 14 life- insurance-company investments in 1940 were greater in amount and in percent of total outstandings than in 1929. In 1940, their holdings of obligations of the United States Government and Federal agencies reached a new peak approximating 5.6 billion dollars, compared with 320 million dollars for 1929. Investments in State and local government securities totaled 1.8 billion, or slightly more than three times the investments in these securities in 1929.
Table 16, showing the mortgage debt on 1- to 4-family urban residential properties classified according to principal lending agencies, and table 11, showing farm-mortgage debt similarly classified, present additional information on the holdings of these types of debt by principal investor classes. Perhaps the most important change occurring
Digitized for FRASER http://fraser.stlouisfed.org/ Federal Reserve Bank of St. Louis

in the investor holdings of farm-mortgage debt was the increase in holdings of Federal land banks and Land Bank Commissioners from1.2 billion dollars in 1929, equal to one-eighth of total outstandings, to 2.6 billion, or two-fifths of outstandings, in 1940. Similarly, the transfer by banks, insurance companies, building and loan associations, and other private investors of 3 billion dollars in urban residential real- estate mortgages to the Home Owners’ Loan Corporation constitutes an important occurrence in this field. By the end of 1940, the Home Owners’ Loan Corporation holdings had been reduced to about 2.0 billion, or to slightly more than 10 percent of the outstanding mortgages on 1- to 4-family urban residential property.
Table 16.— Estimated Outstanding Mortgage Loans on Urban 1- to 4-Family Homes, by Type of Lender, 1929-41
[Millions of dollars]
CHANGING STRUCTURE OF DOMESTIC INDEBTEDNESS 65
Year TotalSavings
and loan associa
tions
Insurancecom
panies
Mutualsavingsbanks
Commercial banks
HomeOwners'Loan
Corporation
Individuals and
others 1
1929____ _____ ____ _____ ____ _ 21,058 6,507 1,626 3,225 2,500 7,2001930................................................. 21,358 6,402 1, 732 3,300 2,524 7,4001931___________ ____ __________ 20,685 5,890 1, 775 3.375 2,145 7, 5001932__________________________ 19, 242 5,148 1, 724 3,375 1,995 7,0001933................................................ 17,878 4, 437 1,599 3, 200 1,810 132 6, 7001934............. ................................... 17,857 3, 710 1,379 3,000 1,189 2,379 6,2001935............................ ..............._. 17, 510 3, 293 1, 281 2,850 1,189 2,897 6,0001936__________________________ 17,225 3, 237 1, 245 2,750 1, 230 2, 763 6,0001937......... ..................................... . 17, 344 3, 420 1, 246 2,700 1,400 2, 398 6,1801938___________________________ 17, 646 3, 555 1, 320 2, 670 1,600 2,169 6, 3321939.............................................. 18, 216 3, 758 1,490 2. 680 1, 810 2,038 6,4401940............................................. 19,123 4,104 1, 758 2, 700 2,0*5 1,956 6, 5101941...................... .......................... 20,008 4,479 2,058 2,720 2,380 1,781 6,590
1 Includes fiduciaries, trust departments of commercial banks, philanthropic and educational institutions, fraternal organizations, real-estate, bond, title and mortgage, and construction companies, the R . F. C. Mortgage Company, and so on.
Source: Division of Economic Research, Federal Home Loan Bank Board.
DEBT AND INTEREST
INTEREST PAYABLE
The concept of “interest payable,” as used in this study, is intended neither as a measure of interest actually paid nor as an indication of the rate of return or yield of bonds and mortgages sold at various prices* above or below par. It is intended simply to indicate the amount of interest accruing and payable under the terms of existing debt contracts. An interest total of this kind is useful mainly in that it indicates the volume of fixed charges payable compared with the income or assets of a debtor or a class of debtors. The interest- payable totals do not include amortization of debt discount and expense.
It may be observed that private short-term debts are excluded from the interest-payable computations. Short-term debts are excluded because no interest, as such, is explicitly paid on some types of short-term debt, as, for example, open accounts of retail establishments. Other types, exemplified by accounts payable, do not bear interest unless payment is deferred beyond a given date, when some
Digitized for FRASER http://fraser.stlouisfed.org/ Federal Reserve Bank of St. Louis

66 INDEBTEDNESS IN THE UNITED STATES
accounts become subject to an interest charge, others to a loss of the privilege of discounting the face amount 01 the accounts payable. Still other types, as, for example, the debts incurred in connection with the purchase of automobiles and other relatively durable merchandise, bear interest, but the interest charges may be so intermingled with other charges and payments that the segregation of interest from other charges is not always possible.
The classes of private debt on which estimations of the rate of interest and interest payable have been made comprise the long-term debts of railway, public utility, industrial, and financial corporations, the mortgage debts of farmers, and the commercial and residential urban real-estate mortgage debts of individuals and other noncorporate borrowers. Public debt for purposes of interest-rate and interest-payable analyses consists of the short-term and long-
INDEX NUMBERS (1935-39 = lOO)
D O 41-477
Figure 10.— Indexes of interest payable on components of long-term private debt, 1929-41.
term interest-bearing debt of the Federal, State, and local governments. Only non-interest-bearing public debt is excluded from these computations.
Interest payable is shown on both a gross and a net debt-basis. The function of estimates of interest payable on gross debt is to depict the aggregate of all interest payable. It is then possible, by taking the difference between gross interest payable and net interest payable, to measure the amount of interest payable by one affiliate to another within the debtor units, and thus to determine the interest payable on duplicating debt, as previously defined. The rate of interest applied in estimating gross interest payable is based on the rates paid on publicly held obligations. This may lead to a slight overstatement of intercorporate interest payable since the rate on some intercorporate obligations is only nominal.
Interest payable on net public interest-bearing debt and net private long-term debt was 5,122 million dollars at the end of 1941. This
Digitized for FRASER http://fraser.stlouisfed.org/ Federal Reserve Bank of St. Louis

was higher by only 58 million than interest payable in 1939, despite a rise of nearly 26 billion dollars in debt, and lower by 1,101 million, or 18 percent, than interest payable in 1929, despite a rise in outstandings of nearly 37 billion. Such a decline in interest payable in the face of a growth in the volume of outstandings can only be explained by the pronounced decline in interest rates together with the change in the composition of total debt during these years.
CHANGING STRUCTURE OF DOMESTIC INDEBTEDNESS 67
1929 1930 1931 1932 1933 1934 1935 1936 1937 1938 1939 1940 1941
Figure ll.-'-Indexes of interest payable on components of public debt, 1929-41.
Digitized for FRASER http://fraser.stlouisfed.org/ Federal Reserve Bank of St. Louis

Table 17.— Net Public and Net Long-Term Private Interest-Bearing Debt, Average Interest Rates, and Interest Payable in the United States, §31929-41
Item
Total net long-term debt..
Public debt_____________________Federal and Federal agencies.
Federal_________________Federal agencies_________
State and local governments..Private debt____________________
Railway_____________________Nonrailway_________________Farm mortgage______________Urban mortgage____________
Total net long-term d e b t...
Public debt--------------------------------Federal and Federal agencies
Federal_________________Federal agencies________
State and local governmentsPrivate debt____________________
Railway____________________Nonrailway_________________Farm mortgage—....................Urban mortgage...................... .
Total net long-term debt—
Public debt_____________________Federal and Federal agencies.
Federal__________________Federal agency__________
State and local governments.
115, 230 120,405 121,365 120,193 117,690 115, 277 115,627 117, 566 120,880 123,483 126, 249 128,904 142,470
28,666 29,371 32,237 34,676 37,003 38,002 40,486 44,352 46,129 47,360 49,884 51,472 63,80715,426 15,139 16, 793 18,356 20, 663 22, 545 25,003 28, 763 30, 739 32, 090 34, 266 35, 531 48,16613,673 13,365 15,082 16,729 18,746 17, 690 19.429 23,009 25,066 26,057 27, 549 28, 970 40,6121,753 1,774 1, 711 1,627 1,917 4, 855 5, 574 5, 754 5.673 6.033 6, 717 6,861 7,554
13,240 14, 232 15,444 16,320 16, 340 15,457 15,483 15, 589 15,390 15, 270 15,618 15,641 15,64186, 564 91.034 89,128 85,517 80,687 77, 275 75,141 73, 214 74, 751 76,123 76,327 77,361 78,66311,541 11, 795 11, 778 11,900 11,861 11,862 11, 753 12,038 12,013 12,018 12,012 12, 014 12,01333,775 37,142 36, 249 34,945 33, 583 30, 966 29,884 28,323 30, 073 31, 410 31,343 31, 709 32,2309,630 9,459 9, 214 8, 638 7,887 7, 786 7,640 7,390 7,218 7, 084 6,910 6,821 6,787
31, 618 32,638 31,887 30, 034 27, 356 26, 661 25, 864 25,463 25,447 25,611 26,062 26,817 27,633
1929 1930 1931 1932 1933 1934 1935 1936 1937 1938 1939 1940 1941
Volume of debt outstanding (millions of dollars)
Average interest rates
5. 347 5. 335 5. 285 5.187 5.020 4. 710 4.463 4.303 4.199 1 4.073 3.886 3.784 3.595
4. 264 4.188 4.105 3. 978 3.745 3.402 3.101 3.010 2.951 2.986 2.890 2. 789 2.6703. 994 3.838 3.695 3.496 3. 202 2. 862 2.501 2.472 2.464 2. 571 2.548 2. 519 2.4203.919 3. 750 3. 599 3.407 3.296 2. 960 2. 554 2. 570 2. 568 2. 586 2. 598 2. 566 2. 5184.650 4. 550 4. 590 4.200 2.700 2. 580 2. 360 2.170 2.100 2. 510 2. 290 2. 250 1.9024. 550 4. 530 4. 520 4. 550 4. 520 4.480 4.380 4. 250 4.150 4. 000 3. 750 3. 500 3.4005. 730 5.740 5.740 5. 720 5. 680 5. 560 5.420 5.310 5.190 4. 920 4. 700 4. 620 4. 3504.670 4.620 4.670 4.640 4.690 4. 590 4.600 4. 550 4. 500 4. 450 4. 500 4. 500 4. 5005.420 5.460 5.460 5.460 5.460 5.400 5.310 5.140 5. 070 4. 680 4. 360 4.250 3.6106.000 6.000 6.000 6.000 5.800 5. 500 5.100 5.100 5.000 5.000 5.000 5.000 4.9406. 500 6. 500 6.500 6.500 6.500 6.300 6.100 6.000 5. 800 5.500 5.200 5.100 5.000
Average interest-rate index (1935--39 = 100)
127.8 127.5 126.3 123.9 120.0 112.6 106.6 102.8 100.3 97.3 92.9 90.4 80.3
142.7 140.2 137.4 133.2 125.4 113.9 103.8 100.7 98.8 99.9 96.7 93.4 89.4159.0 152.8 147.1 139.2 127.5 114.0 99.6 98.4 98.1 102.4 101.5 100.3 96.4152.2 145.6 139.8 132.3 128.0 114.9 99.2 99.8 99.7 100.4 100.9 99.6 97.8203.4 199.0 200.8 133.7 118.1 112.9 103.2 94.9 91.9 109.8 100.2 98.4 83.1110.8 110.3 110.1 110.8 110.1 109. 1 106.7 103.5 101.1 97.4 91.3 85.2 82.8
3WO3MCOCO
CO
>HMCO
IN THE
UN
ITED
Digitized for FRASER http://fraser.stlouisfed.org/ Federal Reserve Bank of St. Louis

Private debt_______Railway________Nonrailway____Farm mortgage.. Urban mortgage.
Total net long-term debt—
Public debt_____________________Federal and Federal agencies
Federal_________________Federal agencies________
State and local governments..Private debt__________________ _
Railway_______________ ____Nonrailway._____ __________Farm mortgage....... .......... ......Urban mortgage____________
112.2 112.4 112.4 112.0 111.2 108.8 106.1 104.1) 101.6 96.3 92.0 90.4 85.2103.3 102.2 103.3 102.7 103.8 101.5 101.8 100.7 99.6 98.5 99.6 99.6 99.6110.3 111.2 111.2 111.2 111.2 109.9 108.1 104.6 103.2 95.3 88.8 86.5 73.5119.0 119.0 119.0 119.0 115.1 109.1 101.2 101.2 99.2 99.2 99.2 99.2 98.0113.6 113.6 113.6 113.6 113.6 110.1 106.6 104.9 101.4 96.2 90.9 89.2 87.4
Interest payable (millions of dollars)
6, 223
1,220 618 536 82
602 5,003
539 1,831
578 2,055
227 582 501 81
645 i, 261
545 !, 028
567 !, 121
6,475
1,319 622 543 79
698 5,155
550 1, 979
553 2,073
6, 314
1, 381 638 570 68
743 4, 930
552 1,908
518 1,952
6,034
1, 409 670 618 52
739 4, 625
556 1,834
457 1, 778
5,665
1,341 649 524 125 692
4,324 544
1,672 428
1,680
5,288
1,379 716 591 125 663
3,909 548
1,456 377
1, 528
5, 305
1,402 763 644 119 639
3,903 541
1,525 361
1,476
5, 204
1, 436 825 674 151 611
3, 768 535
1,470 354
1,409
5,065
1,456 870 716 154 586
3,608 541
1,366 346
1,355
5,048
1,446 899 745 154 547
3,602 541
1,348 345
1,368
5,121
1,699 1,167 1,023
144 532
3,422 541
1,164 335
1,382
Interest-payable index (1935-39=100)
Total long-term debt.. _________ ___ __________________ 118.5 123.6 123.3 120.3 114.9 107.9 102.7 100.7 101.0 99.1 96.4 96.2 97.5
Public debt-------------------------------------------------------------------------- ---------- 87.4 87.9 94.6 98.9 100.9 96.1 93.6 98.8 100.4 102.9 104.3 103. 6 ' 121.7Federal and Federal agencies_________________________________ 81.3 76.5 81.8 83.9 88.1 85.3 82.6 94.2 100.3 108.5 114.4 118.3 153.6
Federal__________________________________________________ 85.9 80.3 87.0 91.3 99.0 83.9 79.5 94.7 103.2 108.0 114.7 118.3 163.9Federal agencies _______ ________________ ____ ______ 60.2 59.5 58.0 49.9 38.2 91.8 96.9 91.8 87.4 110.9 113.1 113.2 105.9
State and local governments . _ ______________________________ 94.7 101.5 109.9 116.9 116.3 108.9 106.7 104.3 100.6 96.2 92.2 86.1 83.8Private debt_______ ____________________________________________ 129.8 136.5 133.7 127.9 120.0 112.2 106.0 101.4 101.3 97.8 93.6 93.4 88.8
Railway_____________________ _____ ___________________________ 99.6 100.7 101.6 102.0 102.7 100.5 100.0 101.3 100.0 98.9 100.0 100.0 100.0Nonrailway_________________________ ____ ____________________ 123.6 137.0 133.6 128.8 123.9 112.9 107.2 98.2 103.0 99.3 92.2 91.0 78.6Farm m ortgage_________________________ _____ _______________ 158.1 155.1 151.3 141.7 125.0 117.1 106.7 103.1 98.7 96.8 94.6 94.6 91.6Urban mortgage_______________________ ________ ______________ 140.1 144.6 141.3 133.1 121.2 114.5 106.8 104.2 100.6 96.0 92.4 93.3 94.2
CHAN
GIN
G
STRUCTU
RE OF
DO
MESTIC
IND
EB
TED
NE
SS
Digitized for FRASER http://fraser.stlouisfed.org/ Federal Reserve Bank of St. Louis

70 INDEBTEDNESS IN THE UNITED STATES
AVERAGE INTEREST RATES
As shown in table 17, the average interest rate on the total debt for all classes covered declined 33 percent over 12 consecutive years, from 5.35 percent in 1929 to 3.60 percent in 1941. The largest declines in interest rates occurred in connection with public debt. On United States Government obligations the rate of interest declined from 3.919 percent in 1929 to 2.518 percent in 1941. Comparatively moderate declines in the interest rate on United States Government obligations occurred in each of the years during the period 1930-33. These declines were followed by sharp reductions in rates, the index (1935-39=100) dropping 13.1 points to 114.9 in 1934 and 15.7 points to 99.2 in 1935. From 1935 through 1941, the average interest rate on United States obligations moved in a narrow range, about 35 percent below the 1929 level.
1929 1930 1931 1932 1933 1934 1935 1936 1937 1938 1939 1940 1941D.D. 41 - 479
Figure 12.— Average interest rate on components o f public debt, 1929-41.
The rate on United States securities used here consists of the average weighted rate on all interest-bearing outstandings as of the end of the calendar year. Consequently, the interest payable on these obligations reflects the amount payable if all securities outstanding at the year’s end were outstanding throughout the year. Such amounts payable differ from the interest actually paid by the United States Government because of the changes in the rates on outstandings through refundings, also because of increases or decreases in the volume of outstandings during the year. Since increases in Federal debt have occurred yearly since 1930, interest payable, computed by applying an average rate to outstandings at the end of the year, slightly exceeds in each year the interest actually paid. As of June 30, 1940, interest payable totaled 1,095 million on gross Federal debt, whereas interest actually paid during the fiscal year 1940 amounted to only 1,041 million.
Digitized for FRASER http://fraser.stlouisfed.org/ Federal Reserve Bank of St. Louis
CHANGING STRUCTURE OF DOMESTIC INDEBTEDNESS 71P u b l ic D e b t
Of all the classes of debt covered in the analysis of interest rates, Federal agency securities experienced the sharpest year-to-year drop in the average interest rate when the rate on this class of obligations fell from 4.2 percent to 2.7 percent from 1932 to 1933. This resulted in a fall of the Federal agen'cv interest-rate index (1935 = 100) from 183.7 to 118.1. For the 1929-41 period, average interest rates of Federal agency securities declined 59 percent. This compares with a decline of 33 percent in the average interest rate on direct United States Government obligations, the class of securities experiencing the second largest decline in interest rates.
The particularly large decline in interest rates of Federal agency securities was due to guarantees, begun in 1933, of the bulk of Federal agency issues by the United States Government. In 1932, the average interest rate on Federal agency securities was 4.2 percent, compared with 3.4 percent for United States Government obligations. In 1941, the rate on Federal agency securities had fallen to 1.9 percent, lower by 0.6 percent than the rate on United States Government securities. Two factors account, in the main, for the lower rate on Federal agency outstandings—the existence of United States Government securities issued in years past and bearing a comparatively high interest rate, which were not subject to call prior to 1940, and the proportionately large use by the agencies of issues not exceeding 5 years in duration. Such issues with near-term maturities have had markedly low interest rates in recent years.
Interest rates on State and local government outstandings did not share in the decline observed for rates on Federal and Federal agency securities during the 1929-33 period. Even in 1934, the average interest rate of 4.5 percent on State and local government securities was little different from the rate of 4.6 for 1929. By the end of 1941, it had dropped to 3.4 percent, a decline of 25 percent from 1929. Widespread defaults in the securities of local government units during 1931-33 were not conducive to lower interest rates for this group. Also, the impracticability of realizing any material savings in interest by refunding small serial issues on which substantial retirement had already been made somewhat limited the opportunity to accomplish reductions in interest rates by refunding existing issues. Interest payable by State and local divisions on gross debt outstandings of 19.8 billion dollars and net debt outstandings of 16 billion dollars amounted to 673 million and 544 million, respectively, in 1941. This was appreciably below the 763 million and 602 million, respectively, payable on a smaller volume of outstandings in 1929.
P r iv a t e D ebt
The average interest rate on private long-term debt has experienced a decline of only 20 percent since 1929, compared with a decline of 35 percent in public debt. The decline in the average rate of interest on outstanding private long-term debt differed in timing and amplitude from the decline in the average rate on public debt. From 1929 through 1933, the interest rate on private debt remained almost constant, wThile that on public debt declined more than one-tenth and that on United States Government obligations fell nearly one-fifth.
Digitized for FRASER http://fraser.stlouisfed.org/ Federal Reserve Bank of St. Louis

72 INDEBTEDNESS IN THE UNITED STATES
Unsatisfactory earnings of many corporations kept the rate of interest at a relatively high level for the very small quantity of new capital issues marketed, and prevented refundings at lower rates by these corporations. For those corporations whose credit warranted new capital or refunding issues at lower.rates, the frozen condition of the securities markets prevented any large-scale financing or refinancing.
Outstandings on urban real-estate mortgage debt owed by individuals and other noncorporate borrowers did not reflect the lower rates resulting from the Home Owners’ Loan Corporation refinancing program until 1934. The reduction in interest rates on farm mortgages was on too small a volume of outstandings to have an appreciable effect on total private long-term outstandings.
1929 1930 1931 1932 1933 1934 1935 1936 1937 1938 1939 1940 1941
Figure 13.— Average interest rate on components o f long-term private debt, 1929-41.
From 1933 to 1941, the average rate on private long-term debt declined about one-fifth to 4.35 percent at the end of 1941. The decline, however, was not distributed evenly among all classes of private long-term outstandings. The average rate of interest on railway obligations was down only slightly principally because of the low earnings of railways but also because of the comparatively low interest rates on railway securities obtaining in 1929. The largest decline in the average rate occurred on the debt obligations of industrial and financial corporations, which experienced a decline of one-third during the 1929-41 period. Next in point of decline were public-utility and urban real-estate mortgage interest rates, each of which was lower by one-fifth. The relatively large decline in these two classes is due to the fact that it began from rather high levels in 1929. For all classes of net private long-term debt, interest payable totaled 3.4 billion dollars on outstandings of 79 billion in 1941, compared with interest payable of 5 billion on outstandings of 87 billion in 1929.
Digitized for FRASER http://fraser.stlouisfed.org/ Federal Reserve Bank of St. Louis

464252'
Table 18.— Gross Public and Gross Long-Term Private Interest-Bearing Debt, Average Interest Rates, and Interest Payable in the UnitedStates, 1929-41
Item1929 1930 1931 1932 1933 1934 1935 1936 1937 1938 1939 1940 1941
Volume of debt outstanding (millions of dollars)
Total gross long-term debt__________________________________ 131,254 137, 515 138,125 138,141 137,997 142,937 143,724 145,364 149, 798 150,921 153,825 158,131 172,598
Public debt._______________________________________ ____ . ________ 34, 658 35,649 38,410 42,323 47, 343 56, 279 59,471 63, 575 66,349 66,093 69,015 72,422 85,738Federal and Federal agencies. _______________________________ 17,898 17, 664 19,350 22,993 27,826 37,452 40,492 44, 363 47,189 46,929 49,404 52,531 65,928
Federal___________________________________________________ 16,029 15. 774 17, 528 20,448 23,450 27, 944 29, 596 33, 699 36, 715 38,911 41,465 44,458 57,451Federal agencies____ __ _________ _______ ________ 1,869 1,890 1,822 2,545 4, 376 9,508 10,896 10, 664 10,474 8,018 7,939 8,073 8,477
State and local governments. __________________ _____________ 16, 760 17, 985 19,060 19, 330 19, 518 18,827 18,979 19,218 19,160 19,164 19,611 19,891 19,810Private debt________________________________________________ _____ 96, 596 101, 866 99,715 95,818 90, 653 86, 658 84,253 81, 783 83,449 84,828 84,810 85, 709 86,860
Railway.. _____________________________________________________ 13,415 13,709 13,690 13,831 13,786 13,788 13, 662 13,993 13,964 13,969 13, 963 13, 963 13,963Public utility______________________ ____ _______ ____ ________ 14, 467 15,665 15,839 16,071 15, 874 15,135 14, 776 14, 241 14, 427 14,469 14,324 14, 338 14,355Industrial and financial_________________ ______________ _____ _ 27,466 30,395 29,085 27, 244 25,750 23, 288 22, 311 20, 696 22, 393 23, 695 23, 513 23,699 24,122Farm mortgage________ ___________ _____ ______ ______ _______ 9,630 9,459 9, 214 8, 638 7,887 7,786 7, 640 7, 390 7,218 7,084 6,948 6,892 6, 787Urban mortgage............................- -------------- ----------------------------- 31, 618 32, 638 31,887 30,034 27,356 26, 661 25,864 25, 463 25, 447 25, 611 26,062 26,817 27,633
Average interest rates
Total gross long-term d e b t........... ............ ..................................... 5.347 5.335 5.285 5.187 5.020 4. 710 4.463 4.303 4.199 4.073 3.886 3.784 3.360
Public debt_____________________________ _________ _________ _____ 4.264 4.188 4.105 3.978 3.745 3.402 3.101 3.010 2.951 2.986 2.890 2.789 2.670Federal and Federal agencies________________________ ______ _ 3.994 3.838 3.695 3.496 3.202 2.862 2.501 2.472 2.464 2. 571 2.548 2. 519 2.420
Federal_____________________________ ____ ________________ 3. 919 3.750 3. 599 3.407 3. 296 2.960 2. 554 2. 570 2. 568 2. 586 2. 598 2. 566 2. 518Federal agencies___ ____________________________________ 4.650 4. 550 4.590 4.200 2.700 2.580 2.360 2.170 2.100 2. 510 2.290 2.250 1.900
State and local governments_________________________ ________ 4.550 4. 530 4. 520 4. 550 4.520 4.480 4.380 4. 250 4.150 4.000 3. 750 3. 500 3.400Private debt— _______ ___________________________________________ 5.730 5.740 5.740 5.720 5.680 5.560 5.420 5.310 5.190 4.920 4. 700 4. 620 4.350
Railway__________ ____ ___________________________ _____ _____ 4.670 4.620 4.670 4.640 4.690 4.590 4. 600 4. 550 4.500 4.450 4. 500 4.500 4.500Public utility_______ __ _________ _______________ _________ 5.200 5.200 5.200 5.200 5.200 5.100 4.970 4. 750 4.650 4.500 4.300 4.100 4.000Industrial and financial. ___________________ ____ ___________ 5. 550 5.600 5.600 5.600 5.600 5.600 5. 550 5.420 5.280 4.800 4.400 4.100 3.900Farm mortgage... __________________________________________ 6.000 6.000 6.000 6.000 5.800 5. 500 5.100 5.100 5.000 5.000 5.000 5.000 4.940Urban mortgage_____ _________________________________________ 6.500 6.500 6.500 6.500 6.500 6.300 6.100 6.000 5.800 5.500 5.200 5.100 5.000
CO
CHAN
GIN
G
STRU
CTUR
E OF
DO
MESTIC
IND
EB
TE
DN
ESS
Digitized for FRASER http://fraser.stlouisfed.org/ Federal Reserve Bank of St. Louis

464252'
Table 18.— Gross Public and Gross Long-Term Private Interest-Bearing Debt, Average Interest Rates, and Interest Payable in the UnitedStates, 1929-41
Item1929 1930 1931 1932 1933 1934 1935 1936 1937 1938 1939 1940 1941
Volume of debt outstanding (millions of dollars)
Total gross long-term debt__________________________________ 131,254 137, 515 138,125 138,141 137,997 142,937 143,724 145,364 149, 798 150,921 153,825 158,131 172,598
Public debt._______________________________________ ____ . ________ 34, 658 35,649 38,410 42,323 47, 343 56, 279 59,471 63, 575 66,349 66,093 69,015 72,422 85,738Federal and Federal agencies. _______________________________ 17,898 17, 664 19,350 22,993 27,826 37,452 40,492 44, 363 47,189 46,929 49,404 52,531 65,928
Federal___________________________________________________ 16,029 15. 774 17, 528 20,448 23,450 27, 944 29, 596 33, 699 36, 715 38,911 41,465 44,458 57,451Federal agencies____ __ _________ _____ ________ 1,869 1,890 1,822 2,545 4, 376 9,508 10,896 10, 664 10,474 8,018 7,939 8,073 8,477
State and local governments. __________________ _____________ 16, 760 17, 985 19,060 19, 330 19, 518 18,827 18,979 19,218 19,160 19,164 19,611 19,891 19,810Private debt________________________________________________ _____ 96, 596 101, 866 99,715 95,818 90, 653 86, 658 84,253 81, 783 83,449 84,828 84,810 85, 709 86,860
R ailw ay..-____ _______________________________________________ 13,415 13,709 13,690 13,831 13,786 13,788 13, 662 13,993 13,964 13,969 13, 963 13, 963 13,963Public utility______________________ ____ _______ ____ ________ 14, 467 15,665 15,839 16,071 15, 874 15,135 14, 776 14, 241 14, 427 14,469 14,324 14, 338 14,355Industrial and financial_________________ ______________ _____ . 27,466 30,395 29,085 27, 244 25,750 23, 288 22, 311 20, 696 22, 393 23, 695 23, 513 23,699 24,122Farm mortgage________ ___________ _____ ______ ______ _______ 9,630 9,459 9, 214 8, 638 7,887 7,786 7, 640 7, 390 7,218 7,084 6,948 6,892 6, 787Urban mortgage............................- -------------- ----------------------------- 31, 618 32, 638 31,887 30,034 27,356 26, 661 25,864 25, 463 25, 447 25, 611 26,062 26,817 27,633
Average interest rates
Total gross long-term debt__......... ............ ..................................... 5.347 5.335 5.285 5.187 5.020 4. 710 4.463 4.303 4.199 4.073 3.886 3.784 3.360
Public debt_____________________________ _________ _________ _____ 4.264 4.188 4.105 3.978 3.745 3.402 3.101 3.010 2.951 2.986 2.890 2.789 2.670Federal and Federal agencies________________________ ______ _ 3.994 3.838 3.695 3.496 3.202 2.862 2.501 2.472 2.464 2. 571 2.548 2. 519 2.420
Federal_____________________________ ____ ________________ 3. 919 3.750 3. 599 3.407 3. 296 2.960 2. 554 2. 570 2. 568 2. 586 2. 598 2. 566 2. 518Federal agencies___ ____________________________________ 4.650 4. 550 4.590 4.200 2.700 2.580 2.360 2.170 2.100 2. 510 2.290 2.250 1.900
State and local governments_________________________ ________ 4.550 4. 530 4. 520 4. 550 4.520 4.480 4.380 4. 250 4.150 4.000 3. 750 3. 500 3.400Private debt— _______ ___________________________________________ 5.730 5.740 5.740 5.720 5.680 5.560 5.420 5.310 5.190 4.920 4. 700 4. 620 4.350
Railway__________ ____ ___________________________ _____ _____ 4.670 4.620 4.670 4.640 4.690 4.590 4. 600 4. 550 4.500 4.450 4. 500 4.500 4.500Public utility_______ __ _________ _______________ _________ 5.200 5.200 5.200 5.200 5.200 5.100 4.970 4. 750 4.650 4.500 4.300 4.100 4.000Industrial and financial. ___________________ ____ ___________ 5. 550 5.600 5.600 5.600 5.600 5.600 5. 550 5.420 5.280 4.800 4.400 4.100 3.900Farm mortgage... __________________________________________ 6.000 6.000 6.000 6.000 5.800 5. 500 5.100 5.100 5.000 5.000 5.000 5.000 4.940Urban mortgage_____ _________________________________________ 6.500 6.500 6.500 6.500 6.500 6.300 6.100 6.000 5.800 5.500 5.200 5.100 5.000
CO
CHAN
GIN
G
STRU
CTUR
E OF
DO
MESTIC
IND
EB
TE
DN
ESS
Digitized for FRASER http://fraser.stlouisfed.org/ Federal Reserve Bank of St. Louis

T .H . U . - 0 ™ . P .H * G ,..» U „ 8. r „ » P H ,„ . In,et„ » „ In, . res, ^
Item1929 1930 1931 1932 1933 1934 1935 1936 1937 1938 1939 1940 1941
Interest payable (millions of dollars)
Total gross long-term debt Pnhlip flpht
7,013 7,331 7,185 7,158 6,922 6,732 6,412 6,254 6,290 6,147 5,976 5,979 6,144A ti-Wliv Ut/ut_Federal and Federal agencies_______
Federal________ _Federal agencies______
State and local governmentsPrivate debt__________
Railway______Public utility_________Industrial and financial Farm mortgageUrban mortgage " "
1,478 715 628 87
763 5,535
626 752
1, 524 578
2,055
1,49367859286
8155,838
633815
1,702567
2,121
1,57771563184
8625,608
629824
1,529553
2,073
1,684 804 697 107 880
5,474 642 836
1,526 518
1,952
1,773 891 773 118 882
5,149 647 825
1,442 457
1, 778
1,915 1,072
827 245 843
4,817 633 772
1,304 428
1, 680
1,844 1,013
756 257 831
4, 568 628 734
1,238 390
1,578
1,914 1,097
866 231 817
4,340 637 676
1,122 377
1,528
1,958 1,163
943 220 795
4,332 628 685
1,182 361
1,476
1,974 1,207 1,006
201 767
4,173 622 651
1,137 354
1,409
1,9951,2591,077
182736
3,981628616
1,035347
1,355
2,019 1,323 1,141
182 696
3,960 628 645 972 347
1,368
2,281 1,608 1,447
161 673
3,863 648 574 941 335
1,365
IND
EB
TED
NE
SS IN
THE U
NITED
ST
AT
ES
Digitized for FRASER http://fraser.stlouisfed.org/ Federal Reserve Bank of St. Louis
RELATION OF INTEREST PAYABLE TO INTEREST PAID
It is to be noted that interest payable includes interest accrued but unpaid on debt contracts in default, and is, accordingly, larger in amount—particularly for some years and for certain'classes of debt— than the interest actually paid. Defaults on corporate bonds and notes aggregated 4.2 billion dollars in 1940, 200 million below the peak level for defaulted issues established in 1936, but approximately nine times higher than the defaulted issues outstanding in 1929. It is estimated that interest accrued but unpaid on these defaulted obligations amounted to 26 million dollars in 1929, 235 million in 1933, and 210 million in 1940. Though in some instances adjustments ultimately may be made without loss of interest to creditors, the adjustments so to be made are not treated as interest paid.
Thus it appears that the differential between interest payable and interest paid on corporate bonds and notes broadened rapidly to 1933, after which it narrowed only slightly because of the mounting volume of railway securities in default. The differential between interest payable and interest paid on farm-mortgage debt and urban real-estate mortgage debt owed by individual and other noncorporate borrowers was progressively narrowed, according to the principal barometers of defaults in these categories. Farm foreclosures, after rising from 20.8 per thousand farms in 1929 to 54.1 in 1933, made annual declines to less than 18 per thousand farms in 1939. Foreclosures on urban or nonfarm dwellings fell from 12 per thousand urban dwellings in 1934 to less than 5 per thousand in 1940. Total nonfarm foreclosures, after rising from 135,000 in 1929 to 250,000 in 1933, declined to 80,000 in 1940, the lowest level since 1926. Excluding foreclosures by the Home Owners’ Loan Corporation, foreclosures during the last 2 years have been around 70,000 per year.
REFINANCING AND REFUNDING ACTIVITIES, 1929-40
The marked reductions in interest rates which began in 1933 resulted in the issuance of a large volume of debtor securities carrying lower rates and issued for the purpose of refunding outstanding debt bearing higher rates. Beginning in 1933, large-scale refundings were carried out in United States Government outstandings until finally all the major issues subject to call were refunded. Existing issues refinanced at lower rates, as well as the large volume of new issues, had the effect of lowering appreciably the average rate of interest payable.
Refundings of State and local government securities, which were in very small volume until 1934, aggregated 2 billion dollars for the period 1929-40. Refundings thus accounted for only 15 percent of State and local government security flotations of 13\2 billion dollars. In local government finance, the issuance of serial obligations and of obligations with relatively near-term maturity dates reduces the need for large- scale refundings.
Corporate bond and note refundings averaged 600 million dollars annually during 1929-31, far below the average bond and note flotation of 4.3 billion for these years. Bond and note refundings shrank to an average of only a quarter of a billion dollars annually from 1932 through to 1934. Of the two principal reasons for refundings—to replace a maturing bond issue and to take advantage of lower interest
CHANGING STRUCTURE OF DOMESTIC INDEBTEDNESS 75
Digitized for FRASER http://fraser.stlouisfed.org/ Federal Reserve Bank of St. Louis

76 INDEBTEDNESS IN THE UNITED STATES
rates—the first was the more important in these years. Several issues actually were replaced by issues bearing higher interest rates. The volume of refundings mounted rapidly to 1.7 billion dollars in 1935, and in 1937 rose to a level of 3.2 billion, the highest for the period. Because of a smaller volume of business and reduced earnings, conditions were less favorable for refunding activities in 1937, and refundings fell by three-fourths to 856 million. In the 3 remaining years of the period, refundings recovered to an average of approximately1.5 billion annually.
On all corporate debt, refundings aggregated 10.5 billion dollars during 1935-40, nearly four times the refunding flotations made during 1929-34. These unusually large refundings were equal to one-fourth of the outstanding net corporate long-term debt and, excluding railway debt, were equal to more than one-third of corporate long-term outstandings. The proportion of refundings to bonded debt was even higher. Declining rates of interest provided the mainspring for these large-scale refinancing operations. Utilities led in volume with refundings totaling 6.6 billion dollars, equal to 63 percent of all corporate refundings in the 6 years from 1935 through 1940. Refunding of railway issues, on the other hand, was small when considered in relation to outstandings. Only in 1936, when refundings of railway securities reached the half-billion mark, did they attain any volume, and this volume was equal to only one-sixth of public utility refinancing in that year.
Refundings by industrial and miscellaneous corporations amounted to 2.7 billions of dollars during 1935-40. The iron and steel, copper, and coal industrial groups led with refundings of 900 million dollars, the petroleum group ranked second with 736 million, and “other industrial and manufacturing corporations” followed with refundings of 596 million.
The refunding in 1939 and 1940 of several issues which had previously been refunded during the period 1934-36 is indicative both of the improvement in the credit position of individual companies and of the decline in the cost of capital during those years.
Refinancing in the farm mortgage and urban residential mortgage fields consisted principally of shifts in the holdings of private lenders to Federal credit agencies. From 1932 through 1936, Federal land bank and Land Bank Commissioner farm-mortgage outstandings rose from 1.1 billion dollars to 2.9 billion, an increase of 161 percent. As indicated by the marked contraction in the holdings of other lenders and by the decline in total farm-mortgage debt, this increase came about through the absorption of holdings by other lenders.
In the home-mortgage field, the largest volume of refinancing occurred from 1933 to 1936 during which period the Home Owners5 Loan Corporation purchased, to the amount of nearly 3.1 billion dollars, distress mortgage loans held by other lenders. Of this amount, 2.7 billion, or just under 90 percent, went to former mortgagees in payment of indebtedness due them. Approximately 230 million, or more than 7 percent, were applied to the payment of taxes and assessments. The remainder went to reconditioning of the properties and to payment of insurance, appraisal, legal, and other costs.
All in all, two noteworthy objectives of debtors were accomplished in the extensive refunding and refinancing activities carried on during
Digitized for FRASER http://fraser.stlouisfed.org/ Federal Reserve Bank of St. Louis

CHANGING STRUCTURE OF DOMESTIC INDEBTEDNESS 77
1929-40. Many debtors, especially farm mortgage and urban residential mortgage borrowers, avoided foreclosure losses by refinancing their loans with Federal agencies, and all classes of borrowers substantially lowered their interest payments by refinancing their obligations at lower rates of interest.
Since corporate receiverships are typically of several years’ duration, and since defaulted obligations are retained in the financial reports of receivership corporations and in the debt totals until final disposition of them is made by liquidation or reorganization, sizable reductions in corporate debt from this source did not occur until some time after the decline in business had been arrested and after a reduction in most forms of debt had taken place. It should be noted that the debts of active corporations in receivership at the end of 1940 appear in both the gross and net debt totals, even though the corporations had been in receivership during a part or all of the 1929-40 period. Railway corporations alone had 3.2 billion dollars of defaulted obligations outstanding in 1940.
DEFAULTED DEBT, 1929-40
In recent years, defaulted railway obligations have accounted for nearly three-fourths of total corporate defaults. This is due not only to the large number of railways placed in receivership but also to the protracted period of receivership. At the close of 1940, only one road—a comparatively small one—had reached the final stages of reorganization. Based on debt reductions being made in this reorganization and those proposed in other reorganizations at various stages of completion, it appears that, when additional railway reorganizations become effective, material reductions will be shown in outstanding railway debt as well as in the volume of defaulted obligations. For several years interest accrued but unpaid on railway issues in default has averaged slightly more than 125 million dollars annually.BILLIONS OF DOLLARS
Figure 14.— Corporate bonds and notes in default, 1929-41.
Digitized for FRASER http://fraser.stlouisfed.org/ Federal Reserve Bank of St. Louis

During the years following 1929, many corporations owning and operating office buildings, theaters, hotels, apartments, and other urban real estate also defaulted on their debt obligations. Unlike railway defaults, however, defaults in real-estate mortgage bonds were of relatively short duration. A corporation holding urban real estate which defaulted on its debt contracts usually reorganized within 2 or 3 years after being placed in receivership. Defaults of real-estate corporations rose sharply from the low level of 60 million dollars in 1929 to just under 1 billion in 1933, then, unlike railway defaults, which continued to rise, dropped abruptly to 648 million in 1934. Further substantial declines in defaulted debt occurred in 1935 and in 1936, after which the volume of real-estate bond and note defaults leveled off near the 200-million-dollar level.
In most instances, a large reduction in outstanding bonds and notes was made in these reorganizations. A special analysis of corporations owning and operating urban realty property placed in receivership and reorganized during 1930-39 disclosed that their long-term debt of 236 million dollars at the time of receivership had been reduced to 83 million by reorganization, as reported in the first published financial statements following reorganization. This represents a decline of 65 percent, compared with a reduction of 46 percent in the long-term debts of reorganized industrial companies referred to previously. The short-term debts of the real-estate corporations declined from 83 million dollars before receivership to 14 million after reorganization.
Table 19.— Corporate Bonds and Notes in Default, by Major Groups, 1929-40
78 INDEBTEDNESS IN THE UNITED STATES
[Millions of dollars]
Year Railway
Publicutility
Industrial
Urbanreal-
estate
Total,all
classesYear Rail
wayPublicutility
Industrial
Urbanreal-
estate
Total,all
classes
1929___ 99 236 64 60 459 1935___ 2,386 673 684 572 4,3151930___ 96 285 104 137 622 1936___ 2, 710 561 706 409 4,3861931___ 260 371 345 328 1,304 1937___ 2, 774 504 552 262 4,0921932___ 411 795 658 739 2,603 1938___ 3,178 412 401 224 4, 2151933___ 1,484 906 852 995 4,237 1939___ 3, 263 426 361 205 4,2551934___ 1, 509 756 731 648 3,644 1940___ 3, 247 265 350 197 4,059
Source: Wall Street Journal,
Industrial and public utility bond defaults also reached their peak in 1933 at about 900 million dollars each. Yearly changes in defaults after 1933 were much smaller because of the greater length of the receivership period. In 1939, the defaulted obligations of public utilities were still above 400 million dollars, owing chiefly to the protracted receivership of several street-railway systems.
Digitized for FRASER http://fraser.stlouisfed.org/ Federal Reserve Bank of St. Louis

C h a p t e r V
The statistical material on indebtedness which has been presented shows in rough outline the manner in which the pattern of credit transfer has altered in the period since 1929. Perhaps the outstanding feature of this changing pattern has been the increasing importance of Government debt—a consequence of the rising tide of Government expenditure and the resultant broader use of public credit. In many fields, such as the financing of home ownership and the provision of funds for farmers, the past decade has brought a substitution of public for private credit. The degree of this substitution has varied from one type of borrowing to another and, in most cases, has followed the partial restriction of traditional private sources of funds. More recently, the wartime expansion of industrial facilities has further accelerated the substitution of public for private credit since the war industries are relying heavily on public funds to finance their growth.
CONSEQUENCES OF AN EXPANDING GOVERNMENT DEBT
The growth in volume of public borrowing during the thirties has had several general effects on the structure of private indebtedness. The relatively low yields on Government flotations, together with the employment of public credit in certain high-interest-rate areas of private finance, have tended to help reduce service charges on virtually all private indebtedness. In addition, the relatively low rates of capital expenditure by business firms during the thirties were accompanied by apparent surpluses of investible funds so that interest rates on private loans declined to exceptionally low figures. This lowering of interest rates, by enabling a larger total debt to be carried with a given income, has appreciably improved the position of many debtors and thus eased the strains which developed in credit relationships during the depression period.
The growth of public debt has also affected the duration of certain private loans by lengthening the amortization period in some cases, for example, home mortgages, while shortening the credit period in other cases, for example, consumer-installment debt. These effects stem, of course, from deliberate governmental policy rather than from the use of public credit, as such, but are related indirectly to the growth of public loans.
A third effect of the relative expansion of Government indebtedness has been to modify the investment portfolios of such financial institutions as banks and life-insurance companies. These institutions have absorbed comparatively large amounts of new public issues and thus the ownership of public debt has been concentrated to an increasing degree. In effect, then, an increasing portion of the savings of
THE SIGNIFICANCE OF A CHANGING DEBT STRUCTURE
79
Digitized for FRASER http://fraser.stlouisfed.org/ Federal Reserve Bank of St. Louis

individuals is being tapped by Government for public expenditure instead of flowing through the capital market to private business firms for capital expenditure. Despite the rapid growth of outlays for producers’ durable goods, business firms have, in recent years, shown a certain reluctance to resort to long-term borrowing as a source of funds. This preference for short-term borrowing has been noticeable throughout the past decade and is partly a matter of in- terest-rate structure. For the most part, short-term rates during the thirties were unusually far below corresponding longer-term rates mainly because of the excess of investible funds and the desire of investors to retain their assets in liquid form. During the past year, uncertainty as to the duration of the war and the character of the postwar economy has merely reinforced this preference for short-term borrowing. Furthermore, the war-stimulated industries have borrowed such funds as they have required from the capital market mainly on short term both because they consider the present boom to be temporary and because they expect to meet the costs of plant expansion largely from the proceeds of war contracts.
AREAS OF TENSION IN THE PRIVATE-DEBT STRUCTURE
Crises in private debtor-creditor relationships arise chiefly during periods of general depression when the contraction of national income and employment makes difficult the meeting of contractual service and amortization charges. In such periods, the burden of private indebtedness is apt to become intolerable, leading to moratoria and legislation calculated to relieve financial distress. At such periods, the judicious use of public credit may aid greatly in removing pressure from business firms in arrears, thus preventing wholesale liquidation with its adverse effects on economic activity. At the same time, however, certain elements in the debt structure will prove obviously to be unsound. Prevention of liquidation in these cases merely delays the readjustments essential to sound recovery. This does not imply that recovery can be hastened by permitting a general liquidation of debt. On the contrary, the implication is that policies to cope with distress indebtedness need to be selective rather than broad and designed merely to perpetuate predepression arrangements.
At the present time, no major crises in the private-debt structure appear imminent, though special problems may occur in those industries which are seriously curtailed by the war effort. The conservative policy relative to long-term borrowing practiced by business firms now expanding rapidly also suggests that the present boom may leave a less troublesome heritage of debt to be resolved during the post-war period. Nevertheless, the transition back to peacetime production, when it comes, may very possibly be attended by a crisis in debtor-creditor relations, by liquidation and reorganization with resultant changes in the ownership of wealth, and by employment of public funds to aid private debts. In brief, the prospects for maintaining a healthy debt structure depend both on the prevention of inflation during the war period and the maintenance of a high level of national income after the wTar.
I f too rapid price increases in the immediate future are permitted, many capital values, such as the market prices of farm land, housing, and certain business property, will reach a level which cannot eco
80 INDEBTEDNESS IN THE UNITED STATES
Digitized for FRASER http://fraser.stlouisfed.org/ Federal Reserve Bank of St. Louis

CHANGING DEBT STRUCTURE 8 1
nomically be supported after the war. This inflation of capital values, undoubtedly accompanied by substantial increases in the volume of debt against these properties, will seriously disturb the security of creditors holding these mortgages and other evidences of debt when war ends, thus producing a debt crisis which might have been avoided by appropriate fiscal measures. Hence, the degree of success of wartime inflationary controls will help to determine the soundness of the post-war private-debt structure.
Likewise, even though some inflation does accompany the war effort and the debt structure is somewhat swollen in consequence, the problems of adjustment will be greatly eased provided the national income can be maintained at a high level after the war has ceased. I f maintenance of the national income is accepted as a necessary post-war program and if this program is carried out by appropriate governmental action when necessary, the weaker portions of the debt structure may gradually be adjusted and strengthened without the necessity for drastic or general reorganization.
THE OUTLOOK FOR FUTURE DEBT DEVELOPMENTS
The capital market is now dominated by the demands of the Federal Treasury for the enormous volume of funds required for the war effort. Despite the prospect of very much higher rates of taxation, public debt is bound to rise to levels much above any we have yet experienced. It is both socially desirable and economically necessary that a large part of war expenditures be financed by borrowing. In real terms part of the war effort will be met by capital depletion ; yet many business firms wTill continue to accrue depreciation allowances. Furthermore, the large volume of institutionalized personal savings can best be tapped through borrowing. These funds constitute the main sources from which government may borrow without inflationary effects. The fact that priority and allocation control must necessarily restrict investment-goods output to make materials and facilities available for war production in large measure assures that such funds will not be spent privately.
Although Federal debt will rise sharply, the prospect is for a decline in the outstandings of State and local government divisions. These governments will perhaps be obliged to pay higher prices for labor and materials but will also be forced to curtail certain construction activities on account of shortages of equipment and supplies. At the same time, the increased yield of existing rates of taxation resulting from the economic expansion, plus the fact that no large new demands on the fiscal capacity of local government are in prospect, indicates an ability to repay State and local government obligations and thus to prepare for expenditures which may be required in the not too-distant future.
Corporate indebtedness in recent years has shown only a moderate expansion relative to the growth of business activity, but this moderate over-all growth has covered marked changes in composition. Railroad and public utility corporations, the chief corporate borrowers on long term, are at present expanding very much less rapidly than are manufacturing enterprises. Thus, relatively fewer longterm debt flotations, compared to new short-term borrowing and to increased sales of corporate stock, appear likely. This trend toward
Digitized for FRASER http://fraser.stlouisfed.org/ Federal Reserve Bank of St. Louis

82 INDEBTEDNESS IN THE UNITED STATES
more short-term borrowing in the private sphere—a trend which has been apparent since 1929 but which was even more prominent in 1941—undoubtedly also reflects an increased preference by investors for liquidity and some recognition of the essentially temporary character of the present expansion, as well as some preoccupation with the post-war problem of industrial transition.
In the mortgage-debt field, changes over the past decade have perhaps been more important qualitatively than quantitatively. The year-to-year changes in outstanding farm and urban mortgages are relatively small and tend to follow closely the volume of net capital formation by private enterprise in these fields. However, important changes have occurred in the terms, tenure, and sources of both home- and farm-mortgag;e credit and these developments point to a structure of mortgage indebtedness more in line with widespread but judicious use of this type of loan.
In the field of consumer credit the period since 1929 has witnessed a rapid expansion in the use of this type of loan and a trend in outstandings very closely related to the level of consumer income. The outlook for this form of credit is at present clear, all the evidence pointing toward contraction. The diminishing volume of production of new consumers’ durable goods and the prospect of even more stringent restrictions upon installment sales than those now in force indicate a sharp fall in the volume of consumer loans. As the war effort progresses, restriction of consumer borrowing will doubtless become increasingly desirable as a method of partially closing the inflationary gap which is appearing between the flow of consumer income and the volume of available consumer goods. Thus, it is conceivable that outstanding consumer credit may shrink to a negligible amount in the next few years. Already, as of 1941, a substantial restriction may be noted since outstandings did not rise at a rate commensurate with the marked upward course of consumers’ income.
THE SIGNIFICANCE OF DEBT FINANCING
Statistical evidence indicates that an increasing volume of debt is a normal accompaniment to expanding economic activity, while debt in total can decrease only as a result of general economic contraction. During the decade of the twenties, economic expansion was financed in part by the growth in debt of business enterprises both on short term and long term. Some savings of individuals were transferred directly to businesses by purchases of stock but the remainder of these savings was placed primarily with financial institutions. These agencies, in turn, invested chiefly in bonds, notes, and mortgages of business enterprises, thus transferring indirectly the savings of individuals to business enterprises undertaking capital formation. During this period, with private indebtedness increasing, public debt could be reduced without repercussions other than possibly a shortage of Government securities for those institutions which were accustomed to this sort of portfolio.
With the advent of the depression at the end of the decade, private capital formation declined drastically in volume, and business indebtedness ceased rising. As the depression deepened, the ability of debtors to meet service and amortization charges on their out
Digitized for FRASER http://fraser.stlouisfed.org/ Federal Reserve Bank of St. Louis

standing obligations became impaired. In this debt crisis the policy was adopted of using the public credit to promote economy recovery and to ease the burden on distressed debtors. Thus, public debt came to play the same role in financing capital formation that private business debt had played previously.
As the economy emerged from depression, public expenditure continued to account for a large portion of new capital formation and the public debt continued to grow. Indeed, in 1937-38, when public expenditure was reduced, business suffered a sharp decline owing partly to this curtailment of expenditure and partly to excessive inventory accumulation. In general, savings were not flowing to industry as freely as they had during the twenties and some use of Government fiscal powers seemed required to facilitate this process.
Since the middle of 1940, rearmament and war expenditures have been added to the already high level of Government disbursements, thus making necessary an even more rapid expansion of public debt. Wartime demands for military equipment have promoted a rapid expansion of industrial plant, chiefly in the durable-goods manufacturing industries. To finance this spurt in capital expenditure both public and private funds have been tapped. Public credit, however, has provided the bulk of the funds for capital outlay in the strictly armament industries. Those industries the expansion of which has been derived indirectly from the war boom have naturally relied on credit from private sources.
CHANGING DEBT STRUCTURE 83
Digitized for FRASER http://fraser.stlouisfed.org/ Federal Reserve Bank of St. Louis

Digitized for FRASER http://fraser.stlouisfed.org/ Federal Reserve Bank of St. Louis

APPENDIX
GENERAL
Since the statistics of indebtedness embraced in this study cover virtually every field in which debts originate, it was necessary to resort to a wide variety of source materials and to employ various methods in developing the information. In quality, the primary statistics range from figures taken from accounting records of all the debt-creating units within specific areas of the economy to estimates made from incomplete and fragmentary debt information. In several instances, the data are far more complete for the later years of the decade than for the earlier years.
In some classifications, the figures for gross debt are complete except for minor deficiencies, while the figures for duplicating debt are based on somewhat less complete data. Consequently, in these classifications the net debt estimates are subject to wider margins of error than are the gross debt figures. In still other instances, the debt statistics consist of a composition of gross and net debt which required adjustment before the figures conformed to either the gross or the net debt concept. No estimates are attempted for debts between unincorporated nonfinaneial business firms or for informal, short-term debts between individuals, since the information in these areas is virtually nonexistent. Such omissions probably result in a slight understatement of the total volume of outstanding debt.
DEBTS OF THE UNITED STATES GOVERNMENT AND FEDERAL CORPORATIONSAND AGENCIES
Except for the years 1940 and 1941, the figures on the gross debt of the United States Government have been taken from the annual reports of the Secretary of the Treasury. Data for 1940 and 1941 are from the Monthly Statements of the Public Debt of the United States and the Daily Treasury Statements. The gross debt totals include interest-bearing debt— bonds, notes, bills, and special issues; matured debt on which interest has ceased, payable upon presentation ; and debt bearing no interest, also payable upon presentation. The latter item consists of old demand notes, national bank notes, and Federal Reserve bank notes assumed by the United States Government, fractional currency, thrift stamps, Treasury savings stamps, and so on. Figures giving gross debt totals of Federal corporations and agencies were taken from the financial statements of those corporations and agencies and from the Daily Treasury Statements for January 15 and January 30.
Duplicating debt of the United States Government and Federal corporations and agencies consists of two classes. One class includes the issued obligations of the United States Government and Federal corporations and agencies held by those units in their sinking, trust, and investment funds. Duplicating Federal debt does not include United States Government and Federal corporation and agency securities held by Federal Reserve banks. The other class of duplicating debt is composed of debt obligations receivable by Federal corporations and agencies.
Figures on net debt were obtained by subtracting duplicating debt, based on Daily Treasury Statements, from gross debt, the United States Government and Federal corporations and agencies being treated as a unit in making the computations.
For all years covered in this study, the gross, duplicating, and net debt totals of the United States Government and Federal corporations and agencies show the indebtedness outstanding as of the end of the calendar year. Special studies were made to place on a calendar-year basis the indebtedness outstanding and
SOURCES AND METHODS OF ESTIMATION
85
Digitized for FRASER http://fraser.stlouisfed.org/ Federal Reserve Bank of St. Louis

86 INDEBTEDNESS IN THE UNITED STATES
loans receivable of Federal corporations and agencies. A similar analysis was made of United States Government and Federal corporation and agency securities held in the sinking, trust, and investment funds of the United States Government and Federal corporations and agencies.
DEBTS OF STATE AND LOCAL GOVERNMENTS
Data on the gross debts of States for the census years of 1929-32, 1937, and 1938 were taken from the annual reports of the Bureau of the Census on the financial statistics of State governments. For 1940 and 1941 the data were taken from a joint questionnaire survey of the Bureau of the Census and the Treasury Department. Figures on the gross debts of local governmental units— counties, municipalities (including townships), school districts, and special districts— were taken from the decennial report of the Bureau of the Census for 1932 and from the joint questionnaire surveys of the Bureau of the Census and the Treasury Department for 1937, 1940, and 1941.
For intercensal years and for years not covered by the questionnaire surveys, data on the gross indebtedness of State governments were compiled from the financial reports of each of the 48 States reporting outstanding indebtedness, while the gross debts of local divisions were determined by straight-line interpolation of the Census figures.
Duplicating debt of State and local governments, consisting of securities of those units held in their sinking, trust, and investment funds, was likewise determined from Census reports and from the questionnaire surveys for the years covered by those publications, and by interpolation for the remaining years. In interpolating, it was assumed that the trend of such fund holdings for local divisions is similar to that shown for the larger cities as published in the annual reports of the Bureau of the Census entitled, “Financial Statistics of Cities.”
Net indebtedness of State and local governments was determined by deducting duplicating debt, as herein defined, from gross State and local government debt.
DEBTS OF PRIVATE CORPORATIONS
Two major sources of data are used in estimating the debts of private corporations. Estimates of the gross debt of steam railways are based on compilations made by the Interstate Commerce Commission, while figures on the net debt of steam railways and on the gross and net debts of nonrailway corporations are based on compilations of the Bureau of Internal Revenue. Substantial adjustments are required before these data can be used to depict either the amounts or the trend of corporate debt. The unadjusted figures of the Bureau of Internal Revenue present the sum of the debt obligations of all nonrailway corporations submitting balance sheets along with their Federal income tax returns. Estimates covering years for which the Bureau of Internal Revenue or the Interstate Commerce Commission tabulations are not yet available were projected from a corporate sample and from current information covering security issues and retirements. These figures for 1940 and 1941 are thus subject to a larger margin of error than are the data for earlier years.
Though during the period under review only about 87 percent of the active corporations filing returns submitted balance sheets, the unadjusted figures understate the indebtedness of nonrailway corporations only slightly, probably by not more than 1 or 2 percent, since the corporations not submitting balance sheets generally are small and often are units of corporate systems with few, if any, outstanding liabilities.
The principal defect in the unadjusted debt compilations of nonrailway corporations is that these compilations consist of a changing mixture of net debt compiled from consolidated financial statements of corporate systems and gross debt compiled from unconsolidated financial statements of individual corporations. As a result, the debt totals are subject to substantial changes resulting from shifts between consolidated and unconsolidated returns. For the most part, such shifts take place because of corporation tax provisions in the several revenue acts in effect during the period.
Under the Revenue Acts of 1932 and 1934, consolidated returns were taxed at higher rates than were unconsolidated returns. This caused many corporations to shift from consolidated to unconsolidated returns. The result was that the volume of corporate debt shown was materially increased since intercorporate
Digitized for FRASER http://fraser.stlouisfed.org/ Federal Reserve Bank of St. Louis

APPENDIX 87debt, not appearing in the consolidated statements, showed up in the unconsolidated balance sheets.
Section 1 of the Revenue Act of 1934 restricted the use of consolidated returns by prohibiting all corporations except “common carriers by railroad” from filing this type of return. In the Revenue Act of 1936, the privilege of filing consolidated returns was broadened slightly to include street, suburban, and interurban electric railways.
As shown in the tabulation below, nonrailway corporations, prior to the discontinuance of the consolidated returns in 1934, filed 8,861 of these returns in 1930, 7,013 in 1933, and 369 in 1934. This decline in the use of consolidated returns caused a substantial part of the pronounced rise in the volume of nonrailway corporate debt as shown in the Bureau of Internal Revenue data. Unadjusted nonrailway debt compilations showed an increase of approximately 10 billion dollars— from 52 billion in 1934 to 62 billion in 1935— whereas, in fact, a small decline in debts outstanding occurred since, in 1934, total retirements slightly exceed the volume of new borrowing. For the years from 1930 through 1933, shifts from consolidated to unconsolidated returns were much smaller but still took place in sufficient number to make the unadjusted totals virtually valueless as a measure of actual changes in nonrailway outstanding debt.
Table I.— Number of Consolidated and Unconsolidated Returns Filed by ActiveCorporations, 1929-38
Year
Consolidatedreturns Uncon
solidatedreturns
Totalreturns
Steamrailway
Nonrailway
1929 _ ____ 8,664 447,267 455, 9311930.................. i 90 8,861 454 085 463,0361931 ________ 8, 405 451, 209 459, 6141932.............. . 90 7, 336 444,458 451, 8841933.................. 88 7,013 439,741 446, 842
Year
Consolidatedreturns Uncon
solidatedreturns
Total
Steamrailway
Nonrailway
returns
1934............ 76 369 469,359 477,050 478, 759
469,804 477,113 478, 857 477, 838 471,032
1935 ................. 631936............ 2 981937...... ............ 2 93 477, 745
470, 9301938.................. 102
1 Estimated.2 Includes consolidated returns of street, suburban, and interurban electric railways.
Adjustments to exclude the effect of these shifts were necessary in order that the yearly totals would reflect only the debt changes arising from issuance of new debt and retirement or cancellation of existing debt. To show trends in the volume of intercorporate debt, the unadjusted figures required correction so as to represent both the net and gross debt series. No entirely satisfactory basis of adjustment covering all the years could be developed since adequate data whereby intercorporate debt can be measured are available only for 1933 and 1934.
The net indebtedness shown by 7,013 nonrailway corporations filing consolidated returns for 1933 was less by 11.5 billion dollars— equal to $1,640,300 per consolidated return— than that shown on an unconsolidated basis for 1934 by the 27,021 corporations which comprised those 7,013 corporate systems reporting for 1933. Although a year had elapsed between the time consolidated and unconsolidated returns were filed, $1,640,300 appears to fairly well represent the intercorporate debt per consolidated return, since 1934 was a year without major changes in corporate organization and since changes in volume of outstanding debt arising from debt issuance and retirement amounted to less than 1 percent in that year.
The nonrailway intercorporate debt for 1930, the year in which the largest number of consolidated returns were filed, was then arrived at by multiplying the number of consolidated returns for 1930 by the figure for average intercorporate debt per consolidated return determined as indicated above for 1933-34. This intercorporate debt was placed at 14,535 million dollars for 1930. The unadjusted total, as compiled by the Bureau of Internal Revenue, may be taken as representing the nonrailway net debt for 1930. Nonrailway gross debt was computed by adding to net debt the intercorporate debt of 14,535 million dollars.
During the entire 1930-34 period there were almost no major changes in nonrailway corporate organization. Few subsidiaries were created or dissolved. The
Digitized for FRASER http://fraser.stlouisfed.org/ Federal Reserve Bank of St. Louis

88 INDEBTEDNESS ITST TH E UNITED STATES
indebtedness of some existing units owed to other units within given corporate systems may have changed, however. Gross debt for each of the years from 1931 through 1935 was computed by adding the intercorporate debt, as determined for each year by the method used for 1930, to the Bureau of Internal Revenue totals for that year. For 1935 and subsequent years, the unadjusted figures of the Bureau of Internal Revenue have been used to represent nonrailway gross debt.
For 1930, intercorporate and net corporate nonrailway debt comprised 18.94 percent and 81.06 percent, respectively, of gross nonrailway corporate debt. These percentages were then applied to the nonrailway gross debt in computing intercorporate and net debt for each of the other years from 1929 through 1935.
A study of all published consolidated statements obtainable revealed that, starting around 1935, intercorporate debt began either to experience a slightly greater proportionate decline or, in the years increases in outstanding debt occurred, to show a slightly smaller proportionate increase than did net corporate debt. This shrinkage in intercorporate debt wras the result of a reduction in the number of subsidiaries of various corporate systems in these years. To take account of this trend the percentage relationship of intercorporate debt to gross debt was reduced arbitrarily by from y2 to 1 percent yearly beginning in 1935. The preliminary estimates of intercorporate debt for the years 1940 and 1941 were placed at 16.4 percent and 15.5 percent, respectively, of gross debt. These preliminary percentages may need revision when more reports for these years become available.
Both gross and net nonrailway debt were broken down into short-term and long-term classifications in accordance with the percentage of long-term and short-term debt shown in the Bureau of Internal Revenue compilations. Before .such apportionment was made for 1934, however, the short-term debts shown in the Bureau of Internal Revenue compilations were reduced by 2,065 million dollars and the long-term debts increased by a like amount. This adjustment was made to allow for the fact that debts of this amount maturing in more than 1 year were classed as short-term debts in the Bureau of Internal Revenue figures. For 1938-40, classification of notes payable into (1) those with maturity dates of less than 1 year from date of issue and (2) those with maturity dates of more than 1 year from date of issue resulted in the reclassification as longterm of a considerable amount of debt which previously had been listed as short-term. No adjustment has been made to take into account the shift caused by this change in the method of reporting notes payable.
Figures on the gross debt of steam railways were taken from the general balance-sheet statements of railroads, prepared by the Interstate Commerce Commission and published in Statistics of Railways. The debt totals represent all the debt obligations of Class I steam railways, lessor companies, and switching and terminal companies. Funded debt matured but unpaid, classified by the Interstate Commerce Commission as a short-term obligation, is treated in this study as a long-term obligation. All interest in arrears and unpaid is treated as a short-term obligation.
Since steam railways were permitted to file tax returns on a consolidated basis during the period 1929-41, consolidated balance-sheet statements generally were submitted by railways in connection with the tax returns filed by them. Wide year-to-year fluctuations in these net debt totals in the early years of the period, a time when the gross debt totals and all other supporting evidence indicated stability, make the figures for the early years unsuited as a measure of net railway debt.
The Bureau of Internal Revenue compilations appear to best reflect the net debt of railways for 1935-37. An average of both the net debt and the gross debt was taken for these years, the difference representing intercorporate or duplicating debt. For the three years, 1935, 1936, and 1937, intercorporate railway debt averaged 13.97 percent of gross railway debt. This percentage was accordingly applied to each of the years during the 1929-41 period for the purpose of arriving at intercorporate and net debt.
FARM-MORTGAGE AND OTHER FARM DEBT
The farm-mortgage debt totals and figures on the debts of farmers’ cooperative associations and the short-term debts of farmers are taken from reports of the Bureau of Agricultural Economics. A statement of the sources used and methods employed in estimating farm-mortgage debt is presented in an article by Donald C. Hortoii entitled, “Fluctuations in Outstanding Farm Mortgage Debt, 1910-39,”
Digitized for FRASER http://fraser.stlouisfed.org/ Federal Reserve Bank of St. Louis

APPENDIX 89
published in the November 1939 issue of the Agricultural Finance Review. In this article the sources and methods used are described, in part, as follows:
“For the Census years 1930 and 1935 data are available for full-owner operators who reported to the Bureau of the Census the amount of their outstanding mortgage debt. To these figures have been added an estimated amount of mortgage debt to account for the remaining mortgaged full-owner operators who did not report their mortgage obligations. On the basis of sample data collected by the Department of Agriculture for Census years, estimates have been prepared showing the mortgage debt on farms operated by part owners, tenants, and hired managers. For the intercensal years the estimates are based on data showing the mortgages held by certain lender groups for which fairly complete annual data are available, and on data for mortgages filed and released each year in selected counties compiled in a nation-wide W. P. A. project. Since 1935, the annual estimates are based on the known mortgage holdings of the leading lending agencies and estimates of mortgages filed and released prepared by the Farm Credit Administration.”
URBAN REAL-ESTATE MORTGAGE DEBT
Estimates of mortgage indebtedness outstanding on 1- to 4-family urban residential property are taken from reports prepared by the Federal Home Loan Bank Board. The following description of the sources and methods used appeared in the September 1940 issue of the Federal Home Loan Bank Review:
“The estimates of outstanding mortgage loans on nonfarm 1-4 family homes have been developed from comprehensive analyses of recent surveys of mortgages recorded throughout the country by type of mortgagee, used in conjunction with reported statistics and special studies. Chief sources of basic information are summarized below:
“Savings an$ loan associations: figures based on a compilation of the annual reports of Feueral savings and loan associations to the Federal Home Loan Bank Board, and of the annual reports of state-chartered savings and loan associations to their supervisors and to the Federal Home Loan Bank Board.
“Insurance companies: estimates developed from study and summary of detailed reports received from a sample group of insurance companies holding more than 85 percent of life insurance company assets. These schedules provide a detailed breakdown of their mortgage loan portfolios.
“Mutual savings banks: basic figures are their total mortgage holdings reported by the Comptroller of the Currency. A special investigation by the Division of Research and Statistics made it possible to segregate these mortgage holdings into the farm and nonfarm elements and further to separate the nonfarm element into mortgages on homes and other-than-home property. This project covered mutual savings banks in the States of New York and Massachusetts, and involved institutions containing more than 50 percent of all mutual savings bank assets.
“Commercial banks: a study conducted at the end of 1934 by the Federal Housing Administration in conjunction with the Comptroller of the Currency, Federal Reserve Board, and Federal Deposit Insurance Corporation segregated mortgages on homes from other nonfarm real estate holdings of the reporting commercial banks. The relationships shown then have been applied to total mortgage holdings of the banks for earlier years. In recent reports the Comptroller of the Currency has provided a segregation of mortgage holdings by national banks. Adjustments have been made in the estmated data on the basis of the Comptroller’s reports as well as the Federal Housing Administration reports indicating increased mortgage lending by commercial banks.
“Home Owners’ Loan Corporation: figures reflect the actual balance of mortgage loans held and advances outstanding.
“Individuals and others: estimates for recent years developed on the basis of studies of mortgage recordings by types of mortgagee conducted by the Division of Research and Statistics. For earlier years the estimates have been prepared after reviewing many studies, bulletins, and researches of various Government and private agencies. Included in these sources are the Financial Survey of Urban Housing, the refinancing operations of the Home Owners’ Loan Corporation by type of mortgagee, local surveys conducted by the National Association of Real Estate Boards, special surveys of the Federal Home Loan Banks, figures supplied by the New York State Mortgage Commission, sundry reports of the Mortgage Bankers’ Association, and hearings of the Sabath Committee investigating real-estate bond holdings committees.”
Digitized for FRASER http://fraser.stlouisfed.org/ Federal Reserve Bank of St. Louis

90 INDEBTEDNESS IN THE UNITED STATES
For the more recent years, comparatively complete statistics of certain types of outstanding loans by the principal lenders also have become available. These newly available figures cover the volume of loans secured by multifamily (five or more families) residential property and commercial real estate. For 1939 and 1940, figures compiled by the Comptroller of the Currency and by other regulatory agencies from statements of condition made by trust companies and commercial, mutual savings, and other banks break down nonfarm real-estate mortgage debts into those secured by 1- to 4-family residential property, multifamily residential property, and other nonfarm real estate. The term “other nonfarm real estate” has been defined in this study to consist essentially of commercial property.
Studies made of the annual reports of savings and loan associations and questionnaire surveys made of the nonfarm real-estate mortgage loans of life- insurance companies also have- produced greatly improved estimates, especially for the more recent years, of mortgages outstanding on multifamily residential property and on commercial property.
Classification of mortgage indebtedness on multifamily residential property and on commercial property into that owed by corporations and that owed by individuals and unincorporated businesses was made on the basis of a study of some 9,000 balance sheets, submitted by corporations owning and operating either apartment houses or commercial real estate at the time of filing tax returns for 1937. Though this information falls far short of that necessary to make highly accurate apportionments for all years, it marks a beginning of useful primary data in this area. Less accurate methods were resorted to in making the apportionment for the other years covered. Indebtedness of corporations owning 1- to 4-family residential property was somewhat arbitrarily placed at 5 percent of the total of such debt outstanding.
BUSINESS AND COMMERCIAL DEBTS OF INDIVIDUALS
The short-term debts of individuals and noncorporate firms and associations are compiled from several primary sources. These estimates vary in quality depending upon the class of debt and the years covered. Estimates of debts owed by customers to security brokers for the years 1931-39 were taken from reports made by brokers to the Federal Reserve Board. They represent substantially complete figures taken from accounting records. In carrying this series back to include 1930 and 1929, brokers’ loans for these years as reported by the Federal Reserve Board and by the New York Stock Exchange were of assistance. It is assumed that all loans by brokers to customers are made to individuals and other noncorporate borrowers.
Estimates of the volume of loans made by banks to individuals and to noncorporate firms and associations are difficult to make since banks do not report loans made to corporations and to noncorporate borrowers separately. The change, effected in 1938 in classification of bank loans as reported to the Comptroller of the Currency, the Federal Reserve Board, and the Federal Deposit Insurance Corporation increased the difficulty of classifying, on a comparable basis for all years, debts owed by individuals to banks. Prior to 1938, bank loans were grouped mainly according to the type of security pledged, while since 1938 they have been classified more nearly according to the purpose of the loan. However, it was possible, with little or no error, to allocate several types of loans either to the corporate or to the noncorporate group. Thus, short-term agricultural loans were classified as noncorporate since, with few exceptions, they are made to noncorporate borrowers. Loans to brokers and dealers in securities also were classified as noncorporate since businesses of such individuals generally are not incorporated. The fact that a few of the security dealers are incorporated and that there has been some slight tendency toward incorporation indicates some error in the allocation made but it is known to be small. Special studies of so-called “personal loans” by banks— a type of loan which has grown rapidly in popularity during the last years of the decade— permit a further quite accurate allocation to the. noncorporate group. “Open-market paper bank loans” are treated as made exclusively to corporations.
Somewhat arbitrary methods were employed in apportioning “commercial and industrial” loans to corporate and to noncorporate borrowers. This class of loans was first broken down by Federal Reserve districts and then further divided into loans by banks located in central Reserve cities, Reserve cities, and country towns. Bankers, bank examiners, and officials of regulatory bodies were then asked to give judgments, based on their experience and observation, as to what proportion of the outstanding commercial and industrial loans was owed by
Digitized for FRASER http://fraser.stlouisfed.org/ Federal Reserve Bank of St. Louis

APPENDIX 91individuals. As long as statements of condition called for by bank regulatory bodies do not show corporate and noncorporate loans separately, estimations of these categories will have to be made by indirect methods.
Data on short-term debts owed by farmers to lending units of the Farm Credit Administration were taken from reports issued by the Farm Credit Administration and the Bureau of Agricultural Economics. Short-term debts originated by purchases of goods and services on the installment plan are based on the Retail Credit Survey and other surveys of the Department of Commerce and on a study by Rolf Nugent, Russell Sage Foundation, entitled, “Consumer Credit and Economic Stability.”
INTEREST PAYABLE
Interest payable, which is not to be confused with interest paid, is confined in this study to long-term and short-term public debt and to long-term private debt. For all debts of the United States Government the computed rate published by the Treasury Department as of the end of the calendar year is used in determining the amount of interest payable. This computed rate of interest and the amount of interest payable may differ from the average rate and the amount actually paid during the year since the outstandings at the end of the year may differ in amount and rate of interest from the average for the year. For present purposes, the computed rate and amount of interest payable appear to be the best measure of interest charges because they more nearly state the extent of interest obligations on amounts outstanding at the end of the year. A special study made by the Treasury Department for the Department of Commerce likewise places the interest payable by Federal corporations and agencies on a computed interest payable basis at the end of the calendar year.
The findings of an extensive study of the contract interest rates on State and local government securities outstanding in 1929 and 1930 provided the basis for estimating the rates of interest payable for these years and for computing the rates payable in subsequent years. For these later years, the rate payable is determined by adjusting the rate of the preceding year to allow for changes in the contract rates caused by the funding and retirement of issues and by the issuance of new securities with rates differing from those previously outstanding.
To determine the rate and amount of interest payable on gross private longterm debt, corporate long-term debt was divided into three classes— industrial, public utility, and railway— and noncorporate real-estate mortgage debt was divided into two classes— urban and farm.
In the former case, several thousand corporate issues were examined to arrive at an average weighted contract rate of interest payable for 1929. In fixing rates for succeeding years, the rate payable on outstandings for each year was adjusted to take into account the contract rate on retirements, refundings, and new issues made during such year.
It should be noted that here as elsewhere these calculations of the rate and amount of interest payable are made without reference to the solvency of the borrowers concerned, the contract rate on debts in default being included with that of the solvent outstandings. The growing practice of corporations in borrowing from banks on serial notes up to 10 years has made the task of determining the contract rate of interest payable more difficult because a description of the issues, together with the serial rates, is not always available.
Rates of interest payable on urban real-estate mortgages are based on sample studies of contracts held by principal lenders. Those payable on farm mortgages are based on studies made by the Bureau of Agricultural Economics.
o
Digitized for FRASER http://fraser.stlouisfed.org/ Federal Reserve Bank of St. Louis