Embed Size (px)
Citation preview

Indecon Impact Assessment of the Help to Buy Tax Incentive
Submitted to
Department of Finance
Prepared by
Indecon International Research Economists
www.indecon.ie
15 September 2017

Disclaimer: This report is provided solely in connection with the consultancy project for the Department of Finance concerning an Impact Assessment of the Help to Buy Incentives. Any liability Indecon will assume to the Department will be governed by specific liabilities, if any, as specified in a contract to be agreed between us. This report is provided on the basis that Indecon accepts no liability whether in contract tort (including negligence) or otherwise to the Department or to any other person in respect of this.

Tables and Figures Page
Executive Summary i
1 Introduction and Background 1
Background and Policy Context 1 Methodological Approach 3 Structure of the Report 3 Acknowledgements 3
2 Analysis of HTB Incentive Take-Up 5
Introduction 5 Level of Interest in Scheme 5 Number of Claims for Assistance 8 Mortgage Approvals Versus Drawdowns 11 Summary of Findings 13
3 Impact on Property Prices 14
Introduction 14 Econometric Modelling of the Determinants of Property Prices 14 Development in Irish Residential Property Prices 28 Case Study Evidence from 12 New Housing Developments 35 Views of HTB Contractors 41 Changes in Other Policies Potentially Impacting on Demand and Prices 45 Correlation between HTB and Prices at County Level 50 Price Data on HTB Transactions 51 Summary of Findings 53
4 Impact on New Build Residential Supply 55
Introduction 55 House Completions and Registrations 56 Planning Permissions 63 Housing Supply in Dublin 64 Econometric Modelling of the Impact on Supply 68 Recent and Expected New Supply 69 Summary of Findings 76
5 Impact of Affordability 77
Introduction 77 FTB Mortgage Affordability 78 Financing of Deposits 82 Summary of Findings 85
6 Design of the Incentive 87
Introduction 87 Structure of the Help to Buy Incentive 87 Criteria in Evaluation Tax Expenditure 89 Principles Relevant to Evaluation of Design of the Incentive 93 Summary of Findings 96
7 Conclusions 97
Annex 1 Bibliography 98

Tables and Figures Page Table 2.1: Trend in Help to Buy Applicants 5
Table 2.2: Applications by First-Time Buyers by Type of Application 6
Table 2.3: Applications by First-Time Buyers by Grouping 6
Table 2.4: First-Time Buyer Applicants Location by County 7
Table 2.5: Claims by First-Time Buyers 7
Table 2.6: Property Values of HTB Claims 9
Table 2.7: HTB Claims 9
Table 2.8: Geographical Breakdown of HTB Claims 10
Table 2.9: Completed Transactions by Type and County 11
Table 3.1: Indicators for Housing Market Conditions and Trends 14
Table 3.2: Number of Houses by Unit Type as a Share of All New BER-Rated Units, 2010-2017 17
Table 3.3: Average Floor Area M2 17
Table 3.4: BER Rating kWh/Yr/M2 18
Table 3.5: Changes in Type of Primary Space Heating Fuel 18
Table 3.6: Dwelling Price Index by Region 29
Table 3.7: Average New Dwelling Sale Prices 30
Table 3.8: % Change in Average Dwelling Prices in Ireland from Previous Quarter 31
Table 3.9: % Change in Average Price from Previous Quarter in Dublin and the Rest of Ireland, based on CSO Data 31
Table 3.10: Average New Dwelling Sale Prices – First-time buyers 32
Table 3.11: Median New Dwelling Sale Prices – First-time buyers 33
Table 3.12: Median Asking Prices for 2 Bedroom Apartments – MyHome.ie Data 35
Table 3.13: Annual Sales by Price Category (€'000), 2016-2017 36
Table 3.14: No. of Sales Agreed as a Share ot Total Annual Sales, by House Type, 2016-2017 37
Table 3.15: Indicative Prices for New 3-Bed Semi-Detached Houses 37
Table 3.16: Average of Site-Level Growth Rates of New 3-Bed Semi-Detached Houses 37
Table 3.17: Average of Site-Level Growth Rates of Prices for New 3-Bed Terrace Houses 38
Table 3.18: Average of Site-Level Growth Rates of Price for New 3-Bed Terrace Houses 38
Table 3.19: Indicative Prices for New 3-Bed End Terrace Houses 38
Table 3.20: Average of Site-Level Growth Rates of Price for New 3-Bed End Terrace Houses 39
Table 3.21: Indicative Prices for New 3-Bed Mid-Terrace Houses 39
Table 3.22: Average of Site-Level Growth Rates of Price for New 3-Bed Mid-Terrace Houses 39
Table 3.23: Unweighted Average of Site-Level Growth Rates of Price for All 3-Bed New Houses 40
Table 3.24: Unweighted Average of Site-Level Growth Rates of Price for All New Houses 40
Table 3.25: Weighted Average of Site-Level Growth Rates of Price of All House Types 41
Table 3.26: Weighted Average of % Change in Price per Square Foot 41
Table 3.27: Price Changes Since 1 January 2017 42
Table 3.28: Price Changes Since 1 January 2017, by Firm Size 42
Table 3.29: Significant Factors Driving Prices Increases 43
Table 3.30: Impact of Help to Buy on Overall Demand 43
Table 3.31: Impact of Help to Buy on the Prices of New and Second Hand Homes 44
Table 3.32: Changes in Mortgage Measures from January 2017 47

Tables and Figures Page Table 3.33: Impact of New Mortgage Lending Rules on Overall Demand 47
Table 3.34: Impact of New Mortgage Lending Rules on Overall Demand, by Firm Size 48
Table 3.35: Completed Transactions by Average Loan-to-Value and County (€) 48
Table 3.36: Breakdown of Loan-to-Value Ratio for HTB-claimed Properties 49
Table 3.37: Completed Transactions by Average Loan-to-Value and County 49
Table 3.38: Analysis of Impact of Changes in Mortgage Lending Rules 50
Table 3.39: Completed Transactions by Average Price and County (€) 52
Table 3.40: Completed Transactions by Average, Highest and Lowest Price and County (€) 52
Table 4.1: Housing Stock and Population Growth 55
Table 4.2: Annual Dwelling Completions 56
Table 4.3: Annual Dwelling Completions by Type 57
Table 4.4: Residential Commencements by Local Authority 59
Table 4.5: Annual New House Registrations 60
Table 4.6: Recent New House Registrations by Month (Jan 2017 - May 2017) 60
Table 4.7: Number of Planning Permission Applications Granted for Dwellings 63
Table 4.8: Number of Dwelling Units for Which Planning Permission Granted 65
Table 4.9: Construction Activity in Active Sites in Dublin Area Local Authorities, Q1 2017 66
Table 4.10: Number of Dwelling Units in Various Stages of Development within the Dublin City Council Local Authority Area, Q1 2016 – Q1 2017 66
Table 4.11: Number of Dwelling Units in Various Stages of Development within the Dún Laoghaire-Rathdown Local Authority Area, Q1 2016 – Q1 2017 67
Table 4.12: Number of Dwelling Units in Various Stages of Development within the Fingal County Council Local Authority Area, Q1 2016 – Q1 2017 67
Table 4.13: Number of Dwelling Units in Various Stages of Development within the South Dublin City Council Local Authority Area, Q1 2016 – Q1 2017 67
Table 4.14: No. of New Builds since January 2017 69
Table 4.15: No. of New Builds since Jan 2017 that Qualify for Help to Buy 69
Table 4.16: Expected No. of New Houses to be Built Over Next 3 Years 70
Table 4.17: Impact of Help to Buy on Decision to Commence Building New Units 70
Table 4.18: Impact of Help to Buy on Decision to Commence Building New Units by Firm Size 70
Table 4.19: Impact of Help to Buy on Decision to Build Over Next 3 Years 71
Table 4.20: Impact of Help to Buy on Decision to Build Over Next 3 Years by Firm Size 71
Table 4.21: Impact on Limited Supply of New Houses 71
Table 4.22: Impact on Limited Supply of New Houses (Small Developers) 72
Table 4.23: Impact on Limited Supply of New Houses (Medium Size Developers) 73
Table 4.24: Impact on Limited Supply of New Houses (Large Developers) 74
Table 4.25: Approved Developers by Size of Developments 75
Table 4.26: Indicative Estimates of Approved Developers by Expected Completion Dates 75
Table 5.1: Home Ownership Rates of Households Aged 25-34 77
Table 5.2: Time Required for First Time Buyer to Save a Deposit under New LTV Rules 83
Table 5.3: Time Required for First Time Buyer to Save a Deposit under Previous LTV Rules 84
Table 5.4: Number of Years Required to Save for Deposit for a Notional Couple on 200% of Average Income 85
Tables and Figures Page Table 6.1: Exchequer Cost of Measure – Scenario Based on Low-Deadweight 92
Table 6.2: Exchequer Cost of Measure – Scenario Based on High-Deadweight 92
Table 6.3: Principles Relevant to Design of Tax Incentives 93
Figure 2.1: Value of Help to Buy Applications (Jan-Aug 2017) 6
Figure 2.2: Number of Help to Buy Claims (Jan-Aug 2017) 8
Figure 2.3: Value of Help to Buy Claims (Jan-Aug 2017) 8
Figure 2.4: Mortgage Approvals and Drawdowns forFirst-time buyers, 2014 Q3 – 2017 Q2 12
Figure 2.5: Ratio of Mortgage Approvals to Drawdowns, 2014 Q3 – 2017 Q2 12
Figure 3.1: CSO Average Price and RPPI Data 16
Figure 3.2: Trend in Prices of House in HTB Price Categories Compared to General Property prices 19
Figure 3.3: Regression Output – ARIMA Model of Property Price Index 20
Figure 3.4: Forecast of Property Price Index (2014-2017) 21
Figure 3.5: Forecast of Property Price Index (July 2016-June 2017) 21
Figure 3.6: Regression Output – ARIMA model of Property Price Index with 2017 Dummy 22
Figure 3.7: Regression Output – Multivariate Model of House Price Index 23
Figure 3.8: Regression Output – Multivariate Model of Average Price of New Dwellings (First-Time Buyer) 25
Figure 3.9: Regression Output – Multivariate Model of Property Prices from Property Price Register, <€250,000 26
Figure 3.10: Regression Output – Multivariate Model of Property Prices from Property Price Register, €250,000-€500,000 27
Figure 3.11: Regression Output – Multivariate Model of Property Prices from Property Price Register, >€500,000 28
Figure 3.12: Monthly Property Price Index Since 2016 29
Figure 3.13: Average Asking Prices 34
Figure 3.14: Regression Coefficient for New Residential Developments by Region 34
Figure 3.15: Regression Output – Percentage Change in Prices and Applications by County 51
Figure 4.1: Housing Commencements 57
Figure 4.2: Housing Commencements – Change from Same Month in Preceding Year 58
Figure 4.3: Residential Construction Commencements 58
Figure 4.4: Housing Completions and Registrations in Ireland (1995-2017) 61
Figure 4.5: Sales by New and Existing Houses (2010-2017) 62
Figure 4.6: Sales by New and Existing Houses Rescaled (2010-2017) 62
Figure 4.7: Planning Permissions Granted and Units for Which Planning Permissions Granted 64
Figure 4.8: Regression Output – Multivariate Model of House Completions 68
Figure 4.9: Regression Output – New and Existing House Annual Sales from Property Price Register 69
Figure 5.1: First-Time Buyer New Dwelling Purchase Price Index, Irish Regions, 2010-2017 78
Figure 5.2 : Housing Affordability Trends for First-Time Buyers on Twice Average Earnings, 2008-2017 81

│ Executive Summary
Indecon International Economic Consultants
Indecon Impact Assessment of the Help to Buy Tax Incentive
i
Executive Summary
Introduction and Background
This study represents an evidence-based assessment of the Help to Buy (HTB) scheme. Following a competitive tender, Indecon Research Economists were appointed by the Minister for Finance to undertake an independent assessment of the HTB tax incentive. Given that the measure has only been in operation for seven months, the analysis represents a preliminary assessment.
The HTB scheme was announced on 19 July 2016 as part of the “Rebuilding Ireland: Action Plan for Housing and Homelessness.” Details of the initiative were included in Budget 2017 and legislated for in Section 9 of the Finance Act. The HTB initiative provides a tax rebate for first-time purchasers to assist them to fund the deposit to purchase or self-build a new house or apartment to live in as their home.
One of the policy aims of the HTB initiative is to assist first-time buyers of new homes to fund the deposit required under the Central Bank’s macroprudential rules. The other main policy aim is to encourage the building of additional new properties. By restricting the initiative to certain categories of new dwellings, it was anticipated that the increase in effective demand for affordable new-build homes could encourage the construction of an additional supply of such properties.
In line with the terms of reference for this assignment, the review examines the following issues:
- The level of take up of HTB;
- The impact on prices;
- The impact on the supply of new housing units; and
- The design of the scheme.
Indecon also examines the impact on affordability, as this is directly related to the objectives of the scheme.
Indecon notes that the scheme is a relatively limited measure with an original estimated cost of €50 million in 2017.1 The measure is restricted to a segregated component of the overall market, namely new homes below a certain price level which will be occupied as a residence by the purchaser.
Despite the limited nature of the measure Indecon believes that great care is needed in considering any government intervention in the Irish property market as there is a significant risk of unintended consequences. In a previous review of property-based tax incentives undertaken in 2005 for the Department of Finance, Indecon highlighted that, in many cases, property-based tax incentives had increased property prices and that there was no market failure or justification for the incentives. For most of the property incentives examined at that time, Indecon economists concluded that “there is absolutely no case for future government incentives. Continuing to approve new projects would contribute to oversupply and would represent a clear waste of scarce public resources”.2
The current HTB scheme was introduced at a very different time where instead of excess supply, there is evidence of significant undersupply of housing in the Irish market. This highlights the importance of an assessment of the fundamental economic determinants of property prices and the factors influencing supply. In a market where the supply of new housing is low and the economy is expanding, the resultant misalignment between supply and demand will, unless addressed, result in a continuing rise in prices.
1 The overall Government Housing initiatives in the Rebuilding Ireland Plan are estimated to cost €5.5 billion.
2 Indecon Review of Property-Based Tax Incentives Scheme, Report for the Department of Finance, October 2005.

│ Executive Summary
Indecon International Economic Consultants
Indecon Impact Assessment of the Help to Buy Tax Incentive
ii
Methodological Approach
A detailed methodology has been undertaken to evaluate the HTB measure in this report. This has included the following research elements:
- Analysis of detailed anonymised microdata from the Revenue Commissioners on transactions supported by the scheme.
- Examination of CSO, Daft.ie and MyHome.ie data on changes in prices in the Irish housing market. This has included reviewing an unpublished sub-sample and cross tabulation of data from CSO and from other sources.
- New empirical evidence on the changes in prices for comparable housing units in a sample of 12 new housing developments, which are likely to have been primarily purchased by individuals who would qualify for HTB.
- Detailed survey of contractors approved for the scheme. - Analysis of information on housing supply. - Review of prudential rules on mortgage lending and other policy changes. - Evaluation of views from stakeholders in the sector. - Modelling of impacts of incentive on affordability for different income cohorts. - Regression analysis of correlation between take up of HTB and changes in new residential property
prices by county. - Econometric modelling of the determinants of Irish property prices.
Analysis of HTB Incentive Take-Up
In evaluating the HTB incentive, it is important to examine the extent to which the incentive has been taken up by prospective FTBs. An analysis of the value of HTB applications is presented in the next figure and shows a decline over the period since the scheme was introduced. This is likely, in part, to reflect the backlog of retrospective properties previously purchased. The fact that numbers were higher in the initial months is not surprising for a scheme with a pre-purchase application process and where a time limited measure was announced. Some of the original applicants may have decided not to purchase any housing unit or may have purchased properties not eligible for the scheme. Other applicants may have delayed purchase.
Value of Help to Buy Applications (Jan-Aug 2017)
Source: Revenue data provided to Indecon, August 2017
11.110.4
10.0
6.05.8
3.7
2.4
1.1
0.0
2.0
4.0
6.0
8.0
10.0
12.0
Jan-17 Feb-17 Mar-17 Apr-17 May-17 Jun-17 Jul-17 Aug-17
Val
ue
of
Hel
p t
o B
uy
Ap
plic
atio
ns
€M
illio
n
│ Executive Summary
Indecon International Economic Consultants
Indecon Impact Assessment of the Help to Buy Tax Incentive
iii
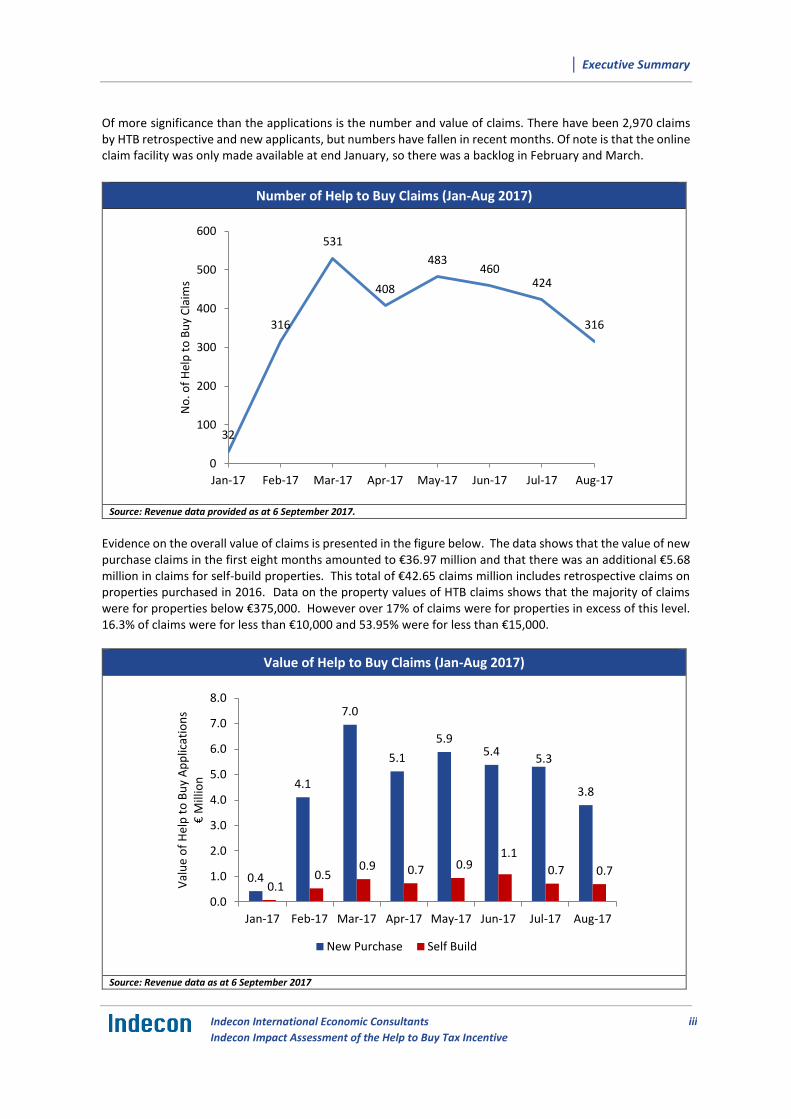
Of more significance than the applications is the number and value of claims. There have been 2,970 claims by HTB retrospective and new applicants, but numbers have fallen in recent months. Of note is that the online claim facility was only made available at end January, so there was a backlog in February and March.
Number of Help to Buy Claims (Jan-Aug 2017)
Source: Revenue data provided as at 6 September 2017.
Evidence on the overall value of claims is presented in the figure below. The data shows that the value of new purchase claims in the first eight months amounted to €36.97 million and that there was an additional €5.68 million in claims for self-build properties. This total of €42.65 claims million includes retrospective claims on properties purchased in 2016. Data on the property values of HTB claims shows that the majority of claims were for properties below €375,000. However over 17% of claims were for properties in excess of this level. 16.3% of claims were for less than €10,000 and 53.95% were for less than €15,000.
Value of Help to Buy Claims (Jan-Aug 2017)
Source: Revenue data as at 6 September 2017
32
316
531
408
483460
424
316
0
100
200
300
400
500
600
Jan-17 Feb-17 Mar-17 Apr-17 May-17 Jun-17 Jul-17 Aug-17
No
. of
Hel
p t
o B
uy
Cla
ims
0.4
4.1
7.0
5.1
5.95.4
5.3
3.8
0.10.5
0.9 0.7 0.91.1
0.7 0.7
0.0
1.0
2.0
3.0
4.0
5.0
6.0
7.0
8.0
Jan-17 Feb-17 Mar-17 Apr-17 May-17 Jun-17 Jul-17 Aug-17
Val
ue
of
Hel
p t
o B
uy
Ap
plic
atio
ns
€M
illio
n
New Purchase Self Build

│ Executive Summary
Indecon International Economic Consultants
Indecon Impact Assessment of the Help to Buy Tax Incentive
iv
In examining the level of take up of HTB and how this relates to overall activity in the market, it is useful to compare this to overall mortgage approvals. Data for mortgage approvals for FTBs shows that there was a noticeable increase in activity in terms of approvals from Q2 2016 onwards prior to the announcement of the HTB scheme, and higher levels of approvals were evident in Q2 2017. This suggests that an increase in approval activity was happening prior to the scheme but that this increased further in 2017. FTBs as a percentage of total mortgage approvals was 52% in the first six months of 2017, which was slightly higher than the average of 50% recorded in the first half of the previous three years. The total number of drawdowns for FTBs in Q1 and Q2 of 2017 for new and second hand properties amounted to a total of 7,279, and the overall number of mortgage drawdowns in the period was just under 15,000.
Impact on Property Prices
An assessment of what impact the HTB incentive may have had on property prices in Ireland since its introduction must consider the determinants of property price movements. Our evaluation takes into account the economic factors driving property prices as, even without any policy changes, an expanding economy is likely to be associated with rising prices. This view is aligned with reported comments by Professor Philip Lane, Governor of the Central Bank of Ireland, who indicated that, “the fundamentals of the housing market were based on employment and income growth and the prevailing interest rate, all of which were supporting strong price increases”.3
As part of this report, Indecon developed new econometric models to examine whether any separate impacts of the HTB on prices to date can be identified. Econometric models of property prices typically are presented as a reduced form inverse demand function, with property prices as a function of factors such as economic growth or changes in employment, interest rates, or demographic factors. Certain models also introduce supply-side variables, such as housing stock and the availability of land for construction, but many focus on the key determinants of demand.
Our modelling attempts to evaluate what prices would have been in 2017 if HTB was not introduced by examining if there is evidence which would suggest that a statistically significant change occurred in the level of prices in 2017 not explained by other economic factors. We model this in both a univariate and a multivariate setting, which means that we study the dynamics of housing prices both alone and in relation to the macro-economy. The regression output from one of our econometric models is presented in the next table.
3 Report on comments by Philip Lane in Article by John Walsh in the Times Newspaper; July 24th, 2017

│ Executive Summary
Indecon International Economic Consultants
Indecon Impact Assessment of the Help to Buy Tax Incentive
v
Regression Output – Multivariate Model of Property price Index ARIMA regression
Sample: 541 - 686 Number of obs = 146
Wald chi2(5) = 344.63
Log likelihood = 521.2182 Prob > chi2 = 0.0000
------------------------------------------------------------------------------
| OPG
D.lnRPPI_rev | Coef. Std. Err. z P>|z| [95% Conf. Interval]
-------------+----------------------------------------------------------------
lnRPPI_rev |
d_2017 | .0039273 .5485652 0.01 0.994 -1.071241 1.079095
|
lnemp |
D1. | .1760849 .0694827 2.53 0.011 .0399013 .3122685
-------------+----------------------------------------------------------------
ARMA |
ar |
L1. | .5612452 .074074 7.58 0.000 .4160629 .7064276
L2. | .4489194 .0918838 4.89 0.000 .2688304 .6290084
L3. | -.1432814 .0743956 -1.93 0.054 -.289094 .0025313
-------------+----------------------------------------------------------------
sigma | .0067791 .0003842 17.64 0.000 .006026 .0075322
------------------------------------------------------------------------------
Note: The test of the variance against zero is one sided, and the two-sided
confidence interval is truncated at zero. Source: Indecon econometric modelling
As part of our analysis, we also considered a number of econometric models of the price of Irish housing. A particular difficulty for us in this assignment is because of the very short time period involved for the analysis. Among the models we examined we considered the role of interest rates, income per capita and other demographic variables. These models did not prove to have very strong potential explanatory power over the period under examination and we felt a better approach might be a multi variate modelling approach which included structural variables to try and measure the impact of demand and wealth changes excluding any impact from the Help to Buy Scheme.
One of the models we examined was to use changes in the consumer sentiment index as a measure of overall spending power resulting from changes in income per capital, interest rates and built into this model were changes in the CPI and also changes in the Irish stock market index and changes in employment. The model estimated is as follows:
The model estimated is as follows:
𝑙𝑛𝑅𝑃𝑃𝐼𝑡 = 𝛼 + 𝛽1𝑙𝑛𝐶𝑆𝐼𝑡 + 𝛽2𝑙𝑛𝐶𝑃𝐼 + 𝛽3𝑙𝑛𝐼𝑆𝐸𝑄𝑡 + 𝛽3𝑙𝑛𝑒𝑚𝑝𝑡 + 휀𝑡
where lnCSI is the natural log of the consumer sentiment index (CSI), lnCPI is the natural log of all items consumer price index (CPI), lnISEQ is the natural log of the Irish Stock Market Index (ISEQ), and lnemp is the natural log of numbers employed.

│ Executive Summary
Indecon International Economic Consultants
Indecon Impact Assessment of the Help to Buy Tax Incentive
vi
Regression Output – Multivariate Model of House Price Index ARIMA regression
Sample: 540 - 686 Number of obs = 147
Wald chi2(5) = 2995.54
Log likelihood = 245.6182 Prob > chi2 = 0.0000
-------------------------------------------------------------------------------------------
| OPG
lnRPPI_rev | Coef. Std. Err. z P>|z| [95% Conf. Interval]
------------------+------------------------------------------------------------------------
lnRPPI_rev |
lniseq | -.0919442 .0248339 -3.70 0.000 -.1406178 -.0432706
lnemp | 4.899447 .1409176 34.77 0.000 4.623254 5.175641
lncsi | -.0807707 .030277 -2.67 0.008 -.1401125 -.021429
lncpi | -3.034468 .1112633 -27.27 0.000 -3.25254 -2.816395
cons | -17.64961 1.094942 -16.12 0.000 -19.79565 -15.50356
------------------+------------------------------------------------------------------------
ARMA12 |
ar |
L1. | .1115462 .0966245 1.15 0.248 -.0778343 .3009268
------------------+------------------------------------------------------------------------
sigma | .0454876 .0033795 13.46 0.000 .0388639 .0521114
-------------------------------------------------------------------------------------------
Source: Indecon econometric modelling
However, our assessment is that this and other models including structural variables did not provide better results compared with the univariate model where the key indicator of overall economic progress were the lagged dependent variable values along with the changes in employment.
AIC and BIC Akaike's information criterion and Bayesian information criterion
-------------------------------------------------------------------------------------------
Model | Obs ll(null) ll(model) df AIC BIC
-------------+-----------------------------------------------------------------------------
1 | 149 . 526.901 4 -1045.802 -1033.786
2 | 147 . 245.6182 7 -477.2365 -456.3034
Source: Indecon analysis
While the results of our econometric modelling do not appear to suggest any identifiable separate impact of the HTB scheme on prices to date, caution is needed in interpreting the results and it is also useful to also examine developments in Irish residential property prices.
The average prices of new homes in Ireland have increased in each quarter since the end of 2015 compared to the previous quarter. Average prices of new homes increased by 7.8% in 2016 Q2 and 6.8% in Q3, while showing slower growth in the last quarter of 2016, possibly reflecting seasonal factors. In the first quarter of 2017, average prices increased by 1.1% and by 4.9% in the second quarter. Average prices of new homes for FTBs also recorded very strong growth in 2016, and prices continued to increase in the first half of 2017.
Data on median prices of new dwellings for FTBs shows that, nationally, prices for new homes increased significantly in 2017. Interestingly, median prices for FTB new homes increased slower in 2017 in Dublin despite the fact that Dublin accounted for the highest percentage of HTB applicants and claims.

│ Executive Summary
Indecon International Economic Consultants
Indecon Impact Assessment of the Help to Buy Tax Incentive
vii
In addition to reviewing CSO data, Indecon examined if there was up-to-date data on new versus second hand average prices from Daft.ie. While the price data was not available by age, a new development variable is included as a control in hedonic regression completed by Professor Ronan Lyons of TCD. The next chart presents the coefficient in that variable for each of the five regions since 2015. The results do not appear to indicate upward pressure in Dublin/Leinster in recent quarters, although, there is a different picture for some other regions.
Regression Coefficient for New Residential Developments by Region
Source: Estimates provided to Indecon in July 2017 by Professor Ronan Lyons, Trinity College, Dublin.
There are limitations to the use of available statistics on housing prices from the point of view of reviewing the impact of HTB, including the fact that the published data is likely to reflect transactions where the prices were agreed some months previously. The published statistics are helpful in examining longer term trends, but because of the lag between publication of price data on completed transactions and the date at which the prices were agreed, there are limits on their use to measure the impact of policy changes only implemented in January 2017.
To address this and other issues, detailed unpublished micro information was obtained from 12 different housing sites, which accounted for over 1,200 new house sales over the period from the third quarter of 2015 until the second quarter of 2017. This data provides a very useful source of evidence on inflation in the prices of new houses in recent months. The data from the 12 new housing sites examined suggests that the average growth rate in prices across all sites recorded in Q1 2017 was 2.3% and in Q2 2017 was 2.9%. The weighted average figure indicated percentage changes of 2.3% in Q1 and 0.9% in Q2.
As part of the assessment of the HTB incentive, Indecon obtained survey responses from 55 contractors approved under the scheme. Contractors were asked to provide information on whether they had placed any new housing units on the market which would qualify for the HTB scheme and to indicate what changes, if any, have occurred in the price of these houses since the 1st of January 2017. The results indicate that 57% of contractors had not increased the price of the housing units while 43% indicated that some price increases had occurred. A smaller proportion of the larger contractors reported increases in prices.
│ Executive Summary
Indecon International Economic Consultants
Indecon Impact Assessment of the Help to Buy Tax Incentive
viii
In examining the impact of the HTB measure on housing prices, Indecon notes that in January 2017, changes were made to the Central Bank’s macroprudential rules on mortgage lending to FTBs. Nationally, the average loan-to-value (LTV) ratio for dwellings purchased with HTB was 86% but 21% of buyers had LTV ratios of less than 80%. A detailed analysis of micro data undertaken by Indecon indicated that only 50% of the non-retrospective purchasers paid deposits less than what was required under the previous Central Bank prudential rules and in many cases purchasers only exceeded previous LTVs by a small amount.
The contractors surveyed were asked to indicate the significance they would attribute to various factors influencing any price increases which occurred. More than half of respondents indicated that changes in cost of construction was a very significant or significant factor driving price increases. The impact of revised loan-to-value mortgage rules, increased demand by FTBs, and the HTB measure were factors which were seen as of some significance by a number of contractors, although these were judged to be of less importance than changes in construction costs.
As part of our analysis we also examined county price data to see if there is any evidence that changes in prices of new housing were correlated with the HTB purchasers in these local markets. If the HTB scheme had an identifiable impact on prices, then one might expect to see prices rising faster in counties where the HTB purchasers were a larger share of buyers in that market. The regression results can be interpreted to mean that counties where HTB was used for a larger share of completed transactions did not have a larger increase in price than other counties.
Indecon also examined price data on completed transactions assisted by HTB and reviewed whether the price levels show any differences for retrospective and non-retrospective prices. The average prices on new transactions assisted by HTB were very similar to the prices for transactions on retrospective sales prior to end of 2016.
The evidence examined using a range of approaches does not suggest any identifiable separate impact of the HTB scheme on prices to date. However, given the data limitations and the short period of recorded transactions since the scheme was introduced, this finding should not be interpreted as proof that HTB had no impact on prices. While no separate impact is evident from the modelling, we caution against assuming that the scheme will not impact on prices in future periods, unless there is an adequate supply response.
Impact on New Build Residential Supply
Data on the total housing stock in Ireland between the 2011 and 2016 shows that while the population grew by 3.8% over this period, housing stock grew by only 0.4%. There has however been some evidence of improvements in the supply of housing in the Irish market in recent months, but as supply inevitably takes time to respond, any identifiable overall impact of the HTB on supply is likely to be only seen over time. The level of housing supply will, in Indecon’s opinion, be largely determined by the cost of construction compared to prevailing market prices. It will also be influenced by the availability of finance for contractors and the assessment by builders and lenders of the sustainable level of effective demand. This is consistent with evidence from Indecon’s survey of contactors approved for the HTB scheme. Over 90% of contractors surveyed indicated that ‘the cost of building compared to market prices’ and ‘difficulties in developers obtaining finance to commence development’ were very significant or significant factors impacting the limited supply of new houses. For larger companies who have the option of building offices or residential properties, the relative returns in each sector are likely to influence resource allocation decisions.

│ Executive Summary
Indecon International Economic Consultants
Indecon Impact Assessment of the Help to Buy Tax Incentive
ix
The total number of housing completions has been rising steadily on an annual basis but the number of housing completions remains significantly below the number required to meet population growth and demand for housing.4 The importance of supply is recognised not only by economists but also by the construction sector. The Construction Industry Federation indicated to Indecon that “there is no disagreement that the level of building activity falls well short of the sustainable demand for new homes.”
As there are issues with completion data, we also examined the trends in new house registrations. An analysis of housing completion and registration in Ireland is presented in the next figure. The data on the most recent house registrations in Ireland show that in the first five months of 2017 there were 3,786 new registrations. This compares with 2,257 in the comparable period in 2016.
Housing Completions and Registrations in Ireland (1995-2017)
Source: Indecon analysis
As part of our research we developed a time series econometric model of supply similar to our approach to modelling of housing prices. The results of our econometric modelling indicate that, after controlling for macro-economic dynamics no significant increase in completions was evident in 2017. The fact that the model does not indicate any significant change in 2017 due to HTB is not surprising given that HTB is a limited measure and any overall potential impact on supply is only likely to be visible with a lag.
Indecon analysis suggests that the HTB measure has not impacted significantly on overall housing supply to date. The measure is likely to have encouraged some limited new supply in the first half of 2017 and to improve the incentive for builders to provide additional units over the next three years. The 55 contractors surveyed by Indecon indicated they had built or commenced building on 3,098 housing units since the measure was introduced and firms in this sample were planning on building 12,752 additional new housing units over the next three years. Most of the contractors also suggested that the HTB scheme encouraged them to commence building new units. Despite this finding Indecon believes that other approaches to directly tackle the cause of undersupply will be critical to achieve an adequate supply of housing.
4 ESRI, Quarterly Economic Commentary, Spring 2017
0
2000
4000
6000
8000
1000
0
1995m1 2000m1 2005m1 2010m1 2015m1tm
completions registrations

│ Executive Summary
Indecon International Economic Consultants
Indecon Impact Assessment of the Help to Buy Tax Incentive
x
Impact on Affordability
The difficulties experienced by first-time purchasers in financing a deposit and mortgage repayments is likely to have contributed to the decline in home ownership evident for younger individuals and young families. The scale of this challenge can be seen from data in the next table which shows that only 30% of households whose head is aged between 25 and 34 own their home compared to 68.4% in 1991. While this may in part reflect a number of factors, it is likely to have been impacted by mortgage affordability and by difficulties for some income cohorts in funding the deposits required to meet Central Bank prudential rules.
Home Ownership Rates of Head of Households Aged 25-34
Own Outright Mortgage Total Home Ownership
1991 9.1% 59.3% 68.4%
2011 2.9% 39.4% 42.3%
2016 5.0% 25.0% 30.0%
Source: NESC (2014) Report and 2016 Census of Population
The next figure shows the FTB property price to net income ratio for a buyer with average earnings. This ratio declined following the collapse in property prices, reaching a trough in 2013. In the past five years, the ratio of property prices to income has increased.
First-time Buyers Dwelling Prices to Net Income Ratio 2008-2017
Source: Indecon analysis Note: The FTB Purchase Price for 2008 and 2009 is calculated based on adjusting the 2010 FTB Purchase Price with the Residential Property Price Index.
An analysis of the position of a FTB family with only one individual employed with average earnings is shown in the table. This indicates that 45% of net income would be required to meet mortgage repayment costs, rising to 54% for a Dublin family. For the same family where the single earner is on average full-time earnings, 37% of net income would be required to meet mortgage payments.
2008 2009 2010 2011 2012 2013 2014 2015 2016 2017
0
1
2
3
4
5
6
7
8
9
10

│ Executive Summary
Indecon International Economic Consultants
Indecon Impact Assessment of the Help to Buy Tax Incentive
xi
Income and Mortgage Repayments - One-Earner First-time Buyers Married Couple at 100% of Average Earnings
2008 2009 2010 2011 2012 2013 2014 2015 2016 2017
National (Average Earnings) Gross Income
€36,866 €36,834 €36,481 €36,056 €36,199 €36,205 €36,269 €36,491 €36,736 €37,736
Net Income €34,817 €33,829 €33,051 €32,372 €32,154 €31,890 €31,861 €32,141 €32,770 €33,662
% of Net Income
57% 39% 34% 33% 30% 28% 30% 37% 42% 45%
National (Full-time Average Earnings) Gross Income
€44,160 €44,346 €44,274 €44,062 €44,523 €44,699 €44,836 €45,075 €45,611 €46,852
Net Income €41,284 €39,781 €39,072 €38,185 €38,481 €38,346 €38,372 €38,858 €39,575 €40,652
% of Net Income
48% 33% 29% 28% 25% 23% 25% 31% 35% 37%
Dublin (Average Earnings) Gross Income
€41,132 €41,097 €40,703 €40,229 €40,435 €40,449 €40,468 €40,716 €40,989 €42,105
Net Income €38,599 €37,206 €36,313 €35,402 €35,374 €35,116 €35,053 €35,447 €36,031 €37,012
% of Net Income
67% 42% 36% 37% 32% 34% 40% 50% 52% 54%
Source: Indecon
The next table shows the position for a FTB on 200% of average earnings or a couple both working and earning average incomes. In this case gross income would be approximately €75,000 and one-quarter of net income would be required to cover mortgage repayments. This percentage has increased in the past four years. As before, for a Dublin family, the figure is higher due to the higher prices of new housing in Dublin despite assumed higher average gross incomes. In this case mortgage payments are estimated to amount to 30% of income for these households, up from 17% in 2012.
Income and Mortgage Repayments - Two-Earner First-time Buyers Married Couple Each Earning Average Earnings
2008 2009 2010 2011 2012 2013 2014 2015 2016 2017
National (Average Earnings) Gross Income
€73,731 €73,669 €72,963 €72,112 €72,397 €72,410 €72,538 €72,982 €73,473 €75,472
Net Income
€64,171 €62,613 €61,380 €59,227 €59,024 €58,486 €58,484 €59,087 €60,053 €61,687
% of Net Income
31% 21% 19% 18% 16% 15% 17% 20% 23% 25%
National (Full-time Average Earnings) Gross Income
€88,320 €88,692 €88,548 €88,124 €89,046 €89,398 €89,672 €90,150 €91,222 €93,704
Net Income
€75,258 €73,782 €72,914 €70,275 €70,512 €70,208 €70,306 €70,932 €72,567 €74,541
% of Net Income
27% 18% 16% 15% 14% 13% 14% 17% 19% 20%
Dublin (Average Earnings) Gross Income
€82,264 €82,194 €81,407 €80,457 €80,870 €80,897 €80,936 €81,432 €81,979 €84,209
Net Income
€70,656 €68,951 €67,629 €64,985 €64,870 €64,342 €64,279 €64,917 €66,050 €67,847
% of Net Income
37% 23% 19% 20% 17% 19% 22% 28% 29% 30%
Source: Indecon

│ Executive Summary
Indecon International Economic Consultants
Indecon Impact Assessment of the Help to Buy Tax Incentive
xii
A potentially larger issue for some individuals and families in relation to mortgage affordability is the ability to fund the deposit required to meet the Central Bank Prudential rules. The next table shows the number of years required for a FTB to save a deposit under the current LTV rules for a range of housing prices, both with and without the HTB Scheme, ceteris paribus.
The figures show that particular problems are evident for purchasers attempting to save the required deposit to purchase an average FTB new home in Dublin, even if there are two individuals each working full time and earning the average earnings for full-time employees. In this case, even assuming very high savings ratios of 10% of gross earnings, it would take such a couple eight years to save for a deposit without HTB and 5.9 years with HTB assistance, ceteris paribus. If this family was only able to source 5% of gross income the number of years required to save for a deposit on a new house in Dublin without HTB would be 16 years.
Time Required for First-time buyer to Save a Deposit under New LTV Rules
Property price
Annual Earnings (Gross)
Max Mortgage (3.5*gross
income, max 90% LTV)
Deposit Required
without HTB incentive
Deposit Required with HTB incentive
No. years required to save deposit (if saving 10% of
gross income)
Without HTB Incentive
With HTB incentive
€239,998
€46,852 €163,982 €64,413 €52,993 13.7 11.3
€75,472 €205,556 €22,840 €11,420 3.0 1.5
€84,210 €205,556 €22,840 €11,420 2.7 1.4
€93,704 €205,556 €22,840 €11,420 2.4 1.2
€113,208 €205,556 €22,840 €11,420 2.0 1.0
€126,315 €205,556 €22,840 €11,420 1.8 0.9
€303,952
€46,852 €163,982* €139,970 €139,970 29.9 29.9
€75,472 €264,152 €39,800 €24,602 5.3 3.3
€84,210 €273,557 €30,395 €15,198 3.6 1.8
€93,704 €273,557 €30,395 €15,198 3.2 1.6
€113,208 €273,557 €30,395 €15,198 2.7 1.3
€126,315 €273,557 €30,395 €15,198 2.4 1.2
€403,200
€46,852 €163,982* €239,218 €239,218 51.1 51.1
€75,472 €264,152* €139,048 €139,048 18.4 18.4
€84,210 €294,735 €108,465 €88,465 12.9 10.5
€93,704 €327,964 €75,236 €55,236 8.0 5.9
€113,208 €362,880 €40,320 €20,320 3.6 1.8
€126,315 €362,880 €40,320 €20,320 3.2 1.6 Source: Indecon analysis *Not eligible for HTB incentive because the mortgage value must be at least 70% of the property price.
For individuals or families with only one earner, working full time and receiving average full-time gross earnings it is not feasible to fund the deposit required by Central Bank rules without significant assistance from family or friends. Despite the fact that some income groups are unlikely to be able to benefit from HTB it is clear that the HTB measure has assisted purchasers with the overall affordability of housing and in particular has reduced the number of years borrowers have to save to fund a deposit to meet Central Bank prudential rules. The figures also show that, ceteris paribus, for higher income earners with combined incomes of €126,315 even without the HTB they would have been in a position to save the required deposit in 3.2 years if they were able to save 10% of gross earnings.

│ Executive Summary
Indecon International Economic Consultants
Indecon Impact Assessment of the Help to Buy Tax Incentive
xiii
Design of the Incentive
The HTB incentive was announced as part of the 2016 “Rebuilding Ireland – Action Plan for Housing and Homelessness” of the Department of Housing, Planning, Community and Local Government and was seen as a complement to the structural actions set out in the Plan. The incentive is limited to a three-and-a-half-year period (July 2016 – December 2019).
The HTB incentive was envisaged as a scheme to improve the availability of adequate affordable mortgage finance for FTBs as new housing output comes on-stream. The HTB scheme as designed provides a refund of income tax and Deposit Interest Retention Tax (DIRT) paid in Ireland over the previous four years.
The design of the scheme implies that a mortgage on the property must be taken out with a qualifying lender and must be at least 70% of the purchase value of the property. This is an appropriate design feature to minimise the level of deadweight but the interaction of this with the Central Bank 3.5 LTV rules means that it may have an unintended impact on low earners wishing to avail of the scheme. In practice, these potential purchasers may even without this restriction have difficulty in obtaining finance. The scheme has been designed to also restrict the amount that can be claimed under the HTB incentive to the lesser of: €20,000 or 5% of the purchase price of a new home and must not be greater than the amount of income tax and Deposit Interest Retention Tax (DIRT) paid in the four years before the purchase or self-build.
Given these design features Indecon has examined the scheme against the criteria set in Government guidelines on evaluating tax incentives. The four key questions are as follows: Is the tax expenditure still relevant? How much did the tax expenditure cost? What was the impact of the tax expenditure? Was it efficient?
With regard to relevance of the measure, due to the relatively short duration since the HTB schemes inception, it is not surprising that the objectives of the scheme are still relevant. The difficulties with affordability and the limited level of new supply in the Irish housing market are still major issues.
With respect to the cost of the tax expenditure, the cost of the HTB scheme is within projected levels; however, a good proportion of 2017 still remains. In addition, we understand that the Revenue Commissioners are preparing new projections on costs, and we recommend costs are reassessed following this forthcoming review.
The impact of the HTB scheme on prices and supply is difficult to measure due to the short period since its inception. The evidence examined does not suggest any identifiable separate impact of the HTB scheme on prices to date. Similarly, the analysis suggests that the HTB measure has not impacted significantly on overall supply to date but is likely to improve the incentive for builders to provide additional units over the next three years. The impact of the measure on affordability is evident and the scheme significantly reduces the time required to save for a deposit. However, this could be eroded if price pass-through from the HTB scheme becomes evident.
Our review suggests that the HTB measure has been implemented in an efficient manner and targets support for FTBs to help them fund the deposit on a house. By restricting the measure to owner occupiers and capping the level of support to the lesser of a number of criteria it has been efficient in minimising the Exchequer costs. However, by providing assistance on properties above average values and by not linking the measure to incomes, the scheme is likely to have been subject to deadweight.
│ Executive Summary
Indecon International Economic Consultants
Indecon Impact Assessment of the Help to Buy Tax Incentive
xiv
Conclusions
A summary of our conclusions is presented in the table below. These are designed to improve the probability that the objectives set for the HTB in terms of affordability and increased housing supply will be met while reducing the risks that the measure will contribute to inflationary pressures. Our analysis also suggests that structural measures are required which directly address the supply problem.
Summary of Key Conclusions
1. The Help to Buy (HTB) scheme is primarily but not exclusively a demand led measure and there is legitimate concern that, in a period of inadequate supply, the measure could result in increased inflationary pressures on property prices therefore reducing any benefit in terms of mortgage affordability.
2. This preliminary empirical analysis completed by Indecon suggests that to date there is no evident impact on overall prices of new homes for first-time buyers (FTBs) as a result of the measure. This is likely to be because of the limited level of take up to date and the fact that the incentive was confined to a segregated segment of the market. It will be vital to monitor the price of HTB new builds over the coming months. This is particularly the case given the revisions by the CSO to the Residential Property Price Index (RPPI) index announced in August. This means that the index now captures both off the plans purchases and some transactions previously excluded from the index. This change could have a non-trivial impact on emerging prices over the coming months.
3. There is potential that if the level of take up HTB accelerates that inflationary pressures would result if there is not an adequate supply response. This highlights the priority which should be given to expanding supply.
4. The HTB measure does not appear to have had any significant overall impact to date on the level of supply. While this was an objective of the scheme, it is not surprising that any impact on supply to date is muted given the time lag required to construct new houses. By increasing effective demand for new homes in certain price categories, the scheme is likely to have encouraged some limited new supply in the first half of 2017 and has increased confidence in the sector. Contractors have indicated plans to expand the supply of new houses over the next three years. The monitoring of these plans is critical to an evaluation of whether the measure contributes to inflationary pressures in the housing market. An abolishment of the scheme would at this time create uncertainty and damage confidence and would likely impact on the levels of new builds.
5. Since the HTB measure was introduced, changes in Central Bank prudential rules have made it easier for some categories of FTBs to fund deposits. The need for the HTB incentive may be reduced for some purchasers as a result of this change.
6. The HTB measure has enhanced affordability for FTB and has reduced the number of years required for purchasers to save the deposit for new houses. There is however likely to be some purchasers who did not need the incentive suggesting an element of deadweight and particular affordability issues remain for those on lower incomes. Furthermore, the enhanced affordability may erode if price pass-through from the incentive becomes evident.
7. The design of the scheme has a number of desirable characteristics, including the time limited nature of the incentive, the restriction to a segment of the market and the introduction of an application process which means that the costs and profile of purchasers is obtained. The restriction of the measure to owner occupiers is also a welcome development in minimising any distortionary impacts.
8. A cost-benefit evaluation of the scheme was not undertaken prior to its introduction. While there were understandable reasons for this, Indecon are concerned that this should not be seen as a precedent for other measures.
9. The cap of €20,000 and the restriction to house purchases below €500,000 have improved equity compared to the position without these elements. However, there is no correlation with individuals’ incomes, and there is likely to be deadweight in the scheme for some recipients of the incentive.
10. Targeting the incentive to provide greater support to assist individuals or couples with average incomes to fund deposits may be appropriate.
11. The key challenge for the housing market is to reduce the costs of housing, including both house prices and the cost of construction.
12. A comprehensive cost-benefit analysis of the scheme should be undertaken after a period, as given the limited time since the measure was introduced, this report inevitably can only represent a preliminary assessment.

│ Executive Summary
Indecon International Economic Consultants
Indecon Impact Assessment of the Help to Buy Tax Incentive
xv
Acknowledgements
Indecon would like to gratefully acknowledge the valuable inputs made by a wide range of officials and other organisations to this review. Indecon would in particular like to thank John Hogan, Patrick Brennan, Alan Smyth, Laura Weymes, Seamus Milne and Joe Cullen in the Department of Finance and Maura Connelly, Brian Farrell, Declan Rigney, Keith Redmond, Brian Farrell, Tom Foxe, Maria O’Reilly and Declan Rigney in the Revenue Commissioners for inputs and provision of information. Thanks are also due to George Hussey, Steward Logan, Colin Ryan, Barry Quinlan and Sarah Neary in the Department of Housing.
Thanks are due to a number of economists including Professor Ronan Lyons (TCD), Conall MaCoille (Davys), Marian Finnegan (Sherry Fitzgerald), and John McCarthy (Savills). Particular thanks are due to Ronan Lyons for permitting use of unpublished regression coefficients on new property prices.
We are also grateful for information from Michael O’Flynn of the O’Flynn Group and Michael Stanley and Declan Murray of Cairn Homes plc, Ivan Gaine of Sherry Fitzgerald, Keith Lowe and Carol Strong of Douglas Newman Good and Ken MacDonald of Hooke and MacDonald. Particular thanks are due to those firms who provided detailed data to enable Indecon to develop a microdatabase on changes in sales prices agreed for new homes since the start of 2017.
We acknowledge the very useful inputs from 55 firms who responded to the Indecon survey of contractors approved for the scheme. We are appreciative of the willingness of these firms to provide information on various aspects of their business and the interaction with the scheme. In addition, we acknowledge with thanks a range of inputs made to Indecon by various stakeholders, including by John O’Connor from the Housing Agency, Hubert Fitzpatrick of the Construction Industry Federation, David Duffy of Property Industry Ireland, Pat Davitt of the Institute of Professional Auctioneers and Valuers, Áine Myler of the Society of Chartered Surveyors Ireland, Maurice Crowley of the Banking and Payments Federation Ireland, Karl Deeter of Irish Mortgage Brokers, Trevor Grant of the Association of Expert Mortgage Advisers and Michael Dowling of The Irish Brokers Association.
We would also like to thank Gregg Patrick and other officials in the CSO for their cooperation and support in providing detailed data which assisted our review.
The usual disclaimer applies, and all of the analysis and judgments in this independent report are the sole responsibility of Indecon.

1 │ Introduction and Background
Indecon International Economic Consultants
Indecon Impact Assessment of the Help to Buy Tax Incentive
1
1 Introduction and Background
Background and Policy Context
This study represents an evidence based assessment of the Help to Buy (HTB) scheme. Following a competitive tender Indecon Research Economists were appointed by the Department of Finance to undertake an independent impact assessment of the HTB tax incentive.
The HTB scheme was announced on 19 July 2016 as part of the “Rebuilding Ireland: Action Plan for Housing and Homelessness.” Details of the initiative were included in Budget 2017 and legislated for in Section 9 of the Finance Act.
The HTB initiative provides a tax rebate for first-time purchaser to assist them to fund the deposit required to purchase or self-build a new house or apartment to live in as their home. The scheme is open to those who are purchasing new builds and those who self-build.
One of the policy aims of the HTB initiative is to assist first-time buyers of new homes to fund the deposit required under the Central Bank’s macroprudential rules. The other main policy aim is to help encourage the building of additional new properties. By restricting this initiative solely to certain categories of new dwellings, it was anticipated that the resulting increase in effective demand for affordable new-build homes from FTBs could potentially encourage the construction of an additional supply of such properties.
In line with the terms of reference for this assignment, the review examines the following issues:
The level of take-up of HTB; The potential impact on prices; The potential impact on the supply of new housing units; and Examination of the design of the scheme.
In addition, Indecon has also examined the potential impact on affordability. As these aspects are directly related to the two key objectives of the scheme, this analysis is essential to the general assessment of the measure.
Given that the scheme has only been in operation for seven months, this implies that the analysis can only represent a preliminary assessment. The assessment is also impacted by a number of fundamental economic factors driving property prices. In addition, there have been changes in Central Bank prudential rules on housing loans since the measure was introduced.
This evaluation takes into account the fundamental economic factors driving property prices as, even without any policy changes, an expanding economy is likely to be associated with rising property prices. This view is aligned with reported comments by Professor Philip Lane, Governor of the Central Bank of Ireland who indicated that, “the fundamentals of the housing market were based on employment and income growth and the prevailing interest rate, all of which were supporting strong price increases”.5
Indecon note that the scheme is a relatively limited measure with an original estimated cost of €50 million in 2017. (The overall Government Housing initiatives in the Rebuilding Ireland Programme are estimated to cost €5.5 billion.) The measure is also restricted to a segregated component of the overall market, namely new homes below a certain price level which will be occupied as a residence by the purchaser.
5 Report on comments by Professor Philip Lane, in Article by John Walsh in the Times Newspaper; July 24th, 2017
1 │ Introduction and Background
Indecon International Economic Consultants
Indecon Impact Assessment of the Help to Buy Tax Incentive
2
Despite the limited nature of the measure Indecon believes that great care is needed in considering any government intervention in the Irish property market as there is a significant risk of unintended consequences. In a previous review of property-based tax incentives undertaken in 2005, Indecon highlighted that in many cases Irish Government property-based tax incentives had increased property prices and that there was no market failure or justification for the incentives. For most of the property incentives examined at that time, Indecon economists concluded that “there is absolutely no case for future government incentives. Continuing to approve new projects would contribute to oversupply and would represent a clear waste of scarce public resources”.6
The current HTB scheme was introduced at a very different time where instead of excess supply, there is evidence of significant undersupply of housing in the Irish market. This highlights the importance of an assessment of the fundamental economic determinants of property prices and of supply factors. In a market where the supply of new housing is low and the economy is expanding, the resultant misalignment between supply and demand will, unless addressed, result in a continuing rise in prices.
Given this context a key issue examined in this report is whether there is any evidence to date that the HTB measure has contributed to the increases in housing prices by expanding demand. If supply fails to respond to what is largely but not exclusively a demand incentive, the impact would be seen in higher prices. The interaction between supply and demand in the Irish housing market has been highlighted by many economists. For example, it has been pointed out that “in housing or indeed in any market, the solution to lack of supply is not to further stimulate demand.”7 Another way of putting this is that “when a lot more people chase an essentially unchanged number of houses, there is only going to be one outcome – higher prices”. This suggests that if supply is not increased and if the measure impacts on overall demand, the benefits to purchasers in terms of overall price could be negated. Indecon accepts that, even in circumstances of higher prices the measure could facilitate individuals who would not otherwise be able to purchase a home to fund the required deposit to meet Central Bank prudential requirements. However, concerns remain regarding the potential future impact of any demand incentive on property prices.
The potential impact on demand of the measure in a supply constrained market led to concerns by both the IMF and the European Commission about the impact of the HTB incentive on the housing market in Ireland. In their review of the Irish economy in May 2017, the IMF welcomed this Indecon review of the Help to Buy scheme, as they recognised that the HTB measure “may add to demand pressures”. The IMF also noted that in relation to housing supply “while there are signs of progress a robust supply response will take time”. The European Commission, in its post-programme surveillance report published in March 2017, suggested that: “The estimated first year fiscal cost is €50 million which implies that the scope of the scheme may be relatively limited. Nevertheless, the measure is likely to increase demand for new properties in the face of inelastic supply, thereby supporting further price increases while only indirectly contributing to increasing supply.” This evaluation attempts to empirically examine the extent to which such concerns regarding the potential impact on houses prices of the measure are evident in the market to date.
6 Indecon Review of Property-Based Tax Incentives Scheme, Report for the Department of Finance, October 2005. (Concerns over the wider potential impact of property and other tax incentives has been highlighted by economists for many years. See Gray, A. W., Responses to Irish Unemployment, The Views of Four Economists, Indecon 1992.)
7 Ronan Lyons, “The Pitfalls of Wooing First Time Buyers” Daft.ie insights, September 28th, 2016

1 │ Introduction and Background
Indecon International Economic Consultants
Indecon Impact Assessment of the Help to Buy Tax Incentive
3
Methodological Approach
A detailed rigorous methodology has been undertaken to establish the level of take up of the HTB measure and to examine the potential impact on prices, supply and affordability. This has included the following research elements:
Analysis of detailed anonymised microdata from the Revenue Commissioners on transactions supported by the scheme.
Examination of CSO, Daft and MyHome.ie data on changes in prices in the Irish Housing Market. This has included reviewing unpublished sub-sample and cross tabulation of data from CSO and from other sources.
New empirical evidence on the changes in prices for comparable housing units in a sample of 12 new housing developments, which are likely to have been primarily purchased by individuals qualifying for HTB.
Detailed survey of contractors approved for the scheme.
Analysis of information on housing supply.
Review of prudential rules on mortgage lending and other policy changes.
Evaluation of submissions from stakeholders in the sector.
Rigorous analysis of correlation between take-up of HTB and new house price by county.
Econometric modelling of determinants of Irish property prices.
Modelling of impacts of incentive on affordability for different income cohorts.
Structure of the Report
The remainder of the report is structured as followed: Section 2 presents an analysis of the level of HTB take-up. In the following section, we examine the evidence on the potential impact on property prices. In Section 4, we consider the impact if any on new build residential supply. Section 5 examines the issue of affordability. In Section 6, we examine the design of the incentive, and in the final section we present conclusions.
Acknowledgements
Indecon would like to gratefully acknowledge the valuable inputs made by a wide range of officials and other organisations to this review. Indecon would in particular like to thank John Hogan, Patrick Brennan, Alan Smyth, Laura Weymes, Seamus Milne and Joe Cullen in the Department of Finance and Maura Connelly, Brian Farrell, Declan Rigney, Keith Redmond, Brian Farrell, Tom Foxe, Maria O’Reilly and Declan Rigney in the Revenue Commissioners for inputs and provision of information. Thanks are also due to George Hussey, Steward Logan, Colin Ryan, Barry Quinlan and Sarah Neary in the Department of Housing.
Thanks are due to a number of economists including Professor Ronan Lyons (TCD), Conall MaCoille (Davys), Marian Finnegan (Sherry Fitzgerald), and John McCarthy (Savills). Particular thanks are due to Ronan Lyons for permitting use of unpublished regression coefficients on new property prices.

1 │ Introduction and Background
Indecon International Economic Consultants
Indecon Impact Assessment of the Help to Buy Tax Incentive
4
We are also grateful for information from Michael O’Flynn of the O’Flynn Group, Michael Stanley and Declan Murray of Cairn Homes plc, Ivan Gaine of Sherry Fitzgerald, Keith Lowe and Carol Strong of Douglas Newman Good, and Ken MacDonald of Hooke and MacDonald.
We acknowledge the very useful inputs from 55 contractors who responded to the Indecon survey of contractors approved for the scheme. We are appreciative of the willingness of these firms to provide information on various aspects of their business and the interaction with the scheme In addition, we acknowledge with thanks a range of inputs made to Indecon on behalf of various stakeholders, including by John O’Connor from the Housing Agency, Hubert Fitzpatrick of the Construction Industry Federation, David Duffy of Property Industry Ireland, Pat Davitt of the Institute of Professional Auctioneers and Valuers, Áine Myler of the Society of Chartered Surveyors Ireland, Maurice Crowley of the Banking and Payments Federation Ireland, Karl Deeter of Irish Mortgage Brokers, Trevor Grant of the Association of Expert Mortgage Advisers and Michael Dowling of The Irish Brokers Association.
We would also like to thank Gregg Patrick and other officials in the CSO for their cooperation and support in providing detailed data which assisted our review.
The usual disclaimer applies and all of the analysis and judgments in this independent report are the sole responsibility of Indecon.

2 │ Analysis of HTB Incentive Take-Up
Indecon International Economic Consultants
Indecon Impact Assessment of the Help to Buy Tax Incentive
5
2 Analysis of HTB Incentive Take-Up
Introduction
In evaluating the impact of the Help to Buy (HTB) scheme it is important to examine the extent to which the incentive has been taken up by prospective first-time buyers (FTBs). Indecon has been provided with detailed anonymised data by the Revenue Commissioners on the level and characteristics of take-up of the scheme.
Level of Interest in Scheme
The table below outlines the number of applicants for the HTB incentive scheme as of August 2017. Data shows that there have been 15,911 applications, and 6,3075 of these were subsequently cancelled by the applicants.
This reflects the fact that applicants can cancel an application and reapply subsequently. Many applicants may simply be using the process to check what tax rebate they would receive if they decided to purchase an eligible new housing unit at some point in the future. The evidence also shows a decline in the number of applications over time.
Table 2.1: Trend in Help to Buy Applicants
Approved Pending Cancelled Total Applied
January 2017 903 554 1,450 2,907
February 2017 876 415 992 2,283
March 2017 939 436 925 2,300
April 2017 697 351 630 1,678
May 2017 787 407 672 1,866
June 2017 681 363 693 1,737
July 2017 666 471 556 1,693
August 2017 500 558 389 1,447
TOTAL 6,049 3,555 6,307 15,911
Source: Indecon Analysis of Revenue Commissioners Data as at 6 September 2017
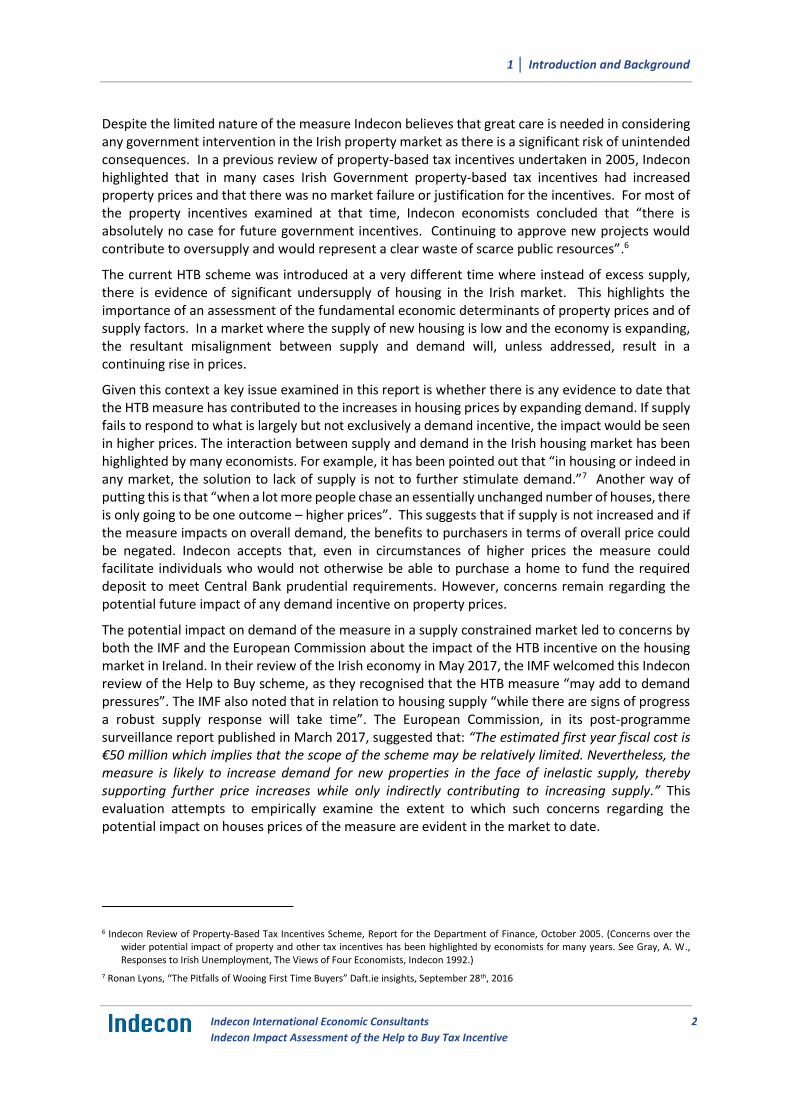
An analysis of the value of HTB applications, presented in the next figure, shows a decline over the period since the scheme was introduced. This is likely, in part, to reflect the backlog of retrospective properties previously purchased. The fact that numbers were higher in the initial months is not surprising for a scheme with a pre-purchase application process and where a time limited measure was announced. Some of the original applicants may have decided not to purchase any housing unit or may have purchased properties not eligible for the scheme. Other applicants may have delayed purchase.
2 │ Analysis of HTB Incentive Take-Up
Indecon International Economic Consultants
Indecon Impact Assessment of the Help to Buy Tax Incentive
6
Figure 2.1: Value of Help to Buy Applications (Jan-Aug 2017)
Source: Revenue data provided to Indecon, as at 6 September 2017
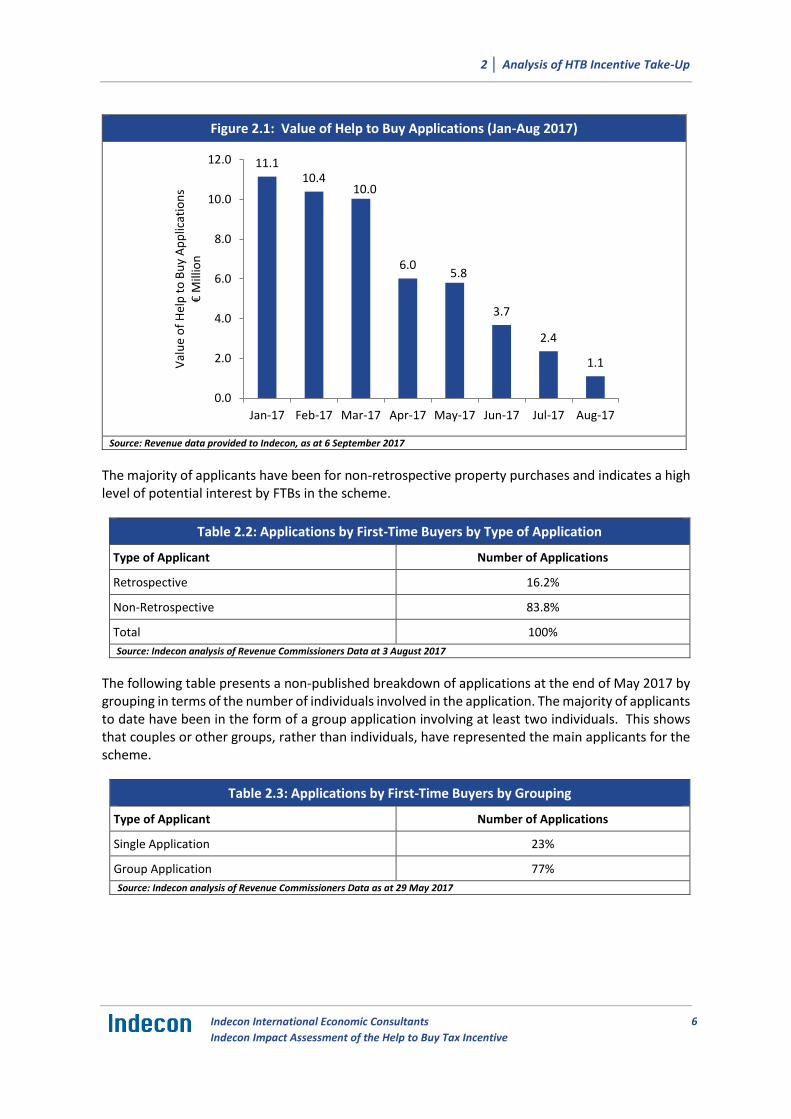
The majority of applicants have been for non-retrospective property purchases and indicates a high level of potential interest by FTBs in the scheme.
Table 2.2: Applications by First-Time Buyers by Type of Application
Type of Applicant Number of Applications
Retrospective 16.2%
Non-Retrospective 83.8%
Total 100%
Source: Indecon analysis of Revenue Commissioners Data at 3 August 2017
The following table presents a non-published breakdown of applications at the end of May 2017 by grouping in terms of the number of individuals involved in the application. The majority of applicants to date have been in the form of a group application involving at least two individuals. This shows that couples or other groups, rather than individuals, have represented the main applicants for the scheme.
Table 2.3: Applications by First-Time Buyers by Grouping
Type of Applicant Number of Applications
Single Application 23%
Group Application 77%
Source: Indecon analysis of Revenue Commissioners Data as at 29 May 2017
11.110.4
10.0
6.05.8
3.7
2.4
1.1
0.0
2.0
4.0
6.0
8.0
10.0
12.0
Jan-17 Feb-17 Mar-17 Apr-17 May-17 Jun-17 Jul-17 Aug-17
Val
ue
of
Hel
p t
o B
uy
Ap
plic
atio
ns
€M
illio
n

2 │ Analysis of HTB Incentive Take-Up
Indecon International Economic Consultants
Indecon Impact Assessment of the Help to Buy Tax Incentive
7
The table below provides a breakdown of applications by county. This table records the location of the applicant at the time of the application. Dublin is the region with the largest proportion with 46.5% of applicants. When the percentages for commuting counties of Kildare, Meath and Wicklow are added, the percentage rises to 62%.
Table 2.4: First-Time Buyer Applicants Location by County
County Percentage of Total Applications
Cavan/Monaghan 1.9%
Clare 1.0%
Cork 8.7%
Donegal 1.2%
Dublin 46.5%
Galway/Roscommon 4.9%
Kerry 1.2%
Kildare 6.3%
Kilkenny 2.7%
Limerick 3.0%
Louth 3.0%
Mayo 1.3%
Meath 5.5%
Sligo 1.4%
Tipperary 1.6%
Waterford 2.3%
Westmeath/Offaly 2.1%
Wexford 1.8%
Wicklow 3.4%
Total 100.0% Source: Indecon analysis of Revenue Commissioners Data as at 29 May 2017. For confidentiality reasons data for certain counties are not provided
Table 2.5 provides a breakdown of claims made under HTB by type of claim. It is only at the claim stage that self-builds and new builds are identified in the data. As of 3 August 2017, the number of new-build purchased non-retrospective HTB claims amounted to 58.9% of claims.
Table 2.5: Claims by First-Time Buyers
Type of Applicant Number of Claimants
New Build Retrospective 25.1%
New Build Non-Retrospective 58.9%
Self-Build Retrospective 6.5%
Self-Build Non-Retrospective 9.4%
Source: Indecon analysis of Revenue Commissioners Data as at 6 September 2017

2 │ Analysis of HTB Incentive Take-Up
Indecon International Economic Consultants
Indecon Impact Assessment of the Help to Buy Tax Incentive
8
Number of Claims for Assistance
Of more significance than the applications is the number of claims. There have been 2,970 claims by HTB applicants to end-August 2017, but the number of claims has fallen in recent months. Of note is that the online claim facility was only made available at end January, so there was a backlog in February and March as applicants made their claims.
Figure 2.2: Number of Help to Buy Claims (Jan-Aug 2017)
Source: Revenue data provided as at 6 September 2017.
Evidence on the overall value of claims is presented in Figure 2.3 and shows that the value of new purchase claims in the first eight months amounted to €36.97 million and there was an addition €5.68 million in claims for self-build properties. This total of €42.65 million includes retrospective claims on properties purchased in 2016.
Figure 2.3: Value of Help to Buy Claims (Jan-Aug 2017)
Source: Revenue data as at 6 September 2017
32
316
531
408
483460
424
316
0
100
200
300
400
500
600
Jan-17 Feb-17 Mar-17 Apr-17 May-17 Jun-17 Jul-17 Aug-17
No.
of H
elp
to B
uy C
laim
s
0.4
4.1
7.0
5.1
5.95.4
5.3
3.8
0.10.5
0.9 0.7 0.91.1
0.7 0.7
0.0
1.0
2.0
3.0
4.0
5.0
6.0
7.0
8.0
Jan-17 Feb-17 Mar-17 Apr-17 May-17 Jun-17 Jul-17 Aug-17
Valu
e of
Hel
p to
Buy
App
licat
ions
€M
illio
n
New Purchase Self Build

2 │ Analysis of HTB Incentive Take-Up
Indecon International Economic Consultants
Indecon Impact Assessment of the Help to Buy Tax Incentive
9
Data on the property values of HTB claims shows that the majority of claims were for properties below €375,000. However over 17% of claims were for properties in excess of this level.
Table 2.6: Property Values of HTB Claims
Property Value Range € %
0-150k 2.9
151-225 14.5
226 – 300 35.4
301 -375 29.9
376 – 450 12.4
Over 450 4.9
Total 100%
Source: Revenue Data as at 3 August 2017
16.3% of claims were for less than €10,000 and for 53.95% the amount was less than €15,000. This reflects the fact that, the price of many homes purchased with HTB assistance, were less than €400,000. The amount claimed will also have been determined by the amount of tax paid by applicants in the eligible period.
Table 2.7: HTB Claims
Amount Claimed (€) %
0-4,999 2.7
5,000 – 9,999 13.5
10,000 – 14,999 37.7
15,000 – 19,999 33.8
20,000 12.3
Source: Revenue Data as at 3 August 2017

2 │ Analysis of HTB Incentive Take-Up
Indecon International Economic Consultants
Indecon Impact Assessment of the Help to Buy Tax Incentive
10
An analysis of the geographic breakdown of HTB as at 6 September 2017 is presented in the table below. This indicates that around 40% of claims were from Dublin. The combined percentage of claims from Dublin and the commuting counties of Meath, Kildare and Wicklow amount to 65% of all the claims.
Table 2.8: Geographical Breakdown of HTB Claims
County Numbered
Carlow 19
Cavan 20
Clare 48
Cork 337
Donegal 30
Dublin 1,425
Galway 145
Kerry 29
Kildare 358
Kilkenny 25
Laois 47
Leitrim <10
Limerick 117
Longford <10
Louth 91
Mayo 36
Meath 390
Monaghan 21
Offaly 41
Roscommon 23
Sligo 15
Tipperary 58
Waterford 89
Westmeath 41
Wexford 49
Wicklow 194
Source: Indecon analysis of Revenue Commissioners Data as at 3 August 2017
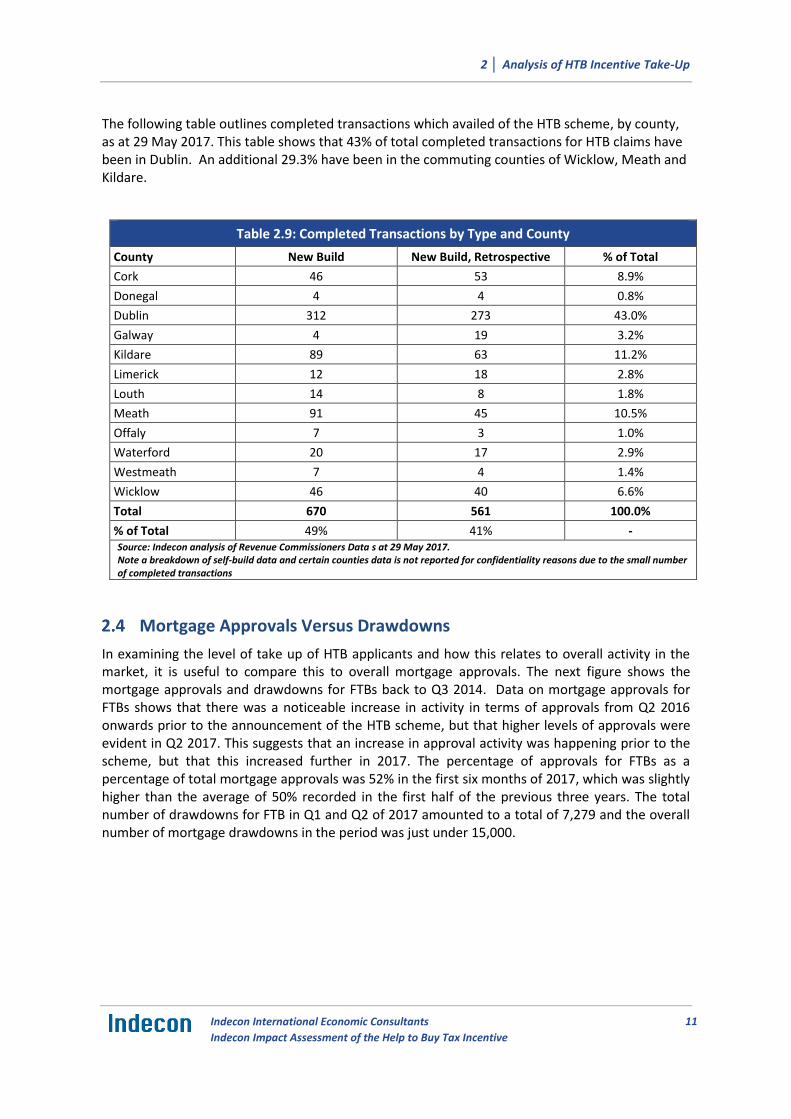
2 │ Analysis of HTB Incentive Take-Up
Indecon International Economic Consultants
Indecon Impact Assessment of the Help to Buy Tax Incentive
11
The following table outlines completed transactions which availed of the HTB scheme, by county, as at 29 May 2017. This table shows that 43% of total completed transactions for HTB claims have been in Dublin. An additional 29.3% have been in the commuting counties of Wicklow, Meath and Kildare.
Table 2.9: Completed Transactions by Type and County
County New Build New Build, Retrospective % of Total
Cork 46 53 8.9%
Donegal 4 4 0.8%
Dublin 312 273 43.0%
Galway 4 19 3.2%
Kildare 89 63 11.2%
Limerick 12 18 2.8%
Louth 14 8 1.8%
Meath 91 45 10.5%
Offaly 7 3 1.0%
Waterford 20 17 2.9%
Westmeath 7 4 1.4%
Wicklow 46 40 6.6%
Total 670 561 100.0%
% of Total 49% 41% - Source: Indecon analysis of Revenue Commissioners Data s at 29 May 2017. Note a breakdown of self-build data and certain counties data is not reported for confidentiality reasons due to the small number of completed transactions
Mortgage Approvals Versus Drawdowns
In examining the level of take up of HTB applicants and how this relates to overall activity in the market, it is useful to compare this to overall mortgage approvals. The next figure shows the mortgage approvals and drawdowns for FTBs back to Q3 2014. Data on mortgage approvals for FTBs shows that there was a noticeable increase in activity in terms of approvals from Q2 2016 onwards prior to the announcement of the HTB scheme, but that higher levels of approvals were evident in Q2 2017. This suggests that an increase in approval activity was happening prior to the scheme, but that this increased further in 2017. The percentage of approvals for FTBs as a percentage of total mortgage approvals was 52% in the first six months of 2017, which was slightly higher than the average of 50% recorded in the first half of the previous three years. The total number of drawdowns for FTB in Q1 and Q2 of 2017 amounted to a total of 7,279 and the overall number of mortgage drawdowns in the period was just under 15,000.
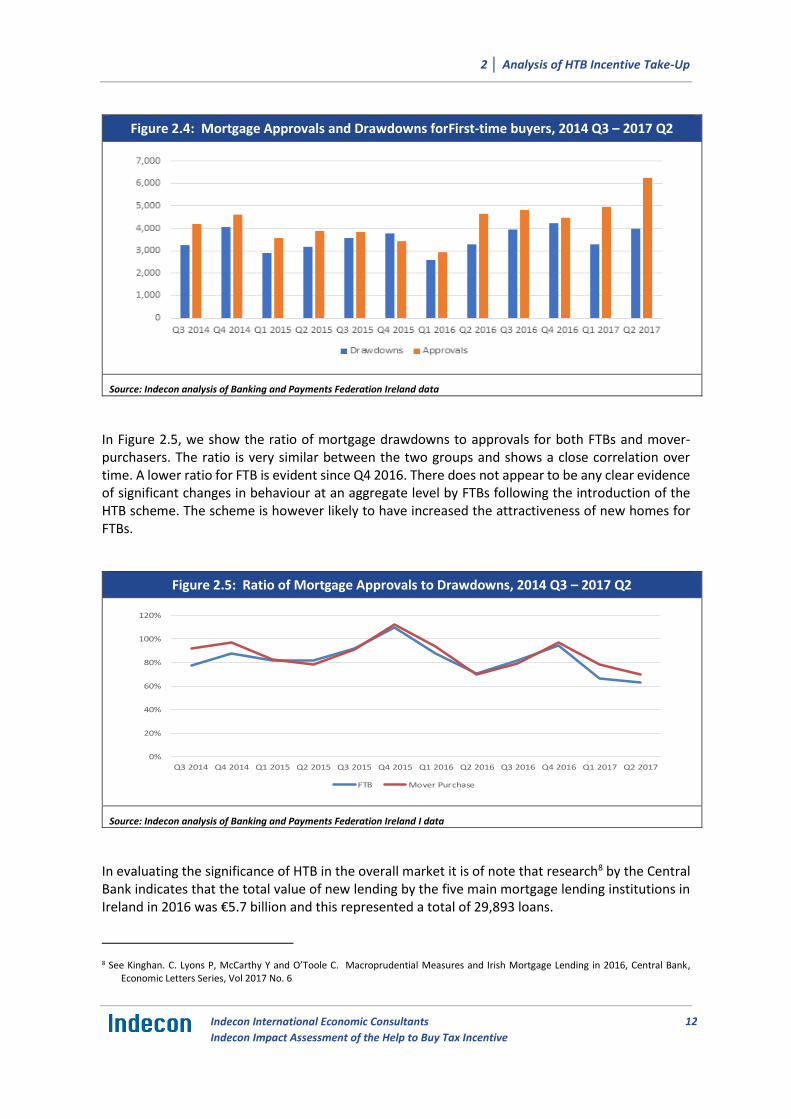
2 │ Analysis of HTB Incentive Take-Up
Indecon International Economic Consultants
Indecon Impact Assessment of the Help to Buy Tax Incentive
12
Figure 2.4: Mortgage Approvals and Drawdowns forFirst-time buyers, 2014 Q3 – 2017 Q2
Source: Indecon analysis of Banking and Payments Federation Ireland data
In Figure 2.5, we show the ratio of mortgage drawdowns to approvals for both FTBs and mover-purchasers. The ratio is very similar between the two groups and shows a close correlation over time. A lower ratio for FTB is evident since Q4 2016. There does not appear to be any clear evidence of significant changes in behaviour at an aggregate level by FTBs following the introduction of the HTB scheme. The scheme is however likely to have increased the attractiveness of new homes for FTBs.
Figure 2.5: Ratio of Mortgage Approvals to Drawdowns, 2014 Q3 – 2017 Q2
Source: Indecon analysis of Banking and Payments Federation Ireland I data
In evaluating the significance of HTB in the overall market it is of note that research8 by the Central Bank indicates that the total value of new lending by the five main mortgage lending institutions in Ireland in 2016 was €5.7 billion and this represented a total of 29,893 loans.
8 See Kinghan. C. Lyons P, McCarthy Y and O’Toole C. Macroprudential Measures and Irish Mortgage Lending in 2016, Central Bank, Economic Letters Series, Vol 2017 No. 6
0%
20%
40%
60%
80%
100%
120%
Q3 2014 Q4 2014 Q1 2015 Q2 2015 Q3 2015 Q4 2015 Q1 2016 Q2 2016 Q3 2016 Q4 2016 Q1 2017 Q2 2017
FTB Mover Purchase
2 │ Analysis of HTB Incentive Take-Up
Indecon International Economic Consultants
Indecon Impact Assessment of the Help to Buy Tax Incentive
13
Summary of Findings
In evaluating the Help to Buy (HTB) incentive it is important to examine the extent to which the incentive has been taken up by prospective first-time buyers (FTBs).
An analysis of the value of HTB applications shows a decline over the period since the scheme was introduced. This is likely in part to reflect the backlog of retrospective properties previously purchased. The fact that numbers were higher in the initial months is not surprising for a scheme with a pre-purchase application process and where a time limited measure was announced. Some of the original applicants may have decided not to purchase any housing unit or may have purchased properties not eligible for the scheme. Other applicants may have delayed purchase.
Of more significance than the applications is the number and value of claims. There have been 2,970 claims by HTB retrospective and new applicants, but numbers have fallen in recent months. Of note is that the online claim facility was only made available at end January so there was a backlog in February and March.
The value of new purchase claims in the first eight months amounted to €36.97 million with an addition €5.68 million in claims for self-build properties. This total of €42.65 claims million includes retrospective claims on properties purchased in 2016. Data on the property values of HTB claims shows that the majority of claims were for properties below €375,000. However, over 17% of claims were for properties in excess of this level. Data on the levels of HTB claims shows that 16.3% of claims were for less than €10,000 and for 53.95% the amount was less than €15,000.
In examining the level of take up of HTB and how this relates to overall activity in the market, it is useful to compare this to overall mortgage approval. Data for mortgage approval for FTBs shows that there was a noticeable increase in activity in terms of approvals from Q2 2016 onwards prior to the announcement of the HTB scheme, but that even higher levels of approvals were evident in Q2 2017. This suggests that an increase in approval activity was happening prior to the scheme but that this increased further in 2017.
The approvals for FTBs as a percentage of total mortgage approvals was 52% in the first six months of 2017, which was slightly higher than the average of 50% recorded in the first half of the previous three years. The total number of drawdowns for FTBs in Q1 and Q2 of 2017 for new and second hand properties amounted to a total of 7,279. The overall number of mortgage drawdowns in the period was just under 15,000.

3 │ Impact on Property Prices
Indecon International Economic Consultants
Indecon Impact Assessment of the Help to Buy Tax Incentive
14
3 Impact on Property Prices
Introduction
An assessment of the impact the Help to Buy (HTB) incentive may have had on property prices in Ireland since its introduction must consider the determinants of property price movements. To take these factors into account, our analysis has included new econometric modelling to examine whether any impacts of the HTB on prices to date can be identified. We also examine in detail the available information on changes in property prices and other potential issues relevant to an evaluation of the impact of the measure.
Econometric Modelling of the Determinants of Property Prices
The approach to the econometric modelling of property prices reflects the significance of fundamental economic determinants influencing demand. Models are typically presented as a reduced form inverse demand function, with property prices as a function of factors such as economic growth or changes in employment, interest rates, or demographic factors. Certain models also introduce supply-side variables, such as housing stock and the availability of land for construction, but many focus on the key determinants of demand. Some indicators on relevant factors impacting on housing markets can be seen from Table 3.1.
Table 3.1: Indicators for Housing Market Conditions and Trends
Market Conditions Taxation
- House prices (nominal, real, mean, median, repeat-sales, and hedonic indicators)
- Real estate taxes - Turnover taxes - Interest deductibility
- Turnover/sales and the stock of unsold houses (including stocks expressed in monthly sales
- Capital gains and estate taxes
Demand Factors Financial Sector
- Disposable income, including per household - Functioning and efficiency of the housing finance market (products, fees, refinancing options, etc.)
- Interest rates: mortgage and risk-free rates
- Debt-servicing costs as a share of income - Regulatory and supervisory regime for housing finance (CARs, maximum LTV and/or LTI ratios)
- Population and household size - Mortgage delinquencies, foreclosures
- Rents, price-rental ratios, rent controls, rent subsidies - Mortgage-backed securities’ spreads; risk premia on subprime mortgages - Equity prices and price-earnings ratios (general)
Supply Factors - Housing stock (developments), vacancy rates Other Indicators
- Residential investment, housing starts, permits issued - Household balance sheets
- Land prices, construction costs, zoning rules - Home-ownership ratio
- Stock prices and rating of listed building companies
Source: Selected extracts from IMF Working Paper WP/08/211.

3 │ Impact on Property Prices
Indecon International Economic Consultants
Indecon Impact Assessment of the Help to Buy Tax Incentive
15
Empirical modelling of property prices has its foundations in research by Case and Schiller (1989), Linneman (1986), and Topel and Rosen (1988). There has also been significant previous econometric modelling of property prices in Ireland by Indecon and by other economists, including Kenneally and McCarthy (1982), Irvine (1984), Hendry (1984), Kenny (1998), Roche (1999 and 2001), McQuinn (2004), Murphy (2005), and O’Reilly (2007). Econometric modelling of the international determinants of property prices has been completed by many economists, including Adams and Füss (2009) and Hirata et al (2013).
The modelling of house price movements in Ireland by Kenny (1998) incorporated a model of demand and supply adjustment using the Johansen multivariate approach to cointegration analysis. This was followed by research by Roche (1999 & 2001), who considered the housing market using a regime-switching model developed by van Norden (1996) and attempted to decompose house prices into fundamental and non-fundamental elements.
Adopting a similar approach to Kenny (1998), McQuinn (2004) used a vector error correction model to model the Irish housing market. The estimated inverse housing demand equation was considered to be a function of real interest rates, housing stock per capita, income per capita, demographic variables, average mortgage approved, as well as a lag of prices and the error correction term(s). A more recent study by Murphy (2005) for Ireland used a standard housing model approach to estimate changes in house prices. The per capita demand for housing was seen as dependent on per capita output, demographic factors and the real rental cost of housing.
Building on the existing econometric research in Ireland and internationally, Indecon, for this assignment, developed a number of econometric models of housing prices in Ireland to see if there are any evident changes which can be identified or attributed to the HTB scheme. This is very challenging for reasons outlined in the introduction to the report. These include the fact that the scheme has only come into effect on 1 January 2017 and that data is now only emerging that might reflect the prices of houses sold which have benefited from HTB.
In considering what property prices might have been in 2017 in the absence of HTB, we examine if there is evidence which would suggest that there is a statistically significant change in the level of property prices in 2017 not explained by other economic determinants. We do this in both a univariate and a multivariate setting, which means that we study the dynamics of property price index both alone and in relation to the macro-economy. We differentiate between the price of newly built houses and the price of existing houses. We also examine the data on the supply and sales of new houses; although, we believe it may be too soon to see any potential effect on supply due to the time lag needed to build a house. Our econometric models attempt to build a counterfactual scenario by modelling prices before 2017 and testing if there is a significant difference in 2017.
Price Data Used in Modelling
In examining the determinants of residential property prices, we considered a variety of methodologies. It is critical to examine how changes in property prices are measured. While prices are interpretable as levels, often prices are aggregated to create an index of property prices. Indices are often quality adjusted, but depending on the index used, may be interpretable only in terms of changes over time.

3 │ Impact on Property Prices
Indecon International Economic Consultants
Indecon Impact Assessment of the Help to Buy Tax Incentive
16
Conniffe and Duffy (1999) previously examined Irish house price indices. As part of their analysis, they discuss different methodologies for constructing property price indices, including median price, a hedonic index, a constrained hedonic index, and a repeat sales index and augmented repeat sales approach. In addition to standard published price indices, we examine the issue of the impact of changes in quality and in Building Energy Ratings (BER) and reviewed the possibility of using a separate index for homes in the price categories assisted by HTB.
Measuring price changes adjusted for quality change using BER and other quality measures
As part of our research, we considered the impact on prices of changes in quality change. A useful source of information on quality change is the BER database, which collects data on over 80 household characteristics.
Indecon notes that the CSO adjusts their price indices for quality change in-line with Eurostat and international best practice. The CSO’s methods are governed by European Regulations, as property price indices are part of a Macro Imbalances Procedure (MIP) and an Alert Mechanism Report based on changes in official CSO property price indices.
The CSO uses an address-matching procedure to match house addresses in the property price registry with the BER database. They also match their data with CSO small areas and the POBAL Deprivation Index. In addition, the CSO published series takes account of BER data which accounts for energy ratings, the total floor area, and dwelling type (house, apartment, semi-detached, etc.). The CSO uses this data as part of a hedonic regression approach to quality adjust the data.9
In considering the impact of quality changes in the CSO’s aggregate Residential Property Price Index (RPPI), CSO kindly provided Indecon with the unsmoothed RPPI data, which was quality adjusted and the raw average aggregate price data for all residential properties from CSO. The difference between the two gives an indicator of the quality change in the aggregate property price index. The data are presented graphically below.
Figure 3.1: CSO Average Price and RPPI Data
Source: Indecon Analysis of Data provided by CSO
9 Patrick, Gregg, “Redeveloping Ireland’s Residential Property Price Index (RPPI)”, Ottawa Group, 10-12 May 2017, Eltville, Germany.
-20.0-15.0-10.0-5.00.05.010.015.020.0
0.0
20.0
40.0
60.0
80.0
100.0
120.0
rppi_raw_reb avg_p_reb Difference

3 │ Impact on Property Prices
Indecon International Economic Consultants
Indecon Impact Assessment of the Help to Buy Tax Incentive
17
The overall trend is slightly higher for the average price (since the recovery) than the unsmoothed/quality adjusted RPPI. Thus, there is some indication that a portion of average property price increases have been accounted for by quality changes. The following table presents the number of houses by unit type as a share of the BER-rated new houses by year. As can be seen by the table, there has been a shift to semi-detached houses and to terraced houses and away from apartments and detached houses.
Table 3.2: Number of Houses by Unit Type as a Share of All New BER-Rated Units, 2010-2017
Year of Construction
Type of House
Apartment House Semi-Detached Terraced
2010 25% 40% 22% 14%
2011 26% 45% 16% 13%
2012 9% 48% 20% 23%
2013 12% 36% 28% 23%
2014 13% 34% 38% 16%
2015 10% 30% 38% 23%
2016 15% 20% 42% 23%
2017 15% 13% 35% 37%
Source: Indecon analysis of BER database
It is possible to look at the BER data in terms of floor area over time, which gives an overall indication of the change in total size of units, as presented in Table 3.3.
Table 3.3: Average Floor Area M2
Year of Construction
Type of Dwelling
Apartment Detached House Semi-Detached Terraced
2010 21.8 132.9 58.0 52.5
2011 21.8 134.3 58.1 52.7
2012 33.7 137.2 64.1 56.7
2013 26.0 125.7 62.3 52.8
2014 16.8 128.1 65.1 61.3
2015 21.1 122.7 63.2 60.9
2016 21.5 117.5 63.2 58.2
2017 21.3 115.1 61.9 56.2
Source: Indecon analysis of BER database

3 │ Impact on Property Prices
Indecon International Economic Consultants
Indecon Impact Assessment of the Help to Buy Tax Incentive
18
Indecon analysed the BER data and house quality indicators by house type as presented the following table. The evidence suggests significant improvements in energy efficiency, as the total energy use per meter squared has almost halved.
Table 3.4: BER Rating kWh/Yr/M2
Year of Construction
Type of Dwelling
Apartment Detached House Semi-Detached Terraced
2010 108.8 106.1 103.0 99.8
2011 94.1 96.4 108.1 96.9
2012 99.2 89.9 86.7 83.1
2013 88.0 80.2 79.5 77.4
2014 77.1 65.9 61.2 58.0
2015 82.2 59.4 58.5 54.9
2016 53.1 57.6 55.6 53.2
2017 54.3 55.9 56.5 54.4 Source: Indecon analysis of BER database
The improvements in the BER may, in part, reflect a shift geographically towards urban areas and the use of gas. This is consistent with the data in the table below, which shows a breakdown of the number of units by primary space heating fuel in the BER database and evidence on the energy ratings by type.
Table 3.5: Changes in Type of Primary Space Heating Fuel
Number of Units by Primary Space Heating Fuel Energy ratings by Primary type of space
heating fuel
Year Mains Gas Electricity Heating
Oil Other Mains
Gas Electricity Heating
Oil Other
2010 1,158 379 1,284 157 110.1 177.1 119.7 159.5
2011 990 300 642 72 103.9 115.6 110.1 196.7
2012 684 197 479 89 92.39 93.88 104.1 107.9
2013 1,321 285 399 63 83.29 96.21 95.21 115.7
2014 1,965 779 494 60 69.01 61.67 77.93 118.2
2015 2,963 1395 613 33 62.18 55.93 68.63 106.9
2016 3,982 2211 422 63 55.73 54.77 65.94 132.0
2017 1,400 505 56 15 56.48 53.26 64.53 63.5 Source: Indecon analysis of BER database

3 │ Impact on Property Prices
Indecon International Economic Consultants
Indecon Impact Assessment of the Help to Buy Tax Incentive
19
The CSO quality adjustment and the Indecon analysis of the BER data provide some indication that overall quality is a component of the changes in Irish Housing Prices. Indecon’s review suggests that this is already accounted for adequately in the CSO quality adjusted series.
Index for Housing in Price Categories Assisted by HTB
In addition to examining the unsmoothed and raw average price data from CSO, Indecon obtained unpublished cross tabulations on new property prices with the assistance of the CSO. Our objective was to consider whether it would be feasible or appropriate to develop an indicative price index for houses in price categories relevant to the HTB scheme. Indecon are very grateful to the CSO for providing a special analysis of average residential property prices by price bands, type of buyer, dwelling type and location (in Dublin and other areas).
As part of the analysis, Indecon examined HTB claims data to examine the price of properties which might have been assisted by the HTB. This was constructed by assigning to the average prices in each price band from the CSO a weight corresponding to the number of HTB claims in each band. Geographical dispersion has also been taken into account, as well as type of buyer and type of dwelling. The index is also weighted by geographic areas (Dublin/Greater Dublin Area/Other), and type of buyer and type of dwelling are also taken into account.
What is referred to as the HTB price index is plotted in the figure below, along with the general RPPI index. It should be noted that this does not measure the price changes for properties assisted by HTB Scheme but simply refers to changes in housing in the price categories covered by the measure. The HTB index is more volatile than the general property price index, as the latter has been both quality-adjusted and smoothed over time by the CSO. The trends are broadly comparable, and linear trends are represented in the figure with dotted lines. Caution is needed in interpreting this finding as HTB scheme was only introduced in January and this index does not measure the price impact of HTB.
Figure 3.2: Trend in Prices of House in HTB Price Categories Compared to General Property Prices
Source: Indecon Analysis of CSO and HTB data
0
20
40
60
80
100
120
140
160
180
RPPI HTB Index Linear (RPPI) Linear (HTB Index)

3 │ Impact on Property Prices
Indecon International Economic Consultants
Indecon Impact Assessment of the Help to Buy Tax Incentive
20
Econometric Models Used
We begin our econometric modelling using the aggregate quality adjusted and smoothed RPPI from the CSO. The series includes transactions involving both first-time buyers (FTBs) and other types of buyers/investors. We use a time series approach, which consists of analysing the properties of property prices over time, in terms of the persistence of exogenous shocks. This is an important preliminary step to identify the appropriate model for a subsequent multivariate analysis, and it also provides a first (unconditional) test for the hypothesis of a statistically significant increase in property prices in 2017.
In general, the periodicity of the data was monthly and the time periods used were 2005-2010 and 2010-2017 for more updated price indices from the CSO. The 2017 data included the most recent month available at the time of writing.
Preliminary data analysis and unit root tests strongly suggest the presence of a unit root in the series. This means that shocks are persistent and that any inference based on econometric models in levels may be misleading. Therefore, we concentrate on models using the first differences in prices.
Numerous ARIMA models were tested both with structural variable and only including AR and MA terms of the dependent variables. In general, model selection criteria, such as AIC and BIC, did not indicate that models including structural variables were better fitting or produced better forecast results. Moreover, it should be recalled that even an AR(1) can be seen as a simple reduced form of lagged structural variables, as all the structural variables that impact the dependent variable are contained in its lagged value. Model selection tests suggest that the most appropriate model for the property price index is the following:
Δ𝑙𝑛𝑅𝑃𝑃𝐼𝑡 = 𝛼 + 𝛽1Δ𝑙𝑛𝑅𝑃𝑃𝐼𝑡−1 + 𝛽2Δ𝑙𝑛𝑅𝑃𝑃𝐼𝑡−2 + 𝛽3Δ𝑙𝑛𝑅𝑃𝑃𝐼𝑡−3 + 휀𝑡
where lnRPPI is the natural log of the Residential Property Price Index (RPPI). Regression results are presented in the following figure.
Figure 3.3: Regression Output – ARIMA Model of Property Price Index
ARIMA regression
Sample: 541 - 689 Number of obs = 149
Wald chi2(3) = 369.28
Log likelihood = 526.901 Prob > chi2 = 0.0000
------------------------------------------------------------------------------
| OPG
D.lnRPPI_rev | Coef. Std. Err. z P>|z| [95% Conf. Interval]
-------------+----------------------------------------------------------------
ARMA |
ar |
L1. | .5769256 .0760443 7.59 0.000 .4278816 .7259695
L2. | .4161066 .0915499 4.55 0.000 .2366721 .5955411
L3. | -.1184148 .0756005 -1.57 0.117 -.2665891 .0297594
-------------+----------------------------------------------------------------
/sigma | .0070122 .00039 17.98 0.000 .0062477 .0077766
------------------------------------------------------------------------------
Note: The test of the variance against zero is one sided, and the two-sided
confidence interval is truncated at zero.
Source: Indecon analysis

3 │ Impact on Property Prices
Indecon International Economic Consultants
Indecon Impact Assessment of the Help to Buy Tax Incentive
21
Additional tests indicate that this is the model that most accurately tracks the behaviour of the series. The figure below depicts the actual index vis-à-vis the one-step-ahead forecasts.
Figure 3.4: Forecast of Property Price Index (2014-2017)
Source: Indecon analysis
Visual inspection of the forecast for 2017 on a more micro level shows that by March 2017 the forecast is nearly equal to the actual index value.
Figure 3.5: Forecast of Property Price Index (July 2016-June 2017)
Source: Indecon analysis
4.2
4.3
4.4
4.5
4.6
Jan 2014 Jan 2015 Jan 2016 Jan 2017 Jul 2017
lnrppi_rev y prediction, one-step
4.48
4.5
4.52
4.54
4.56
Jul 2016 Sept 2016 Oct 2016 Nov 2016 Dec 2016 Jan 2017 Feb 2017 Mar 2017 Apr 2017 May 2017 Jun 2017
lnrppi_rev y prediction, one-step

3 │ Impact on Property Prices
Indecon International Economic Consultants
Indecon Impact Assessment of the Help to Buy Tax Incentive
22
The graphics are depicted in natural logs of the dependent variable. This enables us to interpret the difference or change over time in the property price index variable as the growth rate, g: a 0.01 difference in the log variables is a 1% difference between the forecasted and actual values. The figure shows that forecast error is lower than 0.3%. We conclude this model is accurate in describing the dynamics of the property price index. A final step in our process is to see if the inclusion of a 2017 dummy (indicating the timing of the HTB measures) makes any difference to the forecast or is a significant predictor of property prices.
The model estimated is:
Δ𝑙𝑛𝑅𝑃𝑃𝐼𝑡 = 𝛼 + 𝛽1Δ𝑙𝑛𝑅𝑃𝑃𝐼𝑡−1 + 𝛽2Δ𝑙𝑛𝑅𝑃𝑃𝐼𝑡−2 + 𝛽3Δ𝑙𝑛𝑅𝑃𝑃𝐼𝑡−3 + 𝛾𝑑2017 + 휀𝑡
where lnRPPI is the natural log of the Residential Property Price Index (RPPI) and yd2017 is a dummy variable indicating the year 2017. The estimates of this model are presented in the figure below.
Figure 3.6: Regression Output – ARIMA model of Property Price Index with 2017 Dummy
ARIMA regression
Sample: 541 - 689 Number of obs = 149
Wald chi2(4) = 367.24
Log likelihood = 527.3027 Prob > chi2 = 0.0000
------------------------------------------------------------------------------
| OPG
D.lnRPPI_rev | Coef. Std. Err. z P>|z| [95% Conf. Interval]
-------------+----------------------------------------------------------------
lnRPPI_rev |
d_2017 | .0057614 .0209736 0.27 0.784 -.0353461 .046869
-------------+----------------------------------------------------------------
ARMA |
ar |
L1. | .5830417 .0759314 7.68 0.000 .4342188 .7318645
L2. | .4099219 .0914939 4.48 0.000 .230597 .5892467
L3. | -.1238263 .0751499 -1.65 0.099 -.2711174 .0234647
-------------+----------------------------------------------------------------
/sigma | .0069942 .000392 17.84 0.000 .0062258 .0077626
------------------------------------------------------------------------------
Source: Indecon analysis
The results do not suggest any significant break in the series in 2017. However, it is important to control for factors that may explain the behaviour of property prices independent of the HTB measures but that might be correlated with changes over time and in 2017.10 To capture this, we estimated various multivariate models including the following variables:
GDP and GNP – CSO available on quarterly basis with 1 quarter lag; Unemployment rate – CSO available monthly with less than one-month lag; Employment – available quarterly from the CSO QNHS;
10 This is because house prices may have increased or decreased in 2017 for reasons other than the Help to Buy scheme, for example because of other factors relating to the recovery, such as developments in labour markets or a shift in interest rates.
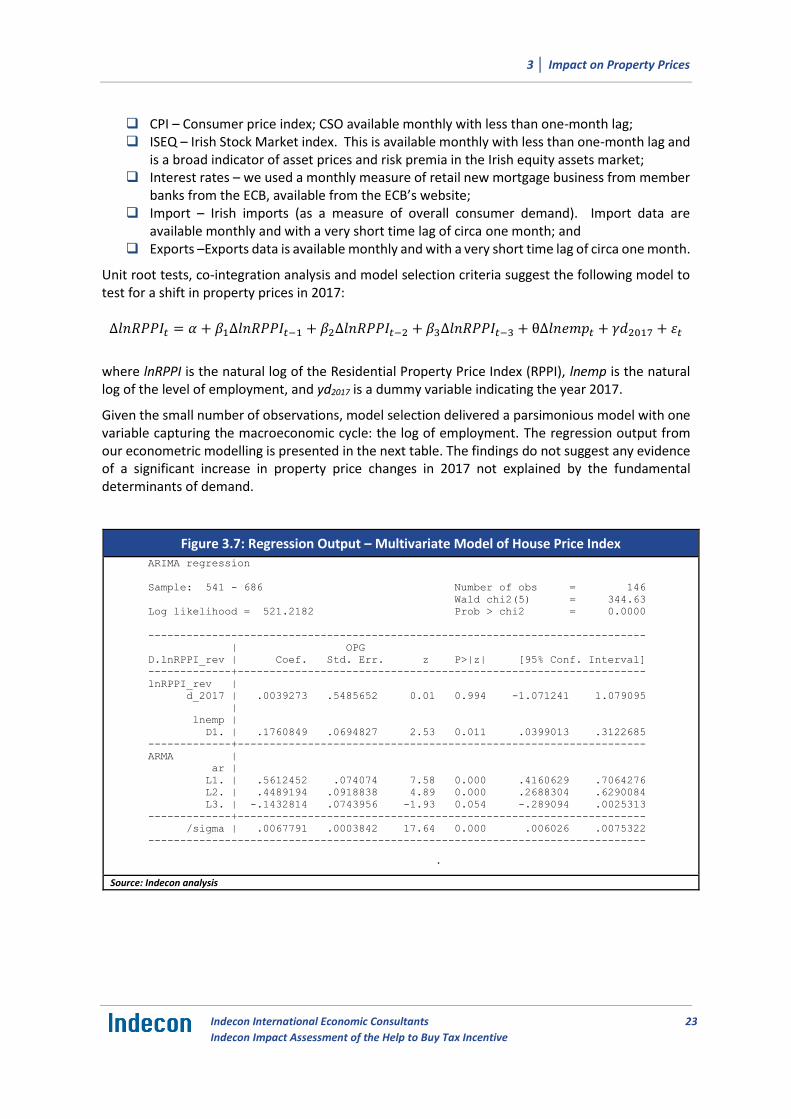
3 │ Impact on Property Prices
Indecon International Economic Consultants
Indecon Impact Assessment of the Help to Buy Tax Incentive
23
CPI – Consumer price index; CSO available monthly with less than one-month lag; ISEQ – Irish Stock Market index. This is available monthly with less than one-month lag and
is a broad indicator of asset prices and risk premia in the Irish equity assets market; Interest rates – we used a monthly measure of retail new mortgage business from member
banks from the ECB, available from the ECB’s website; Import – Irish imports (as a measure of overall consumer demand). Import data are
available monthly and with a very short time lag of circa one month; and Exports –Exports data is available monthly and with a very short time lag of circa one month.
Unit root tests, co-integration analysis and model selection criteria suggest the following model to test for a shift in property prices in 2017: Δ𝑙𝑛𝑅𝑃𝑃𝐼𝑡 = 𝛼 + 𝛽1Δ𝑙𝑛𝑅𝑃𝑃𝐼𝑡−1 + 𝛽2Δ𝑙𝑛𝑅𝑃𝑃𝐼𝑡−2 + 𝛽3Δ𝑙𝑛𝑅𝑃𝑃𝐼𝑡−3 + θΔ𝑙𝑛𝑒𝑚𝑝𝑡 + 𝛾𝑑2017 + 휀𝑡
where lnRPPI is the natural log of the Residential Property Price Index (RPPI), lnemp is the natural log of the level of employment, and yd2017 is a dummy variable indicating the year 2017.
Given the small number of observations, model selection delivered a parsimonious model with one variable capturing the macroeconomic cycle: the log of employment. The regression output from our econometric modelling is presented in the next table. The findings do not suggest any evidence of a significant increase in property price changes in 2017 not explained by the fundamental determinants of demand.
Figure 3.7: Regression Output – Multivariate Model of House Price Index ARIMA regression
Sample: 541 - 686 Number of obs = 146
Wald chi2(5) = 344.63
Log likelihood = 521.2182 Prob > chi2 = 0.0000
------------------------------------------------------------------------------
| OPG
D.lnRPPI_rev | Coef. Std. Err. z P>|z| [95% Conf. Interval]
-------------+----------------------------------------------------------------
lnRPPI_rev |
d_2017 | .0039273 .5485652 0.01 0.994 -1.071241 1.079095
|
lnemp |
D1. | .1760849 .0694827 2.53 0.011 .0399013 .3122685
-------------+----------------------------------------------------------------
ARMA |
ar |
L1. | .5612452 .074074 7.58 0.000 .4160629 .7064276
L2. | .4489194 .0918838 4.89 0.000 .2688304 .6290084
L3. | -.1432814 .0743956 -1.93 0.054 -.289094 .0025313
-------------+----------------------------------------------------------------
/sigma | .0067791 .0003842 17.64 0.000 .006026 .0075322
------------------------------------------------------------------------------
.
Source: Indecon analysis

3 │ Impact on Property Prices
Indecon International Economic Consultants
Indecon Impact Assessment of the Help to Buy Tax Incentive
24
As part of our analysis, we also considered a number of econometric models of the price of Irish housing. A particular difficulty for us in this assignment is because of the very short time period involved for the analysis. Among the models we examined we considered the role of interest rates, income per capita and other demographic variables. These models did not prove to have very strong potential explanatory power over the period under examination and we felt a better approach might be a multi variate modelling approach which included structural variables to try and measure the impact of demand and wealth changes excluding any impact from the Help to Buy Scheme.
One of the models we examined was to use changes in the consumer sentiment index as a measure of overall spending power resulting from changes in income per capital, interest rates and built into this model were changes in the CPI and also changes in the Irish stock market index and changes in employment. The model estimated is as follows:
The model estimated is as follows:
𝑙𝑛𝑅𝑃𝑃𝐼𝑡 = 𝛼 + 𝛽1𝑙𝑛𝐶𝑆𝐼𝑡 + 𝛽2𝑙𝑛𝐶𝑃𝐼 + 𝛽3𝑙𝑛𝐼𝑆𝐸𝑄𝑡 + 𝛽3𝑙𝑛𝑒𝑚𝑝𝑡 + 휀𝑡
where lnCSI is the natural log of the consumer sentiment index (CSI), lnCPI is the natural log of all items consumer price index (CPI), lnISEQ is the natural log of the Irish Stock Market Index (ISEQ), and lnemp is the natural log of numbers employed.
Regression Output – Multivariate Model of House Price Index ARIMA regression
Sample: 540 - 686 Number of obs = 147
Wald chi2(5) = 2995.54
Log likelihood = 245.6182 Prob > chi2 = 0.0000
-------------------------------------------------------------------------------------------
| OPG
lnRPPI_rev | Coef. Std. Err. z P>|z| [95% Conf. Interval]
------------------+------------------------------------------------------------------------
lnRPPI_rev |
lniseq | -.0919442 .0248339 -3.70 0.000 -.1406178 -.0432706
lnemp | 4.899447 .1409176 34.77 0.000 4.623254 5.175641
lncsi | -.0807707 .030277 -2.67 0.008 -.1401125 -.021429
lncpi | -3.034468 .1112633 -27.27 0.000 -3.25254 -2.816395
cons | -17.64961 1.094942 -16.12 0.000 -19.79565 -15.50356
------------------+------------------------------------------------------------------------
ARMA12 |
ar |
L1. | .1115462 .0966245 1.15 0.248 -.0778343 .3009268
------------------+------------------------------------------------------------------------
sigma | .0454876 .0033795 13.46 0.000 .0388639 .0521114
-------------------------------------------------------------------------------------------
Source: Indecon analysis
However, our assessment is that this and other models including structural variables did not provide better results compared with the univariate model where the key indicator of overall economic progress were the lagged dependent variable values along with the changes in employment.

3 │ Impact on Property Prices
Indecon International Economic Consultants
Indecon Impact Assessment of the Help to Buy Tax Incentive
25
AIC and BIC Akaike's information criterion and Bayesian information criterion
-------------------------------------------------------------------------------------------
Model | Obs ll(null) ll(model) df AIC BIC
-------------+-----------------------------------------------------------------------------
1 | 149 . 526.901 4 -1045.802 -1033.786
2 | 147 . 245.6182 7 -477.2365 -456.3034
Source: Indecon analysis
The CSO also provides monthly data on average prices cross tabulated by new and existing dwellings and by buyer type from 2010. It is useful to investigate the relationship between the price of newly constructed properties and the price of existing properties. The dependent variable in the regression below is the natural log (i.e. percentage change) of the average price first-time buyers pay for new properties. The natural log (i.e. percentage change) of the average price first-time buyers pay for existing properties is included as an explanatory variable. We include a variable capturing the unemployment rate in the economy, as suggested by our model selection procedure. We add quarter dummies to control for seasonal effects, as these are more evident in the average series than in the index. A dummy for 2017 (indicating the timing of the HTB measures) is included among the regressors.
The results suggest that prices for new homes for FTBs are likely to change more slowly than existing properties. The 2017 dummy is insignificant, indicating there was no significant change in the relationship between average prices for FTB of new properties and average prices for FTB of existing properties after the introduction of HTB. However, we cannot exclude the possibility that the scheme had an impact on the price of both new and existing dwellings for FTBs, which would not be captured in this regression. We also believe the scheme is likely to have made new dwellings more attractive to FTBs.
Figure 3.8: Regression Output – Multivariate Model of Average Price of New Dwellings (First-Time Buyer)
Source | SS df MS Number of obs = 89
-------------+---------------------------------- F(6, 82) = 87.20
Model | 2.70764562 6 .45127427 Prob > F = 0.0000
Residual | .424344796 82 .005174937 R-squared = 0.8645
-------------+---------------------------------- Adj R-squared = 0.8546
Total | 3.13199041 88 .0355908 Root MSE = .07194
------------------------------------------------------------------------------
lnp_ftb_new | Coef. Std. Err. t P>|t| [95% Conf. Interval]
-------------+----------------------------------------------------------------
d_2017 | -.0291421 .0405056 -0.72 0.474 -.1097208 .0514365
lnp_ftb_old | .8935396 .0799648 11.17 0.000 .7344641 1.052615
lnunempr | -.4285199 .0367793 -11.65 0.000 -.5016856 -.3553541
q2 | .0235323 .0210409 1.12 0.267 -.0183247 .0653893
q3 | -.0331763 .0221657 -1.50 0.138 -.0772709 .0109182
q4 | -.0038771 .0220705 -0.18 0.861 -.0477823 .0400282
_cons | 2.411146 1.010093 2.39 0.019 .4017495 4.420543
------------------------------------------------------------------------------
Source: Indecon analysis
As a further approach to our econometric study of property prices, Indecon utilised the Property Price Register (PPR) database. This database has several advantages over the previous data, which used aggregate price indices or average prices by month. The PPR database records the precise transaction price, the transaction date, and whether the dwelling is a new or existing dwelling unit. As of 24 June 2017, the dataset is available from 1 Jan 2010 to mid-June 2017. We also note the HTB

3 │ Impact on Property Prices
Indecon International Economic Consultants
Indecon Impact Assessment of the Help to Buy Tax Incentive
26
scheme only concerns newly built dwellings with purchasing price less than €500,000. If the policy had a significant impact on prices, and controlling for time trends and other factors, there may be a difference in price between newly built and existing dwellings after 2017 for price values below €500,000 but no difference in more expensive dwellings. To examine this, we ran three separate regressions, dividing the database into three price categories:
Properties with sale price lower than €250,000 (within HTB scheme);
Properties with sale price between €250,000 and €500,000 (within HTB scheme); and
Properties with sale price higher than €500,000 (outside HTB scheme).
We split transactions within the HTB price range in two categories to allow for asymmetries in the relationship with the other variables, which could spuriously affect the results. In addition, in each regression we control for the following factors:
The county where building is located (geographical dummies);
The month of the year when transaction was closed (seasonal dummies);
A time trend;
A price Index of ordinary stocks and shares;
The price level; and
The unemployment rate.
We also adjust for serial correlation in the errors by including lags of residuals.
The estimates for properties with a transaction price below €250,000 are shown in the figure below. Geographical and seasonal dummies are not shown but are controlled for in the estimation. The figure shows that, keeping constant the other variables, there is a break in 2017 for property prices in the €0-€250,000 range during the period considered (2010-2017).
Figure 3.9: Regression Output – Multivariate Model of Property Prices from Property Price Register, <€250,000
Source | SS df MS Number of obs = 182,259
-------------+---------------------------------- F(48, 182210) = 861.50
Model | 13518.967 48 281.645147 Prob > F = 0.0000
Residual | 59568.8297 182,210 .326924042 R-squared = 0.1850
-------------+---------------------------------- Adj R-squared = 0.1848
Total | 73087.7968 182,258 .401012832 Root MSE = .57177
------------------------------------------------------------------------------
lnp | Coef. Std. Err. t P>|t| [95% Conf. Interval]
-------------+----------------------------------------------------------------
|
td | -.006758 .0004476 -15.10 0.000 -.0076353 -.0058806
d_new | .076711 .0040161 19.10 0.000 .0688395 .0845826
d_2017 | -.0321766 .0088629 -3.63 0.000 -.0495476 -.0148055
d_new_2017 | .0818905 .0177887 4.60 0.000 .047025 .1167561
td_2 | 1.71e-07 1.14e-08 14.95 0.000 1.48e-07 1.93e-07
lniseq | .0670609 .0256848 2.61 0.009 .0167192 .1174026
lncpi | 336.2888 73.43123 4.58 0.000 192.3653 480.2123
lncpi_2 | -36.84637 7.979672 -4.62 0.000 -52.48634 -21.20639
lnunempr | -.034202 .064965 -0.53 0.599 -.1615319 .0931278
|
eh1 |
L1. | .0552538 .0018675 29.59 0.000 .0515936 .058914
L2. | .0401162 .001868 21.48 0.000 .036455 .0437773
L3. | .0366378 .0018683 19.61 0.000 .032976 .0402996
|
_cons | -689.5589 167.9313 -4.11 0.000 -1018.7 -360.4174
------------------------------------------------------------------------------
Source: Indecon analysis

3 │ Impact on Property Prices
Indecon International Economic Consultants
Indecon Impact Assessment of the Help to Buy Tax Incentive
27
We note that the coefficient estimate that is most of interest is the d_new_2017 variable. This variable is the interaction of the dummy variables for ‘new’ and ‘2017’. This coefficient is akin to the ‘treatment’ effect in a so-called difference-in-differences model. The interpretation is that the treatment is identified, as it is independent of the assumed constant time trend. For the price band strata below €250k, the effect of being a new dwelling and in 2017 indicates an 8% rise in prices independent of the other trends and factors. This rise could be due to measurement issues or to a variety of factors that are correlated with 2017, including changes in loan-to-value rules, or other factors not accounted for by the lags, the unemployment rate, the CPI, or the ISEQ.
The following table shows the result of a similar regression on dwellings in the price range covered by the scheme: between €250,000 and €500,000. We find no statistical difference in price after 2017 for both new and existing dwellings in this price range.
Figure 3.10: Regression Output – Multivariate Model of Property Prices from Property Price Register, €250,000-€500,000
Source | SS df MS Number of obs = 53,748
-------------+---------------------------------- F(47, 53700) = 34.82
Model | 57.241846 47 1.21791162 Prob > F = 0.0000
Residual | 1878.3764 53,700 .034979076 R-squared = 0.0296
-------------+---------------------------------- Adj R-squared = 0.0287
Total | 1935.61825 53,747 .036013512 Root MSE = .18703
------------------------------------------------------------------------------
lnp | Coef. Std. Err. t P>|t| [95% Conf. Interval]
-------------+----------------------------------------------------------------
td | -.0007907 .0002766 -2.86 0.004 -.0013328 -.0002486
d_new | -.0381152 .0023939 -15.92 0.000 -.0428073 -.033423
d_2017 | -.0041396 .0049331 -0.84 0.401 -.0138085 .0055293
d_new_2017 | -.0008551 .0065836 -0.13 0.897 -.013759 .0120488
td_2 | 1.97e-08 7.05e-09 2.80 0.005 5.90e-09 3.35e-08
lniseq | .0156943 .0153841 1.02 0.308 -.0144587 .0458474
lncpi | -56.55855 42.93211 -1.32 0.188 -140.7058 27.58873
lncpi_2 | 6.280918 4.662924 1.35 0.178 -2.858451 15.42029
lnunempr | .007757 .037872 0.20 0.838 -.0664724 .0819864
|
eh1_lt500 |
L1. | -.0049536 .0010548 -4.70 0.000 -.007021 -.0028862
L2. | -.0015486 .0010495 -1.48 0.140 -.0036057 .0005085
|
_cons | 147.6597 98.04207 1.51 0.132 -44.50358 339.8229
------------------------------------------------------------------------------
Source: Indecon analysis
Interestingly, the d_new_2017 variable is not significant in this regression.
Finally, we estimated the same equation on dwellings above €500,000, which are outside the scope of the HTB scheme. Results shown in the next figure suggest that prices of existing dwellings in this price range fell about 9% due to the treatment of being ‘new’ and ‘in 2017’.

3 │ Impact on Property Prices
Indecon International Economic Consultants
Indecon Impact Assessment of the Help to Buy Tax Incentive
28
Figure 3.11: Regression Output – Multivariate Model of Property Prices from Property Price Register, >€500,000
Source | SS df MS Number of obs = 15,313
-------------+---------------------------------- F(46, 15266) = 4.27
Model | 40.9347185 46 .889885184 Prob > F = 0.0000
Residual | 3181.73027 15,266 .208419381 R-squared = 0.0127
-------------+---------------------------------- Adj R-squared = 0.0097
Total | 3222.66499 15,312 .210466627 Root MSE = .45653
------------------------------------------------------------------------------
lnp | Coef. Std. Err. t P>|t| [95% Conf. Interval]
-------------+----------------------------------------------------------------
td | .0012088 .0012662 0.95 0.340 -.0012731 .0036906
d_new | -.0749445 .0125444 -5.97 0.000 -.0995331 -.050356
d_2017 | .0202977 .0222953 0.91 0.363 -.0234038 .0639991
d_new_2017 | -.0883576 .0360396 -2.45 0.014 -.1589996 -.0177157
td_2 | -3.01e-08 3.23e-08 -0.93 0.351 -9.33e-08 3.32e-08
lniseq | -.0856078 .0701499 -1.22 0.222 -.2231099 .0518943
lncpi | -275.5938 207.6126 -1.33 0.184 -682.5393 131.3517
lncpi_2 | 30.02751 22.54824 1.33 0.183 -14.16972 74.22474
lnunempr | -.0466985 .1792399 -0.26 0.794 -.39803 .3046331
|
eh1_gt500 |
L1. | .0080264 .0044244 1.81 0.070 -.0006458 .0166987
|
_cons | 634.6405 474.5477 1.34 0.181 -295.5297 1564.811
------------------------------------------------------------------------------
Source: Indecon analysis
The econometric results are sensitive to the model and data selection. Time series estimation suggested that no significant changes in 2017 occurred. Other models suggested the relationship between average prices for FTB between new dwellings and existing dwellings did not change in 2017. However, the results when using the PPR transaction data suggested an increase in price associated with sales occurring in 2017 and a property being new. However, given the data limitations and the limited period of recorded transactions since the scheme was introduced, caution should be exercised in interpreting the results.
Development in Irish Residential Property Prices
In assessing the extent to which the HTB incentive has or has not impacted on property prices, it is useful in addition to the econometric modelling to complete a descriptive analysis of available data on changes in prices of Irish housing. The following table shows the RPPI for properties and apartments since the beginning of 2016. This shows upward pressure on the price of housing.

3 │ Impact on Property Prices
Indecon International Economic Consultants
Indecon Impact Assessment of the Help to Buy Tax Incentive
29
Figure 3.12: Monthly Property Price Index Since 2016
Source: CSO Data
The table below contains a breakdown by region. It is evident from the table that prices increased significantly in all areas in 2016, although prices have not yet returned to the levels evident in 2005.
Table 3.6: Dwelling Price Index by Region
Dublin Border
excluding Louth
Midland West Mid-East including
Louth
Mid-West including
South Tipperary
2016 M01 87.0 60.8 67.1 65.9 87.0 66.4
2016 M02 86.4 59.1 66.5 66.8 87.2 66.6
2016 M03 86.6 59.3 66.8 65.8 87.2 66.2
2016 M04 87.1 59.9 67.7 67.3 87.2 66.4
2016 M05 86.8 60.6 68.2 67.6 87 66.1
2016 M06 87.0 61.0 68.8 69.4 87.6 67.6
2016 M07 88.1 61.2 70.1 70.9 89.0 69.4
2016 M08 89.4 61.6 70.6 72.1 90.0 71.0
2016 M09 90.8 62.2 72.3 72.6 91.1 71.7
2016 M10 91.0 62.5 73.9 73.5 92.8 71.6
2016 M11 92.1 63.4 73.9 74.9 94.3 73.3
2016 M12 91.5 63.6 74.2 75.6 95.2 73.0
2017 M01 92.0 64.2 74.1 76.7 95.7 73.0
2017 M02 92.2 66.3 73.8 77.6 96.8 72.9
2017 M03 92.8 66.0 75.7 76.6 97.1 72.4
2017 M04 92.1 65.9 77.0 77.9 98.2 72.7
2017 M05 94.7 66.8 76.5 77.6 97.7 73.0
2017 M06 96.7 67.5 79.0 76.9 98.2 73.3 Source: CSO Data: Base 100 – January 2005

3 │ Impact on Property Prices
Indecon International Economic Consultants
Indecon Impact Assessment of the Help to Buy Tax Incentive
30
The trends in the average new dwelling sale prices over the period 2012 – 2017 are presented in the next table. The data shows very significant regional variance, and average prices in some counties, including Dublin, were lower in the period January to June 2017 than for the average of 2016. This, however, may reflect composition changes as well as seasonal factors.
Table 3.7: Average New Dwelling Sale Prices
2012 2013 2014 2015 2016 2017
Carlow 128,112 128,828 131,047 163,135 200,596 168,853
Cavan 146,592 92,808 81,345 95,157 113,683 106,166
Clare 207,268 141,013 128,521 127,580 135,148 155,184
Cork 193,748 187,833 180,437 189,182 224,923 259,053
Donegal 135,185 110,096 101,065 133,487 142,460 154,669
Dublin 257,618 235,855 294,097 339,590 415,849 390,374
Galway 168,900 141,699 129,104 137,133 163,502 189,887
Kerry 179,087 147,140 132,734 151,407 158,556 197,378
Kildare 218,429 212,508 253,360 280,292 308,759 294,256
Kilkenny 145,080 144,173 142,387 171,372 227,713 235,282
Laois 111,335 96,345 98,989 118,386 154,100 168,667
Leitrim 99,869 87,488 82,958 112,915 113,024 114,931
Limerick 170,535 181,824 125,875 152,950 170,057 200,789
Longford 120,765 82,874 81,109 73,781 96,068 161,099
Louth 200,176 141,799 144,785 153,353 209,715 240,395
Mayo 141,014 95,964 102,250 108,396 107,179 137,150
Meath 174,930 205,815 193,009 253,120 252,115 270,346
Monaghan 151,367 115,896 108,513 123,792 179,032 117,837
Offaly 114,605 111,763 94,564 100,095 105,374 146,100
Roscommon 115,624 83,768 83,986 84,027 85,683 104,488
Sligo 109,308 106,312 114,815 148,520 144,099 137,202
Tipperary 171,081 119,215 119,686 148,927 139,332 152,329
Waterford 147,429 135,036 129,178 157,675 168,604 213,866
Westmeath 123,171 123,606 121,359 104,944 153,079 153,085
Wexford 142,195 119,616 138,117 132,135 152,858 167,339
Wicklow 250,324 195,795 226,328 261,108 344,818 374,032
All Counties 187,032 171,887 185,803 219,939 273,167 298,959 Source: CSO Data Note: 2017 figure based on average from January to June 2017. Based on Filings, All Sale Types.
The next table presents the percentage change in the average prices by quarter for new homes and existing dwellings. The price of new homes has increased in each quarter from Q4 2015 compared to the previous quarter. Average property prices of new homes increased by 7.8% in 2016 Q2 and by 6.8% in Q3 while showing slower growth in the last quarter of 2016, possibly reflecting seasonal factors. In the first quarter of 2017, average prices increased by 1.1% and by 4.9% in the second quarter.
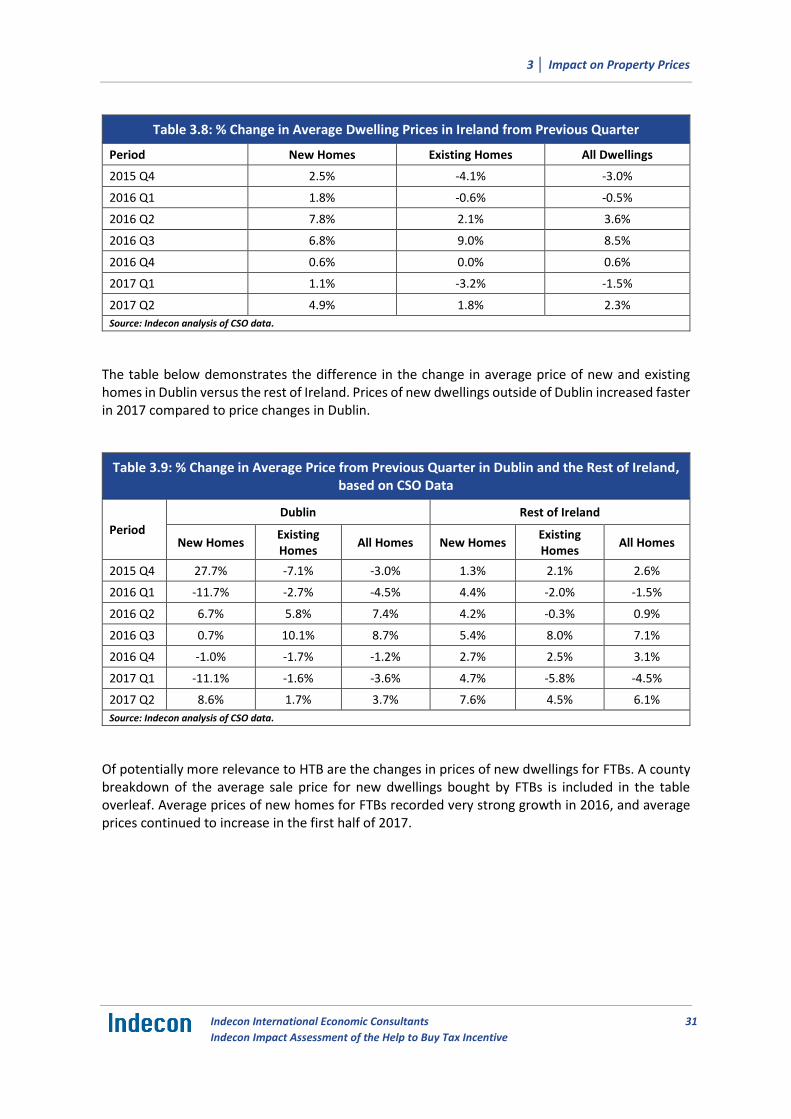
3 │ Impact on Property Prices
Indecon International Economic Consultants
Indecon Impact Assessment of the Help to Buy Tax Incentive
31
Table 3.8: % Change in Average Dwelling Prices in Ireland from Previous Quarter
Period New Homes Existing Homes All Dwellings
2015 Q4 2.5% -4.1% -3.0%
2016 Q1 1.8% -0.6% -0.5%
2016 Q2 7.8% 2.1% 3.6%
2016 Q3 6.8% 9.0% 8.5%
2016 Q4 0.6% 0.0% 0.6%
2017 Q1 1.1% -3.2% -1.5%
2017 Q2 4.9% 1.8% 2.3%
Source: Indecon analysis of CSO data.
The table below demonstrates the difference in the change in average price of new and existing homes in Dublin versus the rest of Ireland. Prices of new dwellings outside of Dublin increased faster in 2017 compared to price changes in Dublin.
Table 3.9: % Change in Average Price from Previous Quarter in Dublin and the Rest of Ireland, based on CSO Data
Period Dublin Rest of Ireland
New Homes Existing Homes
All Homes New Homes Existing Homes
All Homes
2015 Q4 27.7% -7.1% -3.0% 1.3% 2.1% 2.6%
2016 Q1 -11.7% -2.7% -4.5% 4.4% -2.0% -1.5%
2016 Q2 6.7% 5.8% 7.4% 4.2% -0.3% 0.9%
2016 Q3 0.7% 10.1% 8.7% 5.4% 8.0% 7.1%
2016 Q4 -1.0% -1.7% -1.2% 2.7% 2.5% 3.1%
2017 Q1 -11.1% -1.6% -3.6% 4.7% -5.8% -4.5%
2017 Q2 8.6% 1.7% 3.7% 7.6% 4.5% 6.1%
Source: Indecon analysis of CSO data.
Of potentially more relevance to HTB are the changes in prices of new dwellings for FTBs. A county breakdown of the average sale price for new dwellings bought by FTBs is included in the table overleaf. Average prices of new homes for FTBs recorded very strong growth in 2016, and average prices continued to increase in the first half of 2017.
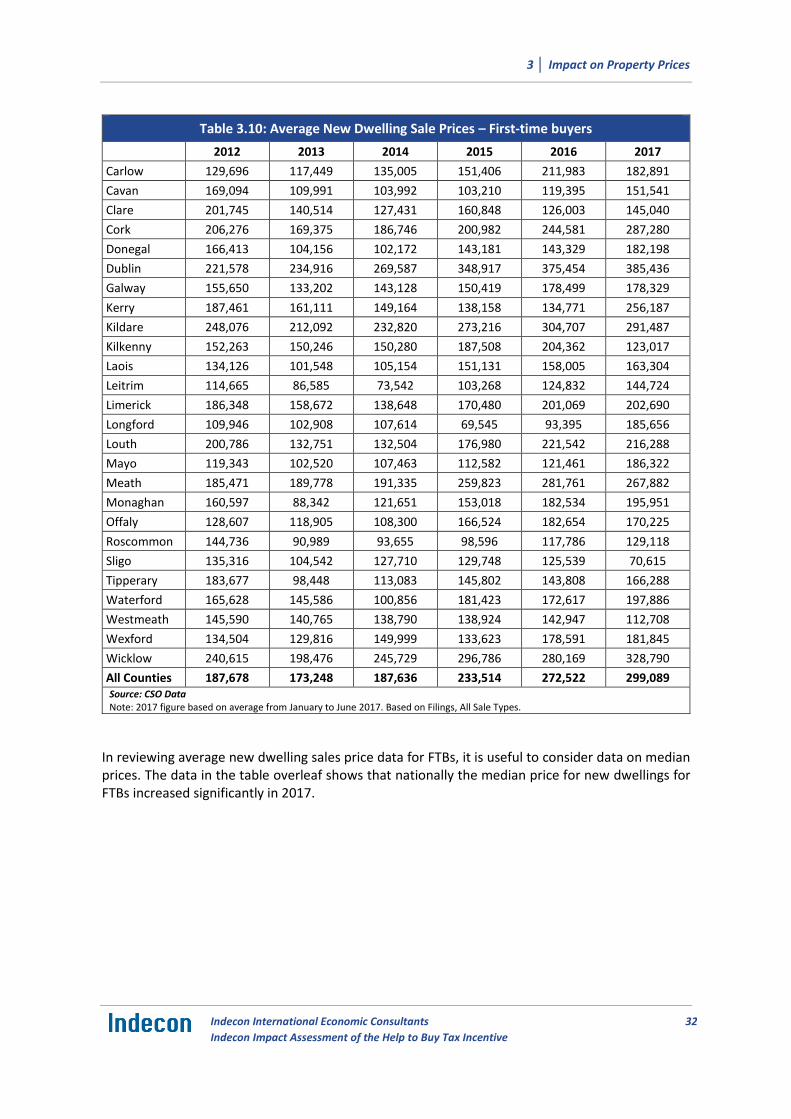
3 │ Impact on Property Prices
Indecon International Economic Consultants
Indecon Impact Assessment of the Help to Buy Tax Incentive
32
Table 3.10: Average New Dwelling Sale Prices – First-time buyers
2012 2013 2014 2015 2016 2017
Carlow 129,696 117,449 135,005 151,406 211,983 182,891
Cavan 169,094 109,991 103,992 103,210 119,395 151,541
Clare 201,745 140,514 127,431 160,848 126,003 145,040
Cork 206,276 169,375 186,746 200,982 244,581 287,280
Donegal 166,413 104,156 102,172 143,181 143,329 182,198
Dublin 221,578 234,916 269,587 348,917 375,454 385,436
Galway 155,650 133,202 143,128 150,419 178,499 178,329
Kerry 187,461 161,111 149,164 138,158 134,771 256,187
Kildare 248,076 212,092 232,820 273,216 304,707 291,487
Kilkenny 152,263 150,246 150,280 187,508 204,362 123,017
Laois 134,126 101,548 105,154 151,131 158,005 163,304
Leitrim 114,665 86,585 73,542 103,268 124,832 144,724
Limerick 186,348 158,672 138,648 170,480 201,069 202,690
Longford 109,946 102,908 107,614 69,545 93,395 185,656
Louth 200,786 132,751 132,504 176,980 221,542 216,288
Mayo 119,343 102,520 107,463 112,582 121,461 186,322
Meath 185,471 189,778 191,335 259,823 281,761 267,882
Monaghan 160,597 88,342 121,651 153,018 182,534 195,951
Offaly 128,607 118,905 108,300 166,524 182,654 170,225
Roscommon 144,736 90,989 93,655 98,596 117,786 129,118
Sligo 135,316 104,542 127,710 129,748 125,539 70,615
Tipperary 183,677 98,448 113,083 145,802 143,808 166,288
Waterford 165,628 145,586 100,856 181,423 172,617 197,886
Westmeath 145,590 140,765 138,790 138,924 142,947 112,708
Wexford 134,504 129,816 149,999 133,623 178,591 181,845
Wicklow 240,615 198,476 245,729 296,786 280,169 328,790
All Counties 187,678 173,248 187,636 233,514 272,522 299,089 Source: CSO Data Note: 2017 figure based on average from January to June 2017. Based on Filings, All Sale Types.
In reviewing average new dwelling sales price data for FTBs, it is useful to consider data on median prices. The data in the table overleaf shows that nationally the median price for new dwellings for FTBs increased significantly in 2017.

3 │ Impact on Property Prices
Indecon International Economic Consultants
Indecon Impact Assessment of the Help to Buy Tax Incentive
33
Table 3.11: Median New Dwelling Sale Prices – First-time buyers
2012 2013 2014 2015 2016 2017
Carlow 129,899 111,990 136,859 156,976 211,429 181,763
Cavan 172,706 94,593 106,081 98,400 117,825 155,954
Clare 198,856 129,809 129,338 150,346 113,153 163,349
Cork 188,330 162,608 186,964 196,023 244,373 287,101
Donegal 163,458 97,346 94,799 147,879 134,742 181,640
Dublin 199,539 208,413 244,030 311,217 342,054 348,880
Galway 154,506 124,218 139,006 132,263 175,164 156,518
Kerry 185,403 161,369 140,174 142,171 134,058 258,854
Kildare 249,088 210,908 229,638 276,398 307,930 310,930
Kilkenny 150,348 148,321 138,353 180,343 204,362 116,548
Laois 127,406 93,614 98,721 153,670 159,133 151,907
Leitrim 119,783 84,794 73,350 90,420 124,832 144,724
Limerick 194,701 151,159 124,996 175,398 208,033 220,560
Longford 113,928 99,894 103,842 69,037 93,726 185,656
Louth 199,832 121,992 126,104 165,600 218,921 221,554
Mayo 125,667 96,628 105,627 110,835 114,367 189,220
Meath 197,977 186,041 185,053 261,725 264,970 267,365
Monaghan 150,397 82,095 119,718 150,720 178,690 198,025
Offaly 120,895 113,848 108,505 166,524 182,289 170,225
Roscommon 143,158 87,233 85,461 91,060 119,375 129,118
Sligo 133,304 98,361 119,473 125,984 124,627 70,615
Tipperary 173,705 105,818 110,433 146,976 139,858 178,122
Waterford 165,686 145,516 100,871 183,511 171,283 188,925
Westmeath 147,424 137,084 132,143 134,201 142,623 98,375
Wexford 131,379 125,146 145,359 130,456 176,089 172,037
Wicklow 217,157 196,511 245,868 292,068 276,438 297,831
All Counties 175,491 152,884 171,548 215,208 261,520 289,058 Source: CSO Data Note: 2017 figure based on median from January to June 2017. Based on Filings, All Sale Types.
The following figure depicts data on asking prices from Daft.ie, breaking them down into three categories: national, Dublin and non-Dublin. The figure shows that the average asking price in Dublin on Daft.ie is higher than the national average. Asking prices in Dublin grew from €312,642 in Q1 2016 to €352,975 in Q2 2017. National property prices, as well as asking prices from outside Dublin, grew in each quarter reaching €240,093 nationally and €192,369 outside Dublin in Q2 2017.

3 │ Impact on Property Prices
Indecon International Economic Consultants
Indecon Impact Assessment of the Help to Buy Tax Incentive
34
Figure 3.13: Average Asking Prices
Source: Daft.ie Data
Indecon examined if there was up-to-date data on new versus second hand average prices from Daft.ie. While the price data was not available by age, a new development variable is included as a control in hedonic regression completed by Professor Ronan Lyons of TCD. The next chart presents the coefficient in that variable for each of the five regions since 2015. The results do not appear to indicate upward pressure in Dublin/Leinster in recent quarters, although, there is a different picture for some other regions.
Figure 3.14: Regression Coefficient for New Residential Developments by Region
Source: Estimates provided to Indecon in July 2017 by Professor Ronan Lyons, Trinity College, Dublin.
-
50,000
100,000
150,000
200,000
250,000
300,000
350,000
400,000
Q1 2016 Q2 2016 Q3 2016 Q4 2016 Q1 2017 Q2 2017
Ave
rage
Ask
ing
Pri
ce (€
)
National Dublin Ex-Dublin
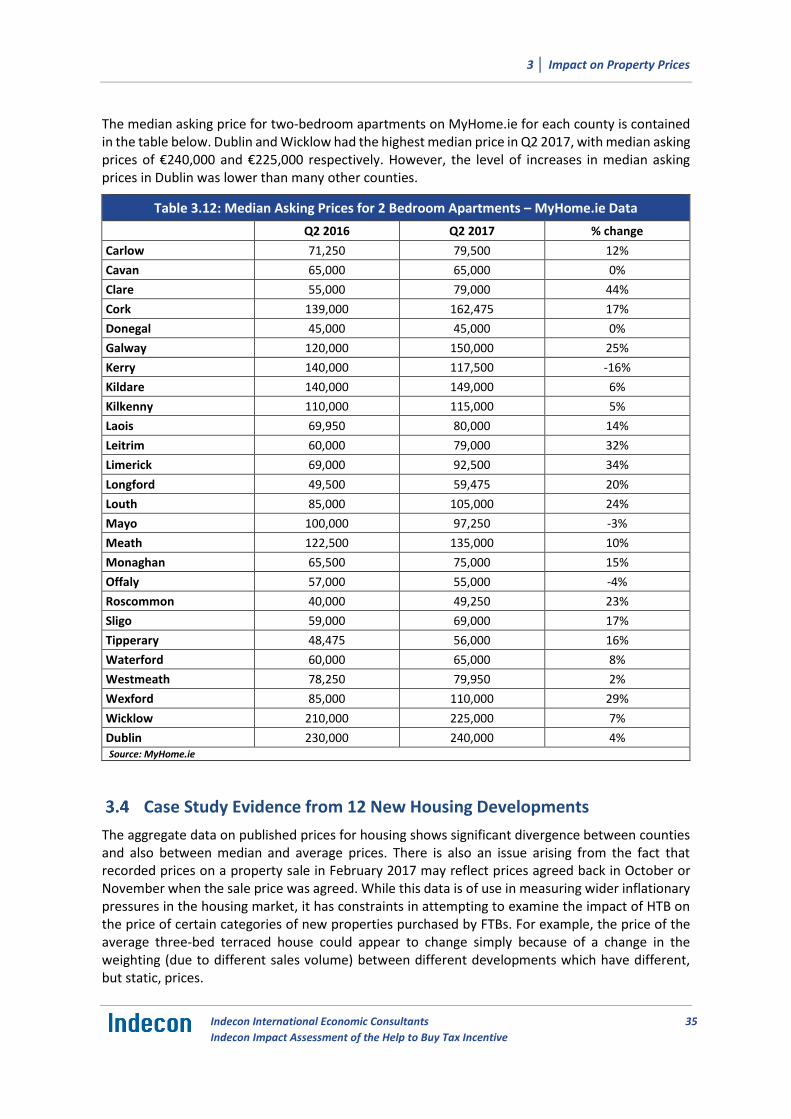
3 │ Impact on Property Prices
Indecon International Economic Consultants
Indecon Impact Assessment of the Help to Buy Tax Incentive
35
The median asking price for two-bedroom apartments on MyHome.ie for each county is contained in the table below. Dublin and Wicklow had the highest median price in Q2 2017, with median asking prices of €240,000 and €225,000 respectively. However, the level of increases in median asking prices in Dublin was lower than many other counties.
Table 3.12: Median Asking Prices for 2 Bedroom Apartments – MyHome.ie Data
Q2 2016 Q2 2017 % change
Carlow 71,250 79,500 12%
Cavan 65,000 65,000 0%
Clare 55,000 79,000 44%
Cork 139,000 162,475 17%
Donegal 45,000 45,000 0%
Galway 120,000 150,000 25%
Kerry 140,000 117,500 -16%
Kildare 140,000 149,000 6%
Kilkenny 110,000 115,000 5%
Laois 69,950 80,000 14%
Leitrim 60,000 79,000 32%
Limerick 69,000 92,500 34%
Longford 49,500 59,475 20%
Louth 85,000 105,000 24%
Mayo 100,000 97,250 -3%
Meath 122,500 135,000 10%
Monaghan 65,500 75,000 15%
Offaly 57,000 55,000 -4%
Roscommon 40,000 49,250 23%
Sligo 59,000 69,000 17%
Tipperary 48,475 56,000 16%
Waterford 60,000 65,000 8%
Westmeath 78,250 79,950 2%
Wexford 85,000 110,000 29%
Wicklow 210,000 225,000 7%
Dublin 230,000 240,000 4% Source: MyHome.ie
Case Study Evidence from 12 New Housing Developments
The aggregate data on published prices for housing shows significant divergence between counties and also between median and average prices. There is also an issue arising from the fact that recorded prices on a property sale in February 2017 may reflect prices agreed back in October or November when the sale price was agreed. While this data is of use in measuring wider inflationary pressures in the housing market, it has constraints in attempting to examine the impact of HTB on the price of certain categories of new properties purchased by FTBs. For example, the price of the average three-bed terraced house could appear to change simply because of a change in the weighting (due to different sales volume) between different developments which have different, but static, prices.

3 │ Impact on Property Prices
Indecon International Economic Consultants
Indecon Impact Assessment of the Help to Buy Tax Incentive
36
Similarly, the price of a three-bed end-of-terrace house would likely be different than a mid-terrace house and so any changes in composition even within the same development might give misleading information on inflationary pressures where there are only a small number of new house sales.
As noted earlier, there are also constraints in using official price data to attempt to measure any impacts for a measure such as HTB which has only been in operation since January, as many transactions assisted by HTB are unlikely as yet to be captured in published figures on the price of completed transactions.
To address these issues, what is required is information on actual sale prices agreed over the past number of months for the same house in the same development. To attempt to obtain detailed evidence on what inflationary pressures have existed in recent new house sales, Indecon liaised with a number of leading auctioneering firms who are actively involved in the selling of new residential properties as well as with one of the largest new home builders.
We designed a detailed request to obtain price changes for the same type of house in specified developments. Very detailed micro information was obtained from 12 different housing sites which accounted for over 1,200 new house sales over the period from the third quarter of 2015 until the second quarter of 2017. All 12 housing sites are being built by HTB-eligible contractors. This data provides a very useful source of micro data which provides evidence on inflation in new property prices in recent months.
Using this evidence, we examined the average price of new houses at each site in different quarters; categorised on the basis of house types, viz. three-bed detached house, three-bed semi-detached house, three-bed terrace house, three-bed end terrace house, etc. This allowed us to track the growth (% change) in the average price of a given house type within a specific housing development.
The majority of houses in the property auctioneer micro dataset had average sales prices in the range of €300k-€350k price category, followed by houses with sale prices in the €250k-€300k range. The highest number of sales was reported during the first quarter of 2017. Relatively few houses were sold in the price ranges above €400k and below €250k.
Table 3.13: Annual Sales by Price Category (€'000), 2016-2017
200-250 250-300 300-350 350-400 400-450 450-500 500+ Total
2016 55 187 238 94 11 0 0 585
2017 30 167 305 51 32 16 1 602
Total 99 379 563 158 43 16 1 1,259
Source: Indecon analysis of property auctioneer data.
The number of sales agreed as a share of total annual sales is shown in the following table, where houses are disaggregated on the basis of their types. Of the houses sold in 2016 and in 2017, the highest share were three-bed terrace houses of various types, followed by three-bed semi-detached houses. In each year, less than 1% of houses sold were three-bed detached houses.

3 │ Impact on Property Prices
Indecon International Economic Consultants
Indecon Impact Assessment of the Help to Buy Tax Incentive
37
Table 3.14: No. of Sales Agreed as a Share ot Total Annual Sales, by House Type, 2016-2017
3-Bed Detached
House
3-Bed Semi-
Detached
3-Bed Terrace
(not specified)
3-Bed End
Terrace
3-Bed Mid
Terrace
3-Bed Other (not specified)
4-Bed (not specified)
2016 0.3% 17.2% 26.0% 8.3% 14.3% 19.3% 14.6%
2017 0.5% 27.8% 23.5% 8.2% 15.4% 9.4% 15.2% Source: Indecon analysis of property auctioneer data
Given that three-bed semi-detached and three-bed terrace houses account for the majority of sales in the property auctioneer micro dataset, it is useful to examine evidence on these categories in more detail. Indicative prices for new three-bed semi-detached houses over the period Q3 2015 to Q2 2017 are shown in the table below. Prices are shown only for periods in which sales for this house type are reported. Over the period, average prices at the site-level for this house type ranged from a minimum of €239,000 at a site in the second quarter of 2016 to a maximum of €370,000 at a site in the first quarter of 2017.
Table 3.15: Indicative Prices for New 3-Bed Semi-Detached Houses
2015 Q3 2015 Q4 2016 Q1 2016 Q2 2016 Q3 2016 Q4 2017 Q1 2017 Q2
Min €280,000 €285,000 €285,000 €239,000 €285,000 €290,000 €248,125 €290,000
Max €325,000 €325,000 €328,750 €325,000 €360,000 €345,000 €370,000 €334,524
Median Price €302,500 €305,000 €325,000 €320,000 €317,917 €324,286 €317,446 €318,374
Source: Indecon analysis of property auctioneer data.
The average growth rate in the price of new three-bed semi-detached houses across all sites is presented in following table. In other words, we calculated the growth (% change) in the average price for new three-bed semi-detached houses for each site. The figures in the table below indicate the average of the quarterly growths across all sites. The average growth in site-level prices reduced by 0.9% from Q1 2016 to Q2 2016 but increased in all other quarters in which sales were reported.
Table 3.16: Average of Site-Level Growth Rates of New 3-Bed Semi-Detached Houses
2015 Q4 2016 Q1 2016 Q2 2016 Q3 2016 Q4 2017 Q1 2017 Q2
Price Changes 0.9% 0.0% -0.9% 1.5% 2.9% 1.8% 0.0%
Source: Indecon analysis of property auctioneer data
Indicative sales prices of new three-bed terrace houses over the period is shown in the table below. Prices are shown only for periods in which sales for this house type are reported. Over the period, average prices at the site-level for this house type ranged from a minimum of €230,000 at a site in the third quarter of 2016 to a maximum of €433,333 at a site in the second quarter of 2017.

3 │ Impact on Property Prices
Indecon International Economic Consultants
Indecon Impact Assessment of the Help to Buy Tax Incentive
38
Table 3.17: Average of Site-Level Growth Rates of Prices for New 3-Bed Terrace Houses
(Not specified whether Mid-Terrace or End-Terrace)
2015 Q3 2016 Q2 2016 Q3 2016 Q4 2017 Q1 2017 Q2
Min €231,667 €230,714 €230,000 €274,778 €233,333 €310,956
Max €231,667 €318,500 €382,538 €384,933 €379,000 €433,333
Median Price €231,667 €274,607 €300,072 €303,879 €304,335 €330,000
Source: Indecon analysis of property auctioneer data.
The average growth rate in the price of new three-bed terrace across all sites is presented in the table below. In other words, we calculated the growth (% change) in the average price for new three-bed semi-detached houses for each site. The figures in the table below indicate the average of the quarterly growths across all sites. Site-level sales prices reduced, on average, by 0.5% from Q2 2016 to Q3 2016. However, site-level prices saw, on average, positive quarterly growth in each period after that, reaching an average growth of 5.8% from Q1 2017 to Q2 2017.
Table 3.18: Average of Site-Level Growth Rates of Price for New 3-Bed Terrace Houses
(Not specified whether Mid-Terrace or End-Terrace)
2016 Q3 2016 Q4 2017 Q1 2017 Q2
Average Price Change -0.5% 1.1% 1.7% 5.8%
Source: Indecon analysis of property auctioneer data
Indicative prices of new three-bed end terrace houses from Q3 2015 to Q2 2017 are shown in the following table. Prices are presented for periods in which sales were reported. Over the period, prices for this house type ranged from a minimum of €275,000 at a site in the third quarter of 2015 to a maximum of €350,000 at a site in the first quarter of 2017.
Table 3.19: Indicative Prices for New 3-Bed End Terrace Houses
2015 Q3 2015 Q4 2016 Q1 2016 Q2 2016 Q3 2016 Q4 2017 Q1 2017 Q2
Min €275,000 €275,000 €275,000 €280,000 €280,000 €280,000 €283,611 €285,000
Max €320,000 €320,000 €320,000 €322,500 €340,000 €327,500 €350,000 €340,000
Median Price €297,500 €297,500 €297,500 €311,563 €315,833 €304,867 €319,821 €314,642
Source: Indecon analysis of property auctioneer data.

3 │ Impact on Property Prices
Indecon International Economic Consultants
Indecon Impact Assessment of the Help to Buy Tax Incentive
39
The average growth rate in the price of new three-bed end terrace across all sites is presented in the table below. Average growth rates across all sites tended to be positive over the period.
Table 3.20: Average of Site-Level Growth Rates of Price for New 3-Bed End Terrace Houses
2015 Q4 2016 Q1 2016 Q2 2016 Q3 2016 Q4 2017 Q1 2017 Q2
Average Price Change 0.0% 0.0% 0.9% -0.1% 1.2% 0.5% 0.6%
Source: Indecon analysis of property auctioneer data.
Indicative sales prices of three-bed mid-terrace houses are shown in the table below. Sales prices for new three-bed mid-terrace houses ranged from €260,000 at a site in Q3 2015 to an average of €340,000 at a site in Q2 2017.
Table 3.21: Indicative Prices for New 3-Bed Mid-Terrace Houses
2015 Q3 2015 Q4 2016 Q1 2016 Q2 2016 Q3 2016 Q4 2017 Q1 2017 Q2
Min €260,000 €260,000 €260,000 €265,000 €265,000 €265,000 €270,000 €275,000
Max €285,000 €285,000 €285,000 €315,000 €325,000 €317,917 €336,250 €340,000
Median Price €272,500 €272,500 €272,500 €283,750 €295,000 €285,050 €295,683 €317,500
Source: Indecon analysis of property auctioneer data.
The average growth rate in the price of new three-bed mid-terrace houses across all sites was positive in each quarter from Q2 2016 to Q2 2017.
Table 3.22: Average of Site-Level Growth Rates of Price for New 3-Bed Mid-Terrace Houses
2015 Q4 2016 Q1 2016 Q2 2016 Q3 2016 Q4 2017 Q1 2017 Q2
Average Price Change 0.0% 0.0% 1.0% 0.9% 0.3% 3.9% 4.5%
Source: Indecon analysis of property auctioneer data.
Compiling the data for all new three-bed houses of all types shows that the average growth rates across all sites was positive for most quarters, except between Q3 and Q4 2016 which saw an average growth rate across all sites of -1.1%. However, the average growth rate across all sites was positive after that point, with an average of 4.6% from Q4 2016 to Q1 2017 and an average of 3.3% from Q1 2017 to Q2 2017.

3 │ Impact on Property Prices
Indecon International Economic Consultants
Indecon Impact Assessment of the Help to Buy Tax Incentive
40
Table 3.23: Unweighted Average of Site-Level Growth Rates of Price for All 3-Bed New Houses
2015 Q4 0.3%
2016 Q1 0.0%
2016 Q2 0.3%
2016 Q3 0.4%
2016 Q4 -1.1%
2017 Q1 4.6%
2017 Q2 3.3% Source: Indecon analysis of property auctioneer data
The average growth rate in prices across all sites for all new houses of all types is compiled in the table below. This data shows that the average growth rate across all sites and all houses types was positive or stayed the same from one quarter to the next over the period form Q3 2016 to Q2 2017. The average of the growth rates was highest in the most recent quarter (Q2 2017) at 2.9%.
Table 3.24: Unweighted Average of Site-Level Growth Rates of Price for All New Houses
Period Mid-
Terrace End-
Terrace Terrace
(unspecified) Semi-
Detached Detached Other All Types
2016 Q3 0.9% -0.1% -0.5% 0.8% 0.0% 9.7% 1.8%
2016 Q4 0.3% 4.1% 1.1% 3.9% 2.3% -6.9% 0.8%
2017 Q1 3.9% 0.2% 1.7% -0.9% 0.5% 8.3% 2.3%
2017 Q2 4.5% 0.3% 5.8% 0.5% - 3.5% 2.9%
Source: Indecon analysis of property auctioneer data
The availability of data on the number of sales agreed by site and quarter for some of the house types facilitated the calculation of the weighted average growth rate across sites, in which the average of the site-level growth rates is weighted by the number of sales that occurred at each site.
The weighted average of the site-level growth rates in the sales prices of all three-bed and four-bed houses is shown in the table overleaf. The average of the site-level growth rates across all house types was positive in each quarter. Indecon would note that the weighted data in the following table excludes sales by one of the auctioneering firms who did not provide us with sufficient data to estimating a weighting for that firm.
While the data from 12 new housing estates examined suggests that average growth rate in prices recorded in Q1 2017 were 2.3% and in Q2 2017 were 2.9%; when a weighted average figure is estimated, these growth rates are 2.3% in Q1 and 0.9% in Q2.

3 │ Impact on Property Prices
Indecon International Economic Consultants
Indecon Impact Assessment of the Help to Buy Tax Incentive
41
Table 3.25: Weighted Average of Site-Level Growth Rates of Price of All House Types
Period
3-Bed 4-Bed Other
All Types Detached
Semi-Detached
Terrace Other
End Terrace
Mid Terrace
Other
2016 Q3 - -2.1% -0.6% -0.7% 0.0% - 9.7% 0.0%
2016 Q4 4.6% 5.7% 1.1% 3.7% 0.9% -16.5% 2.4% 1.1%
2017 Q1 -0.5% 2.2% 2.7% -0.4% 5.9% 20.1% -6.7% 2.3%
2017 Q2 - -1.3% 3.1% 0.2% 0.6% 5.7% 1.2% 0.9%
Source: Indecon analysis of property auctioneer data
The property auctioneer micro dataset also included data on the average price per square foot for each house type on the site-level, allowing us to calculate the growth in the average price per square foot for a given house type in each development. This analysis of price per square foot takes account of changes in the size of new houses which may be a factor for changes in the overall prices of houses.
Following the same methodology used above, we calculate the weighted average of the growth rates in price per square foot of all three-bed and four-bed house types. The results are presented in the table below.
Table 3.26: Weighted Average of % Change in Price per Square Foot
Period
3-Bed 4-Bed Other
All Types Detached
Semi-Detached
Terrace Other
End Terrace
Mid Terrace
Other
2016 Q3 - -2.2% -0.5% -0.7% 0.0% - 6.0% -0.2%
2016 Q4 -8.6% 3.7% 2.4% 3.8% 0.8% -4.1% 2.1% 2.1%
2017 Q1 6.9% 2.4% 4.1% 1.5% 0.5% 22.0% -2.1% 2.7%
2017 Q2 - -0.9% -1.4% -0.2% -0.5% 4.4% 0.5% -0.4%
Source: Indecon analysis of property auctioneer data
Views of HTB Contractors
As part of the assessment of the HTB incentive, Indecon undertook a survey of the contractors approved under the scheme. Our analysis in May 2017 indicated that there were 262 contractors approved under the HTB Scheme. While it is necessary to caveat any survey evidence the views constitute supplementary material to our empirical analysis. Of these, Indecon were able to identify from public sources contact details for 201 contractors. A detailed survey was issued and completed responses were obtained from 55 contractors, representing a high response rate of 27.4%.

3 │ Impact on Property Prices
Indecon International Economic Consultants
Indecon Impact Assessment of the Help to Buy Tax Incentive
42
Contractors were asked to provide information on whether they had placed any new housing units on the market which would qualify for the HTB scheme and to indicate what changes, if any, have occurred in the price of these houses since the 1st of January 2017. The results indicate that 43% of respondents indicated that the price of the houses had increased while 57% indicated the price remained static.
Table 3.27: Price Changes Since 1 January 2017
Reduced Remained Static Increased
Percentage of Respondents 0% 57% 43%
Source: Indecon Survey of HTB Contractors
Indecon performed further detailed analysis of the survey responses regarding price changes since 1st January 2017 to any new houses which qualify for HTB. This analysis compared the responses among the developers according to firm size which was determined by the number of additional new housing units a firm expected to build over the next three years. A smaller proportion of the large-sized developers reported experiencing an increase in the price of these houses compared with the average of the entire sample, while a greater proportion of the medium-sized developers reported an increase in prices.
Table 3.28: Price Changes Since 1 January 2017, by Firm Size
Reduced Remained Static Increased
Small (<50 units) 0% 70% 30%
Medium (50-299 units) 0% 48% 52%
Large (300+ units) 0% 78% 22% Source: Indecon Survey of HTB Contractors Note: The definitions of the firm-size categories are based on the firms’ responses to the Indecon Survey of Housing Sector Stakeholders, which asked stakeholders to indicate the number of additional new housing units they expect to build over the next three years.
The contractors surveyed were asked to indicate the significance level they would attribute to various factors potentially influencing the price increases. More than half of respondents indicated that ‘changes in cost of construction’ were a very significant or significant factor driving price increases. ‘The impact of revised loan-to-value mortgage rules’ and ‘increased demand by FTBs’ were two factors of which a significant proportion of respondents indicated were very significant or significant. 45% of respondents said ‘the impact of the HTB scheme for FTBs’ was a very significant/significant factor, and 45% said it was neither significant nor insignificant. A further 10% said it was insignificant/very insignificant. Views were mixed on the significance of other factors including’ changes in land prices’, ‘relative return in other sectors of the property market’, and ‘increased demand by other owner occupiers’. ‘Increased demand by investors’ was seen as relatively less significant.
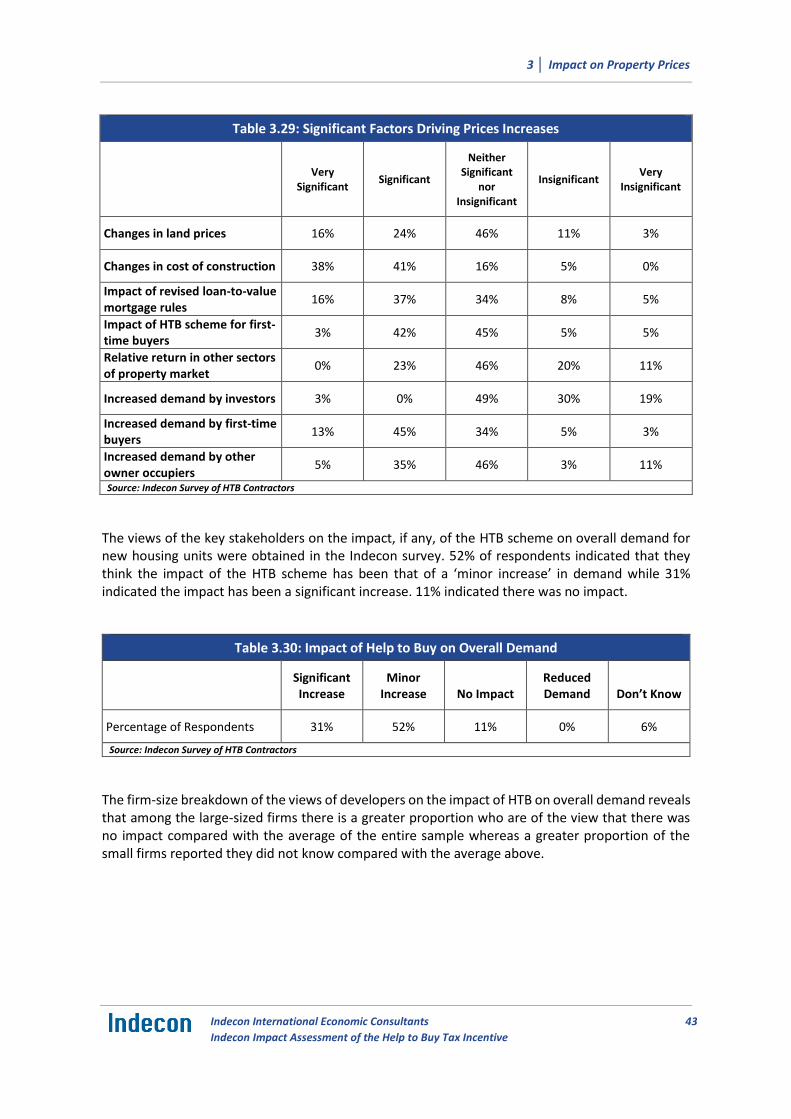
3 │ Impact on Property Prices
Indecon International Economic Consultants
Indecon Impact Assessment of the Help to Buy Tax Incentive
43
Table 3.29: Significant Factors Driving Prices Increases
Very Significant
Significant
Neither Significant
nor Insignificant
Insignificant Very
Insignificant
Changes in land prices 16% 24% 46% 11% 3%
Changes in cost of construction 38% 41% 16% 5% 0%
Impact of revised loan-to-value mortgage rules
16% 37% 34% 8% 5%
Impact of HTB scheme for first-time buyers
3% 42% 45% 5% 5%
Relative return in other sectors of property market
0% 23% 46% 20% 11%
Increased demand by investors 3% 0% 49% 30% 19%
Increased demand by first-time buyers
13% 45% 34% 5% 3%
Increased demand by other owner occupiers
5% 35% 46% 3% 11%
Source: Indecon Survey of HTB Contractors
The views of the key stakeholders on the impact, if any, of the HTB scheme on overall demand for new housing units were obtained in the Indecon survey. 52% of respondents indicated that they think the impact of the HTB scheme has been that of a ‘minor increase’ in demand while 31% indicated the impact has been a significant increase. 11% indicated there was no impact.
Table 3.30: Impact of Help to Buy on Overall Demand
Significant Increase
Minor Increase No Impact
Reduced Demand Don’t Know
Percentage of Respondents 31% 52% 11% 0% 6%
Source: Indecon Survey of HTB Contractors
The firm-size breakdown of the views of developers on the impact of HTB on overall demand reveals that among the large-sized firms there is a greater proportion who are of the view that there was no impact compared with the average of the entire sample whereas a greater proportion of the small firms reported they did not know compared with the average above.

3 │ Impact on Property Prices
Indecon International Economic Consultants
Indecon Impact Assessment of the Help to Buy Tax Incentive
44
Table 3.31: Impact of Help to Buy on Overall Demand, by Firm Size
Significant Increase
Minor Increase
No Impact Reduced Demand
Don’t Know
Small (<50 units) 36% 36% 9% 0% 18%
Medium (50-299 units) 30% 61% 6% 0% 3%
Large (300+ units) 33% 33% 33% 0% 0% Source: Indecon Survey of HTB Contractors Note: The definitions of the firm-size categories are based on the firms’ responses to the Indecon Survey of Housing Sector Stakeholders, which asked stakeholders to indicate the number of additional new housing units they expect to build over the next three years.
When asked to indicate the impact, if any, of the HTB scheme on the price of new and second-hand property prices, a plurality of respondents indicated they thought the scheme had no impact on prices. 20% of respondents said the scheme increased overall prices and the price of new homes for FTBs respectively. Few respondents felt that the scheme had an impact of reducing prices.
Table 3.31: Impact of Help to Buy on the Prices of New and Second Hand Homes
Increased
Prices No Impact Reduced Prices Don’t Know
Impact on Overall Price of New Housing
20% 75% 2% 4%
Impact on Price new homes for First-time buyers
20% 69% 4% 7%
Impact on Price of Second Hand Houses
8% 47% 6% 40%
Source: Indecon Survey of HTB Contractors
A closer look at the responses by firm size showed again that for the most part a majority of firms at all firm-size levels indicated that they thought the scheme had no impact on property prices of new and second-hand homes.

3 │ Impact on Property Prices
Indecon International Economic Consultants
Indecon Impact Assessment of the Help to Buy Tax Incentive
45
Table 3.32: Impact of Help to Buy on the Prices of New and Second Hand Homes, by Firm Size
Size Of
Developer Increased
Prices No Impact
Reduced Prices
Don’t Know
Impact on Overall Price of New Housing
Small 0% 100% 0% 0%
Medium 24% 70% 0% 6%
Large 11% 78% 11% 0%
Impact on Price new homes for
First-time buyers
Small 0% 91% 9% 0%
Medium 25% 63% 0% 13%
Large 11% 78% 11% 0%
Impact on Price of Second Hand
Houses
Small 0% 55% 0% 45%
Medium 6% 42% 3% 48%
Large 11% 56% 22% 11% Source: Indecon Survey of HTB Contractors Note: The definitions of the firm-size categories are based on the firms’ responses to the Indecon Survey of Housing Sector Stakeholders, which asked stakeholders to indicate the number of additional new housing units they expect to build over the next three years.
Changes in Other Policies Potentially Impacting on Demand and Prices
A number of other policy changes which potentially could impact on housing demand or prices have also been introduced. The Housing Assistance Payment limits have been increased. Further, changes in mortgage investment relief were introduced to allow landlords who lease to tenants in receipt of social housing supports to avail of 100% mortgage interest relief. Most importantly, there have been changes to Central Bank Prudential Rules.
Indecon notes that the Housing Assistance Payment (HAP) was introduced in 2014 and replaced the old Rent Supplement for those in long-term housing need. The HAP has been rolled out gradually, and became available throughout the country in March 2017. Given that the policy was introduced in 2014 and gradually extended, it is unlikely that any impact of this policy on prices would be visible in 2017. Similarly, the introduction in January 2016 of a 100% mortgage interest relief for landlords who lease to tenants in receipt of social housing supports is unlikely to have any short impact on 2017 data for new property prices purchased by FTB. We have, however, examined in more detail the issue of the changes in Central Bank Prudential Rules. To account for this potential issue, Indecon has analysed data on the specific types of buyers and types of properties which are eligible for HTB but not eligible for other policies.
In January 2017, changes were made to the Central Bank’s macroprudential rules on mortgage lending to FTBs. The mortgage measures were introduced in February 2015 to enhance the resilience of both borrowers and the banking sector, and to reduce the risk of bank credit and property price spirals from developing in the future. As this and HTB are both focused on FTBs, they could potentially impact demand and supply of dwellings as well as property prices.
3 │ Impact on Property Prices
Indecon International Economic Consultants
Indecon Impact Assessment of the Help to Buy Tax Incentive
46
These measures initially capped both the loan-to-value (LTV) ratios and loan-to-income (LTI) ratios for mortgages provided to FTBs and non-FTBs. The measures also set a LTV ratio limit for loans to buy-to-let investors.
Prior to 1 January 2017, the mortgage rules set out a maximum LTV ratio of 80% for non-FTBs of primary dwelling homes. For FTBs, a higher cap of 90% was applied for the first €220,000 of the value of the property and the 80% LTV then applies to the part of the value of the property above €220,000. A limit of 15% of the value of new mortgage lending for primary dwellings was allowed above the caps. A 70% LTV limit was set for buy-to-let investors, to be exceeded by no more than 10% of the value of new buy-to-let lending.
For the LTI ratio, a maximum of 3.5 times gross income is allowed, assessed on combined gross income in the case of joint borrowers, with up to 20% of the value of new lending allowed above this limit. This only applies to mortgages on primary residences and there is no LTI limit imposed on buy-to-let borrowings. For a more detailed discussion of the original mortgage measures, see Cassidy and Hallissey.11
The Central Bank undertook a review of the mortgage lending requirements in 2016. Following the review, the framework was broadly unchanged. The 3.5 times ceiling on the loan-to-income (LTI) ratio remained. Requirements for buy to let borrowers and the exemptions for negative equity mortgage borrowers from the measures also remain unchanged.
The review identified a number of refinements to improve the sustainability and effectiveness of the current framework. The refinements from 1 January 2017 were:
The ceiling on the loan-to-value (LTV) ratio for all FTBs was set at 90%. This was a shift from the pre-existing requirements, which put the ceiling at 90% for loans up to €220,000 but at 80% for the balance of loans above €220,000. This means that FTBs could borrow up to 90% of a value of a home, with a requirement for a 10% minimum deposit.
The 20% minimum deposit requirement (i.e. maximum LTV ratio of 80%) continued to apply to second and subsequent buyers.
The structure of the proportionate LTV allowances was amended. Five percent of the value of new lending to FTBs was allowed above the 90% LTV limit, and 20% of the value of new lending to second and subsequent buyers for primary residences was allowed above the 80% loan-to-value limit. This replaced the pre-existing regulation, which allowed 15% of total lending for primary dwellings (the sum of lending to FTBs and second and subsequent buyers) above the LTV limits.
The pre-existing two-month valuation period was extended to four months in recognition of the fact that a portion of property sales can take longer than the average three months to conclude.
There was a technical amendment to the scope of the non-primary dwelling home limit so that large commercial landlords and developers were not in scope of the Regulations. This was implemented by applying the Regulations to consumers based on the definition in the Consumer Protection Code 2012 and that used by the Financial Services Ombudsman to define the scope of its jurisdiction.
11 Cassidy, M. and N. Hallissey (2016), “The introduction of macroprudential measures for the Irish mortgage market”, Economic and Social Review, 47 (2), pp. 271-297.

3 │ Impact on Property Prices
Indecon International Economic Consultants
Indecon Impact Assessment of the Help to Buy Tax Incentive
47
The following table outlines the changes in the LTV and LTI requirements following the review.
Table 3.32: Changes in Mortgage Measures from January 2017
LTV Limits
For primary dwelling homes
Until 31 Dec 2016
FTBs: Sliding LTV limit from 90%*
15% of all new lending allowed above limits
Non-FTBs: 80%
From 1 Jan 2017
FTBs: 90% 5% of new lending to FTBs allowed above 90%
Non-FTBs: 80% 20% of non-FTB new lending allowed above 80%
For buy-to-let borrowers (investors)
70% LTV limit 10% of new lending above the BTL limit is allowed
LTI Limits For primary dwelling homes
3.5 times income 20% of new lending above the LTI limit is allowed
Exemptions
From LTV Limit: Borrowers in Negative equity
From LTI Limit: Borrowers for investment properties
From both limits: Switcher mortgages
Restructuring of mortgages in arrears
Source: Central Bank of Ireland *A limit of 90 per cent LTV applies on the first €220,000 of the value of a residential property and a limit of 80 per cent LTV applies on any value of the property thereafter.
Indecon asked HTB contractors their views on the impact, if any, the new mortgage lending rules had on the overall demand for new housing units. 26% of respondents indicated that the new mortgage lending rules have caused a significant increase in demand while 41% consider it to have caused a minor increase in demand.
Table 3.33: Impact of New Mortgage Lending Rules on Overall Demand
Significant Increase
Minor Increase No Impact
Reduced Demand Don’t Know
Percentage of Respondents 26% 41% 13% 11% 9%
Source: Indecon Survey of HTB Contractors
A breakdown by firm size reveals that a greater proportion of the large-size firms indicated that the new mortgage lending rules had a minor impact or no impact on overall demand for new housing units compared with the average across the entire sample above.

3 │ Impact on Property Prices
Indecon International Economic Consultants
Indecon Impact Assessment of the Help to Buy Tax Incentive
48
Table 3.34: Impact of New Mortgage Lending Rules on Overall Demand, by Firm Size
Significant Increase
Minor Increase
No Impact Reduced Demand
Don’t Know
Small 27% 45% 9% 0% 18%
Medium 27% 36% 12% 15% 9%
Large 22% 56% 22% 0% 0% Source: Indecon Survey of HTB Contractors Note: The definitions of the firm-size categories are based on the firms’ responses to the Indecon Survey of Housing Sector Stakeholders, which asked stakeholders to indicate the number of additional new housing units they expect to build over the next three years.
In considering the changes in loan-to-value rules and its interaction with the HTB scheme, it is useful to examine data from completed transactions which have been assisted by HTB. Of particular interest is whether, as a result of the Central Bank changes there has been any significant changes evident in the LTV ratios for those assisted by HTB.
The following table examines the average loan-to-value (LTV) ratios for completed transactions utilising HTB. The table provides a breakdown by county and type of application. Nationally, the average LTV for dwellings purchased with HTB has been 86%. The average LTV has been higher for new builds than self-builds.
Table 3.35: Completed Transactions by Average Loan-to-Value and County (€)
Overall New Build
New Build, Retrospective
Self-Build Self-Build,
Retrospective
Cork 84% 86% 85% 80% 80%
Donegal 87% 87% 90% 90% 80%
Dublin 84% 85% 84% 75%
Galway 85% 78% 88% 81% 84%
Kerry 77% 85% 70% 76%
Kildare 86% 86% 86% 80%
Laois 81% 89% 80% 77%
Leitrim 81% 88% 73%
Limerick 84% 84% 85% 85% 79%
Louth 87% 89% 89% 73%
Meath 87% 87% 86% 86% 78%
Offaly 87% 88% 89% 80% 84%
Waterford 87% 87% 87% 85%
Westmeath 83% 85% 86% 78% 79%
Wicklow 86% 86% 87% 82% 82%
Overall 85% 86% 85% 81% 81% Source: Indecon analysis of Revenue Commissioners Data as at 29 May 2017. Prices for certain counties excluded on confidentiality grounds

3 │ Impact on Property Prices
Indecon International Economic Consultants
Indecon Impact Assessment of the Help to Buy Tax Incentive
49
The table below displays a breakdown of the loan-to-value ratio of properties for which HTB claims have been made as of 3 August 2017. This indicates that over 21% of buyers had LTV ratios of less than 80%. This may suggest some level of deadweight in the HTB scheme. However, the fact that not all of HTB purchasers used the tax refund to fund higher priced properties is of note.
Table 3.36: Breakdown of Loan-to-Value Ratio for HTB-claimed Properties
LTV Ratio % of Total
70- 74.99% 11.25%
75 – 79.99% 10.52%
80 – 84.99% 16.05%
85 - 89.99% 30.22%
90% and over 31.97%
Source: Revenue Data on HTB as of 3 August 2017
Data on completed transactions by LTV are presented below.
Table 3.37: Completed Transactions by Average Loan-to-Value and County
Overall New Build New Build
Retrospective Self-Build Self-Build,
Retrospective
Carlow 79% 90% 74%
Cavan 83% 81% 84%
Clare 89% 90% 90% 89% 85%
Cork 84% 86% 85% 80% 80%
Donegal 87% 87% 90% 90% 80%
Dublin 84% 85% 84% 75%
Galway 85% 78% 88% 81% 84%
Kerry 77% 85% 70% 76%
Kildare 86% 86% 86% 80% Kilkenny 82% 88% 81%
Laois 81% 89% 80% 77%
Leitrim 81% 88% 73%
Limerick 84% 84% 85% 85% 79%
Longford 79% 79%
Louth 87% 89% 89% 73% Mayo 85% 84% 86%
Meath 87% 87% 86% 86% 78%
Monaghan 90% 90% Offaly 87% 88% 89% 80% 84%
Roscommon 85% 90% 83% 80%
Sligo 85% 90% 80%
Tipperary 86% 90% 89% 85% 84%
Waterford 87% 87% 87% 85%
Westmeath 83% 85% 86% 78% 79%
Wexford 87% 87% 88% 85%
Wicklow 86% 86% 87% 82% 82%
Overall 85% 86% 85% 81% 81% Source: Indecon Analysis of Revenue Data as at 29 May 2017

3 │ Impact on Property Prices
Indecon International Economic Consultants
Indecon Impact Assessment of the Help to Buy Tax Incentive
50
Indecon analysis of Revenue Commissioners’ data shows that even with the new LTV rules 69% of purchasers could not have met the required deposit without the assistance of HTB or without other source of funding. Nearly 90% of the non-retrospective home purchases assisted by the HTB have been potentially impacted by the change in the Central Bank Prudential Rules as they purchased homes at prices over €220,000. However, a more detailed analysis of accompanied micro data undertaken by Indecon of Revenue Commission data indicated that only 50% of the non-retrospective purchasers paid deposits less than what was required under the previous Central Bank prudential rates.
Table 3.38: Analysis of Impact of Changes in Mortgage Lending Rules
Non-retrospective applicants for new builds 670
Average Price 313,812
Average LTV 86%
Number Potentially Impacted by CB Rule Changes Due to purchase price of over €220K
594
% of applicants for non-retrospective new builds 89%
Average Deposit Paid 48,731
Average Deposit Required Under CB Rules Prior to 2017 44,082
Number paying deposit less than implied under previous rules 336
% of applicants for non-retrospective new builds 50%
No. of people who could not reach 90% LTV without HTB 461
% of applicants for non-retrospective new builds 69%
No. of people who could not reach required LTV under previous rules without HTB
509
% of applicants for non-retrospective new builds 76% Source: Indecon analysis based on Revenue Commission data as at 29 May 2017
Correlation between HTB and Prices at County Level
As part of our analysis, we examine county price data to see if there is any evidence that changes in prices of housing is correlated with the significance of HTB purchasers in these local markets. If there was evidence the HTB scheme had an identifiable impact on prices, then one might expect to see prices rising faster in counties where HTB assistance was a greater percentage of buyers in that market. To assess this, we investigate the link between the percentage change in price and the ratio between HTB claims and sales. The ratio is a measure of the importance of HTB demand relative to total demand met by supply. We have estimated this using claims data from the Revenue Commissioners. (We also separately tested the data using applicants and similar results were evident).

3 │ Impact on Property Prices
Indecon International Economic Consultants
Indecon Impact Assessment of the Help to Buy Tax Incentive
51
Figure 3.15: Regression Output – Percentage Change in Prices and Applications by County
Regression Statistics R Square 0.199 Adjusted R Square 0.129
Standard Error 0.503659
Observations 26 df SS MS F Prob > F Regression 2 1.356 0.678 2.859 0.078 Residual 23 5.456 0.237 Total 25 6.812
Coefficients Standard
Error t Stat P-value Lower 95%
Upper 95%
Intercept 0.810 0.235 3.442 0.002 0.323 1.297
Claims/Sales -1.187 0.998 -1.190 0.246 -3.251 0.877
Initial price (€000s) -0.002 0.001 -1.721 0.099 -0.004 0.000
Source: Indecon analysis
As a proxy for the average quality of properties, location and other characteristics that may differ across counties, we control for average property prices in 2016. The results suggest that expensive dwellings had a smaller percentage increase in price than less expensive ones. The coefficient on the share of transactions assisted by the scheme is not statistically different from zero, this can be interpreted to mean that counties where the HTB scheme was used for a larger share of completed transactions did not have a larger increase in price than other counties.
Price Data on HTB Transactions
Indecon also examined price data on completed transactions assisted by HTB and reviewed whether the price levels show any differences for retrospective and non-retrospective prices. The following table outlines the average price for completed transactions with HTB split across counties and between the different types of transactions. Nationally, the average price of a transactions utilising HTB has been €311,964. The highest average price has been in Dublin. The average price on completed transactions assisted by HTB compared to transactions for retrospective sales differences prior to end of 2016 does not suggest any evidence of price inflation as a result of HTB.

3 │ Impact on Property Prices
Indecon International Economic Consultants
Indecon Impact Assessment of the Help to Buy Tax Incentive
52
Table 3.39: Completed Transactions by Average Price and County (€)
County Overall New Build New Build, Retrospective
Self-Build
Cork 300,545 293,508 302,254
Donegal 192,273 155,000 155,500
Dublin 349,416 346,333 351,743
Galway 261,940 288,620 229,092
Kerry 271,308 170,000
Kildare 324,149 326,279 322,730
Laois 256,353 181,667
Limerick 238,061 228,704 228,714
Louth 246,917 248,286 226,875
Meath 283,882 288,413 267,256
Offaly 203,536 190,214 163,333
Waterford 203,054 200,900 188,242
Westmeath 253,105 229,857
Wicklow 327,006 327,500
Overall 311,964 313,812 Source: Indecon analysis of Revenue Commissioners Data as at 29 May 2017
The following table illustrates the range of prices for completed transactions utilising HTB. The average property price for all counties for transactions assisted with HTB was €311,964. This reflects the experience of Dublin and the Community Counties. The evidence shows a significant range of price with some transactions at much higher level of prices but these represent a minority of transactions.
Table 3.40: Completed Transactions by Average, Highest and Lowest Price and County (€)
County Average Price Lowest Price Highest Price
Cork 300,545 105,000 500,000
Donegal 192,273 115,000 400,000
Dublin 349,416 205,000 595,000
Galway 261,940 130,000 498,000
Kerry 271,308 170,000 450,000
Kildare 324,149 192,950 470,000
Laois 256,353 160,000 390,000
Limerick 238,061 136,500 335,000
Louth 246,917 115,000 495,000
Meath 283,882 189,000 560,000
Offaly 203,536 130,000 320,000
Tipperary 228,791 141,000 330,000
Waterford 203,054 149,950 376,000
Westmeath 253,105 160,000 400,000
Wicklow 327,006 205,000 545,000 Source: Indecon analysis of Revenue Commissioners Data as at 29 May 2017. Prices for certain counties excluded on confidential grounds

3 │ Impact on Property Prices
Indecon International Economic Consultants
Indecon Impact Assessment of the Help to Buy Tax Incentive
53
Summary of Findings
An assessment of what impact of the Help to Buy (HTB) incentive may have had on property prices in Ireland since its introduction must consider the determinants of property price movements. Our evaluation takes into account the economic factors driving property prices, as even without any policy changes, an expanding economy is likely to be associated with rising prices.
As part of this report, Indecon developed new econometric models to examine whether any separate impacts of the HTB on prices to date can be identified. Econometric models of property prices typically are presented as a reduced form inverse demand function, with property prices as a function of factors such as economic growth or changes in employment, interest rates, or demographic factors. Certain models also introduce supply-side variables such as housing stock and the availability of land for construction but many focus on the key determinants of demand.
Our modelling attempts to evaluate what prices would have been in 2017 if HTB was not introduced by examining if there is evidence which would suggest that a statistically significant change occurred in the level of prices in 2017 not explained by other economic factors.
While the results of our econometric modelling do not appear to suggest any identifiable separate impact of the HTB Scheme on prices to date, it is useful to also examine developments in Irish residential property prices.
The average prices of new homes in Ireland have increased in each quarter since the end of 2015 compared to the previous quarter. Average prices of new homes increased by 7.8% in 2016 Q2 and 6.8% in Q3 while showing slower growth in the last quarter of 2016, possibly reflecting seasonal factors. In the first quarter of 2017, average prices increased by 1.1% and by 4.9% in the second quarter. Average prices of new homes for first-time buyers (FTBs) also recorded very strong growth in 2016 and prices continued to increase in the first half of 2017.
Data on median prices of new dwellings for FTBs shows that, nationally, prices for new homes increased significantly in 2017. Interestingly, median prices for FTB new homes increased slower in 2017 in Dublin despite the fact that Dublin accounted for the highest percentage of HTB applicants and claims.
In addition to reviewing CSO data, Indecon examined if there was up-to-date data on new versus second-hand average prices from Daft.ie. While the price data was not available by age, a new development variable is included as a control in a hedonic regression completed by Professor Ronan Lyons of TCD. The results do not appear to indicate upward pressure in Dublin/Leinster in the last two to three quarters although there is a different picture for some other regions.
Detailed unpublished micro information was obtained from 12 different housing sites which accounted for over 1,200 new house sales over the period from the third quarter of 2015 until the second quarter of 2017. This data provides a very useful source of evidence on inflation in the prices of new houses in recent months. The data from the 12 new housing sites examined suggests that average price changes recorded in Q1 2017 increased by 2.3% and in Q2 2017 increased by 2.9%. The weighted average figure indicated percentage changes of 2.3% in Q1 and 0.9% in Q2.

3 │ Impact on Property Prices
Indecon International Economic Consultants
Indecon Impact Assessment of the Help to Buy Tax Incentive
54
As part of the assessment of the HTB incentive, Indecon obtained survey responses from 55 contractors approved under the scheme. Contractors were asked to provide information on whether they had placed any new housing units on the market which would qualify for the HTB scheme and to indicate what changes, if any, have occurred in the price of these houses since the 1st of January 2017. The results indicate that 57% of contractors had not increased the price of the housing units while 43% indicated that some price increases had occurred. A smaller proportion of the larger contractors reported increases in prices.
In examining the impact of the HTB measure on housing prices, Indecon notes that, in January 2017, changes were made to the Central Bank’s macroprudential rules on mortgage lending to FTBs. Nationally, the average LTV for dwellings purchased with HTB was 86%, but 21% of buyers had LTV ratios of less than 80%. A detailed analysis of micro data undertaken by Indecon indicated that only 50% of the non-retrospective purchasers paid deposits less than what was required under the previous Central Bank prudential rules, and in many cases purchasers only exceeded previous LTVs by a small amount.
The contractors surveyed were asked to indicate the significance they would attribute to various factors potentially influencing any price increases. More than half of respondents indicated that ‘changes in cost of construction’ was a very significant or significant factor driving price increases. The ‘impact of revised loan-to-value mortgage rules’, ‘increased demand by FTBs’, and the ‘HTB measure’ were factors which were seen as of some significance by a number of contractors; although, these were judged to be of less importance than changes in construction costs.
As part of our analysis, we also examined county price data to see if changes in prices of new housing were correlated with the significance of HTB purchasers in these local markets. If the Help to Buy scheme had an identifiable impact on prices, then one might expect to see prices rising faster in counties where the HTB purchasers were a larger share of buyers in that market. Counties where the HTB was used for a larger share of completed transactions did not have a larger increase in price than other counties.
Indecon also examined price data on completed transactions assisted by HTB and reviewed whether the price levels show any differences for retrospective and non-retrospective prices. The average price on new transactions assisted by HTB were very similar to prices for transactions on retrospective sales prior to end of 2016.
The evidence examined using a range of approaches does not suggest any identifiable separate impact of the HTB scheme on prices to date. However, given the data limitations and the short period of recorded transactions since the scheme was introduced, this finding should not be interpreted as proof that HTB had no impact on prices. While no separate impact is evident from the modelling, we caution against assuming that the scheme will not impact on prices in future periods unless there is an adequate supply response.

4 │ Impact on New Build Residential Supply
Indecon International Economic Consultants
Indecon Impact Assessment of the Help to Buy Tax Incentive
55
4 Impact on New Build Residential Supply
Introduction
There has been some evidence of improvements in the supply of housing in the Irish market, but as supply inevitably takes time to respond to developments, any impact of the HTB on supply is likely to be only seen over time. The level of housing supply will, in Indecon’s view, be largely determined by site costs and the cost of construction compared to prevailing market prices. The cost of construction will be influenced by labour, material and finance costs, as well as planning requirements, development levies and taxation. In addition to construction costs, site costs represent a significant component of the price of new housing units. The role which site costs play in the Irish housing market has been noted previously. For example, back in 1997 it was noted that in “the housing market bottlenecks in the supply of land have resulted in higher site prices, with implications for housing inflation. Such bottlenecks should be addressed by appropriate planning and zoning decisions, for example by rezoning land for residential use or providing servicing to some of the land currently residential-zoned”.12
The Importance of supply is recognised not only by economists but also by the construction sector. In a submission to Indecon, the Construction Industry Federation indicated that “there is no disagreement that the level of residence building activity falls well short of the sustainable demand for new homes.”
The impact of the HTB scheme on overall level of supply is difficult to measure. The CIF have suggested that the scheme is having a positive impact on supply, and they pointed out that 2,210 residential units were registered under the Home Bond Insurance Scheme in the 3 months January to March 2017. This was a significant increase compared to 2016. However, it is clear that housing supply has, not surprisingly, been very constrained in the period following the property crash. The CIF estimated that the level of new residential completion for 2017 will be in the region of 18,000 units.
Table 4.1 outlines the developments in the total housing stock in Ireland between the 2011 and 2016 censuses in the context of the overall population growth in this period. While the total population grew by 3.8% over this period, the total housing stock grew by only 0.4%.
Table 4.1: Housing Stock and Population Growth
2011 2016 % Change 2011-2016
Total Population 4,588,252 4,761,865 3.8%
Total Housing Stock 1,994,845 2,003,645 0.4%
Source: Indecon analysis of CSO Census data
12 See Gray, A. W., 1997, Challenges for Ireland in the Integrated European Union, Essay 5 to Celebrate T.K. Whitakers 80 years, Ed. By O’Muircheartaigh, F., Institute of Public Administration.

4 │ Impact on New Build Residential Supply
Indecon International Economic Consultants
Indecon Impact Assessment of the Help to Buy Tax Incentive
56
House Completions and Registrations
There are difficulties in official data on supply of new dwellings in the Irish market. Data on new housing supply are based on estimates of ESB connections. Separate data is also available as measured by completion of registrations by home bond insurance purchases. Each variable has limitations, as some self-build housing may not have the bond, while connections do not exclude houses that were disconnected and reconnected after two years. These re-connected houses count as new supply, as they have been out of the market for a substantial period of time, but do not represent new construction.
The following table, Table 4.2, outlines the total number of housing completions recorded on an annual basis since 2007, as well as the percentage change in this indicator from the previous year. It can be observed that there has been a major fall in housing completions from a peak of over 77,500 in 2007 to a low of 8,300 in 2013. The number of housing completions has been rising steadily on an annual basis since then. However, the total number of housing completions in 2016 remains significantly below the number that has been calculated as being required to meet population growth and demand for housing of 30,000-35,000 housing units per annum.13
Table 4.2: Annual Dwelling Completions
Year Dwelling Completions % Change from Previous Year
2007 77,627 -17%
2008 51,324 -34%
2009 26,420 -49%
2010 14,602 -45%
2011 10,480 -28%
2012 8,488 -19%
2013 8,301 -2%
2014 11,016 33%
2015 12,666 15%
2016 14,932 18%
2017* 6,995* 25%** Source: Indecon analysis of Department of Housing Data *Year to May (inclusive) **Compared to Jan-May 2016
Table 4.3 provides a breakdown of annual housing completions by type. This breakdown shows that significantly more houses continue to be constructed than apartments. In 2016, there were 12,625 houses completed compared to 2,307 apartments.
13 ESRI, Quarterly Economic Commentary, Spring 2017

4 │ Impact on New Build Residential Supply
Indecon International Economic Consultants
Indecon Impact Assessment of the Help to Buy Tax Incentive
57
Table 4.3: Annual Dwelling Completions by Type
Year Individual House Scheme House Apartments Total
2007 19,663 39,273 18,691 77,627
2008 17,386 21,127 12,811 51,324
2009 12,065 9,207 5,148 26,420
2010 7,914 4,600 2,088 14,602
2011 6,526 2,614 1,340 10,480
2012 5,162 2,333 993 8,488
2013 4,730 2,649 922 8,301
2014 5,171 3,595 2,250 11,016
2015 6,071 4,954 1,641 12,666
2016 6,203 6,422 2,307 14,932
2017* 2,715 3,132 1,148 6,995 Source: Indecon analysis of Department of Housing Data *Year to May (inclusive)
The following figures outline the trend in housing commencements in recent months.
Figure 4.1: Housing Commencements
Source: Dept. of Housing Data
810
1,430
662
833
1,453
1,037 957 978
1,080
1,760
1,326
908 910
1,265
1,685 1,620
2,053
0
500
1,000
1,500
2,000
2,500
No
.of
Co
mm
ence
men
ts

4 │ Impact on New Build Residential Supply
Indecon International Economic Consultants
Indecon Impact Assessment of the Help to Buy Tax Incentive
58
The following figure illustrates the growth rate in each month compared to the same month in the previous year. This figure suggests that commencement in recent months have exceeded those in the preceding year.
Figure 4.2: Housing Commencements – Change from Same Month in Preceding Year
Source: Dept. of Housing Data
Figure 4.3 demonstrates the rise in residential construction commencements over the past three years. The latest data indicates an all-time high. The previous peak over the last three years was in October 2016, which saw 1,760 commencements, a 63% increase on the previous month. Following that peak, there was a decline before a recovery in March of 2017. As the figure below shows, there is monthly variability in the number of commencements, but the trend since March 2014 has been one of growth. It is important to note that the data on residential construction commencements only goes back as far as March 2014.
Figure 4.3: Residential Construction Commencements
Source: Department of Housing Data
-50%
0%
50%
100%
150%
200%
250%
300%
0
500
1000
1500
2000
2500
Mar
-14
May
-14
Jul-
14
Sep
-14
No
v-1
4
Jan
-15
Mar
-15
May
-15
Jul-
15
Sep
-15
No
v-1
5
Jan
-16
Mar
-16
May
-16
Jul-
16
Sep
-16
No
v-1
6
Jan
-17
Mar
-17
May
-17
No
. of
Res
iden
tial
Bu
ildin
gs
Co
mm
ence
men
ts

4 │ Impact on New Build Residential Supply
Indecon International Economic Consultants
Indecon Impact Assessment of the Help to Buy Tax Incentive
59
Table 4.4 shows the number of commencements by local authority since March 2014. The Greater Dublin Area (GDA) has contributed over half of all residential commencements since March 2014. This could be most clearly seen in 2015 when the GDA accounted for 61.5% of all commencements. Local authorities such as Cork County and Meath County saw a large increase between 2015 and 2016, leading them to be the only authorities outside of Dublin with over one thousand commencements in 2016.
Table 4.4: Residential Commencements by Local Authority
Local Authority 2014* 2015 2016 2017**
Carlow County 33 62 94 28
Cavan County 42 96 107 40
Clare County 54 109 200 89
Cork City 19 45 197 63
Cork County 209 792 1,330 590
Donegal County 50 231 310 108
Dublin City 230 855 1,619 999
Dun-Laoghaire Rathdown 172 825 1,264 527
Fingal County 361 1,803 1,692 855
Galway City 4 56 101 77
Galway County 91 298 322 269
Kerry County 62 187 212 142
Kildare County 231 718 919 531
Kilkenny County 36 111 170 77
Laois County 12 105 182 105
Leitrim County 4 21 18 21
Limerick City and County 51 176 419 219
Longford County 8 19 52 26
Louth County 51 151 350 298
Mayo County 51 141 211 124
Meath County 133 381 1,028 776
Monaghan County 32 72 103 59
Offaly County 21 75 115 75
Roscommon County 17 47 79 43
Sligo County 20 41 77 65
South Dublin County 112 403 829 519
Tipperary County 35 96 133 56
Waterford City and County 70 161 223 169
Westmeath County 15 59 73 58
Wexford County 90 208 279 221
Wicklow County 137 403 526 304
Total 2,470 8,747 13,234 7,533
Dublin Local Authorities 926 3,886 5,404 2,900
GDA - Greater Dublin Area 1,426 5,388 7,877 4,511
Source: Department of Housing Data *March to December **January to May

4 │ Impact on New Build Residential Supply
Indecon International Economic Consultants
Indecon Impact Assessment of the Help to Buy Tax Incentive
60
Table 4.5 shows that the number of new house registrations fell in each year up until 2012. From 2013 onwards, there has been strong growth in new house registrations, with 31% growth in 2016. Whilst the number of new house registrations is lower than the levels in 2007 and 2008, there has been a return to growth in recent years.
Table 4.5: Annual New House Registrations
Year Housing Registrations % Change from Previous Year
2007 38,351 -42%
2008 12,676 -67%
2009 3,743 -70%
2010 1,680 -55%
2011 834 -50%
2012 627 -25%
2013 1,326 111%
2014 2,574 94%
2015 4,297 67%
2016 5,626 31% Source: Indecon analysis of CSO Data
The impact of the HTB Scheme on overall level of supply is difficult to measure. The CIF has suggested to Indecon that the scheme is having a positive impact on supply, and they pointed out that 2,210 residential units were registered under the Home Bond Insurance Scheme in the 3 months January to March 2017. This was a significant increase compared to similar period in 2016. It is however clear that housing supply has, not surprisingly, been very constrained in the period following the property crash. The CIF estimated that the level of new residential completion for 2017 will be in the region of 18,000 units.
The following table presents the most recent house registrations in Ireland. It shows that, in the first five months of 2017, there were 3,786 new registrations. This compares with 2,257 in the comparable period in 2016.
Table 4.6: Recent New House Registrations by Month (Jan 2017 - May 2017)
2016 2017
January 160 393
February 300 978
March 803 839
April 421 780
May 573 796
Total 2,257 3,786
Source: Indecon analysis of CSO Data
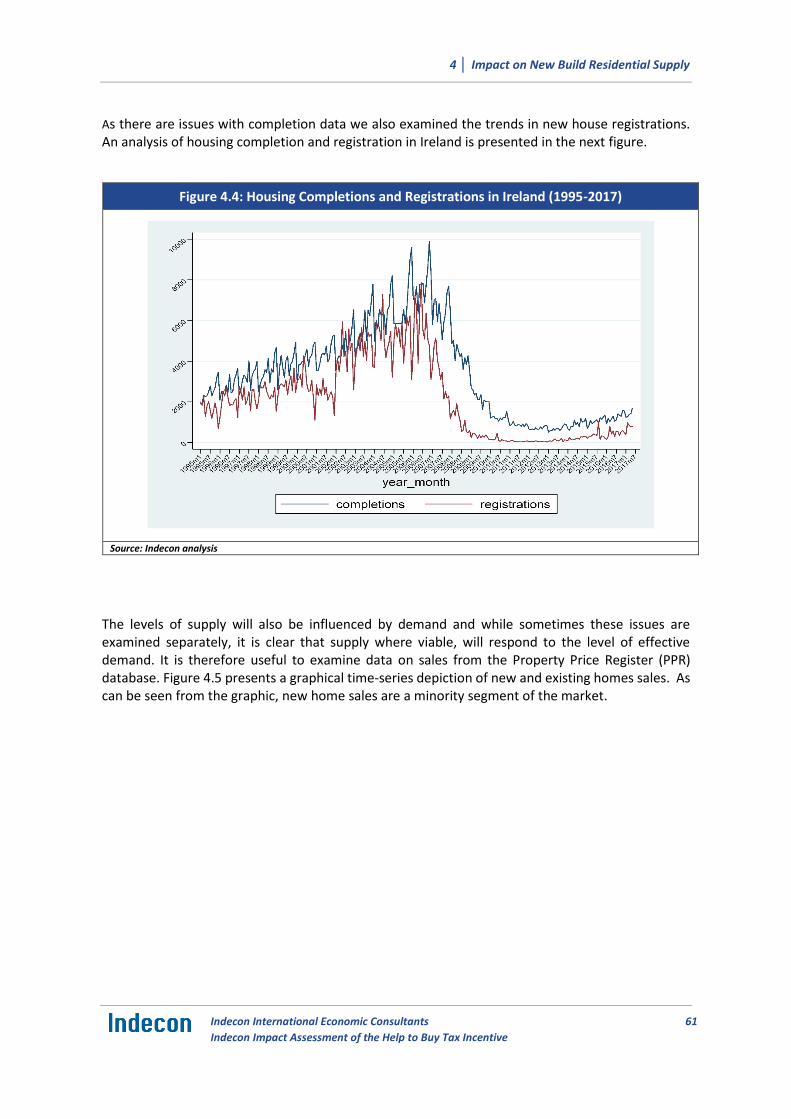
4 │ Impact on New Build Residential Supply
Indecon International Economic Consultants
Indecon Impact Assessment of the Help to Buy Tax Incentive
61
As there are issues with completion data we also examined the trends in new house registrations. An analysis of housing completion and registration in Ireland is presented in the next figure.
Figure 4.4: Housing Completions and Registrations in Ireland (1995-2017)
Source: Indecon analysis
The levels of supply will also be influenced by demand and while sometimes these issues are examined separately, it is clear that supply where viable, will respond to the level of effective demand. It is therefore useful to examine data on sales from the Property Price Register (PPR) database. Figure 4.5 presents a graphical time-series depiction of new and existing homes sales. As can be seen from the graphic, new home sales are a minority segment of the market.

4 │ Impact on New Build Residential Supply
Indecon International Economic Consultants
Indecon Impact Assessment of the Help to Buy Tax Incentive
62
Figure 4.5: Sales by New and Existing Houses (2010-2017)
Source: Indecon analysis
It is useful to consider the times-series with new homes sales graphed on the secondary axis, which is shown below. This shows that the trends in these two series are quite similar and that the seasonal impact appears to be common to both. This seasonal impact appears to be December, but there are also spikes in April and March.
Figure 4.6: Sales by New and Existing Houses Rescaled (2010-2017)
Source: Indecon analysis
0
100
200
300
400
500
600
700
800
900
1,000
0.00
1,000.00
2,000.00
3,000.00
4,000.00
5,000.00
6,000.00
7,000.00
Jan
-10
Jun
-10
No
v-1
0
Ap
r-1
1
Sep
-11
Feb
-12
Jul-
12
Dec
-12
May
-13
Oct
-13
Mar
-14
Au
g-1
4
Jan
-15
Jun
-15
No
v-1
5
Ap
r-1
6
Sep
-16
Feb
-17
num_sales_old num_sales_new

4 │ Impact on New Build Residential Supply
Indecon International Economic Consultants
Indecon Impact Assessment of the Help to Buy Tax Incentive
63
Planning Permissions
Table 4.7 presents data on the number of planning permission applications granted. Q1 of 2010 had the highest number of housing and total planning permission applications granted, with 1,756 applications granted. This fell to a low over the period of 747 applications in Q4 of 2013. 2013 saw the fewest applications granted over the seven-year period, with the numbers increasing in more recent years. Q1 of 2017 experienced the highest number of applications granted since 2010.
Table 4.7: Number of Planning Permission Applications Granted for Dwellings
Period Houses Apartments Total
2010 Q1 1,664 92 1,756
2010 Q2 1,395 115 1,510
2010 Q3 1,537 89 1,626
2010 Q4 1,362 65 1,427
2011 Q1 1,205 67 1,272
2011 Q2 1,197 63 1,260
2011 Q3 1,207 56 1,263
2011 Q4 907 43 950
2012 Q1 902 49 951
2012 Q2 875 62 937
2012 Q3 857 47 904
2012 Q4 788 46 834
2013 Q1 818 40 858
2013 Q2 727 40 767
2013 Q3 864 64 928
2013 Q4 694 53 747
2014 Q1 835 49 884
2014 Q2 809 63 872
2014 Q3 887 65 952
2014 Q4 804 69 873
2015 Q1 977 82 1,059
2015 Q2 913 73 986
2015 Q3 1,036 85 1,121
2015 Q4 995 86 1,081
2016 Q1 1,072 90 1,162
2016 Q2 1,090 107 1,197
2016 Q3 1,273 126 1,399
2016 Q4 1,234 102 1,336
2017 Q1 1,387 126 1,513 Source: CSO Data

4 │ Impact on New Build Residential Supply
Indecon International Economic Consultants
Indecon Impact Assessment of the Help to Buy Tax Incentive
64
The next figures outline the recent trends in planning permissions in terms of total planning permissions granted and the total number of units for which planning permission has been granted on a quarterly basis since the beginning of 2016. As with the commencements data, while this data does show an increase in both metrics in recent months, the time lag between applying for planning permission and the permission being granted is such that recent planning permission applications cannot be linked with the introduction of the HTB incentive.
Figure 4.7: Planning Permissions Granted and Units for Which Planning Permissions Granted
Source: CSO data
Housing Supply in Dublin
Given the issues arisen in relation to data on residential completion as an indicator of trends, it is more relevant for this review to examine data for Q1 2017 collected for the Dublin Supply Taskforce by South County Dublin on behalf of all local authorities. Apart from the issue of timing of completion, this evidence is more relevant to examine supply issue relating to HTB, as it deals only with development over 10 units and does not cover student accommodation or Pat 8 – local authority own development (e.g. social housing). Table 4.8 presents the trend in the number of units for which planning permission was granted. The number of units fell from 2010 to 2013 before growing again to reach a seven-year peak of 5,814 units in Q3 2016. This is despite the fact that the number of apartment units has not yet reached their 2010 levels, with a peak of 2,335 in Q2 2010. This means that the number of housing units has grown to greater levels than they were in 2010 and contribute a greater proportion of the total number of units than they did in previous years.
-
200
400
600
800
1,000
1,200
1,400
1,600
2016Q1 2016Q2 2016Q3 2016Q4 2017Q1
Nu
mb
er
of
Pe
rmis
sio
ns
Gra
nte
d
Planning Permissions Granted
-
1,000
2,000
3,000
4,000
5,000
6,000
7,000
2016Q1 2016Q2 2016Q3 2016Q4 2017Q1
Nu
mb
er o
f U
nit
s
Units for Which Planning Permissions Granted

4 │ Impact on New Build Residential Supply
Indecon International Economic Consultants
Indecon Impact Assessment of the Help to Buy Tax Incentive
65
Table 4.8: Number of Dwelling Units for Which Planning Permission Granted
Period Houses Apartments Total
2010 Q1 3,585 1,925 5,510
2010 Q2 3,043 2,335 5,378
2010 Q3 2,817 1,824 4,641
2010 Q4 2,159 790 2,949
2011 Q1 3,075 592 3,667
2011 Q2 2,599 711 3,310
2011 Q3 1,887 625 2,512
2011 Q4 1,537 619 2,156
2012 Q1 1,263 92 1,355
2012 Q2 1,166 240 1,406
2012 Q3 1,540 98 1,638
2012 Q4 1,420 431 1,851
2013 Q1 1,860 448 2,308
2013 Q2 1,496 430 1,926
2013 Q3 1,252 157 1,409
2013 Q4 1,394 162 1,556
2014 Q1 1,446 158 1,604
2014 Q2 1,492 114 1,606
2014 Q3 1,783 361 2,144
2014 Q4 1,905 152 2,057
2015 Q1 2,514 699 3,213
2015 Q2 2,637 473 3,110
2015 Q3 2,345 359 2,704
2015 Q4 2,754 1,263 4,017
2016 Q1 2,534 557 3,091
2016 Q2 2,340 801 3,141
2016 Q3 4,362 1,452 5,814
2016 Q4 3,245 1,084 4,329
2017 Q1 3,754 896 4,650
Source: CSO Data

4 │ Impact on New Build Residential Supply
Indecon International Economic Consultants
Indecon Impact Assessment of the Help to Buy Tax Incentive
66
Table 4.9 shows the number of active sites in Dublin Area Local Authorities in Q1 2017, with Fingal County Council having the most houses under construction. Dublin County Council has 1,313 apartments under construction, making it the Local Authority with the most units under construction. South Dublin County Council has the fewest houses and apartments under construction, contributing 12.1% of the total units under construction.
Table 4.9: Construction Activity in Active Sites in Dublin Area Local Authorities, Q1 2017
Planning Authority No. Houses Under
Construction No. Apartments
Under Construction Total Units Under
Construction
Dublin City Council 611 1,313 1,924
Fingal County Council 1,202 727 1,929
Dún Laoghaire-Rathdown 565 686 1,251
South Dublin County Council 529 167 696
Total 2,907 2,893 5,800
Source: Housing Supply Coordination Task Force for Dublin, Department of Housing, Planning, Community and Local Government
Indecon has examined the stage of development of housing units between Q1 2016 and Q1 2017. The first quarter of 2017 had the highest number of units under construction since the start of 2016 and also had the highest number of units on serviced land and ready to be developed.
Table 4.10: Number of Dwelling Units in Various Stages of Development within the Dublin City Council Local Authority Area, Q1 2016 – Q1 2017
Stage of Development 2016 Q1 2016 Q2 2016 Q3 2016 Q4 2017 Q1
No. Completions per Quarter 75 31 122 112 44
No. Built to Date 122 483 500 469 487
No. Under Construction 675 820 901 843 1,924
No. Permitted but not Commenced 4,341 4,148 5,088 5,643 5,603
On Serviced Land and Ready to be Developed
8,170 7,859 8,061 9,061 9,519
Source: Housing Supply Coordination Task Force for Dublin, Department of Housing, Planning, Community and Local Government
The following table contains data for housing units in the Dún Laoghaire-Rathdown Local Authority Area and shows that 2017 Q1 had the most completions of any quarter in the period covered. However, it also had the fewest under construction. The third quarter of 2016, in comparison, had the fewest number of units completed (10) but the highest number under construction (2,003). It also had the highest number of permitted units that had not yet started construction.
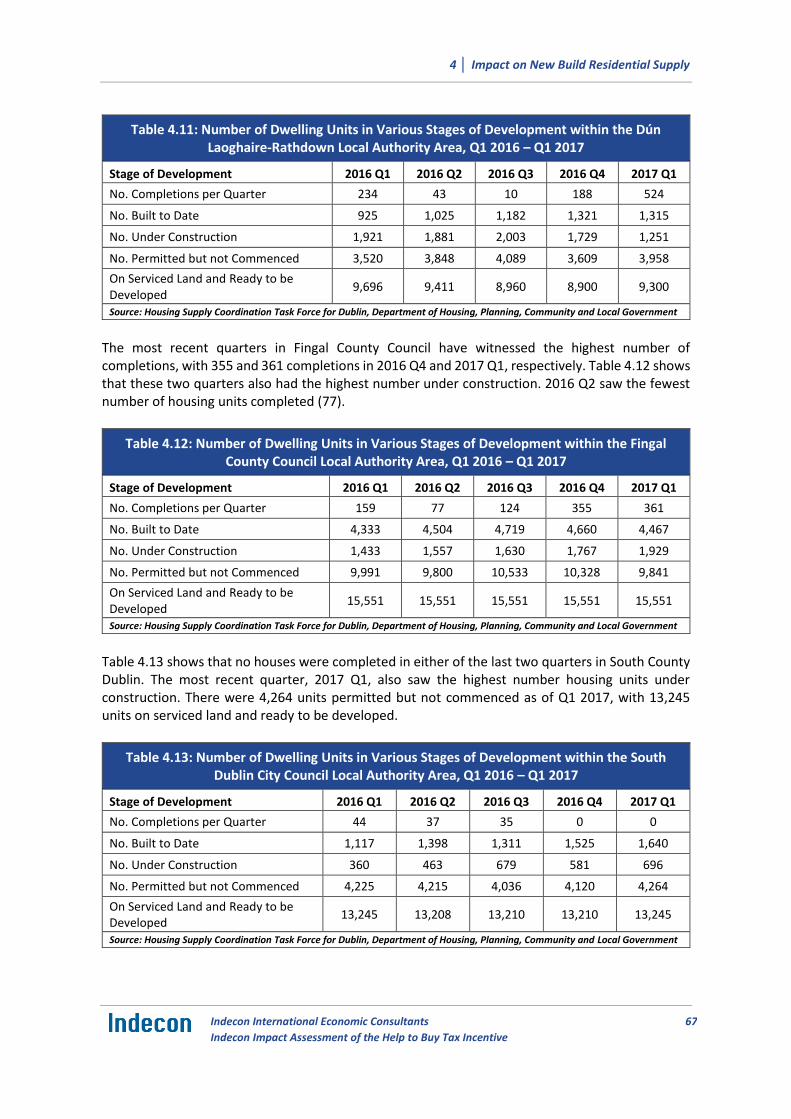
4 │ Impact on New Build Residential Supply
Indecon International Economic Consultants
Indecon Impact Assessment of the Help to Buy Tax Incentive
67
Table 4.11: Number of Dwelling Units in Various Stages of Development within the Dún Laoghaire-Rathdown Local Authority Area, Q1 2016 – Q1 2017
Stage of Development 2016 Q1 2016 Q2 2016 Q3 2016 Q4 2017 Q1
No. Completions per Quarter 234 43 10 188 524
No. Built to Date 925 1,025 1,182 1,321 1,315
No. Under Construction 1,921 1,881 2,003 1,729 1,251
No. Permitted but not Commenced 3,520 3,848 4,089 3,609 3,958
On Serviced Land and Ready to be Developed
9,696 9,411 8,960 8,900 9,300
Source: Housing Supply Coordination Task Force for Dublin, Department of Housing, Planning, Community and Local Government
The most recent quarters in Fingal County Council have witnessed the highest number of completions, with 355 and 361 completions in 2016 Q4 and 2017 Q1, respectively. Table 4.12 shows that these two quarters also had the highest number under construction. 2016 Q2 saw the fewest number of housing units completed (77).
Table 4.12: Number of Dwelling Units in Various Stages of Development within the Fingal County Council Local Authority Area, Q1 2016 – Q1 2017
Stage of Development 2016 Q1 2016 Q2 2016 Q3 2016 Q4 2017 Q1
No. Completions per Quarter 159 77 124 355 361
No. Built to Date 4,333 4,504 4,719 4,660 4,467
No. Under Construction 1,433 1,557 1,630 1,767 1,929
No. Permitted but not Commenced 9,991 9,800 10,533 10,328 9,841
On Serviced Land and Ready to be Developed
15,551 15,551 15,551 15,551 15,551
Source: Housing Supply Coordination Task Force for Dublin, Department of Housing, Planning, Community and Local Government
Table 4.13 shows that no houses were completed in either of the last two quarters in South County Dublin. The most recent quarter, 2017 Q1, also saw the highest number housing units under construction. There were 4,264 units permitted but not commenced as of Q1 2017, with 13,245 units on serviced land and ready to be developed.
Table 4.13: Number of Dwelling Units in Various Stages of Development within the South Dublin City Council Local Authority Area, Q1 2016 – Q1 2017
Stage of Development 2016 Q1 2016 Q2 2016 Q3 2016 Q4 2017 Q1
No. Completions per Quarter 44 37 35 0 0
No. Built to Date 1,117 1,398 1,311 1,525 1,640
No. Under Construction 360 463 679 581 696
No. Permitted but not Commenced 4,225 4,215 4,036 4,120 4,264
On Serviced Land and Ready to be Developed
13,245 13,208 13,210 13,210 13,245
Source: Housing Supply Coordination Task Force for Dublin, Department of Housing, Planning, Community and Local Government
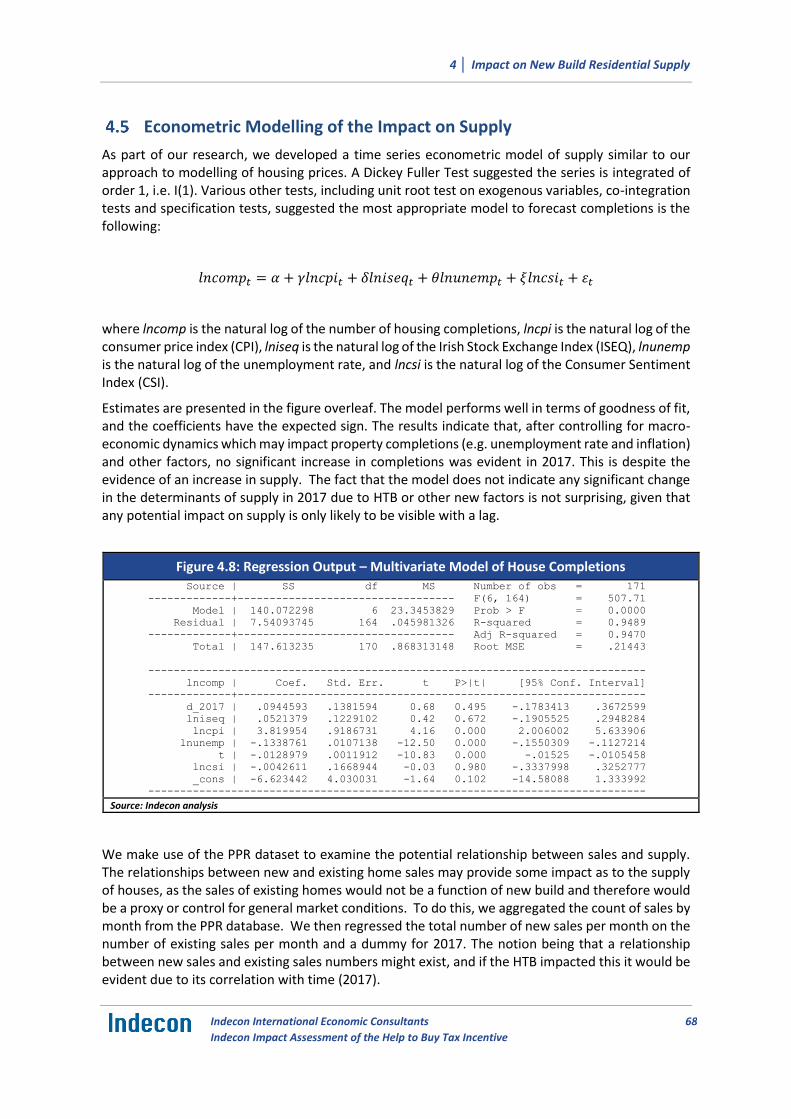
4 │ Impact on New Build Residential Supply
Indecon International Economic Consultants
Indecon Impact Assessment of the Help to Buy Tax Incentive
68
Econometric Modelling of the Impact on Supply
As part of our research, we developed a time series econometric model of supply similar to our approach to modelling of housing prices. A Dickey Fuller Test suggested the series is integrated of order 1, i.e. I(1). Various other tests, including unit root test on exogenous variables, co-integration tests and specification tests, suggested the most appropriate model to forecast completions is the following:
𝑙𝑛𝑐𝑜𝑚𝑝𝑡 = 𝛼 + 𝛾𝑙𝑛𝑐𝑝𝑖𝑡 + 𝛿𝑙𝑛𝑖𝑠𝑒𝑞𝑡 + 𝜃𝑙𝑛𝑢𝑛𝑒𝑚𝑝𝑡 + 𝜉𝑙𝑛𝑐𝑠𝑖𝑡 + 휀𝑡
where lncomp is the natural log of the number of housing completions, lncpi is the natural log of the consumer price index (CPI), lniseq is the natural log of the Irish Stock Exchange Index (ISEQ), lnunemp is the natural log of the unemployment rate, and lncsi is the natural log of the Consumer Sentiment Index (CSI).
Estimates are presented in the figure overleaf. The model performs well in terms of goodness of fit, and the coefficients have the expected sign. The results indicate that, after controlling for macro-economic dynamics which may impact property completions (e.g. unemployment rate and inflation) and other factors, no significant increase in completions was evident in 2017. This is despite the evidence of an increase in supply. The fact that the model does not indicate any significant change in the determinants of supply in 2017 due to HTB or other new factors is not surprising, given that any potential impact on supply is only likely to be visible with a lag.
Figure 4.8: Regression Output – Multivariate Model of House Completions Source | SS df MS Number of obs = 171
-------------+---------------------------------- F(6, 164) = 507.71
Model | 140.072298 6 23.3453829 Prob > F = 0.0000
Residual | 7.54093745 164 .045981326 R-squared = 0.9489
-------------+---------------------------------- Adj R-squared = 0.9470
Total | 147.613235 170 .868313148 Root MSE = .21443
------------------------------------------------------------------------------
lncomp | Coef. Std. Err. t P>|t| [95% Conf. Interval]
-------------+----------------------------------------------------------------
d_2017 | .0944593 .1381594 0.68 0.495 -.1783413 .3672599
lniseq | .0521379 .1229102 0.42 0.672 -.1905525 .2948284
lncpi | 3.819954 .9186731 4.16 0.000 2.006002 5.633906
lnunemp | -.1338761 .0107138 -12.50 0.000 -.1550309 -.1127214
t | -.0128979 .0011912 -10.83 0.000 -.01525 -.0105458
lncsi | -.0042611 .1668944 -0.03 0.980 -.3337998 .3252777
_cons | -6.623442 4.030031 -1.64 0.102 -14.58088 1.333992
------------------------------------------------------------------------------
Source: Indecon analysis
We make use of the PPR dataset to examine the potential relationship between sales and supply. The relationships between new and existing home sales may provide some impact as to the supply of houses, as the sales of existing homes would not be a function of new build and therefore would be a proxy or control for general market conditions. To do this, we aggregated the count of sales by month from the PPR database. We then regressed the total number of new sales per month on the number of existing sales per month and a dummy for 2017. The notion being that a relationship between new sales and existing sales numbers might exist, and if the HTB impacted this it would be evident due to its correlation with time (2017).

4 │ Impact on New Build Residential Supply
Indecon International Economic Consultants
Indecon Impact Assessment of the Help to Buy Tax Incentive
69
Results are reported in the figure below and indicate that, on average for the sample period, sales of new houses increase by approximately 6% for every 10% increase in sales of existing houses. The results suggest a break in this relationship in 2017, when sales of new houses accelerated compared to sales of existing houses. The result is robust to the inclusion of a linear time trend in the regression (results not presented).
Figure 4.9: Regression Output – New and Existing House Annual Sales from Property Price Register
Source | SS df MS Number of obs = 90
-------------+---------------------------------- F(2, 87) = 42.70
Model | 8.10560895 2 4.05280447 Prob > F = 0.0000
Residual | 8.25769911 87 .094916082 R-squared = 0.4954
-------------+---------------------------------- Adj R-squared = 0.4838
Total | 16.3633081 89 .183857394 Root MSE = .30808
------------------------------------------------------------------------------
lns_new | Coef. Std. Err. t P>|t| [95% Conf. Interval]
-------------+----------------------------------------------------------------
lns_old | .6138935 .0697424 8.80 0.000 .4752728 .7525141
d_2017 | .2429496 .1309418 1.86 0.067 -.0173114 .5032105
_cons | 1.181233 .5360647 2.20 0.030 .1157465 2.24672
Source: Indecon analysis
Recent and Expected New Supply
As part of the assessment of the HTB incentive, Indecon undertook a survey of the key stakeholders in the residential property sector. The findings of this survey provide a useful insight into the impact of the scheme on the supply of new housing units from the perspective of some of the key stakeholders in the sector.
Contractors responding to the Indecon survey were asked to indicate the number of new housing units, if any, which their business has built or commenced construction since 1 January 2017 in Dublin and in other regions. The total number of new builds which were built or commissioned construction since January 2017 by the sample of HTB contractors amounted to 3,098 of which 2,299 were in Dublin and 799 in other regions.
Table 4.14: No. of New Builds since January 2017
Dublin Other Regions
Total New Builds 2,299 799
Source: Indecon Survey of HTB Contractors
Contractors also indicated how many, if any, of these builds would potentially qualify for the HTB scheme. The total number of new-builds which would potentially qualify was just over 2,049.
Table 4.15: No. of New Builds since Jan 2017 that Qualify for Help to Buy
Total New Builds 2,049
Source: Indecon Survey of HTB Contractors

4 │ Impact on New Build Residential Supply
Indecon International Economic Consultants
Indecon Impact Assessment of the Help to Buy Tax Incentive
70
Contractors responding to the survey also provided data on how many additional new housing units they expect to build over the next three years. The total number of expected new builds among firms surveyed is estimated to be 12,752. This suggests that a significant increase in supply is likely over the next three years.
Table 4.16: Expected No. of New Houses to be Built Over Next 3 Years
Total Expected Builds 12,752
Source: Indecon Survey of HTB Contractors
Contractors views on the impact that the HTB scheme had on the decision to commence building new units appears positive, with 60% of respondents saying it encouraged them to commence building new units and 40% saying it had no impact.
Table 4.17: Impact of Help to Buy on Decision to Commence Building New Units
Encouraged Building New Units
Resulted in Building Fewer
Units No Impact Don’t Know
Percentage of Respondents
60% 0% 40% 0%
Source: Indecon Survey of HTB Contractors
A firm-level breakdown of responses reveals that a greater than average proportion of the large-sized firms indicated that the HTB scheme encouraged building new units.
Table 4.18: Impact of Help to Buy on Decision to Commence Building New Units by Firm Size
Encouraged
Building New Units
Resulted in Building Fewer
Units No Impact Don’t Know
Small 45% 0% 55% 0%
Medium 59% 0% 41% 0%
Large 89% 0% 11% 0% Source: Indecon Survey of HTB Contractors Note: The definitions of the firm-size categories are based on the firms’ responses to the Indecon Survey of Housing Sector Stakeholders, which asked stakeholders to indicate the number of additional new housing units they expect to build over the next three years.
Similarly, 78% of respondents said the scheme would likely incentivise them to build more units over the next three years, with the remaining 22% indicating it would have no impact. No respondents indicated it would result in fewer builds.

4 │ Impact on New Build Residential Supply
Indecon International Economic Consultants
Indecon Impact Assessment of the Help to Buy Tax Incentive
71
Table 4.19: Impact of Help to Buy on Decision to Build Over Next 3 Years
Likely to Incentivise More Units
Result in Fewer Units
No Impact Don’t Know
Percentage of Respondents
78% 0% 22% 0%
Source: Indecon Survey of HTB Contractors
When the responses are examined by firm size, this reveals that all of the large-sized firms indicated the HTB scheme would likely incentivise them to build more units over the next three years.
Table 4.20: Impact of Help to Buy on Decision to Build Over Next 3 Years by Firm Size
Likely to Incentivise
More Units Result in Fewer
Units No Impact Don’t Know
Small 73% 0% 27% 0%
Medium 73% 0% 27% 0%
Large 100% 0% 0% 0% Source: Indecon Survey of HTB Contractors Note: The definitions of the firm-size categories are based on the firms’ responses to the Indecon Survey of Housing Sector Stakeholders, which asked stakeholders to indicate the number of additional new housing units they expect to build over the next three years.
A key issue for policymakers is to examine the factors influencing the limited supply of new houses in Ireland. Over 90% of HTB contractors indicated that ‘the cost of building compared to market prices’ and ‘difficulties in developers obtaining finance to commence development’ were very significant or significant factors impacting the limited supply of new houses. A large majority of respondents also indicated that ‘difficulties in securing planning’, ‘uncertainty concerning ability of FTBs to obtain lending’ and ‘uncertainty concerning ability of other buyers to obtain lending’ were very significant/significant factors influencing supply.
Table 4.21: Impact on Limited Supply of New Houses
Very Significant
Significant
Neither Significant
nor Insignificant
Insignificant Very
Insignificant
Cost of building compared to market prices
69% 25% 5% 0% 0%
Difficulties in securing planning 42% 40% 15% 4% 0%
Difficulties in developers obtaining finance to commence development
56% 40% 4% 0% 0%
More attractive returns in other segments of property market
9% 21% 55% 15% 0%
Ongoing uncertainties on future demand for housing
9% 30% 35% 19% 7%
Uncertainty concerning ability of first-time buyers to obtain lending
28% 41% 26% 4% 2%
Uncertainty concerning ability of other buyers to obtain lending
15% 48% 31% 4% 2%
Source: Indecon Survey of HTB Contractors

4 │ Impact on New Build Residential Supply
Indecon International Economic Consultants
Indecon Impact Assessment of the Help to Buy Tax Incentive
72
Among the small-size firms, all (100%) of respondents indicated that ‘the cost of building compared to market prices’ and ‘difficulties in developers obtaining finance to commence development’ were very significant or significant factors impacting supply. A slightly lower proportion of small developers compared with the average of the entire sample were of the view that ‘difficulty in securing planning’, ‘uncertainty concerning ability of FTBs to obtain lending’ and ‘uncertainty concerning ability of other buyers to obtain lending’ were very significant or significant factors affecting supply.
Table 4.22: Impact on Limited Supply of New Houses (Small Developers)
Very
Significant Significant
Neither Significant
nor Insignificant
Insignificant Very
Insignificant
Cost of building compared to market prices
64% 36% 0% 0% 0%
Difficulties in securing planning
36% 36% 27% 0% 0%
Difficulties in developers obtaining finance to commence development
45% 55% 0% 0% 0%
More attractive returns in other segments of property market
9% 9% 73% 9% 0%
Ongoing uncertainties on future demand for housing
9% 18% 64% 9% 0%
Uncertainty concerning ability of first-time buyers to obtain lending
36% 27% 36% 0% 0%
Uncertainty concerning ability of other buyers to obtain lending
18% 45% 36% 0% 0%
Source: Indecon Survey of HTB Contractors Note: The definitions of the firm-size categories are based on the firms’ responses to the Indecon Survey of Housing Sector Stakeholders, which asked stakeholders to indicate the number of additional new housing units they expect to build over the next three years.
The views of the medium-sized firms were similar to that of the average of the entire sample.

4 │ Impact on New Build Residential Supply
Indecon International Economic Consultants
Indecon Impact Assessment of the Help to Buy Tax Incentive
73
Table 4.23: Impact on Limited Supply of New Houses (Medium Size Developers)
Very
Significant Significant
Neither Significant
nor Insignificant
Insignificant Very
Insignificant
Cost of building compared to market prices
70% 21% 9% 0% 0%
Difficulties in securing planning 48% 30% 15% 6% 0%
Difficulties in developers obtaining finance to commence development
58% 36% 6% 0% 0%
More attractive returns in other segments of property market
3% 28% 53% 16% 0%
Ongoing uncertainties on future demand for housing
6% 42% 27% 18% 6%
Uncertainty concerning ability of first-time buyers to obtain lending
18% 52% 21% 6% 3%
Uncertainty concerning ability of other buyers to obtain lending
15% 48% 27% 6% 3%
Source: Indecon Survey of HTB Contractors Note: The definitions of the firm-size categories are based on the firms’ responses to the Indecon Survey of Housing Sector Stakeholders, which asked stakeholders to indicate the number of additional new housing units they expect to build over the next three years.
As was the case for the small-size firms, all of the large-size firms indicated that ‘the cost of building compared to market prices’, ‘difficulties in securing planning’ and ‘difficulties in developers obtaining finance to commence development’ were very significant or significant factors impacting supply. Across the various factors, a greater proportion of the large-size firms agreed the listed factor was significant degree, with the exception of ‘ongoing uncertainties on future demand for housing’ and ‘uncertainty concerning ability of other buyers to obtain lending’ of which the proportion was slightly lower.
An issue of importance in considering the impact on supply is that changes in policy over a short period can impact market confidence. This was highlighted by a number of stakeholders consulted. For example, the Banking and Payments Federation Ireland indicated that “The HTB scheme was introduced to provide a measure of support for the housing market where the HTB scheme to be amended or withdrawn there could be an impact on supply resulting in an increase in uncertainty for all stakeholders in the market”.
The Association of Expert Mortgage Advisers suggested that the scheme has contributed to property price inflation but suggested that this is as much to do with a lack of supply as it has to do with the scheme. As supply starts to come on stream in the next 18-26 months they expect that the price of new starter homes is likely to plateau given the Central Bank macroprudential rules and general lending criteria. The Irish Brokers Association also suggested that as a result of the measure builders “are more confident in building as they know there are sufficient customers available to buy the end product”.

4 │ Impact on New Build Residential Supply
Indecon International Economic Consultants
Indecon Impact Assessment of the Help to Buy Tax Incentive
74
A similar issue was suggested to Indecon by the Society of Chartered Surveyors Ireland who suggested that, in their opinion, the HTB scheme, by focussing on demand, was a sub-optimal policy approach, but they concluded that “the early abolishment of the scheme in its infancy might do more harm than good for future policy”. Consultations with Property Industry Ireland (PII) also indicated that the “key issue facing the housing market is supply. PII is of the view that the improvement in demand has stimulated supply and more importantly in demand has stimulated supply of starter homes”. According to PII members the introduction of the scheme has given confidence to builders and has accelerated activity on sites for starter homes.
Table 4.24: Impact on Limited Supply of New Houses (Large Developers)
Very
Significant Significant
Neither Significant nor
Insignificant Insignificant
Very Insignificant
Cost of building compared to market prices
67% 33% 0% 0% 0%
Difficulties in securing planning 33% 67% 0% 0% 0%
Difficulties in developers obtaining finance to commence development
67% 33% 0% 0% 0%
More attractive returns in other segments of property market
33% 11% 44% 11% 0%
Ongoing uncertainties on future demand for housing
22% 0% 33% 33% 11%
Uncertainty concerning ability of first-time buyers to obtain lending
56% 22% 22% 0% 0%
Uncertainty concerning ability of other buyers to obtain lending
11% 44% 44% 0% 0%
Source: Indecon Survey of HTB Contractors Note: The definitions of the firm-size categories are based on the firms’ responses to the Indecon Survey of Housing Sector Stakeholders, which asked stakeholders to indicate the number of additional new housing units they expect to build over the next three years.
In examining the potential impact of increasing the HTB incentive on the supply of houses in the market, it is useful to examine available planning permission for HTB contractors. Table 4.25 shows that, as of end May 2017, there were 262 contractors approved by the Revenue Commissioners for HTB. These approved firms had planning permission for a total of 13,160 houses.

4 │ Impact on New Build Residential Supply
Indecon International Economic Consultants
Indecon Impact Assessment of the Help to Buy Tax Incentive
75
Table 4.25: Approved Developers by Size of Developments
Number of Homes Per Planning Permission
No. Contractors Total No. Homes % of Total Homes % of Approved
Contractors
0-25 Homes 120 923 7% 46%
26-50 Homes 40 1,358 10% 15%
51-75 Homes 34 2,072 16% 13%
76-100 Homes 10 864 7% 4%
101-150 Homes 23 2,853 22% 9%
150-200 Homes 12 2,076 16% 5%
200+ Homes 9 3,014 23% 3%
Not specified 14 - - 5%
Total 262 13,160 100% 100%
Source: Indecon analysis of Revenue Commissioners Data as at 29 May 2017
As part of the application process to become an approved contractor for the HTB scheme, firms were asked to provide as estimate of when they envisaged their developments to be completed. While not all firms provided these details, the following table outlines the expected percentage number of houses due to be completed. The majority of eligible houses were due to be completed by the end of 2018. However, it is notable that only 12.7% of planned developments were expected by end of June 2017.
Table 4.26: Indicative Estimates of Approved Developers by Expected Completion Dates
% of Planned
Developments Implied No of Houses.
By June 2017 12.7% 1,527
July – Dec 2017 25.2% 3,044
2018 37.7% 4,553
Later than 2018 24.3% 2,935
Source: Indecon analysis utilising Revenue Commissioners Data as of 6 September 2017

4 │ Impact on New Build Residential Supply
Indecon International Economic Consultants
Indecon Impact Assessment of the Help to Buy Tax Incentive
76
Summary of Findings
Data on the total housing stock in Ireland between the 2011 and 2016 shows that while the total population grew by 3.8% over this period, housing stock grew by only 0.4%. There has, however, been some evidence of improvements in the supply of housing in the Irish market in recent months, but as supply inevitably takes time to respond, any identifiable overall impact of the Help to Buy (HTB) on supply is likely to be only seen over time.
The level of housing supply will, in Indecon’s opinion, be largely determined by the cost of construction compared to prevailing market prices. It will also be influenced by the availability of finance for contractors and the assessment by builders and lenders of the sustainable level of effective demand. This is consistent with evidence from Indecon’s survey of contactors approved for the HTB scheme.
Over 90% of contractors surveyed indicated that ‘the cost of building compared to market prices’ and ‘difficulties in developers obtaining finance to commence development’ were very significant or significant factors impacting the limited supply of new houses. For larger companies who have the option of building offices or residential properties, the relative returns in each sector are likely to influence resource allowance decisions.
The total number of housing completions has been rising steadily on an annual basis, but the number of housing completions remains significantly below the number required to meet population growth and demand for housing.
The importance of supply is recognised not only by economists but also by the construction sector. The Construction Industry Federation indicated to Indecon that “there is no disagreement that the level of building activity falls well short of the sustainable demand for new homes.”
The data on the most recent house registrations in Ireland show that, in the first five months of 2017, there were 3,786 new registrations. This compares with 2,257 in the comparable period in 2016.
As part of our research, we developed a time series econometric model of supply similar to our approach to modelling of housing prices. The results of our econometric modelling indicate that, after controlling for macro-economic dynamics, no significant increase in completions was evident in 2017. The fact that the model does not indicate any significant change in 2017 due to HTB is not surprising given that HTB is a limited measure and any overall potential impact on supply is only likely to be visible with a lag.
Indecon analysis suggests that the HTB measure has not impacted significantly on overall housing supply to date. The measure is likely to have encouraged some limited new supply in the first half of 2017 and to improve the incentive for builders to provide additional units over the next three years. The 55 contractors surveyed by Indecon indicated they had built or commenced building 3,098 housing units since the measure was introduced and firms in this sample were planning on building 12,752 additional new housing units over the next three years. Most of the contractors also suggested that the HTB scheme encouraged them to commence building new units. Despite this finding, Indecon believes that other approaches to directly tackle the cause of undersupply will be critical to achieve an adequate supply of housing.

5 │ Impact of Affordability
Indecon International Economic Consultants
Indecon Impact Assessment of the Help to Buy Tax Incentive
77
5 Impact of Affordability
Introduction
The difficulties faced by first-time purchasers in financing deposits and mortgage repayments is likely to have contributed to the very significant decline in home ownership for those aged 25-34. This appears to be a greater problem than faced by older generations. For example, it has been noted that “younger households cannot access debt in the same way as the generation in front of them, those aged 35-45 thanks to severe rules, but when they do access mortgage credit they get whacked for it in the size of the bill for the home, which is rising fast again, especially in Dublin”.14 The scale of this issue can be seen from data in the next table which shows that only 30% of households whose head is aged between 25 and 34 own their home compared to 68.4% of households in 1991. While this may in part reflect demographic and other factors, it is also likely to have been impacted by mortgage affordability and by difficulties in funding the deposits required to meet Central Bank prudential rules.
Table 5.1: Home Ownership Rates of Households Aged 25-34
Own Outright Mortgage Total Home Ownership
1991 9.1 59.3 68.4
2011 2.9 39.4 42.3
2016 5.0 25.0 30.0
Source: NESC (2014) report and 2016 Census of Population
Affordability of housing is influenced by a number of factors including the cost of housing, the ability to secure mortgage finance, the feasibility of saving the level of deposit required by the Central Bank prudential requirements and the affordability of monthly mortgage repayments both at current interest levels and also if interest rates increase.
All of these factors are critical and it is important not to simply assume that some of these can be met. For example, if a purchaser can afford the mortgage repayments and if they could obtain finance, this is of no benefit if they are unable to save a sufficient amount to fund a deposit within a reasonable number of years. Similarly, if the price of a dwelling is such that a mortgage is more than 3.5 times their income the housing may not be affordable because of the implications of the level of deposit required.
The cost of housing is a key issue and while this is influenced by the interaction of supply and demand it is fundamentally determined by the prices at which supply is viable. This will be determined by construction costs, land costs, the cost of finance, VAT, development charges and planning requirements.
14 Stephen Kinsella, The Sunday Business Post, June 25, 2017.
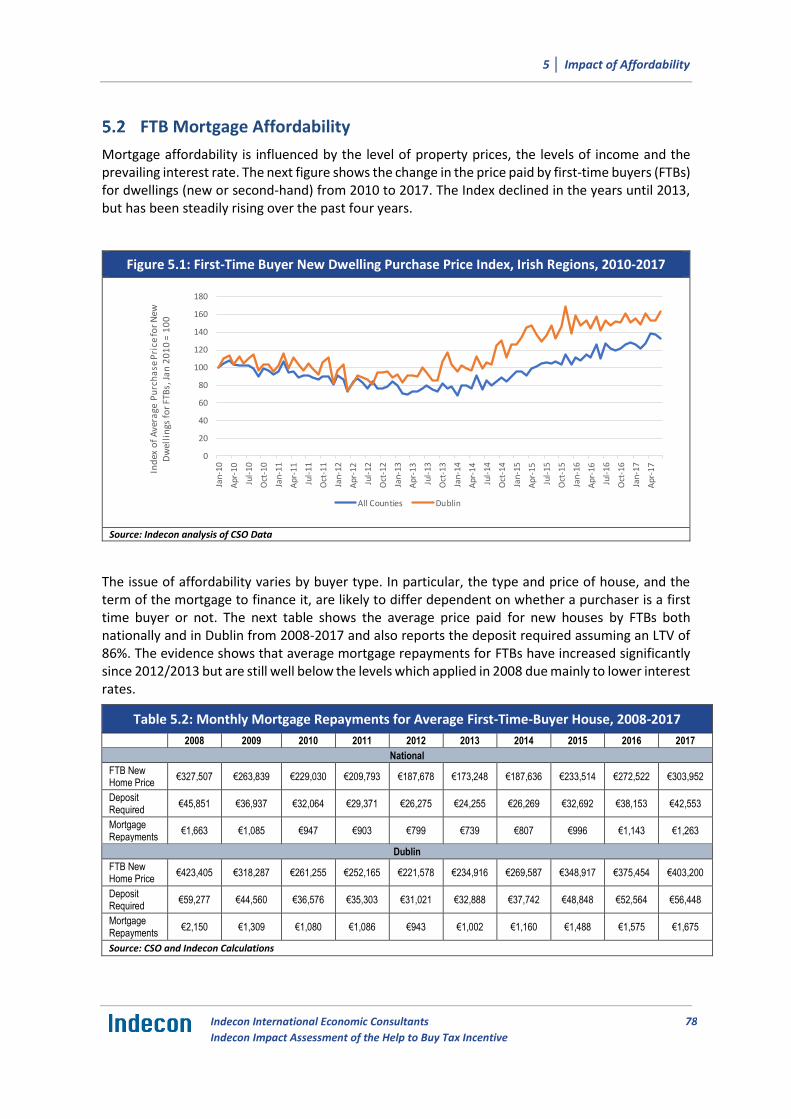
5 │ Impact of Affordability
Indecon International Economic Consultants
Indecon Impact Assessment of the Help to Buy Tax Incentive
78
FTB Mortgage Affordability
Mortgage affordability is influenced by the level of property prices, the levels of income and the prevailing interest rate. The next figure shows the change in the price paid by first-time buyers (FTBs) for dwellings (new or second-hand) from 2010 to 2017. The Index declined in the years until 2013, but has been steadily rising over the past four years.
Figure 5.1: First-Time Buyer New Dwelling Purchase Price Index, Irish Regions, 2010-2017
Source: Indecon analysis of CSO Data
The issue of affordability varies by buyer type. In particular, the type and price of house, and the term of the mortgage to finance it, are likely to differ dependent on whether a purchaser is a first time buyer or not. The next table shows the average price paid for new houses by FTBs both nationally and in Dublin from 2008-2017 and also reports the deposit required assuming an LTV of 86%. The evidence shows that average mortgage repayments for FTBs have increased significantly since 2012/2013 but are still well below the levels which applied in 2008 due mainly to lower interest rates.
Table 5.2: Monthly Mortgage Repayments for Average First-Time-Buyer House, 2008-2017
2008 2009 2010 2011 2012 2013 2014 2015 2016 2017
National
FTB New Home Price
€327,507 €263,839 €229,030 €209,793 €187,678 €173,248 €187,636 €233,514 €272,522 €303,952
Deposit Required
€45,851 €36,937 €32,064 €29,371 €26,275 €24,255 €26,269 €32,692 €38,153 €42,553
Mortgage Repayments
€1,663 €1,085 €947 €903 €799 €739 €807 €996 €1,143 €1,263
Dublin
FTB New Home Price
€423,405 €318,287 €261,255 €252,165 €221,578 €234,916 €269,587 €348,917 €375,454 €403,200
Deposit Required
€59,277 €44,560 €36,576 €35,303 €31,021 €32,888 €37,742 €48,848 €52,564 €56,448
Mortgage Repayments
€2,150 €1,309 €1,080 €1,086 €943 €1,002 €1,160 €1,488 €1,575 €1,675
Source: CSO and Indecon Calculations
0
20
40
60
80
100
120
140
160
180
Jan-
10
Apr
-10
Jul-
10
Oct
-10
Jan-
11
Apr
-11
Jul-
11
Oct
-11
Jan-
12
Apr
-12
Jul-
12
Oct
-12
Jan-
13
Ap
r-13
Jul-
13
Oct
-13
Jan-
14
Ap
r-14
Jul-
14
Oct
-14
Jan-
15
Ap
r-15
Jul-
15
Oct
-15
Jan-
16
Ap
r-16
Jul-
16
Oct
-16
Jan-
17
Apr
-17
Ind
ex o
f A
vera
ge P
urc
ha
se P
rice
for
New
D
wel
lin
gs fo
r FT
Bs,
Ja
n 2
01
0 =
10
0
All Counties Dublin

5 │ Impact of Affordability
Indecon International Economic Consultants
Indecon Impact Assessment of the Help to Buy Tax Incentive
79
The next figure shows the FTB property price to net income ratio (as calculated as a married couple with one earner on 100% of average earnings) declined following the economic crisis, reaching a trough in 2013. In the subsequent years, the ratio of property prices to income increased. The increase in the percentage of household income required to service a mortgage is concurrent with a rise in the ratio of property price to income, showing that housing is becoming less affordable.
Figure 5.2: First-Time-Buyer Dwelling Prices to Net Income Ratio 2008-2017
Source: Indecon analysis Note: The FTB Purchase Price for 2008 and 2009 is calculated based on adjusting the 2010 FTB Purchase Price with the Residential Property Price Index.
An analysis of the position of an FTB on average earnings in terms of the cost of the mortgage as a percentage of net income is shown in the table below. It indicates that 45% of net income would be required to meet mortgage repayment costs nationally, rising to 54% for a Dublin family. For the same family where the single earner is on the average full-time earnings, 37% of net income would be required to meet mortgage payments.
Table 5.3: Income and Mortgage Repayments - One-Earner First-Time-Buyer Married Couple at 100% of Average Earnings
2008 2009 2010 2011 2012 2013 2014 2015 2016 2017
National (Average Earnings)
Gross Income €36,866 €36,834 €36,481 €36,056 €36,199 €36,205 €36,269 €36,491 €36,736 €37,736
Net Income €34,817 €33,829 €33,051 €32,372 €32,154 €31,890 €31,861 €32,141 €32,770 €33,662
% of Net Income 57% 39% 34% 33% 30% 28% 30% 37% 42% 45%
National (Full-time Average Earnings)
Gross Income €44,160 €44,346 €44,274 €44,062 €44,523 €44,699 €44,836 €45,075 €45,611 €46,852
Net Income €41,284 €39,781 €39,072 €38,185 €38,481 €38,346 €38,372 €38,858 €39,575 €40,652
% of Net Income 48% 33% 29% 28% 25% 23% 25% 31% 35% 37%
Dublin (Average Earnings)
Gross Income €41,132 €41,097 €40,703 €40,229 €40,435 €40,449 €40,468 €40,716 €40,989 €42,105
Net Income €38,599 €37,206 €36,313 €35,402 €35,374 €35,116 €35,053 €35,447 €36,031 €37,012
% of Net Income 67% 42% 36% 37% 32% 34% 40% 50% 52% 54%
Source: CSO and Indecon Calculations
2008 2009 2010 2011 2012 2013 2014 2015 2016 2017
0
1
2
3
4
5
6
7
8
9
10

5 │ Impact of Affordability
Indecon International Economic Consultants
Indecon Impact Assessment of the Help to Buy Tax Incentive
80
The next table indicates that, for FTBs on 200% of average earnings which amount to income of approximately €75,000 (or a couple both working and earning average incomes), one-quarter of net income would be required in 2017 to cover mortgage repayments. This percentage has increased in the past five years. For a family earning twice full-time average earnings, the figure is lower (20%). As before, for a Dublin family the figure is higher despite the higher gross and net income of families in Dublin. Mortgage payments are estimated as accounting for 30% of income for these households, up from 17% in 2012.
Table 5.4: Income and Mortgage Repayments - Two-Earner First-Time-Buyer Married Couple Each Earning Average Earnings
2008 2009 2010 2011 2012 2013 2014 2015 2016 2017
National (Average Earnings)
Gross Income €73,731 €73,669 €72,963 €72,112 €72,397 €72,410 €72,538 €72,982 €73,473 €75,472
Net Income €64,171 €62,613 €61,380 €59,227 €59,024 €58,486 €58,484 €59,087 €60,053 €61,687
% of Net Income 31% 21% 19% 18% 16% 15% 17% 20% 23% 25%
National (Full-time Average Earnings)
Gross Income €88,320 €88,692 €88,548 €88,124 €89,046 €89,398 €89,672 €90,150 €91,222 €93,704
Net Income €75,258 €73,782 €72,914 €70,275 €70,512 €70,208 €70,306 €70,932 €72,567 €74,541
% of Net Income 27% 18% 16% 15% 14% 13% 14% 17% 19% 20%
Dublin (Average Earnings)
Gross Income €82,264 €82,194 €81,407 €80,457 €80,870 €80,897 €80,936 €81,432 €81,979 €84,209
Net Income €70,656 €68,951 €67,629 €64,985 €64,870 €64,342 €64,279 €64,917 €66,050 €67,847
% of Net Income 37% 23% 19% 20% 17% 19% 22% 28% 29% 30%
Source: CSO and Indecon Calculations
The figure overleaf shows the change in the percentage of net income for a FTB couple with combined earnings twice annual gross income. It is clear that a greater percentage of income on monthly mortgage is spent in Dublin than the rest of the country, despite Dublin incomes being higher than the rest of Ireland. Both the national and Dublin lines indicate a similar trend, with the percentage of income spent on mortgage repayments falling up until 2012/2013. Following 2012/2013, there have been increases in the percentage of income spent on mortgage repayments. For 2017, it is estimated that a Dublin family will have to spend 30% of their net income on mortgage payments. The comparable figure for the country as a whole is just under 25%.

5 │ Impact of Affordability
Indecon International Economic Consultants
Indecon Impact Assessment of the Help to Buy Tax Incentive
81
Figure 5.2 : Housing Affordability Trends for First-Time Buyers on Twice Average Earnings, 2008-2017
Source: Indecon Analysis
Where a couple have a combined income equal to three times average earnings (i.e. both are working and individually earn 150% of average earnings), mortgage affordability improves significantly. Mortgage repayments amount to around 18% of net income in 2017 nationally or 15% earning three times Full-time Average Earnings. The equivalent percentage for a Dublin household on three-times average earnings is 22%.
Table 1.1: Income and Mortgage Repayments - Two-Earner First-Time-Buyer Married Couple Earning 300% Average Earnings
2008 2009 2010 2011 2012 2013 2014 2015 2016 2017
National (Average Earnings)
Gross Income €110,597 €110,503 €109,444 €108,168 €108,596 €108,615 €108,807 €109,474 €110,209 €113,207
Net Income €85,922 €84,345 €82,904 €80,500 €80,382 €79,847 €80,246 €80,982 €82,095 €84,329
% of Net Income 23% 15% 14% 13% 12% 11% 12% 15% 17% 18%
National (Full-time Average Earnings)
Gross Income €132,480 €133,038 €132,822 €132,186 €133,569 €134,097 €134,508 €135,225 €136,833 €140,556
Net Income €98,833 €97,641 €96,698 €94,671 €95,116 €94,882 €95,666 €96,432 €98,070 €100,738
% of Net Income 20% 13% 12% 11% 10% 9% 10% 12% 14% 15%
Dublin (Average Earnings)
Gross Income €123,396 €123,291 €122,110 €120,686 €121,305 €121,346 €121,405 €122,148 €122,968 €126,314
Net Income €93,473 €91,891 €90,377 €87,886 €87,880 €87,358 €87,804 €88,586 €89,751 €92,193
% of Net Income 28% 17% 14% 15% 13% 14% 16% 20% 21% 22%
Source: Indecon
2008 2009 2010 2011 2012 2013 2014 2015 2016 2017
10%
15%
20%
25%
30%
35%
40%
Mo
nth
yl R
epa
ymen
ts a
s a
% o
f N
et
Inco
me
for
FTB
s o
n t
wic
e G
ross
Na
tio
na
l Ea
rnin
gs
National Dublin
5 │ Impact of Affordability
Indecon International Economic Consultants
Indecon Impact Assessment of the Help to Buy Tax Incentive
82
Financing of Deposits
A potentially larger issue for some individuals and families in relation to mortgage affordability is the ability to fund the deposit required to meet the Central Bank Prudential rules. The minimum deposit required is currently 10%, and borrowers must also restrict the overall mortgage level to meet the Loan-to-income ratio of 3.5 times gross income. The table overleaf shows the number of years required for a FTB to save a deposit under the current LTV rules for a range of property prices, both with and without the Help to Buy (HTB) scheme. This analysis assumes no further price changes related to the HTB scheme or other sources.
In particular, we present the average price nationally for FTBs of either a new or an existing home, the average property price nationally for FTBs of new homes, and the average price in Dublin for FTBs of new homes. We also present scenarios in which the purchasers are a couple where both partners earn the average gross income nationally and where both partners earn 1.5 times the average gross income nationally. We also consider a Dublin premium and also include the respective figures with the average earnings for a Dublin-based couple. Finally, we note that FTBs tend to be younger and thus may not earn the average income. Therefore, we also include the national average gross income of an individual working full time.
The table shows that ceteris paribus, without the HTB scheme, a family with combined incomes of three times the gross average earnings (€113,208) would need to save 10% of gross income for two years to have sufficient set aside for a 10% deposit on a house costing €239,998 (the average price paid by FTBs for new and second-hand houses nationally in June 2017). With the HTB scheme, this falls to one year. The time it takes to save rises as the cost of the dwelling rises. For example, for a dwelling which costs €303,952, the same family must save for 2.7 years without the HTB scheme, and 1.3 with it. For households with earnings equivalent to that of one full-time worker (€46,852), the Loan-to-income limit of 3.5 times income limits the mortgage size and would require a very high level of deposit. For example, if a family on this income level wished to purchase a house costing €303,952 (the average price of a new FTB house nationally), they would require a deposit of €139,970. This would take 29.9 years accumulate, assuming that they saved 10% of gross income. Such a family would also not be eligible for the HTB scheme, as the mortgage size would be less than 70% of the purchase value.

5 │ Impact of Affordability
Indecon International Economic Consultants
Indecon Impact Assessment of the Help to Buy Tax Incentive
83
Table 5.2: Time Required for First Time Buyer to Save a Deposit under New LTV Rules
Property price
Annual Earnings (Gross)
Max Mortgage (3.5*gross
income, max 90% LTV)
Deposit Required
without HTB incentive
Deposit Required with HTB incentive
No. years required to save deposit (if saving 10% of
gross income)
Without HTB
Incentive
With HTB incentive
€239,998
€46,852 €163,982 €64,413 €52,993 13.7 11.3
€75,472 €205,556 €22,840 €11,420 3.0 1.5
€84,210 €205,556 €22,840 €11,420 2.7 1.4
€93,704 €205,556 €22,840 €11,420 2.4 1.2
€113,208 €205,556 €22,840 €11,420 2.0 1.0
€126,315 €205,556 €22,840 €11,420 1.8 0.9
€303,952
€46,852 €163,982* €139,970 €139,970 29.9 29.9
€75,472 €264,152 €39,800 €24,602 5.3 3.3
€84,210 €273,557 €30,395 €15,198 3.6 1.8
€93,704 €273,557 €30,395 €15,198 3.2 1.6
€113,208 €273,557 €30,395 €15,198 2.7 1.3
€126,315 €273,557 €30,395 €15,198 2.4 1.2
€403,200
€46,852 €163,982* €239,218 €239,218 51.1 51.1
€75,472 €264,152* €139,048 €139,048 18.4 18.4
€84,210 €294,735 €108,465 €88,465 12.9 10.5
€93,704 €327,964 €75,236 €55,236 8.0 5.9
€113,208 €362,880 €40,320 €20,320 3.6 1.8
€126,315 €362,880 €40,320 €20,320 3.2 1.6 Source: Indecon analysis *Not eligible for HTB incentive because the mortgage value must be at least 70% of the property price.
For some categories of borrowers, the Central Bank prudential rules introduced in January 2017 have improved affordability since the start of 2017. Previously, the ceiling for first-time buyers was 90% for loans up to €220,000 and 80% for the balance. In the table below, we report the time required for a FTB to save a deposit under the old LTV rules for a range of property prices, ceteris paribus. This change had the effect of reducing the required deposit and therefore the number of years required to save for a deposit for those purchasing higher-value houses. For example, for a family on three times the average annual earnings (i.e. €113,208), it would have previously taken over five years (5.2) to save a sufficient deposit for a property priced €403,200 (the average price paid for new dwellings by FTBs in Dublin in June 2017) without the HTB scheme. From January 2017, this was reduced to 3.6 years. With the HTB scheme, this family would have had to have saved for 3.6 years (prior to 2017 under the old Central Bank rules) and 1.8 years (under the new Central Bank rules).

5 │ Impact of Affordability
Indecon International Economic Consultants
Indecon Impact Assessment of the Help to Buy Tax Incentive
84
Table 5.3: Time Required for First Time Buyer to Save a Deposit under Previous LTV Rules
Property price
Annual Earnings (Gross)
Max Mortgage (3.5*gross
income, max 90% LTV)
Deposit Required
without HTB incentive
Deposit Required with HTB incentive
No. years required to save deposit (if saving 10% of gross
income)
Without HTB Incentive
With HTB incentive
€228,395
€46,852 €163,982 €64,413 €52,993 13.7 11.3
€75,472 €204,716 €23,679 €12,259 3.1 1.6
€84,210 €204,716 €23,679 €12,259 2.8 1.5
€93,704 €204,716 €23,679 €12,259 2.5 1.3
€113,208 €204,716 €23,679 €12,259 2.1 1.1
€126,315 €204,716 €23,679 €12,259 1.9 1.0
€303,952
€46,852 €163,982* €139,970 €139,970 29.9 29.9
€75,472 €264,152 €39,800 €24,602 5.3 3.3
€84,210 €265,162 €38,790 €23,593 4.6 2.8
€93,704 €265,162 €38,790 €23,593 4.1 2.5
€113,208 €265,162 €38,790 €23,593 3.4 2.1
€126,315 €265,162 €38,790 €23,593 3.1 1.9
€403,200
€46,852 €163,982* €239,218 €239,218 51.1 51.1
€75,472 €264,152* €139,048 €139,048 18.4 18.4
€84,210 €294,735 €108,465 €88,465 12.9 10.5
€93,704 €327,964 €75,236 €55,236 8.0 5.9
€113,208 €344,560 €58,640 €139,048 5.2 3.4
€126,315 €344,560 €58,640 €38,640 4.6 3.1 Source: Indecon analysis *Not eligible for HTB incentive because the mortgage value must be at least 70% of the property price.
Indecon has also calculated estimates for the number of years that would be required for a couple to save for a deposit on a house in different places around the country. The calculations assume that they are able to save 10% of their gross income of twice national earnings each month and are not limited by the rule capping mortgages at 3.5 times income. Using the average sale price of property prices by buyer type in each region, Indecon is able to provide an estimate for the length of time it would take a notional couple to save for a deposit in certain counties, as well as at a national level. The Central Bank guidelines state that a deposit of 10% of the value of the house is required for the granting of a mortgage to FTBs, compared to 20% for second time and subsequent buyers.15 The HTB policy offers FTBs a tax rebate of 5% (subject to a maximum of €20,000), which can be used for a deposit. This would mean that FTBs, with full rebate, would be required to save 5% of the value of the house for a mortgage. The table shows that for the notional couple it would take 1.6 years for them to save up for their deposit, if they were able to save one-tenth of their gross income each month and they were a FTB eligible for the full rebate. This is half the time that would be required if they did not qualify for the rebate and had to save for a 10% deposit. The length of time is highest for Dublin.
15 https://www.centralbank.ie/financial-system/financial-stability/macro-prudential-policy/mortgage-measures
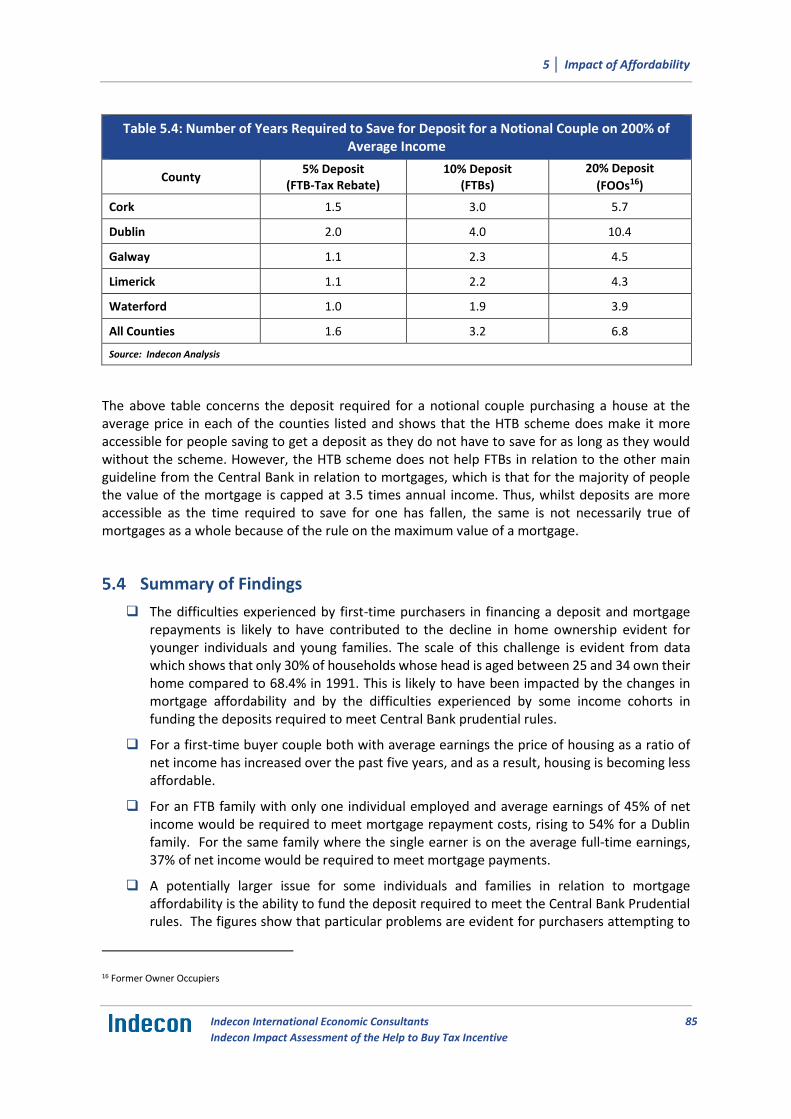
5 │ Impact of Affordability
Indecon International Economic Consultants
Indecon Impact Assessment of the Help to Buy Tax Incentive
85
Table 5.4: Number of Years Required to Save for Deposit for a Notional Couple on 200% of Average Income
County 5% Deposit
(FTB-Tax Rebate) 10% Deposit
(FTBs)
20% Deposit
(FOOs16)
Cork 1.5 3.0 5.7
Dublin 2.0 4.0 10.4
Galway 1.1 2.3 4.5
Limerick 1.1 2.2 4.3
Waterford 1.0 1.9 3.9
All Counties 1.6 3.2 6.8
Source: Indecon Analysis
The above table concerns the deposit required for a notional couple purchasing a house at the average price in each of the counties listed and shows that the HTB scheme does make it more accessible for people saving to get a deposit as they do not have to save for as long as they would without the scheme. However, the HTB scheme does not help FTBs in relation to the other main guideline from the Central Bank in relation to mortgages, which is that for the majority of people the value of the mortgage is capped at 3.5 times annual income. Thus, whilst deposits are more accessible as the time required to save for one has fallen, the same is not necessarily true of mortgages as a whole because of the rule on the maximum value of a mortgage.
Summary of Findings
The difficulties experienced by first-time purchasers in financing a deposit and mortgage repayments is likely to have contributed to the decline in home ownership evident for younger individuals and young families. The scale of this challenge is evident from data which shows that only 30% of households whose head is aged between 25 and 34 own their home compared to 68.4% in 1991. This is likely to have been impacted by the changes in mortgage affordability and by the difficulties experienced by some income cohorts in funding the deposits required to meet Central Bank prudential rules.
For a first-time buyer couple both with average earnings the price of housing as a ratio of net income has increased over the past five years, and as a result, housing is becoming less affordable.
For an FTB family with only one individual employed and average earnings of 45% of net income would be required to meet mortgage repayment costs, rising to 54% for a Dublin family. For the same family where the single earner is on the average full-time earnings, 37% of net income would be required to meet mortgage payments.
A potentially larger issue for some individuals and families in relation to mortgage affordability is the ability to fund the deposit required to meet the Central Bank Prudential rules. The figures show that particular problems are evident for purchasers attempting to
16 Former Owner Occupiers

5 │ Impact of Affordability
Indecon International Economic Consultants
Indecon Impact Assessment of the Help to Buy Tax Incentive
86
save the required deposit to purchase an average FTB new home in Dublin, even if there are two individuals each working full time and earning the average earnings for full-time employees. In this case, even assuming very high savings ratios of 10% of gross earnings, it would take such a couple eight years to save for a deposit without Help to Buy (HTB) and 5.9 years with HTB assistance. If this family was only able to save 5% of gross income the number of years required to save for a deposit on a new house in Dublin without HTB would be 16 years.
Particular problems are evident for purchasers attempting to save the required deposit to purchase an average FTB new home in Dublin, even if there are two individuals each working full time and earning the average earnings for full-time employees. In this case even assuming very high savings ratios of 10% of gross earnings it would take such a couple eight years to save for a deposit and 5.9 years with HTB assistance. If this family was only able to save 5% of gross income the number of years required to save for a deposit on a new house in Dublin without HTB would be 16 years.
For individuals or families with only one earner, working full time and receiving average full-time gross earnings it is not feasible to fund the deposit required by Central Bank rules without significant assistance from family or friends. Despite this it is clear that the HTB measure has assisted purchasers with the overall affordability of housing and in particular has reduced the number of years borrowers have to save to fund a deposit to meet Central Bank prudential rules. However, this could be eroded if price pass-through from the HTB scheme becomes evident. The figures also show that for higher income earners with combined incomes of €126,315 even without the HTB they would have been able to source the required deposit in 3.2 years if they were able to save 10% of gross earnings.

6 │ Design of the Incentive
Indecon International Economic Consultants
Indecon Impact Assessment of the Help to Buy Tax Incentive
87
6 Design of the Incentive
Introduction
In examining the design of the Help to Buy (HTB) incentive, it is necessary to consider the objectives set for the measure and how the scheme was structured to support these objectives. One of the key objectives was to address what was seen as a growing affordability gap for many households wishing to purchase their own homes. The plan also was designed to increase the output of private housing to meet demand at affordable prices.
Structure of the Help to Buy Incentive
The HTB incentive was structured to provide support to first time property buyers to aid with the deposit to buy or build a new house or apartment. It is restricted to properties which purchasers live in as their home. The incentive gives a refund of income tax and Deposit Interest Retention Tax (DIRT) that was paid in Ireland over the previous four years.
To claim HTB, an individual must:
Be a first-time buyer (FTB);
Buy or build a new property between 19 July 2016 and 31 December 2019;
Live in the property as their main home for five years after they buy or build it; and
Be tax compliant.
To qualify, an individual must not have previously bought or built a house or apartment, either on their own or jointly with any other person. If an individual is buying or building the new property with other people, they must also be FTBs.
If an individual is buying the property, they must have signed a contract to buy that property on or after 19 July 2016. If an individual is self-building, they must have drawn down the first part of the mortgage on or after that date. In addition to the above requirements, the contractor whom an individual is purchasing their home from must be approved by Revenue. To qualify for HTB, the property must be newly built with the construction subject to Value Added Tax (VAT) in Ireland.
The property must never have been used, or have been suitable to use, as a residential home. If the property was non-residential but has been converted for residential use, it may qualify for HTB.
The purchase value of a new build means the purchase price paid. For self-built property, the purchase value is the approved valuation by the lender at the time that the applicant took out the mortgage.
If the property was purchased between 19 July 2016 and 31 December 2016, the purchase price must be €600,000 or less. If bought after 1 January 2017, it must be €500,000 or less.
There is a requirement to take out a mortgage on the property with a qualifying lender. This loan must be used only for buying or building the property. The loan must be at least 70% of the purchase value of the property. This is known as the loan-to-value ratio.

6 │ Design of the Incentive
Indecon International Economic Consultants
Indecon Impact Assessment of the Help to Buy Tax Incentive
88
The amount that can be claimed under the HTB incentive is the lesser of:
€20,000;
5% of the purchase price of a new home. For self-builds, this is 5% of the completion value of the property; or
the amount of income tax and Deposit Interest Retention Tax (DIRT) paid in the four years before the purchase or self-build.
The maximum payment is €20,000 per property. This cap applies regardless of how many people enter into a contract to buy a house. Universal Social Charge (USC) or Pay Related Social Insurance (PRSI) are not taken into account when calculating how much you can claim.
There are two stages to the online process of applying for HTB:
The application stage; and
The claim stage.
Applications can be made as an individual or as part of a group if buying or building with other people. Applicants must complete a declaration and select the years they want to use for a refund. If they are tax compliant, the application will be approved and applicants are provided with an application number and a summary of the maximum amount they can claim. When an individual has signed the contract for their home and is ready to make a claim, the following steps must be completed online:
(i) Upload the following information about the application
A copy of the signed contract; Evidence of the mortgage (including loan-to-value ratio); and Proof of drawdown of the first part of the mortgage, if it is a self-build.
(ii) The next step requires an individual to log in to HTB through myAccount or Revenue Online Service (ROS) and make their claim. At this point individuals are asked to confirm details about the:
Property;
Purchase price;
Date of completion;
Mortgage; and
Amount of deposit already paid.
If applying with other people, applicants will also need to confirm the portion of the refund to be refunded to each person. If self-building, they will need to provide the BIC and IBAN of the loan bank account. Once a claim has been submitted a claim reference is provided.
(iii) Once a claim has been submitted, the developer or contractor will be advised (or solicitor if self-building). They will be provided with the claim reference (issued after step 2) and access code (issued when you submitted your application). Before a refund is received, the information provided will need to be verified by the:
Developer or contractor, in the case of a new build; or
Solicitor in the case of a self-build.

6 │ Design of the Incentive
Indecon International Economic Consultants
Indecon Impact Assessment of the Help to Buy Tax Incentive
89
The refund received is limited to 5% of the purchase price of the house. This means that it may differ from the maximum relief amount given at the application stage.
Indecon’s assessment is that the structure of the incentive was well designed but we do not have comprehensive information on whether at a wider policy level other options to address the objectives were evaluated. The structure of the measure is designed as a subsidy for buyers of new houses. While supply and demand are interlinked, it is clear to Indecon that the measure is primarily but not exclusively a demand measure. If the primary objective is to assist with a growing affordability gap as a compliment to other structural supply initiatives, our analysis suggests that this has in part been achieved. There are, however, other approaches which could be used to achieve this objective including the provision of equity loans which have been used effectively in other countries.
Indecon is not suggesting that equity loans or other options would represent a better alternative but we believe that in designing any new measures an evaluation of alternative ways of achieving the objectives should be undertaken.
If the primary objective is to increase supply due to the existence of market failure in the Irish housing market, the optimal solution would be to address the causes of market failure directly.
Criteria in Evaluation Tax Expenditure
The Department of Finance has published guidelines for best practice in evaluating tax expenditure programmes.17 These guidelines outline the role, features, and appropriate usages of tax expenditures in Ireland. The document also provides a framework approach for both ex-ante and ex-post evaluations of tax expenditure programmes.
The definition of tax expenditures in Irish legislation is based on an OECD definition which describes tax expenditures as a transfer of public resources that is achieved by:
Reducing tax obligations with respect to a benchmark tax; or
Reducing or postponing revenue for a comparatively narrow population of taxpayers relative to the tax base.
As the HTB Scheme has been operational since January 2017, the ex-post guidelines are of relevance to this report.
The guidelines outline the key evaluation questions for any ex-post evaluations:
Is the tax expenditure still relevant?
How much did the tax expenditure cost?
What was the impact of the tax expenditure?
Was it efficient?
17 Report on Tax Expenditures – Incorporating Department of Finance Guidelines for Tax Expenditure Evaluation. October 2014

6 │ Design of the Incentive
Indecon International Economic Consultants
Indecon Impact Assessment of the Help to Buy Tax Incentive
90
Relevance
As part of this interim evaluation, Indecon have assessed the HTB scheme as to its continued relevance in the context of the external economic environment. The HTB scheme was designed to enhance availability of adequate, affordable mortgage finance for FTBs as new housing output comes on-stream. Due to the relatively short duration since the HTB schemes inception, it is unsurprising that the objectives of the scheme are still relevant at this time. The supply shortages in the Irish housing market and the challenges faced by average earners in purchasing a home are very evident.
A change in relation to other policy interventions interacting with the HTB scheme concerns the introduction of the new Central Bank mortgage rules in January 2017. These new rules set the LTV requirements for FTBs at 90%. This change impacts the ability of FTBs in certain price categories to purchase a house. Indecon believes that, for some purchasers, the changes in the LTV will have reduced the period needed to save for a deposit, and this is likely to have reduced the need for HTB for some purchasers.
Cost
It is critical that the costs of the HTB scheme is established. It was originally projected that the HTB scheme would cost the Exchequer €50 million in 2017. The estimated total value of approved HTB claims to date amounts to €36.4 million, however there is some uncertainty on the final cost for 2017. An evidence-based update on the projected cost in 2017 will be available later in 2017.18 Revenue notes that the number of applications is not indicative of uptake, and may prove to be an unreliable basis to estimate the scheme’s costs. Some applicants may not purchase a property or may decide to purchase a property that is not eligible for the scheme. Further, details of the claim must be verified by the qualifying contractor or solicitor and therefore subject to potential timing delays outside of the control of Revenue. Indecon’s analysis of the available information on cost is broadly aligned with what was originally estimated.
Indecon have also estimated the cost of the Exchequer of the HTB scheme under a number of potential scenarios. The net Exchequer cost includes the gross direct cost of the subsidy itself; though, this is potentially offset by increases in other sources of revenue in so far as the scheme changes buyer and/or supplier behaviour. In particular, the Exchequer would benefit if the existence of the scheme induced the construction and sale of additional residential dwelling units. The gross cost of revenue foregone, less the additional revenue caused by additional construction activity, gives the net cost of the scheme to the Exchequer.
The first step is to calculate the gross cost of the HTB scheme, which is estimated based on two scenarios regarding the take-up of the scheme as follows:
• Scenario 1: The first scenario is based on the levels of take-up experienced by the verified claims for the first seven months of 2017 extrapolated for a full 12 months.
• Scenario 2: The second scenario is designed to capture a higher level of take-up, and is calculated as double that of the first scenario.
Both of these figures are multiplied by the average subsidy as experienced to date of the scheme.
18 Help To Buy (HTB) Incentive Statistics, Revenue Commissioners Statistics and Economic Research Branch, 3rd August 2017

6 │ Design of the Incentive
Indecon International Economic Consultants
Indecon Impact Assessment of the Help to Buy Tax Incentive
91
The second step is to calculate the Exchequer benefits, which arise in so far as the HTB scheme induces the additional construction of residential units that would not have otherwise been built. It is, however, important to take account of deadweight. In so far as the HTB scheme increases house construction, there are a number of potential benefits linked to the sale of additional new residential units to FTBs:
• Increase in VAT receipts;
• Increase in Stamp Duty Receipts;
• Development levies; (As these are not direct Exchequer payments we have not included these in our estimates); and
• Receipts related to increased employment and profits in the construction sector (e.g. income tax paid by construction workers). It is however necessary to take account of the opportunity cost of resources and these are likely to be very high in the current Irish construction sector. We have therefore not included any estimated benefits for this in this analysis.
In calculating the level of VAT and Stamp Duty revenues generated, Indecon have taken account of the probable existence of deadweight, in that who availed of the scheme are likely to have bought a new home anyway, and if a FTB had not bought a new property, a non-FTB buyer may have purchased the property. This suggests a level of deadweight – a point recognised by the Irish Brokers Association who suggested to Indecon that “some FTBs do need support”. However, our analysis also suggests that some FTB would not be able to purchase a home without the scheme. This was noted by the Institute of Professional Auctioneers and Valuers who indicated that “the scheme is helping aspiring FTBs to buy homes they may not otherwise have been in a position to buy”, given the Central Bank macroprudential rules. The results of a survey by one of the auctioneer firms of FTBs who had purchased since the scheme was introduced and supplied to Indecon19 indicated that 58 of the 60 buyers surveyed were availing of the HTB incentive. The results also indicated that 62% of the buyers stated that the HTB had speeded up their buying decision. 40% indicated they could have purchased the house with their own financial resources i.e. with no Help to Buy grant or other loans from family or friends.
To end of August there were 2,970 claims and this includes both retrospective and other purchases. There is also evidence of a decline in the number of claims. In developing our estimate for Exchequer costs, we estimate an annual number of units assisted by increasing claims at end of August by 25%, to arrive to an estimate of 3,712.
Indecon examines two estimates of the Exchequer benefit. In the first, we assume that 50% of new house builds taken up by FTB claimants under the HTB scheme were induced by the scheme and would not have been purchased in the absence of the scheme. In the second estimate of Exchequer benefits, we assume a 90% deadweight. Our figures are calculated based on the average price of FTB purchases under the scheme to date of €313,000. For self-builds VAT is only charged on the construction costs, and is calculated on an assumed VAT-inclusive cost of €150,000.
19 Source: Survey of First Time Buyers Undertaken by Leading Auctioneering Practice and Results Provided to Indecon
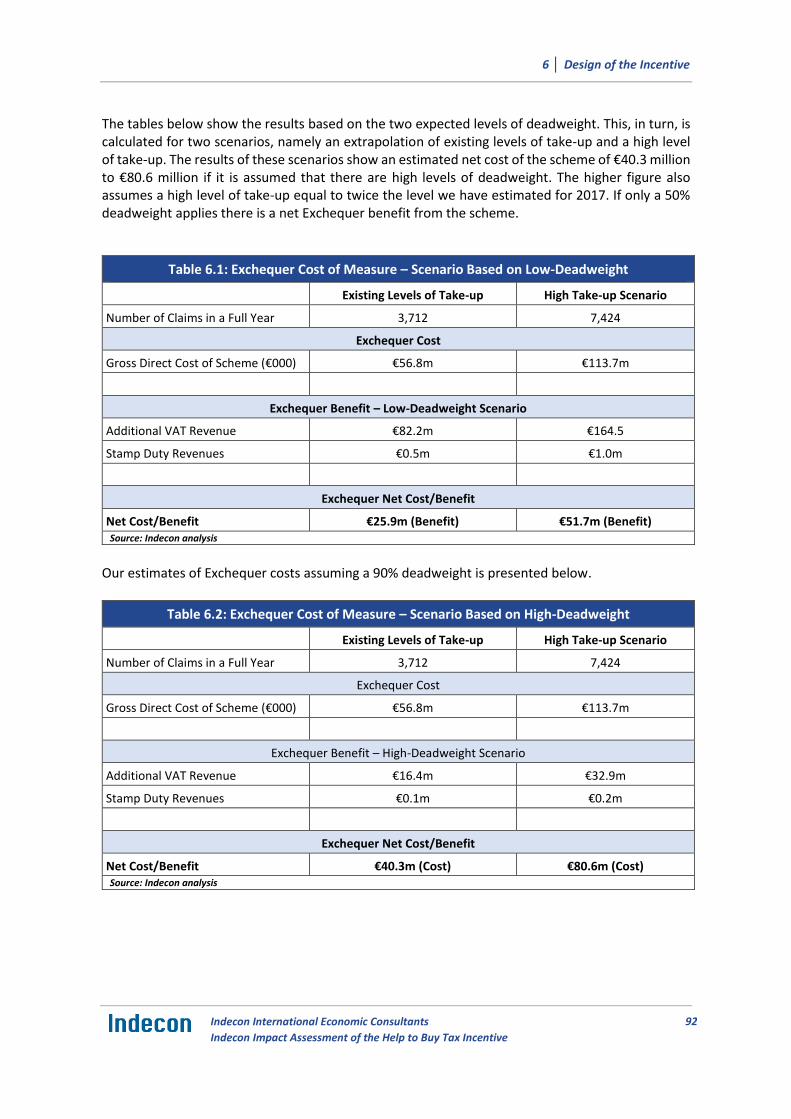
6 │ Design of the Incentive
Indecon International Economic Consultants
Indecon Impact Assessment of the Help to Buy Tax Incentive
92
The tables below show the results based on the two expected levels of deadweight. This, in turn, is calculated for two scenarios, namely an extrapolation of existing levels of take-up and a high level of take-up. The results of these scenarios show an estimated net cost of the scheme of €40.3 million to €80.6 million if it is assumed that there are high levels of deadweight. The higher figure also assumes a high level of take-up equal to twice the level we have estimated for 2017. If only a 50% deadweight applies there is a net Exchequer benefit from the scheme.
Table 6.1: Exchequer Cost of Measure – Scenario Based on Low-Deadweight
Existing Levels of Take-up High Take-up Scenario
Number of Claims in a Full Year 3,712 7,424
Exchequer Cost
Gross Direct Cost of Scheme (€000) €56.8m €113.7m
Exchequer Benefit – Low-Deadweight Scenario
Additional VAT Revenue €82.2m €164.5
Stamp Duty Revenues €0.5m €1.0m
Exchequer Net Cost/Benefit
Net Cost/Benefit €25.9m (Benefit) €51.7m (Benefit) Source: Indecon analysis
Our estimates of Exchequer costs assuming a 90% deadweight is presented below.
Table 6.2: Exchequer Cost of Measure – Scenario Based on High-Deadweight
Existing Levels of Take-up High Take-up Scenario
Number of Claims in a Full Year 3,712 7,424
Exchequer Cost
Gross Direct Cost of Scheme (€000) €56.8m €113.7m
Exchequer Benefit – High-Deadweight Scenario
Additional VAT Revenue €16.4m €32.9m
Stamp Duty Revenues €0.1m €0.2m
Exchequer Net Cost/Benefit
Net Cost/Benefit €40.3m (Cost) €80.6m (Cost) Source: Indecon analysis

6 │ Design of the Incentive
Indecon International Economic Consultants
Indecon Impact Assessment of the Help to Buy Tax Incentive
93
Impact
The impact of the HTB scheme on prices and supply is relatively difficult to measure due to the short period since its inception. The evidence examined does not suggest any identifiable separate impact of the HTB scheme on prices to date. Similarly, the analysis suggests that the HTB measure has not impacted significantly on overall supply to date but is likely to improve the incentive for builders to provide additional units over the next three years. The impact of the measure on affordability is evident and the scheme significantly reduces the time required to save for a deposit. However, this may be eroded if price pass-through from the HTB scheme becomes evident.
Efficiency
Our review suggests that the HTB measure has been implemented in an efficient manner and targets support for FTBs to help them fund the deposit on a house. By restricting the measure to owner occupiers and capping the level of support to the lesser of a number of criteria it has been efficient in minimising the Exchequer costs. However, by providing assistance on properties above the average values and by not linking the measure to incomes, the scheme is likely to have been subject to some deadweight.
Principles Relevant to Evaluation of Design of the Incentive
In addition to the issues examined, Indecon believes there are four principles which are relevant to our examination of the design of the HTB scheme. These are based on recommendations Indecon made following 2005 Review of Property Based Tax Incentives and are summarised in the table below. In this section, we examine how the design of HTB compares against these criteria.
Table 6.3: Principles Relevant to Design of Tax Incentives
1 Tax incentives schemes should require full disclosures of key information to the Exchequer by investors/promoters via a certification scheme or other mechanism to enable the full cost and impact of the schemes to be monitored.
2. The decision to introduce any new tax incentives should be informed by a formal assessment of the likely costs and benefits.
3. Where there is justification for government incentives the option of direct public expenditure as an alternative to tax incentives should be considered.
4. Any tax incentive schemes which are introduced should have a defined lifespan of a maximum of 3 years and extensions should only be considered after evaluation of the results of a formal cost-benefit appraisal.
Source: Indecon Review of Property Based Tax Incentives for the Department of Finance (2005)

6 │ Design of the Incentive
Indecon International Economic Consultants
Indecon Impact Assessment of the Help to Buy Tax Incentive
94
1. Tax incentives schemes should require full disclosures of key information to the Exchequer by investors/promoters via a certification scheme or other mechanism to enable the full cost and impact of the schemes to be monitored.
A major problem from a public policy perspective which applied historically to many of the property schemes was an absence of information on the level of take-up and the profile of beneficiaries. Without this information, it is not possible for policymakers to know the costs of the schemes or whether their continuation is valid or otherwise.
Indecon notes that the current HTB scheme has been structured in a way in which the costs are known in advance as part of the application and claims process as well as details on the recipients. This is a welcome development. Information collected by the Revenue Commissioners on the HTB noted earlier in this section, includes details of the following:
Loan-to-value ratio;
Purchase price;
Date of Completion; and
Mortgage.
In addition, inherent in the design of the scheme is information on the incomes and tax paid by purchasers. This information is very important in evaluating the scheme in measuring the costs of the incentive.
While the level of data collected on the HTB scheme is comprehensive, a better assessment of the impact of the scheme could be undertaken if there was potential to combine Revenue Commissioners data on claims with CSO data on price changes. We therefore recommend that CSO and the Revenue Commissioners investigate the potential to integrate data collection in the context of the wider National Data Infrastructure (NDI) work.
2. The decision to introduce any new tax incentives should be informed by a formal assessment of the likely costs and benefits.
There is a danger for policymakers that tax incentive schemes will be introduced without being informed of their likely costs and benefits. Indecon in 2005 recommended that a formal assessment of the likely costs and benefits should be undertaken for any new tax incentives schemes. We note that this was not undertaken in the case of the HTB initiative, but we understand that this reflected a concern to respond urgently to the emerging developments in the housing market. However, Indecon are concerned about any precedent this could cause, and we strongly recommend an ex-ante assessment of any future initiatives. We also note that Government policy as set out in the Medium Term Economic Strategy indicated that tax expenditures with higher costs would be subjected to ex-ante evaluation.

6 │ Design of the Incentive
Indecon International Economic Consultants
Indecon Impact Assessment of the Help to Buy Tax Incentive
95
3. Where there is justification for government incentives the option of direct public expenditure as an alternative to tax incentives should be considered.
Government intervention is only appropriate where there are market failures. Because of issues arising from the capital constraints in the banking sector and legacy issues for the property crash there are understandable limits on the availability of builders to secure finance for commercially viable investments. Planning and zoning restrictions also have resulted in higher land and construction prices which has impacted on the viability of new homes. The resultant shortage of supply of new houses has contributed to the mismatch between the output of affordable houses and the levels of demand. This results in negative economic externalities as people who are forced to rely on a restricted rental market or to seek government provision of housing. Where there is market failure and a justification for government incentives, Indecon believe that the best option is to tackle the cause of market failure directly or to consider the option for providing direct public expenditure as an alternative to a tax incentive. In a number of the property schemes previously reviewed by Indecon, we found that the tax incentives were a very inappropriate way to fund the much-needed investment in this sector. In certain cases, the tax incentives represented a very expensive form of public sector borrowing. We therefore recommended that, where there is justification for government incentives, the option of direct public expenditure as an alternative to tax incentives should be considered.
Indecon notes that a similar principle was referred to in the Governments Medium Term Economic Strategy which indicated that the Government will “use the tax system in limited circumstances where there are demonstrable market failures and a tax-based incentive is more efficient than a direct-expenditure intervention”. Indecon’s assessment of the HTB is that there was a valid market failure argument for the HTB introduction. We also believe that the HTB, as a tax refund incentive, was likely to be as efficient as a direct expenditure intervention. However, Indecon notes that the tax incentive mechanism used is likely to have limited the level of take–up, thereby reducing the overall costs. Given the uncertainty about whether there would be an adequate supply response, restricting the level of take-up is likely to have been appropriate. However, there may be merit in considering a small adjustment to assist returning emigrants to access affordable housing by allowing a tax refund on the last four years in which tax was paid.
4. Any tax incentive schemes which are introduced should have a defined lifespan of a maximum of 3 years and extensions should only be considered after evaluation of the results of a formal cost-benefit appraisal.
Tax incentives frequently result in a much greater level of activity than was originally envisaged. In many cases, incentives may be needed to address specific issues at a particular time but are unnecessary after a period.
The principle is aligned with the Government commitments in the Medium Term Economic Strategy to “time-limit all tax expenditures” and to “conduct a regular programme of tax relief reviews”.
Indecon believes that the restriction of the measure to a temporary initiative for properties purchased before 19 July 2016 and 31 December 2019 was appropriate and a welcome feature of the design of the initiative.

6 │ Design of the Incentive
Indecon International Economic Consultants
Indecon Impact Assessment of the Help to Buy Tax Incentive
96
Summary of Findings
The Help to Buy (HTB) incentive was announced as part of the 2016 “Rebuilding Ireland – Action Plan for Housing and Homelessness” of the Department of Housing, Planning, Community and Local Government and was seen as a complement to the structural actions set out in the Plan. The incentive is limited to a three-and-a-half-year period (July 2016 – December 2019).
The HTB incentive was envisaged as a scheme to improve the availability of adequate, affordable mortgage finance for first-time buyers (FTBs) as new housing output comes on-stream. The HTB scheme as designed provides a refund of income tax and Deposit Interest Retention Tax (DIRT) paid in Ireland over the previous four years.
The design of the scheme implies that a mortgage on the property must be taken out with a qualifying lender and must be at least 70% of the purchase value of the property. This is an appropriate design feature to minimise the level of deadweight but the interaction of this with the Central Bank 3.5 LTV means that it may have an unintended impact on low earners wishing to avail of the scheme. In practice, these potential purchasers may even without this restriction have difficulty in obtaining finance. The scheme has been designed to also restrict the amount that can be claimed under the HTB incentive to the lesser of: €20,000 or 5% of the purchase price of a new home and must not be greater than the amount of income tax and Deposit Interest Retention Tax (DIRT) paid in the four years before the purchase or self-build.
Given these design features Indecon has examined the scheme against the criteria set in Government guidelines on evaluating tax incentives. The four key questions are as follows: Is the tax expenditure still relevant? How much did the tax expenditure cost? What was the impact of the tax expenditure? Was it efficient?
With regard to relevance of the measure, due to the relatively short duration since the HTB schemes inception, it is not surprising that the objectives of the scheme are still relevant. The difficulties with affordability and the limited level of new supply in the Irish housing market are still major issues.
With respect to the cost of the tax expenditure, the costs of the HTB scheme is within projected levels; however, a good proportion of 2017 still remains. In addition, we understand that the Revenue Commissioners are preparing new projections on costs and we recommend costs are reassessed following this forthcoming review.
The impact of the HTB scheme on prices and supply is difficult to measure due to the short period since its inception. The evidence examined does not suggest any identifiable separate impact of the HTB scheme on prices to date. Similarly, the analysis suggests that the HTB measure has not impacted significantly on overall supply to date but is likely to improve the incentive for builders to provide additional units over the next three years. The impact of the measure on affordability is evident and the scheme significantly reduces the time required to save for a deposit. However, this may be eroded if price pass-through from the HTB scheme becomes evident.
Our review suggests that the HTB measure has been implemented in an efficient manner and targets support for FTBs to help them fund the deposit on a house. By restricting the measure to owner occupiers and capping the level of support to the lesser of a number of criteria it has been efficient in minimising the Exchequer costs. However, by providing assistance on properties above average values and by not linking the measure to incomes, the scheme is likely to have been subject to deadweight.

7 │ Conclusions
Indecon International Economic Consultants
Indecon Impact Assessment of the Help to Buy Tax Incentive
97
7 Conclusions
As summary of our conclusions are presented in the table below. These are designed to improve the probability that the objectives set for the Help to Buy (HTB) in terms of affordability and increased housing supply will be met while reducing the risks that the measure will contribute to inflationary pressures. Our analysis suggests that structural measures are required which directly address the supply problem.
Summary of Key Conclusions
1. HTB scheme is primarily but not exclusively a demand led measure and there is legitimate concern that, in a period of inadequate supply, the measure could result in increased inflationary pressures on property prices therefore reducing any benefit in terms of mortgage affordability.
2. This preliminary empirical analysis completed by Indecon suggests that to date there is no evident impact on overall prices of new homes for first-time buyers (FTBs) as a result of the measure. This is likely to be because of the limited level of take up to date and the fact that the incentive was confined to a segregated segment of the market. It will be vital to monitor the price of HTB new builds over the coming months. This is particularly the case given the revisions by the CSO to the Residential Property Price (RPPI) index announced in August. This means that the index now captures both off the plans purchases and some transactions previously excluded from the index. This change could have a non-trivial impact on emerging prices over the coming months.
3. There is potential that if the level of HTB take-up accelerates that inflationary pressures would result if there is not an adequate supply response. This highlights the priority which should be given to expanding supply.
4. The HTB measure does not appear to have had any significant overall impact to date on the level of supply. While this was an objective of the scheme, it is not surprising that any impact on supply to date is muted given the time lag required to construct new houses. By increasing effective demand for new homes in certain price categories, the scheme is likely to have encouraged some limited new supply in the first half of 2017 and has increased confidence in the sector. Contractors have indicated plans to expand the supply of new houses over the next three years. The monitoring of these plans is critical to an evaluation of whether the measure contributes to inflationary pressures in the housing market. An abolishment of the scheme at this time would create uncertainty and damage confidence and would likely impact on the levels of new builds.
5. Since the HTB measure was introduced, changes in Central Bank prudential rules have made it easier for some categories of first-time buyers (FTBs) to fund deposits. The need for the HTB incentive may be reduced for some purchasers as a result of this change.
6. The HTB measure has enhanced affordability for FTB and has reduced the number of years required for purchasers to save the deposit for new houses. There is however likely to be some purchasers who did not need the incentive suggesting an element of deadweight and particular affordability issues remain for those on lower incomes. Furthermore, the enhanced affordability may erode if price pass-through from the incentive becomes evident.
7. The design of the scheme has a number of desirable characteristics, including the time limited nature of the incentive, the restriction to a segment of the market and the introduction of an application process which means that the costs and profile of purchasers is obtained. The restriction of the measure to owner occupiers is also a welcome development in minimising any distortionary impacts.
8. A cost-benefit evaluation of the scheme was not undertaken prior to its introduction. While there were understandable reasons for this, Indecon are concerned that this should not be seen as a precedent for other measures.
9. The cap of €20,000 and the restriction to house purchases below €500,000 have improved equity compared to the position without these elements. However, there is no correlation with individuals’ incomes, and there is likely to be deadweight in the scheme for some recipients of the incentive.
10. Targeting the incentive to provide greater support to assist individuals or couples with average incomes to fund deposits may be appropriate.
11. The key challenge for the housing market is to reduce the costs of housing, including both house prices and the cost of construction.
12. A comprehensive cost-benefit analysis of the scheme should be undertaken after a period, as given the limited time since the measure was introduced, this report inevitably can only represent a preliminary assessment.

Annex 1 │ Bibliography
Indecon International Economic Consultants
Indecon Impact Assessment of the Help to Buy Tax Incentive
98
Annex 1 Bibliography
Adams, Zeno, and Roland Füss, 2010. "Macroeconomic determinants of international housing markets." Journal of Housing Economics 19.1: 38-50.
Callaghan, N., Hegarty, D., Hynes, T., McGann, M., O’Connor, B., and Weymes, L., 2014. Quantification of the Economic Impacts of Selected Structural Reforms in Ireland. IGEES Working Paper, July 2014.
Cameron, Gavin, John Muellbauer, and Anthony Murphy, 2006. "Was There A British House Price Bubble? Evidence from a Regional Panel."
Case, K., Shiller, R., 1989. The Efficiency of the Market for Single-Family Homes. American Economic Review 79 (1), 125-137.
Cassidy, M. and N. Hallissey (2016), “The introduction of macroprudential measures for the Irish mortgage market”, Economic and Social Review, 47 (2), pp. 271-297.
Conniffe, D., Duffy, D., 1999. Irish House Price Indices – Methodological Issues. The Economic and Social Review 30 (4), 403-423.
ESRI, Quarterly Economic Commentary, Spring 2017.
Gerlach-Kristen, P., O'Connell, B., and O'Toole, C., 2013. How do banking crises affect aggregate consumption? Evidence from international crisis episodes. ESRI Working Paper Number 424.
Glaeser, E., Gyourko, J., 2008. Arbitrage in Housing, in: Glaeser, E., Quigley, J. (Eds.), Housing and the Built Environment: Access, Finance, Policy. Lincoln Land Institute of Land Policy, Cambridge, MA.
Glaeser, E., Gyourko, J., Saiz, A., 2008. Housing Supply and Housing Bubbles. Discussion Paper No. 2158, Harvard Institute of Economic Research.
Gray, A. W., 1997, Challenges for Ireland in the Integrated European Union, Essay 5 to Celebrate T.K. Whitakers 80 years, Ed. By O’Muircheartaigh, F., Institute of Public Administration.
Gray, A. W., ‘Responses to Irish Unemployment: The Views of Four Economists’, Indecon 1992.
Gregg, P., “Redeveloping Ireland’s Residential Property Price Index (RPPI)”, Ottawa Group, 10-12 May 2017, Eltville, Germany.
Hendry, D., 1984. Econometric Modelling of House Prices in the United Kingdom, in: Hendry, D.F., Wallis, K.F. (Eds.), Econometrics and Quantitative Economics. Basil Blackwell.
Hilbers, P., Hoffmaister, A.W., Banerji, A., Shi, H., 2008. Housing Price Development in Europe: A Comparison. Working Paper No. 211, International Monetary Fund, European Department.
Hirata, Hideaki, et al., 2012. Global house price fluctuations: Synchronization and determinants. No. w18362. National Bureau of Economic Research.
Indecon Review of Property-Based Tax Incentive Scheme, Report for the Department of Finance, October 2005.
Annex 1 │ Bibliography
Indecon International Economic Consultants
Indecon Impact Assessment of the Help to Buy Tax Incentive
99
Irvine, I.J., 1984. A Study of New Houses Prices in Ireland in the Seventies. ESRI General Research Series Paper No. 118.
Kenneally, M., McCarthy, J.V., 1982. A Preliminary Econometric Investigation of the Irish Housing Market, 1969-76. The Economic and Social Review 14, 41-69.
Kenny, G., 1999. The Housing Market and the Macroeconomy: Evidence from Ireland. Economic Modelling 16, 389-409.
Kinghan, C., Lyons, P., McCarthy, Y., and O’Toole, C., 2017. Macroprudential Measures and Irish Mortgage Lending: An Overview of Lending in 2016. Central Bank Economic Letters Series, Volume 2017, Number 6.
Kinsella, S., The Sunday Business Post, June 25, 2017.
Lane P., Report on Comments in Article by John Walsh in the Times Newspaper, July 24th, 2017.
Linneman, P., 1986. An Empirical Test of the Efficiency of the Housing Market. Journal of Urban Economics 20, 140-154.
Lyons, R., Lyons, S., and Stanley, S., 2016. The price effect of building energy ratings in the Dublin residential market. Energy Efficiency 9:4 (2016): 875-885.
Lyons. R., “The Pitfalls of Wooing First-time buyers” Daft.ie insights, September 28th, 2016.
Lyons, R., 2015. Housing supply in Ireland since 1990: The role of costs and regulation. Journal of the Statistical and Social Inquiry Statistical Society of Ireland 44 (2015): 141-155.
Lyons, R., 2015. East, west, boom and bust: the spread of house prices and rents in Ireland, 2007–2012. Journal of Property Research, 32:1 (2015): 77-101.
McCord, M., et al., 2012. "Spatial variation as a determinant of house price: Incorporating a geographically weighted regression approach within the Belfast housing market." Journal of Financial Management of Property and Construction 17.1: 49-72.
McQuinn, K., 2004. A Model of the Irish Housing Sector. Research Technical Paper 1/RT/04, Central Bank and Financial Services Authority of Ireland.
McQuinn, K., O’Reilly, G., 2006. Assessing the Role of Income and Interest Rates in Determining House Prices. Economic Modelling 25, 377-390.
McQuinn, K., O’Reilly, G., 2007. A Model of Cross-Country House Prices. Research Technical Paper 5/RT/07, Central Bank and Financial Services Authority of Ireland.
Meese, R., Wallace, N., 1994. Testing the Present Value Relation for House Prices: Should I Leave My House in San Francisco? Journal of Urban Economics 35, 245-266.
Murphy, A., 1998. Econometric Modelling of the Irish Housing Market, in: Bacon, P., McCabe, F., Murphy, A. (Eds), An Economic Assessment of Recent House Price Developments. Stationary Office, Dublin.

Annex 1 │ Bibliography
Indecon International Economic Consultants
Indecon Impact Assessment of the Help to Buy Tax Incentive
100
National Competitiveness Council, 2016. A Study to Examine the Affordability of Irish Housing Prepared by Indecon International Consultants on behalf of the National Competitiveness Council.
NESC, 2014. Homeownership and Rental: What Road is Ireland On? National Economic and Social Council Background Paper No. 140, December 2014.
Pedroni, P., 2001. Purchasing Power Parity Test in Cointegrated Panels. Review of Economics and Statistics 83 (4). 727–31.
Posedel, Petra, and Maruska Vizek, 2009. "House price determinants in transition and EU-15 countries." Post-communist economies 21.3: 327-343.
Poterba, J., 1984. Tax Subsidies to Owner-Occupied Housing: An Asset-Market Approach. The Quarterly Journal of Economics. 99 (4), 729–52.
Roche, M., 1999. Irish House Prices: Will the Roof Fall In? The Economic and Social Review 30 (4), 343-362.
Roche, M., 2001. The Rise in Dublin City House Prices: Bubble, Fad or Just Fundamentals. Economic Modelling 18 (2), 281-295.
Shiller, R., 1981. Do Stock Prices Move Too Much to be Justified by Subsequent Changes in Dividends? American Economic Review 71 (3), 421-436.
Stock, J., Watson, M., 1993. A Simple Estimator of Cointegrating Vectors in Higher Order Integrated Systems. Econometrica 61 (4), 783-820.
Topel, R., Rosen, S., 1988. Housing Investment in the United States. Journal of Political Economy 96 (4), 718-740.
Turnbull, D., 2017. A long-term assessment of Irish house price affordability. NERI Working Paper Series.
Van Norden, S., 1996. Regime-Switching as a Test for Exchange Rate Bubbles. Journal of Applied Econometrics 11, 219-251.
Van Norden, S., Vigfusson, R., 1996. Regime-Switching Models: A Guide to the Bank of Canada Gauss Procedures. Central Bank of Canada Working Paper 96-3.


![Indecon+Report+on+EFL+Sector.+November+07+Amended[1] 23-9-09 Failte Ireland Website](https://img.pdfslide.net/doc/110x75/54687d81b4af9fe7768b4be5/indeconreportoneflsectornovember07amended1-23-9-09-failte-ireland-website.jpg)


