Embed Size (px)
Citation preview
2013-14 School Accountability Report Card for Independence High School Page 1 of 12
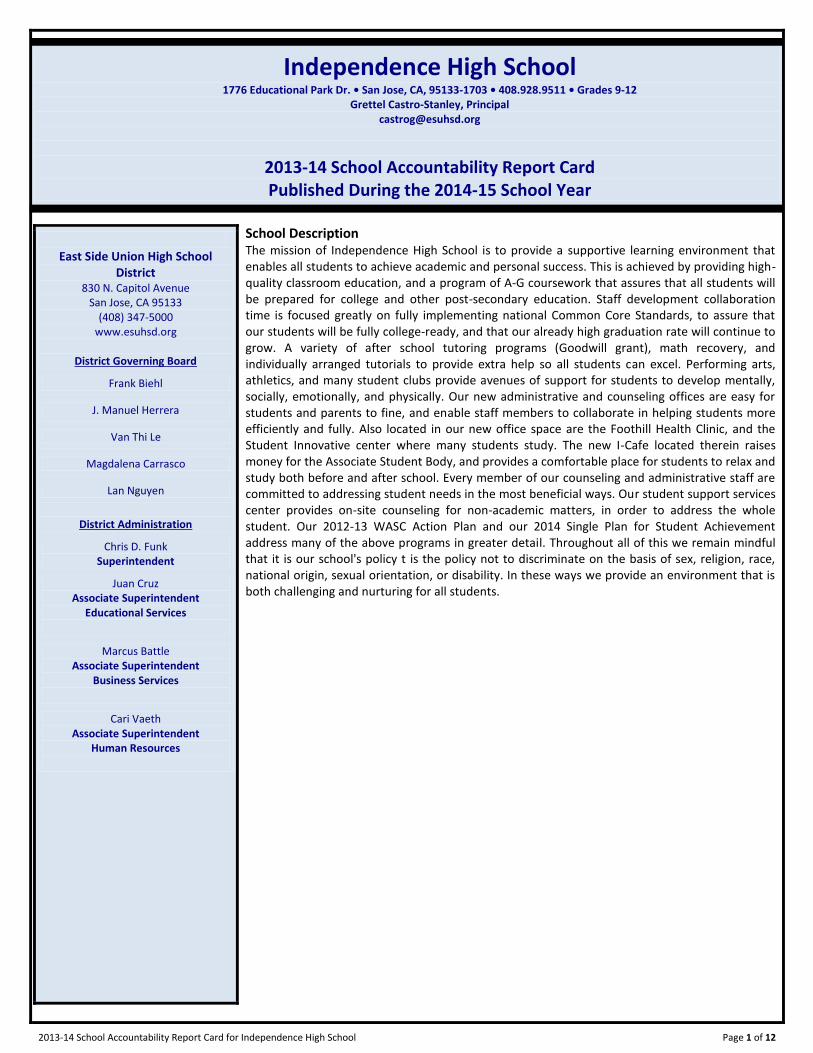
Independence High School
1776 Educational Park Dr. • San Jose, CA, 95133-1703 • 408.928.9511 • Grades 9-12 Grettel Castro-Stanley, Principal
2013-14 School Accountability Report Card
Published During the 2014-15 School Year
East Side Union High School District
830 N. Capitol Avenue San Jose, CA 95133
(408) 347-5000 www.esuhsd.org
District Governing Board
Frank Biehl
J. Manuel Herrera
Van Thi Le
Magdalena Carrasco
Lan Nguyen
District Administration
Chris D. Funk Superintendent
Juan Cruz Associate Superintendent
Educational Services
Marcus Battle Associate Superintendent
Business Services
Cari Vaeth Associate Superintendent
Human Resources
----{iSARC_DLogo}---- School Description The mission of Independence High School is to provide a supportive learning environment that enables all students to achieve academic and personal success. This is achieved by providing high-quality classroom education, and a program of A-G coursework that assures that all students will be prepared for college and other post-secondary education. Staff development collaboration time is focused greatly on fully implementing national Common Core Standards, to assure that our students will be fully college-ready, and that our already high graduation rate will continue to grow. A variety of after school tutoring programs (Goodwill grant), math recovery, and individually arranged tutorials to provide extra help so all students can excel. Performing arts, athletics, and many student clubs provide avenues of support for students to develop mentally, socially, emotionally, and physically. Our new administrative and counseling offices are easy for students and parents to fine, and enable staff members to collaborate in helping students more efficiently and fully. Also located in our new office space are the Foothill Health Clinic, and the Student Innovative center where many students study. The new I-Cafe located therein raises money for the Associate Student Body, and provides a comfortable place for students to relax and study both before and after school. Every member of our counseling and administrative staff are committed to addressing student needs in the most beneficial ways. Our student support services center provides on-site counseling for non-academic matters, in order to address the whole student. Our 2012-13 WASC Action Plan and our 2014 Single Plan for Student Achievement address many of the above programs in greater detail. Throughout all of this we remain mindful that it is our school's policy t is the policy not to discriminate on the basis of sex, religion, race, national origin, sexual orientation, or disability. In these ways we provide an environment that is both challenging and nurturing for all students.
2013-14 School Accountability Report Card for Independence High School Page 2 of 12
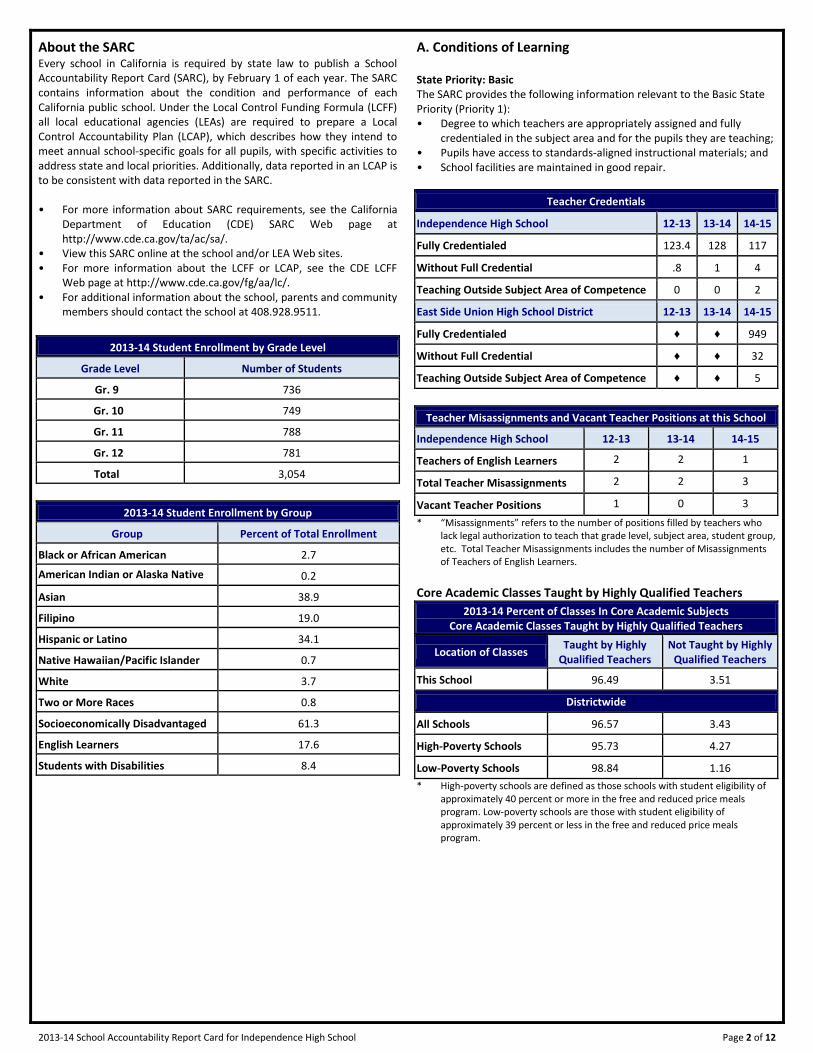
About the SARC Every school in California is required by state law to publish a School Accountability Report Card (SARC), by February 1 of each year. The SARC contains information about the condition and performance of each California public school. Under the Local Control Funding Formula (LCFF) all local educational agencies (LEAs) are required to prepare a Local Control Accountability Plan (LCAP), which describes how they intend to meet annual school-specific goals for all pupils, with specific activities to address state and local priorities. Additionally, data reported in an LCAP is to be consistent with data reported in the SARC. • For more information about SARC requirements, see the California
Department of Education (CDE) SARC Web page at http://www.cde.ca.gov/ta/ac/sa/.
• View this SARC online at the school and/or LEA Web sites. • For more information about the LCFF or LCAP, see the CDE LCFF
Web page at http://www.cde.ca.gov/fg/aa/lc/. • For additional information about the school, parents and community
members should contact the school at 408.928.9511.
2013-14 Student Enrollment by Grade Level
Grade Level Number of Students
Gr. 9-- 736
Gr. 10- 749
Gr. 11- 788
Gr. 12- 781
Total-- 3,054
2013-14 Student Enrollment by Group
Group Percent of Total Enrollment
Black or African American------- 2.7
American Indian or Alaska Native-------
0.2
Asian------- 38.9
Filipino------- 19.0
Hispanic or Latino------- 34.1
Native Hawaiian/Pacific Islander 0.7
White 3.7
Two or More Races 0.8
Socioeconomically Disadvantaged 61.3
English Learners 17.6
Students with Disabilities 8.4
A. Conditions of Learning State Priority: Basic The SARC provides the following information relevant to the Basic State Priority (Priority 1): • Degree to which teachers are appropriately assigned and fully
credentialed in the subject area and for the pupils they are teaching; • Pupils have access to standards-aligned instructional materials; and • School facilities are maintained in good repair.
Teacher Credentials
Independence High School 12-13 13-14 14-15
Fully Credentialed 123.4 128 117
Without Full Credential .8 1 4
Teaching Outside Subject Area of Competence 0 0 2
East Side Union High School District 12-13 13-14 14-15
Fully Credentialed ♦ ♦ 949
Without Full Credential ♦ ♦ 32
Teaching Outside Subject Area of Competence ♦ ♦ 5
Teacher Misassignments and Vacant Teacher Positions at this School
Independence High School 12-13 13-14 14-15
Teachers of English Learners 2 2 1
Total Teacher Misassignments 2 2 3
Vacant Teacher Positions 1 0 3
* “Misassignments” refers to the number of positions filled by teachers who lack legal authorization to teach that grade level, subject area, student group, etc. Total Teacher Misassignments includes the number of Misassignments of Teachers of English Learners.
Core Academic Classes Taught by Highly Qualified Teachers
2013-14 Percent of Classes In Core Academic Subjects Core Academic Classes Taught by Highly Qualified Teachers
Location of Classes Taught by Highly
Qualified Teachers Not Taught by Highly
Qualified Teachers
This School 96.49 3.51
Districtwide
All Schools 96.57 3.43
High-Poverty Schools 95.73 4.27
Low-Poverty Schools 98.84 1.16
* High-poverty schools are defined as those schools with student eligibility of approximately 40 percent or more in the free and reduced price meals program. Low-poverty schools are those with student eligibility of approximately 39 percent or less in the free and reduced price meals program.
2013-14 School Accountability Report Card for Independence High School Page 3 of 12
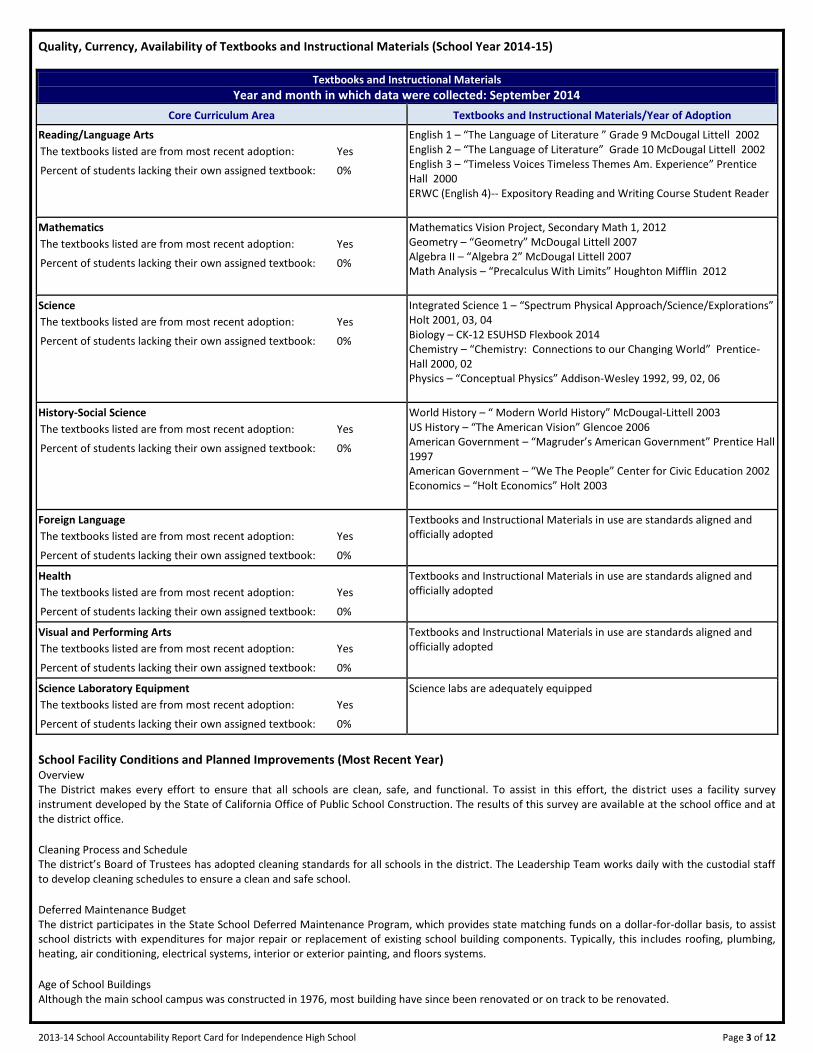
Quality, Currency, Availability of Textbooks and Instructional Materials (School Year 2014-15)
Textbooks and Instructional Materials
Year and month in which data were collected: September 2014
Core Curriculum Area Textbooks and Instructional Materials/Year of Adoption
Reading/Language Arts
The textbooks listed are from most recent adoption: Yes
Percent of students lacking their own assigned textbook: 0%
English 1 – “The Language of Literature ” Grade 9 McDougal Littell 2002 English 2 – “The Language of Literature” Grade 10 McDougal Littell 2002 English 3 – “Timeless Voices Timeless Themes Am. Experience” Prentice Hall 2000 ERWC (English 4)-- Expository Reading and Writing Course Student Reader
Mathematics
The textbooks listed are from most recent adoption: Yes
Percent of students lacking their own assigned textbook: 0%
Mathematics Vision Project, Secondary Math 1, 2012 Geometry – “Geometry” McDougal Littell 2007 Algebra II – “Algebra 2” McDougal Littell 2007 Math Analysis – “Precalculus With Limits” Houghton Mifflin 2012
Science
The textbooks listed are from most recent adoption: Yes
Percent of students lacking their own assigned textbook: 0%
Integrated Science 1 – “Spectrum Physical Approach/Science/Explorations” Holt 2001, 03, 04 Biology – CK-12 ESUHSD Flexbook 2014 Chemistry – “Chemistry: Connections to our Changing World” Prentice-Hall 2000, 02 Physics – “Conceptual Physics” Addison-Wesley 1992, 99, 02, 06
History-Social Science
The textbooks listed are from most recent adoption: Yes
Percent of students lacking their own assigned textbook: 0%
World History – “ Modern World History” McDougal-Littell 2003 US History – “The American Vision” Glencoe 2006 American Government – “Magruder’s American Government” Prentice Hall 1997 American Government – “We The People” Center for Civic Education 2002 Economics – “Holt Economics” Holt 2003
Foreign Language
The textbooks listed are from most recent adoption: Yes
Percent of students lacking their own assigned textbook: 0%
Textbooks and Instructional Materials in use are standards aligned and officially adopted
Health
The textbooks listed are from most recent adoption: Yes
Percent of students lacking their own assigned textbook: 0%
Textbooks and Instructional Materials in use are standards aligned and officially adopted
Visual and Performing Arts
The textbooks listed are from most recent adoption: Yes
Percent of students lacking their own assigned textbook: 0%
Textbooks and Instructional Materials in use are standards aligned and officially adopted
Science Laboratory Equipment
The textbooks listed are from most recent adoption: Yes
Percent of students lacking their own assigned textbook: 0%
Science labs are adequately equipped
School Facility Conditions and Planned Improvements (Most Recent Year) Overview The District makes every effort to ensure that all schools are clean, safe, and functional. To assist in this effort, the district uses a facility survey instrument developed by the State of California Office of Public School Construction. The results of this survey are available at the school office and at the district office. Cleaning Process and Schedule The district’s Board of Trustees has adopted cleaning standards for all schools in the district. The Leadership Team works daily with the custodial staff to develop cleaning schedules to ensure a clean and safe school. Deferred Maintenance Budget The district participates in the State School Deferred Maintenance Program, which provides state matching funds on a dollar-for-dollar basis, to assist school districts with expenditures for major repair or replacement of existing school building components. Typically, this includes roofing, plumbing, heating, air conditioning, electrical systems, interior or exterior painting, and floors systems. Age of School Buildings Although the main school campus was constructed in 1976, most building have since been renovated or on track to be renovated.
2013-14 School Accountability Report Card for Independence High School Page 4 of 12
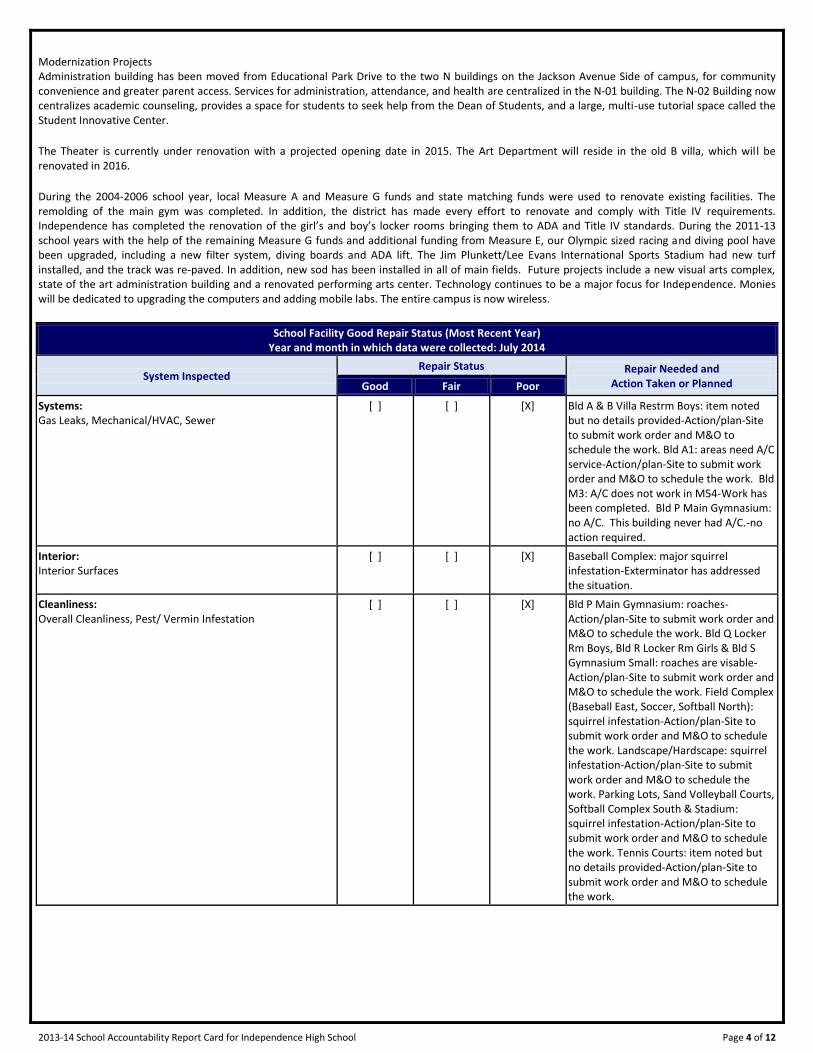
Modernization Projects Administration building has been moved from Educational Park Drive to the two N buildings on the Jackson Avenue Side of campus, for community convenience and greater parent access. Services for administration, attendance, and health are centralized in the N-01 building. The N-02 Building now centralizes academic counseling, provides a space for students to seek help from the Dean of Students, and a large, multi-use tutorial space called the Student Innovative Center. The Theater is currently under renovation with a projected opening date in 2015. The Art Department will reside in the old B villa, which will be renovated in 2016. During the 2004-2006 school year, local Measure A and Measure G funds and state matching funds were used to renovate existing facilities. The remolding of the main gym was completed. In addition, the district has made every effort to renovate and comply with Title IV requirements. Independence has completed the renovation of the girl’s and boy’s locker rooms bringing them to ADA and Title IV standards. During the 2011-13 school years with the help of the remaining Measure G funds and additional funding from Measure E, our Olympic sized racing and diving pool have been upgraded, including a new filter system, diving boards and ADA lift. The Jim Plunkett/Lee Evans International Sports Stadium had new turf installed, and the track was re-paved. In addition, new sod has been installed in all of main fields. Future projects include a new visual arts complex, state of the art administration building and a renovated performing arts center. Technology continues to be a major focus for Independence. Monies will be dedicated to upgrading the computers and adding mobile labs. The entire campus is now wireless.
School Facility Good Repair Status (Most Recent Year) Year and month in which data were collected: July 2014
System Inspected Repair Status Repair Needed and
Action Taken or Planned Good Fair Poor
Systems: Gas Leaks, Mechanical/HVAC, Sewer
[ ] [ ] [X] Bld A & B Villa Restrm Boys: item noted but no details provided-Action/plan-Site to submit work order and M&O to schedule the work. Bld A1: areas need A/C service-Action/plan-Site to submit work order and M&O to schedule the work. Bld M3: A/C does not work in M54-Work has been completed. Bld P Main Gymnasium: no A/C. This building never had A/C.-no action required.
Interior: Interior Surfaces
[ ] [ ] [X] Baseball Complex: major squirrel infestation-Exterminator has addressed the situation.
Cleanliness: Overall Cleanliness, Pest/ Vermin Infestation
[ ] [ ] [X] Bld P Main Gymnasium: roaches-Action/plan-Site to submit work order and M&O to schedule the work. Bld Q Locker Rm Boys, Bld R Locker Rm Girls & Bld S Gymnasium Small: roaches are visable-Action/plan-Site to submit work order and M&O to schedule the work. Field Complex (Baseball East, Soccer, Softball North): squirrel infestation-Action/plan-Site to submit work order and M&O to schedule the work. Landscape/Hardscape: squirrel infestation-Action/plan-Site to submit work order and M&O to schedule the work. Parking Lots, Sand Volleyball Courts, Softball Complex South & Stadium: squirrel infestation-Action/plan-Site to submit work order and M&O to schedule the work. Tennis Courts: item noted but no details provided-Action/plan-Site to submit work order and M&O to schedule the work.
2013-14 School Accountability Report Card for Independence High School Page 5 of 12
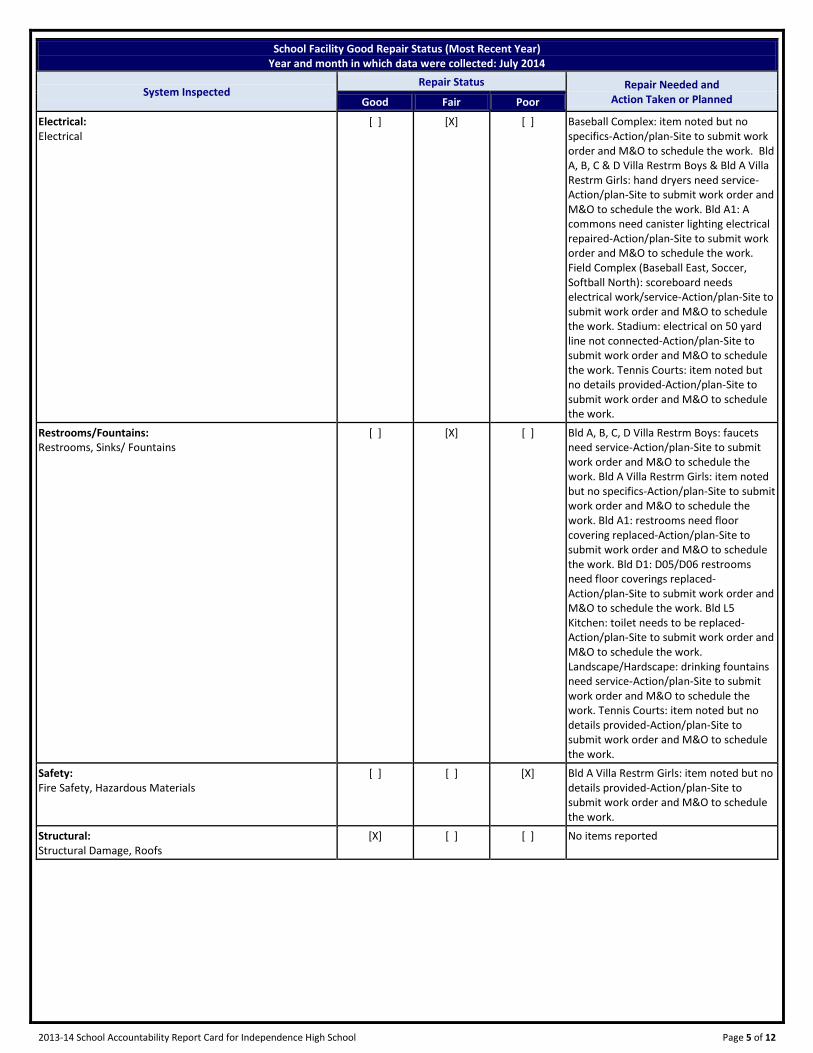
School Facility Good Repair Status (Most Recent Year) Year and month in which data were collected: July 2014
System Inspected Repair Status Repair Needed and
Action Taken or Planned Good Fair Poor
Electrical: Electrical
[ ] [X] [ ] Baseball Complex: item noted but no specifics-Action/plan-Site to submit work order and M&O to schedule the work. Bld A, B, C & D Villa Restrm Boys & Bld A Villa Restrm Girls: hand dryers need service-Action/plan-Site to submit work order and M&O to schedule the work. Bld A1: A commons need canister lighting electrical repaired-Action/plan-Site to submit work order and M&O to schedule the work. Field Complex (Baseball East, Soccer, Softball North): scoreboard needs electrical work/service-Action/plan-Site to submit work order and M&O to schedule the work. Stadium: electrical on 50 yard line not connected-Action/plan-Site to submit work order and M&O to schedule the work. Tennis Courts: item noted but no details provided-Action/plan-Site to submit work order and M&O to schedule the work.
Restrooms/Fountains: Restrooms, Sinks/ Fountains
[ ] [X] [ ] Bld A, B, C, D Villa Restrm Boys: faucets need service-Action/plan-Site to submit work order and M&O to schedule the work. Bld A Villa Restrm Girls: item noted but no specifics-Action/plan-Site to submit work order and M&O to schedule the work. Bld A1: restrooms need floor covering replaced-Action/plan-Site to submit work order and M&O to schedule the work. Bld D1: D05/D06 restrooms need floor coverings replaced-Action/plan-Site to submit work order and M&O to schedule the work. Bld L5 Kitchen: toilet needs to be replaced-Action/plan-Site to submit work order and M&O to schedule the work. Landscape/Hardscape: drinking fountains need service-Action/plan-Site to submit work order and M&O to schedule the work. Tennis Courts: item noted but no details provided-Action/plan-Site to submit work order and M&O to schedule the work.
Safety: Fire Safety, Hazardous Materials
[ ] [ ] [X] Bld A Villa Restrm Girls: item noted but no details provided-Action/plan-Site to submit work order and M&O to schedule the work.
Structural: Structural Damage, Roofs
[X] [ ] [ ] No items reported
2013-14 School Accountability Report Card for Independence High School Page 6 of 12
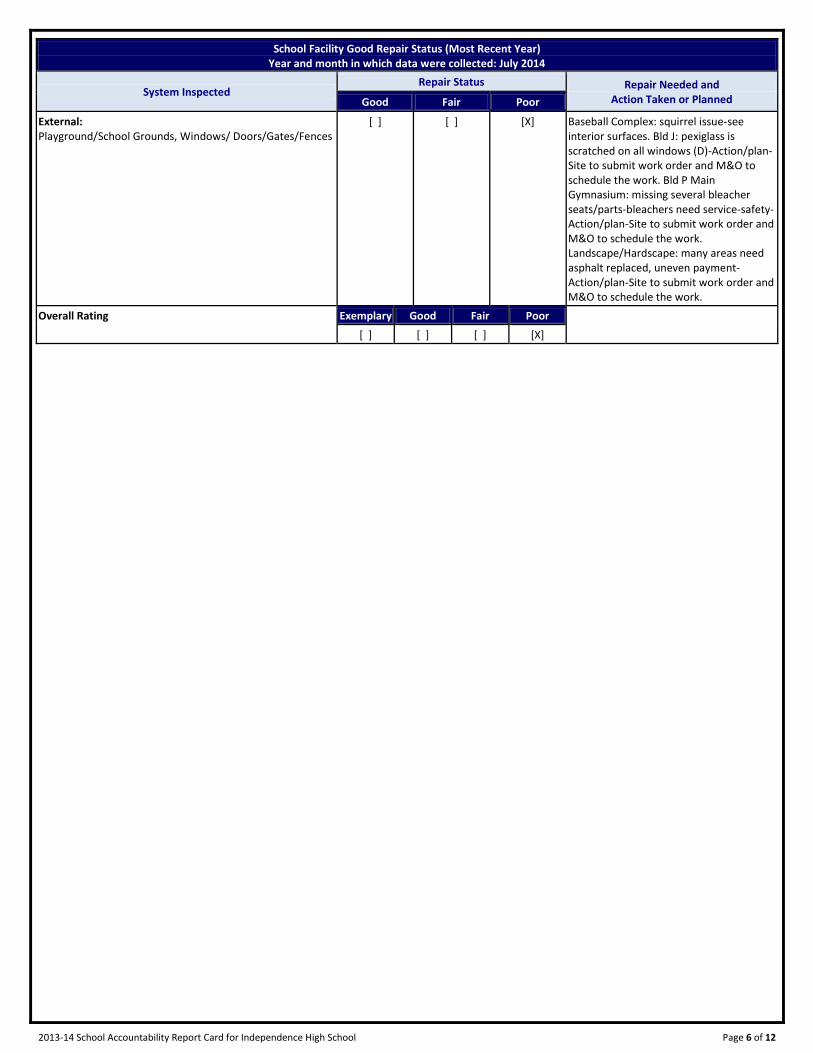
School Facility Good Repair Status (Most Recent Year) Year and month in which data were collected: July 2014
System Inspected Repair Status Repair Needed and
Action Taken or Planned Good Fair Poor
External: Playground/School Grounds, Windows/ Doors/Gates/Fences
[ ] [ ] [X] Baseball Complex: squirrel issue-see interior surfaces. Bld J: pexiglass is scratched on all windows (D)-Action/plan-Site to submit work order and M&O to schedule the work. Bld P Main Gymnasium: missing several bleacher seats/parts-bleachers need service-safety-Action/plan-Site to submit work order and M&O to schedule the work. Landscape/Hardscape: many areas need asphalt replaced, uneven payment-Action/plan-Site to submit work order and M&O to schedule the work.
Overall Rating Exemplary Good Fair Poor
---------- [ ] [ ] [ ] [X]
2013-14 School Accountability Report Card for Independence High School Page 7 of 12
B. Pupil Outcomes State Priority: Pupil Achievement The SARC provides the following information relevant to the Pupil Achievement State Priority (Priority 4): • Statewide assessments (i.e., California Assessment of Student
Performance and Progress and its successor the Standardized Testing and Reporting Program);
• The Academic Performance Index; and • The percentage of pupils who have successfully completed courses
that satisfy the requirements for entrance to the University of California and the California State University, or career technical education sequences or programs of study.
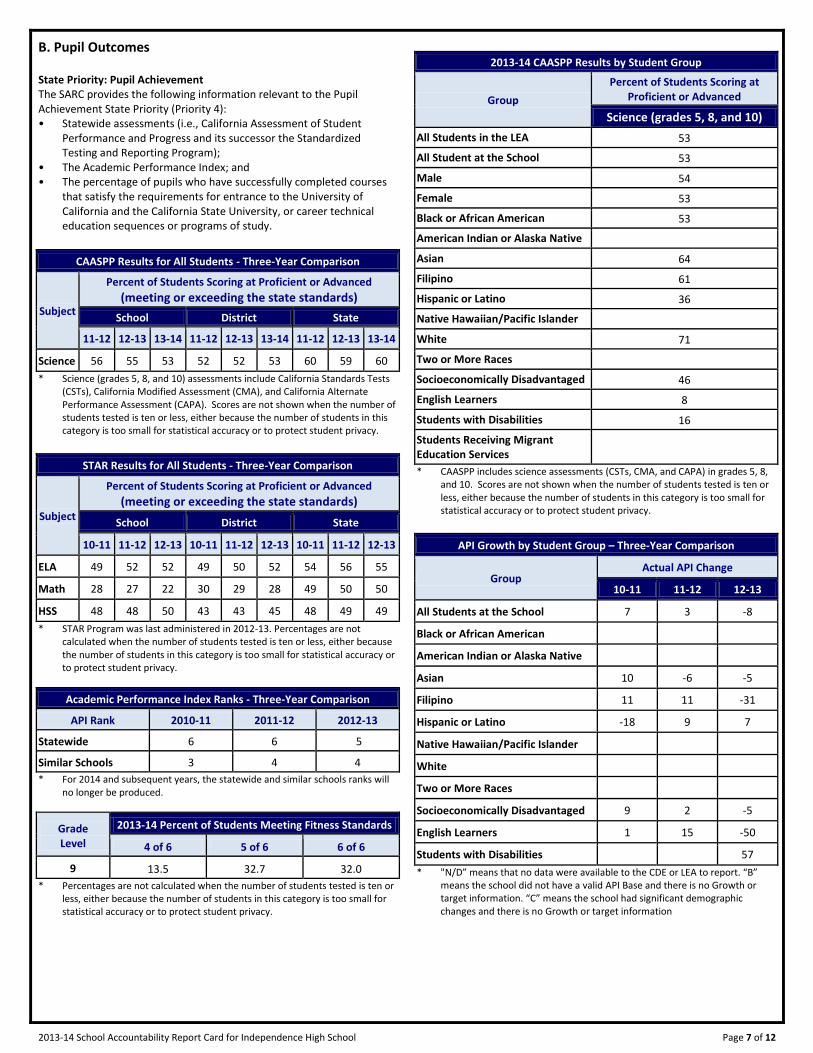
CAASPP Results for All Students - Three-Year Comparison
Subject
Percent of Students Scoring at Proficient or Advanced
(meeting or exceeding the state standards)
School District State
11-12 12-13 13-14 11-12 12-13 13-14 11-12 12-13 13-14
Science 56 55 53 52 52 53 60 59 60
* Science (grades 5, 8, and 10) assessments include California Standards Tests (CSTs), California Modified Assessment (CMA), and California Alternate Performance Assessment (CAPA). Scores are not shown when the number of students tested is ten or less, either because the number of students in this category is too small for statistical accuracy or to protect student privacy.
STAR Results for All Students - Three-Year Comparison
Subject
Percent of Students Scoring at Proficient or Advanced
(meeting or exceeding the state standards)
School District State
10-11 11-12 12-13 10-11 11-12 12-13 10-11 11-12 12-13
ELA 49 52 52 49 50 52 54 56 55
Math 28 27 22 30 29 28 49 50 50
HSS 48 48 50 43 43 45 48 49 49
* STAR Program was last administered in 2012-13. Percentages are not calculated when the number of students tested is ten or less, either because the number of students in this category is too small for statistical accuracy or to protect student privacy.
Academic Performance Index Ranks - Three-Year Comparison
API Rank 2010-11 2011-12 2012-13
Statewide------- 6 6 5
Similar Schools------- 3 4 4
* For 2014 and subsequent years, the statewide and similar schools ranks will no longer be produced.
Grade Level
2013-14 Percent of Students Meeting Fitness Standards
4 of 6 5 of 6 6 of 6
---9--- 13.5 32.7 32.0
* Percentages are not calculated when the number of students tested is ten or less, either because the number of students in this category is too small for statistical accuracy or to protect student privacy.
2013-14 CAASPP Results by Student Group
Group
Percent of Students Scoring at Proficient or Advanced
Science (grades 5, 8, and 10)
All Students in the LEA 53
All Student at the School 53
Male------- 54
Female------- 53
Black or African American 53
American Indian or Alaska Native
Asian------- 64
Filipino------- 61
Hispanic or Latino 36
Native Hawaiian/Pacific Islander
White------- 71
Two or More Races-------
Socioeconomically Disadvantaged 46
English Learners------- 8
Students with Disabilities 16
Students Receiving Migrant Education Services
* CAASPP includes science assessments (CSTs, CMA, and CAPA) in grades 5, 8, and 10. Scores are not shown when the number of students tested is ten or less, either because the number of students in this category is too small for statistical accuracy or to protect student privacy.
API Growth by Student Group – Three-Year Comparison
Group Actual API Change
10-11 11-12 12-13
All Students at the School 7 3 -8
Black or African American
American Indian or Alaska Native
Asian------- 10 -6 -5
Filipino------- 11 11 -31
Hispanic or Latino -18 9 7
Native Hawaiian/Pacific Islander
White-------
Two or More Races
Socioeconomically Disadvantaged 9 2 -5
English Learners 1 15 -50
Students with Disabilities 57
* "N/D” means that no data were available to the CDE or LEA to report. “B” means the school did not have a valid API Base and there is no Growth or target information. “C” means the school had significant demographic changes and there is no Growth or target information
2013-14 School Accountability Report Card for Independence High School Page 8 of 12
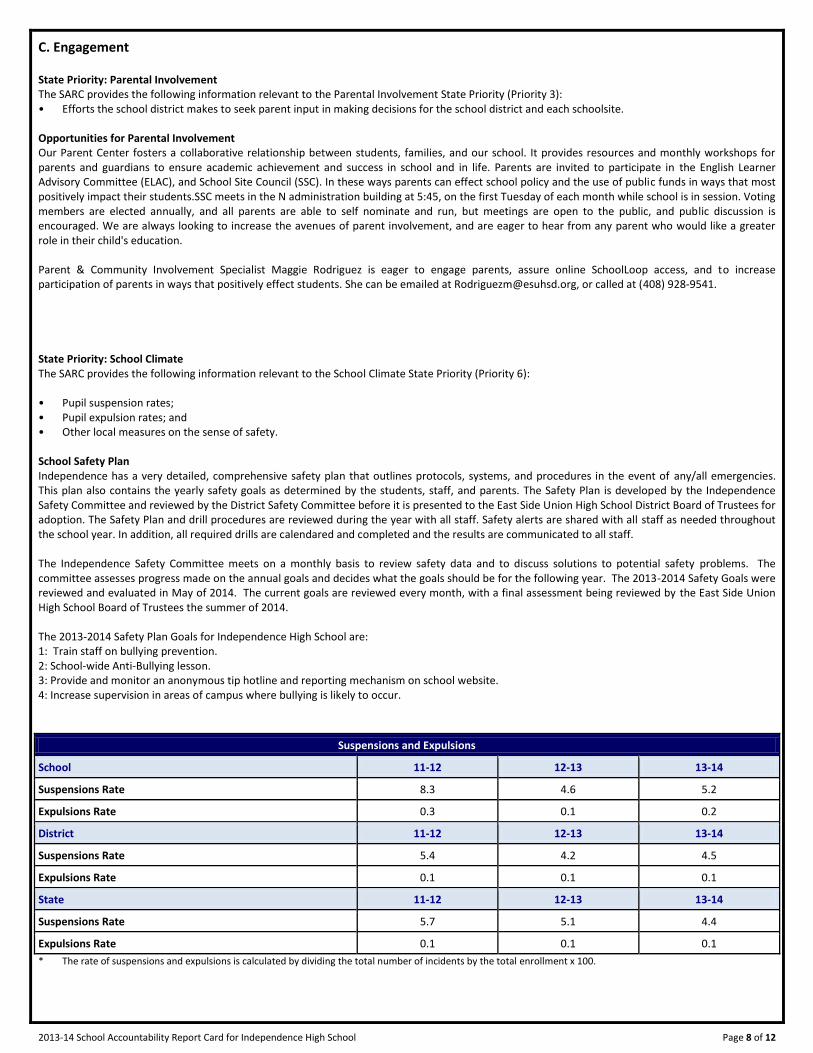
C. Engagement State Priority: Parental Involvement The SARC provides the following information relevant to the Parental Involvement State Priority (Priority 3): • Efforts the school district makes to seek parent input in making decisions for the school district and each schoolsite. Opportunities for Parental Involvement Our Parent Center fosters a collaborative relationship between students, families, and our school. It provides resources and monthly workshops for parents and guardians to ensure academic achievement and success in school and in life. Parents are invited to participate in the English Learner Advisory Committee (ELAC), and School Site Council (SSC). In these ways parents can effect school policy and the use of public funds in ways that most positively impact their students.SSC meets in the N administration building at 5:45, on the first Tuesday of each month while school is in session. Voting members are elected annually, and all parents are able to self nominate and run, but meetings are open to the public, and public discussion is encouraged. We are always looking to increase the avenues of parent involvement, and are eager to hear from any parent who would like a greater role in their child's education. Parent & Community Involvement Specialist Maggie Rodriguez is eager to engage parents, assure online SchoolLoop access, and to increase participation of parents in ways that positively effect students. She can be emailed at [email protected], or called at (408) 928-9541.
State Priority: School Climate The SARC provides the following information relevant to the School Climate State Priority (Priority 6): • Pupil suspension rates; • Pupil expulsion rates; and • Other local measures on the sense of safety. School Safety Plan Independence has a very detailed, comprehensive safety plan that outlines protocols, systems, and procedures in the event of any/all emergencies. This plan also contains the yearly safety goals as determined by the students, staff, and parents. The Safety Plan is developed by the Independence Safety Committee and reviewed by the District Safety Committee before it is presented to the East Side Union High School District Board of Trustees for adoption. The Safety Plan and drill procedures are reviewed during the year with all staff. Safety alerts are shared with all staff as needed throughout the school year. In addition, all required drills are calendared and completed and the results are communicated to all staff. The Independence Safety Committee meets on a monthly basis to review safety data and to discuss solutions to potential safety problems. The committee assesses progress made on the annual goals and decides what the goals should be for the following year. The 2013-2014 Safety Goals were reviewed and evaluated in May of 2014. The current goals are reviewed every month, with a final assessment being reviewed by the East Side Union High School Board of Trustees the summer of 2014. The 2013-2014 Safety Plan Goals for Independence High School are: 1: Train staff on bullying prevention. 2: School-wide Anti-Bullying lesson. 3: Provide and monitor an anonymous tip hotline and reporting mechanism on school website. 4: Increase supervision in areas of campus where bullying is likely to occur.
Suspensions and Expulsions
School 11-12 12-13 13-14
Suspensions Rate 8.3 4.6 5.2
Expulsions Rate 0.3 0.1 0.2
District 11-12 12-13 13-14
Suspensions Rate 5.4 4.2 4.5
Expulsions Rate 0.1 0.1 0.1
State 11-12 12-13 13-14
Suspensions Rate 5.7 5.1 4.4
Expulsions Rate 0.1 0.1 0.1
* The rate of suspensions and expulsions is calculated by dividing the total number of incidents by the total enrollment x 100.
2013-14 School Accountability Report Card for Independence High School Page 9 of 12
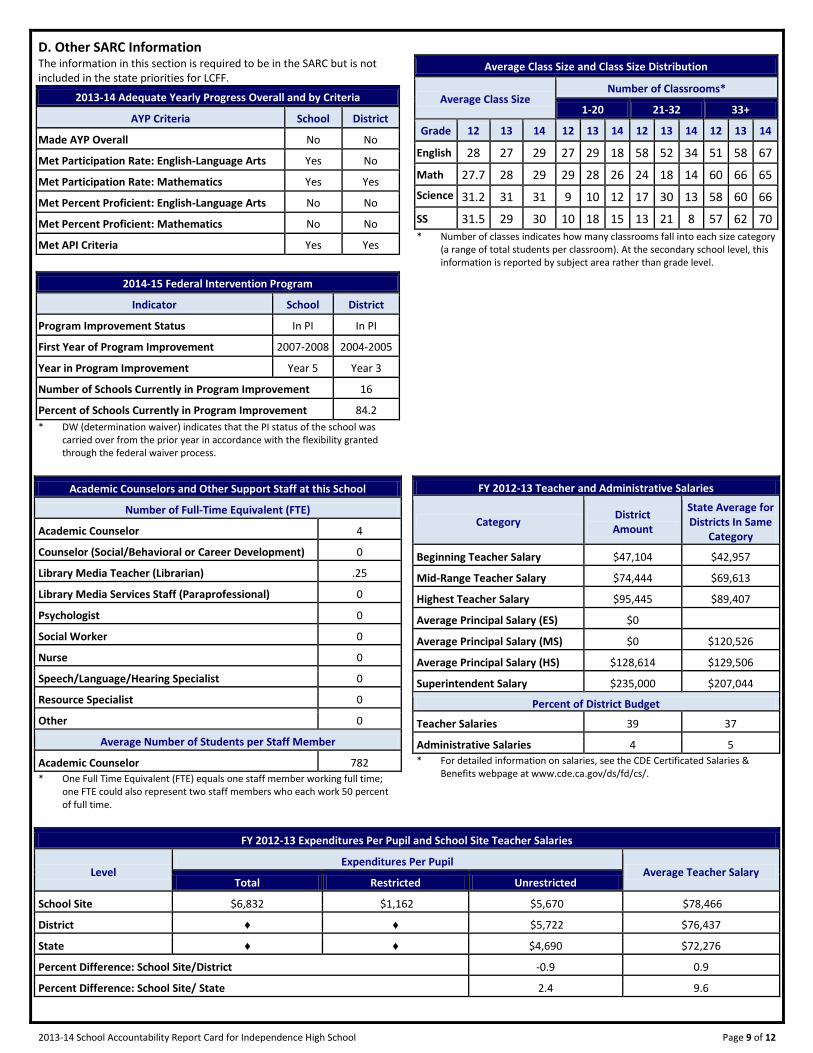
D. Other SARC Information The information in this section is required to be in the SARC but is not included in the state priorities for LCFF.
2013-14 Adequate Yearly Progress Overall and by Criteria
AYP Criteria School District
Made AYP Overall No No
Met Participation Rate: English-Language Arts Yes No
Met Participation Rate: Mathematics Yes Yes
Met Percent Proficient: English-Language Arts No No
Met Percent Proficient: Mathematics No No
Met API Criteria Yes Yes
2014-15 Federal Intervention Program
Indicator School District
Program Improvement Status In PI In PI
First Year of Program Improvement 2007-2008 2004-2005
Year in Program Improvement Year 5 Year 3
Number of Schools Currently in Program Improvement 16
Percent of Schools Currently in Program Improvement 84.2
* DW (determination waiver) indicates that the PI status of the school was carried over from the prior year in accordance with the flexibility granted through the federal waiver process.
Average Class Size and Class Size Distribution
Average Class Size Number of Classrooms*
1-20 21-32 33+
Grade 12 13 14 12 13 14 12 13 14 12 13 14
English 28 27 29 27 29 18 58 52 34 51 58 67
Math--- 27.7 28 29 29 28 26 24 18 14 60 66 65
Science
31.2 31 31 9 10 12 17 30 13 58 60 66
SS----- 31.5 29 30 10 18 15 13 21 8 57 62 70
* Number of classes indicates how many classrooms fall into each size category (a range of total students per classroom). At the secondary school level, this information is reported by subject area rather than grade level.
Academic Counselors and Other Support Staff at this School
Number of Full-Time Equivalent (FTE)
Academic Counselor------- 4
Counselor (Social/Behavioral or Career Development) 0
Library Media Teacher (Librarian) .25
Library Media Services Staff (Paraprofessional) 0
Psychologist------- 0
Social Worker------- 0
Nurse------- 0
Speech/Language/Hearing Specialist 0
Resource Specialist------- 0
Other------- 0
Average Number of Students per Staff Member
Academic Counselor------- 782
* One Full Time Equivalent (FTE) equals one staff member working full time; one FTE could also represent two staff members who each work 50 percent of full time.
FY 2012-13 Teacher and Administrative Salaries
Category District Amount
State Average for Districts In Same
Category
Beginning Teacher Salary $47,104 $42,957
Mid-Range Teacher Salary $74,444 $69,613
Highest Teacher Salary $95,445 $89,407
Average Principal Salary (ES) $0
Average Principal Salary (MS) $0 $120,526
Average Principal Salary (HS) $128,614 $129,506
Superintendent Salary $235,000 $207,044
Percent of District Budget
Teacher Salaries 39 37
Administrative Salaries 4 5
* For detailed information on salaries, see the CDE Certificated Salaries & Benefits webpage at www.cde.ca.gov/ds/fd/cs/.
FY 2012-13 Expenditures Per Pupil and School Site Teacher Salaries
Level Expenditures Per Pupil
Average Teacher Salary Total Restricted Unrestricted
School Site------- $6,832 $1,162 $5,670 $78,466
District------- ♦ ♦ $5,722 $76,437
State------- ♦ ♦ $4,690 $72,276
Percent Difference: School Site/District -0.9 0.9
Percent Difference: School Site/ State 2.4 9.6
2013-14 School Accountability Report Card for Independence High School Page 10 of 12
Types of Services Funded at Independence High School School funds come from the state or federal government. Each school fund was created to address a certain student needs, and is based on the legislation that was passed to address that need. For example, Title I is intended to help the effects of poverty by giving additional support to their education. Title III is intended to support the achievement of English Learners and immigrant students. Each categorical fund has a formula for determining how it is allocated. Some are by enrollment (CBEDS) and some are by a characteristic of the student (if they receive free or reduced lunch, or if they are an English Learner). How these funds are disbursed at the school level is determined In the Single Plan for Student Achievement which is approved initially by the Site Council and ultimately by the Board of Trustees. Independence receives: Title 1 Funds – These monies are used to ensure that all students have a fair, equal and significant opportunity to obtain a high-quality education and reach, at a minimum, proficiency. Economic Impact Aid [EIA] Funds - These funds are used to support additional programs and services for English Language learners and economically disadvantage students, From these funds the following programs are being funded: Read 180 Program English Language Arts and Math California High School Exit Examination [CAHSEE] support program to include counseling services. Recovery Math program that is focused on students passing Algebra 1 Supplemental Counseling Program for ninth grade, English Language Learners [ELL] and at risk students Homework/tutorial Center AVID program Multi Service Team that provides a variety of direct counseling services to students and parent as well as referrals to social service agencies operated by Santa Clara County academic counseling That concentrates on our Avid, ELD students, and Title One. Money has been allocated to the acquisition of student computers and related technologies (smart boards, document cameras, iPads, etc.) that will be used by students or directly for students. Additional resource periods for instructional coaching to benefit students has also been implemented. Professional Development provided for Teachers at Independence High School The Independence High School Professional Development Team is working in the direction of increasing rigor in instruction with three foci; reading skills, writing skills and application of technology to support Common Core implementation. We have developed a mission and vision statement as a school and for each department. As a school we are reflecting how we teach our students by making instructional shifts. To support our staff we are planning trainings for Data Driven Instruction, Backwards Mapping, Cooperative Learning Strategies, Inquiry/questioning techniques, Rigorous Rubric Development, and No Opt Out Strategies. Time is also allotted for staff to create and implement lessons that are at least level 3 rigor of Webb's Depth of Knowledge. For reference we using the Hess Cognitive Rigor Matrix as it addresses the Blooms taxonomy and Webb's Depth of Knowledge.
2013-14 School Accountability Report Card for Independence High School Page 11 of 12
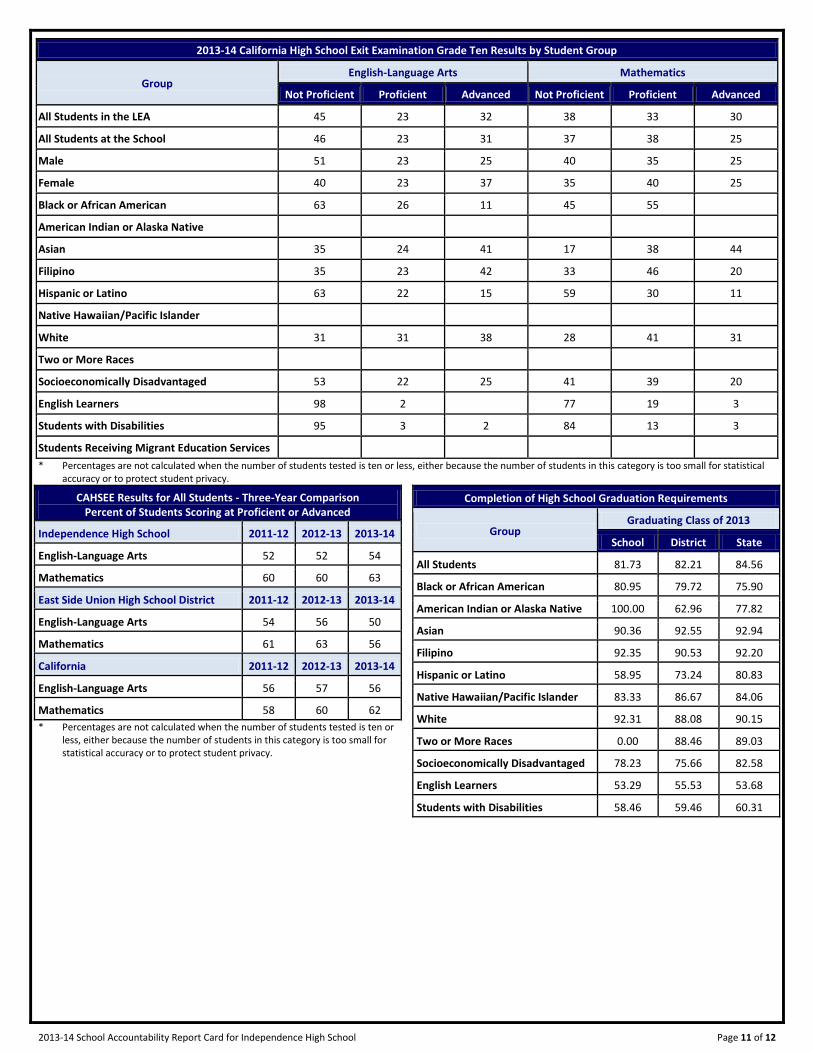
2013-14 California High School Exit Examination Grade Ten Results by Student Group
Group English-Language Arts Mathematics
Not Proficient Proficient Advanced Not Proficient Proficient Advanced
All Students in the LEA 45 23 32 38 33 30
All Students at the School 46 23 31 37 38 25
Male------- 51 23 25 40 35 25
Female------- 40 23 37 35 40 25
Black or African American 63 26 11 45 55
American Indian or Alaska Native
Asian------- 35 24 41 17 38 44
Filipino------- 35 23 42 33 46 20
Hispanic or Latino 63 22 15 59 30 11
Native Hawaiian/Pacific Islander
White------- 31 31 38 28 41 31
Two or More Races
Socioeconomically Disadvantaged 53 22 25 41 39 20
English Learners------- 98 2 77 19 3
Students with Disabilities 95 3 2 84 13 3
Students Receiving Migrant Education Services
* Percentages are not calculated when the number of students tested is ten or less, either because the number of students in this category is too small for statistical accuracy or to protect student privacy.
CAHSEE Results for All Students - Three-Year Comparison Percent of Students Scoring at Proficient or Advanced
Independence High School 2011-12 2012-13 2013-14
English-Language Arts 52 52 54
Mathematics 60 60 63
East Side Union High School District 2011-12 2012-13 2013-14
English-Language Arts 54 56 50
Mathematics 61 63 56
California 2011-12 2012-13 2013-14
English-Language Arts 56 57 56
Mathematics 58 60 62
* Percentages are not calculated when the number of students tested is ten or less, either because the number of students in this category is too small for statistical accuracy or to protect student privacy.
Completion of High School Graduation Requirements
Group Graduating Class of 2013
School District State
All Students 81.73 82.21 84.56
Black or African American 80.95 79.72 75.90
American Indian or Alaska Native 100.00 62.96 77.82
Asian------- 90.36 92.55 92.94
Filipino------- 92.35 90.53 92.20
Hispanic or Latino 58.95 73.24 80.83
Native Hawaiian/Pacific Islander 83.33 86.67 84.06
White------- 92.31 88.08 90.15
Two or More Races 0.00 88.46 89.03
Socioeconomically Disadvantaged 78.23 75.66 82.58
English Learners 53.29 55.53 53.68
Students with Disabilities 58.46 59.46 60.31
2013-14 School Accountability Report Card for Independence High School Page 12 of 12
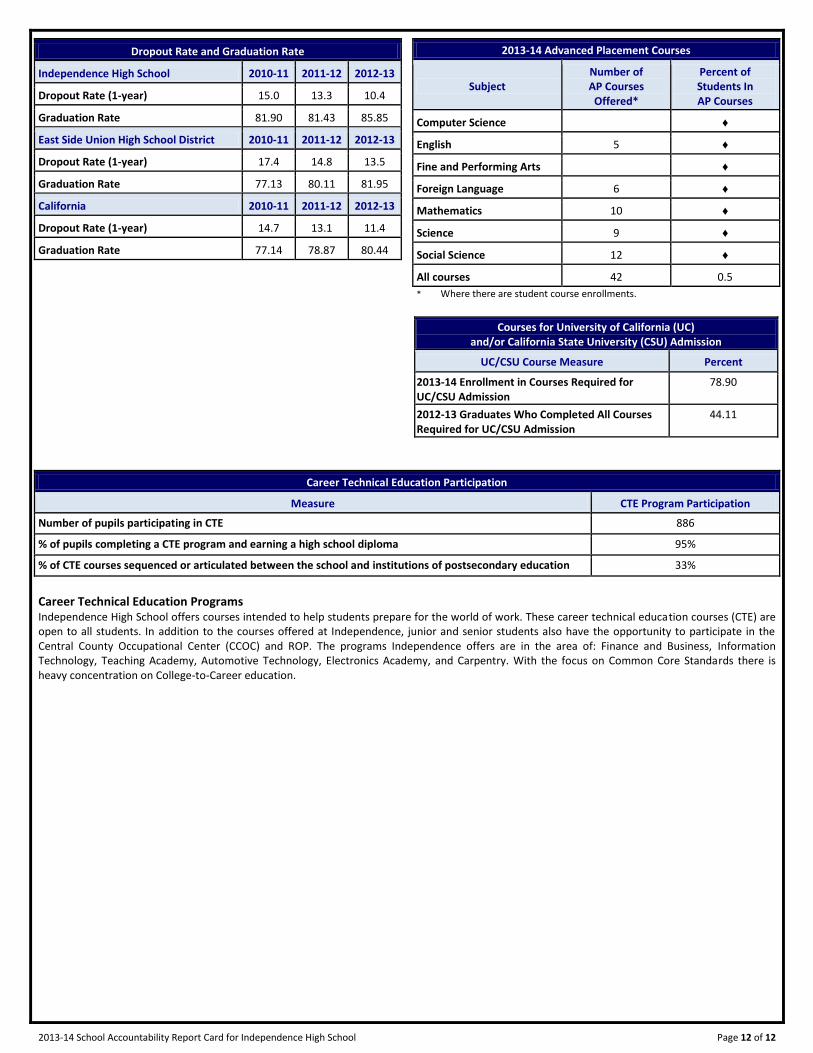
Dropout Rate and Graduation Rate
Independence High School 2010-11 2011-12 2012-13
Dropout Rate (1-year) 15.0 13.3 10.4
Graduation Rate 81.90 81.43 85.85
East Side Union High School District 2010-11 2011-12 2012-13
Dropout Rate (1-year) 17.4 14.8 13.5
Graduation Rate 77.13 80.11 81.95
California 2010-11 2011-12 2012-13
Dropout Rate (1-year) 14.7 13.1 11.4
Graduation Rate 77.14 78.87 80.44
2013-14 Advanced Placement Courses
Subject Number of AP Courses
Offered*
Percent of Students In AP Courses
Computer Science ♦
English------- 5 ♦
Fine and Performing Arts ♦
Foreign Language 6 ♦
Mathematics 10 ♦
Science------- 9 ♦
Social Science 12 ♦
All courses 42 0.5
* Where there are student course enrollments.
Courses for University of California (UC) and/or California State University (CSU) Admission
UC/CSU Course Measure Percent
2013-14 Enrollment in Courses Required for UC/CSU Admission
78.90
2012-13 Graduates Who Completed All Courses Required for UC/CSU Admission
44.11
Career Technical Education Participation
Measure CTE Program Participation
Number of pupils participating in CTE 886
% of pupils completing a CTE program and earning a high school diploma 95%
% of CTE courses sequenced or articulated between the school and institutions of postsecondary education 33%
Career Technical Education Programs Independence High School offers courses intended to help students prepare for the world of work. These career technical education courses (CTE) are open to all students. In addition to the courses offered at Independence, junior and senior students also have the opportunity to participate in the Central County Occupational Center (CCOC) and ROP. The programs Independence offers are in the area of: Finance and Business, Information Technology, Teaching Academy, Automotive Technology, Electronics Academy, and Carpentry. With the focus on Common Core Standards there is heavy concentration on College-to-Career education.