Embed Size (px)
Citation preview

Indeterminacy in a Matching Model of Money withProductive Government Expenditure
Angus C. Chu Chih-Hsing Liao Xiangbo Liu Mengbo Zhang
November 2016
Abstract
This study explores the effects of inflation on economic growth in a two-sector mon-etary search-and-matching model with productive government expenditure. We findthat when labor intensity of production in the centralized market is below a threshold,the economy features a unique balanced growth path along which inflation reducesgrowth so long as capital intensity of production in the decentralized market is posi-tive. When labor intensity in the centralized market is above the threshold however, theeconomy may feature multiple balanced growth paths. Multiple equilibria arise whenthe matching probability in the decentralized market is above a threshold. In this case,the high-growth equilibrium features a negative effect of inflation on economic growthwhereas the low-growth equilibrium may feature a negative, a positive or a U-shapedeffect of inflation on growth. When the matching probability is above the thresh-old but not too large, the low-growth equilibrium is locally determinate whereas thehigh-growth equilibrium is locally indeterminate and subject to sunspot fluctuationsaround it. Finally, when the matching probability is suffi ciently large, both equilibriaare locally determinate, and hence, either equilibrium may emerge in the economy.
Keywords: Economic growth; inflation; money; random matching; indeterminacy
JEL Classification: E30, E40, O42
Chu: [email protected]. China Center for Economic Studies, School of Economics, Fudan University,
Shanghai, China. Liao: [email protected]. Department of Economics, Chinese Culture University,
Taipei, Taiwan. Liu: [email protected], School of Labor and Human Resources and International
Monetary Institute, Renmin University, Beijing, China. Zhang: [email protected]. Department of
Economics, University of California, Los Angeles, United States.
1

1 Introduction
This study explores the effects of inflation on economic growth in a monetary search-and-matching model with equilibrium indeterminacy. We consider a two-sector search-and-matching model from Lagos and Wright (2005) and follow Aruoba et al. (2011) and Waller(2011) to incorporate endogenous capital accumulation into the model. The novelty of ourstudy is that we allow for productive government spending as in the seminal study by Barro(1990) in order to generate endogenous growth. The resulting monetary search-and-matchingmodel with productive government spending features equilibrium indeterminacy and sunspotfluctuations that are absent in the Barro model and the Lagos-Wright model.Our results can be summarized as follows. When labor intensity of production in the
centralized market is below a threshold value, the economy features a unique and determinatebalanced growth equilibrium in which an increase in the money growth rate leads to a lowergrowth rate of output. Given that the threshold value on labor intensity of production inthe model is 0.5, empirical values of labor income share, which approximates labor intensity,are often above this threshold. When labor intensity in the centralized market is above thethreshold, the economy either features multiple balanced growth equilibria or exhibits noequilibrium. Multiple equilibria arise when the matching probability in the decentralizedmarket is above a threshold value. When the matching probability is above this thresholdbut not too large, the low-growth equilibrium is locally determinate whereas the high-growthequilibrium is locally indeterminate and subject to sunspot fluctuations around it. Whenthe matching probability in the decentralized market is suffi ciently large, both equilibria arelocally determinate. In this case, either equilibrium could emerge in the economy. Whenmultiple equilibria are present, the high-growth equilibrium always features a negative effectof inflation on economic growth whereas the low-growth equilibrium may feature a negativeeffect, a positive effect or a U-shaped effect of inflation on growth.The intuition behind the different effects of inflation on growth can be explained as
follows. A higher inflation rate increases the cost of consumption in the decentralized marketwhere consumption requires the use of money as a medium of exchange. Here we interpretthe decentralized market as an informal market, where transactions rely on fiat money. Dueto the negative effect of inflation on the demand for consumption goods in the decentralizedmarket, individuals have less incentives to accumulate physical capital, which is a factorinput for the production of consumption goods given a positive capital intensity in thedecentralized market. As a result, higher inflation reduces capital accumulation and causesa negative effect on economic growth. This negative capital-accumulation effect of inflationis also present in previous studies, such as Aruoba et al. (2011), Waller (2011) and Chu etal. (2014). However, with the presence of productive government spending, inflation has anadditional positive labor-market effect on growth. When inflation reduces the demand forconsumption in the decentralized market, it also shifts the demand for consumption to thecentralized market, where money is not needed for transaction purposes. This increase inconsumption causes the individuals to also want to consume more leisure and reduce theirsupply of labor in the centralized market. Given that the labor demand curve may becomeupward sloping in the presence of productive government spending, the shift in labor supplyin this case leads to a surprising increase in equilibrium labor input, which in turn increasesthe levels of output and capital investment in the centralized market. In the low-growth
2

equilibrium, both this positive labor-market effect and the negative capital-accumulationeffect are present to generate ambiguous effects of inflation on economic growth.This study relates to the literature on matching models of money and capital; see for
example, Shi (1999), Menner (2006), Williamson and Wright (2010), Aruoba et al. (2011),Bencivenga and Camera (2011) and Waller (2011). Our study differs from these studies byallowing for endogenous economic growth in the long run. Chu et al. (2014) also considerthe effects of inflation on endogenous economic growth in a matching model of money andcapital. Their model generates endogenous growth via capital externality and does notexhibit equilibrium indeterminacy due to the absence of productive government expenditure.Our model generates endogenous growth via productive government expenditure and featuresa unique equilibrium with the same comparative static effects of inflation as in Chu et al.(2014) under one parameter space but also multiple equilibria with different comparativestatic effects of inflation under another parameter space that is empirically more relevant.In other words, the analysis in this study nests the analysis in Chu et al. (2014) as a specialcase. Furthermore, we generalize the model to the case of asymmetric degrees of capitalintensity in the two markets and find that they have different implications on equilibriumdynamics and the effects of inflation.The study also relates to the literature on inflation and economic growth; see for example,
Wang and Yip (1992), Gomme (1993), Dotsey and Ireland (1996), Ho et al. (2007), Changet al. (2007), Chen et al. (2008) and Chu and Cozzi (2014). Some studies, such as Farmer(1997), Itaya and Mino (2003) and Lai and Chin (2010), also explore the effects of inflationon equilibrium indeterminacy.1 Studies in this literature model money demand using theclassical approaches, such as cash-in-advance constraints, money in utility and transactioncosts, without considering search and matching. This study attempts to relate this liter-ature to the literature on matching models of money and capital in order to highlight theimplications of random matching on growth and indeterminacy. We find that the degree oflabor intensity of production in the centralized market and the matching probability in thedecentralized market are the key determinants of the dynamic properties of the equilibria,whereas the degree of capital intensity of production in the decentralized market determineswhether inflation affects economic growth.The rest of the paper is organized as follows. Section 2 presents the model. Section 3
studies the dynamics. Section 4 examines the effects of inflation. The final section concludes.
2 The model
We consider an economy that consists of a unit continuum of identical and infinitely-livedindividuals in discrete time. In each period, there are economic activities in two markets:individuals first enter a decentralized market (hereafter DM) and then a centralized market(hereafter CM). We interpret the DM as an informal market, in which transactions rely onfiat money and it is also easy for vendors to evade taxes, so that the government can only levy
1See Benhabib and Farmer (1994, 1996) and Schmitt-Grohe and Uribe (1997) for seminal studies onequilibrium indeterminacy. Benhabib and Farmer (1999) provide a survey of this literature. For an earlystudy that explores fiscal policy and indeterminacy, see Goenka (1994).
3

taxes on wage and capital income in the CM, where transactions rely on credit. Followingthe literature, we assume that there is no discounting within each period, while the discountfactor is β ∈ (0, 1) between any two consecutive periods.
2.1 Individuals’optimization in the CM
In the CM, individuals consume a general good or invest it to accumulate physical capitalin order to maximize their lifetime discounted utility. Their instantaneous utility function isrepresented by2
ut = θ lnxt − γht,where xt is the consumption of the general good, ht is the supply of labor, and the parametersγ > 0 and θ > 0 determine respectively the disutility of labor supply and the importanceof consumption in the CM. Let’s denote W (mt, kt) and V (mt, kt) as the period-t valuefunctions for individuals in the CM and the DM, respectively. For the maximization problemof individuals in the CM, we have
W (mt, kt) = maxxt,ht,mt+1,kt+1
θ lnxt − γht + βV (mt+1, kt+1), (1)
subject to a sequence of budget constraints given by
kt+1 +mt+1
pt= (1− τ t) (wtht + rtkt) + (1− δ) kt − xt + Tt +
mt
pt, (2)
where pt is the price of general good xt, wt is the real wage rate, rt is the real rental priceof capital, τ t ∈ (0, 1) denotes the income tax rate, kt denotes the capital stock owned by anindividual, and mt is the nominal money balance in period t. The parameter δ ∈ (0, 1) isthe depreciation rate of capital. Tt denotes a real lump-sum transfer from the government.If we use the budget constraint to substitute ht into equation (1), then standard dynamic
optimization leads to the following first-order conditions:
θ
xt=
γ
(1− τ t)wt, (3)
θ
xt= βVk (mt+1, kt+1) , (4)
θ
ptxt= βVm (mt+1, kt+1) . (5)
Equation (3) represents a horizontal labor supply curve. Furthermore, equations (3) to (5)imply that all individuals enter the DM in the next period with the same holdings of capitaland money because xt is the same across individuals, due to their quasi-linear preference, asshown in (3). Finally, the envelope conditions are given by
Wk (mt, kt) =θ [1− δ + (1− τ t) rt]
xt, (6)
2Due to separable utility in xt and ht, we must consider log utility in order to be consistent with thebalanced growth path along which xt grows at a constant rate and ht remains stationary.
4

Wm (mt, kt) =θ
ptxt. (7)
2.2 Individuals’optimization in the DM
In the DM, firms do not operate, and a special good is produced and traded privatelyamong individuals. We denote σ ∈ (0, 0.5) as the probability of an agent becoming a buyer.Similarly, with probability σ an agent becomes a seller, and with probability 1 − 2σ heis a nontrader. Following Lagos and Wright (2005), one buyer meets one seller randomlyand anonymously with a matching technology and buyers pay money in trade. Given thismatching setup, the value of entering the DM is given by
V (mt, kt) = σV b (mt, kt) + σV s (mt, kt) + (1− 2σ)W (mt, kt) , (8)
where V b (mt, kt) and V s (mt, kt) are the values of being a buyer and a seller, respectively.To analyze V b(.) and V s(.), we consider the following functional forms for the buyers’
preference and the sellers’production technology. In the DM, each buyer’s utility ln qbt isincreasing and concave in the consumption of the special good. Each seller produces specialgood qst by combining her capital kt and effort et subject to the following Cobb-Douglasproduction function:
qst = F (kt, Ztet) = Akηt (Ztet)1−η , (9)
where A > 0 is a Hicks-neutral productivity parameter. The parameter η ∈ (0, 1) determinescapital intensity η and labor intensity 1−η of production in the DM whereas Zt is the level oflabor productivity. As in the seminal study by Barro (1990), labor productivity is determinedby productive government expenditure; i.e., we assume that Zt = Gt.3 Rewriting equation(9), we can express the utility cost of production in terms of effort as
e
(qstGt
,ktGt
)= A−1/(1−η)
(qstGt
)1/(1−η)(ktGt
)−η/(1−η)
. (10)
Buyers purchase special good qbt by spending money dbt , whereas sellers earn money d
st by
producing special good qst . Given these terms of trade, the values of being a buyer and aseller are respectively
V b(mt, kt) = ln qbt +W (mt − dbt , kt), (11)
V s(mt, kt) = −e(qstGt
,ktGt
)+W (mt + dst , kt). (12)
Differentiating (11) and (12) and substituting them into (8), we can obtain the followingenvelope condition for mt:
Vm(mt, kt) = (1− 2σ)Wm(mt, kt) + σ
[1
qbt
∂qbt∂mt
+Wm(mt − dbt , kt)(
1− ∂dbt∂mt
)](13)
+σ
[−e1
(qstGt
,ktGt
)1
Gt
∂qst∂mt
+Wm(mt + dst , kt)
(1 +
∂dst∂mt
)],
3It is useful to note that Barro (1990) considers inelastic labor supply whereas we consider elastic laborsupply, which interacts with productive government spending to generate indeterminacy. The constantreturns to scale with respect to kt and Gt is necessary to generate endogenous long-run growth but not forequilibrium indeterminacy.
5

where Wm(mt, kt) = Wm(mt − dbt , kt) = Wm(mt + dst , kt) = θ/(ptxt) from (7). Similarly, wecan obtain the following envelope condition for kt:
Vk(mt, kt) = (1− 2σ)Wk(mt, kt) + σ
[1
qbt
∂qbt∂kt−Wm(mt − dbt , kt)
∂dbt∂kt
+Wk(mt − dbt , kt)]
(14)
+σ
[−e1
(qstGt
,ktGt
)1
Gt
∂qst∂kt− e2
(qstGt
,ktGt
)1
Gt
+Wm(mt + dst , kt)∂dst∂kt
+Wk(mt + dst , kt)
],
whereWk(mt, kt) = Wk(mt−dbt , kt) = Wk(mt+dst , kt) = θ [(1− τ t) rt + (1− δ)] /xt from (6).To solve the marginal value of holding money (13) and capital (14), we consider a com-
petitive equilibrium with price taking as in Aruoba et al. (2011) and Waller (2011).4 Underprice taking, once buyers and sellers are matched, they both act as price takers. Given theprice pt of the special good, buyers choose qbt to maximize
V b(mt, kt) = maxqbt
[ln qbt +W (mt − ptqbt , kt)] (15)
subject to the budget constraintdbt = ptq
bt ≤ mt. (16)
It can be shown that in the DM, buyers spend all their money, so that the money constraintimplies that
qbt = mt/pt. (17)
As for sellers’maximization problem in the DM, it is given by
V s(mt, kt) = maxqst
[−e(qstGt
,ktGt
)+W (mt + ptq
st , kt)
]. (18)
Sellers’optimal supplies of the special good can be obtained from the following condition:
e1
(qstGt
,ktGt
)1
Gt
= ptWm(mt + ptqst , kt)⇔
1
1− ηe(qstGt
,ktGt
)= θ
ptqst
ptxt, (19)
where e1 denotes the derivative of e(.) with respect to its first argument. The second equalityof (19) makes use of (7) and (10).Using (17) and (19), we can obtain ∂qbt/∂mt = 1/pt, ∂dbt/∂mt = 1, and ∂dst/∂kt =
pt (∂qst /∂kt), whereas the other partial derivatives, ∂qbt/∂kt, ∂d
bt/∂kt, ∂q
st /∂mt and ∂dst/∂mt,
in (13) and (14) are zero. Substituting these conditions, qbt = qst = qt and (19) into (13) and(14), we can derive the following conditions:
Vm(mt, kt) =(1− σ) θ
ptxt+
σ
ptqt, (20)
Vk(mt, kt) =θ [(1− τ t) rt + (1− δ)]
xt− σ
Gt
e2
(qtGt
,ktGt
), (21)
4We cannot consider bargaining in this model because the bargaining condition is incompatible withendogenous growth; see Appendix A in Chu et al. (2014) for a detailed discussion.
6

where e2 denotes the derivative of e(.) with respect to its second argument. The intuitionbehind these two conditions can be explained as follows. The marginal value of moneyholding is the expected gain in utility by either consuming more special good qt in the DMwith probability σ or consuming more general good xt in the CM with probability 1 − σ.The marginal value of capital holding is the gain in utility by consuming more general goodxt in the CM with the after-tax net capital income (1− τ t) rt + 1− δ plus the expected gainin utility by incurring less production effort as a seller in the DM with probability σ.5
2.3 Firms’optimization in the CM
In the CM, there is a large number of identical firms. In each period, each firm produces thegeneral good using capital Kt and labor Ht. The production function is given by
Yx,t = AKαt (ZtHt)
1−α , (22)
where the parameter α ∈ (0, 1) determines labor intensity 1 − α of production in the CM.Labor productivity is determined by productive government spending as before; i.e., Zt = Gt.Taking factor prices and the government’s expenditure as given, the representative firmchooses Ht and Kt to maximize its profits. Interior solutions of the firm’s problem arecharacterized by the first-order conditions as follows:
rt = αAKα−1t (GtHt)
1−α , (23)
wt = (1− α)AKαt H
−αt G1−α
t . (24)
In equilibrium, Kt = kt and Ht = ht.
2.4 Government
In this economy, the government plays the following two roles: it implements fiscal and mon-etary policies. In each period, the government’s public expenditure is financed by imposing atax on individuals’wage and capital income in the CM. Therefore, the government’s budgetconstraint can be expressed as
Gt = τ t(wtht + rtkt) = τ tYx,t. (25)
The government also issues money at an exogenously given rate at µt = (mt+1 − mt)/mt
to finance a lump-sum transfer that has a real value of Tt = (mt+1 − mt)/pt = µtmt/pt.We separate the fiscal and monetary components of the government in order to allow formonetary policy independence. In other words, we do not consider the case in which thegovernment can use the central bank to finance its fiscal spending.6
5Recall that e2(qt/Gt, kt/Gt) < 0; see equation (10).6In the case of seigniorage, higher inflation would increase tax revenue for productive government spend-
ing, and hence, it would have an additional positive effect on economic growth.
7

2.5 Equilibrium
The equilibrium is defined as a sequence of allocations Gt, xt, ht, Yx,t, qt, dt,mt+1, kt+1∞t=0,a sequence of prices rt, wt, pt, pt∞t=0 and a sequence of policies µt, τ t, Tt
∞t=0, with the fol-
lowing conditions satisfied in each period.
• In the CM, individuals choose xt, ht,mt+1, kt+1 to maximize (1) subject to (2), takingrt, wt, pt and µt, τ t, Tt as given;
• In the DM, buyers and sellers choose qt, dt to maximize (11) and (12) respectively,taking pt as given;
• Firms in the CM produce Yx,t competitively to maximize profit taking rt, wt andGt as given;
• The real aggregate consumption includes consumption in CM and DM such that
ct = (ptxt + σptqt) /pt;
• The real aggregate output includes output in CM and DM such that
Yt = (ptYx,t + σptqt) /pt;
• The capital stock accumulates through investment from the general good such that
kt+1 = Yx,t − xt −Gt + (1− δ) kt;
• The government balances its budget in every period such that Gt = τ tYx,t and Tt =µtmt/pt.
• All markets clear in every period.
3 Equilibrium indeterminacy
In the rest of the paper, we assume stationary monetary and tax policies, i.e., µt = µ andτ t = τ . The stationary money growth rate has a lower bound, i.e., µ ≥ β−1.7 The dynamicalsystem can be derived as follows. First, we define two transformed variables Φt ≡ mt/ (ptxt)and Ωt ≡ xt/kt. Φt represents the ratio of real money balance to consumption in the CM,whereas Ωt represents the consumption-capital ratio in CM. Note that Φt and Ωt are bothjump variables and they are stationary on a balanced growth path. From equations (5) and(20), we obtain the recursive equation of Φt, which is given by
Φt+1 =1 + µ
β(1− σ)Φt −
σ
θ(1− σ)≡ f(Φt). (26)
Figure 1 shows that the money-consumption ratio Φt jumps immediately to a unique andsaddle-point stable steady-state equilibrium Φ.
7It can be shown that this lower bound is equivalent to a zero lower bound on the nominal interest rate.
8

Figure 1: Phase diagram of Φt
Manipulating equations (22) and (25) yields Gt = (τA)1/αkth(1−α)/αt , which is increasing
in labor ht. We then use this condition to rearrange (23) and (24) as
rt = αA1/α (τht)(1−α)/α , (23a)
wt = (1− α) τ (1−α)/αA1/αkth(1−2α)/αt . (24a)
It is useful to note that (24a) represents the labor demand curve in the CM, which is upwardsloping if and only if α < 1/2 (i.e., labor intensity 1 − α > 1/2 in the CM). Combininglabor demand in (24a) and labor supply in (3), we derive that the following equilibriumrelationship between labor ht and the consumption-capital ratio Ωt:
ht =
[θ
γ(1− τ) (1− α) τ (1−α)/αA1/α
]α/(2α−1)
Ωα/(1−2α)t , (27)
which shows a positive relationship between labor ht and the consumption-capital ratio Ωt ifand only if α < 1/2 (i.e., labor intensity 1− α > 1/2 in the CM). This positive relationshipcaptures the case in which a decrease in labor supply (i.e., an upward shift in the horizontallabor supply curve) leads to an increase in equilibrium labor input due to an upward-slopinglabor demand curve in the CM.Combining equations (4), (10), (19), (21), (23a) and (27), we obtain the dynamical
equation of consumption in the CM:xt+1
xt= β
[1− δ + αDΩε
t+1 + ησΦt+1Ωt+1
], (28)
where we define two composite parameters D, ε as follows.
D ≡ (1− τ) τ (1−α)/αA1/α
[θ
γ(1− τ) (1− α) τ (1−α)/αA1/α
](1−α)/(2α−1)
> 0,
9

and ε ≡ (1− α) / (1− 2α). For convenience, we plot the value of ε against α in Figure 2.
Figure 2: Relationship between α and ε
The resource constraint implies the following dynamics of the capital stock kt:
kt+1
kt= DΩε
t − Ωt + 1− δ, (29)
where we have used (22), (27) and Gt = (τA)1/αkth(1−α)/αt . Combining equations (28) and
(29), we derive the dynamics of Ωt ≡ xt/kt as follows.
Ωt+1
Ωt
=β[1− δ + αDΩε
t+1 + ησΦt+1Ωt+1
]DΩε
t − Ωt + 1− δ , (30)
From (26) and (30), the steady-state values of Φt and Ωt, denoted as Φ and Ω, are determinedby
Φ =σβ
θ [1 + µ− (1− σ) β], (31)
(1 + ηβσΦ) Ω = (1− αβ)DΩε + (1− β) (1− δ) . (32)
We first substitute (31) into (32) and then plot the left-hand side (LHS) and right-hand side(RHS) of (32) in Figure 3.Figure 3a shows that when α > 1/2 (i.e., ε < 0), there is a unique steady-state equilibrium
value of Ω. In this case, an increase in µ raises the steady-state equilibrium value of Ω if andonly if capital intensity η > 0 in the DM. Intuitively, higher inflation increases the cost ofconsumption in the DM where money is used as a medium of exchange. Due to this lowerdemand for consumption and a positive capital intensity in the DM, there is less incentive toaccumulate physical capital, which is a factor input for production in the DM. Furthermore,the lower demand for consumption in the DM shifts the demand for consumption to the CM.Both of these effects lead to an increase in the consumption-capital ratio Ω in the CM.
10

Figure 3a: Unique equilibrium under α > 1/2
Figure 3b shows that when α < 1/2 (i.e., ε > 1) and σ is suffi ciently large, thereare two steady-state equilibrium values of Ω denoted as Ωlow,Ωhigh. In this case, anincrease in µ leads to an increase in Ωlow but a decrease in Ωhigh. Given the two equilibria,we have global indeterminacy. The intuition can be understood as follows. SubstitutingGt = (τA)1/αkth
(1−α)/αt into (22) yields Yx,t = τ (1−α)/αA1/αkth
(1−α)/αt , where (1 − α)/α > 1
if and only if α < 1/2 (i.e., labor intensity 1 − α > 1/2 in the CM). When (1 − α)/α > 1,the aggregate production function exhibits increasing returns to scale in labor, which in turngives rise to an upward-sloping labor demand curve in the CM. Together with a horizontallabor supply curve from the quasi-linear preference, global indeterminacy arises. Finally,when α < 1/2 (i.e., ε > 1) and σ is suffi ciently small, there is no equilibrium, and we ruleout this parameter space by assumption.
Figure 3b: Multiple equilibria under α < 1/2
11

In (30), the variable Φt jumps to its unique steady-state value Φ given in (31). Therefore,equation (30) represents an autonomous one-dimensional dynamical system for Ωt. Taking alinear approximation around the steady-state equilibrium value Ω and using (32), we derive
Ωt+1 = (1− ξ)Ω + ξΩt ≡ F (Ωt), (33)
where ξ ≡ [(1− δ) + (1− ε)DΩε] / β [(1− δ) + α (1− ε)DΩε] is the characteristic root ofthe dynamical system. Figure 4 plots the phase diagram of the local dynamics of Ωt underα > 1/2. When α > 1/2 (i.e., ε < 0), the characteristic root ξ is greater than one. In thiscase, Figure 4 shows that the unique steady-state equilibrium exhibits saddle-point stability;therefore, Ωt always jumps to the unique steady state. However, empirical values of laborincome share suggest that labor intensity 1−α is usually greater than 0.5. Therefore, α < 1/2is the more relevant parameter space, which we examine next.
Figure 4: Phase diagram of Ωt under α > 1/2
For the case of α < 1/2 (i.e., ε > 1), it would be easier to understand the results if wefirst plot the relationship between the characteristic root ξ and the steady-state equilibriumvalue Ω. Also, it is useful to recall that ξ ∈ (−1, 1) implies a dynamically stable (i.e., locallyindeterminate) system and that a system is dynamically unstable (i.e., locally determinate)if ξ < −1 or ξ > 1. Figure 5 shows that the equilibrium Ωlow is always dynamicallyunstable because Ωlow < Ω∗ which implies ξ > 1, whereas the equilibrium Ωhigh can be eitherdynamically unstable (when Ωhigh > Ω∗∗ which implies ξ < −1 or ξ > 1) or dynamicallystable (when Ωhigh < Ω∗∗ which implies ξ ∈ (−1, 1)).8
8We will show that Ωhigh > Ω∗ and also derive Ω∗ and Ω∗∗ in the appendix.
12

Figure 5: Relationship between ξ and Ω under α < 1/2
Recall from Figure 3b that Ωhigh is increasing in the value of the matching parameter σ inthe DM. Then, Figure 6a shows that when α < 1/2 and σ is not too large,9 the equilibriumΩhigh is locally indeterminate (i.e., dynamically stable) because Ω∗ < Ωhigh < Ω∗∗ whereas theequilibriumΩlow is always locally determinate (i.e., dynamically unstable) becauseΩlow < Ω∗.When Ωlow is unstable and Ωhigh is stable, Ωt reaching the unstable equilibrium Ωlow is ameasure-zero event. In this case, the economy is subject to sunspot fluctuations around thestable equilibrium Ωhigh.
Figure 6a: Phase diagram of Ωt underα < 1/2 and a small σ
9Here we assume that σ is suffi ciently large for the presence of equilibria but not excessively large. In theproof of Proposition 1, we explicitly derive these threshold values; see the appendix.
13

Figure 6b10 shows that when α < 1/2 and σ is suffi ciently large, the two equilibria areboth locally determinate (i.e., dynamically unstable) because Ωhigh > Ω∗∗ and Ωlow < Ω∗. Inthis case, it is possible for Ωt to jump to either equilibrium. Therefore, unlike the case witha small σ, we cannot rule out the steady-state equilibrium Ωlow under a suffi ciently large σ.We summarize these results in Proposition 1.
Proposition 1 If α > 1/2, then there exists a unique steady-state equilibrium value of Ωt,which exhibits saddle-point stability. If α < 1/2, then there exist two equilibria. One islocally determinate and the other one is locally indeterminate under a suffi ciently small σwhereas they are both locally determinate under a suffi ciently large σ.
Proof. See the appendix.
Figure 6b: Phase diagram of Ωt under α < 1/2 and a large σ
4 Inflation and economic growth
In this section, we examine the relationship between inflation and economic growth. Giventhat in our analysis we treat the growth rate of money supply mt as an exogenous policyparameter µ, we first need to discuss the relationship between µ and the endogenous inflationrate π. Along a balanced-growth path, aggregate variables, such as output, consumption,capital and real money balance, grow at the same long-run growth rate g. In other words,the growth rate of mt/pt is equal to g, which in turn implies that (1 + g) = (1 + µ)/(1 + π)
10In this figure, we draw the case in which the characteristic root at the steady-state equilibrium Ωhigh isξ < −1. One can also draw the case of ξ > 1.
14

because the growth rates of mt and pt are respectively µ and π. From the approximationln(1+X) ≈ X, the relationship (1+π) = (1+µ)/(1+g) becomes π = µ−g(µ), where the long-run growth rate g(µ) is a function of µ as we will show below. Taking the derivative yields∂π/∂µ = 1− g′(µ). Therefore, if money growth µ has a negative effect on economic growthg, then it must have a positive effect on inflation π implying also a negative relationshipbetween inflation and economic growth. Even if money growth µ has a positive effect oneconomic growth g, it would still have a positive effect on inflation π so long as its effecton economic growth is not excessively large (i.e., g′(µ) < 1). In this case, the positiverelationship between money growth and economic growth implies also a positive relationshipbetween inflation and economic growth. Therefore, the relationship between money growthand economic growth generally carries over to inflation and economic growth.Using (29), we obtain the following expression for the long-run growth rate of the econ-
omy:
g ≡ kt+1
kt− 1 = DΩε
t − Ωt − δ. (34)
In the case of a unique equilibrium (i.e., α > 1/2 and ε < 0), we have ∂g/∂Ω < 0. Further-more, Figure 3a shows that ∂Ω/∂µ > 0 given η > 0. Therefore, the overall effect of µ ong is negative. Intuitively, an increase in inflation leads to a higher cost of money holding,which in turn increases the cost of consumption and reduces the level of consumption inthe DM. As a result, there are less incentives to accumulate capital for production in theDM, and the lower rate of capital accumulation leads to a lower growth rate of the economy.We summarize this result in Proposition 2. This result is similar to the one in Chu et al.(2014), except that we have generalized the model to asymmetric degrees of capital intensityin the CM and the DM and shown that it is the degree of capital intensity η in the DM thatdetermines whether inflation affects economic growth.
Proposition 2 If α > 1/2, then there exists a unique balanced growth equilibrium in whicha higher money growth rate µ reduces economic growth.
Proof. See the appendix.
In the more plausible case of α < 1/2, we have multiple equilibria, and it would be moretransparent if we use (28) to express the long-run growth rate of the economy as
g ≡ xt+1
xt− 1 = β [1− δ + αDΩε + ησΦΩ]− 1, (35)
where Φ is the steady-state ratio of real money balance to consumption in the CM as shownin (31). The ratio of real money balance to consumption in the DM is decreasing in thegrowth rate of money supply, and this result can be shown as follows:
∂Φ
∂µ= − σβ
θ [(1 + µ)− β (1− σ)]2< 0. (36)
Intuitively, a higher money growth rate increases inflation, which in turn raises the cost ofmoney holding. Equation (35) also shows that a larger Ω corresponds to a higher growth
15

rate for a given Φ because ε is positive (recall that α < 1/2 implies ε > 1). Therefore, Ωhigh
corresponds to the high-growth equilibrium ghigh whereas Ωlow corresponds to the low-growthequilibrium glow.Figure 3b shows that Ωhigh is decreasing in µ given η > 0. Together with the result
that Φ is also decreasing in µ, we find that the high-growth equilibrium growth rate ghigh isdecreasing in the money growth rate µ. Therefore, the effect of inflation on growth in thehigh-growth equilibrium is the same as in the unique equilibrium. However, the intuitionbehind these results is different. In the case of the high-growth equilibrium, an increase ininflation reduces the consumption-capital ratio Ωhigh in the CM, and this counterintuitiveresult is due to the presence of global indeterminacy. From (34), we see that Ω has a positiveeffect on g via DΩε (when ε is positive) and a negative effect on g via −Ω. The overallrelationship between g and Ω in (34) is a U-shaped function11 as we show in Figure 7.12
Because Ωhigh is always on the upward-sloping side of the U-shape, the increase in µ leadsto a decrease in both Ωhigh and ghigh. In this case, when inflation decreases consumption inthe CM, it causes the individuals to also want to consume less leisure and raise their supplyof labor in the CM. Given that the labor demand curve is upward sloping due to productivegovernment spending, this increase in labor supply (i.e., a downward shift in the horizontallabor supply curve) leads to a surprising decrease in equilibrium labor input, which in turnreduces the levels of output and capital investment.
Figure 7: Relationship between g and Ω in(34) when ε > 1
As for Ωlow, it is increasing in µ given η > 0 as shown in Figure 3b. However, glow can beeither increasing or decreasing in µ. Recall from (34) that g is a U-shaped function in Ω when
11Recall that ε > 1 when α < 1/2.12In Figure 7, the equilibria Ωlow,Ωhigh are determined by the intersection of g(Ω) in (34) and g(Ω) in
(35), where the latter is a monotonically increasing function in Ω when ε is positive. We do not draw (35)in Figure 7 to simplify the diagram.
16

ε > 1. Therefore, when Ωlow is suffi ciently small, the increase in Ωlow caused by an increasein µ reduces the growth rate glow. Intuitively, higher inflation reduces both consumption andthe incentives to accumulate capital for production in the DM. This lower rate of capitalaccumulation causes the lower growth rate. This is the negative capital-accumulation effectof inflation. In contrast, when Ωlow is suffi ciently large, the increase in Ωlow caused by anincrease in µ raises the growth rate glow. Intuitively, when inflation increases consumptionin the CM, it causes the individuals to also want to consume more leisure and reduce theirsupply of labor in the CM. Given that the labor demand curve is upward sloping due toproductive government spending, this decrease in labor supply (i.e., an upward shift in thehorizontal labor supply curve) leads to a surprising increase in equilibrium labor input, whichin turn increases the levels of output and capital investment. This is the novel positive labor-market effect of inflation in the presence of productive government spending. Therefore, theoverall effect of µ on the low-growth equilibrium growth rate glow is generally a U-shapedfunction. However, as we will show in Proposition 3, it is also possible for the labor-marketeffect to always dominate the capital-accumulation effect (i.e., when Ωlow is always on theupward-sloping side of the U-shape in Figure 7) or for the capital-accumulation effect toalways dominate the labor-market effect (i.e., when Ωlow is always on the downward-slopingside of the U-shape). We summarize these results in Proposition 3.
Proposition 3 If α < 1/2, then a higher money growth rate µ has the following effects oneconomic growth: the high-growth equilibrium ghigh is decreasing in µ whereas the low-growthequilibrium glow can be an increasing, a decreasing or a U-shaped function in µ.
Proof. See the appendix.
5 Conclusion
In this study, we have explored the effects of inflation in a monetary search-and-matchingmodel. A novelty of our analysis is productive government expenditure that generates en-dogenous growth and equilibrium indeterminacy in the model. We find that when laborintensity in the CM is below a threshold, the model features a unique equilibrium in whichinflation has a negative effect on growth so long as capital intensity is positive in the DM.When labor intensity in the CM is above the threshold which is empirically the more likelyscenario, the model may feature two equilibria, in which the two equilibria display differentcomparative statics of growth with respect to inflation. Specifically, the high-growth equi-librium features a negative effect of inflation on growth whereas the low-growth equilibriummay feature a negative, a positive or a U-shaped effect of inflation on growth. Further-more, under a suffi ciently large matching probability in the DM, both equilibria are locallydeterminate; therefore, either equilibrium may emerge in the economy.
17

References
[1] Aruoba, S., Waller, C., and Wright, R., 2011. Money and capital. Journal of MonetaryEconomics, 58, 98-116.
[2] Barro, R., 1990. Government spending in a simple model of endogenous growth. Journalof Political Economy, 98, 103-125.
[3] Bencivenga, V., and Camera, G., 2011. Banking in a matching model of money andcapital. Journal of Money, Credit and Banking, 43, 449-476.
[4] Benhabib, J. and Farmer, R., 1994. Indeterminacy and increasing returns. Journal ofEconomic Theory, 73, 19-41.
[5] Benhabib, J. and Farmer, R., 1996. Indeterminacy and sector-specific externalities.Journal of Monetary Economics, 37, 421-444.
[6] Benhabib, J. and Farmer, R., 1999. Indeterminacy and sunspots in macroeconomics.In J. Taylor and M. Woodford, eds., Handbook of Macroeconomics, Amsterdam: NorthHolland, 387-448.
[7] Chang, J., Chang, W., Lai, C., and Wang, P., 2007. Equilibrium dynamics in an en-dogenous growth model of money and banking. Journal of Money, Credit and Banking,39, 1683-1710.
[8] Chen, B., Hsu, M., and Lu, C., 2008. Inflation and growth: Impatience and a qualitativeequivalence. Journal of Money, Credit and Banking, 40, 1309-1323.
[9] Chu, A., and Cozzi, G., 2014. R&D and economic growth in a cash-in-advance economy.International Economic Review, 55, 507-524.
[10] Chu, A., Kan, K., Lai, C., and Liao, C., 2014. Money, random matching and endogenousgrowth: A quantitative analysis. Journal of Economic Dynamics and Control, 41, 173-187.
[11] Dotsey, M., and Ireland, P., 1996. The welfare cost of inflation in general equilibrium.Journal of Monetary Economics, 37, 29-47.
[12] Farmer, R., 1997. Money in a real business cycle model. Journal of Money, Credit andBanking, 29, 568-611.
[13] Goenka, A., 1994. Fiscal rules and extrinsic uncertainty. Economic Theory, 4, 401-416.
[14] Gomme, P., 1993. Money and growth revisited: Measuring the costs of inflation in anendogenous growth model. Journal of Monetary Economics, 32, 51-77.
[15] Ho, W., Zeng, J., and Zhang, J., 2007. Inflation taxation and welfare with externalitiesand leisure. Journal of Money, Credit, and Banking, 39, 105-31.
18

[16] Itaya, J., andMino, K., 2003. Inflation, transaction costs and indeterminacy in monetaryeconomies with endogenous growth. Economica, 70, 451-470.
[17] Lagos, R., and Wright, R., 2005. A unified framework for monetary theory and policyanalysis. Journal of Political Economy, 113, 463-484.
[18] Lai, C., and Chin, C., 2010. (In)determinacy, increasing returns, and the optimality ofthe Friedman rule in an endogenously growing open economy. Economic Theory, 44,69-100.
[19] Menner, M., 2006. A search-theoretic monetary business cycle with capital formation.Contributions to Macroeconomics, 6, Article 11.
[20] Schmitt-Grohé, S. and Uribe, M., 1997. Balanced-budget rules, distortionary taxes andaggregate instability. Journal of Political Economy, 105, 976-1000.
[21] Shi, S., 1999. Search, inflation and capital accumulation. Journal of Monetary Eco-nomics, 44, 81-104.
[22] Waller, C., 2011. Random matching and money in the neoclassical growth model: Someanalytical results. Macroeconomic Dynamics, 15, 293-312.
[23] Wang, P., and Yip, C., 1992. Alternative approaches to money and growth. Journal ofMoney, Credit and Banking, 24, 553-62.
[24] Williamson, S., and Wright, R., 2010. New monetarist economics: Models. In: B. Fried-man and M. Woodford (ed.). Handbook of Monetary Economics, 3, 25-96. Elsevier.
19

Appendix
Proof of Proposition 1. Equation (30) shows that the variable Φt jumps to its uniquesteady state Φ given in (31). We substitute Φ into (30) to obtain the following autonomousone-dimensional dynamical system for Ωt:
Ωt+1
Ωt
=β[1− δ + αDΩε
t+1 + ησΦΩt+1
]DΩε
t − Ωt + 1− δ . (A1)
Taking a linear approximation around the steady-state equilibrium Ω yields
Ωt+1 = Ω +(1− δ) + (1− ε)DΩε
β [(1− δ) + α (1− ε)DΩε](Ωt − Ω) , (A2)
where we have used (32). Based on (A2), the characteristic root ξ of the dynamical systemcan be expressed as
ξ ≡ (1− δ) + (1− ε)DΩε
β [(1− δ) + α (1− ε)DΩε]. (A3)
The local stability properties of the steady state are determined by comparing the numberof the stable root with the number of predetermined variables in the dynamical system. In(A2), there is no predetermined variable because Ωt is a jump variable. As a result, thesteady-state equilibrium Ω is locally determinate when the characteristic root is unstable(i.e., |ξ| > 1) whereas it is locally indeterminate when the characteristic root is stable (i.e.,|ξ| < 1). Given these properties, we have the following results. First, if α > 1/2 (i.e., ε < 0),then the dynamical system exists a unstable root. This result implies that Ωt displayssaddle-point stability and equilibrium uniqueness as shown in Figures 3a and 4.Second, if α < 1/2 (i.e., ε > 1), then whether the root is unstable or stable is determined
by the steady-state equilibrium value of Ω. The result implies that multiple equilibria mayemerge as shown in Figure 3b. To derive a range for the steady-state equilibrium value ofΩ, we first make use of (32) to obtain
∂LHS
∂Ω=∂RHS
∂Ω⇒ Ω∗ ≡
[(1− β) (1− δ)
(1− αβ) (ε− 1)D
]1/ε
, (A4)
where Ω∗ is a threshold value under which Ωlow < Ω∗ and Ωhigh > Ω∗ as shown in Figure 8.
20

Figure 8
A steady-state equilibrium Ω is dynamically stable if ξ ∈ (−1, 1). One can manipulate(A3) to show that ξ ∈ (−1, 1) is equivalent to
Ω∗ < Ω < Ω∗∗, (A5)
where Ω∗∗ ≡ [(1 + β) (1− δ)] / [(1 + αβ) (ε− 1)D]1/ε. Therefore, a steady-state equilib-rium Ω is locally indeterminate if Ω ∈ (Ω∗,Ω∗∗) whereas it is locally determinate if Ω < Ω∗
or Ω > Ω∗∗. We can now conclude that Ωlow is locally determinate because Ωlow < Ω∗.However, Ωhigh can be either locally indeterminate when Ω∗ < Ωhigh < Ω∗∗ or it can belocally determinate when Ωhigh > Ω∗∗.Next, we examine how the matching probability σ affects the steady-state equilibrium
values of Φ,Ω, which in turn affect the dynamical properties of Ωt. Differentiating (31)and (32) with respect to σ yields
∂Φ
∂σ=
β (1 + µ− β)
θ [(1 + µ)− β (1− σ)]2> 0. (A6)
∂Ω
∂σ=
ηβΩ2
(1− αβ) (ε− 1)DΩε − (1− β) (1− δ)︸ ︷︷ ︸?
(Φ + σ
∂Φ
∂σ
)︸ ︷︷ ︸
+
. (A7)
Equation (A6) indicates that increasing σ has a positive effect on Φ. Equation (A7) showsthat increasing σ has an ambiguous effect on Ω. Specifically, if and only if Ω > Ω∗, then Ωis increasing in σ. The result implies that an increase in σ may cause Ωhigh to change frombeing locally indeterminate (i.e., Ωhigh < Ω∗∗) to being locally determinate (i.e., Ωhigh > Ω∗∗).Finally, it can be shown that when σ is suffi ciently large (small), we must obtain Ωhigh > Ω∗∗
(Ωhigh < Ω∗∗). To prove this statement, we make use of (32) to obtain
(1 + ηβσΦ) = (1− αβ)DΩε−1 +(1− β) (1− δ)
Ω. (A8)
21

The right-hand side (RHS) of (A8) is increasing in Ω, and this result can be shown as follows:
∂RHS
∂Ω=
1
Ω2[(1− αβ)(ε− 1)DΩε − (1− β)(1− δ)]︸ ︷︷ ︸
+
> 0. (A9)
Suppose we have an equilibrium Ωhigh < Ω∗∗ under a certain value of σ. In this case,substituting Ω∗∗ into the RHS of (A8) yields (1 + ηβσΦ) < (RHS)Ω=Ω∗∗. Given ∂Φ/∂σ > 0,we know that there exists a larger value of σ denoted as σ∗∗ such that (1 + ηβσΦ) =(RHS)Ω=Ω∗∗ at σ = σ∗∗, where
σ∗∗ ≡ 1
2ηβ2
θβ(Θ− 1) +
2
√[θβ(Θ− 1)]2 + 4ηθβ2(Θ− 1) [1 + µ− β]
> 0, (A10)
Θ ≡ (1− αβ)D(Ω∗∗)ε−1 +(1− β)(1− δ)
Ω∗∗> 1. (A11)
By analogous inference, we substitute Ω∗ into (A8) to derive
σ∗ ≡ 1
2ηβ2
θβ(Ψ− 1) +
2
√[θβ(Ψ− 1)]2 + 4ηθβ2(Ψ− 1) [1 + µ− β]
> 0, (A12)
Ψ ≡ (1− αβ)D(Ω∗)ε−1 +(1− β)(1− δ)
Ω∗> 1. (A13)
As a result, if σ is suffi ciently large (i.e., σ > σ∗∗), then Ωhigh changes from being locallyindeterminate to being locally determinate. On the contrary, if σ is suffi ciently small (i.e.,σ ∈ (σ∗, σ∗∗)), then Ωhigh exists and is locally indeterminate.
Proof of Proposition 2. Differentiating (32) with respect to µ and using (36) yield
∂Ω
∂µ=
ηβσΩ2
(1− αβ) (ε− 1)DΩε − (1− β) (1− δ)︸ ︷︷ ︸?
× ∂Φ
∂µ︸︷︷︸−
. (A14)
Given α > 1/2 and ε < 0, we have the following results. First, there is a unique steady-stateequilibrium value of Ω which is increasing in µ, given η > 0, as reported in Figure 3a. Second,based on (34), the growth rate is monotonically decreasing in the consumption-capital ratioin the CM (i.e., ∂g/∂Ω = εDΩε−1 − 1 < 0). We make use of these results and take thedifferentials of (34) with respect to µ to obtain
∂g
∂µ=
∂g
∂Ω︸︷︷︸−
× ∂Ω
∂µ︸︷︷︸+
< 0. (A15)
Equation (A15) shows that if α > 1/2, there exists a unique balanced-growth equilibrium inwhich an increase in µ reduces g.
22
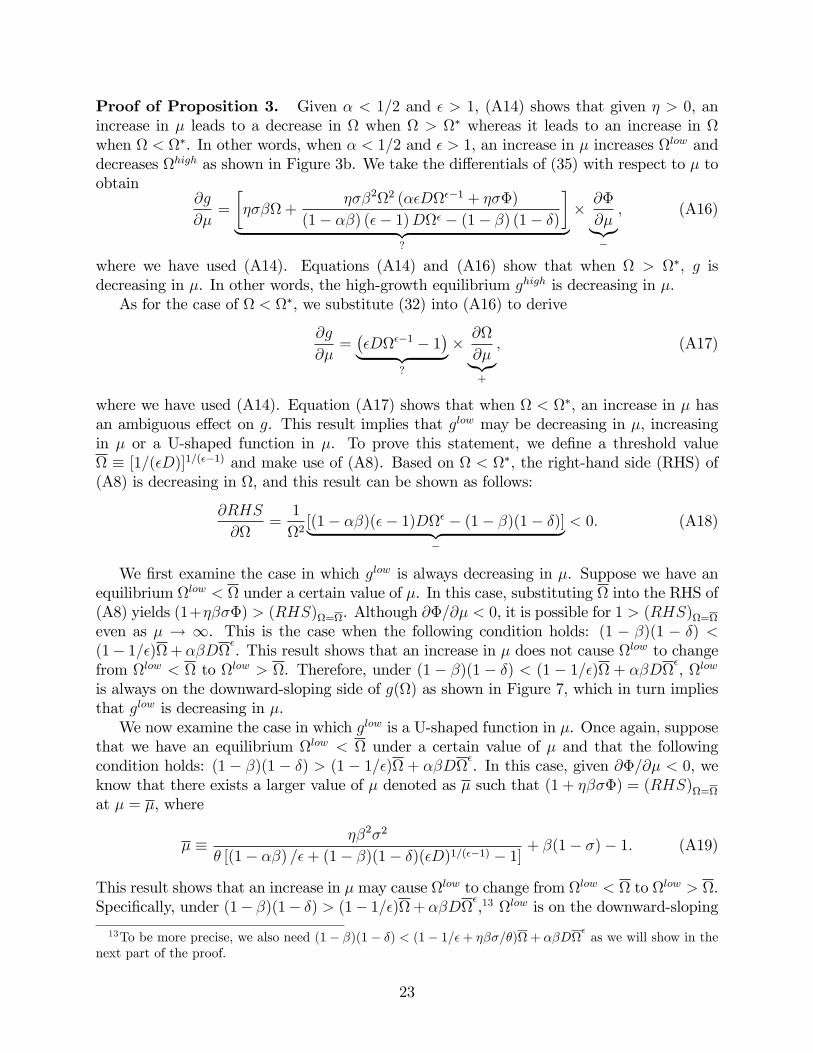
Proof of Proposition 3. Given α < 1/2 and ε > 1, (A14) shows that given η > 0, anincrease in µ leads to a decrease in Ω when Ω > Ω∗ whereas it leads to an increase in Ωwhen Ω < Ω∗. In other words, when α < 1/2 and ε > 1, an increase in µ increases Ωlow anddecreases Ωhigh as shown in Figure 3b. We take the differentials of (35) with respect to µ toobtain
∂g
∂µ=
[ησβΩ +
ησβ2Ω2 (αεDΩε−1 + ησΦ)
(1− αβ) (ε− 1)DΩε − (1− β) (1− δ)
]︸ ︷︷ ︸
?
× ∂Φ
∂µ︸︷︷︸−
, (A16)
where we have used (A14). Equations (A14) and (A16) show that when Ω > Ω∗, g isdecreasing in µ. In other words, the high-growth equilibrium ghigh is decreasing in µ.As for the case of Ω < Ω∗, we substitute (32) into (A16) to derive
∂g
∂µ=(εDΩε−1 − 1
)︸ ︷︷ ︸?
× ∂Ω
∂µ︸︷︷︸+
, (A17)
where we have used (A14). Equation (A17) shows that when Ω < Ω∗, an increase in µ hasan ambiguous effect on g. This result implies that glow may be decreasing in µ, increasingin µ or a U-shaped function in µ. To prove this statement, we define a threshold valueΩ ≡ [1/(εD)]1/(ε−1) and make use of (A8). Based on Ω < Ω∗, the right-hand side (RHS) of(A8) is decreasing in Ω, and this result can be shown as follows:
∂RHS
∂Ω=
1
Ω2[(1− αβ)(ε− 1)DΩε − (1− β)(1− δ)]︸ ︷︷ ︸
−
< 0. (A18)
We first examine the case in which glow is always decreasing in µ. Suppose we have anequilibrium Ωlow < Ω under a certain value of µ. In this case, substituting Ω into the RHS of(A8) yields (1+ηβσΦ) > (RHS)Ω=Ω. Although ∂Φ/∂µ < 0, it is possible for 1 > (RHS)Ω=Ω
even as µ → ∞. This is the case when the following condition holds: (1 − β)(1 − δ) <(1− 1/ε)Ω + αβDΩ
ε. This result shows that an increase in µ does not cause Ωlow to change
from Ωlow < Ω to Ωlow > Ω. Therefore, under (1 − β)(1 − δ) < (1 − 1/ε)Ω + αβDΩε, Ωlow
is always on the downward-sloping side of g(Ω) as shown in Figure 7, which in turn impliesthat glow is decreasing in µ.We now examine the case in which glow is a U-shaped function in µ. Once again, suppose
that we have an equilibrium Ωlow < Ω under a certain value of µ and that the followingcondition holds: (1 − β)(1 − δ) > (1 − 1/ε)Ω + αβDΩ
ε. In this case, given ∂Φ/∂µ < 0, we
know that there exists a larger value of µ denoted as µ such that (1 + ηβσΦ) = (RHS)Ω=Ω
at µ = µ, where
µ ≡ ηβ2σ2
θ [(1− αβ) /ε+ (1− β)(1− δ)(εD)1/(ε−1) − 1]+ β(1− σ)− 1. (A19)
This result shows that an increase in µ may cause Ωlow to change from Ωlow < Ω to Ωlow > Ω.Specifically, under (1− β)(1− δ) > (1− 1/ε)Ω + αβDΩ
ε,13 Ωlow is on the downward-sloping
13To be more precise, we also need (1− β)(1− δ) < (1− 1/ε+ ηβσ/θ)Ω + αβDΩεas we will show in the
next part of the proof.
23

side of g(Ω) when µ < µ, whereas Ωlow is on the upward-sloping side of g(Ω) when µ > µ asshown in Figure 7. Therefore, the overall effect of µ on glow follows a U-shaped function.Finally, we examine the case in which glow is always increasing in µ. Suppose we have an
equilibrium Ωlow > Ω. In this case, substituting Ω into the RHS of (A8) yields (1 +ηβσΦ) <(RHS)Ω=Ω. Although ∂Φ/∂µ < 0, it is possible for (1 + ηβσ/θ) < (RHS)Ω=Ω even atµ = µ, where µ = β − 1 is the lower bound on µ (i.e., the zero lower bound on the nominalinterest rate). This is the case when the following condition holds: (1−β)(1−δ) > (1−1/ε+ηβσ/θ)Ω+αβDΩ
ε. In this case, a decrease in µ does not cause Ωlow to change from Ωlow > Ω
to Ωlow < Ω for µ ≥ µ. Therefore, under (1−β)(1− δ) > (1−1/ε+ ηβσ/θ)Ω +αβDΩε, Ωlow
is always on the upward-sloping side of g(Ω) as shown in Figure 7, which in turn impliesthat glow is increasing in µ.To sum up, the overall relationship between the low-growth equilibrium glow and the
money growth rate µ can be positive, negative or U-shaped.
24