Embed Size (px)
Citation preview
Index of balancing stakeholders’ interests as a mechanism to improve corporate governance of
Russian oil companies
4th International Doctoral Meeting of Montpellier3 – 5 May, 2011
Julia KrutilinaNational Research University – Higher School of Economics

Actuality and theoretical background
2
Company
Conceptual framework
financial and economic crisis of 2008-2010 and its implications
globalization of the world economy
increasing level of quality of people life
increasing desire of companies to improve their reputation
Government
Consumers
Suppliers
Stakeholder concept
Freeman, 1984; Jensen, 1976; Post, Preston, 2002; Bradley, 2009; Donaldson, 1995; Hill, Jones, 1992
Freeman, 2007; Keeney, Gregory, 1999
Mitchell, 1997; Frooman, 1999; Jones, 1995; Rowley, 2003; Kaler, 2006
Models of evaluation Recommendations on Policy
Standards• Guide to reporting on sustainable development from GRI;• AA1000 series from AccountAbility;• Oil and gas industry guidance on voluntary sustainability reporting from IPIECA;• Global compact from UN;• etc.

3
Scorecard model based on index of balancing stakeholder interests
Stakeholders interests Indicatorsof benefits and costs
Companies values of indicators
Short-term and long-term periods
… … …
Internal
External
Shareholders, investors, Management, Employees
Suppliers Consumers, Government, Regions and local communities
Inte
rest
s
C1 C2 Cn… … …
… … …
… … …
… … …… … …… … …
Gro
ups
inde
xes
Annual average increase rate of main indicators
of benefits
Gro
ups
dyna
mic
indi
cato
rs Index of balancing
stakeholder interests

44
Table 1. Indicators for internal stakeholder groups.
Scorecard model based on index of balancing stakeholder interests
Group of stakeholder
Characteristic of indicator
Characteristic of goal
Goals Indicators
Shareholders and investors
Static Benefits High level of dividends, Dividends per share, $, High company capitalization, Share price, $, Stability of dividend payments. Dividends nonpayment accidents, un.
Costs Decrease of specific risks, Specific risk rate of emitter, Decrease of systematic risks Beta level of shares
Dynamic Annual average increase rate of main indicators of benefits
Annual average increase rate of dividends, %, Annual average increase rate of company capitalization, %
Management Static Benefits High level of compensation, Level of top-management salary and compensation, thousands $,
Career opportunities, Average tenure, year, Power and authorities. Average percentage of manager’s tasks and duties, %.
Costs Level of conflict in the company, Average number of conflicts, un., Personal time spent on the job Average time spent on overtime, hours per day.
Dynamic Annual average increase rate of main indicators of benefits
Annual average increase rate of compensation level, %, Annual average increase rate of tasks and duties share, %
Employees Static Benefits High level of salary, Level of salary, thousands $ per month, Employment and development guarantees
Social benefits, thousands $ per year, Duration of employees training programs, thousands of man-hours.
Costs Employment and development guarantees, Level of staff turnover, %, Work safety
Number of victims of accidents, people, Average frequency of accidents, units per mln of man-hours
Dynamic Annual average increase rate of main indicators of benefits
Annual average increase rate of salary, %, Annual average increase rate of social benefits, %

55
Table 2. Indicators for external stakeholder groups.
Scorecard model based on index of balancing stakeholder interests
Group of stakeholder
Characteristic of indicator
Characteristic of goal
Goals Indicators
Suppliers Static Benefits Long-term partnership, Percentage of long-term contracts, %,
Large amounts of supplies, Percentage of the cost of procurement, %,
Support local partners Percentage of local suppliers, %
Costs Timeliness of payments, Percentage of debt to pay for supplies in the total amount of payments on deliveries for the year, %,
Stability of supply Average level of disruptions caused by the company, units per year
Dynamic Annual average increase rate of main indicators of benefits
Annual average increase rate of procurement, %
Consumers Static Benefits High product quality, Light oil product yield, %,
Quality of retail sales service,
Deep of oil refining, %,
Saturation coverage ratio of retail stations.
Costs Relatively low price for the products Average time of signing of OTC, days,
Average price for oil on internal market, $/bbl,
Average price for gasoline on internal market, $/tn
Dynamic Annual average increase rate of main indicators of benefits
Annual average decrease rate of main production price, %,
Annual average decrease rate of deep of oil refining, %

66
Table 3. Indicators for external stakeholder groups.
Scorecard model based on index of balancing stakeholder interests
Group of stakeholder
Characteristic of indicator
Characteristic of goal
Goals Indicators
Government Static Benefits Replenishment of hydrocarbon reserves, Reserves replacement ratio (by SEC-LOF), %, Developing new greenfields, Percentage of new licenses for exploration and
development in the total number of licenses, %, Percentage of exploration costs in total costs, %,
Tax payments, Percentage of tax payment in total costs, %, Modernization of facilities, Percentage of organic investment in total costs, %, Increasing energy efficiency, Level of APG utilization, %,
Saving energy, %, Environmental protection,
Investments on environmental protection, mln. $, Waste utilization, thousands of ton,
High product quality Light oil product yield, %Costs Compliance with national and international
environmental standardsTotal greenhouse emissions, thousands of ton, Water usage, thousands of sq.m.
Dynamic Annual average increase rate of main indicators of benefits
Annual average decrease rate of tax payment, %, Annual average decrease rate of APG utilization, %, Annual average decrease rate of saving energy, %
Regionals and communities
Static Benefits Reconstruction of regions, Percentage of area remediated, %, Social responsibility events, Social investments, mln.$, Interaction with universities and young professionals
Investment in young professionals development programs, thousands $, Number of students who passed the intern in the company, people
Costs Employment guarantees for population, Level of staff turnover, %, Negative impact on local companies Average loss rate of local businesses, mln.$
Dynamic Annual average increase rate of main indicators of benefits
Annual average increase rate of percentage of area remediated, %, Annual Average increase rate of social investments, %

77
Stakeholders Main indicators of a model
Shareholders and investors
Dividends per share, share price, dividends nonpayment accidents, specific risk rate;
Management Level of top-management salary and compensation, average tenure, average time spent on overtime;
Employees Level of salary, social benefits, level of staff turnover, average recordable incident rate;
Suppliers Percentage of long-term contracts, percentage of the cost of procurement, percentage of local suppliers, average level of disruptions caused by the company;
Consumers Deep of oil refining, average price on production on internal market, saturation coverage ratio of retail stations, average time of signing of OTC;
Government SEC reserves replacement ratio, percentage of taxes, level of APG utilization, Light oil product yields, total greenhouse emissions;
Regions and communities
Percentage of area remediated, social investments, level of staff turnover, investment in young professionals development programs.
Table 4. Main indicators of the proposed scorecard model based on index of balancing stakeholder interests.
Scorecard model based on index of balancing stakeholder interests

8
• Index of balancing stakeholder interests:
• The stakeholder group index:
• The index of indicator:
8
Calculation formula of the scorecard model
i - consecutive number of group;j - consecutive number of indicator
,
m - number of indicators in the group
n - number stakeholder groups - weight of stakeholder group
,
,
1
2
3
99
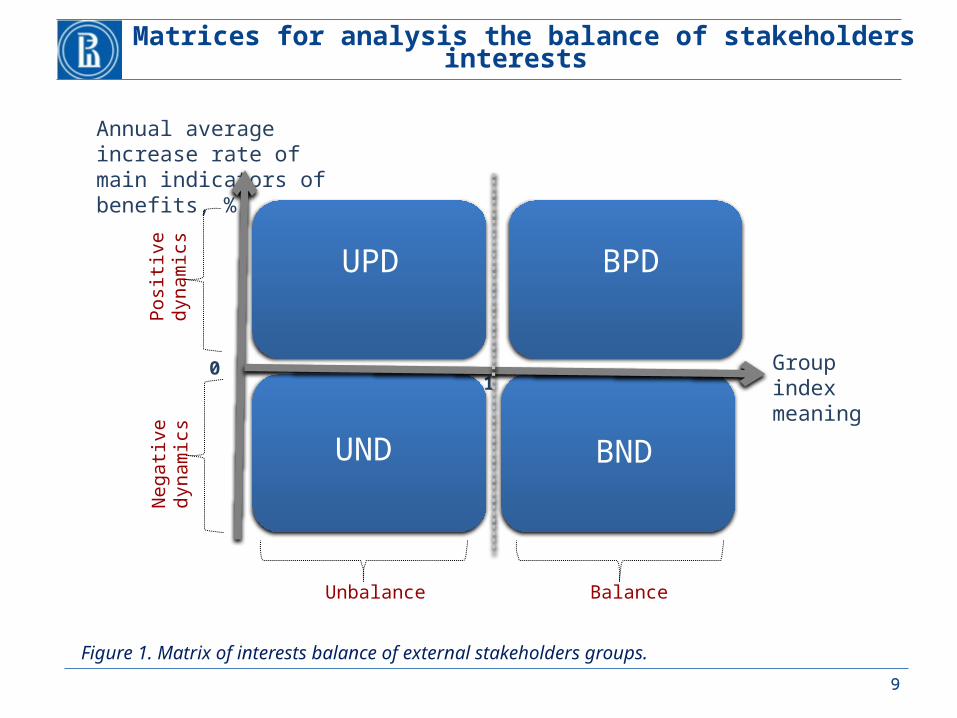
Matrices for analysis the balance of stakeholders interests
Figure 1. Matrix of interests balance of external stakeholders groups.
Annual average increase rate of main indicators of benefits, %
Group index meaning
Posi
tive
dyna
mic
sN
egati
ve d
ynam
ics
BPDUPD
BNDUND
Unbalance Balance
10

1010
Matrices for analysis the balance of stakeholders interests
0
Inflation rate, %
Annual average increase rate of main indicators of benefits, %
Group index meaning1
BPDoiUPDoi
Posi
tive
dyna
mic
sN
egati
ve
dyna
mic
s
BPDuiUPDui
BNDUND
Over
inflationU
nder inflation
Unbalance Balance
Figure 2. Matrix of interests balance of internal stakeholders groups.

Recommendations on adjusting the company's stakeholder policy
11
BPDUPD
BNDUND
BPDUPD
BNDUND
BPDUPD
BNDUND
BPDUPD
BNDUND
BPD
UPD
BND
UND
•No special events to increase the stakeholders satisfaction involved in this zone•To use a potential for reallocating resources towards less satisfied groups
• To increase a static indicator in the short term• To review long-term plan for reallocating resources towards less satisfied weighty groups
•To plan an increase of the key benefits indicators in the long term, •To undertake work to bring new policy to stakeholders
•To bring values of static and dynamic indicators to market average level•To gradually increase the level of indicators values to level of core industry leaders towards less satisfied weighty groups • To use of the mechanisms to inform stakeholders about planned activities, organization of the feedback channel to receive complaints and grievances for they can be removed

Lukoil
Surgutneftegas
Tatneft
TNK-BP
Rosneft
Gazprom neft
Bashneft
Implementation of the model: TNK-BP
12
TNK-BP’s model
2005 - 2009
Fina
ncia
l and
soc
ial
stat
emen
ts
Stakeholders Group index meanings
Dynamic indicator meanings, %
Suppliers 1 19,38
Shareholders 1,03 15,7
Employees 1,35 11,13
Government 1,11 10,77
Management 1 1,74
Consumers 0,96 0,35
Regions 1,07 -1,39
Average in industry
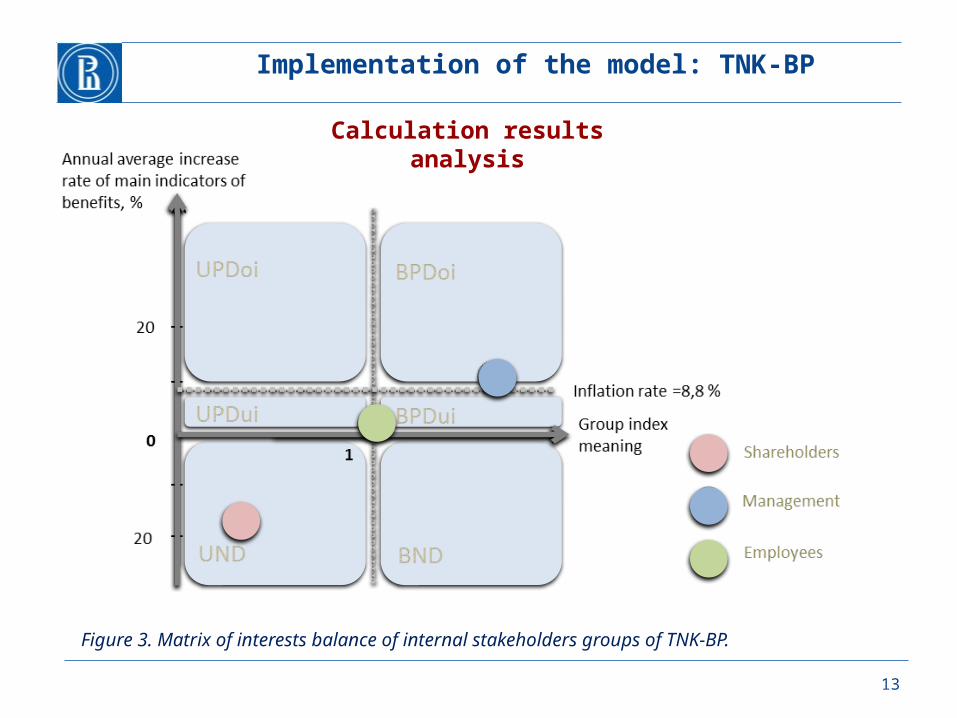
TNK-BPIndex of balancing stakeholder interests:• 0,87
Annual average increase rate of main indicators of benefits• 5,64 %
Scorecard model calculation
13
Implementation of the model: TNK-BP
Figure 3. Matrix of interests balance of internal stakeholders groups of TNK-BP.
Calculation results analysis

14
Implementation of the model: TNK-BP
Figure 4. Matrix of interests balance of external stakeholders groups of TNK-BP.
Calculation results analysis

15
Main recommendations on company’s policy in stakeholder management
Implementation of the model: TNK-BP
Shareholders
Increasing dividends payment to level of $0,5 by 2012
Annual growth of dividends payment on average for 20%,
Realization of projects in Russia and Ukraine providing annual capitalization growth on average for 6-10%
Regions and communities
Annual increase of social investments to level of 150 mln$ by 2015
Decrease of staff turnover to level on average of 6%

16
Main pitfalls
Testing model
Preliminary current controlStakeholder groups Indicators Mean St.dev.Shareholders Dividends per share, $, 0,552 0,760
Share price, $, 14,544 19,961Dividends nonpayment accidents, un. 0,057 0,151Specific risk rate of emitter, 0,971 0,960Beta level of shares 1,321 0,401Annual average increase rate of dividends, %, 0,256 0,458Annual average increase rate of company capitalization, % 0,058 0,135
Management Level of top-management salary and compensation, thousands $, 103,921 99,993Average tenure, year, 5,861 2,435Annual average increase rate of compensation level, %, 0,017 0,120
Employees Level of salary, thousands $ per month, 1,635 0,412Social benefits, thousands $ per year, 0,537 0,315Duration of employees training programs, thousands of man-hours 185,000 105,987Level of staff turnover, %, 5,839 2,707Number of victims of accidents, people, 52,250 31,774Average frequency of accidents, units per mln of man-hours 1,467 1,256Annual average increase rate of salary, %, 0,100 0,122Annual average increase rate of social benefits, % 0,123 0,134
The testing method
The sample forming

17
Testing model
Stakeholder groups Indicators Mean St.dev.Suppliers Percentage of the cost of procurement, %, 38,767 35,342
Percentage of local suppliers, % 76,857 26,207Annual average increase rate of procurement, % 0,194 0,313
Consumers Light oil product yield, %, 52,014 8,885Deep of oil refining, %, 75,817 9,701Saturation coverage ratio of retail stations. 4,836 3,868Average price for oil on internal market, $/bbl, 34,469 3,756Average price for gasoline on internal market, $/tn 763,481 66,675Annual average decrease rate of main production price, %, 0,029 0,078Annual average decrease rate of deep of oil refining, % 0,028 0,033
Government Reserves replacement ratio (by SEC-LOF), %, 310,040 223,453Percentage of new licenses for exploration and development in the total number of licenses, %, 4,059 3,911Percentage of exploration costs in total costs, %, 0,617 0,384Percentage of tax payment in total costs, %, 31,583 22,771Percentage of organic investment in total costs, %, 12,262 9,630Level of APG utilization, %, 78,829 16,922Saving energy, %, 6,094 7,472Investments on environmental protection, mln. $, 157,225 169,258Waste utilization, thousands of ton, 286,571 264,587Light oil product yield, % 52,014 8,885Total greenhouse emissions, thousands of ton, 535,600 409,916Annual average decrease rate of tax payment, %, 0,037 0,273Annual average decrease rate of APG utilization, %, 0,037 0,046Annual average decrease rate of saving energy, % 0,376 0,834
Regions Percentage of area remediated, %, 9,873 9,011Social investments, mln.$, 149,059 188,317Investment in young professionals development programs, thousands $, 1,055 0,502Level of staff turnover, %, 5,922 2,846Annual average increase rate of percentage of area remediated, %, -0,092 0,116Annual Average increase rate of social investments, % 0,037 0,136

Stakeholder groups
Indicators TNK-BP Gazprom neft
Rosneft Lukoil Tatneft Surgutneftegaz
Bashneft
Market average level
Shareholders Dividends per share, $, 0,07 0,15 0,07 1,61 0,21 0,04 1,71 0,55Share price, $, 1,95 5,42 8,34 56,09 4,62 0,88 24,50 14,54Dividends nonpayment accidents, un. 0,40 0,00 0,00 0,00 0,00 0,00 0,00 0,06Specific risk rate of emitter, 2,00 0,80 0,00 0,50 1,00 2,50 0,00 0,97Beta level of shares 1,75 1,25 1,00 1,00 1,25 1,00 2,00 1,32Group index 0,33 0,73 0,68 2,51 0,68 0,46 1,81 1,03Annual average increase rate of dividends, %, -28,80% 6,05% 15,83% 8,38% 62,66% 5,64% 109,69% 25,6%Annual average increase rate of company capitalization, % -8,06% 9,72% 4,63% -1,42% 8,61% -4,99% 32,29% 5,8%Annual average increase rate of main indicators of benefits, % -18,43% 7,88% 10,23% 3,48% 35,63% 0,33% 70,99% 15,7%
Management Level of top-management salary and compensation, thousands $, 287,32 103,40 170,00 108,00 39,20 4,53 15,00 103,92Average tenure, year, 3,90 2,48 4,45 7,90 6,80 9,50 6,00 5,86Group index 1,72 0,71 1,20 1,19 0,77 0,83 0,58 1,00Annual average increase rate of compensation level, %, 10,59% 5,73% 6,25% 10,88% -6,14% -22,28% 7,14% 1,74%Annual average increase rate of main indicators of benefits, % 10,59% 5,73% 6,25% 10,88% -6,14% -22,28% 7,14% 1,74%
Employees Level of salary, thousands $ per month, 1,84 1,46 1,79 2,03 0,89 2,03 1,40 1,63Social benefits, thousands $ per year, 0,70 1,00 0,75 0,25 0,34 0,61 0,11 0,54Duration of employees training programs, thousands of man-hours 340,00 150,00 100,00 150,00 n n n 185,00Level of staff turnover, %, 9,50 3,00 8,80 5,57 4,37 n 3,80 5,84Number of victims of accidents, people, 78,00 n 70,00 54,00 7,00 n n 52,25Average frequency of accidents, units per mln of man-hours 3,23 0,96 0,29 1,39 n n n 1,47Group index 1,00 1,41 1,57 0,93 2,49 1,19 0,87 1,35Annual average increase rate of salary, %, 4,10% 3,23% 26,70% 26,75% -5,32% 6,84% 7,69% 10,00%Annual average increase rate of social benefits, % -3,61% 30,19% 14,47% 29,10% 0,00% 10,91% 4,76% 12,26%Annual average increase rate of main indicators of benefits, % 0,25% 16,71% 20,59% 27,92% -2,66% 8,88% 6,23% 11,13%
Appendix A: calculation of TNK-BP model

Appendix A: calculation of TNK-BP model
Stakeholder groups
Indicators TNK-BP Gazprom neft
Rosneft Lukoil Tatneft Surgutneftegaz
Bashneft
Market average level
SuppliersPercentage of the cost of procurement, %, 26,84 82,10 80,15 63,00 4,36 11,35 3,56 38,77
Percentage of local suppliers, % 85,00 100,00 91,00 92,00 30,00 50,00 90,00 76,86
Group index 0,90 1,71 1,63 1,41 0,25 0,47 0,63 1,00
Annual average increase rate of procurement, % 78,07% -5,88% -3,31% 1,61% 22,82% 42,84% -0,49% 19,38%
Annual average increase rate of main indicators of benefits, % 78,07% -5,88% -3,31% 1,61% 22,82% 42,84% -0,49% 19,38%
ConsumersLight oil product yield, %, 53,50 62,00 57,30 50,10 40,60 40,20 60,40 52,01
Deep of oil refining, %, n 75,50 64,60 74,80 90,00 66,60 83,40 75,82
Saturation coverage ratio of retail stations. 8,80 0,70 8,17 5,59 0,92 n n 4,84Optimality of distances ratio between retail stations. 4,07 0,63 4,03 3,23 1,00 n n 2,59
Average price for oil on internal market, $/bbl, 29,40 38,48 35,00 35,00 n n n 34,47Average price for gasoline on internal market, $/tn 654,07 735,30 814,00 794,90 717,50 853,60 775,00 763,48
Group index 1,13 0,75 1,19 1,05 0,72 0,83 1,08 0,96
Annual average decrease rate of main production price, %, -4,46% 18,48% -3,38% 5,81% 3,55% -0,98% 1,30% 2,90%Annual average decrease rate of deep of oil refining, % n 3,42% -0,69% 0,44% 1,12% 4,06% 8,31% 2,78%
Annual average increase rate of main indicators of benefits, % -4,46% 10,95% -2,04% 3,13% 2,33% 1,54% 4,81% 2,32%

Appendix A: calculation of TNK-BP modelStakeholder groups
Indicators TNK-BP Gazprom neft
Rosneft Lukoil Tatneft Surgutneftegaz
Bashneft
Market average level
Government
Reserves replacement ratio (by SEC-LOF), %, 143,20 265,00 167,50 695,50 279,00 n n 310,04Percentage of new licenses for exploration and development in the total number of licenses, %, 4,27 1,52 0,56 2,18 4,42 11,41 n 4,06Percentage of exploration costs in total costs, %, 20,8% 57,5% n 55,3% 113,5% n n 61,7%Percentage of tax payment in total costs, %, 23,25 19,20 41,99 13,14 49,30 4,97 69,23 31,58Percentage of organic investment in total costs, %, 14,46 12,15 10,66 10,22 1,10 31,65 5,60 12,26Level of APG utilization, %, 84,40 48,10 67,00 76,00 93,70 96,90 85,70 78,83Saving energy, %, n -5,90 3,87 10,00 13,00 n 9,50 6,09Investments on environmental protection, mln. $, 94,07 62,90 373,30 419,00 130,00 17,00 4,30 157,22Waste utilization, thousands of ton, 210,00 247,00 779,90 251,20 30,00 465,90 22,00 286,57Light oil product yield, % 53,50 62,00 57,30 50,10 40,60 40,20 60,40 52,01Total greenhouse emissions, thousands of ton, 955,00 202,00 944,80 813,70 80,70 217,40 n 535,60Group index 0,78 0,77 1,11 1,15 1,56 1,47 0,94 1,11Annual average decrease rate of tax payment, %, -16,97% -8,60% -25,45% 18,17% 0,47% 56,71% 1,25% 3,66%Annual average decrease rate of APG utilization, %, 2,83% 13,25% 5,41% 1,72% -0,95% 1,37% 2,02% 3,67%Annual average decrease rate of saving energy, % n n -12,05% -16,67% 160,52% n 18,75% 37,64%Annual average increase rate of main indicators of benefits, % -7,07% 2,33% -10,70% 1,08% 53,35% 29,04% 7,34% 10,77%
Regions Percentage of area remediated, %, 5,29 1,28 11,30 11,82 3,43 26,11 n 9,87Social investments, mln.$, 40,00 28,11 526,80 277,10 92,00 39,70 39,70 149,06Investment in young professionals development programs, thousands $, 0,70 n 1,41 n n n n 1,06Level of staff turnover, %, 10,00 3,00 8,80 5,57 4,37 н 3,80 5,92Group index 0,51 0,76 1,67 1,37 0,77 1,46 0,91 1,07Annual average increase rate of percentage of area remediated, %, -20,60% -20,79% 6,30% -0,45% -16,59% -3,18% n -9,22%Annual Average increase rate of social investments, % -18,35% 8,12% -4,82% 24,89% -1,85% 7,30% 10,28% 3,65%Annual average increase rate of main indicators of benefits, % -19,48% -6,34% 0,74% 12,22% -9,22% 2,06% 10,28% -1,39%
Index of balancing stakeholder interests 0,87 0,98 1,29 1,37 1,04 0,96 0,98 1,07Annual average increase rate of main indicators of benefits, % 5,64% 4,48% 3,11% 8,62% 13,73% 8,91% 15,18% 8,53%