Embed Size (px)
Citation preview
Visit us at www.sharekhan.com August 01, 2012
For Private Circulation only
Sharekhan Ltd, Regd Add: 10th Floor, Beta Building, Lodha iThink Techno Campus, Off. JVLR, Opp. Kanjurmarg Railway
Station, Kanjurmarg (East), Mumbai – 400 042, Maharashtra. Tel: 022 - 61150000. BSE Cash-INB011073351; F&O-
INF011073351; NSE – INB/INF231073330; CD - INE231073330; MCX Stock Exchange: CD - INE261073330 DP: NSDL-IN-DP-NSDL-
233-2003; CDSL-IN-DP-CDSL-271-2004; PMS INP000000662; Mutual Fund: ARN 20669. Sharekhan Commodities Pvt. Ltd.: MCX-
10080; (MCX/TCM/CORP/0425); NCDEX -00132; (NCDEX/TCM/CORP/0142)
Index
� Stock Update >> Bajaj Corp
� Stock Update >> GlaxoSmithKline Consumer Healthcare
� Stock Update >> Ipca Laboratories
� Stock Update >> Greaves Cotton
� Stock Update >> Jaiprakash Associates
� Stock Update >> IDBI Bank
� Sector Update >> Automobiles

2Sharekhan Home NextAugust 01, 2012
Company details
Price chart
Shareholding pattern
Price performance
(%) 1m 3m 6m 12m
Absolute 19.8 13.9 43.3 21.6
Relative 20.8 13.1 41.2 26.2
to Sensex
Bajaj Corp Ugly Duckling
Stock Update
Q1FY2013 results: First-cut analysis Hold; CMP: Rs150
Price target: Under review
Market cap: Rs2,212 cr
52 week high/low: Rs153/119
NSE volume: 97,271(no. of shares)
BSE code: 533229
NSE code: BAJAJCORP
Sharekhan code: BAJAJCORP
Free float: 2.2 cr(no. of shares)
Result highlights
� Bajaj Corp’s Q1FY2013 results are ahead of our expectation largely on account
of higher than expected operating margins during the quarter. The ad-spends
as a percentage to sales stood lower than our expectation, resulting in a 322
basis points year on year (YoY) increase in the operating margins to 28.2%.
� The net sales grew by 29.6% YoY to Rs138.2 crore, which is exactly in-line with
our expectation of Rs137.9 crore. The sales volume growth during the quarter
stood at ~22%.
� The gross margins improved by 275 basis points YoY and 251 basis points quarter
on quarter (QoQ) to 55.7% in Q1FY2013 (ahead of our expectation of 54.2%).
This gives us an indication that the key input prices have remained stable on a
Y-o-Y basis. The price increase of ~9% in the Bajaj Almond Drops hair oil must
have helped in improving the gross margins on a Q-o-Q as well as Y-o-Y basis.
� The ad-spends as a percentage to sales stood at 7.1% in Q1FY2013 as against
our expectation of 15.0% for the quarter. Hence the operating margins stood at
28.2%, ahead of our expectation of 24.2%. The operating margins improved
sequentially by 470 basis points.
� The operating profit grew by 46.3% YoY to Rs38.9 crore and the profit after tax
(PAT) grew by 32.4% YoY to Rs37.6 crore (ahead of our expectation of Rs34.1
crore).
� Q1FY2013 was yet another quarter of strong performance by Bajaj Corp with
an around 30% growth in revenues and an above 30% growth in the PAT. However
Results (Rs cr)
Particulars Q1FY13 Q1FY12 YoY % Q4FY12 QoQ %
Net sales 138.0 106.6 29.5 146.6 -5.8
Other operating income 0.2 0.1 82.3 0.4 -57.8
Total income from operations 138.2 106.7 29.6 147.0 -6.0
Total expenditure 99.3 80.1 24.0 112.6 -11.8
Operating profit 38.9 26.6 46.3 34.5 12.9
Other income 9.0 9.5 -5.6 10.0 -10.3
Interest expenses 0.0 0.0 -30.5 0.0 -21.0
Depreciation 0.8 0.5 64.5 0.8 -3.0
Profit before tax 47.1 35.6 32.2 43.7 7.8
Tax 9.5 7.2 31.5 9.1 4.1
Reported PAT 37.6 28.4 32.4 34.6 8.8
Adjusted EPS (Rs) 2.6 1.9 32.4 2.3 8.8
Gross margins (%) 55.7 52.9 275 bps 53.2 251 bps
OPM (%) 28.2 24.9 322 bps 23.5 470 bps
investor’s eye stock update
Promoters84.8%
FIIs9.5%
Others5.3%
Domestic institutions
0.5%
90
105
120
135
150
165
Aug
-11
Oct
-11
Dec
-11
Feb
-12
Apr
-12
Jun-
12
Aug
-12
3Sharekhan August 01, 2012 Home Next
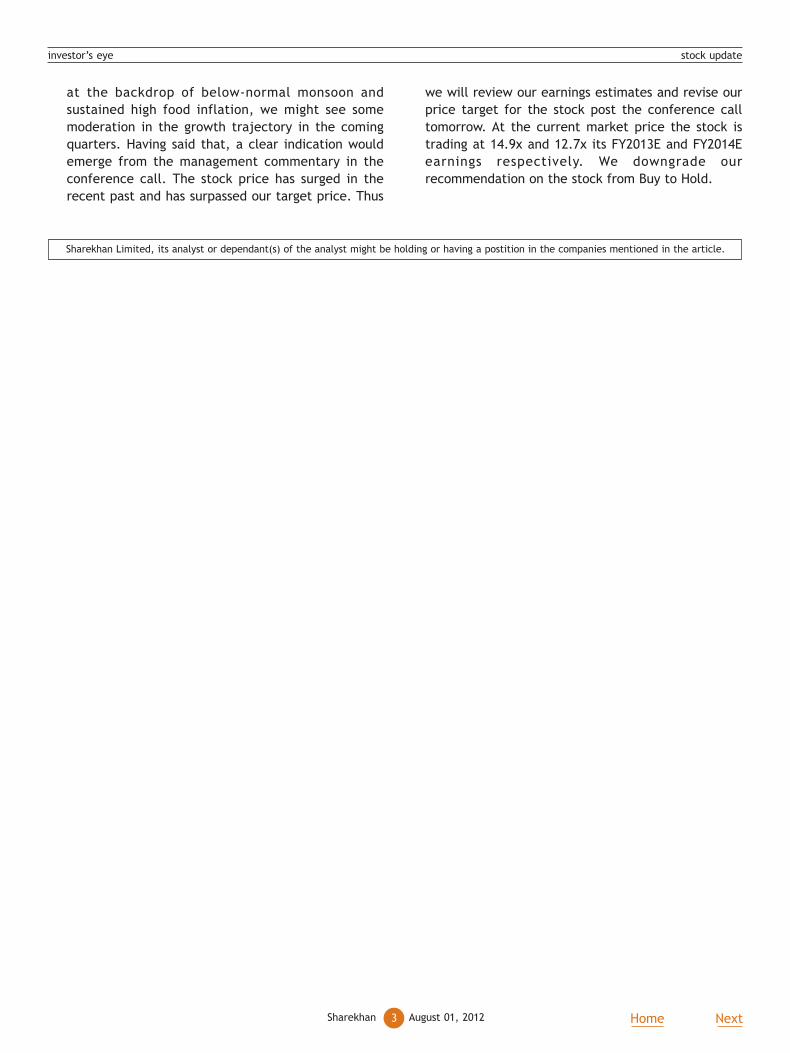
at the backdrop of below-normal monsoon and
sustained high food inflation, we might see some
moderation in the growth trajectory in the coming
quarters. Having said that, a clear indication would
emerge from the management commentary in the
conference call. The stock price has surged in the
recent past and has surpassed our target price. Thus
we will review our earnings estimates and revise our
price target for the stock post the conference call
tomorrow. At the current market price the stock is
trading at 14.9x and 12.7x its FY2013E and FY2014E
earnings respectively. We downgrade our
recommendation on the stock from Buy to Hold.
Sharekhan Limited, its analyst or dependant(s) of the analyst might be holding or having a postition in the companies mentioned in the article.
investor’s eye stock update
4Sharekhan Home NextAugust 01, 2012
Promoters43%
FIIs14%
Domestic institutions
18%
Others25%
Company details
Price chart
Shareholding pattern
Price performance
(%) 1m 3m 6m 12m
Absolute -3.7 -5.7 4.1 10.9
Relative -2.9 -6.3 2.6 15.2
to Sensex
GlaxoSmithKline Consumer Healthcare Evergreen
Stock Update
Results ahead of expectation Buy; CMP: Rs2,668
Price target: Rs3,000
Market cap: Rs11,232 cr
52 week high/low: Rs2940/2179
NSE volume: 4.2 lakh(no. of shares)
BSE code: 500676
NSE code: GSKCONS
Sharekhan code: GSKCONS
Free float: 2.4 cr(no. of shares)
Result highlights
� Results ahead of expectation: Glaxo Smithkline Consumer Healthcare (GSK
Consumer)’s Q2CY2012 results have come ahead of our expectation largely on
account of higher than anticipated business auxiliary income and treasury income
during the quarter. The domestic revenue growth sustained at 15% with volume
growth standing at 7%. Horlicks’ volume growth stood at 7% while Boost’s volume
growth improved to 11%. The highlight of the quarter was the 360 basis points
year on year (YoY) improvement in the gross margins to 63.0%.
� Q2CY2012 performance snapshot: GSK Consumer’s reported net sales grew
by 11.7% YoY to Rs729.7 crore (our expectation was of Rs773.3 crore) driven by
a 3.2% volume growth and an approximately 9% YoY price-led growth in
Q2CY2012. The revenue growth was impacted by a 10% YoY decline in the export
sales and flat canteen sales department (CSD) sales. The domestic business’
revenues grew by 15.5% YoY in Q2CY2012, driven by a mix of 7% volume growth
and price-led growth of 8%. The gross margins improved by 360 basis points YoY
to 63.0%. The improvement in the gross margins can be attributed to an improved
revenue mix due to lower exports & CSD sales, softening in the prices of key
inputs and the price increases undertaken in the portfolio. However a 247 basis
points YoY increase in the other expenses resulted in a flat operating profit
margin (OPM) to 15.2% in Q2CY2012. Hence the operating profit grew by 12.3%
YoY (in line with the top line growth) to Rs110.7 crore. The business auxiliary
income grew by 40% YoY to Rs28.7 crore and the other income grew by 84.0%
YoY to Rs28.5 crore during the quarter. This led to a strong 29.3% YoY growth in
Results (Rs cr)
Particulars Q2CY12 Q2CY11 YoY % Q1CY12 QoQ %
Net sales 729.7 653.4 11.7 813.0 -10.2
Other operating income 28.7 20.5 40.1 23.4 22.7
Total operating income 758.4 673.9 12.5 836.4 -9.3
Total expenditure 619.1 554.8 11.6 651.4 -5.0
Operating profit 110.7 98.5 12.3 161.7 -31.5
Other income 28.5 15.5 84.3 24.5 16.6
EBIDTA 167.9 134.5 24.8 209.5 -19.9
Interest 0.8 0.9 -7.8 1.2 -29.7
PBDT 167.1 133.6 25.1 208.3 -19.8
Depreciation 8.6 11.3 -24.4 11.9 -28.3
PBT 158.5 122.3 29.6 196.4 -19.3
Tax 51.9 39.8 30.3 64.5 -19.4
Reported PAT 106.6 82.5 29.3 132.0 -19.2
Adjusted EPS (Rs.) 25 20 29.3 31 -19.2
GPM (%) 63.0 59.4 360bps 59.4 360bps
OPM% (excl. other operating inc.) 15.2 15.1 19.9
investor’s eye stock update
2200
2350
2500
2650
2800
2950
Aug
-11
Oct
-11
Dec
-11
Feb
-12
Apr
-12
Jun-
12
Aug
-12
5Sharekhan August 01, 2012 Home Next
investor’s eye stock update
the reported profit after tax (PAT) to Rs106.5 crore
(ahead of our expectation of Rs96 crore) during the
quarter.
� Outlook and valuation: We have fine-tuned our
earnings estimates for FY2013 and FY2014 to factor in
for a lower than anticipated revenue growth,
substantial improvement in the gross margin and higher
than anticipated other income during the quarter.
However any disruption in the volume growth
momentum and any significant surge in the key input
prices in the coming quarter would act as a key risk to
our earnings estimates.
We expect GSK Consumer’s top line and bottom line
to grow at a compound annual growth rate (CAGR) of
16.6% and 19.2% respectively over CY2011-13. We like
GSK Consumer on the back of its leadership position in
the malted food drinks (MFD) segment, strong pricing
power and strong cash generation ability. Hence we
maintain our Buy recommendation on the stock with a
price target of Rs3,000. At the current market price
the stock trades at 25.8x its CY2012E earnings per share
(EPS) of Rs103.5 and 22.2x its CY2013E EPS of Rs120.1.
Business performance
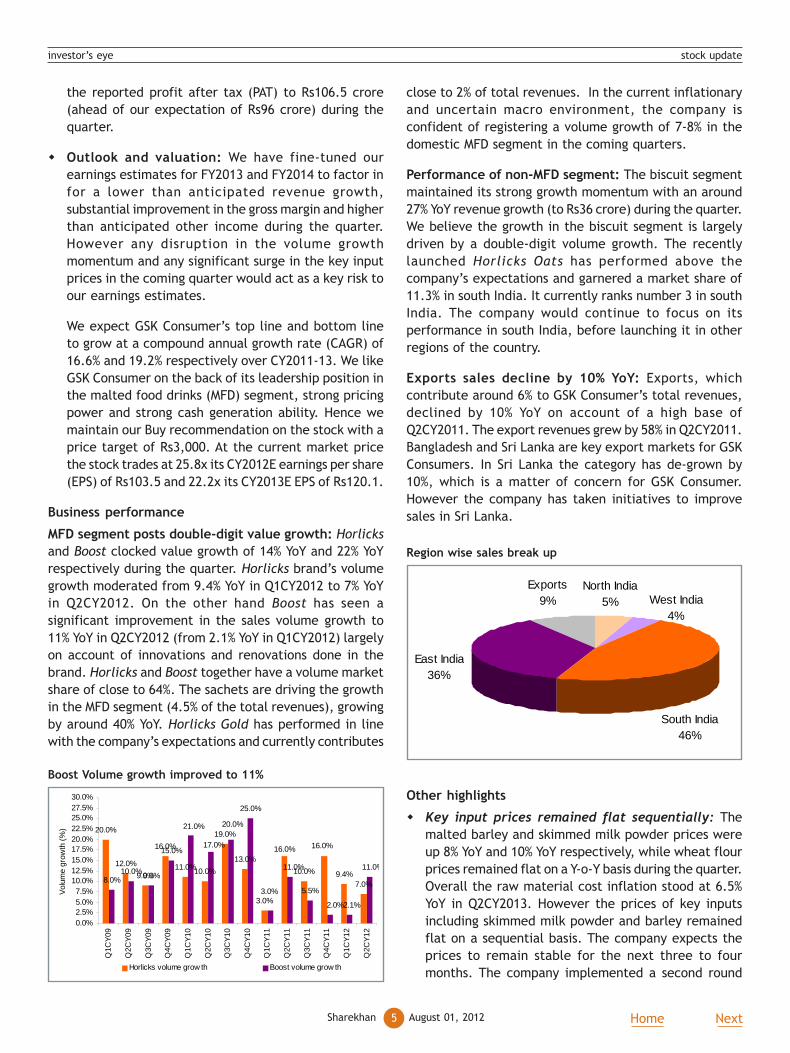
MFD segment posts double-digit value growth: Horlicks
and Boost clocked value growth of 14% YoY and 22% YoY
respectively during the quarter. Horlicks brand’s volume
growth moderated from 9.4% YoY in Q1CY2012 to 7% YoY
in Q2CY2012. On the other hand Boost has seen a
significant improvement in the sales volume growth to
11% YoY in Q2CY2012 (from 2.1% YoY in Q1CY2012) largely
on account of innovations and renovations done in the
brand. Horlicks and Boost together have a volume market
share of close to 64%. The sachets are driving the growth
in the MFD segment (4.5% of the total revenues), growing
by around 40% YoY. Horlicks Gold has performed in line
with the company’s expectations and currently contributes
close to 2% of total revenues. In the current inflationary
and uncertain macro environment, the company is
confident of registering a volume growth of 7-8% in the
domestic MFD segment in the coming quarters.
Performance of non-MFD segment: The biscuit segment
maintained its strong growth momentum with an around
27% YoY revenue growth (to Rs36 crore) during the quarter.
We believe the growth in the biscuit segment is largely
driven by a double-digit volume growth. The recently
launched Horlicks Oats has performed above the
company’s expectations and garnered a market share of
11.3% in south India. It currently ranks number 3 in south
India. The company would continue to focus on its
performance in south India, before launching it in other
regions of the country.
Exports sales decline by 10% YoY: Exports, which
contribute around 6% to GSK Consumer’s total revenues,
declined by 10% YoY on account of a high base of
Q2CY2011. The export revenues grew by 58% in Q2CY2011.
Bangladesh and Sri Lanka are key export markets for GSK
Consumers. In Sri Lanka the category has de-grown by
10%, which is a matter of concern for GSK Consumer.
However the company has taken initiatives to improve
sales in Sri Lanka.
Boost Volume growth improved to 11%
20.0%
12.0%
9.0%
16.0%
11.0%10.0%
19.0%
13.0%
3.0%
10.0% 9.4%7.0%8.0%
10.0%9.0%
15.0%
25.0%
5.5%
16.0% 16.0%
3.0%
17.0%
21.0% 20.0%
11.0%
2.0%
11.0%
2.1%
0.0%2.5%5.0%7.5%
10.0%12.5%15.0%17.5%20.0%22.5%25.0%27.5%30.0%
Q1C
Y09
Q2C
Y09
Q3C
Y09
Q4C
Y09
Q1C
Y10
Q2C
Y10
Q3C
Y10
Q4C
Y10
Q1C
Y11
Q2C
Y11
Q3C
Y11
Q4C
Y11
Q1C
Y12
Q2C
Y12
Vol
ume
grow
th (
%)
Horlicks volume grow th Boost volume grow th
Region wise sales break up
North India5% West India
4%
Exports9%
East India36%
South India46%
Other highlights
� Key input prices remained flat sequentially: The
malted barley and skimmed milk powder prices were
up 8% YoY and 10% YoY respectively, while wheat flour
prices remained flat on a Y-o-Y basis during the quarter.
Overall the raw material cost inflation stood at 6.5%
YoY in Q2CY2013. However the prices of key inputs
including skimmed milk powder and barley remained
flat on a sequential basis. The company expects the
prices to remain stable for the next three to four
months. The company implemented a second round
6Sharekhan Home NextAugust 01, 2012
Sharekhan Limited, its analyst or dependant(s) of the analyst might be holding or having a postition in the companies mentioned in the article.
of price increase of above 5% in July 2012 to mitigate
the impact of increase in excise duty and service tax
rate in the Union Budget 2012-13. We expect the gross
margins to remain stable in the coming quarters unless
there is a significant hike in the key input prices.
� Sustained strong growth in business auxiliary
income: The business auxiliary income continued to
grow strongly during the quarter with a 40.0% YoY rise
to Rs28 crore. The same came on the back of a strong
performance of the newly launched Sensodyne
toothpaste, while the matured brands like Crocin and
Iodex serviced income growth by 10% YoY.
� Capex of Rs120-130 crore for FY2013: The company
is planning to incur a capital expenditure (capex) of
Rs120-130 crore for CY2012 for the expansion of the
capacity. The capex would be funded through internal
accruals.
Outlook and valuation: We have fine-tuned our earnings
estimates for FY2013 and FY2014 to factor in for a lower
than anticipated revenue growth, substantial
improvement in the gross margins and higher than
anticipated other income during the quarter. However
any disruption in the volume growth momentum and any
significant surge in the key input prices in the coming
quarter would act as a key risk to our earnings estimates.
We expect GSK Consumer’s top line and bottom line to
grow at a CAGR of 16.6% and 19.2% respectively over
CY2011-13. We like GSK Consumer on the back of its
leadership position in the MFD segment, strong pricing
power and strong cash generation ability. Hence we
maintain our Buy recommendation on the stock with a
price target of Rs3,000. At the current market price the
stock trades at 25.8x its CY2012E EPS of Rs103.5 and 22.2x
its CY2013E EPS of Rs120.1.
Valuation
Particulars CY10 CY11 CY12E CY13E
Revenues (Rs cr) 2306.1 2685.5 3119.8 3651.4
Operating margins (%) 16.3 15.8 16.6 16.7
PAT (Rs cr) 299.8 355.2 435.4 505.1
EPS (Rs) 71.3 84.5 103.5 120.1
P/E (x) 37.4 31.6 25.8 22.2
EV/sales (x) 4.4 3.8 3.2 2.7
EV/EBIDTA (x) 20.7 17.2 13.9 11.6
RoNW (%) 32.2 33.8 34.6 33.5
RoCE (%) 48.7 51.7 52.8 51.1
investor’s eye stock update

7Sharekhan August 01, 2012 Home Next
Company details
Price chart
Shareholding pattern
Price performance
(%) 1m 3m 6m 12m
Absolute 12.1 11.2 35.1 23.4
Relative 13.0 10.5 33.1 28.1
to Sensex
Ipca Laboratories Ugly Duckling
Stock Update
Strong operating performance; target price revised to Rs476 Buy; CMP: Rs409
Price target: Rs476
Market cap: Rs5,046 cr
52 week high/low: Rs410/230
NSE volume: 1.5 lakh(no. of shares)
BSE code: 524494
NSE code: IPCALAB
Sharekhan code: IPCALAB
Free float: 6.8 cr(no. of shares)
Result highlights
� Strong operating performance: Ipca Laboratories (Ipca)’s net sales jumped by
19.7% year on year (YoY) to Rs630.3 crore in Q1FY2013, mainly driven by the
formulation business in the domestic market, which grew by 18.6% YoY to Rs224.2
crore and the active pharmaceutical ingredient (API) business which grew by
39% YoY to Rs181.6 crore. The operating profit margin (OPM) got expanded by
460 basis points YoY to 21.8%. However, the net profit after tax (PAT) declined
by 30.4% YoY to Rs43 crore, mainly due to a provision for foreign exchange
(forex) loss of Rs58.9 crore. Excluding the forex loss, the net profit would rise
by an impressive 93% YoY to Rs101.8 crore.
� 87% of forex loss is unrealised and adjustable: Out of Rs58.9 crore provided
during the quarter Rs51.2 crore is unrealised and therefore subject to
adjustments in subsequent quarters. Moreover, only Rs20.8 crore of the
unrealised forex loss belongs to the trading account and the remaining relates
to foreign loans, which are payable over a long period of time. However, it has
realised a forex loss of Rs7.8 crore during the quarter.
� We fine-tune estimates and revise target price to Rs476; maintain Buy: We
marginally fine tune our earnings estimate for FY2013 and FY2014 to reduce it
by nearly 2% (mainly on account of higher fixed cost and higher than estimated
capital expenditure [capex] guidance). We also roll-over our target multiples
to FY2014E earnings, which results in the target price getting increased by 9%
to Rs476 (implies 13x FY2014E earnings).
Results (Rs cr)
Particulars Q1FY13 Q1FY12 YoY % Q4FY12 QoQ %
Net sales 630.3 526.4 19.7 553.1 13.9
Expenditure 492.6 435.6 13.1 443.7 11.0
Operating profit 137.6 90.8 51.6 109.4 25.8
Other income 7.1 6.2 14.6 11.7 -39.2
EBIDTA 144.8 97.0 49.3 121.1 19.5
Interest 9.5 7.4 28.3 11.1 -14.5
Depreciation 19.9 15.4 29.3 14.2 40.3
PBT 115.3 74.2 55.5 95.8 20.4
Tax 13.5 21.5 -37.3 18.6 -27.3
Adjusted PAT (ex-forex) 101.8 52.6 93.4 77.2 31.9
Forex loss/(gains) 58.9 -9.1 -746.7 -5.1 -1244.9
Net profit (reported) 43.0 61.7 -30.4 82.4 -47.8
EPS (Rs) 8.1 4.2 92.8 6.1 31.9
OPM (%) 21.8 17.2 460bps 19.8 205.8bps
EBIDTA margin (%) 23.0 18.4 455bps 21.9 107.1bps
Net profit margin (%) 16.2 10.0 616bps 14.0 219.4bps
Tax rate (%) 23.9 29.0 -512bps 19.4 451.8bps
investor’s eye stock update
Institutions22%
Foreign10%
Promoters46%
Public and others12%
Non-promoter corporate
10%
220
260
300
340
380
420
Aug
-11
Oct
-11
Dec
-11
Feb
-12
Apr
-12
Jun-
12
Aug
-12
8Sharekhan Home NextAugust 01, 2012
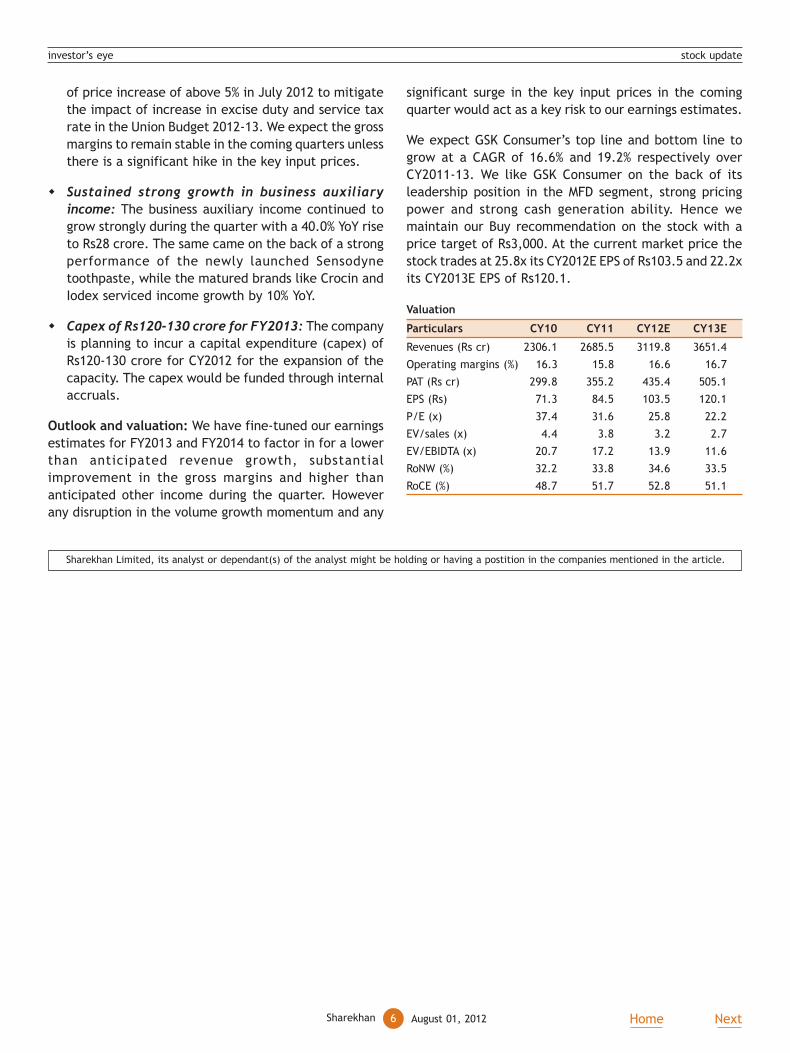
Impressive pick up in domestic formulation market
The revenue from the domestic market witnessed a strong
rise of 18.6% YoY to Rs224.2 crore. The growth in the
domestic market has been better than that in the six
sequential previous quarters when the company witnessed
the impact of sales force restructuring and addition of
new field force. The growth during the quarter surpasses
the three years’ historical average of 15.5% and it is also
better than industry average of 15-16%. The growth has
been supported by across therapies with the respiratory
and anti-infectives segments contributing better than
others. We believe the trend would continue and the
company may achieve an 18% growth in revenue from the
domestic market during FY2013.
Revenue break-up
Particulars Q1FY13 Q1FY12 YoY % Q4FY12 QoQ %
India 263.5 229.7 14.7 181.9 44.9
Formulations 224.2 189.0 18.6 147.6 51.9
API 39.3 40.7 -3.3 34.3 14.7
International 366.7 296.7 23.6 371.1 -1.2
Formulations 224.5 206.6 8.7 239.2 -6.1
Tender business 60.0 53.3 12.5 63.0 -4.8
Other generic business 164.5 153.3 7.3 176.2 -6.6
API 142.2 90.1 57.8 131.9 7.8
Total sales 630.3 526.4 19.7 553.0 14.0
Total API 181.6 130.8 38.8 166.2 9.2
Total Formulation 448.7 395.6 13.4 386.8 16.0
Implementation of ‘track and trace’ system temporarily
hurts export of formulations; we expect a rebound in
H2FY2013
The revenue from export of formulations during the
quarter witnessed a modest growth of 7.3% YoY to Rs164.5
crore despite a favorable currency. A slower growth during
the quarter was primarily due to the implementation of
the ‘track and trace’ system mandated by the government
of India. The government has announced that all
pharmaceutical export shipments must have the ‘track
Growth in domestic formulations business
and trace’ feature to avoid any spurious Indian
pharmaceutical products getting pushed into the market.
This switch-over process, which requires all inventories
to be recorded in a specially made software, resulted in
temporary disruptions in supplies to export markets,
especially to Europe and the CIS region (Commonwealth
of Independent States region). However, with this being
a temporary phenomenon, we expect the exports growth
to bounce back in H2FY2013. We expect the formulation
exports business to record a near 29% rise in FY2013 and
16% rise in FY2014.
API business jumps on consolidation of Tonira and off-
take in international markets: During Q1FY2013 the
revenue from the active pharmaceutical ingredient (API)
business jumped by 38.8% to Rs181.6 crore, mainly driven
by exports which jumped by 57.8% YoY to Rs142.2 crore.
The exports of API comprise of Rs14 crore of sale from
the newly merged Tonira Pharma (Tonira). Tonira exports
APIs mainly to Japan and it is expected to contribute near
to Rs50 crore to the company’s revenues in FY2013.
Excluding Tonira Pharma, the revenue from API exports
jumped by 42.3% YoY, which is yet impressive. However,
the revenue from domestic sales of APIs declined by 3.3%
YoY to Rs39.3 crore. We expect API exports to record a
6.6% rise in revenues in FY2013 and 11.4% rise in FY2014.
Healthy rise in margin; reversal of trend: A better
product mix helped the company to record a healthy rise
in the operating margin by 460 basis points YoY to 21.8%.
This is a reversal of trend as Q1 records generally lower
margin due to seasonality involved in some products. Even
on a quarter on quarter (QoQ) basis, the margin expanded
by 206 basis points. A strong revenue from the domestic
market, backward integration and synergies from Tonira
are some of the factors which contributed towards the
expansion in margins. We expect this level of margin to
sustain even in the subsequent quarters. We forecast an
operating margin of 21.5% and 22.5% for FY2013 and
FY2014 respectively.
Trend in operating profit margin
investor’s eye stock update
20.2
23.9
22.7
16.9
20.0
23.722.8
18.7
17.0
22.8
17.2
24.7
23.0
19.8
21.8
19.6
19.5
16.017.018.019.020.021.022.023.024.025.026.0
Q1F
Y09
Q2F
Y09
Q3F
Y09
Q4F
Y09
Q1F
Y10
Q2F
Y10
Q3F
Y10
Q4F
Y10
Q1F
Y11
Q2F
Y11
Q3F
Y11
Q4F
Y11
Q1F
Y12
Q2F
Y12
Q3F
Y12
Q4F
Y12
Q1F
Y13
OPM %
3.5
21.6
1.6
14.8
24.5
14.2
37.5
29.6
16.1
29.4
12.4
3.35.7 6.4
13.2
11.7
18.6
15.5
0.0
5.0
10.0
15.0
20.0
25.0
30.0
35.0
40.0
Q1F
Y09
Q2F
Y09
Q3F
Y09
Q4F
Y09
Q1F
Y10
Q2F
Y10
Q3F
Y10
Q4F
Y10
Q1F
Y11
Q2F
Y11
Q3F
Y11
Q4F
Y11
Q1F
Y12
Q2F
Y12
Q3F
Y12
Q4F
Y12
Q1F
Y13
%
YoY % Average growth (%)
9Sharekhan August 01, 2012 Home Next
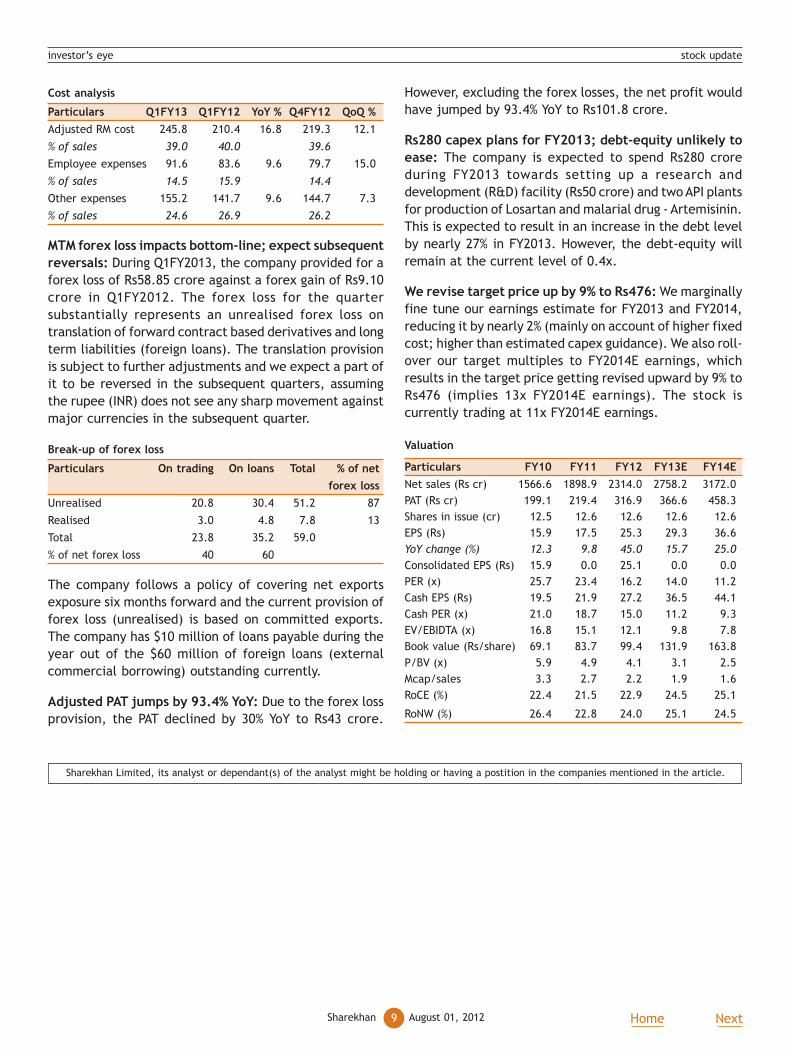
Cost analysis
Particulars Q1FY13 Q1FY12 YoY % Q4FY12 QoQ %
Adjusted RM cost 245.8 210.4 16.8 219.3 12.1
% of sales 39.0 40.0 39.6
Employee expenses 91.6 83.6 9.6 79.7 15.0
% of sales 14.5 15.9 14.4
Other expenses 155.2 141.7 9.6 144.7 7.3
% of sales 24.6 26.9 26.2
MTM forex loss impacts bottom-line; expect subsequent
reversals: During Q1FY2013, the company provided for a
forex loss of Rs58.85 crore against a forex gain of Rs9.10
crore in Q1FY2012. The forex loss for the quarter
substantially represents an unrealised forex loss on
translation of forward contract based derivatives and long
term liabilities (foreign loans). The translation provision
is subject to further adjustments and we expect a part of
it to be reversed in the subsequent quarters, assuming
the rupee (INR) does not see any sharp movement against
major currencies in the subsequent quarter.
Break-up of forex loss
Particulars On trading On loans Total % of net
forex loss
Unrealised 20.8 30.4 51.2 87
Realised 3.0 4.8 7.8 13
Total 23.8 35.2 59.0
% of net forex loss 40 60
The company follows a policy of covering net exports
exposure six months forward and the current provision of
forex loss (unrealised) is based on committed exports.
The company has $10 million of loans payable during the
year out of the $60 million of foreign loans (external
commercial borrowing) outstanding currently.
Adjusted PAT jumps by 93.4% YoY: Due to the forex loss
provision, the PAT declined by 30% YoY to Rs43 crore.
However, excluding the forex losses, the net profit would
have jumped by 93.4% YoY to Rs101.8 crore.
Rs280 capex plans for FY2013; debt-equity unlikely to
ease: The company is expected to spend Rs280 crore
during FY2013 towards setting up a research and
development (R&D) facility (Rs50 crore) and two API plants
for production of Losartan and malarial drug - Artemisinin.
This is expected to result in an increase in the debt level
by nearly 27% in FY2013. However, the debt-equity will
remain at the current level of 0.4x.
We revise target price up by 9% to Rs476: We marginally
fine tune our earnings estimate for FY2013 and FY2014,
reducing it by nearly 2% (mainly on account of higher fixed
cost; higher than estimated capex guidance). We also roll-
over our target multiples to FY2014E earnings, which
results in the target price getting revised upward by 9% to
Rs476 (implies 13x FY2014E earnings). The stock is
currently trading at 11x FY2014E earnings.
Valuation
Particulars FY10 FY11 FY12 FY13E FY14E
Net sales (Rs cr) 1566.6 1898.9 2314.0 2758.2 3172.0
PAT (Rs cr) 199.1 219.4 316.9 366.6 458.3
Shares in issue (cr) 12.5 12.6 12.6 12.6 12.6
EPS (Rs) 15.9 17.5 25.3 29.3 36.6
YoY change (%) 12.3 9.8 45.0 15.7 25.0
Consolidated EPS (Rs) 15.9 0.0 25.1 0.0 0.0
PER (x) 25.7 23.4 16.2 14.0 11.2
Cash EPS (Rs) 19.5 21.9 27.2 36.5 44.1
Cash PER (x) 21.0 18.7 15.0 11.2 9.3
EV/EBIDTA (x) 16.8 15.1 12.1 9.8 7.8
Book value (Rs/share) 69.1 83.7 99.4 131.9 163.8
P/BV (x) 5.9 4.9 4.1 3.1 2.5
Mcap/sales 3.3 2.7 2.2 1.9 1.6
RoCE (%) 22.4 21.5 22.9 24.5 25.1
RoNW (%) 26.4 22.8 24.0 25.1 24.5
investor’s eye stock update
Sharekhan Limited, its analyst or dependant(s) of the analyst might be holding or having a postition in the companies mentioned in the article.
10Sharekhan Home NextAugust 01, 2012
Company details
Price chart
Shareholding pattern
Price performance
(%) 1m 3m 6m 12m
Absolute -7.9 -20.7 -24.1 -27.5
Relative -7.1 -21.2 -25.2 -24.7
to Sensex
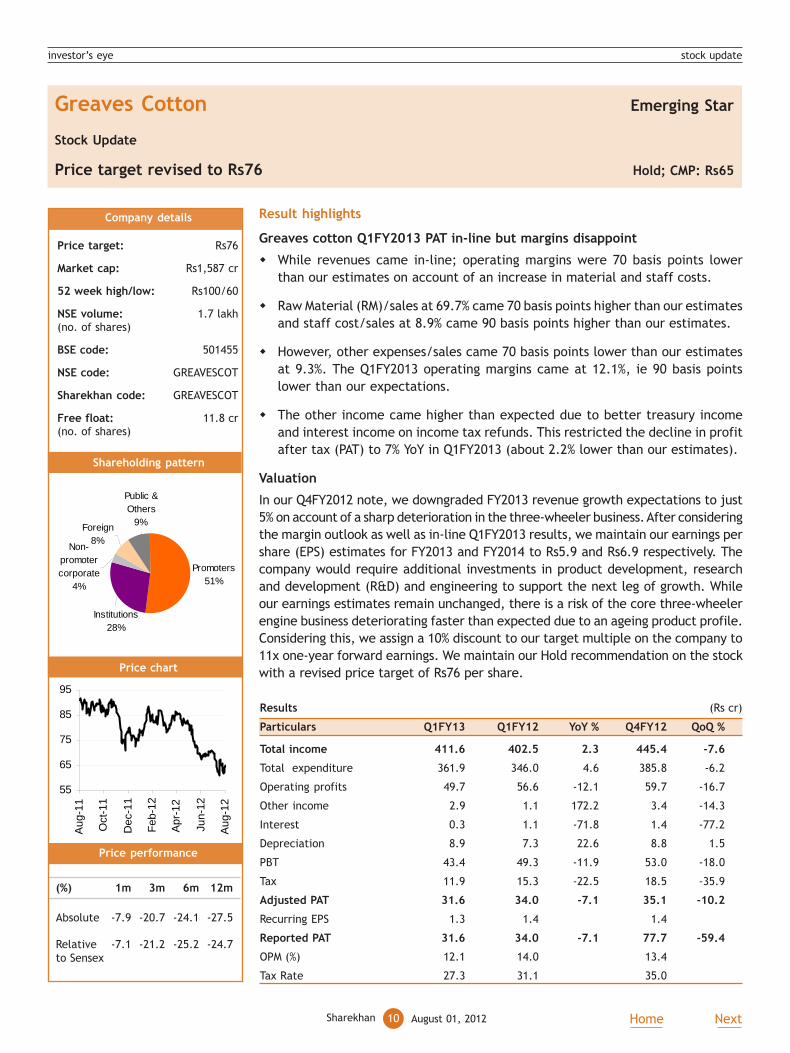
Greaves Cotton Emerging Star
Stock Update
Price target revised to Rs76 Hold; CMP: Rs65
Price target: Rs76
Market cap: Rs1,587 cr
52 week high/low: Rs100/60
NSE volume: 1.7 lakh(no. of shares)
BSE code: 501455
NSE code: GREAVESCOT
Sharekhan code: GREAVESCOT
Free float: 11.8 cr(no. of shares)
Result highlights
Greaves cotton Q1FY2013 PAT in-line but margins disappoint
� While revenues came in-line; operating margins were 70 basis points lower
than our estimates on account of an increase in material and staff costs.
� Raw Material (RM)/sales at 69.7% came 70 basis points higher than our estimates
and staff cost/sales at 8.9% came 90 basis points higher than our estimates.
� However, other expenses/sales came 70 basis points lower than our estimates
at 9.3%. The Q1FY2013 operating margins came at 12.1%, ie 90 basis points
lower than our expectations.
� The other income came higher than expected due to better treasury income
and interest income on income tax refunds. This restricted the decline in profit
after tax (PAT) to 7% YoY in Q1FY2013 (about 2.2% lower than our estimates).
Valuation
In our Q4FY2012 note, we downgraded FY2013 revenue growth expectations to just
5% on account of a sharp deterioration in the three-wheeler business. After considering
the margin outlook as well as in-line Q1FY2013 results, we maintain our earnings per
share (EPS) estimates for FY2013 and FY2014 to Rs5.9 and Rs6.9 respectively. The
company would require additional investments in product development, research
and development (R&D) and engineering to support the next leg of growth. While
our earnings estimates remain unchanged, there is a risk of the core three-wheeler
engine business deteriorating faster than expected due to an ageing product profile.
Considering this, we assign a 10% discount to our target multiple on the company to
11x one-year forward earnings. We maintain our Hold recommendation on the stock
with a revised price target of Rs76 per share.
Results (Rs cr)
Particulars Q1FY13 Q1FY12 YoY % Q4FY12 QoQ %
Total income 411.6 402.5 2.3 445.4 -7.6
Total expenditure 361.9 346.0 4.6 385.8 -6.2
Operating profits 49.7 56.6 -12.1 59.7 -16.7
Other income 2.9 1.1 172.2 3.4 -14.3
Interest 0.3 1.1 -71.8 1.4 -77.2
Depreciation 8.9 7.3 22.6 8.8 1.5
PBT 43.4 49.3 -11.9 53.0 -18.0
Tax 11.9 15.3 -22.5 18.5 -35.9
Adjusted PAT 31.6 34.0 -7.1 35.1 -10.2
Recurring EPS 1.3 1.4 1.4
Reported PAT 31.6 34.0 -7.1 77.7 -59.4
OPM (%) 12.1 14.0 13.4
Tax Rate 27.3 31.1 35.0
investor’s eye stock update
Promoters51%
Foreign8%
Public & Others
9%
Non-promoter corporate
4%
Institutions28%
55
65
75
85
95
Aug
-11
Oct
-11
Dec
-11
Feb
-12
Apr
-12
Jun-
12
Aug
-12

11Sharekhan August 01, 2012 Home Next
Segmental comparison of business segments (Rs cr)
Particulars Q1FY13 Q1FY12 YoY % Q4FY12 QoQ %
Engine division
Revenues 362.3 337.9 7.2 394.7 -8.2
PBIT 58.4 58.1 0.4 73.3 -20.4
PBIT margins (%) 16.1 17.2 -110bps 18.6 -250bps
Construction equipment
Revenues 35.5 48.6 -27.0 38.3 -7.3%
PBIT -1.6 0.1 NA -4.2 NA
PBIT margins (%) -4.6 0.2 -480bps -10.9 630bps
Others
Revenues 14.1 16.0 -11.9 12.6 11.8
PBIT 1.1 2.8 -62.2 -0.2 NA
PBIT margins (%) 7.6 17.7 -1010bps -1.3 890bps
Engine business: The revenues in Q1FY2013 grew by 7.2%
YoY in spite of flat three-wheeler demand. The slower
growth in three-wheelers was offset by supplies to Tata
Magic Iris and Ace Zip. For the quarter, the revenue
contribution from spare parts (reported under engine
sales) increased to 24% against 21% a year ago, reflecting
a strong growth. In Q1FY2013, the company sold 90,000
automotive engines, 28,000 agri engines and around 2,000
gensets.
Infrastructure equipment business: The revenues in
Q1FY2013 declined sharply by 27% YoY due to sluggish
demand. The possibility of a turnaround looks bleak in
the near term.
Key take-aways from the conference call
Stagnation witnessed for three-wheeler engines but…
The engine volumes in Q1FY2013 remained flat Y-o-Y for
both, automotive and agri segments, but the segment
grew in value terms by 7% YoY. The demand for three-
wheelers declined sharply, thereby impacting the offtake
of three-wheeler engines. But the same got offset by four-
wheeler engines. Industrial engines grew by 10% YoY while
genset engines grew in single digits during Q1FY2013.
…revenue diversification in four-wheelers and non-auto
application supported growth
Tata Motors’ engine offtake is consolidating around 4,000-
5,000 units/per month (13-14,000 engines dispatched in
Q1FY2013). The company is a 100% supplier to the Magic
Iris and Ace Zip vehicles of Tata Motors. Further a ramp
up from Tata Motors is expected from Q3FY2013.
Non-auto applications from tractors, pumps sets, marine
engines and spare parts sales offset the decline in the
three-wheeler engine market. The contribution by spares,
investor’s eye stock update
reported under the automotive engine segment has
improved to 24% in Q1FY2013 against 21% a year ago.
Industrial engines are a relatively new opportunity for
the company where it is currently utilising engines as
captive for construction equipment segment (for transit
mixers). Several third party customers are taking trials
and some breakthrough is expected in the medium term.
Focus is also being laid on large agri equipments such as
harvesters, reapers and on other equipment related to
fire fighting, marine, drilling etc. The farm equipment
demand is expected to remain flat due to the deficit
monsoon which is likely to impact cultivation. Diesel pump
sets, electrical pump sets and the tiller market are other
niche markets.
In the infrastructure segment, the road sector has shown
signs of improvement while the concrete segment
significantly moderated. The break-even in the
infrastructure segment is uncertain in the near term.
Q1FY2013 seen as worst for operating margins; expect
improvement in H2FY2013
The management expects margins to benefit from the
operating leverage in H2FY2013 when volumes revive. The
Q1FY2013 operating margins at 12.1% are seen as worst
for the year. Also, several one-off activities in the past
few quarters that elevated other expenses are expected
to moderate going forward. The company had a large
spend in Q4FY2012 on brand transformation.
The engine business’ earnings before interest and tax
(EBIT) margins were the lowest in the last few quarters.
Margins may improve from Q3FY2013 on a better mix as
well as demand revival in key segments.
Attracting talent to prepare organisation for next level
of growth
The company indicated towards higher employee expenses
for FY2013 due to planned investments in R&D, marketing
and engineering as the management prepares the
organisation for the next level of growth. The ball park
figure for employee expenses per quarter is in the range
of Rs35-36 crore.
New avenues of growth: In talks with Piaggio for small
LCV but nothing concluded
The company is in discussions with Piaggio for engine
supply for a sub-1 tonne light commercial vehicle (LCV).
However nothing concrete has been concluded. The
company recently concluded a seven year engine supply
12Sharekhan Home NextAugust 01, 2012
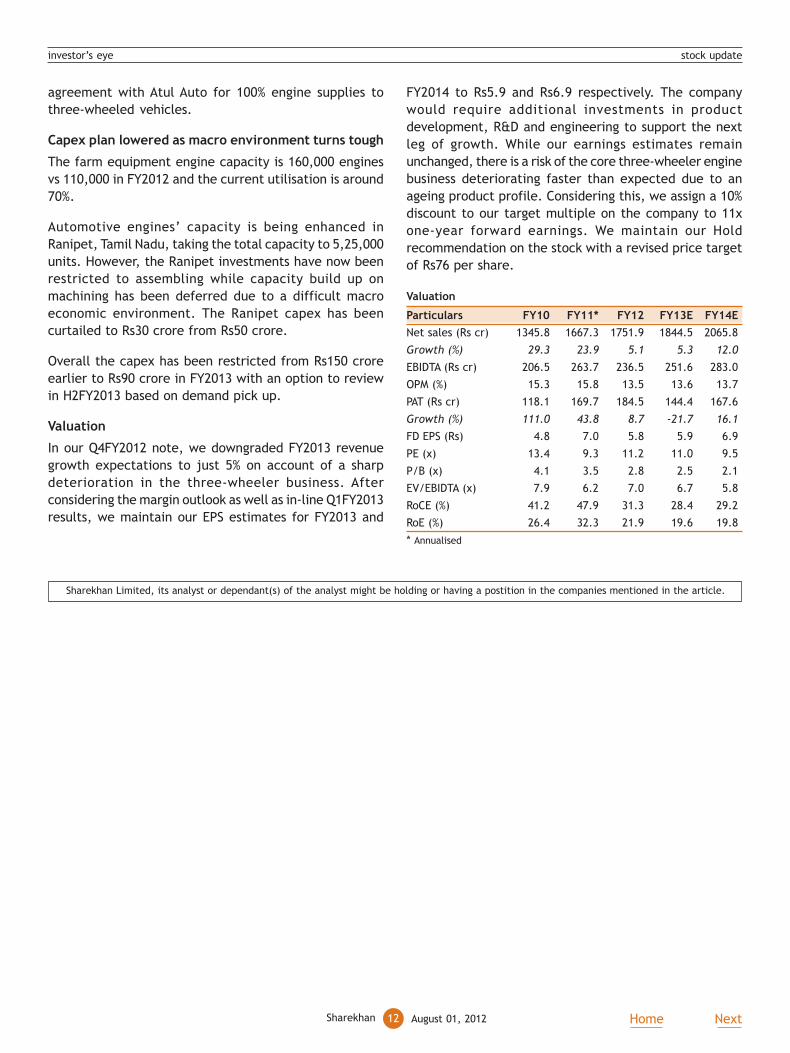
agreement with Atul Auto for 100% engine supplies to
three-wheeled vehicles.
Capex plan lowered as macro environment turns tough
The farm equipment engine capacity is 160,000 engines
vs 110,000 in FY2012 and the current utilisation is around
70%.
Automotive engines’ capacity is being enhanced in
Ranipet, Tamil Nadu, taking the total capacity to 5,25,000
units. However, the Ranipet investments have now been
restricted to assembling while capacity build up on
machining has been deferred due to a difficult macro
economic environment. The Ranipet capex has been
curtailed to Rs30 crore from Rs50 crore.
Overall the capex has been restricted from Rs150 crore
earlier to Rs90 crore in FY2013 with an option to review
in H2FY2013 based on demand pick up.
Valuation
In our Q4FY2012 note, we downgraded FY2013 revenue
growth expectations to just 5% on account of a sharp
deterioration in the three-wheeler business. After
considering the margin outlook as well as in-line Q1FY2013
results, we maintain our EPS estimates for FY2013 and
investor’s eye stock update
FY2014 to Rs5.9 and Rs6.9 respectively. The company
would require additional investments in product
development, R&D and engineering to support the next
leg of growth. While our earnings estimates remain
unchanged, there is a risk of the core three-wheeler engine
business deteriorating faster than expected due to an
ageing product profile. Considering this, we assign a 10%
discount to our target multiple on the company to 11x
one-year forward earnings. We maintain our Hold
recommendation on the stock with a revised price target
of Rs76 per share.
Valuation
Particulars FY10 FY11* FY12 FY13E FY14E
Net sales (Rs cr) 1345.8 1667.3 1751.9 1844.5 2065.8
Growth (%) 29.3 23.9 5.1 5.3 12.0
EBIDTA (Rs cr) 206.5 263.7 236.5 251.6 283.0
OPM (%) 15.3 15.8 13.5 13.6 13.7
PAT (Rs cr) 118.1 169.7 184.5 144.4 167.6
Growth (%) 111.0 43.8 8.7 -21.7 16.1
FD EPS (Rs) 4.8 7.0 5.8 5.9 6.9
PE (x) 13.4 9.3 11.2 11.0 9.5
P/B (x) 4.1 3.5 2.8 2.5 2.1
EV/EBIDTA (x) 7.9 6.2 7.0 6.7 5.8
RoCE (%) 41.2 47.9 31.3 28.4 29.2
RoE (%) 26.4 32.3 21.9 19.6 19.8
* Annualised
Sharekhan Limited, its analyst or dependant(s) of the analyst might be holding or having a postition in the companies mentioned in the article.

13Sharekhan August 01, 2012 Home Next
Company details
Price chart
Shareholding pattern
Price performance
(%) 1m 3m 6m 12m
Absolute -0.1 -1.8 5.1 10.8
Relative 0.7 -2.4 3.6 15.1
to Sensex
Jaiprakash Associates Ugly Duckling
Stock Update
Earnings in line with estimates Buy; CMP: Rs76
Price target: Rs105
Market cap: Rs16,126 cr
52 week high/low: Rs88/50
NSE volume: 1.9 lakh(no. of shares)
BSE code: 532532
NSE code: JPASSOCIAT
Sharekhan code: JPASSOCIAT
Free float: 113.1 cr(no. of shares)
Result highlights
� Q1FY2013 earnings in line with estimate: In Q1FY2013 JP Associates Ltd (JAL)
posted a net profit of Rs139 crore (a decline of 24.7% year on year [YoY]). The
same is in line with our estimate. However, the revenues came short of our
estimate on account of lower than expected revenues from its construction
division. The earnings of Q1FY2013 are comparable on a year-on-year (Y-o-Y)
basis because the company has reworked the earnings of Q1FY2012 for a like-
to-like comparison in view of the partial demerger of its cement division.
� Cement division supports revenue growth; construction and real estate
divisions offset the benefit: The revenues from the cement division, which
accounts for around 50% of the overall revenue, grew by an impressive 21.8%
YoY supported by a growth in the volume as well as realisation. However, on
account of a decline in the revenues from the construction and real estate
divisions (down 4.6% and 52.4% YoY respectively), the overall revenues of the
company could grow by just 3.1% YoY to Rs3,008 crore.
� OPM expanded YoY as well as sequentially: On the margin front, the operating
profit margin (OPM) for the quarter stood at 26% as compared with 25.7% in the
corresponding quarter of the previous year on account of an increase in the
profitability of its construction division (EBIT margin of 29.6% as against 19.6%
in Q1FY2012). The sharp increase in the EBIT margin of the construction division
was driven by the claim received by the company on one of its hydro power
projects executed in Jammu & Kashmir. On the other hand, the profitability of
its other key divisions, namely cement and real estate, contracted by 170 basis
points and 13 percentage points YoY respectively.
Results (stand-alone) (Rs cr)
Particulars Q1FY13 Q1FY12* YoY % QoQ %
Net sales 2964 2902 2.1 -26.4
Other operating income 45 17 169.1 24.5
Total revenues 3008 2919 3.1 -25.9
Total expenditure 2192 2156 1.7 -27.9
Operating profit 771 747 3.3 -21.6
Other income 29 21 38.6 -10.1
EBIDTA 844 784 7.7 -19.7
Interest 465 384 21.3 -19.8
PBDT 379 400 -5.2 -19.5
Depreciation 176 141 24.8 7.7
PBT 204 259 -21.3 -33.7
Tax 65 75 -13.0 127.5
RPAT 139 184 -24.7 -50.2
Margins (%)
OPM 26.0 25.7
NPM 4.7 6.4
Tax rate 31.8 28.8
*Financials for Q1FY2012 restated factoring in the partial demerger of the cement division
investor’s eye stock update
Promoters46%
Public & others20%
Foreign20%
Institutions14%
505560657075808590
Aug
-11
Oct
-11
Dec
-11
Feb
-12
Apr
-12
Jun-
12
Aug
-12
14Sharekhan Home NextAugust 01, 2012
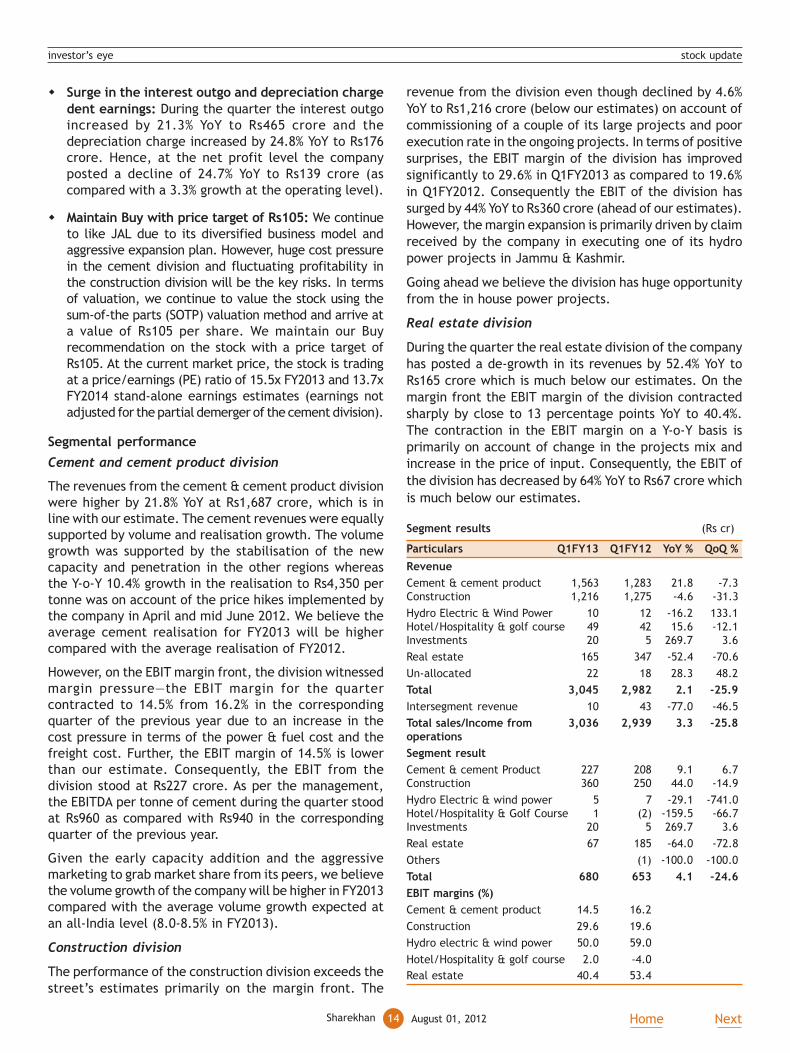
� Surge in the interest outgo and depreciation charge
dent earnings: During the quarter the interest outgoincreased by 21.3% YoY to Rs465 crore and thedepreciation charge increased by 24.8% YoY to Rs176crore. Hence, at the net profit level the companyposted a decline of 24.7% YoY to Rs139 crore (ascompared with a 3.3% growth at the operating level).
� Maintain Buy with price target of Rs105: We continueto like JAL due to its diversified business model andaggressive expansion plan. However, huge cost pressurein the cement division and fluctuating profitability inthe construction division will be the key risks. In termsof valuation, we continue to value the stock using thesum-of-the parts (SOTP) valuation method and arrive ata value of Rs105 per share. We maintain our Buyrecommendation on the stock with a price target ofRs105. At the current market price, the stock is tradingat a price/earnings (PE) ratio of 15.5x FY2013 and 13.7xFY2014 stand-alone earnings estimates (earnings notadjusted for the partial demerger of the cement division).
Segmental performance
Cement and cement product division
The revenues from the cement & cement product divisionwere higher by 21.8% YoY at Rs1,687 crore, which is inline with our estimate. The cement revenues were equallysupported by volume and realisation growth. The volumegrowth was supported by the stabilisation of the newcapacity and penetration in the other regions whereasthe Y-o-Y 10.4% growth in the realisation to Rs4,350 pertonne was on account of the price hikes implemented bythe company in April and mid June 2012. We believe theaverage cement realisation for FY2013 will be highercompared with the average realisation of FY2012.
However, on the EBIT margin front, the division witnessedmargin pressure—the EBIT margin for the quartercontracted to 14.5% from 16.2% in the correspondingquarter of the previous year due to an increase in thecost pressure in terms of the power & fuel cost and thefreight cost. Further, the EBIT margin of 14.5% is lowerthan our estimate. Consequently, the EBIT from thedivision stood at Rs227 crore. As per the management,the EBITDA per tonne of cement during the quarter stoodat Rs960 as compared with Rs940 in the correspondingquarter of the previous year.
Given the early capacity addition and the aggressivemarketing to grab market share from its peers, we believethe volume growth of the company will be higher in FY2013compared with the average volume growth expected atan all-India level (8.0-8.5% in FY2013).
Construction division
The performance of the construction division exceeds thestreet’s estimates primarily on the margin front. The
investor’s eye stock update
revenue from the division even though declined by 4.6%YoY to Rs1,216 crore (below our estimates) on account ofcommissioning of a couple of its large projects and poorexecution rate in the ongoing projects. In terms of positivesurprises, the EBIT margin of the division has improvedsignificantly to 29.6% in Q1FY2013 as compared to 19.6%in Q1FY2012. Consequently the EBIT of the division hassurged by 44% YoY to Rs360 crore (ahead of our estimates).However, the margin expansion is primarily driven by claimreceived by the company in executing one of its hydropower projects in Jammu & Kashmir.
Going ahead we believe the division has huge opportunityfrom the in house power projects.
Real estate division
During the quarter the real estate division of the companyhas posted a de-growth in its revenues by 52.4% YoY toRs165 crore which is much below our estimates. On themargin front the EBIT margin of the division contractedsharply by close to 13 percentage points YoY to 40.4%.The contraction in the EBIT margin on a Y-o-Y basis isprimarily on account of change in the projects mix andincrease in the price of input. Consequently, the EBIT of
the division has decreased by 64% YoY to Rs67 crore which
is much below our estimates.
Segment results (Rs cr)
Particulars Q1FY13 Q1FY12 YoY % QoQ %
Revenue
Cement & cement product 1,563 1,283 21.8 -7.3
Construction 1,216 1,275 -4.6 -31.3
Hydro Electric & Wind Power 10 12 -16.2 133.1
Hotel/Hospitality & golf course 49 42 15.6 -12.1
Investments 20 5 269.7 3.6
Real estate 165 347 -52.4 -70.6
Un-allocated 22 18 28.3 48.2
Total 3,045 2,982 2.1 -25.9
Intersegment revenue 10 43 -77.0 -46.5
Total sales/Income from 3,036 2,939 3.3 -25.8operations
Segment result
Cement & cement Product 227 208 9.1 6.7
Construction 360 250 44.0 -14.9
Hydro Electric & wind power 5 7 -29.1 -741.0
Hotel/Hospitality & Golf Course 1 (2) -159.5 -66.7
Investments 20 5 269.7 3.6
Real estate 67 185 -64.0 -72.8
Others (1) -100.0 -100.0
Total 680 653 4.1 -24.6
EBIT margins (%)
Cement & cement product 14.5 16.2
Construction 29.6 19.6
Hydro electric & wind power 50.0 59.0
Hotel/Hospitality & golf course 2.0 -4.0
Real estate 40.4 53.4
15Sharekhan August 01, 2012 Home Next
Penalty by High court of Himachal Pradesh and CCI
During the quarter the High court of Himachal Pradesh
imposed a penalty of Rs100 crore on the company
(Jaiprakash Associates) for alleged compliance related
issue under Environmental Law in respect of its grinding
and blending units at Bagheri. Further the Competition
Commission of India (CCI) has also imposed a penalty of
Rs1,323 crore on the company for involvement in the
formation of a cartel and managing cement prices at
higher levels. However, as per the legal advice the
company believes it has strong reason for successful appeal
in both the cases and hence no provision has been made
against this penalty during the quarter.
Received approval for demerger of its cement plant in
Gujarat & Andhra Pradesh
The company has received an approval from the High court
of Allahabad for demerger of its cement plants located in
Gujarat and Andhra Pradesh and transfer the same into
Jaypee Cement Corporation which is a 100% subsidiary of
JP Associates. Jaypee Cement Corporation is implementing
the set up of a 3 MTPA cement plant in Karnataka. Hence
the new entity Jaypee Cement Corporation will have a
combined cement capacity of around 12 MTPA by the end
of FY2013. Going ahead the company is looking to sell
stake in Jaypee Cement Corporation by introducing a
strategic investor and reducing the debt in the parent’s
balance sheet.
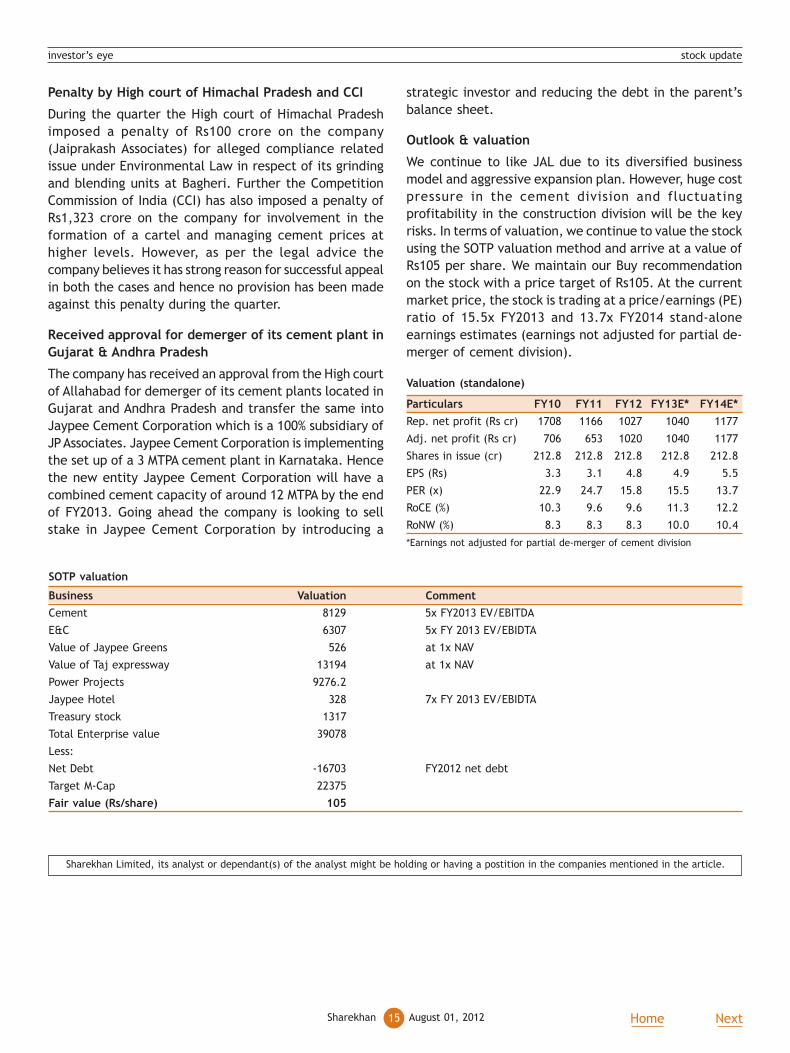
Outlook & valuation
We continue to like JAL due to its diversified business
model and aggressive expansion plan. However, huge cost
pressure in the cement division and fluctuating
profitability in the construction division will be the key
risks. In terms of valuation, we continue to value the stock
using the SOTP valuation method and arrive at a value of
Rs105 per share. We maintain our Buy recommendation
on the stock with a price target of Rs105. At the current
market price, the stock is trading at a price/earnings (PE)
ratio of 15.5x FY2013 and 13.7x FY2014 stand-alone
earnings estimates (earnings not adjusted for partial de-
merger of cement division).
Valuation (standalone)
Particulars FY10 FY11 FY12 FY13E* FY14E*
Rep. net profit (Rs cr) 1708 1166 1027 1040 1177
Adj. net profit (Rs cr) 706 653 1020 1040 1177
Shares in issue (cr) 212.8 212.8 212.8 212.8 212.8
EPS (Rs) 3.3 3.1 4.8 4.9 5.5
PER (x) 22.9 24.7 15.8 15.5 13.7
RoCE (%) 10.3 9.6 9.6 11.3 12.2
RoNW (%) 8.3 8.3 8.3 10.0 10.4
*Earnings not adjusted for partial de-merger of cement division
SOTP valuation
Business Valuation Comment
Cement 8129 5x FY2013 EV/EBITDA
E&C 6307 5x FY 2013 EV/EBIDTA
Value of Jaypee Greens 526 at 1x NAV
Value of Taj expressway 13194 at 1x NAV
Power Projects 9276.2
Jaypee Hotel 328 7x FY 2013 EV/EBIDTA
Treasury stock 1317
Total Enterprise value 39078
Less:
Net Debt -16703 FY2012 net debt
Target M-Cap 22375
Fair value (Rs/share) 105
Sharekhan Limited, its analyst or dependant(s) of the analyst might be holding or having a postition in the companies mentioned in the article.
investor’s eye stock update

16Sharekhan Home NextAugust 01, 2012
Company details
Price chart
Shareholding pattern
Price performance
(%) 1m 3m 6m 12m
Absolute -5.8 -13.3 -11.6 -28.1
Relative -5.0 -13.9 -12.8 -25.3
to Sensex
IDBI Bank Cannonball
Stock Update
Price target revised to Rs120 Hold; CMP: Rs87
Price target: Rs120
Market cap: Rs11,070 cr
52 week high/low: Rs128/77
NSE volume: 23.7 lakh(no. of shares)
BSE code: 500116
NSE code: IDBI
Sharekhan code: IDBI
Free float: 37.6 cr(no. of shares)
Result highlights
� IDBI Bank’s Q1FY2013 results were below our expectations as the net profits
grew by 27.5% year on year (YoY) to Rs427 crore. The subdued growth in the net
interest income (NII; 10.3% YoY) coupled with an increase in provisions (up 19%
YoY) contributed to a lower than estimated growth in earnings.
� The NII growth of 10.3% YoY (4.9% QoQ) was slightly short of our estimates as
there was reversal of Rs60 crore of interest income from the slippages. While
margins remained stable (2.09% vs 2.07% in Q4FY2012) the advances declined
7.4% quarter on quarter (QoQ) leading to a slower growth in the NII.
� The current account savings account (CASA) ratio declined to 18.1% (24.1% in
Q4FY2012) largely due to a decline in the current account deposits. Overall,
the deposits grew by 8.8% YoY.
� Due to higher slippages (Rs1,043 crore) and sluggish recoveries, the asset quality
deteriorated sharply during the quarter. The slippages were mainly from the
corporate, small and medium enterprise (SME) and agri segments. The bank
also restructured Rs902 crore worth of advances, thereby taking the total
restructured book to 6.5% of total advances.
� The non-interest income grew by 20% YoY (-33.5% QoQ) led by a 37% YoY growth
(36% QoQ decline) in the commission income. The cost to income ratio declined
to 36.8% from 39.9% in Q4FY2012 (34.9% in Q1FY2012).
Outlook and valuation
A relatively weaker deposit base, rising non-performing assets (NPAs) and a lower
tier I capital adequacy ratio (CAR; 8.24%) are likely to constrain the business growth
Results (Rs cr)
Particulars Q1FY13 Q1FY12 YoY % Q4FY12 QoQ %
Interest earned 6,269.8 5,628.9 11.4 6,079.5 3.1
Interest expense 4,999.2 4,476.5 11.7 4,868.6 2.7
Net interest income 1,270.6 1,152.4 10.3 1,210.9 4.9
Other income 517.0 430.9 20.0 777.0 -33.5
Net operating income 1,787.6 1,583.3 12.9 1,987.9 -10.1
Operating expenses 658.6 552.5 19.2 793.3 -17.0
- Employee cost 316.3 244.0 29.6 383.2 -17.5
- Other costs 342.3 308.5 10.9 410.1 -16.5
Operating profit 1,129.1 1,030.8 9.5 1,194.6 -5.5
Prov for contingencies 506.8 425.7 19.1 273.8 85.1
PBT 622.2 605.1 2.8 920.8 -32.4
Tax 194.9 270.0 -27.8 150.0 29.9
PAT 427.3 335.1 27.5 770.8 -44.6
Gross NPA (%) 3.24 2.10 2.49
Net NPA (%) 2.07 1.25 1.61
investor’s eye stock update
Promoter70%
Foreign3%
Public & others12%
MF & FI15%
70
80
90
100
110
120
130
Aug
-11
Oct
-11
Dec
-11
Feb
-12
Apr
-12
Jun-
12
Aug
-12
17Sharekhan August 01, 2012 Home Next
investor’s eye stock update
going ahead. We have revised our estimates downwards
for FY2013 and FY2014 by around 7% and now expect thebank’s earnings to grow at a compounded annual growthrate (CAGR) of 7.5% over FY2012-14. The return ratios(return on equity [RoE] of 11% and return on assets [RoA]of 0.7%) remain lower than that of peer banks and henceare likely to impact valuations. We revise our sum of theparts (SOTP) based target price to Rs120 (valued for thestandalone bank at Rs105). Going ahead the asset qualityremains a key concern which could keep valuationsdepressed. We maintain our Hold rating on the stock.
NII growth remains subdued
IDBI Bank’s NII growth has remained subdued over thepast four quarters due to a slower business growth. Apartfrom that there was interest reversal of Rs60 crore (dueto slippages) which impacted growth in NII. While themargins remained stable (2.09% vs 2.07%), the bank’sstrategy of moderate growth in advances has impactedNII growth. The cost of funds increased marginally on QoQbasis (8.43% vs 8.38%) due to the cash reserve ratio (CRR)cut. The yield on advances and investments was slightlylower on a sequential basis. We have built in a NII growthof 15.7% CAGR over FY2012-14.
Advances decline 7.4% QoQ, retail mix improves
During Q1FY2013, the advances declined by 7.4% QoQ(growth of 8.3% YoY). The corporate, SME and agricultureadvances recorded a sequential decline of 8.5%, 40.6% and16% respectively. However the retail advances increasedby 11.2% QoQ and 13.7% YoY. Consequently, the proportionof retail advances increased to 16.8% from 20.2% inQ1FY2012. Going ahead the bank will focus more on the
priority sector advances to achieve priority sector targets.
Business growth
Particulars Q1FY13 Q1FY12 YoY % Q4FY12 QoQ %
Advances 167,779 154,984 8.3 181,158 -7.4
Deposits 191,747 176,282 8.8 210,492 -8.9
CD Ratio 87.5 87.9 86.1
CASA ratio retracts to 18.1%
The CASA ratio deteriorated to 18.1% during the quarter
mainly due to an outflow of current account deposits (-
46% QoQ). While the overall deposits declined by 9% QoQ,
the savings deposits declined by 7.4% QoQ. We have
therefore reduced our CASA ratio assumptions to 20%.
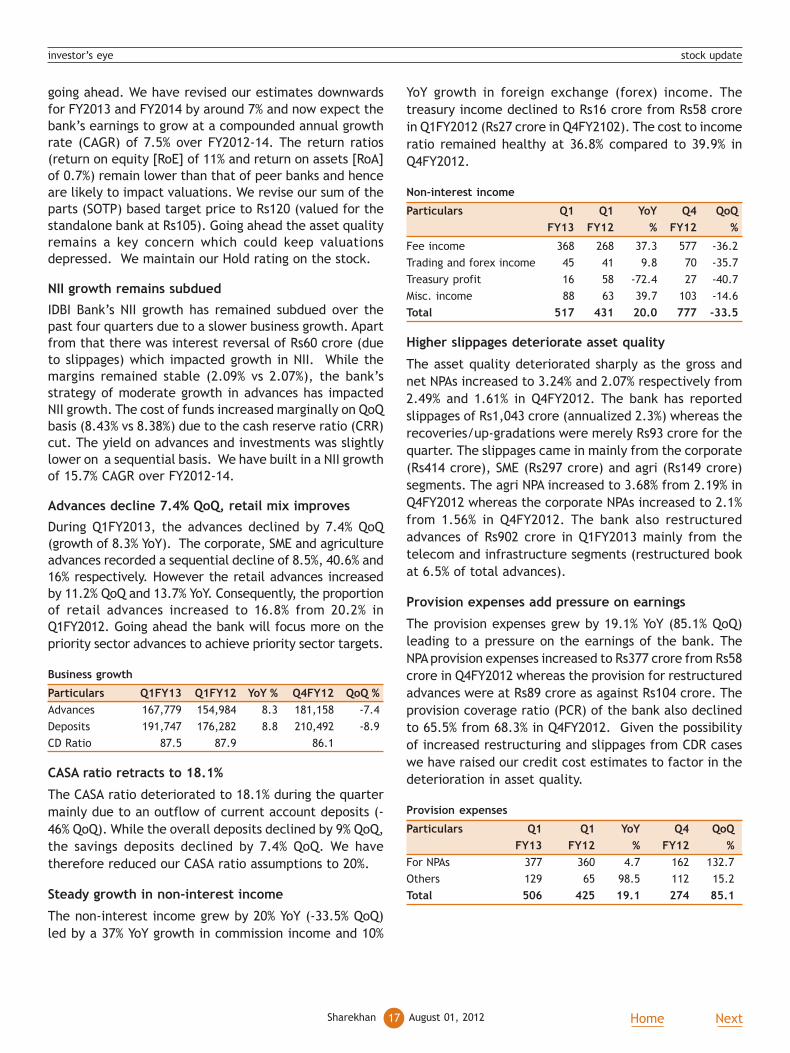
Steady growth in non-interest income
The non-interest income grew by 20% YoY (-33.5% QoQ)
led by a 37% YoY growth in commission income and 10%
YoY growth in foreign exchange (forex) income. The
treasury income declined to Rs16 crore from Rs58 crore
in Q1FY2012 (Rs27 crore in Q4FY2102). The cost to income
ratio remained healthy at 36.8% compared to 39.9% in
Q4FY2012.
Non-interest income
Particulars Q1 Q1 YoY Q4 QoQ
FY13 FY12 % FY12 %
Fee income 368 268 37.3 577 -36.2
Trading and forex income 45 41 9.8 70 -35.7
Treasury profit 16 58 -72.4 27 -40.7
Misc. income 88 63 39.7 103 -14.6
Total 517 431 20.0 777 -33.5
Higher slippages deteriorate asset quality
The asset quality deteriorated sharply as the gross and
net NPAs increased to 3.24% and 2.07% respectively from
2.49% and 1.61% in Q4FY2012. The bank has reported
slippages of Rs1,043 crore (annualized 2.3%) whereas the
recoveries/up-gradations were merely Rs93 crore for the
quarter. The slippages came in mainly from the corporate
(Rs414 crore), SME (Rs297 crore) and agri (Rs149 crore)
segments. The agri NPA increased to 3.68% from 2.19% in
Q4FY2012 whereas the corporate NPAs increased to 2.1%
from 1.56% in Q4FY2012. The bank also restructured
advances of Rs902 crore in Q1FY2013 mainly from the
telecom and infrastructure segments (restructured book
at 6.5% of total advances).
Provision expenses add pressure on earnings
The provision expenses grew by 19.1% YoY (85.1% QoQ)
leading to a pressure on the earnings of the bank. The
NPA provision expenses increased to Rs377 crore from Rs58
crore in Q4FY2012 whereas the provision for restructured
advances were at Rs89 crore as against Rs104 crore. The
provision coverage ratio (PCR) of the bank also declined
to 65.5% from 68.3% in Q4FY2012. Given the possibility
of increased restructuring and slippages from CDR cases
we have raised our credit cost estimates to factor in the
deterioration in asset quality.
Provision expenses
Particulars Q1 Q1 YoY Q4 QoQ
FY13 FY12 % FY12 %
For NPAs 377 360 4.7 162 132.7
Others 129 65 98.5 112 15.2
Total 506 425 19.1 274 85.1
18Sharekhan Home NextAugust 01, 2012
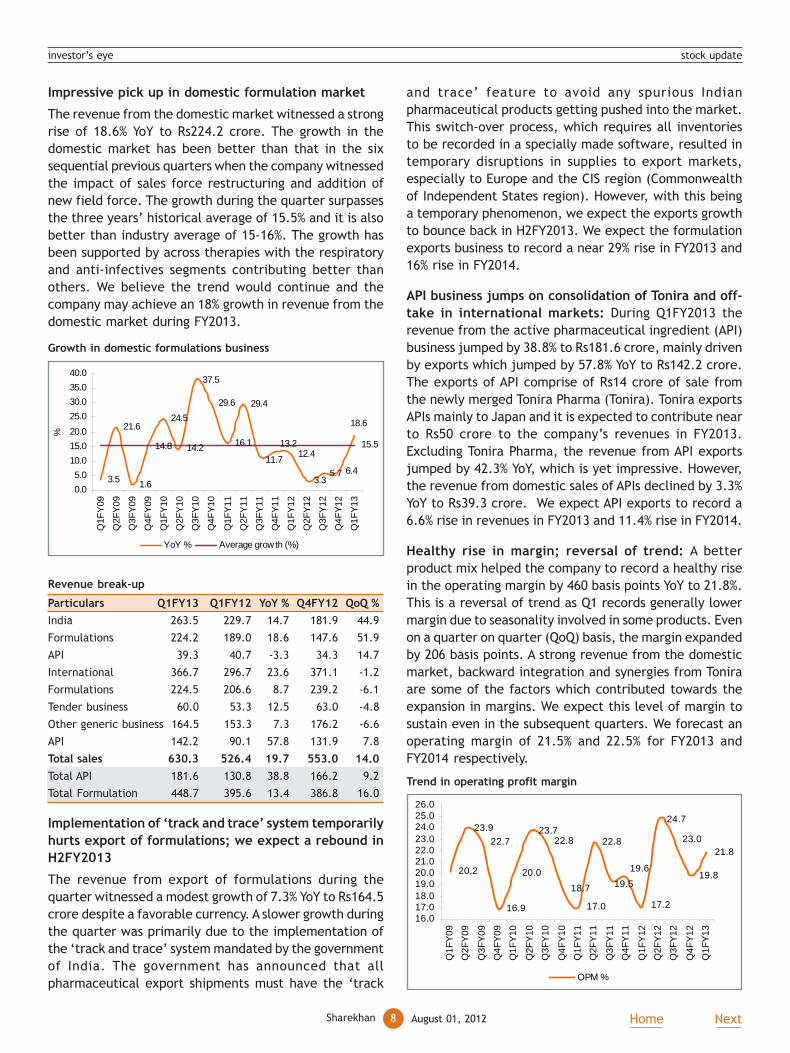
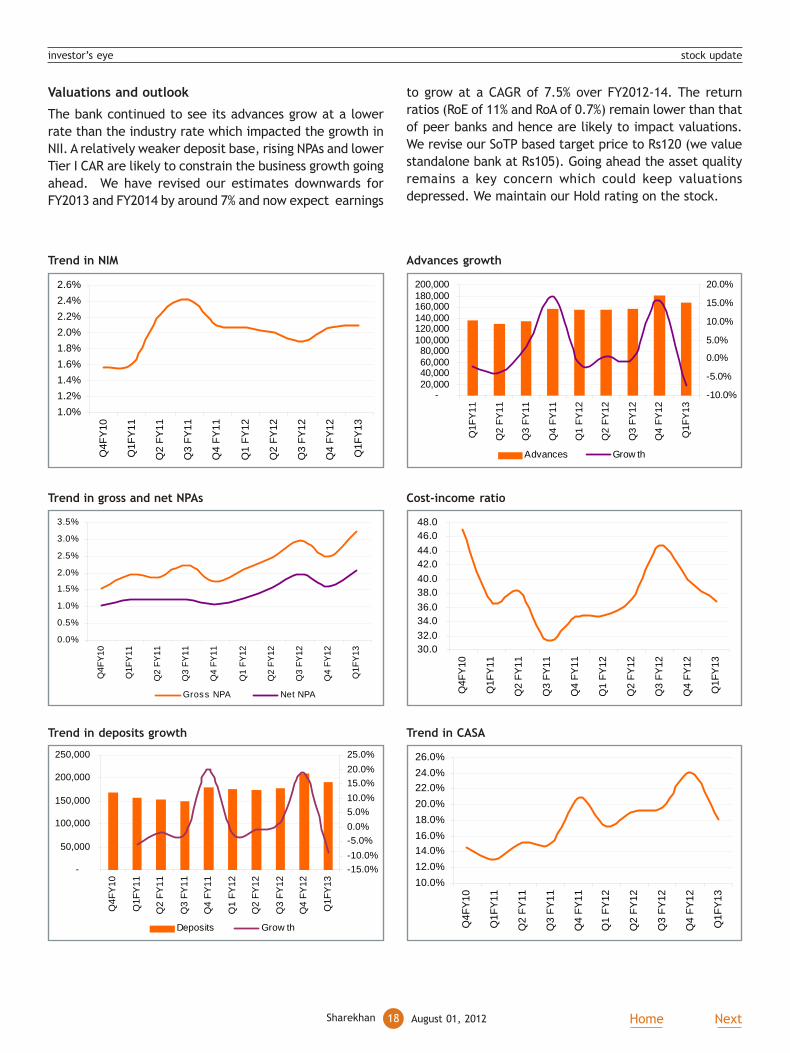
Trend in gross and net NPAs
Trend in NIM Advances growth
Trend in deposits growth Trend in CASA
Cost-income ratio
investor’s eye stock update
-20,00040,00060,00080,000
100,000120,000140,000160,000180,000200,000
Q1F
Y11
Q2
FY
11
Q3
FY
11
Q4
FY
11
Q1
FY
12
Q2
FY
12
Q3
FY
12
Q4
FY
12
Q1F
Y13
-10.0%
-5.0%
0.0%
5.0%
10.0%
15.0%
20.0%
Advances Grow th
-
50,000
100,000
150,000
200,000
250,000
Q4F
Y10
Q1F
Y11
Q2
FY
11
Q3
FY
11
Q4
FY
11
Q1
FY
12
Q2
FY
12
Q3
FY
12
Q4
FY
12
Q1F
Y13
-15.0%
-10.0%
-5.0%
0.0%
5.0%
10.0%
15.0%
20.0%
25.0%
Deposits Grow th
10.0%
12.0%
14.0%
16.0%
18.0%
20.0%
22.0%
24.0%
26.0%
Q4F
Y10
Q1F
Y11
Q2
FY
11
Q3
FY
11
Q4
FY
11
Q1
FY
12
Q2
FY
12
Q3
FY
12
Q4
FY
12
Q1F
Y13
1.0%
1.2%
1.4%
1.6%
1.8%
2.0%
2.2%
2.4%
2.6%
Q4F
Y10
Q1F
Y11
Q2
FY
11
Q3
FY
11
Q4
FY
11
Q1
FY
12
Q2
FY
12
Q3
FY
12
Q4
FY
12
Q1F
Y13
0.0%
0.5%
1.0%
1.5%
2.0%
2.5%
3.0%
3.5%
Q4F
Y10
Q1F
Y11
Q2
FY
11
Q3
FY
11
Q4
FY
11
Q1
FY
12
Q2
FY
12
Q3
FY
12
Q4
FY
12
Q1F
Y13
Gross NPA Net NPA
30.032.0
34.036.0
38.040.0
42.044.0
46.048.0
Q4F
Y10
Q1F
Y11
Q2
FY
11
Q3
FY
11
Q4
FY
11
Q1
FY
12
Q2
FY
12
Q3
FY
12
Q4
FY
12
Q1F
Y13
Valuations and outlook
The bank continued to see its advances grow at a lower
rate than the industry rate which impacted the growth in
NII. A relatively weaker deposit base, rising NPAs and lower
Tier I CAR are likely to constrain the business growth going
ahead. We have revised our estimates downwards for
FY2013 and FY2014 by around 7% and now expect earnings
to grow at a CAGR of 7.5% over FY2012-14. The return
ratios (RoE of 11% and RoA of 0.7%) remain lower than that
of peer banks and hence are likely to impact valuations.
We revise our SoTP based target price to Rs120 (we value
standalone bank at Rs105). Going ahead the asset quality
remains a key concern which could keep valuations
depressed. We maintain our Hold rating on the stock.
19Sharekhan August 01, 2012 Home Next
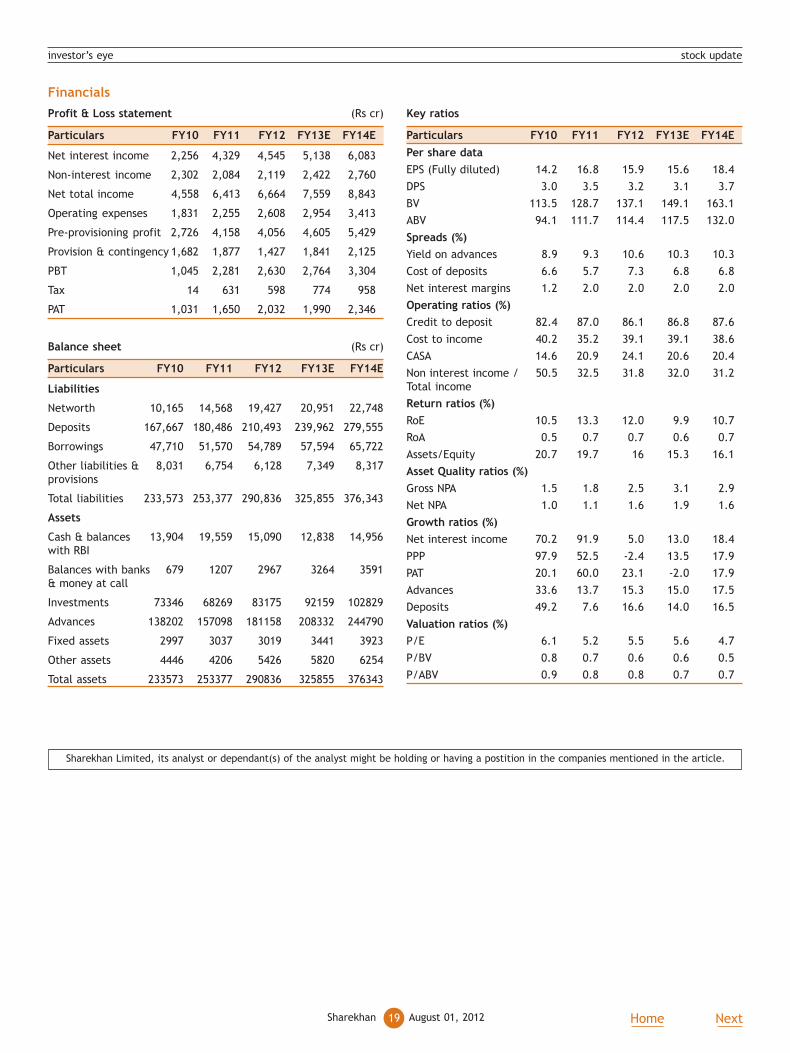
Profit & Loss statement (Rs cr)
Particulars FY10 FY11 FY12 FY13E FY14E
Net interest income 2,256 4,329 4,545 5,138 6,083
Non-interest income 2,302 2,084 2,119 2,422 2,760
Net total income 4,558 6,413 6,664 7,559 8,843
Operating expenses 1,831 2,255 2,608 2,954 3,413
Pre-provisioning profit 2,726 4,158 4,056 4,605 5,429
Provision & contingency 1,682 1,877 1,427 1,841 2,125
PBT 1,045 2,281 2,630 2,764 3,304
Tax 14 631 598 774 958
PAT 1,031 1,650 2,032 1,990 2,346
Balance sheet (Rs cr)
Particulars FY10 FY11 FY12 FY13E FY14E
Liabilities
Networth 10,165 14,568 19,427 20,951 22,748
Deposits 167,667 180,486 210,493 239,962 279,555
Borrowings 47,710 51,570 54,789 57,594 65,722
Other liabilities & 8,031 6,754 6,128 7,349 8,317
provisions
Total liabilities 233,573 253,377 290,836 325,855 376,343
Assets
Cash & balances 13,904 19,559 15,090 12,838 14,956
with RBI
Balances with banks 679 1207 2967 3264 3591
& money at call
Investments 73346 68269 83175 92159 102829
Advances 138202 157098 181158 208332 244790
Fixed assets 2997 3037 3019 3441 3923
Other assets 4446 4206 5426 5820 6254
Total assets 233573 253377 290836 325855 376343
Financials
Key ratios
Particulars FY10 FY11 FY12 FY13E FY14E
Per share data
EPS (Fully diluted) 14.2 16.8 15.9 15.6 18.4
DPS 3.0 3.5 3.2 3.1 3.7
BV 113.5 128.7 137.1 149.1 163.1
ABV 94.1 111.7 114.4 117.5 132.0
Spreads (%)
Yield on advances 8.9 9.3 10.6 10.3 10.3
Cost of deposits 6.6 5.7 7.3 6.8 6.8
Net interest margins 1.2 2.0 2.0 2.0 2.0
Operating ratios (%)
Credit to deposit 82.4 87.0 86.1 86.8 87.6
Cost to income 40.2 35.2 39.1 39.1 38.6
CASA 14.6 20.9 24.1 20.6 20.4
Non interest income / 50.5 32.5 31.8 32.0 31.2
Total income
Return ratios (%)
RoE 10.5 13.3 12.0 9.9 10.7
RoA 0.5 0.7 0.7 0.6 0.7
Assets/Equity 20.7 19.7 16 15.3 16.1
Asset Quality ratios (%)
Gross NPA 1.5 1.8 2.5 3.1 2.9
Net NPA 1.0 1.1 1.6 1.9 1.6
Growth ratios (%)
Net interest income 70.2 91.9 5.0 13.0 18.4
PPP 97.9 52.5 -2.4 13.5 17.9
PAT 20.1 60.0 23.1 -2.0 17.9
Advances 33.6 13.7 15.3 15.0 17.5
Deposits 49.2 7.6 16.6 14.0 16.5
Valuation ratios (%)
P/E 6.1 5.2 5.5 5.6 4.7
P/BV 0.8 0.7 0.6 0.6 0.5
P/ABV 0.9 0.8 0.8 0.7 0.7
Sharekhan Limited, its analyst or dependant(s) of the analyst might be holding or having a postition in the companies mentioned in the article.
investor’s eye stock update
20Sharekhan Home NextAugust 01, 2012
investor’s eye sector update
Automobiles
Sector Update
Crash test ahead
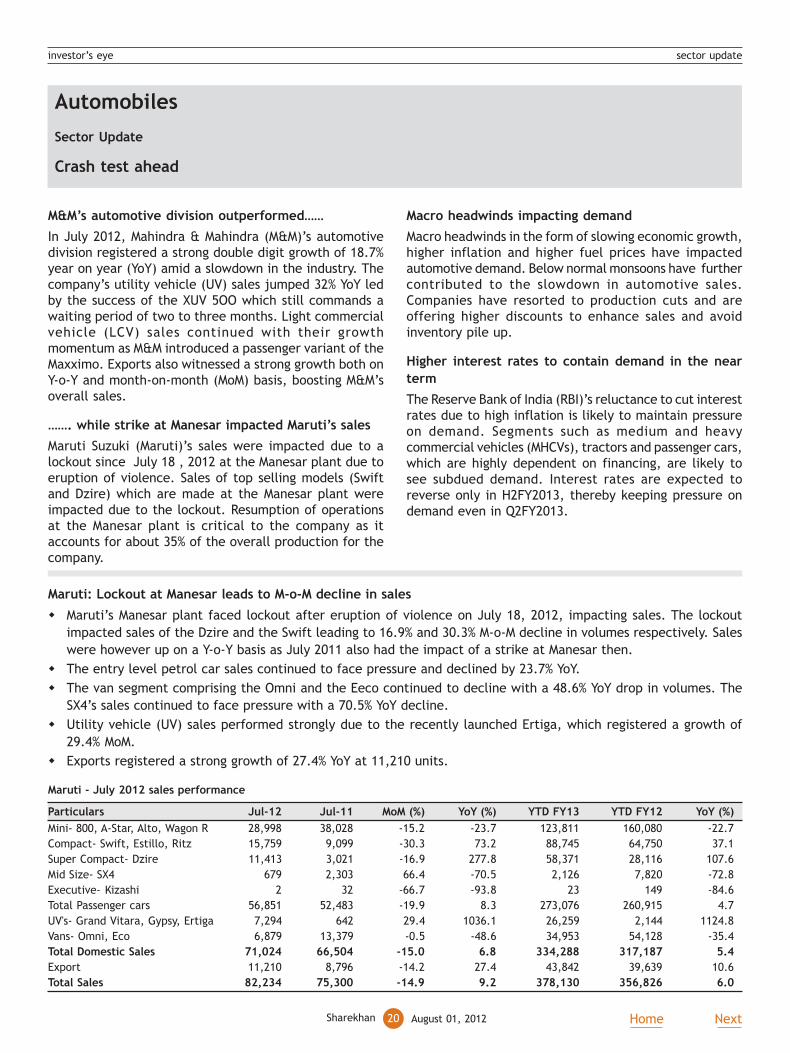
M&M’s automotive division outperformed……
In July 2012, Mahindra & Mahindra (M&M)’s automotivedivision registered a strong double digit growth of 18.7%year on year (YoY) amid a slowdown in the industry. Thecompany’s utility vehicle (UV) sales jumped 32% YoY ledby the success of the XUV 5OO which still commands awaiting period of two to three months. Light commercialvehicle (LCV) sales continued with their growthmomentum as M&M introduced a passenger variant of theMaxximo. Exports also witnessed a strong growth both onY-o-Y and month-on-month (MoM) basis, boosting M&M’soverall sales.
……. while strike at Manesar impacted Maruti’s sales
Maruti Suzuki (Maruti)’s sales were impacted due to alockout since July 18 , 2012 at the Manesar plant due toeruption of violence. Sales of top selling models (Swiftand Dzire) which are made at the Manesar plant wereimpacted due to the lockout. Resumption of operationsat the Manesar plant is critical to the company as itaccounts for about 35% of the overall production for thecompany.
Maruti - July 2012 sales performance
Particulars Jul-12 Jul-11 MoM (%) YoY (%) YTD FY13 YTD FY12 YoY (%)
Mini- 800, A-Star, Alto, Wagon R 28,998 38,028 -15.2 -23.7 123,811 160,080 -22.7
Compact- Swift, Estillo, Ritz 15,759 9,099 -30.3 73.2 88,745 64,750 37.1
Super Compact- Dzire 11,413 3,021 -16.9 277.8 58,371 28,116 107.6
Mid Size- SX4 679 2,303 66.4 -70.5 2,126 7,820 -72.8
Executive- Kizashi 2 32 -66.7 -93.8 23 149 -84.6
Total Passenger cars 56,851 52,483 -19.9 8.3 273,076 260,915 4.7
UV's- Grand Vitara, Gypsy, Ertiga 7,294 642 29.4 1036.1 26,259 2,144 1124.8
Vans- Omni, Eco 6,879 13,379 -0.5 -48.6 34,953 54,128 -35.4
Total Domestic Sales 71,024 66,504 -15.0 6.8 334,288 317,187 5.4
Export 11,210 8,796 -14.2 27.4 43,842 39,639 10.6
Total Sales 82,234 75,300 -14.9 9.2 378,130 356,826 6.0
Maruti: Lockout at Manesar leads to M-o-M decline in sales
� Maruti’s Manesar plant faced lockout after eruption of violence on July 18, 2012, impacting sales. The lockout
impacted sales of the Dzire and the Swift leading to 16.9% and 30.3% M-o-M decline in volumes respectively. Sales
were however up on a Y-o-Y basis as July 2011 also had the impact of a strike at Manesar then.
� The entry level petrol car sales continued to face pressure and declined by 23.7% YoY.
� The van segment comprising the Omni and the Eeco continued to decline with a 48.6% YoY drop in volumes. The
SX4’s sales continued to face pressure with a 70.5% YoY decline.
� Utility vehicle (UV) sales performed strongly due to the recently launched Ertiga, which registered a growth of
29.4% MoM.
� Exports registered a strong growth of 27.4% YoY at 11,210 units.
Macro headwinds impacting demand
Macro headwinds in the form of slowing economic growth,higher inflation and higher fuel prices have impactedautomotive demand. Below normal monsoons have furthercontributed to the slowdown in automotive sales.Companies have resorted to production cuts and areoffering higher discounts to enhance sales and avoidinventory pile up.
Higher interest rates to contain demand in the near
term
The Reserve Bank of India (RBI)’s reluctance to cut interestrates due to high inflation is likely to maintain pressureon demand. Segments such as medium and heavycommercial vehicles (MHCVs), tractors and passenger cars,which are highly dependent on financing, are likely tosee subdued demand. Interest rates are expected toreverse only in H2FY2013, thereby keeping pressure ondemand even in Q2FY2013.
21Sharekhan August 01, 2012 Home Next
investor’s eye sector update
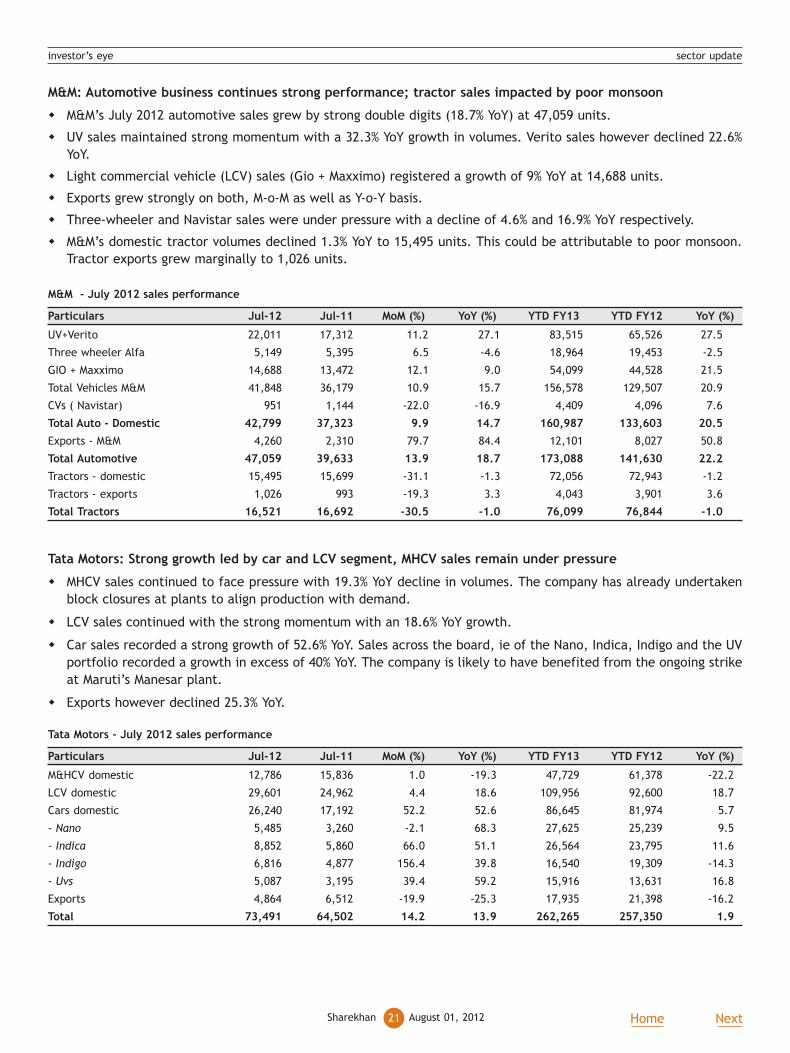
M&M - July 2012 sales performance
Particulars Jul-12 Jul-11 MoM (%) YoY (%) YTD FY13 YTD FY12 YoY (%)
UV+Verito 22,011 17,312 11.2 27.1 83,515 65,526 27.5
Three wheeler Alfa 5,149 5,395 6.5 -4.6 18,964 19,453 -2.5
GIO + Maxximo 14,688 13,472 12.1 9.0 54,099 44,528 21.5
Total Vehicles M&M 41,848 36,179 10.9 15.7 156,578 129,507 20.9
CVs ( Navistar) 951 1,144 -22.0 -16.9 4,409 4,096 7.6
Total Auto - Domestic 42,799 37,323 9.9 14.7 160,987 133,603 20.5
Exports - M&M 4,260 2,310 79.7 84.4 12,101 8,027 50.8
Total Automotive 47,059 39,633 13.9 18.7 173,088 141,630 22.2
Tractors - domestic 15,495 15,699 -31.1 -1.3 72,056 72,943 -1.2
Tractors - exports 1,026 993 -19.3 3.3 4,043 3,901 3.6
Total Tractors 16,521 16,692 -30.5 -1.0 76,099 76,844 -1.0
M&M: Automotive business continues strong performance; tractor sales impacted by poor monsoon
� M&M’s July 2012 automotive sales grew by strong double digits (18.7% YoY) at 47,059 units.
� UV sales maintained strong momentum with a 32.3% YoY growth in volumes. Verito sales however declined 22.6%
YoY.
� Light commercial vehicle (LCV) sales (Gio + Maxximo) registered a growth of 9% YoY at 14,688 units.
� Exports grew strongly on both, M-o-M as well as Y-o-Y basis.
� Three-wheeler and Navistar sales were under pressure with a decline of 4.6% and 16.9% YoY respectively.
� M&M’s domestic tractor volumes declined 1.3% YoY to 15,495 units. This could be attributable to poor monsoon.
Tractor exports grew marginally to 1,026 units.
Tata Motors: Strong growth led by car and LCV segment, MHCV sales remain under pressure
� MHCV sales continued to face pressure with 19.3% YoY decline in volumes. The company has already undertaken
block closures at plants to align production with demand.
� LCV sales continued with the strong momentum with an 18.6% YoY growth.
� Car sales recorded a strong growth of 52.6% YoY. Sales across the board, ie of the Nano, Indica, Indigo and the UV
portfolio recorded a growth in excess of 40% YoY. The company is likely to have benefited from the ongoing strike
at Maruti’s Manesar plant.
� Exports however declined 25.3% YoY.
Tata Motors - July 2012 sales performance
Particulars Jul-12 Jul-11 MoM (%) YoY (%) YTD FY13 YTD FY12 YoY (%)
M&HCV domestic 12,786 15,836 1.0 -19.3 47,729 61,378 -22.2
LCV domestic 29,601 24,962 4.4 18.6 109,956 92,600 18.7
Cars domestic 26,240 17,192 52.2 52.6 86,645 81,974 5.7
- Nano 5,485 3,260 -2.1 68.3 27,625 25,239 9.5
- Indica 8,852 5,860 66.0 51.1 26,564 23,795 11.6
- Indigo 6,816 4,877 156.4 39.8 16,540 19,309 -14.3
- Uvs 5,087 3,195 39.4 59.2 15,916 13,631 16.8
Exports 4,864 6,512 -19.9 -25.3 17,935 21,398 -16.2
Total 73,491 64,502 14.2 13.9 262,265 257,350 1.9

22Sharekhan Home NextAugust 01, 2012
investor’s eye sector update
TVS Motors: Two-wheeler sales decline across segments, three-wheeler sales remain flat
� TVS Motors’ two-wheeler sales declined 15.4% YoY to 157,954 units. The decline was witnessed across product
segments.
� Motorcycle sales were the worst hit with a 24% YoY decline in volumes. After losing market share in the motorcycle
segment, TVS Motors is now witnessing a market share loss in the scooter segment after Honda expanded capacity.
� Moped sales too declined 5.2% YoY at 63,704 units.
� Three-wheeler sales remained flat at 3,301 units.
TVS Motors – July 2012 sales performance
Particulars Jul-12 Jul-11 MoM (%) YoY (%) YTD FY13 YTD FY12 YoY (%)
Motorcycle 53,355 70,170 -12.9 -24.0 246,729 285,221 -13.5
Mopeds 63,704 67,169 -3.5 -5.2 267,579 259,302 3.2
Scooters 40,895 49,333 7.2 -17.1 153,727 166,856 -7.9
Total Two wheeler 157,954 186,672 -4.5 -15.4 668,035 711,379 -6.1
Three wheelers 3,301 3,290 1.4 0.3 12,380 14,713 -15.9
Overall Sales 161,255 189,962 -4.4 -15.1 680,415 726,092 -6.3
Eicher Motors: Sales in negative territory
� VECV’s domestic sales declined for the first time in the calendar year in July 2012. Domestic sales declined by a
sharp 11.3% YoY at 3,492 units. The year till date (YTD CY2012) sales growth has now come down to single digits.
� Exports also witnessed pressure with the sales halving to 110 units.
Eicher Motors - July 2012 sales performance
Particulars Jul-12 Jul-11 MoM (%) YoY (%) YTD CY12 YTD CY11 YoY (%)
Domestic 3,492 3,935 -7.3 -11.3 28,177 25,852 9.0
Exports 110 217 -63.0 -49.3 1,484 1,712 -13.3
Total sales 3,602 4,152 -11.4 -13.2 29,661 27,564 7.6
Sharekhan Limited, its analyst or dependant(s) of the analyst might be holding or having a postition in the companies mentioned in the article.
23Sharekhan August 01, 2012 Home Next
Evergreen
GlaxoSmithKline Consumer HealthcareHousing Development Finance CorporationHDFC BankInfosysLarsen & ToubroReliance IndustriesTata Consultancy Services
Emerging Star
Axis Bank (UTI Bank)Cadila HealthcareEros International MediaGateway DistriparksGreaves CottonIL&FS Transportation NetworksIRB Infrastructure DevelopersKalpataru Power TransmissionMax IndiaOpto Circuits IndiaThermaxYes BankZydus Wellness
Apple Green
Aditya Birla NuvoApollo TyresBajaj AutoBajaj FinServBajaj Holdings & InvestmentBank of BarodaBank of IndiaBharat ElectronicsBharat Heavy ElectricalsBharti AirtelCorporation BankCrompton GreavesDivi's LaboratoriesGAIL IndiaGlenmark PharmaceuticalsGodrej Consumer ProductsGrasim IndustriesHCL TechnologiesHindustan UnileverICICI BankIndian Hotels CompanyITCMahindra & MahindraMaricoMaruti Suzuki IndiaLupinOil IndiaPiramal Healthcare (Nicholas Piramal India)PTC IndiaPunj LloydSintex IndustriesState Bank of IndiaTata Global Beverages (Tata Tea)Wipro
Ugly Duckling
Ashok LeylandBajaj Corp
CESC
Deepak Fertilisers & Petrochemicals Corporation
Federal Bank
Gayatri Projects
India Cements
Ipca Laboratories
ISMT
Jaiprakash Associates
Kewal Kiran Clothing
Mcleod Russel India
NIIT Technologies
Orbit Corporation
Polaris Financial Technology
Pratibha Industries
Provogue India
Punjab National Bank
Ratnamani Metals and Tubes
Raymond
Selan Exploration Technology
Sun Pharmaceutical Industries
Torrent Pharmaceuticals
UltraTech Cement
Union Bank of India
United Phosphorus
V-Guard Industries
Vulture’s Pick
Mahindra Lifespace Developers
Orient Paper and Industries
Tata Chemicals
Unity Infraprojects
Cannonball
Allahabad Bank
Andhra Bank
IDBI Bank
Madras Cements
Shree Cement
Sharekhan Stock Idea
Disclaimer
This document has been prepared by Sharekhan Ltd.(SHAREKHAN) This Document is subject to changes without prior notice and is intended only for the person or entity to which it is addressed to and may contain confidential and/orprivileged material and is not for any type of circulation. Any review, retransmission, or any other use is prohibited. Kindly note that this document does not constitute an offer or solicitation for the purchase or sale of any financialinstrument or as an official confirmation of any transaction.
Though disseminated to all the customers simultaneously, not all customers may receive this report at the same time. SHAREKHAN will not treat recipients as customers by virtue of their receiving this report.
The information contained herein is from publicly available data or other sources believed to be reliable. While we would endeavour to update the information herein on reasonable basis, SHAREKHAN, its subsidiaries and associatedcompanies, their directors and employees (“SHAREKHAN and affiliates”) are under no obligation to update or keep the information current. Also, there may be regulatory, compliance, or other reasons that may prevent SHAREKHAN andaffiliates from doing so. We do not represent that information contained herein is accurate or complete and it should not be relied upon as such. This document is prepared for assistance only and is not intended to be and must not alonebetaken as the basis for an investment decision. The user assumes the entire risk of any use made of this information. Each recipient of this document should make such investigations as it deems necessary to arrive at an independentevaluation of an investment in the securities of companies referred to in this document (including the merits and risks involved), and should consult its own advisors to determine the merits and risks of such an investment. The investmentdiscussed or views expressed may not be suitable for all investors. We do not undertake to advise you as to any change of our views. Affiliates of Sharekhan may have issued other reports that are inconsistent with and reach differentconclusion from the information presented in this report.
This report is not directed or intended for distribution to, or use by, any person or entity who is a citizen or resident of or located in any locality, state, country or other jurisdiction, where such distribution, publication, availability oruse would be contrary to law, regulation or which would subject SHAREKHAN and affiliates to any registration or licensing requirement within such jurisdiction. The securities described herein may or may not be eligible for sale in alljurisdictions or to certain category of investors. Persons in whose possession this document may come are required to inform themselves of and to observe such restriction.
SHAREKHAN & affiliates may have used the information set forth herein before publication and may have positions in, may from time to time purchase or sell or may be materially interested in any of the securities mentioned or relatedsecurities. SHAREKHAN may from time to time solicit from, or perform investment banking, or other services for, any company mentioned herein. Without limiting any of the foregoing, in no event shall SHAREKHAN, any of its affiliatesor any third party involved in, or related to, computing or compiling the information have any liability for any damages of any kind. Any comments or statements made herein are those of the analyst and do not necessarily reflect thoseof SHAREKHAN.
To know more about our products and services click here.