Embed Size (px)
Citation preview

INDEX TO VIRGINIA CORN HYBRID AND MANAGEMENT TRIALS 1998
SECTION I. VIRGINIA CORN HYBRID TRIALS IN 1998.Companies participating in the 1998 Corn Hybrid Trials 21998 Virginia Corn Hybird Plot Information 3Table 1. 1998 Relative Yield of hybrids entered in three or more
locations. 4-6 Table 2. Two Year Average Relative Yield of hybrids entered in
the same three or more locations. 6-7Table 3. Three Year Average Relative Yield of hybrids entered
in the same three or more locations. 7-8Table 4. Yields at Rockingham, VA in 1998. 9-10Table 5. Two year average yields at Rockingham, VA in 1997 and 1998. 10-11Table 6. Three year average yields at Rockingham, VA in 1996, 1997,
and 1998. 11-12Table 7. Yields at Blacksburg, VA in 1998. 13-14Table 8. Two year average yields at Blacksburg, VA in 1997 and 1998. 14-15Table 9. Three year average yields at Blacksburg, VA in 1996, 1997, and 1998. 15-16Table 10. Yields at Blackstone, VA in 1998. 17-18Table 11. Two year average yields at Blackstone, VA in 1997 and 1998. 18Table 12. Three year average yields at Blackstone, VA in 1996, 1997,
and 1998. 19Table 13. Yields at Holland, VA in 1998. 20-21Table 14. Two year average yields at Holland, VA in 1996 and 1998. 21-22Table 15. Three year average yields at Holland, VA in 1995, 1996,
and 1998. 22Table 16. Yields at Mt Holly, VA in 1998. 23-25Table 17. Two year average yields at Mt Holly, VA in 1996 and 1998. 25Table 18. Three year average yields at Mt Holly, VA in 1995, 1996,
and 1998. 26 Table19. Yields at Mt Holly, VA under irrigation in 1998. 27-29
Table 20. Two year average yields at Mt Holly, VA under irrigation in 1997and 1998. 29-30
Table 21. Three year average yields at Mt Holly, VA under irrigation in 1996,1997, and 1998. 30
Table 22. Yields at Wythe, VA in 1998. 31Table 23. Two year average yields at Wythe, VA in 1997 and 1998. 32Table 24. Yields at Orange, VA in 1998. 33-34Table 25. Two year average yields at Orange, VA in 1997 and 1998. 35-36Table 26. Three year average yields at Orange, VA in 1996, 1997, and 1998. 36
SECTION II. EVALUATION OF DOUBLECROP CORN UNDER IRRIGATIONIN EASTERN VIRGINIA.
Table 27. Doublecrop Corn Hybrid Study under irrigation at Corbin Hall, VAin 1998. 37
SECTION III. EVALUATION OF CORN ROW WIDTH AND POPULATION INEASTERN VIRGINIA .
Table 28. Corn Row Width/Population Study at TOANO, VA in 1998. 38
SECTION IV. EVALUATION OF BT HYBRIDS IN EASTERN VIRGINIA.Table 29. ECB feeding damage, 1998 corn Bt hybrid study, Holland, Va. 39Table 30. ECB feeding damage, 1998 corn Bt hybrid study, Mt. Holly, Va. 39-40Table 31. Bt corn hybrids under dryland conditions; Holland, Virginia, 1998. 40Table 32. Bt corn hybrids under irrigation; Mt. Holly, Virginia, 1998. 40
SECTION V. 1998 EUROPEAN CORN BORER SURVEY IN EASTERN VIRGINIA 41
SECTION VI. RESISTANCE AND AGRONOMIC CHARACTERISTICS OFMAIZE HYBRIDS UNDER NATURAL GRAY LEAF SPOT DISEASE PRESSURE 42-43
SECTION I. VIRGINIA CORN HYBRID TRIALS IN 1998.
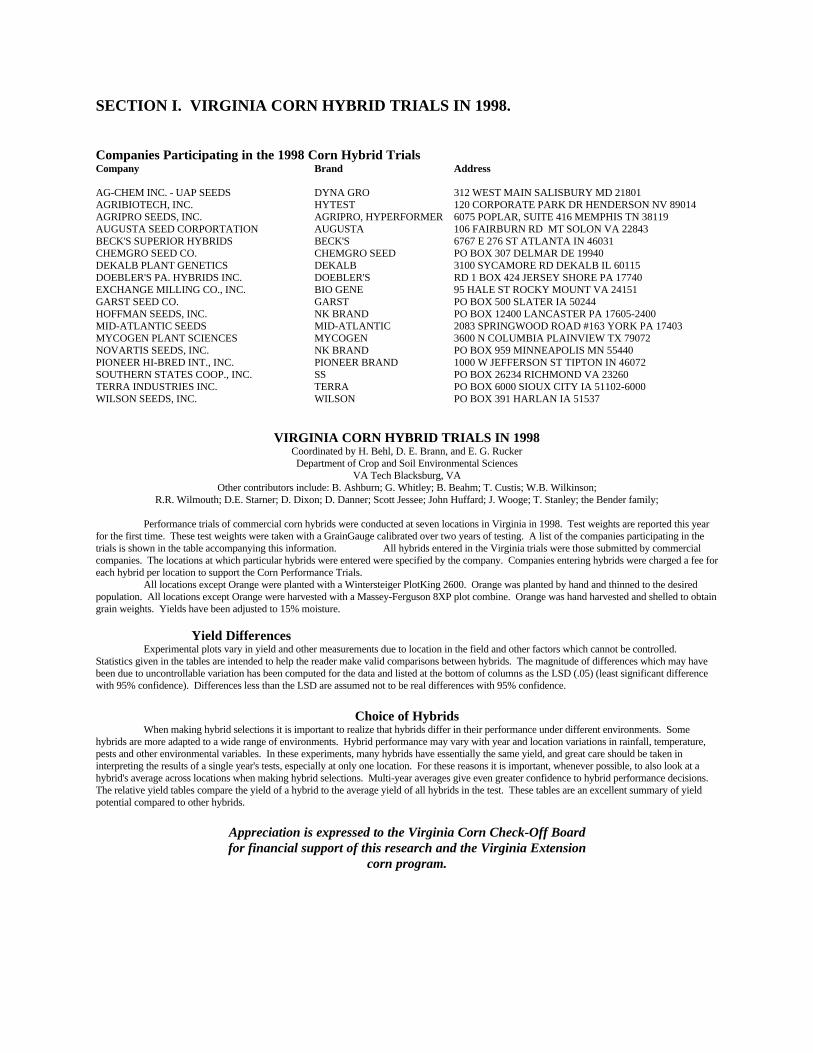
Companies Participating in the 1998 Corn Hybrid TrialsCompany Brand Address
AG-CHEM INC. - UAP SEEDS DYNA GRO 312 WEST MAIN SALISBURY MD 21801AGRIBIOTECH, INC. HYTEST 120 CORPORATE PARK DR HENDERSON NV 89014AGRIPRO SEEDS, INC. AGRIPRO, HYPERFORMER 6075 POPLAR, SUITE 416 MEMPHIS TN 38119AUGUSTA SEED CORPORTATION AUGUSTA 106 FAIRBURN RD MT SOLON VA 22843BECK'S SUPERIOR HYBRIDS BECK'S 6767 E 276 ST ATLANTA IN 46031CHEMGRO SEED CO. CHEMGRO SEED PO BOX 307 DELMAR DE 19940DEKALB PLANT GENETICS DEKALB 3100 SYCAMORE RD DEKALB IL 60115DOEBLER'S PA. HYBRIDS INC. DOEBLER'S RD 1 BOX 424 JERSEY SHORE PA 17740EXCHANGE MILLING CO., INC. BIO GENE 95 HALE ST ROCKY MOUNT VA 24151GARST SEED CO. GARST PO BOX 500 SLATER IA 50244HOFFMAN SEEDS, INC. NK BRAND PO BOX 12400 LANCASTER PA 17605-2400MID-ATLANTIC SEEDS MID-ATLANTIC 2083 SPRINGWOOD ROAD #163 YORK PA 17403MYCOGEN PLANT SCIENCES MYCOGEN 3600 N COLUMBIA PLAINVIEW TX 79072NOVARTIS SEEDS, INC. NK BRAND PO BOX 959 MINNEAPOLIS MN 55440PIONEER HI-BRED INT., INC. PIONEER BRAND 1000 W JEFFERSON ST TIPTON IN 46072SOUTHERN STATES COOP., INC. SS PO BOX 26234 RICHMOND VA 23260TERRA INDUSTRIES INC. TERRA PO BOX 6000 SIOUX CITY IA 51102-6000WILSON SEEDS, INC. WILSON PO BOX 391 HARLAN IA 51537
VIRGINIA CORN HYBRID TRIALS IN 1998Coordinated by H. Behl, D. E. Brann, and E. G. RuckerDepartment of Crop and Soil Environmental Sciences
VA Tech Blacksburg, VAOther contributors include: B. Ashburn; G. Whitley; B. Beahm; T. Custis; W.B. Wilkinson;
R.R. Wilmouth; D.E. Starner; D. Dixon; D. Danner; Scott Jessee; John Huffard; J. Wooge; T. Stanley; the Bender family;
Performance trials of commercial corn hybrids were conducted at seven locations in Virginia in 1998. Test weights are reported this yearfor the first time. These test weights were taken with a GrainGauge calibrated over two years of testing. A list of the companies participating in thetrials is shown in the table accompanying this information. All hybrids entered in the Virginia trials were those submitted by commercialcompanies. The locations at which particular hybrids were entered were specified by the company. Companies entering hybrids were charged a fee foreach hybrid per location to support the Corn Performance Trials.
All locations except Orange were planted with a Wintersteiger PlotKing 2600. Orange was planted by hand and thinned to the desiredpopulation. All locations except Orange were harvested with a Massey-Ferguson 8XP plot combine. Orange was hand harvested and shelled to obtaingrain weights. Yields have been adjusted to 15% moisture.
Yield DifferencesExperimental plots vary in yield and other measurements due to location in the field and other factors which cannot be controlled.
Statistics given in the tables are intended to help the reader make valid comparisons between hybrids. The magnitude of differences which may havebeen due to uncontrollable variation has been computed for the data and listed at the bottom of columns as the LSD (.05) (least significant differencewith 95% confidence). Differences less than the LSD are assumed not to be real differences with 95% confidence.
Choice of HybridsWhen making hybrid selections it is important to realize that hybrids differ in their performance under different environments. Some
hybrids are more adapted to a wide range of environments. Hybrid performance may vary with year and location variations in rainfall, temperature,pests and other environmental variables. In these experiments, many hybrids have essentially the same yield, and great care should be taken ininterpreting the results of a single year's tests, especially at only one location. For these reasons it is important, whenever possible, to also look at ahybrid's average across locations when making hybrid selections. Multi-year averages give even greater confidence to hybrid performance decisions.The relative yield tables compare the yield of a hybrid to the average yield of all hybrids in the test. These tables are an excellent summary of yieldpotential compared to other hybrids.
Appreciation is expressed to the Virginia Corn Check-Off Boardfor financial support of this research and the Virginia Extension
corn program.

1998 VIRGINIA CORN HYBRID PLOT INFORMATION(Rates are on a per acre basis.)
Blacksburg Whitethorne FarmPlanted: May 22, 1998Harvested: October 19, 1998Pesticide: 4.5 lb Partner® + 1.5 qt atrazine 4L + 1 lb Simtrol®
preplant incorporated May 21, 1998Fertilizer: 30-60-60 preplant incorporated May 19, 1998
150 lb N using UAN sidedressed July 1, 1998Plot Size: 2 rows 27' x 30" 3 replicationsSoil Series: HayterCooperator: J. Wooge
Blackstone Southern Piedmont Agricultural Research & Extension CenterPlanted: April 28, 1998Harvested: September 17, 1998Pesticide: 2 qt Bladex 4L + 1 qt Dual 8E/A April 29, 1998
1 pt Lannate® LV (cereal leaf beetle) June 8, 1998Fertilizer: 2 ton lime plowed under March 3, 1998
1000 lb 10-10-10 preplant incorporated April 29, 1998235 lb ammonium nitrate broadcasted June 5, 1998
Irrigation: 1.5" July 2, 8, and 15; 1" July 24Plot Size: 2 rows 27' x 30" 4 replicationsSoil Series: WedoweeCooperators: W. B. Wilkinson and R. R. Wilmouth
Holland Tidewater Agricultural Research & Extension CenterPlanted: April 27, 1998Harvested: September 18, 1998Pesticide: 1.5 pt Dual II® + 1.5 pt atrazine preplant incorporated April 24, 1998Fertilizer: 500 lb 5-10-30 March 31, 1998 + 100 units N April 24,
1998 + 100 units N using UAN + 25 lb 21-0-0-24 June 3, 1998Plot Size: 2 rows 27' x 30" 3 replicationsSoil Series: DragstonCooperators: Bobby Ashburn and Gene Whitley
Mt Holly (dry) Virginia Crop Improvement Association FarmPlanted: April 28, 1998Harvested: September 22, 1998Pesticide: 1.8 qt Bicep® 6L + 1 pt atrazine + 1 pt 2,4-D and 1 pt gramoxoneFertilizer: 60 lb N preplant incorporated +75 lb N sidedressed May 30, 1998Plot Size: 2 rows 27' x 30" 3 replicationsSoil Series: State fine sandy loamCooperator: Bruce Beahm
Mt Holly (irr) Virginia Crop Improvement Association FarmPlanted: May 16, 1998Harvested: September 23, 1998Pesticide: 1.8 qt Bicep 6L + 1 pt atrazine preplant incorporatedFertilizer: 100 lb N preplant incorporated + 100 lb N sidedressed June 2 +90 lb N sidedressed June 9Irrigation: 0.5" June 6 1.0" August 1
1.0" July 1 1.0" August 61.0" July 5 1.0" August 161.0" July 15 0.5" August 231.0" July 21
Plot Size: 2 rows 27' x 30" 4 replicationsSoil Series: State fine sandy loamCooperator: Bruce Beahm
Orange Northern Piedmont Agricultural Research & Extension CenterPlanted: May 20, 1998Harvested: October 11, 1998Pesticide: 1 qt Dual® + 2 qt Aatrex® 4L preplant incorporatedFertilizer: 1275 lb 10-10-10 April 29, 1998 + 100 lb N sidedressed June 30, 1998Plot Size: 1 row 30' x 30" 3 replicationsSoil Series: Davidson silty clayCooperators: D. E. Starner and D. Dixon
Wythe CountyPlanted: May 19, 1998Harvested: October 12, 1998Pesticide: 0.5 pt Banvel® + 1.5 pt 2,4-D May 13, 1998
2.5 pt gramoxone + 2 pt Lorsban® 4E + 2.5 qt Bicep® IIapplied May 18, 1998
Fertilizer: 6300 gal manure with an analysis of 87-124-190-33SN level was brought to 160 lb by broadcasting urea
Plot Size: 2 rows 27' x 30" 4 replicationsCooperators: David Danner, Scott Jessee, and John Huffard

Rockingham CountyPlanted: May 15, 1998Harvested: October 9, 1998Pesticide: 2.5 qt Bicep® + 1 qt Princep® + 5 oz Asana® + 1.5 pt gramoxone + 1 pt surfactant applied May 15, 1998Fertilizer: 50-40-80-20 broadcast May 15, 1998
80 lb N sidedressedPlot Size: 2 rows 27' x 30" 4 replicationsCooperators: Tom Stanley and the Bender family

Table 1. 1998 RELATIVE YIELD* of hybrids entered in three or more locations.
Very Early Maturity Mt Holly Black- Blacks- Rock-Brand Hybrid Dry Irr Holland Stone Orange Burg ingham Wythe Mean
AUGUSTA A9873 104 103 - - 132 - - - 112DOEBLERS 636XY 117 99 - - 115 109 - - 109DEKALB DK595 101 96 - - 121 - - - 105GARST 8585GLS 85 101 - - 126 - - - 104DEKALB DK591 109 99 - - 127 106 88 104 104SOUTHERN STATES 576 102 103 - - 113 - 93 - 102PIONEER BRAND 34K77 121 114 67 92 128 103 99 97 102TERRA TR1047 99 107 - 73 - 130 - - 101DEKALB DK527 123 89 - - 101 - - - 101AUGUSTA A885 90 95 58 - 131 - - - 93AUGUSTA A359 106 104 56 - 98 - - - 92
Early Maturity Mt Holly Black- Blacks- Rock-Brand Hybrid Dry Irr Holland Stone Orange Burg ingham Wythe Mean
PIONEER BRAND 3223 124 113 145 117 102 - - - 120PIONEER BRAND 33V08(Bt) 117 109 114 110 136 - - - 116NK N79-L3 103 105 124 - - 131 - - 114PIONEER BRAND 33Y09(Bt) 120 104 104 110 122 121 102 121 113MYCOGEN 7250 114 104 112 - - - - - 110AUGUSTA A9864 111 97 - - 126 - - - 110PIONEER BRAND 33G26 102 106 125 101 117 124 101 95 108PIONEER BRAND 3310 - - - 98 104 122 106 110 108AUGUSTA A6485 112 97 - - 117 - - - 108NK N7639Bt 106 103 - - - 121 100 109 107SOUTHERN STATES EXP76322 85 101 115 - 105 112 113 107 106AUGUSTA A285 114 96 - - 100 107 109 - 105SOUTHERN STATES 726 111 100 - - 102 - - - 104WILSON 1792 93 102 119 - - - - - 104NK N73-N8 - - 117 - - 104 96 100 103AUGUSTA A385 122 102 - - 89 - 102 - 103BECK'S 5405 96 99 115 - - - - - 103DEKALB DK635 98 94 - - 105 112 - - 102PIONEER BRAND 3394 102 105 98 93 109 - - - 101SOUTHERN STATES 627 112 89 - - 113 - 98 - 101DEKALB DK641 91 110 97 100 103 - - - 100TERRA TR1088 104 97 - 84 - 122 - - 100DEKALB DK626 125 100 98 87 93 103 100 - 100AUGUSTA A552 107 104 - 102 83 106 - 93 99MYCOGEN 2801 91 98 108 - - - - - 99WILSON E6018 99 94 106 - - 102 - - 99DOEBLERS 642XP 106 98 - - - - 96 - 99AUGUSTA A3364 75 101 - - 117 - - - 98DOEBLERS 636XY* - - 69 - 102 119 99 - 98SOUTHERN STATES EXP76395 107 101 - - 95 - 92 - 98PIONEER BRAND 32K61 109 100 64 94 104 112 108 95 98GARST 8464 124 89 87 86 102 - - - 97SOUTHERN STATES 767 106 89 - - 97 - - - 96SOUTHERN STATES 747 101 98 - - 88 - - - 96
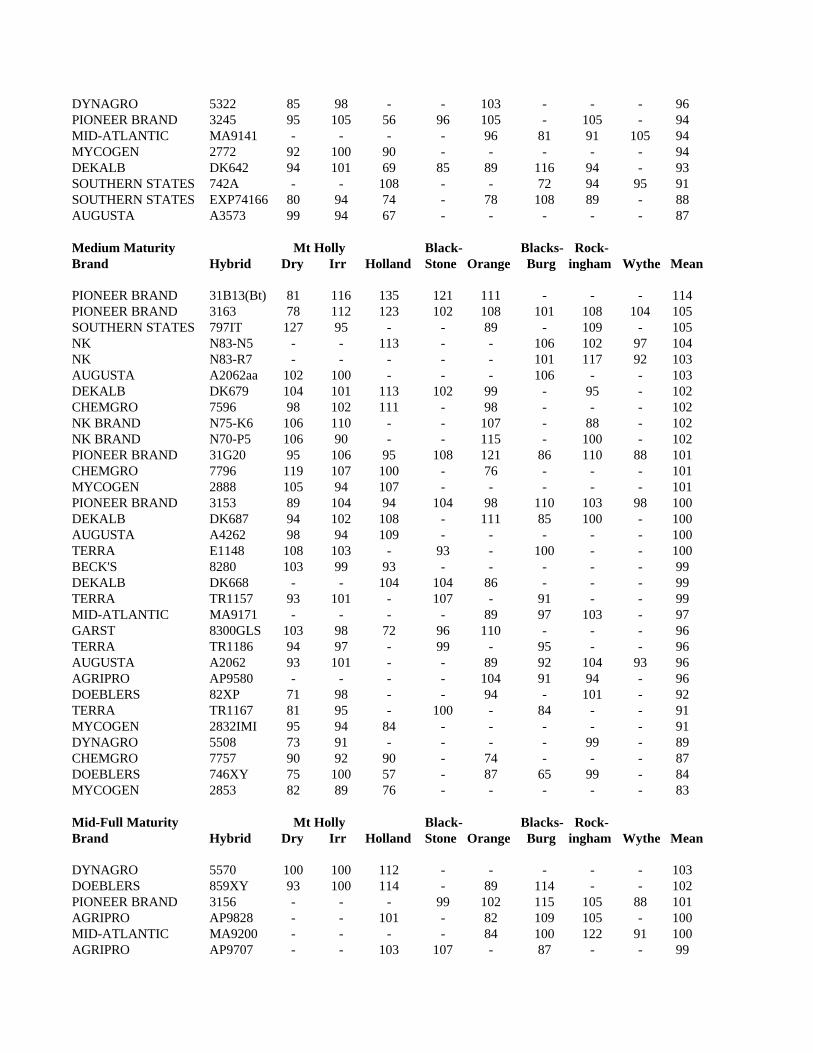
DYNAGRO 5322 85 98 - - 103 - - - 96PIONEER BRAND 3245 95 105 56 96 105 - 105 - 94MID-ATLANTIC MA9141 - - - - 96 81 91 105 94MYCOGEN 2772 92 100 90 - - - - - 94DEKALB DK642 94 101 69 85 89 116 94 - 93SOUTHERN STATES 742A - - 108 - - 72 94 95 91SOUTHERN STATES EXP74166 80 94 74 - 78 108 89 - 88AUGUSTA A3573 99 94 67 - - - - - 87
Medium Maturity Mt Holly Black- Blacks- Rock-Brand Hybrid Dry Irr Holland Stone Orange Burg ingham Wythe Mean
PIONEER BRAND 31B13(Bt) 81 116 135 121 111 - - - 114PIONEER BRAND 3163 78 112 123 102 108 101 108 104 105SOUTHERN STATES 797IT 127 95 - - 89 - 109 - 105NK N83-N5 - - 113 - - 106 102 97 104NK N83-R7 - - - - - 101 117 92 103AUGUSTA A2062aa 102 100 - - - 106 - - 103DEKALB DK679 104 101 113 102 99 - 95 - 102CHEMGRO 7596 98 102 111 - 98 - - - 102NK BRAND N75-K6 106 110 - - 107 - 88 - 102NK BRAND N70-P5 106 90 - - 115 - 100 - 102PIONEER BRAND 31G20 95 106 95 108 121 86 110 88 101CHEMGRO 7796 119 107 100 - 76 - - - 101MYCOGEN 2888 105 94 107 - - - - - 101PIONEER BRAND 3153 89 104 94 104 98 110 103 98 100DEKALB DK687 94 102 108 - 111 85 100 - 100AUGUSTA A4262 98 94 109 - - - - - 100TERRA E1148 108 103 - 93 - 100 - - 100BECK'S 8280 103 99 93 - - - - - 99DEKALB DK668 - - 104 104 86 - - - 99TERRA TR1157 93 101 - 107 - 91 - - 99MID-ATLANTIC MA9171 - - - - 89 97 103 - 97GARST 8300GLS 103 98 72 96 110 - - - 96TERRA TR1186 94 97 - 99 - 95 - - 96AUGUSTA A2062 93 101 - - 89 92 104 93 96AGRIPRO AP9580 - - - - 104 91 94 - 96DOEBLERS 82XP 71 98 - - 94 - 101 - 92TERRA TR1167 81 95 - 100 - 84 - - 91MYCOGEN 2832IMI 95 94 84 - - - - - 91DYNAGRO 5508 73 91 - - - - 99 - 89CHEMGRO 7757 90 92 90 - 74 - - - 87DOEBLERS 746XY 75 100 57 - 87 65 99 - 84MYCOGEN 2853 82 89 76 - - - - - 83
Mid-Full Maturity Mt Holly Black- Blacks- Rock-Brand Hybrid Dry Irr Holland Stone Orange Burg ingham Wythe Mean
DYNAGRO 5570 100 100 112 - - - - - 103DOEBLERS 859XY 93 100 114 - 89 114 - - 102PIONEER BRAND 3156 - - - 99 102 115 105 88 101AGRIPRO AP9828 - - 101 - 82 109 105 - 100MID-ATLANTIC MA9200 - - - - 84 100 122 91 100AGRIPRO AP9707 - - 103 107 - 87 - - 99
PIONEER BRAND 3167 - - 112 109 63 - - - 96GARST 8220 102 97 - - 76 - 106 - 96SOUTHERN STATES 849IT - - - - 71 110 101 98 96SOUTHERN STATES 943 - - - - 83 89 99 - 91MID-ATLANTIC MAX9230 - - - 99 84 88 86 - 90MID-ATLANTIC MA9201 - - - 96 89 80 92 - 90PIONEER BRAND 3082 - - 91 100 73 - - - 89SOUTHERN STATES 897 - - - - 63 99 92 - 86AGRIPRO AP9919V - - 76 - 78 97 - - 84
*Relative yield is calculated by dividing the yield of a hybrid by the average yield of all hybrids of all maturities at thatlocation. A hybrid with a relative yield of 105 was 5% above the average of all hybrids at that location. The value of 105 isnot a yield but a value relative to all other yield values at that location. Relative yields are listed in order of descendingmean values.
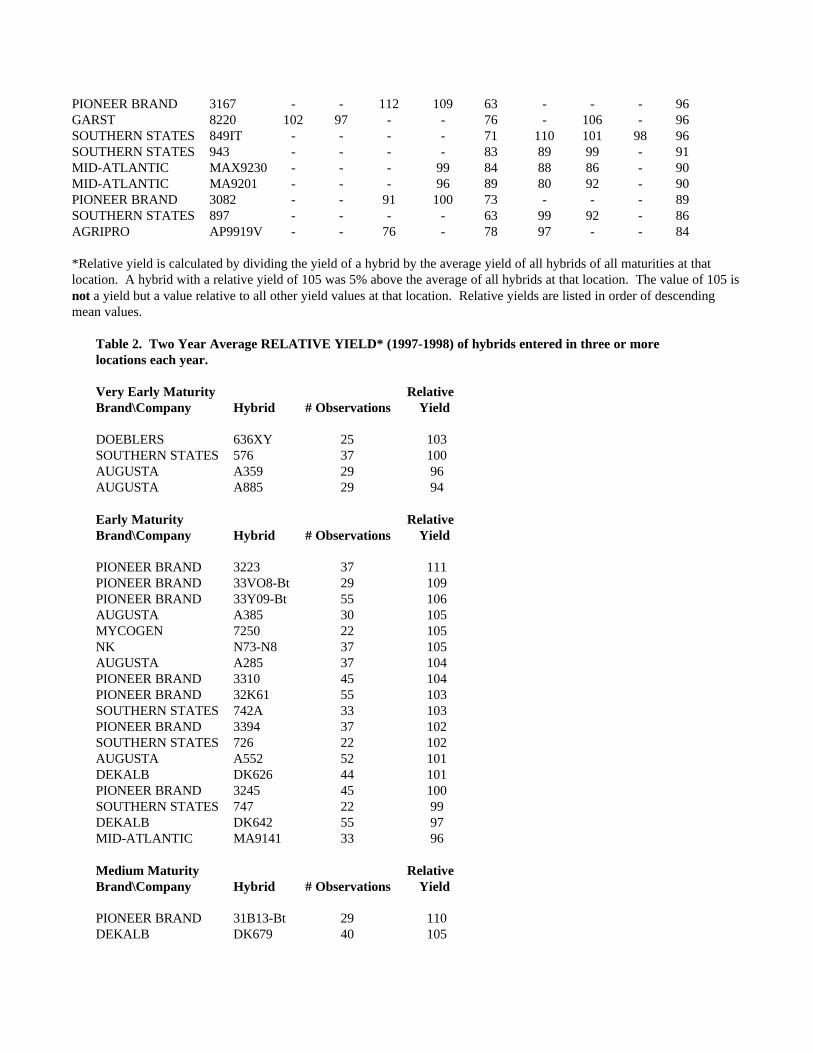
Table 2. Two Year Average RELATIVE YIELD* (1997-1998) of hybrids entered in three or morelocations each year.
Very Early Maturity RelativeBrand\Company Hybrid # Observations Yield
DOEBLERS 636XY 25 103SOUTHERN STATES 576 37 100AUGUSTA A359 29 96AUGUSTA A885 29 94
Early Maturity RelativeBrand\Company Hybrid # Observations Yield
PIONEER BRAND 3223 37 111PIONEER BRAND 33VO8-Bt 29 109PIONEER BRAND 33Y09-Bt 55 106AUGUSTA A385 30 105MYCOGEN 7250 22 105NK N73-N8 37 105AUGUSTA A285 37 104PIONEER BRAND 3310 45 104PIONEER BRAND 32K61 55 103SOUTHERN STATES 742A 33 103PIONEER BRAND 3394 37 102SOUTHERN STATES 726 22 102AUGUSTA A552 52 101DEKALB DK626 44 101PIONEER BRAND 3245 45 100SOUTHERN STATES 747 22 99DEKALB DK642 55 97MID-ATLANTIC MA9141 33 96
Medium Maturity RelativeBrand\Company Hybrid # Observations Yield
PIONEER BRAND 31B13-Bt 29 110DEKALB DK679 40 105
PIONEER BRAND 3163 63 105PIONEER BRAND 3153 63 105DEKALB DK668 30 103SOUTHERN STATES 797IT 26 103BECK'S 8280 26 102NK N83-R7 26 102DEKALB DK687 47 101TERRA TR1157 30 101AUGUSTA A2062 48 100DOEBLERS 82XP 37 98MID-ATLANTIC MA9171 29 96TERRA TR1186 26 96TERRA TR1167 30 94DOEBLERS 746XY 36 92DYNAGRO 5508 23 92
Mid-Full Maturity RelativeBrand\Company Hybrid # Observations Yield
PIONEER BRAND 3156 41 100MID-ATLANTIC MA9200 33 99PIONEER BRAND 3082 22 97SOUTHERN STATES 897 33 97SOUTHERN STATES 943 37 97
*Relative yield is calculated by dividing the yield of a hybrid by the average yield of all hybrids of all maturities atthat location. A hybrid with a relative yield of 105 was 5% above the average of all hybrids at that location. Thevalue of 105 is not a yield but a value relative to all other yield values at that location. Relative yields are listed inorder of descending mean values.
Table 3. Three Year Average RELATIVE YIELD* (1996-1998) of hybrids entered in three or morelocations each year.
Very Early Maturity RelativeBrand\Company Hybrid # Observations Yield
DOEBLERS 636XY 37 101SOUTHERN STATES 576 53 100AUGUSTA A359 37 98AUGUSTA A885 37 95
Early Maturity RelativeBrand\Company Hybrid # Observations Yield
PIONEER BRAND 3223 61 110AUGUSTA A385 38 106AUGUSTA A552 72 105NK N73-N8 49 105PIONEER BRAND 3310 69 104AUGUSTA A285 49 103PIONEER BRAND 3245 73 103PIONEER BRAND 3394 61 102SOUTHERN STATES 726 34 102DEKALB DK626 60 101DEKALB DK642 79 101MID-ATLANTIC MA9141 45 101MYCOGEN 7250 30 101SOUTHERN STATES 742A 45 101SOUTHERN STATES 747 34 99

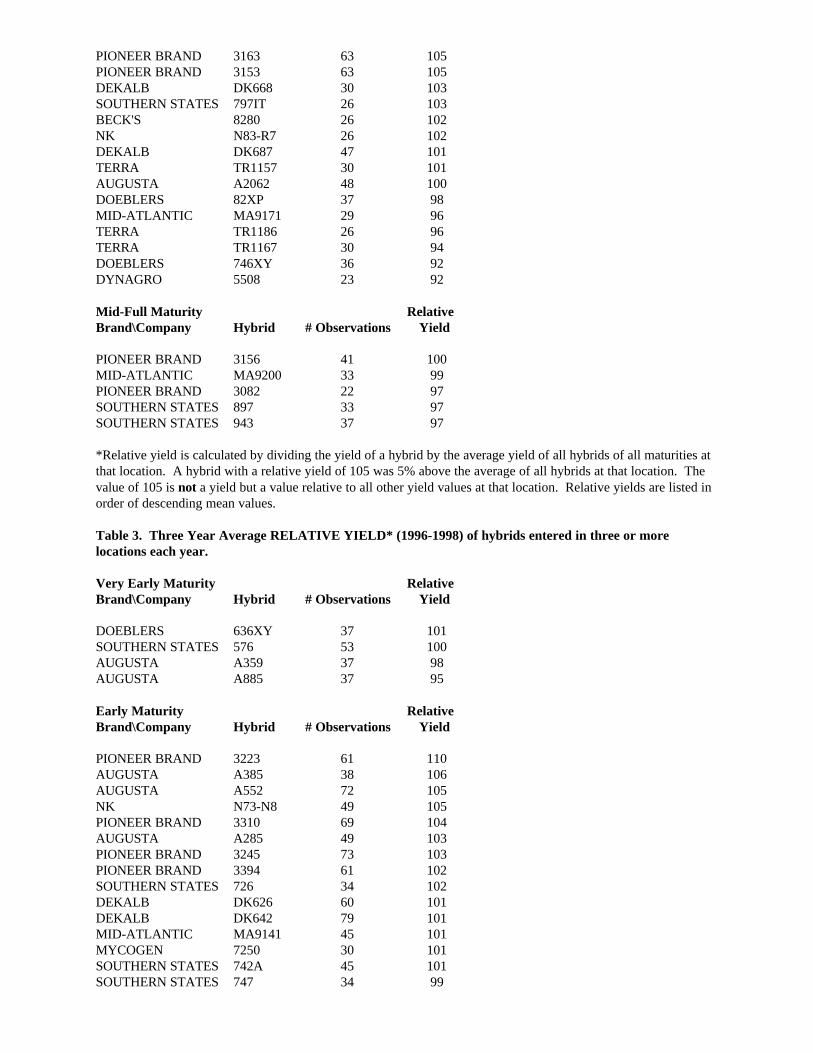
Medium Maturity RelativeBrand\Company Hybrid # Observations Yield
PIONEER BRAND 3153 87 106PIONEER BRAND 3163 95 106DEKALB DK668 46 103BECK'S 8280 46 102DEKALB DK687 59 101MID-ATLANTIC MA9171 49 101TERRA TR1157 46 101DOEBLERS 82XP 57 99TERRA TR1167 50 99DOEBLERS 746XY 52 96
Mid-Full Maturity RelativeBrand\Company Hybrid # Observations Yield
PIONEER BRAND 3082 34 101PIONEER BRAND 3156 61 100MID-ATLANTIC MA9200 53 99SOUTHERN STATES 943 65 99SOUTHERN STATES 897 53 95
*Relative yield is calculated by dividing the yield of a hybrid by the average yield of all hybrids of all maturities atthat location. A hybrid with a relative yield of 105 was 5% above the average of all hybrids at that location. Thevalue of 105 is not a yield but a value relative to all other yield values at that location. Relative yields are listed inorder of descending mean values.
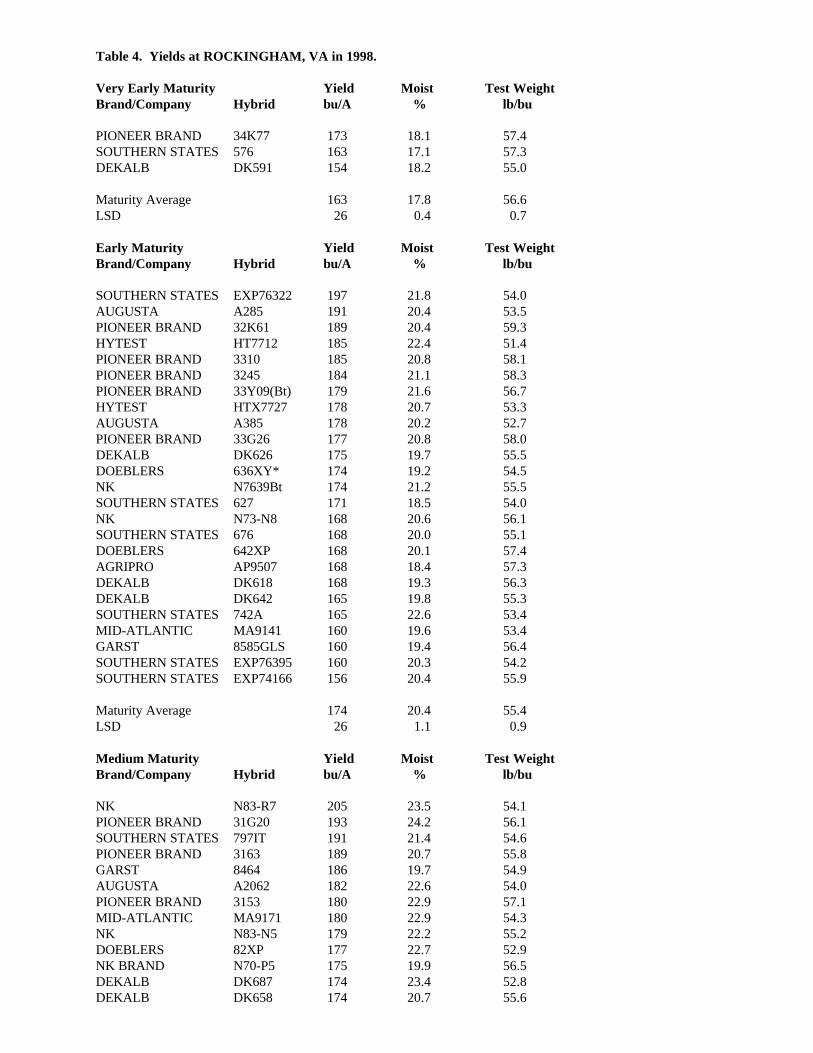
Table 4. Yields at ROCKINGHAM, VA in 1998.
Very Early Maturity Yield Moist Test WeightBrand/Company Hybrid bu/A % lb/bu
PIONEER BRAND 34K77 173 18.1 57.4SOUTHERN STATES 576 163 17.1 57.3DEKALB DK591 154 18.2 55.0
Maturity Average 163 17.8 56.6LSD 26 0.4 0.7
Early Maturity Yield Moist Test WeightBrand/Company Hybrid bu/A % lb/bu
SOUTHERN STATES EXP76322 197 21.8 54.0AUGUSTA A285 191 20.4 53.5PIONEER BRAND 32K61 189 20.4 59.3HYTEST HT7712 185 22.4 51.4PIONEER BRAND 3310 185 20.8 58.1PIONEER BRAND 3245 184 21.1 58.3PIONEER BRAND 33Y09(Bt) 179 21.6 56.7HYTEST HTX7727 178 20.7 53.3AUGUSTA A385 178 20.2 52.7PIONEER BRAND 33G26 177 20.8 58.0DEKALB DK626 175 19.7 55.5DOEBLERS 636XY* 174 19.2 54.5NK N7639Bt 174 21.2 55.5SOUTHERN STATES 627 171 18.5 54.0NK N73-N8 168 20.6 56.1SOUTHERN STATES 676 168 20.0 55.1DOEBLERS 642XP 168 20.1 57.4AGRIPRO AP9507 168 18.4 57.3DEKALB DK618 168 19.3 56.3DEKALB DK642 165 19.8 55.3SOUTHERN STATES 742A 165 22.6 53.4MID-ATLANTIC MA9141 160 19.6 53.4GARST 8585GLS 160 19.4 56.4SOUTHERN STATES EXP76395 160 20.3 54.2SOUTHERN STATES EXP74166 156 20.4 55.9
Maturity Average 174 20.4 55.4LSD 26 1.1 0.9
Medium Maturity Yield Moist Test WeightBrand/Company Hybrid bu/A % lb/bu
NK N83-R7 205 23.5 54.1PIONEER BRAND 31G20 193 24.2 56.1SOUTHERN STATES 797IT 191 21.4 54.6PIONEER BRAND 3163 189 20.7 55.8GARST 8464 186 19.7 54.9AUGUSTA A2062 182 22.6 54.0PIONEER BRAND 3153 180 22.9 57.1MID-ATLANTIC MA9171 180 22.9 54.3NK N83-N5 179 22.2 55.2DOEBLERS 82XP 177 22.7 52.9NK BRAND N70-P5 175 19.9 56.5DEKALB DK687 174 23.4 52.8DEKALB DK658 174 20.7 55.6

DYNAGRO 5508 174 20.4 52.5DOEBLERS 746XY 173 19.8 53.5AGRIPRO AP9597 170 19.3 57.2DEKALB DK679 166 22.7 54.9AGRIPRO AP9580 164 18.1 53.2DOEBLERS 858XMD 162 22.6 54.5DYNAGRO 5456 158 19.0 54.0NK BRAND N75-K6 155 21.7 56.4
Maturity Average 178 21.6 54.8LSD 22 1.5 1.1
Mid-Full Maturity Yield Moist Test WeightBrand/Company Hybrid bu/A % lb/bu
MID-ATLANTIC MA9200 214 23.8 53.9GARST 8300GLS 188 20.9 55.3GARST 8220 185 23.9 50.9PIONEER BRAND 3156 184 23.3 54.5AGRIPRO AP9828 184 24.1 53.4SOUTHERN STATES 849IT 176 22.5 50.3SOUTHERN STATES 943 173 22.8 51.4SOUTHERN STATES 897 161 22.8 52.3MID-ATLANTIC MA9201 161 24.9 52.3MID-ATLANTIC MAX9230 151 23.9 50.0
Maturity Average 178 23.3 52.4LSD 21 1.6 2.6
Location Average 175 21.2 54.8
Table 5. Two year average yield at ROCKINGHAM, VA in 1997 and 1998.
Very Early Maturity Yield MoistBrand/Company Hybrid bu/A %
SOUTHERN STATES 576 147 17.9
Early Maturity Yield MoistBrand/Company Hybrid bu/A %
PIONEER BRAND 32K61 166 22.5PIONEER BRAND 33Y09-Bt 165 22.5PIONEER BRAND 3310 165 21.7AUGUSTA A385 162 21.0AUGUSTA A285 162 20.7DEKALB DK626 159 20.6SOUTHERN STATES 742A 157 25.4DEKALB DK642 157 21.2NK N73-N8 152 21.2PIONEER BRAND 3245 149 21.5MID-ATLANTIC MA9141 140 20.7
Maturity Average 158 21.7LSD (0.05) 15 1.0
Medium Maturity Yield MoistBrand/Company Hybrid bu/A %
NK N83-R7 170 25.3
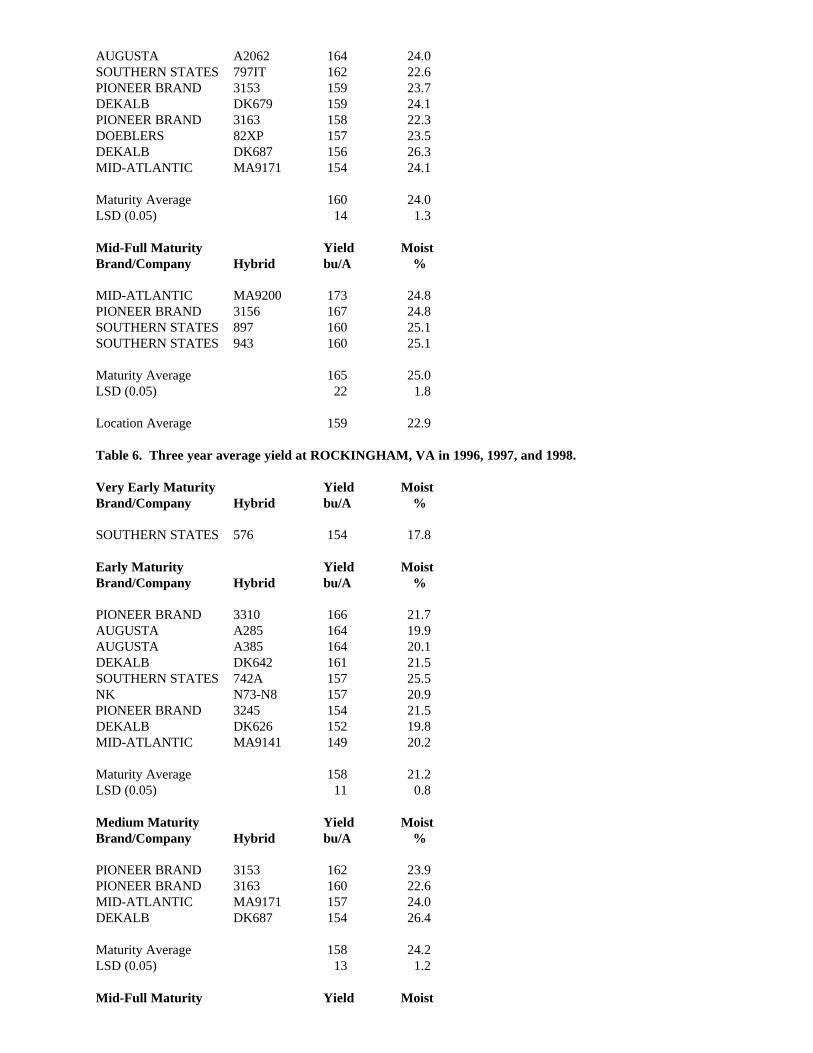
AUGUSTA A2062 164 24.0SOUTHERN STATES 797IT 162 22.6PIONEER BRAND 3153 159 23.7DEKALB DK679 159 24.1PIONEER BRAND 3163 158 22.3DOEBLERS 82XP 157 23.5DEKALB DK687 156 26.3MID-ATLANTIC MA9171 154 24.1
Maturity Average 160 24.0LSD (0.05) 14 1.3
Mid-Full Maturity Yield MoistBrand/Company Hybrid bu/A %
MID-ATLANTIC MA9200 173 24.8PIONEER BRAND 3156 167 24.8SOUTHERN STATES 897 160 25.1SOUTHERN STATES 943 160 25.1
Maturity Average 165 25.0LSD (0.05) 22 1.8
Location Average 159 22.9
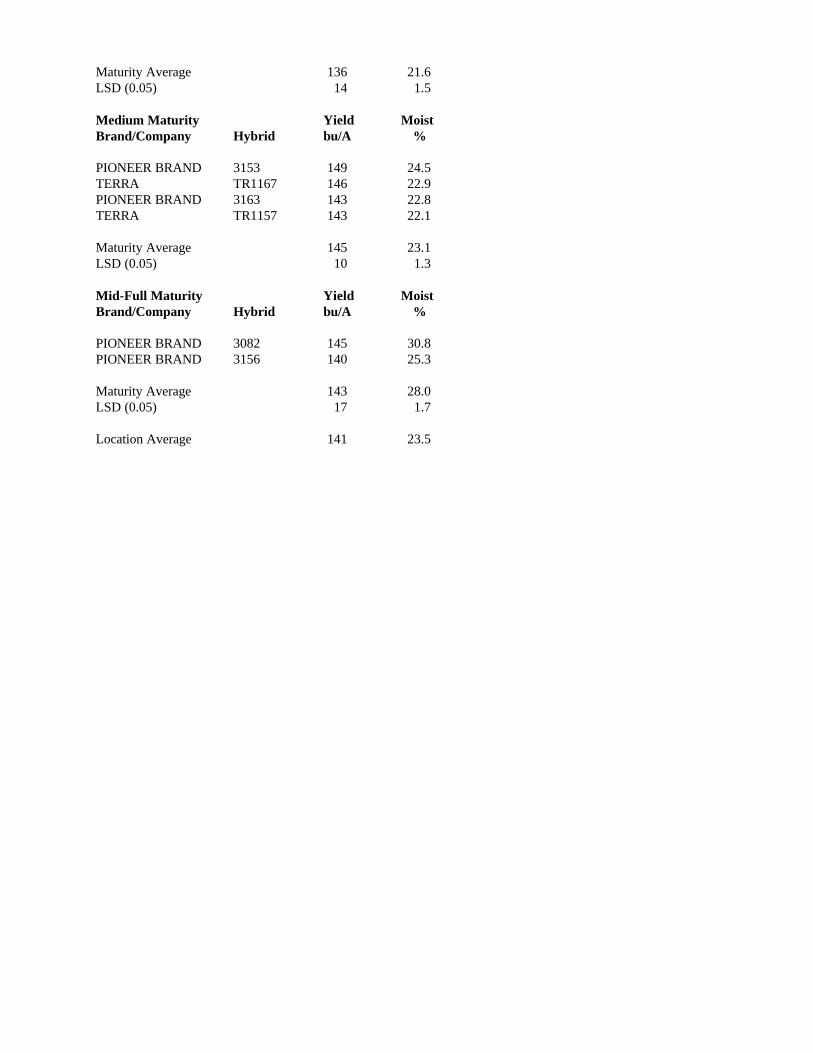
Table 6. Three year average yield at ROCKINGHAM, VA in 1996, 1997, and 1998.
Very Early Maturity Yield MoistBrand/Company Hybrid bu/A %
SOUTHERN STATES 576 154 17.8
Early Maturity Yield MoistBrand/Company Hybrid bu/A %
PIONEER BRAND 3310 166 21.7AUGUSTA A285 164 19.9AUGUSTA A385 164 20.1DEKALB DK642 161 21.5SOUTHERN STATES 742A 157 25.5NK N73-N8 157 20.9PIONEER BRAND 3245 154 21.5DEKALB DK626 152 19.8MID-ATLANTIC MA9141 149 20.2
Maturity Average 158 21.2LSD (0.05) 11 0.8
Medium Maturity Yield MoistBrand/Company Hybrid bu/A %
PIONEER BRAND 3153 162 23.9PIONEER BRAND 3163 160 22.6MID-ATLANTIC MA9171 157 24.0DEKALB DK687 154 26.4
Maturity Average 158 24.2LSD (0.05) 13 1.2
Mid-Full Maturity Yield Moist
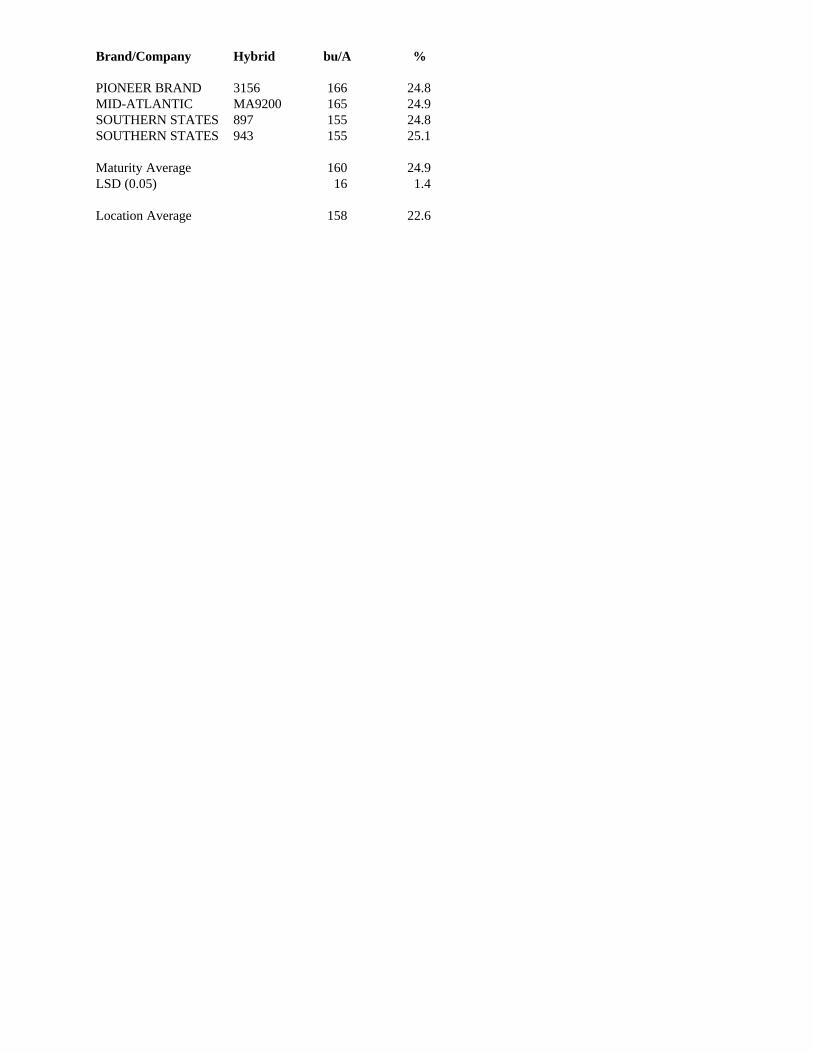
Brand/Company Hybrid bu/A %
PIONEER BRAND 3156 166 24.8MID-ATLANTIC MA9200 165 24.9SOUTHERN STATES 897 155 24.8SOUTHERN STATES 943 155 25.1
Maturity Average 160 24.9LSD (0.05) 16 1.4
Location Average 158 22.6

Table 7. Yields at BLACKSBURG, VA in 1998.
Very Early Maturity Yield Moist Test WeightBrand/Company Hybrid bu/A % lb/bu
TERRA TR1047 205 17.5 54.1DOEBLERS 636XY 172 20.1 52.8DEKALB DK591 167 19.9 52.2PIONEER BRAND 34K77 163 19.1 54.8
Maturity Average 177 19.1 53.4LSD 32 1.0 1.3
Early Maturity Yield Moist Test WeightBrand/Company Hybrid bu/A % lb/bu
NK N79-L3 207 24.6 55.1PIONEER BRAND 33G26 196 22.6 55.3PIONEER BRAND 3310 194 21.7 54.4TERRA TR1088 193 19.3 51.5NK N7639Bt 192 24.0 52.7PIONEER BRAND 33Y09(Bt) 191 20.1 56.0DOEBLERS 636XY 188 19.6 51.7DEKALB DK642 183 20.6 52.6SOUTHERN STATES EXP76322 178 20.3 52.6PIONEER BRAND 32K61 177 20.6 55.6DEKALB DK635 176 20.6 54.3SOUTHERN STATES EXP74166 170 21.8 53.2AUGUSTA A285 168 20.8 51.8AUGUSTA A552 168 25.0 51.6NK N73-N8 165 22.1 52.3DEKALB DK626 163 21.5 51.7DEKALB DK618 162 19.6 53.1WILSON E6018 161 20.4 54.3AGRIPRO AP9507 156 19.5 54.7BIO GENE 312 152 22.1 50.9MID-ATLANTIC MA9141 128 23.4 50.6SOUTHERN STATES 742A 114 23.0 52.1
Maturity Average 172 21.5 53.1LSD 28 1.9 1.7
Medium Maturity Yield Moist Test WeightBrand/Company Hybrid bu/A % lb/bu
PIONEER BRAND 3153 174 23.9 54.4AUGUSTA A2062aa 167 22.1 52.1BIO GENE 407 167 24.5 53.0NK N83-N5 167 22.8 53.3AGRIPRO AP9597 163 20.4 53.7DOEBLERS 859XY 160 24.0 53.3PIONEER BRAND 3163 160 24.0 52.9NK N83-R7 159 26.2 52.0TERRA E1148 158 19.9 53.4MID-ATLANTIC MA9171 154 22.9 53.9BIO GENE 500 151 21.8 50.9TERRA TR1186 149 26.5 52.2BIO GENE 408 148 22.9 50.1AUGUSTA A2062 146 22.7 53.7AGRIPRO AP9580 144 18.5 50.4

TERRA TR1157 144 22.1 50.2PIONEER BRAND 31G20 136 25.6 54.5DEKALB DK687 135 27.0 52.4TERRA TR1167 133 22.2 52.1DEKALB DK658 121 19.8 52.8MID-ATLANTIC MAX9173 115 23.8 50.2MID-ATLANTIC MAX9182 103 21.7 53.3DOEBLERS 746XY 102 22.0 51.2BIO GENE 417 83 22.7 52.1
Maturity Average 144 23.0 52.5LSD 36 1.7 1.2
Mid-Full Maturity Yield Moist Test WeightBrand/Company Hybrid bu/A % lb/bu
PIONEER BRAND 3156 182 23.7 53.4DOEBLERS 859XY 180 23.7 53.0SOUTHERN STATES 849IT 175 27.9 49.7AGRIPRO AP9828 172 22.1 53.8HYTEST BH4924 164 21.9 53.9DEKALB DK743 160 28.1 51.7MID-ATLANTIC MA9200 158 28.5 49.7SOUTHERN STATES 897 157 24.3 50.2AGRIPRO AP9919V 154 24.4 51.3SOUTHERN STATES 943 141 30.5 49.4MID-ATLANTIC MAX9230 139 25.1 50.4AGRIPRO AP9707 137 25.2 52.6MID-ATLANTIC MA9201 126 28.7 52.4
Maturity Average 157 25.7 51.6LSD 34 3.1 0.8
Location Average 158 22.8 52.6
Table 8. Two year average yield at BLACKSBURG, VA in 1997 and 1998.
Early Maturity Yield MoistBrand/Company Hybrid bu/A %
PIONEER BRAND 3310 167 21.6PIONEER BRAND 33Y09-Bt 166 20.6DEKALB DK642 159 20.7PIONEER BRAND 32K61 158 21.2NK N73-N8 157 21.2AUGUSTA A285 154 19.7AUGUSTA A552 152 24.2SOUTHERN STATES 742A 141 23.6MID-ATLANTIC MA9141 132 21.9Maturity Average 154 21.6LSD (0.05) 24 1.2
Medium Maturity Yield MoistBrand/Company Hybrid bu/A %
PIONEER BRAND 3153 166 23.8PIONEER BRAND 3163 149 22.4TERRA TR1157 147 22.5AUGUSTA A2062 142 23.6NK N83-R7 139 25.0

TERRA TR1167 136 23.2MID-ATLANTIC MA9171 132 23.6TERRA TR1186 132 22.7DEKALB DK687 129 27.3DOEBLERS 746XY 128 21.2
Maturity Average 140 23.5LSD (0.05) 31 1.6
Mid-Full Maturity Yield MoistBrand/Company Hybrid bu/A %
PIONEER BRAND 3156 140 24.0MID-ATLANTIC MA9200 140 26.7SOUTHERN STATES 897 140 24.2SOUTHERN STATES 943 134 28.1
Maturity Average 138 25.8LSD (0.05) 17 2.6
Location Average 145 23.2
Table 9. Three year average yield at BLACKSBURG, VA in 1996, 1997, and 1998.
Early Maturity Yield MoistBrand/Company Hybrid bu/A %
DEKALB DK642 174 22.6PIONEER BRAND 3310 172 22.8NK N73-N8 171 23.7AUGUSTA A552 169 26.3MID-ATLANTIC MA9141 168 23.1SOUTHERN STATES 742A 145 26.5
Maturity Average 167 24.1LSD (0.05) 22 1.4
Medium Maturity Yield MoistBrand/Company Hybrid bu/A %
PIONEER BRAND 3153 177 25.7PIONEER BRAND 3163 162 25.6TERRA TR1157 156 24.0MID-ATLANTIC MA9171 156 25.7TERRA TR1167 152 24.5DOEBLERS 746XY 151 22.9DEKALB DK687 144 29.7
Maturity Average 157 25.4LSD (0.05) 26 1.6
Mid-Full Maturity Yield MoistBrand/Company Hybrid bu/A %
MID-ATLANTIC MA9200 170 29.2PIONEER BRAND 3156 155 26.6SOUTHERN STATES 943 153 29.9SOUTHERN STATES 897 145 27.2
Maturity Average 156 28.1

LSD (0.05) 23 1.9
Location Average 160 25.5

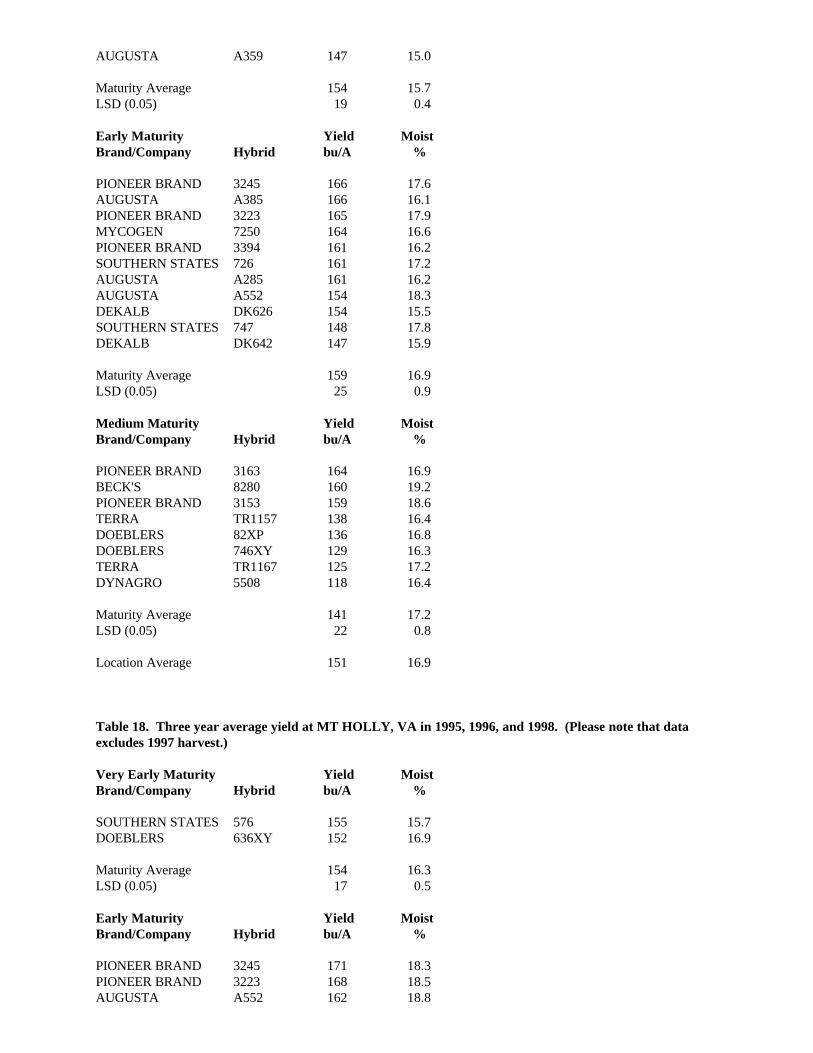
Table 10. Yields at BLACKSTONE, VA in 1998.
Very Early Maturity Yield Moist Test WeightBrand/Company Hybrid bu/A % lb/bu
PIONEER BRAND 34K77 130 16.8 60.6TERRA TR1047 104 15.1 58.3
Maturity Average 117 15.9 59.4LSD 53 0.6 1.1
Early Maturity Yield Moist Test WeightBrand/Company Hybrid bu/A % lb/bu
PIONEER BRAND 3223 167 18.1 58.8PIONEER BRAND 33Y09(Bt) 157 17.3 60.1PIONEER BRAND 33V08(Bt) 156 17.2 61.0AUGUSTA A552 144 17.8 56.9PIONEER BRAND 33G26 144 17.4 60.4DEKALB DK641 142 15.6 58.8PIONEER BRAND 3310 139 17.6 59.7PIONEER BRAND 3245 136 18.3 59.7PIONEER BRAND 32K61 134 17.8 61.3PIONEER BRAND 3394 131 16.7 59.9DEKALB DK626 123 15.2 58.9GARST 8464 122 17.7 58.0DEKALB DK642 120 15.9 58.1TERRA TR1088 119 13.8 55.1
Maturity Average 138 16.9 59.0LSD 22 0.8 1.4
Medium Maturity Yield Moist Test WeightBrand/Company Hybrid bu/A % lb/bu
PIONEER BRAND 31B13(Bt) 172 19.2 58.7PIONEER BRAND 31G20 153 19.4 59.4TERRA TR1157 152 17.7 56.0DEKALB DK668 148 17.9 58.0PIONEER BRAND 3153 147 19.1 59.6DEKALB DK679 145 17.6 59.3PIONEER BRAND 3163 144 18.4 58.5TERRA TR1186 141 20.3 57.8TERRA TR1167 141 17.8 55.1GARST 8220 137 19.4 53.1GARST 8300GLS 136 18.0 58.5TERRA E1148 132 15.4 58.6
Maturity Average 146 18.3 57.7LSD 18 0.6 2.5
Mid-Full Maturity Yield Moist Test WeightBrand/Company Hybrid bu/A % lb/bu
AGRIPRO HS9843 162 15.8 58.5PIONEER BRAND 3167 154 21.3 56.1DEKALB DK743 153 19.8 56.0AGRIPRO AP9707 152 16.9 58.3PIONEER BRAND 3082 142 24.6 57.4MID-ATLANTIC MAX9230 141 20.1 54.8

PIONEER BRAND 3156 140 18.9 59.3MID-ATLANTIC MA9201 136 19.4 56.1
Maturity Average 147 19.6 57.1LSD 17 1.8 0.9
Location Average 142 17.9 58.1
Table 11. Two year average yield at BLACKSTONE, VA in 1997 and 1998.
Early Maturity Yield MoistBrand/Company Hybrid bu/A %
PIONEER BRAND 3223 147 20.8PIONEER BRAND 33VO8-Bt 139 19.1AUGUSTA A552 136 20.7PIONEER BRAND 32K61 131 20.8PIONEER BRAND 33Y09-Bt 130 23.8PIONEER BRAND 3245 127 21.4PIONEER BRAND 3310 123 21.2PIONEER BRAND 3394 119 18.7
Maturity Average 131 20.8LSD (0.05) 13 2.2
Medium Maturity Yield MoistBrand/Company Hybrid bu/A %
PIONEER BRAND 31B13-Bt 148 23.7DEKALB DK668 146 22.0TERRA TR1157 143 21.6PIONEER BRAND 3153 142 23.7TERRA TR1167 133 23.1PIONEER BRAND 3163 129 22.0TERRA TR1186 124 22.8
Maturity Average 138 22.7LSD (0.05) 11 2.3
Mid-Full Maturity Yield MoistBrand/Company Hybrid bu/A %
PIONEER BRAND 3156 140 25.1PIONEER BRAND 3082 138 29.5
Maturity Average 139 27.3LSD (0.05) 21 2.5
Location Average 135 22.4
Table 12. Three year average yield at BLACKSTONE, VA in 1996, 1997, and 1998.
Early Maturity Yield MoistBrand/Company Hybrid bu/A %
PIONEER BRAND 3223 152 21.4PIONEER BRAND 3245 132 23.1PIONEER BRAND 3310 132 22.1PIONEER BRAND 3394 127 19.5
Maturity Average 136 21.6LSD (0.05) 14 1.5
Medium Maturity Yield MoistBrand/Company Hybrid bu/A %
PIONEER BRAND 3153 149 24.5TERRA TR1167 146 22.9PIONEER BRAND 3163 143 22.8TERRA TR1157 143 22.1
Maturity Average 145 23.1LSD (0.05) 10 1.3
Mid-Full Maturity Yield MoistBrand/Company Hybrid bu/A %
PIONEER BRAND 3082 145 30.8PIONEER BRAND 3156 140 25.3
Maturity Average 143 28.0LSD (0.05) 17 1.7
Location Average 141 23.5

Table 13. Yields at HOLLAND, VA in 1998.
Very Early Maturity Yield Moist Test WeightBrand/Company Hybrid bu/A % lb/bu
PIONEER BRAND 34K77 74 16.7 51.7AUGUSTA A885 65 15.5 51.7AUGUSTA A359 62 15.7 50.2
Maturity Average 67 15.9 51.2LSD 7 1.8 2.6
Early Maturity Yield Moist Test WeightBrand/Company Hybrid bu/A % lb/bu
PIONEER BRAND 3223 160 18.1 55.3HYTEST HT7712 158 21.1 49.2BECK'S 6580 157 17.1 55.8HYPERFORMER HY9646 140 16.8 53.2PIONEER BRAND 33G26 139 16.4 54.4NK N79-L3 137 19.3 58.3WILSON 1792 132 17.1 55.5NK N73-N8 129 17.0 52.4SOUTHERN STATES EXP76322 128 16.2 53.3BECK'S 5405 128 16.3 53.8PIONEER BRAND 33V08(Bt) 126 17.4 56.1MYCOGEN 7250 125 16.8 55.2SOUTHERN STATES 742A 120 16.3 53.4MYCOGEN 2801 120 16.3 51.5HYTEST HTX7727 119 15.6 54.6WILSON E6018 118 16.1 55.8PIONEER BRAND 33Y09(Bt) 116 17.7 54.5HYTEST HTX7610 111 16.0 52.2DEKALB DK626 109 16.2 52.8PIONEER BRAND 3394 109 16.9 56.4DEKALB DK641 108 16.0 53.7MYCOGEN 2772 100 15.2 52.7GARST 8464 97 16.6 51.5AGRIPRO AP9616 94 15.3 51.2SOUTHERN STATES EXP74166 83 16.7 55.0DOEBLERS 636XY 77 15.4 51.0DEKALB DK642 77 18.1 53.1AUGUSTA A3573 74 13.3 48.1PIONEER BRAND 32K61 71 17.6 51.4PIONEER BRAND 3245 62 19.4 55.0
Maturity Average 114 16.8 53.5LSD 48 1.4 2.6
Medium Maturity Yield Moist Test WeightBrand/Company Hybrid bu/A % lb/bu
PIONEER BRAND 31B13(Bt) 150 18.9 54.0HYTEST HT7748 145 17.1 54.9AGRIPRO AP9909 144 19.0 55.3PIONEER BRAND 3163 136 18.4 52.7NK N83-N5 126 18.2 55.7DEKALB DK679 126 17.3 56.1CHEMGRO 7596 124 16.7 52.5HYPERFORMER HY9899V 124 20.3 52.1
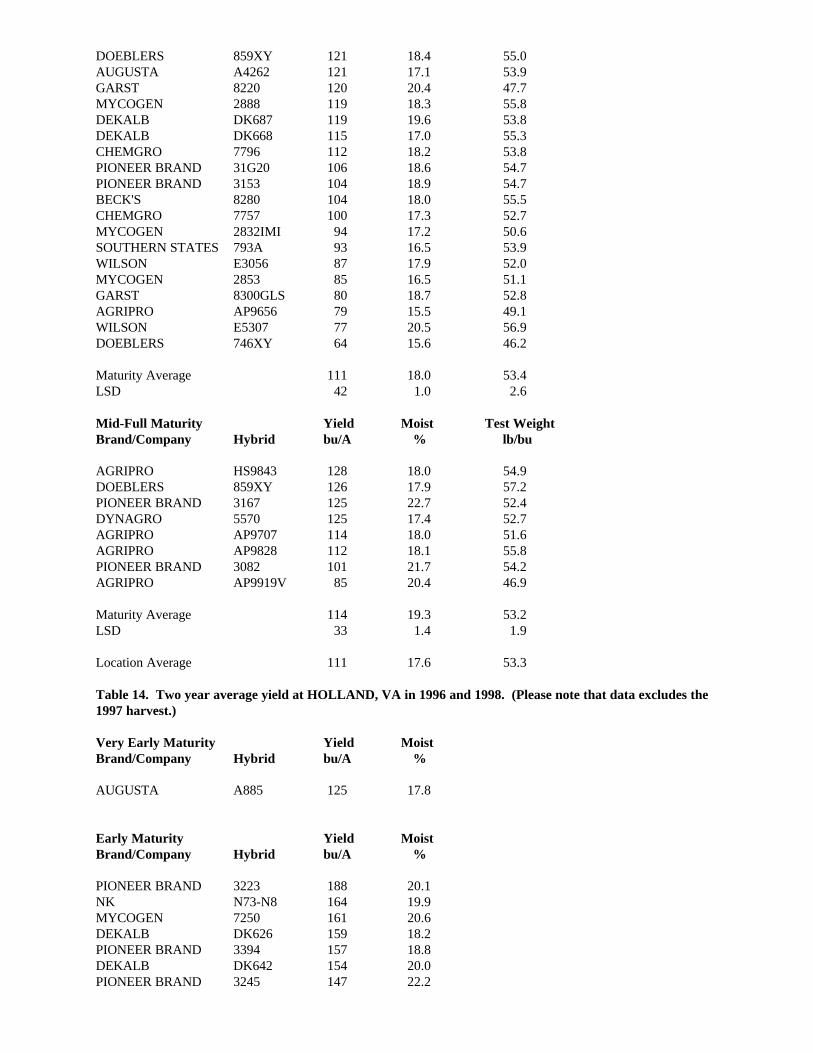
DOEBLERS 859XY 121 18.4 55.0AUGUSTA A4262 121 17.1 53.9GARST 8220 120 20.4 47.7MYCOGEN 2888 119 18.3 55.8DEKALB DK687 119 19.6 53.8DEKALB DK668 115 17.0 55.3CHEMGRO 7796 112 18.2 53.8PIONEER BRAND 31G20 106 18.6 54.7PIONEER BRAND 3153 104 18.9 54.7BECK'S 8280 104 18.0 55.5CHEMGRO 7757 100 17.3 52.7MYCOGEN 2832IMI 94 17.2 50.6SOUTHERN STATES 793A 93 16.5 53.9WILSON E3056 87 17.9 52.0MYCOGEN 2853 85 16.5 51.1GARST 8300GLS 80 18.7 52.8AGRIPRO AP9656 79 15.5 49.1WILSON E5307 77 20.5 56.9DOEBLERS 746XY 64 15.6 46.2
Maturity Average 111 18.0 53.4LSD 42 1.0 2.6
Mid-Full Maturity Yield Moist Test WeightBrand/Company Hybrid bu/A % lb/bu
AGRIPRO HS9843 128 18.0 54.9DOEBLERS 859XY 126 17.9 57.2PIONEER BRAND 3167 125 22.7 52.4DYNAGRO 5570 125 17.4 52.7AGRIPRO AP9707 114 18.0 51.6AGRIPRO AP9828 112 18.1 55.8PIONEER BRAND 3082 101 21.7 54.2AGRIPRO AP9919V 85 20.4 46.9
Maturity Average 114 19.3 53.2LSD 33 1.4 1.9
Location Average 111 17.6 53.3
Table 14. Two year average yield at HOLLAND, VA in 1996 and 1998. (Please note that data excludes the1997 harvest.)
Very Early Maturity Yield MoistBrand/Company Hybrid bu/A %
AUGUSTA A885 125 17.8
Early Maturity Yield MoistBrand/Company Hybrid bu/A %
PIONEER BRAND 3223 188 20.1NK N73-N8 164 19.9MYCOGEN 7250 161 20.6DEKALB DK626 159 18.2PIONEER BRAND 3394 157 18.8DEKALB DK642 154 20.0PIONEER BRAND 3245 147 22.2
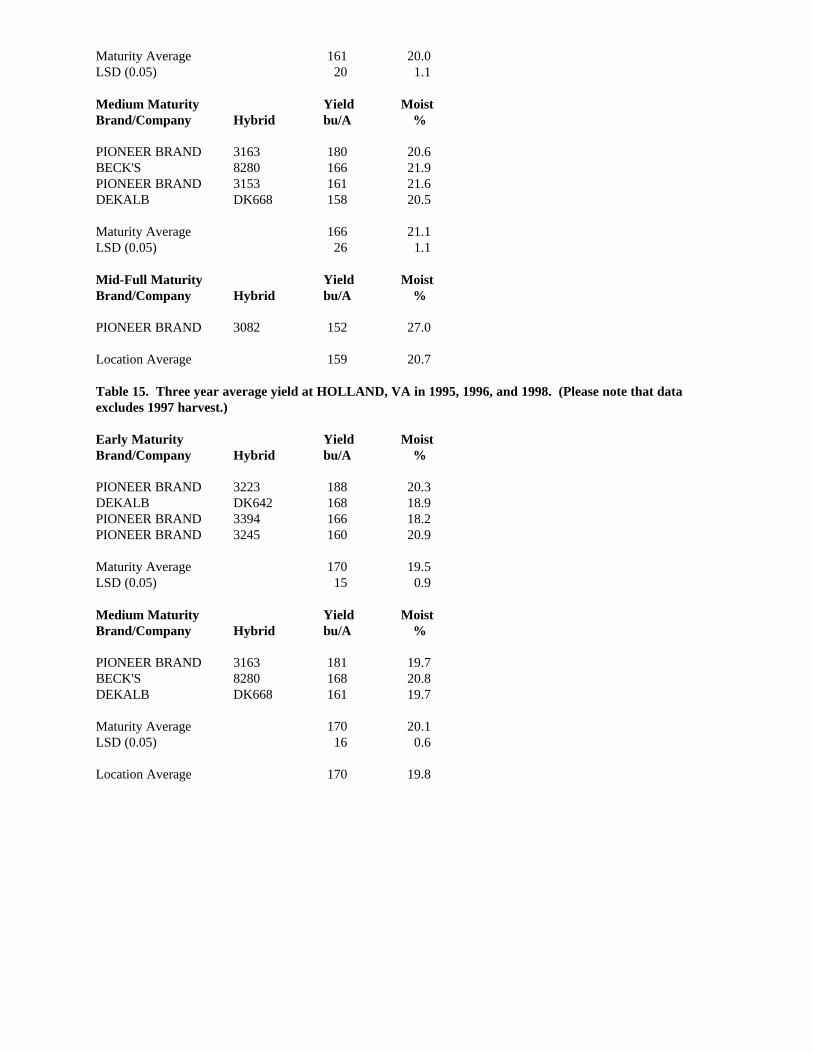
Maturity Average 161 20.0LSD (0.05) 20 1.1
Medium Maturity Yield MoistBrand/Company Hybrid bu/A %
PIONEER BRAND 3163 180 20.6BECK'S 8280 166 21.9PIONEER BRAND 3153 161 21.6DEKALB DK668 158 20.5
Maturity Average 166 21.1LSD (0.05) 26 1.1
Mid-Full Maturity Yield MoistBrand/Company Hybrid bu/A %
PIONEER BRAND 3082 152 27.0
Location Average 159 20.7
Table 15. Three year average yield at HOLLAND, VA in 1995, 1996, and 1998. (Please note that dataexcludes 1997 harvest.)
Early Maturity Yield MoistBrand/Company Hybrid bu/A %
PIONEER BRAND 3223 188 20.3DEKALB DK642 168 18.9PIONEER BRAND 3394 166 18.2PIONEER BRAND 3245 160 20.9
Maturity Average 170 19.5LSD (0.05) 15 0.9
Medium Maturity Yield MoistBrand/Company Hybrid bu/A %
PIONEER BRAND 3163 181 19.7BECK'S 8280 168 20.8DEKALB DK668 161 19.7
Maturity Average 170 20.1LSD (0.05) 16 0.6
Location Average 170 19.8

Table 16. Yields at MT HOLLY, VA in 1998.
Very Early Maturity Yield Moist Test WeightBrand/Company Hybrid bu/A % lb/bu
DEKALB DK527 161 11.6 57.6PIONEER BRAND 34K77 159 13.8 60.5DOEBLERS 636XY 154 13.4 58.8SOUTHERN STATES 598IT 148 11.8 57.1DEKALB DK591 143 12.4 57.2AUGUSTA A359 139 11.7 55.5AUGUSTA A9873 136 11.9 57.6SOUTHERN STATES 576 134 11.3 57.0DEKALB DK595 132 10.9 55.8TERRA TR1047 130 11.1 56.1AUGUSTA A885 117 12.7 58.5GARST 8585GLS 111 12.1 58.5
Maturity Average 138 12.1 57.4LSD 48 1.4 2.0
Early Maturity Yield Moist Test WeightBrand/Company Hybrid bu/A % lb/bu
DEKALB DK626 163 11.7 57.1GARST 8464 162 12.7 56.3PIONEER BRAND 3223 162 14.6 58.2AUGUSTA A385 160 13.1 55.8PIONEER BRAND 33Y09(Bt) 158 14.0 59.9PIONEER BRAND 33V08(Bt) 153 13.1 58.4AUGUSTA A285 150 12.3 57.7MYCOGEN 7250 149 12.7 58.3AUGUSTA A6485 147 13.2 57.9SOUTHERN STATES 627 147 11.5 54.1AUGUSTA A9864 145 13.6 59.4SOUTHERN STATES 726 145 12.9 58.0PIONEER BRAND 32K61 143 13.7 60.7SOUTHERN STATES EXP76007 142 12.3 55.8SOUTHERN STATES EXP76395 140 12.8 56.8AUGUSTA A552 140 13.9 58.2NK N7639Bt 139 14.5 60.3SOUTHERN STATES 767 138 12.8 58.0DOEBLERS 642XP 138 14.1 60.7TERRA TR1088 137 11.2 55.4NK N79-L3 135 15.3 62.3PIONEER BRAND 33G26 134 13.1 58.6PIONEER BRAND 3394 133 13.4 59.3SOUTHERN STATES 747 132 13.7 58.3WILSON E6018 130 13.8 58.6AUGUSTA A3573 129 12.2 55.7DEKALB DK635 128 12.6 56.7BECK'S 5405 125 10.8 55.5PIONEER BRAND 3245 124 13.5 61.1DEKALB DK642 123 12.0 56.7WILSON 1792 122 12.9 57.8MYCOGEN 2801 120 12.2 57.3MYCOGEN 2772 120 12.3 56.8DEKALB DK641 119 11.8 57.3DYNAGRO 5322 112 11.0 55.3SOUTHERN STATES EXP76322 111 11.8 57.6
SOUTHERN STATES EXP74166 105 13.1 57.8AUGUSTA A3364 98 12.6 58.3
Maturity Average 136 12.9 57.8LSD 42 1.6 1.7
Medium Maturity Yield Moist Test WeightBrand/Company Hybrid bu/A % lb/bu
SOUTHERN STATES 797IT 166 13.7 59.9CHEMGRO 7796 155 13.1 58.5TERRA E1148 142 12.3 57.3NK BRAND N75-K6 139 13.2 60.3NK BRAND N70-P5 139 13.8 59.3MYCOGEN 2888 138 12.6 58.3DEKALB DK679 136 13.0 60.2BECK'S 8280 136 14.9 59.9GARST 8300GLS 135 13.1 58.6AUGUSTA A2062aa 134 13.1 58.0CHEMGRO 7596 128 11.1 56.0AUGUSTA A4262 128 13.5 56.4MYCOGEN 2832IMI 124 13.3 58.0PIONEER BRAND 31G20 124 14.9 60.4DEKALB DK687 123 14.3 58.4TERRA TR1186 123 13.2 60.4AUGUSTA A2062 122 14.0 57.8TERRA TR1157 122 11.4 55.3AUGUSTA A3564 118 12.6 54.9CHEMGRO 7757 117 12.7 56.4PIONEER BRAND 3153 116 13.7 61.0MYCOGEN 2853 107 12.6 57.2TERRA TR1167 107 12.6 57.4PIONEER BRAND 31B13(Bt) 106 14.2 59.0PIONEER BRAND 3163 102 12.0 57.8DOEBLERS 746XY 99 12.0 55.7DYNAGRO 5508 95 11.3 55.6DOEBLERS 82XP 94 11.9 57.5
Maturity Average 123 13.1 58.1LSD 42 1.6 2.0
Mid-Full Maturity Yield Moist Test WeightBrand/Company Hybrid bu/A % lb/bu
GARST 8220 134 14.5 55.6DYNAGRO 5570 131 12.6 55.6DOEBLERS 859XY 122 15.8 59.6Maturity Average 129 14.3 56.9LSD 28 3.4 2.0
Location Average 131 12.9 57.8
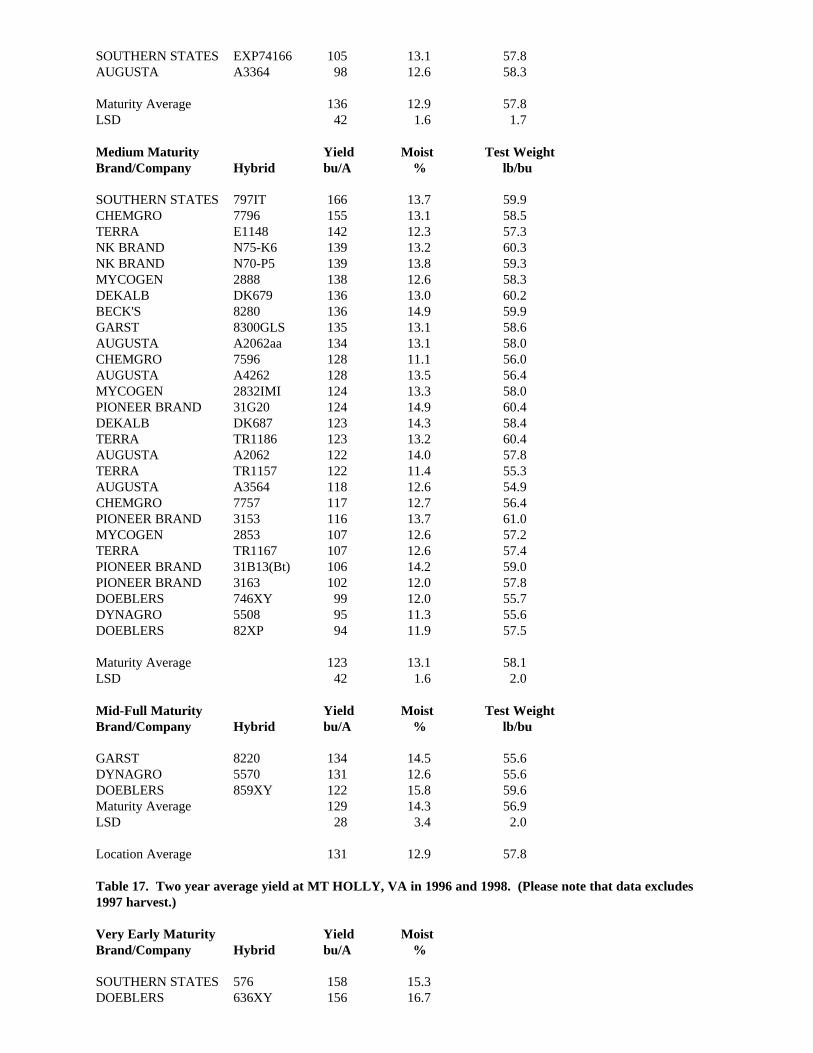
Table 17. Two year average yield at MT HOLLY, VA in 1996 and 1998. (Please note that data excludes1997 harvest.)
Very Early Maturity Yield MoistBrand/Company Hybrid bu/A %
SOUTHERN STATES 576 158 15.3DOEBLERS 636XY 156 16.7
AUGUSTA A359 147 15.0
Maturity Average 154 15.7LSD (0.05) 19 0.4
Early Maturity Yield MoistBrand/Company Hybrid bu/A %
PIONEER BRAND 3245 166 17.6AUGUSTA A385 166 16.1PIONEER BRAND 3223 165 17.9MYCOGEN 7250 164 16.6PIONEER BRAND 3394 161 16.2SOUTHERN STATES 726 161 17.2AUGUSTA A285 161 16.2AUGUSTA A552 154 18.3DEKALB DK626 154 15.5SOUTHERN STATES 747 148 17.8DEKALB DK642 147 15.9
Maturity Average 159 16.9LSD (0.05) 25 0.9
Medium Maturity Yield MoistBrand/Company Hybrid bu/A %
PIONEER BRAND 3163 164 16.9BECK'S 8280 160 19.2PIONEER BRAND 3153 159 18.6TERRA TR1157 138 16.4DOEBLERS 82XP 136 16.8DOEBLERS 746XY 129 16.3TERRA TR1167 125 17.2DYNAGRO 5508 118 16.4
Maturity Average 141 17.2LSD (0.05) 22 0.8
Location Average 151 16.9
Table 18. Three year average yield at MT HOLLY, VA in 1995, 1996, and 1998. (Please note that dataexcludes 1997 harvest.)
Very Early Maturity Yield MoistBrand/Company Hybrid bu/A %
SOUTHERN STATES 576 155 15.7DOEBLERS 636XY 152 16.9
Maturity Average 154 16.3LSD (0.05) 17 0.5
Early Maturity Yield MoistBrand/Company Hybrid bu/A %
PIONEER BRAND 3245 171 18.3PIONEER BRAND 3223 168 18.5AUGUSTA A552 162 18.8

PIONEER BRAND 3394 161 16.5AUGUSTA A285 155 17.0DEKALB DK642 147 16.4
Maturity Average 161 17.6LSD (0.05) 17 0.7
Medium Maturity Yield MoistBrand/Company Hybrid bu/A %
PIONEER BRAND 3163 160 17.7BECK'S 8280 159 19.9DOEBLERS 82XP 146 17.9TERRA TR1167 134 18.1
Maturity Average 150 18.4LSD (0.05) 16 0.5
Location Average 156 17.7
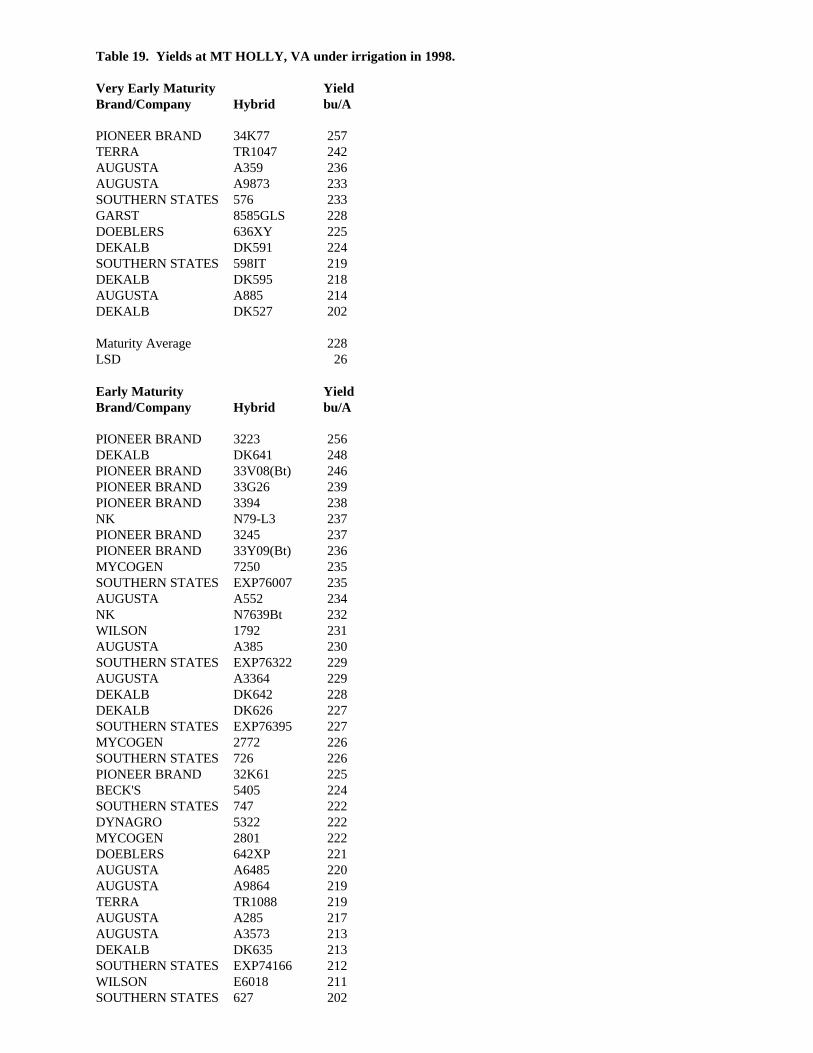
Table 19. Yields at MT HOLLY, VA under irrigation in 1998.
Very Early Maturity YieldBrand/Company Hybrid bu/A
PIONEER BRAND 34K77 257TERRA TR1047 242AUGUSTA A359 236AUGUSTA A9873 233SOUTHERN STATES 576 233GARST 8585GLS 228DOEBLERS 636XY 225DEKALB DK591 224SOUTHERN STATES 598IT 219DEKALB DK595 218AUGUSTA A885 214DEKALB DK527 202
Maturity Average 228LSD 26
Early Maturity YieldBrand/Company Hybrid bu/A
PIONEER BRAND 3223 256DEKALB DK641 248PIONEER BRAND 33V08(Bt) 246PIONEER BRAND 33G26 239PIONEER BRAND 3394 238NK N79-L3 237PIONEER BRAND 3245 237PIONEER BRAND 33Y09(Bt) 236MYCOGEN 7250 235SOUTHERN STATES EXP76007 235AUGUSTA A552 234NK N7639Bt 232WILSON 1792 231AUGUSTA A385 230SOUTHERN STATES EXP76322 229AUGUSTA A3364 229DEKALB DK642 228DEKALB DK626 227SOUTHERN STATES EXP76395 227MYCOGEN 2772 226SOUTHERN STATES 726 226PIONEER BRAND 32K61 225BECK'S 5405 224SOUTHERN STATES 747 222DYNAGRO 5322 222MYCOGEN 2801 222DOEBLERS 642XP 221AUGUSTA A6485 220AUGUSTA A9864 219TERRA TR1088 219AUGUSTA A285 217AUGUSTA A3573 213DEKALB DK635 213SOUTHERN STATES EXP74166 212WILSON E6018 211SOUTHERN STATES 627 202
SOUTHERN STATES 767 201GARST 8464 201
Maturity Average 226LSD 23
Medium Maturity YieldBrand/Company Hybrid bu/A
PIONEER BRAND 31B13(Bt) 262PIONEER BRAND 3163 254NK BRAND N75-K6 249CHEMGRO 7796 241PIONEER BRAND 31G20 240PIONEER BRAND 3153 234TERRA E1148 232DEKALB DK687 231CHEMGRO 7596 230AUGUSTA A2062 229AUGUSTA A2062aa 227TERRA TR1157 227DEKALB DK679 227DOEBLERS 746XY 227BECK'S 8280 224DOEBLERS 82XP 221GARST 8300GLS 220TERRA TR1186 219TERRA TR1167 215AUGUSTA A3564 214SOUTHERN STATES 797IT 214AUGUSTA A4262 213MYCOGEN 2832IMI 212MYCOGEN 2888 212CHEMGRO 7757 208DYNAGRO 5508 205NK BRAND N70-P5 204MYCOGEN 2853 202
Maturity Average 226LSD 26
Mid-Full Maturity YieldBrand/Company Hybrid bu/A
DYNAGRO 5570 225DOEBLERS 859XY 225GARST 8220 220Maturity Average 224LSD 38
Location Average 226
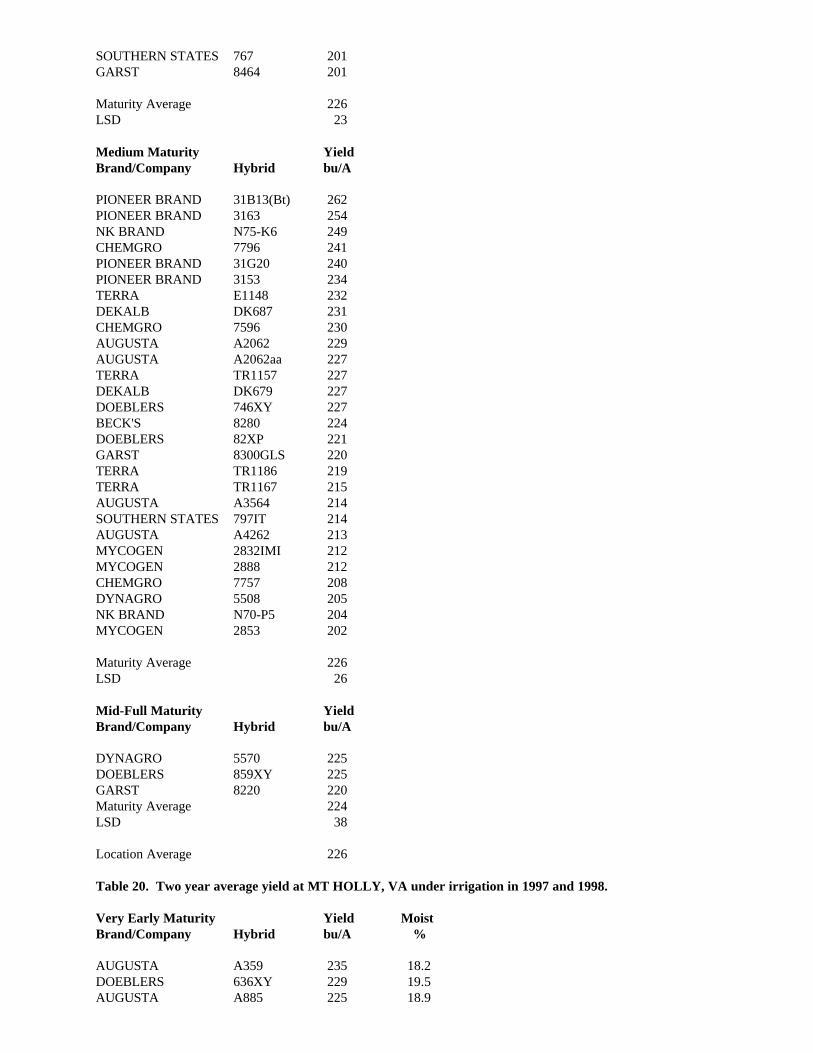
Table 20. Two year average yield at MT HOLLY, VA under irrigation in 1997 and 1998.
Very Early Maturity Yield MoistBrand/Company Hybrid bu/A %
AUGUSTA A359 235 18.2DOEBLERS 636XY 229 19.5AUGUSTA A885 225 18.9

SOUTHERN STATES 576 225 17.6
Maturity Average 228 18.6LSD (0.05) 15 1.5
Early Maturity Yield MoistBrand/Company Hybrid bu/A %
PIONEER BRAND 3223 243 21.7AUGUSTA A552 239 22.3PIONEER BRAND 3245 238 21.6PIONEER BRAND 32K61 237 20.3PIONEER BRAND 3394 236 19.9DEKALB DK642 233 20.8PIONEER BRAND 33VO8-Bt 232 19.9AUGUSTA A385 231 21.0DEKALB DK626 230 19.5PIONEER BRAND 33Y09-Bt 228 19.3MYCOGEN 7250 227 20.6AUGUSTA A285 223 20.4SOUTHERN STATES 747 222 22.3SOUTHERN STATES 726 218 21.2
Maturity Average 231 20.8LSD (0.05) 16 1.9
Medium Maturity Yield MoistBrand/Company Hybrid bu/A %
PIONEER BRAND 31B13-Bt 252 23.1PIONEER BRAND 3163 244 22.7AUGUSTA A2062 233 23.7TERRA TR1186 233 21.4PIONEER BRAND 3153 231 22.4DOEBLERS 746XY 230 21.1DEKALB DK679 230 23.0DOEBLERS 82XP 226 22.4DEKALB DK687 224 23.1BECK'S 8280 222 23.4TERRA TR1157 222 22.2TERRA TR1167 219 23.4DYNAGRO 5508 214 21.5Maturity Average 229 22.6LSD (0.05) 16 1.1
Location Average 230 21.2
Table 21. Three year average yield at MT HOLLY, VA under irrigation in 1996, 1997, and 1998.
Very Early Maturity Yield MoistBrand/Company Hybrid bu/A %
AUGUSTA A359 236 18.5DOEBLERS 636XY 225 19.7SOUTHERN STATES 576 223 17.7
Maturity Average 228 18.7LSD (0.05) 12 1.2
Early Maturity Yield Moist
Brand/Company Hybrid bu/A %
PIONEER BRAND 3245 244 21.7PIONEER BRAND 3223 244 21.5AUGUSTA A552 242 22.7DEKALB DK642 238 20.8PIONEER BRAND 3394 236 20.1AUGUSTA A385 236 21.1DEKALB DK626 233 19.6SOUTHERN STATES 747 230 22.4AUGUSTA A285 228 20.6SOUTHERN STATES 726 228 21.3MYCOGEN 7250 225 20.8
Maturity Average 235 21.2LSD (0.05) 12 1.0
Medium Maturity Yield MoistBrand/Company Hybrid bu/A %
PIONEER BRAND 3163 249 22.4PIONEER BRAND 3153 238 22.5DOEBLERS 746XY 230 21.1DOEBLERS 82XP 230 22.1BECK'S 8280 229 23.4TERRA TR1157 229 21.8TERRA TR1167 224 22.9
Maturity Average 233 22.3LSD (0.05) 12 0.8
Location Average 233 21.2

Table 22. Yields at WYTHE, VA in 1998.
Very Early Maturity Yield Moist Test WeightBrand/Company Hybrid bu/A % lb/bu
DEKALB DK591 89 22.4 52.9PIONEER BRAND 34K77 83 23.8 52.2
Maturity Average 86 23.1 52.5LSD 39 3.9 3.6
Early Maturity Yield Moist Test WeightBrand/Company Hybrid bu/A % lb/bu
PIONEER BRAND 33Y09(Bt) 103 22.1 55.1PIONEER BRAND 3310 94 22.5 56.1NK N7639Bt 93 23.1 52.0SOUTHERN STATES EXP76322 91 22.0 52.0MID-ATLANTIC MA9141 89 21.6 51.6NK N73-N8 85 22.5 53.1PIONEER BRAND 33G26 81 23.9 56.1PIONEER BRAND 32K61 81 24.1 54.8SOUTHERN STATES 742A 80 23.6 51.4AUGUSTA A552 79 23.1 50.3
Maturity Average 87 22.9 53.2LSD 21 1.3 1.5
Medium Maturity Yield Moist Test WeightBrand/Company Hybrid bu/A % lb/bu
SOUTHERN STATES 793A 109 22.6 52.7PIONEER BRAND 3163 89 22.5 52.4PIONEER BRAND 3153 83 24.2 53.3NK N83-N5 83 23.4 54.4AUGUSTA A2062 79 24.1 52.5NK N83-R7 78 26.7 51.4PIONEER BRAND 31G20 74 25.5 54.0
Maturity Average 85 24.1 53.0LSD 29 1.4 1.4
Mid-Full Maturity Yield Moist Test WeightBrand/Company Hybrid bu/A % lb/bu
SOUTHERN STATES 849IT 83 24.2 49.7MID-ATLANTIC MA9200 77 24.6 50.0PIONEER BRAND 3156 75 23.1 53.7
Maturity Average 78 23.9 51.1LSD 25 2.9 2.7
Location Average 85 23.4 52.8
Table 23. Two year average yield at WYTHE, VA in 1997 and 1998.
Early Maturity Yield MoistBrand/Company Hybrid bu/A %

PIONEER BRAND 32K61 135 25.5MID-ATLANTIC MA9141 134 25.7SOUTHERN STATES 742A 131 27.0PIONEER BRAND 33Y09-Bt 123 24.0PIONEER BRAND 3310 120 25.2NK N73-N8 118 24.9AUGUSTA A552 111 26.4
Maturity Average 125 25.5LSD (0.05) 24 1.5
Medium Maturity Yield MoistBrand/Company Hybrid bu/A %
PIONEER BRAND 3153 130 26.1PIONEER BRAND 3163 121 25.6AUGUSTA A2062 114 27.1NK N83-R7 110 28.3
Maturity Average 119 26.8LSD (0.05) 19 1.1
Mid-Full Maturity Yield MoistBrand/Company Hybrid bu/A %
MID-ATLANTIC MA9200 112 28.3PIONEER BRAND 3156 107 26.2
Maturity Average 110 27.3LSD (0.05) 25 1.0
Location Average 120 26.2

Table 24. Yields at ORANGE, VA in 1998. (Corn was harvested early to preserve data from damage due toa strong thunderstorm 9/7/98.)
Very Early Maturity Yield Moist Days To Ear Ht LodgingBrand/Company Hybrid bu/A % Silk inches %
AUGUSTA A9873 134 21.0 63 52 17AUGUSTA A885 133 21.3 62 44 2PIONEER BRAND 34K77 131 22.2 62 47 6DEKALB DK591 130 24.8 63 47 4GARST 8585GLS 129 20.4 62 44 4DEKALB DK595 123 20.1 62 43 8DOEBLERS 636XY 117 24.5 64 46 10SOUTHERN STATES 576 115 22.0 64 52 11DEKALB DK527 103 17.6 61 47 11AUGUSTA A359 100 29.9 66 51 10
Maturity Average 121 22.4 63 47 8LSD 22 2.7 1 4 8
Early Maturity Yield Moist Days To Ear Ht LodgingBrand/Company Hybrid bu/A % Silk inches %
PIONEER BRAND 33V08(Bt) 139 27.7 64 52 15AUGUSTA A9864 128 23.9 63 52 23PIONEER BRAND 33Y09(Bt) 124 26.9 65 55 24AUGUSTA A3364 120 25.4 65 52 10PIONEER BRAND 33G26 119 22.1 64 52 21AUGUSTA A6485 119 22.3 63 45 15DYNAGRO 5407 115 22.7 65 50 30SOUTHERN STATES 627 115 22.1 64 45 17PIONEER BRAND 3394 111 22.1 63 51 21PIONEER BRAND 3245 108 25.2 66 48 10DEKALB DK635 107 24.2 64 45 15SOUTHERN STATES EXP76322 107 29.8 67 59 40PIONEER BRAND 32K61 106 26.0 67 53 21PIONEER BRAND 3310 106 25.1 66 49 22DEKALB DK641 105 25.6 65 54 25DYNAGRO 5322 105 19.4 62 48 18DOEBLERS 636XY* 104 24.1 65 49 21PIONEER BRAND 3223 104 32.6 68 58 53GARST 8464 104 21.9 63 43 8SOUTHERN STATES 726 104 24.0 64 52 25AUGUSTA A285 102 25.3 66 51 24DOEBLERS 746XY* 99 29.5 67 49 8SOUTHERN STATES 767 99 26.7 65 48 13SOUTHERN STATES EXP76395 97 29.5 67 54 13MID-ATLANTIC MA9141 97 31.3 67 50 16DEKALB DK626 95 20.9 64 50 22AUGUSTA A385 91 32.8 68 51 19DEKALB DK642 90 23.7 66 45 32SOUTHERN STATES 747 90 30.3 65 53 22AUGUSTA A552 85 37.3 70 59 32SOUTHERN STATES EXP74166 79 29.3 68 57 30Maturity Average 106 26.1 65 51 22LSD 21 3.8 2 5 14
Medium Maturity Yield Moist Days To Ear Ht LodgingBrand/Company Hybrid bu/A % Silk inches %
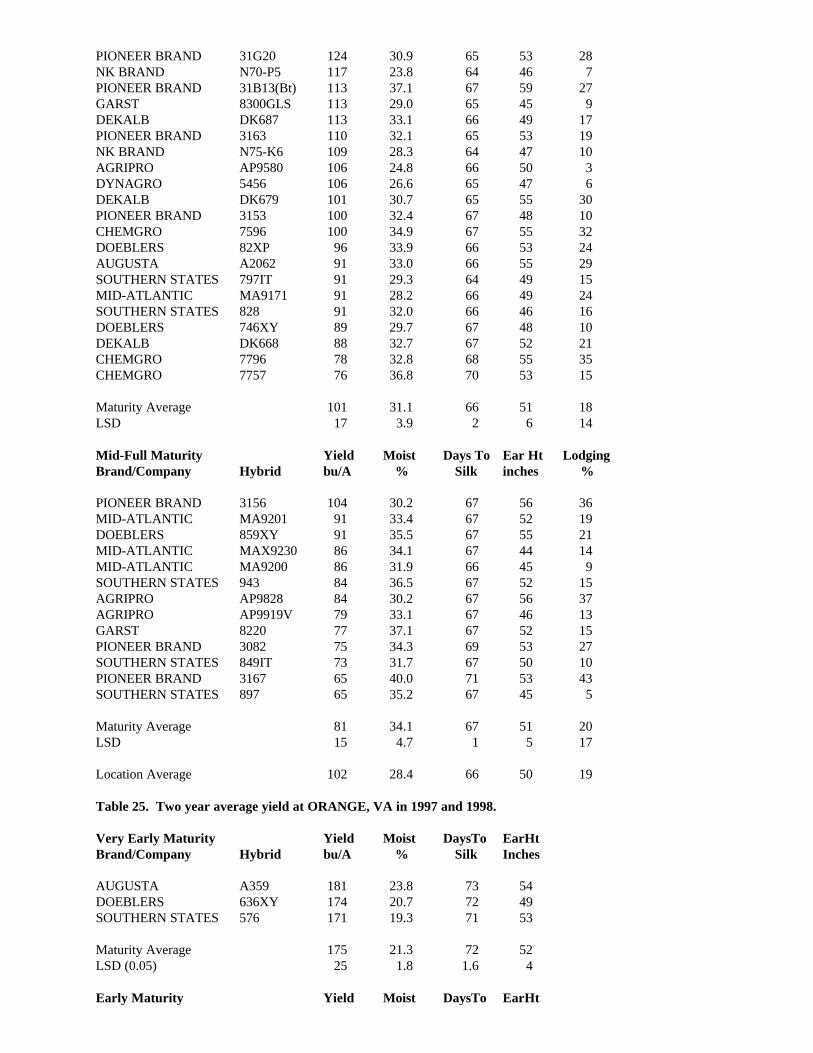
PIONEER BRAND 31G20 124 30.9 65 53 28NK BRAND N70-P5 117 23.8 64 46 7PIONEER BRAND 31B13(Bt) 113 37.1 67 59 27GARST 8300GLS 113 29.0 65 45 9DEKALB DK687 113 33.1 66 49 17PIONEER BRAND 3163 110 32.1 65 53 19NK BRAND N75-K6 109 28.3 64 47 10AGRIPRO AP9580 106 24.8 66 50 3DYNAGRO 5456 106 26.6 65 47 6DEKALB DK679 101 30.7 65 55 30PIONEER BRAND 3153 100 32.4 67 48 10CHEMGRO 7596 100 34.9 67 55 32DOEBLERS 82XP 96 33.9 66 53 24AUGUSTA A2062 91 33.0 66 55 29SOUTHERN STATES 797IT 91 29.3 64 49 15MID-ATLANTIC MA9171 91 28.2 66 49 24SOUTHERN STATES 828 91 32.0 66 46 16DOEBLERS 746XY 89 29.7 67 48 10DEKALB DK668 88 32.7 67 52 21CHEMGRO 7796 78 32.8 68 55 35CHEMGRO 7757 76 36.8 70 53 15
Maturity Average 101 31.1 66 51 18LSD 17 3.9 2 6 14
Mid-Full Maturity Yield Moist Days To Ear Ht LodgingBrand/Company Hybrid bu/A % Silk inches %
PIONEER BRAND 3156 104 30.2 67 56 36MID-ATLANTIC MA9201 91 33.4 67 52 19DOEBLERS 859XY 91 35.5 67 55 21MID-ATLANTIC MAX9230 86 34.1 67 44 14MID-ATLANTIC MA9200 86 31.9 66 45 9SOUTHERN STATES 943 84 36.5 67 52 15AGRIPRO AP9828 84 30.2 67 56 37AGRIPRO AP9919V 79 33.1 67 46 13GARST 8220 77 37.1 67 52 15PIONEER BRAND 3082 75 34.3 69 53 27SOUTHERN STATES 849IT 73 31.7 67 50 10PIONEER BRAND 3167 65 40.0 71 53 43SOUTHERN STATES 897 65 35.2 67 45 5
Maturity Average 81 34.1 67 51 20LSD 15 4.7 1 5 17
Location Average 102 28.4 66 50 19
Table 25. Two year average yield at ORANGE, VA in 1997 and 1998.
Very Early Maturity Yield Moist DaysTo EarHtBrand/Company Hybrid bu/A % Silk Inches
AUGUSTA A359 181 23.8 73 54DOEBLERS 636XY 174 20.7 72 49SOUTHERN STATES 576 171 19.3 71 53
Maturity Average 175 21.3 72 52LSD (0.05) 25 1.8 1.6 4
Early Maturity Yield Moist DaysTo EarHt

Brand/Company Hybrid bu/A % Silk Inches
PIONEER BRAND 33VO8-Bt 195 22.3 72 54AUGUSTA A552 192 29.0 77 61PIONEER BRAND 33Y09-Bt 185 22.4 73 57AUGUSTA A385 183 26.1 75 53PIONEER BRAND 3394 183 20.1 71 53PIONEER BRAND 3223 183 26.2 76 57PIONEER BRAND 32K61 182 22.1 75 54PIONEER BRAND 3310 182 22.7 73 53PIONEER BRAND 3245 181 22.9 75 51SOUTHERN STATES 726 181 21.7 72 53SOUTHERN STATES 747 179 25.2 75 53AUGUSTA A285 179 22.1 73 50DEKALB DK626 177 19.5 72 53DEKALB DK642 176 22.1 74 47MID-ATLANTIC MA9141 172 25.7 74 51
Maturity Average 182 23.3 74 53LSD (0.05) 13 1.9 1 3
Medium Maturity Yield Moist DaysTo EarHtBrand/Company Hybrid bu/A % Silk Inches
PIONEER BRAND 31B13-Bt 193 27.6 75 64PIONEER BRAND 3163 187 26.0 74 56PIONEER BRAND 3153 184 26.2 75 55AUGUSTA A2062 182 25.9 74 59MID-ATLANTIC MA9171 182 25.2 75 55SOUTHERN STATES 797IT 179 24.4 71 52DEKALB DK687 178 26.7 74 53DOEBLERS 746XY 173 23.8 75 53DEKALB DK668 171 25.4 74 57
Maturity Average 181 25.7 74 56LSD (0.05) 12 2.0 2 4
Mid-Full Maturity Yield Moist DaysTo EarHtBrand/Company Hybrid bu/A % Silk Inches
SOUTHERN STATES 943 188 31.0 74 54PIONEER BRAND 3156 181 26.3 75 57MID-ATLANTIC MA9200 181 28.1 74 50
SOUTHERN STATES 897 165 27.7 75 49PIONEER BRAND 3082 165 28.7 78 55
Maturity Average 176 28.4 75 53LSD (0.05) 14 2.3 2 3
Location Average 180 24.6 74 54
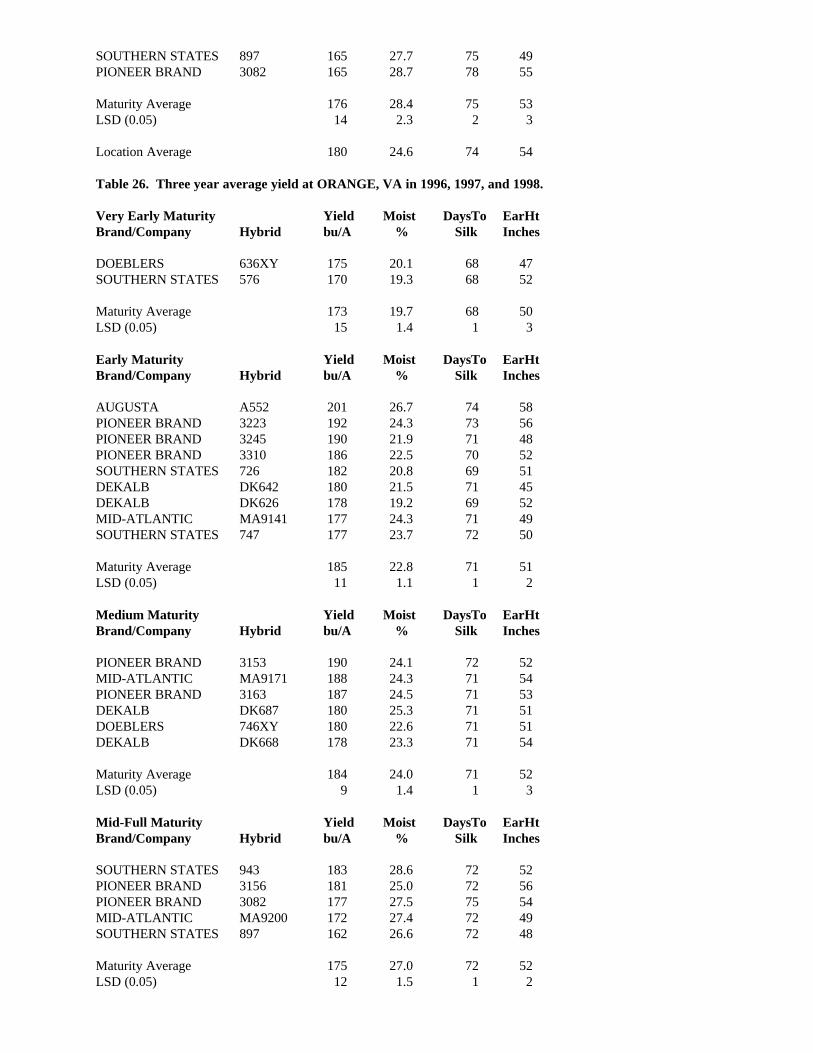
Table 26. Three year average yield at ORANGE, VA in 1996, 1997, and 1998.
Very Early Maturity Yield Moist DaysTo EarHtBrand/Company Hybrid bu/A % Silk Inches
DOEBLERS 636XY 175 20.1 68 47SOUTHERN STATES 576 170 19.3 68 52
Maturity Average 173 19.7 68 50LSD (0.05) 15 1.4 1 3
Early Maturity Yield Moist DaysTo EarHtBrand/Company Hybrid bu/A % Silk Inches
AUGUSTA A552 201 26.7 74 58PIONEER BRAND 3223 192 24.3 73 56PIONEER BRAND 3245 190 21.9 71 48PIONEER BRAND 3310 186 22.5 70 52SOUTHERN STATES 726 182 20.8 69 51DEKALB DK642 180 21.5 71 45DEKALB DK626 178 19.2 69 52MID-ATLANTIC MA9141 177 24.3 71 49SOUTHERN STATES 747 177 23.7 72 50
Maturity Average 185 22.8 71 51LSD (0.05) 11 1.1 1 2
Medium Maturity Yield Moist DaysTo EarHtBrand/Company Hybrid bu/A % Silk Inches
PIONEER BRAND 3153 190 24.1 72 52MID-ATLANTIC MA9171 188 24.3 71 54PIONEER BRAND 3163 187 24.5 71 53DEKALB DK687 180 25.3 71 51DOEBLERS 746XY 180 22.6 71 51DEKALB DK668 178 23.3 71 54
Maturity Average 184 24.0 71 52LSD (0.05) 9 1.4 1 3
Mid-Full Maturity Yield Moist DaysTo EarHtBrand/Company Hybrid bu/A % Silk Inches
SOUTHERN STATES 943 183 28.6 72 52PIONEER BRAND 3156 181 25.0 72 56PIONEER BRAND 3082 177 27.5 75 54MID-ATLANTIC MA9200 172 27.4 72 49SOUTHERN STATES 897 162 26.6 72 48
Maturity Average 175 27.0 72 52LSD (0.05) 12 1.5 1 2

Location Average 181 23.8 71 51SECTION II. EVALUATION OF DOUBLECROP CORN UNDER IRRIGATION INEASTERN VIRGINIA.
Table 27. Doublecrop Corn Hybrid Study under irrigation at Corbin Hall, VA in 1998.
Yield Moist Test WtBrand/Company Hybrid bu/A % lb/bu
SOUTHERN STATES EXP78004 101 15.9 55.0NOVARTIS N4640Bt 99 16.1 55.0PIONEER 33V08Bt 97 15.8 55.2NOVARTIS N7639Bt 96 16.5 55.8PIONEER 36K27Bt 96 14.7 52.9PIONEER 33Y09Bt 87 15.6 55.3NOVARTIS N79-L3 87 16.5 56.2SOUTHERN STATES EXP18516 86 13.9 54.5NOVARTIS N4242Bt 78 13.7 54.5DEKALB DK591 76 16.3 51.4NOVARTIS N4640 76 12.4 51.5MYCOGEN 7059 75 14.5 54.8NOVARTIS N6800Bt 75 14.1 53.3MYCOGEN 7559 68 15.1 53.0NOVARTIS N6800 67 13.9 54.7MYCOGEN 2362 66 12.6 51.7MYCOGEN 2598 61 13.5 51.6DEKALB DK446 59 12.3 50.5MYCOGEN 2382 57 12.8 54.8DEKALB DK546 53 12.2 51.0SOUTHERN STATES EXP74166 50 13.6 50.7AUGUSTA 885 40 12.6 49.9PIONEER 3905 35 12.6 52.9PIONEER 3984 30 12.8 53.8
Location Average 71 14.2 53.4LSD (0.05) 20 1.3 2.2
Corn was planted June 4, 1998 and harvested October 2, 1998. Nitrogen at 130 lb was used as a carrier forGuardsman® at 3 pt and Roundup® at 2 qt applied preemergently.
SECTION III. EVALUATION OF CORN ROW WIDTH AND POPULATION INEASTERN VIRGINIA .
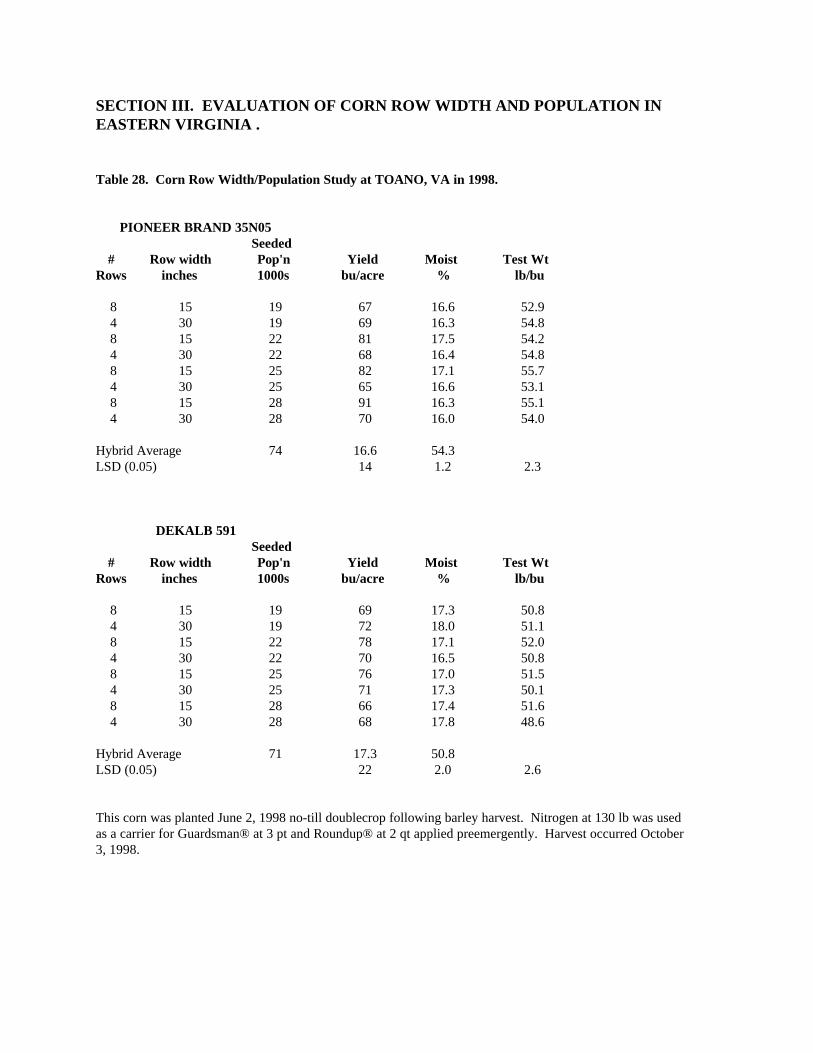
Table 28. Corn Row Width/Population Study at TOANO, VA in 1998.
PIONEER BRAND 35N05Seeded
# Row width Pop'n Yield Moist Test WtRows inches 1000s bu/acre % lb/bu
8 15 19 67 16.6 52.94 30 19 69 16.3 54.88 15 22 81 17.5 54.24 30 22 68 16.4 54.88 15 25 82 17.1 55.74 30 25 65 16.6 53.18 15 28 91 16.3 55.14 30 28 70 16.0 54.0
Hybrid Average 74 16.6 54.3LSD (0.05) 14 1.2 2.3
DEKALB 591Seeded
# Row width Pop'n Yield Moist Test WtRows inches 1000s bu/acre % lb/bu
8 15 19 69 17.3 50.84 30 19 72 18.0 51.18 15 22 78 17.1 52.04 30 22 70 16.5 50.88 15 25 76 17.0 51.54 30 25 71 17.3 50.18 15 28 66 17.4 51.64 30 28 68 17.8 48.6
Hybrid Average 71 17.3 50.8LSD (0.05) 22 2.0 2.6
This corn was planted June 2, 1998 no-till doublecrop following barley harvest. Nitrogen at 130 lb was usedas a carrier for Guardsman® at 3 pt and Roundup® at 2 qt applied preemergently. Harvest occurred October3, 1998.
SECTION IV. EVALUATION OF BT HYBRIDS IN EASTERN VIRGINIA.
R. Youngman, C. Laub, T. Kuhar, T. Dellinger, H. Behl, E. Rucker, and D. Brann
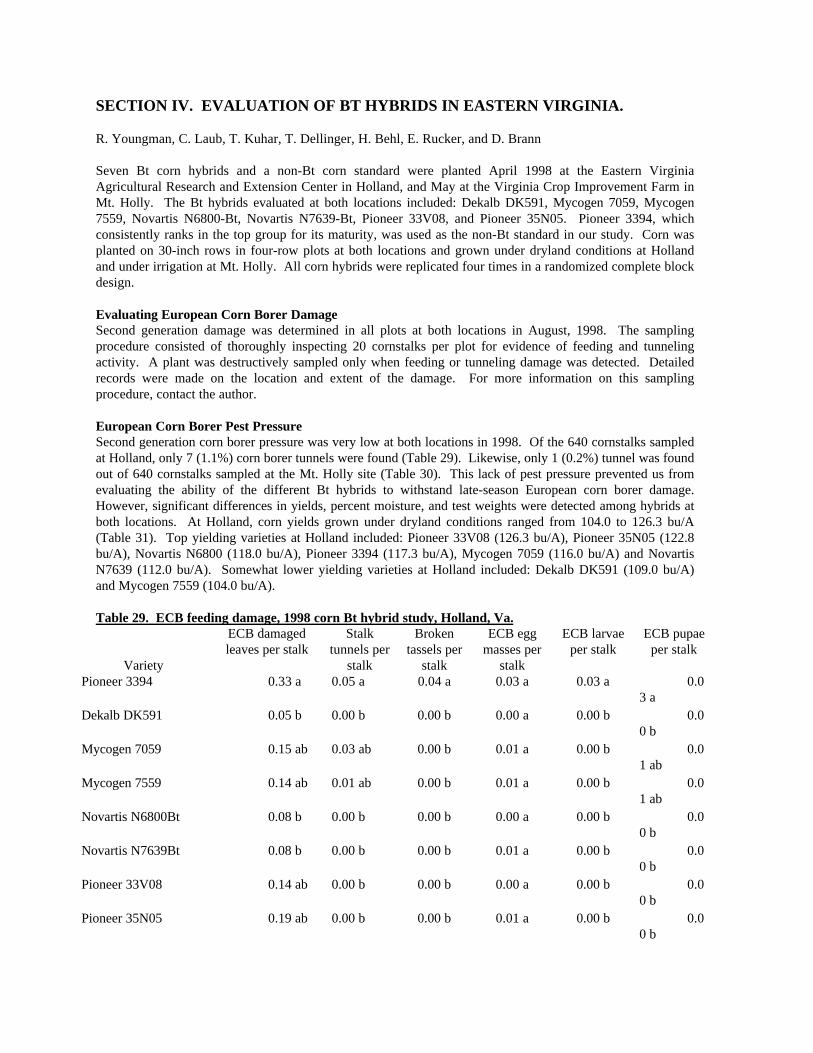
Seven Bt corn hybrids and a non-Bt corn standard were planted April 1998 at the Eastern VirginiaAgricultural Research and Extension Center in Holland, and May at the Virginia Crop Improvement Farm inMt. Holly. The Bt hybrids evaluated at both locations included: Dekalb DK591, Mycogen 7059, Mycogen7559, Novartis N6800-Bt, Novartis N7639-Bt, Pioneer 33V08, and Pioneer 35N05. Pioneer 3394, whichconsistently ranks in the top group for its maturity, was used as the non-Bt standard in our study. Corn wasplanted on 30-inch rows in four-row plots at both locations and grown under dryland conditions at Hollandand under irrigation at Mt. Holly. All corn hybrids were replicated four times in a randomized complete blockdesign.
Evaluating European Corn Borer DamageSecond generation damage was determined in all plots at both locations in August, 1998. The samplingprocedure consisted of thoroughly inspecting 20 cornstalks per plot for evidence of feeding and tunnelingactivity. A plant was destructively sampled only when feeding or tunneling damage was detected. Detailedrecords were made on the location and extent of the damage. For more information on this samplingprocedure, contact the author.
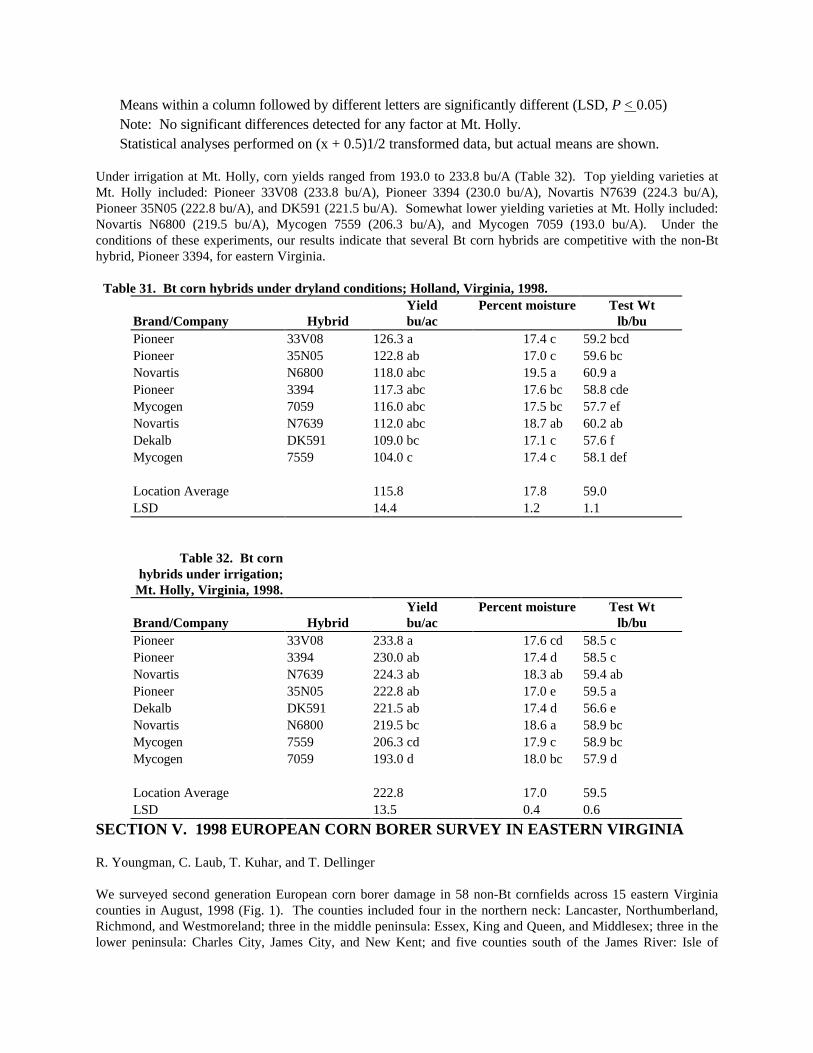
European Corn Borer Pest PressureSecond generation corn borer pressure was very low at both locations in 1998. Of the 640 cornstalks sampledat Holland, only 7 (1.1%) corn borer tunnels were found (Table 29). Likewise, only 1 (0.2%) tunnel was foundout of 640 cornstalks sampled at the Mt. Holly site (Table 30). This lack of pest pressure prevented us fromevaluating the ability of the different Bt hybrids to withstand late-season European corn borer damage.However, significant differences in yields, percent moisture, and test weights were detected among hybrids atboth locations. At Holland, corn yields grown under dryland conditions ranged from 104.0 to 126.3 bu/A(Table 31). Top yielding varieties at Holland included: Pioneer 33V08 (126.3 bu/A), Pioneer 35N05 (122.8bu/A), Novartis N6800 (118.0 bu/A), Pioneer 3394 (117.3 bu/A), Mycogen 7059 (116.0 bu/A) and NovartisN7639 (112.0 bu/A). Somewhat lower yielding varieties at Holland included: Dekalb DK591 (109.0 bu/A)and Mycogen 7559 (104.0 bu/A).
Table 29. ECB feeding damage, 1998 corn Bt hybrid study, Holland, Va.
Variety
ECB damagedleaves per stalk
Stalktunnels per
stalk
Brokentassels per
stalk
ECB eggmasses per
stalk
ECB larvaeper stalk
ECB pupaeper stalk
Pioneer 3394 0.33 a 0.05 a 0.04 a 0.03 a 0.03 a 0.03 a
Dekalb DK591 0.05 b 0.00 b 0.00 b 0.00 a 0.00 b 0.00 b
Mycogen 7059 0.15 ab 0.03 ab 0.00 b 0.01 a 0.00 b 0.01 ab
Mycogen 7559 0.14 ab 0.01 ab 0.00 b 0.01 a 0.00 b 0.01 ab
Novartis N6800Bt 0.08 b 0.00 b 0.00 b 0.00 a 0.00 b 0.00 b
Novartis N7639Bt 0.08 b 0.00 b 0.00 b 0.01 a 0.00 b 0.00 b
Pioneer 33V08 0.14 ab 0.00 b 0.00 b 0.00 a 0.00 b 0.00 b
Pioneer 35N05 0.19 ab 0.00 b 0.00 b 0.01 a 0.00 b 0.00 b

Means within a column followed by different letters are significantly different (LSD, P < 0.05)Statistical analyses performed on (x + 0.5)1/2 transformed data, but actual means are shown.
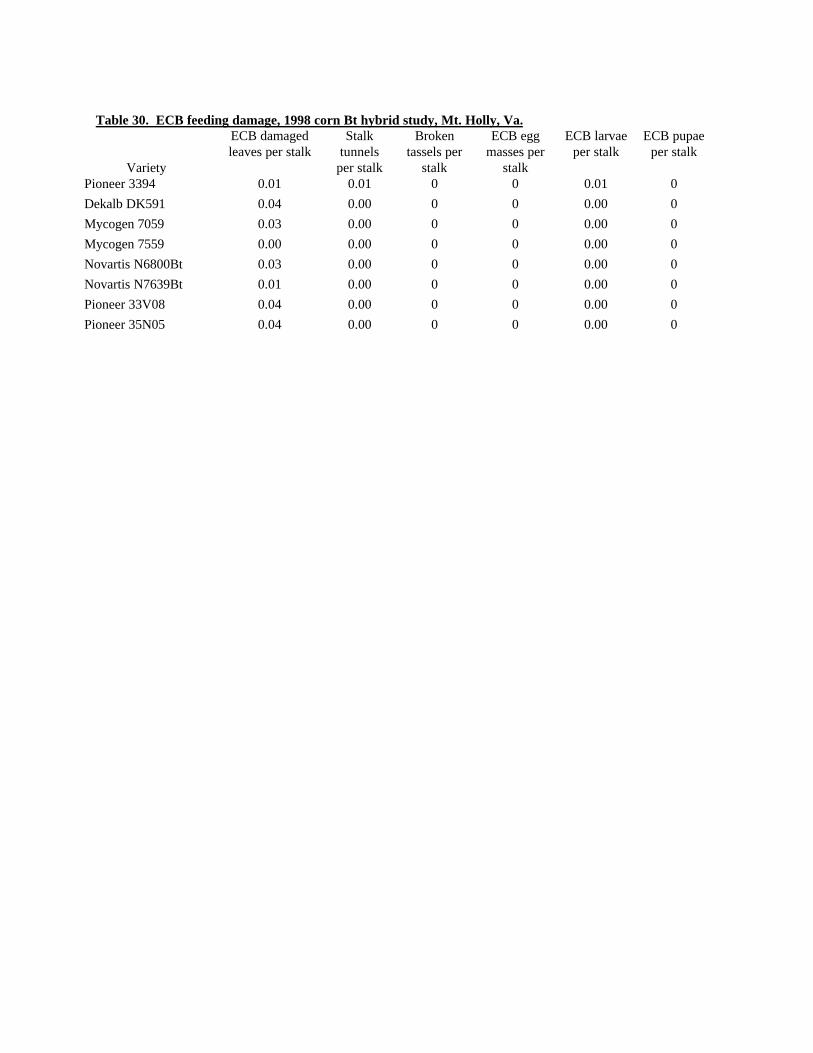
Table 30. ECB feeding damage, 1998 corn Bt hybrid study, Mt. Holly, Va.
Variety
ECB damagedleaves per stalk
Stalktunnels
per stalk
Brokentassels per
stalk
ECB eggmasses per
stalk
ECB larvaeper stalk
ECB pupaeper stalk
Pioneer 3394 0.01 0.01 0 0 0.01 0
Dekalb DK591 0.04 0.00 0 0 0.00 0
Mycogen 7059 0.03 0.00 0 0 0.00 0
Mycogen 7559 0.00 0.00 0 0 0.00 0
Novartis N6800Bt 0.03 0.00 0 0 0.00 0
Novartis N7639Bt 0.01 0.00 0 0 0.00 0
Pioneer 33V08 0.04 0.00 0 0 0.00 0
Pioneer 35N05 0.04 0.00 0 0 0.00 0
Means within a column followed by different letters are significantly different (LSD, P < 0.05)Note: No significant differences detected for any factor at Mt. Holly.Statistical analyses performed on (x + 0.5)1/2 transformed data, but actual means are shown.
Under irrigation at Mt. Holly, corn yields ranged from 193.0 to 233.8 bu/A (Table 32). Top yielding varieties atMt. Holly included: Pioneer 33V08 (233.8 bu/A), Pioneer 3394 (230.0 bu/A), Novartis N7639 (224.3 bu/A),Pioneer 35N05 (222.8 bu/A), and DK591 (221.5 bu/A). Somewhat lower yielding varieties at Mt. Holly included:Novartis N6800 (219.5 bu/A), Mycogen 7559 (206.3 bu/A), and Mycogen 7059 (193.0 bu/A). Under theconditions of these experiments, our results indicate that several Bt corn hybrids are competitive with the non-Bthybrid, Pioneer 3394, for eastern Virginia.
Table 31. Bt corn hybrids under dryland conditions; Holland, Virginia, 1998.
Brand/Company HybridYieldbu/ac
Percent moisture Test Wtlb/bu
Pioneer 33V08 126.3 a 17.4 c 59.2 bcdPioneer 35N05 122.8 ab 17.0 c 59.6 bcNovartis N6800 118.0 abc 19.5 a 60.9 aPioneer 3394 117.3 abc 17.6 bc 58.8 cdeMycogen 7059 116.0 abc 17.5 bc 57.7 efNovartis N7639 112.0 abc 18.7 ab 60.2 abDekalb DK591 109.0 bc 17.1 c 57.6 fMycogen 7559 104.0 c 17.4 c 58.1 def
Location Average 115.8 17.8 59.0LSD 14.4 1.2 1.1
Table 32. Bt cornhybrids under irrigation;
Mt. Holly, Virginia, 1998.
Brand/Company HybridYieldbu/ac
Percent moisture Test Wtlb/bu
Pioneer 33V08 233.8 a 17.6 cd 58.5 cPioneer 3394 230.0 ab 17.4 d 58.5 cNovartis N7639 224.3 ab 18.3 ab 59.4 abPioneer 35N05 222.8 ab 17.0 e 59.5 aDekalb DK591 221.5 ab 17.4 d 56.6 eNovartis N6800 219.5 bc 18.6 a 58.9 bcMycogen 7559 206.3 cd 17.9 c 58.9 bcMycogen 7059 193.0 d 18.0 bc 57.9 d
Location Average 222.8 17.0 59.5LSD 13.5 0.4 0.6
SECTION V. 1998 EUROPEAN CORN BORER SURVEY IN EASTERN VIRGINIA
R. Youngman, C. Laub, T. Kuhar, and T. Dellinger
We surveyed second generation European corn borer damage in 58 non-Bt cornfields across 15 eastern Virginiacounties in August, 1998 (Fig. 1). The counties included four in the northern neck: Lancaster, Northumberland,Richmond, and Westmoreland; three in the middle peninsula: Essex, King and Queen, and Middlesex; three in thelower peninsula: Charles City, James City, and New Kent; and five counties south of the James River: Isle of

Wight, Prince George, Southampton, Surry, and Sussex. In each field, 100 stalks were sampled for corn borerdamage making up a total sample size of 5,800 plants.
Unlike our 1997 survey which indicated a relatively low level of European corn borer damage for eastern Virginia,our 1998 survey indicated moderate to severe levels of European corn borer pressure in all 15 counties. Thepercentage of cornstalks with corn borer tunnels ranged from a low of 19.3% for Northumberland Co. to a high of118.8% for Isle of Wight Co. Note that it is possible to generate percentage values greater than 100%, becauseunder heavy corn borer infestations individual cornstalks can have several tunnels each. When averaged across all58 cornfields, 54.7% of the stalks in eastern Virginia had corn borer tunnels. Given that most of the cornfields inour 1998 survey exhibited above-threshold infestation levels of European corn borer, most corn growers whoplanted Bt hybrids in eastern Virginia would have benefited from higher grain yields and grain quality in 1998.
Figure 1. 1998 survey of European corn borer damage in 58 non-Bt cornfields in eastern Virginia. Numbers incounties represent average percentage of stalks with ECB tunnels.
SECTION VI.
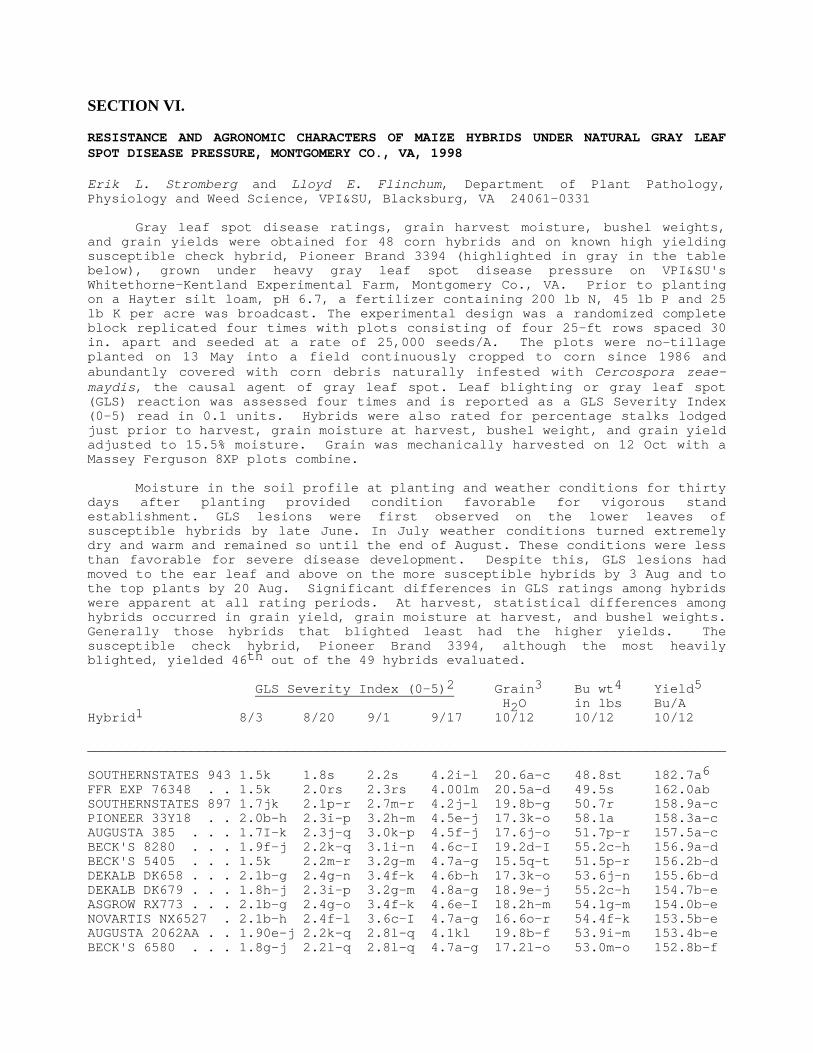
RESISTANCE AND AGRONOMIC CHARACTERS OF MAIZE HYBRIDS UNDER NATURAL GRAY LEAFSPOT DISEASE PRESSURE, MONTGOMERY CO., VA, 1998
Erik L. Stromberg and Lloyd E. Flinchum, Department of Plant Pathology,Physiology and Weed Science, VPI&SU, Blacksburg, VA 24061-0331
Gray leaf spot disease ratings, grain harvest moisture, bushel weights,and grain yields were obtained for 48 corn hybrids and on known high yieldingsusceptible check hybrid, Pioneer Brand 3394 (highlighted in gray in the tablebelow), grown under heavy gray leaf spot disease pressure on VPI&SU'sWhitethorne-Kentland Experimental Farm, Montgomery Co., VA. Prior to plantingon a Hayter silt loam, pH 6.7, a fertilizer containing 200 lb N, 45 lb P and 25lb K per acre was broadcast. The experimental design was a randomized completeblock replicated four times with plots consisting of four 25-ft rows spaced 30in. apart and seeded at a rate of 25,000 seeds/A. The plots were no-tillageplanted on 13 May into a field continuously cropped to corn since 1986 andabundantly covered with corn debris naturally infested with Cercospora zeae-maydis, the causal agent of gray leaf spot. Leaf blighting or gray leaf spot(GLS) reaction was assessed four times and is reported as a GLS Severity Index(0-5) read in 0.1 units. Hybrids were also rated for percentage stalks lodgedjust prior to harvest, grain moisture at harvest, bushel weight, and grain yieldadjusted to 15.5% moisture. Grain was mechanically harvested on 12 Oct with aMassey Ferguson 8XP plots combine.
Moisture in the soil profile at planting and weather conditions for thirtydays after planting provided condition favorable for vigorous standestablishment. GLS lesions were first observed on the lower leaves ofsusceptible hybrids by late June. In July weather conditions turned extremelydry and warm and remained so until the end of August. These conditions were lessthan favorable for severe disease development. Despite this, GLS lesions hadmoved to the ear leaf and above on the more susceptible hybrids by 3 Aug and tothe top plants by 20 Aug. Significant differences in GLS ratings among hybridswere apparent at all rating periods. At harvest, statistical differences amonghybrids occurred in grain yield, grain moisture at harvest, and bushel weights.Generally those hybrids that blighted least had the higher yields. Thesusceptible check hybrid, Pioneer Brand 3394, although the most heavilyblighted, yielded 46th out of the 49 hybrids evaluated.
GLS Severity Index (0-5)2 Grain3 Bu wt4 Yield5
H2O in lbs Bu/AHybrid1 8/3 8/20 9/1 9/17 10/12 10/12 10/12
________________________________________________________________________________
SOUTHERNSTATES 943 1.5k 1.8s 2.2s 4.2i-l 20.6a-c 48.8st 182.7a6
FFR EXP 76348 . . 1.5k 2.0rs 2.3rs 4.00lm 20.5a-d 49.5s 162.0abSOUTHERNSTATES 897 1.7jk 2.1p-r 2.7m-r 4.2j-l 19.8b-g 50.7r 158.9a-cPIONEER 33Y18 . . 2.0b-h 2.3i-p 3.2h-m 4.5e-j 17.3k-o 58.1a 158.3a-cAUGUSTA 385 . . . 1.7I-k 2.3j-q 3.0k-p 4.5f-j 17.6j-o 51.7p-r 157.5a-cBECK'S 8280 . . . 1.9f-j 2.2k-q 3.1i-n 4.6c-I 19.2d-I 55.2c-h 156.9a-dBECK'S 5405 . . . 1.5k 2.2m-r 3.2g-m 4.7a-g 15.5q-t 51.5p-r 156.2b-dDEKALB DK658 . . . 2.1b-g 2.4g-n 3.4f-k 4.6b-h 17.3k-o 53.6j-n 155.6b-dDEKALB DK679 . . . 1.8h-j 2.3i-p 3.2g-m 4.8a-g 18.9e-j 55.2c-h 154.7b-eASGROW RX773 . . . 2.1b-g 2.4g-o 3.4f-k 4.6e-I 18.2h-m 54.1g-m 154.0b-eNOVARTIS NX6527 . 2.1b-h 2.4f-l 3.6c-I 4.7a-g 16.6o-r 54.4f-k 153.5b-eAUGUSTA 2062AA . . 1.90e-j 2.2k-q 2.8l-q 4.1kl 19.8b-f 53.9i-m 153.4b-eBECK'S 6580 . . . 1.8g-j 2.2l-q 2.8l-q 4.7a-g 17.2l-o 53.0m-o 152.8b-f
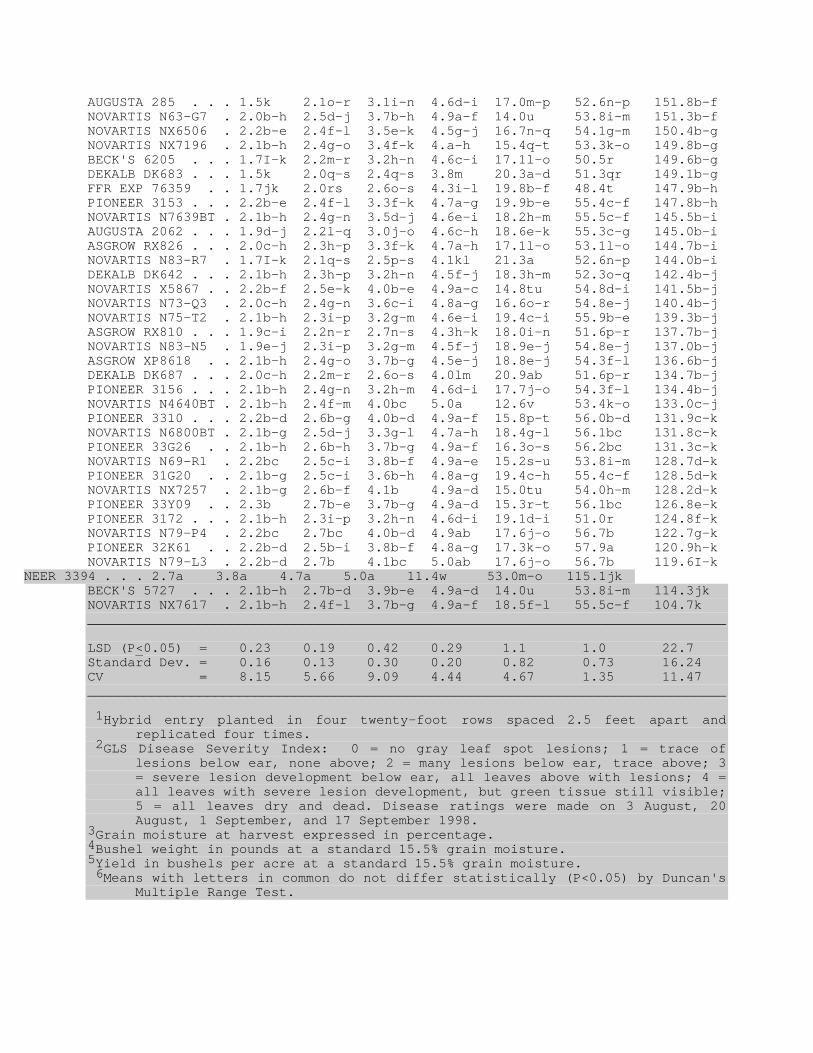
AUGUSTA 285 . . . 1.5k 2.1o-r 3.1i-n 4.6d-i 17.0m-p 52.6n-p 151.8b-fNOVARTIS N63-G7 . 2.0b-h 2.5d-j 3.7b-h 4.9a-f 14.0u 53.8i-m 151.3b-fNOVARTIS NX6506 . 2.2b-e 2.4f-l 3.5e-k 4.5g-j 16.7n-q 54.1g-m 150.4b-gNOVARTIS NX7196 . 2.1b-h 2.4g-o 3.4f-k 4.a-h 15.4q-t 53.3k-o 149.8b-gBECK'S 6205 . . . 1.7I-k 2.2m-r 3.2h-n 4.6c-i 17.1l-o 50.5r 149.6b-gDEKALB DK683 . . . 1.5k 2.0q-s 2.4q-s 3.8m 20.3a-d 51.3qr 149.1b-gFFR EXP 76359 . . 1.7jk 2.0rs 2.6o-s 4.3i-l 19.8b-f 48.4t 147.9b-hPIONEER 3153 . . . 2.2b-e 2.4f-l 3.3f-k 4.7a-g 19.9b-e 55.4c-f 147.8b-hNOVARTIS N7639BT . 2.1b-h 2.4g-n 3.5d-j 4.6e-i 18.2h-m 55.5c-f 145.5b-iAUGUSTA 2062 . . . 1.9d-j 2.2l-q 3.0j-o 4.6c-h 18.6e-k 55.3c-g 145.0b-iASGROW RX826 . . . 2.0c-h 2.3h-p 3.3f-k 4.7a-h 17.1l-o 53.1l-o 144.7b-iNOVARTIS N83-R7 . 1.7I-k 2.1q-s 2.5p-s 4.1kl 21.3a 52.6n-p 144.0b-iDEKALB DK642 . . . 2.1b-h 2.3h-p 3.2h-n 4.5f-j 18.3h-m 52.3o-q 142.4b-jNOVARTIS X5867 . . 2.2b-f 2.5e-k 4.0b-e 4.9a-c 14.8tu 54.8d-i 141.5b-jNOVARTIS N73-Q3 . 2.0c-h 2.4g-n 3.6c-i 4.8a-g 16.6o-r 54.8e-j 140.4b-jNOVARTIS N75-T2 . 2.1b-h 2.3i-p 3.2g-m 4.6e-i 19.4c-i 55.9b-e 139.3b-jASGROW RX810 . . . 1.9c-i 2.2n-r 2.7n-s 4.3h-k 18.0i-n 51.6p-r 137.7b-jNOVARTIS N83-N5 . 1.9e-j 2.3i-p 3.2g-m 4.5f-j 18.9e-j 54.8e-j 137.0b-jASGROW XP8618 . . 2.1b-h 2.4g-o 3.7b-g 4.5e-j 18.8e-j 54.3f-l 136.6b-jDEKALB DK687 . . . 2.0c-h 2.2m-r 2.6o-s 4.0lm 20.9ab 51.6p-r 134.7b-jPIONEER 3156 . . . 2.1b-h 2.4g-n 3.2h-m 4.6d-i 17.7j-o 54.3f-l 134.4b-jNOVARTIS N4640BT . 2.1b-h 2.4f-m 4.0bc 5.0a 12.6v 53.4k-o 133.0c-jPIONEER 3310 . . . 2.2b-d 2.6b-g 4.0b-d 4.9a-f 15.8p-t 56.0b-d 131.9c-kNOVARTIS N6800BT . 2.1b-g 2.5d-j 3.3g-l 4.7a-h 18.4g-l 56.1bc 131.8c-kPIONEER 33G26 . . 2.1b-h 2.6b-h 3.7b-g 4.9a-f 16.3o-s 56.2bc 131.3c-kNOVARTIS N69-R1 . 2.2bc 2.5c-i 3.8b-f 4.9a-e 15.2s-u 53.8i-m 128.7d-kPIONEER 31G20 . . 2.1b-g 2.5c-i 3.6b-h 4.8a-g 19.4c-h 55.4c-f 128.5d-kNOVARTIS NX7257 . 2.1b-g 2.6b-f 4.1b 4.9a-d 15.0tu 54.0h-m 128.2d-kPIONEER 33Y09 . . 2.3b 2.7b-e 3.7b-g 4.9a-d 15.3r-t 56.1bc 126.8e-kPIONEER 3172 . . . 2.1b-h 2.3i-p 3.2h-n 4.6d-i 19.1d-i 51.0r 124.8f-kNOVARTIS N79-P4 . 2.2bc 2.7bc 4.0b-d 4.9ab 17.6j-o 56.7b 122.7g-kPIONEER 32K61 . . 2.2b-d 2.5b-i 3.8b-f 4.8a-g 17.3k-o 57.9a 120.9h-kNOVARTIS N79-L3 . 2.2b-d 2.7b 4.1bc 5.0ab 17.6j-o 56.7b 119.6I-k
BECK'S 5727 . . . 2.1b-h 2.7b-d 3.9b-e 4.9a-d 14.0u 53.8i-m 114.3jkNOVARTIS NX7617 . 2.1b-h 2.4f-l 3.7b-g 4.9a-f 18.5f-l 55.5c-f 104.7k________________________________________________________________________________
LSD (P<0.05) = 0.23 0.19 0.42 0.29 1.1 1.0 22.7Standard Dev. = 0.16 0.13 0.30 0.20 0.82 0.73 16.24CV = 8.15 5.66 9.09 4.44 4.67 1.35 11.47________________________________________________________________________________
1Hybrid entry planted in four twenty-foot rows spaced 2.5 feet apart andreplicated four times.
2GLS Disease Severity Index: 0 = no gray leaf spot lesions; 1 = trace oflesions below ear, none above; 2 = many lesions below ear, trace above; 3= severe lesion development below ear, all leaves above with lesions; 4 =all leaves with severe lesion development, but green tissue still visible;5 = all leaves dry and dead. Disease ratings were made on 3 August, 20August, 1 September, and 17 September 1998.
3Grain moisture at harvest expressed in percentage.4Bushel weight in pounds at a standard 15.5% grain moisture.5Yield in bushels per acre at a standard 15.5% grain moisture. 6Means with letters in common do not differ statistically (P<0.05) by Duncan's
Multiple Range Test.
NEER 3394 . . . 2.7a 3.8a 4.7a 5.0a 11.4w 53.0m-o 115.1jk