Embed Size (px)
Citation preview

February 13, 2015
ICICI Securities Ltd | Retail Equity Research
Result Update
Higher prices lead to margin expansion… • India Cement’s Q3FY15 results came in line with our estimates with
revenues at | 1035.9 crore and net profit posting a loss of | 11.7 crore vs. our estimated revenue and loss of | 1034.8 crore and net loss of | 7.3 crore, respectively
• Sales volumes declined 8.0% YoY to 2.1 MT (in line with our estimate of 2.1 MT) while realisation for the quarter improved 8.3% YoY to | 4795/tonne. Cement EBITDA/tonne stood at | 755/tonne vs. | 592/tonne in Q3FY14 (up ~27.5% YoY). On a QoQ basis also, it improved 22.3% led by an increase in cement prices and a decline in power & fuel costs
• The pricing environment in the south continues to remain stable. On the cost front, road freight is expected to see a decline of ~5-7% on account of diesel price decline which should help the company to further improve margins going forward.
Fifth largest player in India with strong presence in south (AP, Karnataka)
India Cement is the fifth-largest cement player in India and the largest player in South India. Out of total cement sales, ~85-90% of sales come from the southern region for the company. Due to excess capacity in the southern region, particularly Andhra Pradesh (AP) where the company has over 49% of its total capacity, it reported muted revenue growth i.e. at a CAGR of 4.2% during FY10-14. Further, with power problems in AP and low capacity utilisation (~60-62%), its operating margins have come down sharply from 21.9% in FY10 to 12.1% in FY14. With the Telangana issue now resolved, we expect overall utilisation in the southern region to improve over the next two or three years. While the bottoming out of demand in South India is a key positive for India Cement, the utilisation level is unlikely to exceed ~67-68% till FY17-18E, which will limit the volume growth for the company.
Margins to remain flattish led by high power costs
Although the company commissioned the 50 MW power plant in AP, it went into maintenance due to some technical problem. This led to further delays in stabilisation of the power plant. As a result, its power cost per tonne remained higher at | 1273/tonne in FY14 (i.e. 20% higher than average industry cost). We expect it to continue to be higher till the plant stabilises. In addition, inefficiency of some older plants also remains a structural cost concern for the company. In this situation, we expect a margin expansion to happen gradually through price hikes in the next two years.
Investment in unrelated businesses keeps RoE at lower levels
India Cement has investments worth ~| 2300 crore in non-cement assets of which ~| 700 crore is invested in the shipping and IPL business. Apart from this, the company is invested in Coromandel Sugar & Travels and Jagati Publications Carmel Holdings. In the absence of healthy earnings from these businesses (EBITDA of | 46 crore in FY14, | 56 crore in FY13), its RoE has remained lower at 4% in FY13 and -0.9% in FY14.
High risks, low RoE factored in valuations; maintain BUY
At the CMP of | 104, the stock is available at $66/tonne on capacity of 15.5 MT, which is still 35% cheaper than the average valuations of midcap companies. Given the healthy pricing scenario coupled with an expected pick-up in demand, we remain positive on the company and maintain our BUY rating on the stock with a revised target price of | 127/share (i.e. valuing at $73/tonne on FY17E capacity and 6.5x FY17E EV/EBITDA).
India Cement (INDCEM) | 103
Rating matrix Rating : BuyTarget : | 127Target Period : 12-15 monthsPotential Upside : 22%
What’s changed? Target Changed from |141 to |127EPS FY15E UnchangedEPS FY16E Changed from |6.6 to |5.7EPS FY17E Changed from | 7.8 to |9.3Rating Unchanged
Quarterly performance
Q3FY15 Q3FY14 YoY (%) Q2FY15 QoQ (%)Revenue 1,035.9 1,036.5 -0.1 1,131.7 -8.5EBITDA 158.7 144.4 10.0 179.1 -11.4EBITDA (%) 15.3 13.9 140 bps 15.8 -51 bpsPAT (11.7) 0.4 PL 7.5 NA
Key financials | Crore FY14 FY15E FY16E FY17E
Net Sales 4,440.9 4,616.3 5,004.5 5,363.6
EBITDA 537.1 703.5 922.2 1,031.5Net Profit (35.9) 27.2 166.3 251.5
EPS (|) (1.2) 0.9 5.4 8.2 Valuation summary
FY14 FY15E FY16E FY17E
P/E 0.0 118.6 19.4 12.8
Target P/E NA 143.4 23.5 15.5
EV/EBITDA 11.2 9.0 6.7 5.9
EV/Tonne($) 71 68 67 66
P/BV 0.8 0.9 0.8 0.7RoNW (%) (0.9) 0.7 3.9 5.5
RoCE (%) 3.9 6.4 8.9 10.0 Stock data
Amount
Mcap | 3226 crore
Debt (FY15E) | 3080 crore
Cash & Invest (FY15E) | 31 crore
EV | 6274 crore
52 week H/L | 134 / 48
Equity cap | 307.2 crore
Face value | 10
Particular
Price performance
1M 3M 6M 12M
Heildelberg Cem. 8.2 0.4 40.9 126.3
India Cement 34.2 -3.1 5.6 99.4
JK Cement 11.9 26.1 84.6 293.2
JK Lakshmi Cem. 1.9 15.9 82.6 458.6 Research Analyst
Rashesh Shah [email protected]

ICICI Securities Ltd | Retail Equity Research Page 2
Variance analysis Q3FY15 Q4FY14E Q3FY14 YoY (%) Q2FY15 QoQ (%) Comments
Total Operating Income 1035.9 1103.6 1036.5 -0.1 1,131.7 -8.5Cement volumes declined 3.7% YoY to 2.35 MT while realisation improved sharply by 13.1% YoY to | 4655/tonne
Other Income 4.7 3.5 1.9 143.0 4.2 12.5Raw Material Expenses 145.2 155.0 137.7 5.5 173.6 -16.4Employee Expenses 78.3 75.4 83.1 -5.7 76.8 2.0Stock Adjustment 15.1 0.0 1.3 NA -15.9 -195.1
Power & Fuel 262.0 285.8 296.1 -11.5 296.3 -11.6Low cement volumes coupled with a fall in international coal prices led to a decline in total power cost.On a per tonne basis, it remained flat at | 1261/tonne
Freight cost 224.7 255.4 231.8 -3.1 265.1 -15.3Others 151.9 136.9 142.3 6.7 156.6 -3.0EBITDA 158.7 195.1 144.4 10.0 179.1 -11.4
EBITDA Margin (%) 15.3 17.7 13.9 140 bps 15.8 -51 bpsLower operating cost led to 408 bps expansion in margins. However, the same remained lower than our estimates due to higher freight costs during the quarter
Interest 108.7 97.8 77.3 40.7 109.5 -0.7Depreciation 66.4 66.9 68.6 -3.2 66.3 0.1PBT -11.7 24.8 0.4 -2,881.0 7.5 -255.9Total Tax 0.0 -3.1 0.0 NA 0.0 NAPAT -11.7 24.8 0.4 PL 7.5 NA
Key MetricsVolume (MT) 2.35 2.36 2.44 -3.7 2.56 -8.1 Sales volume declined on account of poor demand in APRealisation (|) 4,655 4,394 4,116 13.1 4,244 9.7Cement EBITDA per Tonne (|) 618 538 408 51.3 448 37.9
Better realisation and lower power cost helped to improve EBITDA/tonne for the quarter on a QoQ basis
Source: Company, ICICIdirect.com Research Change in estimates
(| Crore) Old New % Change Old New % Change Old New % Change Comments
Revenue 4,895.3 4,644.6 -5.1 5,331.8 5,040.1 -5.5 NA 5,415.4 NA
We expect FY15 to be a challenging year in terms of volume growth amid excess capacity in the southern region. However, strong pricing environment would be a key driver for revenue growth
EBITDA 746.4 751.2 0.6 916.2 934.8 2.0 NA 1,083.3 NA
EBITDA Margin (%) 15.2 16.2 93 bps 17.2 18.5 136 bps NA 20.0 NA
Margins are expected to recover from FY16E led by improvement pricing environemnt and stabilisation of new power plant
PAT 47.4 74.9 58.0 184.4 174.7 -5.3 NA 286.7 NAEPS (|) 1.5 2.4 58.0 6.0 5.7 -5.3 NA 9.3 NA
FY15E FY16E FY17E
Source: Company, ICICIdirect.com Research Assumptions
CommentsFY13 FY14 FY15E FY16E FY17E FY15E FY16E FY17E
Volume (MT) 10.1 10.0 9.5 10.0 10.4 10.4 10.7 NAWe remain conservative on the volume growth front with visible recovery from FY16E onwards
Cement Realisation (|) 4,362 4,183 4,626 4,735 4,958 4,278 4,490.0 NAHowever, we expect pricing environment to remain strong due to improvement in demand
Cement EBITDA per Tonne (|) 783 289 556 670 773 323 518.0 NAExpect lower EBITDA/tonne than industry due to high exposure in AP
EarlierCurrent
Source: Company, ICICIdirect.com Research
ICICI Securities Ltd | Retail Equity Research Page 3
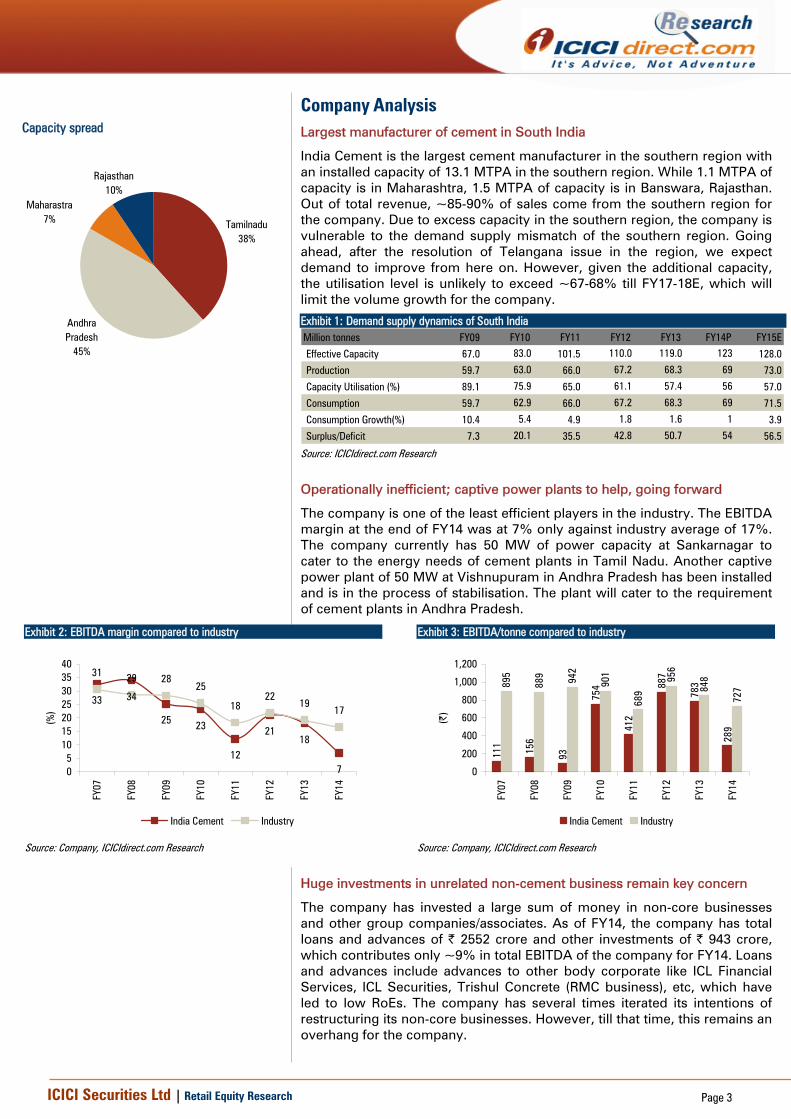
Company Analysis Largest manufacturer of cement in South India
India Cement is the largest cement manufacturer in the southern region with an installed capacity of 13.1 MTPA in the southern region. While 1.1 MTPA of capacity is in Maharashtra, 1.5 MTPA of capacity is in Banswara, Rajasthan. Out of total revenue, ~85-90% of sales come from the southern region for the company. Due to excess capacity in the southern region, the company is vulnerable to the demand supply mismatch of the southern region. Going ahead, after the resolution of Telangana issue in the region, we expect demand to improve from here on. However, given the additional capacity, the utilisation level is unlikely to exceed ~67-68% till FY17-18E, which will limit the volume growth for the company.
Exhibit 1: Demand supply dynamics of South India Million tonnes FY09 FY10 FY11 FY12 FY13 FY14P FY15E
Effective Capacity 67.0 83.0 101.5 110.0 119.0 123 128.0
Production 59.7 63.0 66.0 67.2 68.3 69 73.0
Capacity Utilisation (%) 89.1 75.9 65.0 61.1 57.4 56 57.0
Consumption 59.7 62.9 66.0 67.2 68.3 69 71.5
Consumption Growth(%) 10.4 5.4 4.9 1.8 1.6 1 3.9
Surplus/Deficit 7.3 20.1 35.5 42.8 50.7 54 56.5 Source: ICICIdirect.com Research
Operationally inefficient; captive power plants to help, going forward
The company is one of the least efficient players in the industry. The EBITDA margin at the end of FY14 was at 7% only against industry average of 17%. The company currently has 50 MW of power capacity at Sankarnagar to cater to the energy needs of cement plants in Tamil Nadu. Another captive power plant of 50 MW at Vishnupuram in Andhra Pradesh has been installed and is in the process of stabilisation. The plant will cater to the requirement of cement plants in Andhra Pradesh.
Exhibit 2: EBITDA margin compared to industry
33 34
25 23
12
2118
7
31 29 2825
1822
1917
05
10152025303540
FY07
FY08
FY09
FY10
FY11
FY12
FY13
FY14
(%)
India Cement Industry
Source: Company, ICICIdirect.com Research
Exhibit 3: EBITDA/tonne compared to industry
111 156
93
754
412
887
783
289
895
889 942
901
689
956
848
727
0
200
400
600
800
1,000
1,200
FY07
FY08
FY09
FY10
FY11
FY12
FY13
FY14
(|)
India Cement Industry
Source: Company, ICICIdirect.com Research
Huge investments in unrelated non-cement business remain key concern
The company has invested a large sum of money in non-core businesses and other group companies/associates. As of FY14, the company has total loans and advances of | 2552 crore and other investments of | 943 crore, which contributes only ~9% in total EBITDA of the company for FY14. Loans and advances include advances to other body corporate like ICL Financial Services, ICL Securities, Trishul Concrete (RMC business), etc, which have led to low RoEs. The company has several times iterated its intentions of restructuring its non-core businesses. However, till that time, this remains an overhang for the company.
Capacity spread
Tamilnadu38%
Andhra Pradesh
45%
Maharastra7%
Rajasthan10%

ICICI Securities Ltd | Retail Equity Research Page 4
Expect revenue CAGR of 6.5% during FY14-17E
The company’s revenue has grown at a CAGR of 4.2% during FY10-14 while in FY12-14, the growth was lower at 2.8% led by a slowdown in AP coupled with higher cement capacity. Going forward, with the resolution of the Telangana issue and a strong focus towards infrastructure development by the government, we expect revenue CAGR of 6.5% in FY14-17E. We expect volume growth at a CAGR of 1.1% during our forecast period of FY14-17E while realisations are expected to grow at 5.5% on account of an improvement in capacity utilisations.
Exhibit 4: Expect revenue CAGR of 6.5% during FY14-17E
3771 35014203
4597 4441 46165005
5364
0
1000
2000
3000
4000
5000
6000
FY10 FY11 FY12 FY13 FY14 FY15E FY16E FY17E
Net Sales (| crore)
Source: Company, ICICIdirect.com Research
Exhibit 5: Capacity addition plans State Region MT
Sankarnagar, Tirunelveli Tamilnadu South 2.1
Sankari, Salem Tamilnadu South 0.9Dalavoi, Ariyalur Tamilnadu South 1.9
Vallur Village, Tiruvallur Tamilnadu South 1.1Chilamakur, Kadapa Andhra Pradesh South 1.5
Yerraguntla, Kadapa Andhra Pradesh South 0.7
Vishnupuram, Nalgonda Andhra Pradesh South 2.5
Malkapur, Ranga Reddy Andhra Pradesh South 2.4Parli Vaijnath, Beed Maharashtra West 1.1
banswara Rajasthan North 1.5Total 15.7
Source: Company, ICICIdirect.com Research
Exhibit 6: Volume to grow at CAGR of 1.1% during FY14-17E
10.969.97 9.53 10.05 10.02 10.45 11.01 11.51
0.00
3.00
6.00
9.00
12.00
15.00
FY10 FY11 FY12 FY13 FY14 FY15E FY16E FY17E
Sales Volumes (In mn)
Source: Company, ICICIdirect.com Research
Exhibit 7: Realisation to grow at CAGR of 5.5% during FY14-17E
3266 33754215 4362 4183 4613 4723 4908
0
2000
4000
6000
FY10
FY11
FY12
FY13
FY14
FY15
E
FY16
E
FY17
E
(|/to
nne)
-10
0
10
20
30
(%)
Cement Realisation (|/tonne) -LS Growth (%) -RS
Source: Company, ICICIdirect.com Research
Exhibit 8: Volumes decline 8.0% YoY Q3FY15 due to lower demand…
2.31 2.43
2.19 2.
60
2.38 2.48
2.42 2.
78
2.65
2.44
2.29 2.
64
2.56
2.35
2.11
0.00
0.501.00
1.50
2.002.50
3.00
Q1FY
12
Q2FY
12
Q3FY
12
Q4FY
12
Q1FY
13
Q2FY
13
Q3FY
13
Q4FY
13
Q1FY
14
Q2FY
14
Q3FY
14
Q4FY
14
Q1FY
15
Q2FY
15
Q3FY
15
-15.0
-10.0-5.0
0.0
5.010.0
15.0
Sales volumes (In MT) -LHS Growth (%) -RHS
Source: Company, ICICIdirect.com Research
Exhibit 9: …but realisations up 8.3% YoY to | 4795/tonne
4148
4223
4241
4245 44
6644
1143
7342
2141
8941
16 4429
4027 42
44 4655 4795
2000250030003500400045005000
Q1FY
12Q2
FY12
Q3FY
12Q4
FY12
Q1FY
13Q2
FY13
Q3FY
13Q4
FY13
Q1FY
14Q2
FY14
Q3FY
14Q4
FY14
Q1FY
15Q2
FY15
Q3FY
15
|/to
nne
-1001020304050
(%)
Realisation-LHS Growth (%) -RHS
`
Source: Company, ICICIdirect.com Research

ICICI Securities Ltd | Retail Equity Research Page 5
Margins to improve gradually, going forward
We expect margins to improve gradually during our forecast period of FY14-17E led by healthy realisations and reduction in power & freight cost/tonne.
Exhibit 10: Expect EBITDA/tonne of |723 in FY17E
754
412
887783
289
506658
723
0
200
400
600
800
1000
FY10 FY11 FY12 FY13 FY14 FY15E FY16E FY17E
|
Cement EBITDA/Tonne
Source: Company, ICICIdirect.com Research
Exhibit 11: Margins to pick-up from FY17E
21.9
12.4
21.518.3
12.115.2
18.4 19.2
05
101520253035
FY10 FY11 FY12 FY13 FY14 FY15E FY16E FY17E
(%)
EBITDA Margin (%)
Source: Company, ICICIdirect.com Research
Exhibit 12: Q3FY15 cement EBITDA improved due to higher cement prices
988887 862 819
1029
778 792
569 572408
592
388 448
618755
0
200
400
600
800
1000
1200
Q1FY
12
Q2FY
12
Q3FY
12
Q4FY
12
Q1FY
13
Q2FY
13
Q3FY
13
Q4FY
13
Q1FY
14
Q2FY
14
Q3FY
14
Q4FY
14
Q1FY
15
Q2FY
15
Q3FY
15
Source: Company, ICICIdirect.com Research
Exhibit 13: Margin trend (%)
23.120.719.3
23.1
18.317.814.115.4
11.713.9
6.9
12.915.3
22.915.8
0
5
10
15
20
25
Q1FY
12
Q2FY
12
Q3FY
12
Q4FY
12
Q1FY
13
Q2FY
13
Q3FY
13
Q4FY
13
Q1FY
14
Q2FY
14
Q3FY
14
Q4FY
14
Q1FY
15
Q2FY
15
Q3FY
15
(%)
EBITDA Margin (%)
Source: Company, ICICIdirect.com Research
Expect net margins to improve during FY14-17E
After reporting a loss in FY14, we expect net margins to improve to 4.7% in FY17E from 3.6% in FY13. Overall, we expect the company to report a net profit of | 251.5 crore during FY17E from a loss of | 35.9 crore in FY14. Exhibit 14: Profitability trend
310.8
65.7
296.0
27.2
166.3
251.5
-35.9
176.39.4
4.7
0.6
3.33.6
7.0
1.9-0.8
-100
0
100
200
300
400
FY10 FY11 FY12 FY13 FY14 FY15E FY16E FY17E
| cr
ore
-5
0
5
10
15
20
(%)
Net profit - LS Net profit margin -RS
Source: Company, ICICIdirect.com Research

ICICI Securities Ltd | Retail Equity Research Page 6
Outlook and valuation With the Telangana issue now resolved, we expect the overall utilisation in the southern region to improve over the next two or three years. While the bottoming out of demand in South India is a key positive for India Cement, the utilisation level is unlikely to exceed the peak of FY13 till FY17-18E, which will limit the volume growth for the company. At the CMP of | 103, the stock is available at $66/tonne on capacity of 15.5 MT, which is still 35% cheaper than the average valuations of midcap companies. Given the healthy pricing scenario coupled with an expected pick-up in demand, we remain positive on the company and maintain our BUY rating on the stock with a revised target price of | 127/share (i.e. valuing at $73/tonne on FY17E capacity and 6.5x FY17E EV/EBITDA).
Exhibit 15: Key assumptions | per tonne (Blended) FY12 FY13 FY14 FY15E FY16E FY17E
Capacity Utilisation (%) 67.4 71.5 64.7 61.5 64.8 66.8
Realisation 4215 4362 4183 4613 4723 4908
Total Expenditure 3328 3579 3894 4106 4065 4185
Stock Adj 3 -19 -31 44 0 0
Raw material 568 575 604 685 735 755
Power & fuel 1149 1249 1273 1233 1260 1280
Employee 312 332 350 344 360 370
Freight 793 954 1007 1063 1070 1080
Others 503 489 691 738 640 700
EBITDA per Tonne 887 783 289 506 658 723
Source: ICICIdirect.com Research

ICICI Securities Ltd | Retail Equity Research Page 7
Exhibit 16: One year forward EV/EBITDA
0
2000
4000
6000
8000
10000
12000
Feb-
07
Aug-
07
Feb-
08
Aug-
08
Feb-
09
Aug-
09
Feb-
10
Aug-
10
Feb-
11
Aug-
11
Feb-
12
Aug-
12
Feb-
13
Aug-
13
Feb-
14
Aug-
14
Feb-
15
(| C
rore
)EV 10.4x 9.4x 8.5x 7.5x 5.6x
Source: Company, ICICIdirect.com Research
Exhibit 17: One year forward EV/Tonne
0
1000
2000
3000
4000
Feb-
07
Aug-
07
Feb-
08
Aug-
08
Feb-
09
Aug-
09
Feb-
10
Aug-
10
Feb-
11
Aug-
11
Feb-
12
Aug-
12
Feb-
13
Aug-
13
Feb-
14
Aug-
14
Feb-
15
Milli
on $
EV $180 $160 $140 $120 $80
Source: Company, ICICIdirect.com Research
Exhibit 18: Valuations Sales Growth EPS Growth PE EV/EBITDA EV/Tonne RoNW RoCE
(Rs cr) (%) (Rs) (%) (x) (x) (x) (%) (%)FY14 4597.0 9.4 5.3 -44.2 19.7 7.2 71 4.0 8.1FY15E 4440.9 -3.4 -1.2 -121.9 0.0 11.2 68 -0.9 3.9FY16E 4616.3 4.0 0.9 -175.9 118.6 9.0 67 0.7 6.4FY17E 5004.5 8.4 5.4 511.2 19.4 6.7 66 3.9 8.9
Source: Company, ICICIdirect.com Research

ICICI Securities Ltd | Retail Equity Research Page 8
Company snapshot
0
20
40
60
80
100
120
140
160
180
Jan-
09
Apr-0
9
Jul-0
9
Oct-0
9
Jan-
10
Apr-1
0
Jul-1
0
Oct-1
0
Jan-
11
Apr-1
1
Jul-1
1
Oct-1
1
Jan-
12
Apr-1
2
Jul-1
2
Oct-1
2
Jan-
13
Apr-1
3
Jul-1
3
Oct-1
3
Jan-
14
Apr-1
4
Jul-1
4
Oct-1
4
Jan-
15
Apr-1
5
Jul-1
5
Oct-1
5
Jan-
16
Target price: |127
Source: Bloomberg, Company, ICICIdirect.com Research Key events Date EventMar-08 The company revives their shipping business with the purchase of two ships (dry bulk carriers) with a total capacity of 79,843 DWT. Commences commercial
production of 1 MT grinding plant at Chennai. Also, the company successfully bids for the Chennai franchise of the DLF-IPL 20/20 Cricket Tournament - 'Chennai Super Kings'.
Feb-09 Completes and commences commercial production of 1 MT grinding plant at Parli (Maharashtra). The company's subsidiary, namely, Trishul Concrete Products Ltd gets completed and commences commercial production of 1 lakh cuic metre ready mix concrete plant at Hyderabad (Andhra Pradesh)
Apr-09 The company upgrades capacity of kiln I to 3000 TPD (1700 TPD) at Vishnupuram
Sep-09 Announces plans to set up two 50 MW power plant in Shankar Nagar, Tamil Nadu and Andhra Pradesh with total capex of | 500 crore
Jan-10 ICL Financial Services Ltd (ICLFSL), the company's wholly-owned subsidiary, acquires 60.89% (including shares acquired under open offer) equity share capital in Indo Zinc Ltd (IZL). Consequently, IZL became a subsidiary of ICLFSL and ultimate subsidiary of the company. The company set up PT. Coromandel Minerals Resources as subsidiary in Indonesia for acquiring coal concessions
Apr-10 The company obtains ISO 9001 certification for quality assurance for their Dalavoi Plant.
Jun-10 The company completes upgradation of capacity at Chilamakur to 4500 tonnes per day
Jun-12 CCI fines company with penalty of | 187.5 crore on alleged cartelisation
Aug-12 Reports Q1FY12 results with 39% fall in profit, misses forecast due to overcapacity in South
Sep-12 COMPAT serves notice to CCI in cement cartelisation case
May-13 COMPAT directs cement companies to pay 10% penalty
Oct-13 Supreme Court bars company promoter N Srinivasan from taking charge as BCCI President till investigation gets complete w.r.t. IPL probe
Feb-15 Company transfred IPL division into separate subsidiary company Chennai Super Kings Cricket (CSKC) limited
Source: Company, ICICIdirect.com Research Top 10 Shareholders Shareholding Pattern Rank Name Latest Filing Date % O/S Position (m) Change (m)1 BNY Mellon Asset Management 31-Dec-14 9.80 30.1 0.12 EWS Finance & Investments Ltd. 31-Dec-14 9.00 27.6 0.03 Prince Holdings Madras Pvt. Ltd. 31-Dec-14 8.30 25.5 0.04 Subramanian (Vidya) 31-Dec-14 6.50 20.0 0.05 Life Insurance Corporation of India 31-Dec-14 6.06 18.6 0.06 Trishul Investments Pvt. Ltd. 31-Dec-14 5.71 17.5 0.07 The Boston Company Asset Management, LLC 1-Jul-14 5.24 16.1 -6.28 AfrAsia Capital Management Ltd 31-Dec-14 4.56 14.0 0.09 Anna Investments Pvt. Ltd. 31-Dec-14 4.24 13.0 0.010 HSBC Global Asset Management (Hong Kong) Limited 31-Dec-14 4.10 12.6 -0.4
(in %) Dec-13 Mar-14 Jun-14 Sep-14 Dec-14Promoter 28.23 28.23 28.23 28.23 28.23FII 35.10 35.96 36.12 35.96 33.07DII 12.74 11.97 12.15 11.97 12.50Others 23.93 23.84 23.50 23.84 26.20
Source: Reuters, ICICIdirect.com Research Recent Activity
Investor name Value Shares Investor name Value SharesDimensional Fund Advisors, L.P. 12.30m 9.07m The Boston Company Asset Management, LLC -10.50m -6.15m Napean Trading & Investment Company Pvt. Ltd. 4.92m 3.63m Artisan Partners Limited Partnership -2.52m -2.11m Barclays Capital Mauritius, Ltd. 4.51m 3.32m GMO LLC -2.14m -1.86m Norges Bank Investment Management (NBIM) 3.07m 2.82m Raiffeisen Kapitalanlage-Gesellschaft mbH -1.35m -1.67m Reliance Capital Asset Management Ltd. 2.75m 2.26m Robeco Institutional Asset Management B.V. -0.72m -1.03m
Buys Sells
ICICI Securities Ltd | Retail Equity Research Page 9
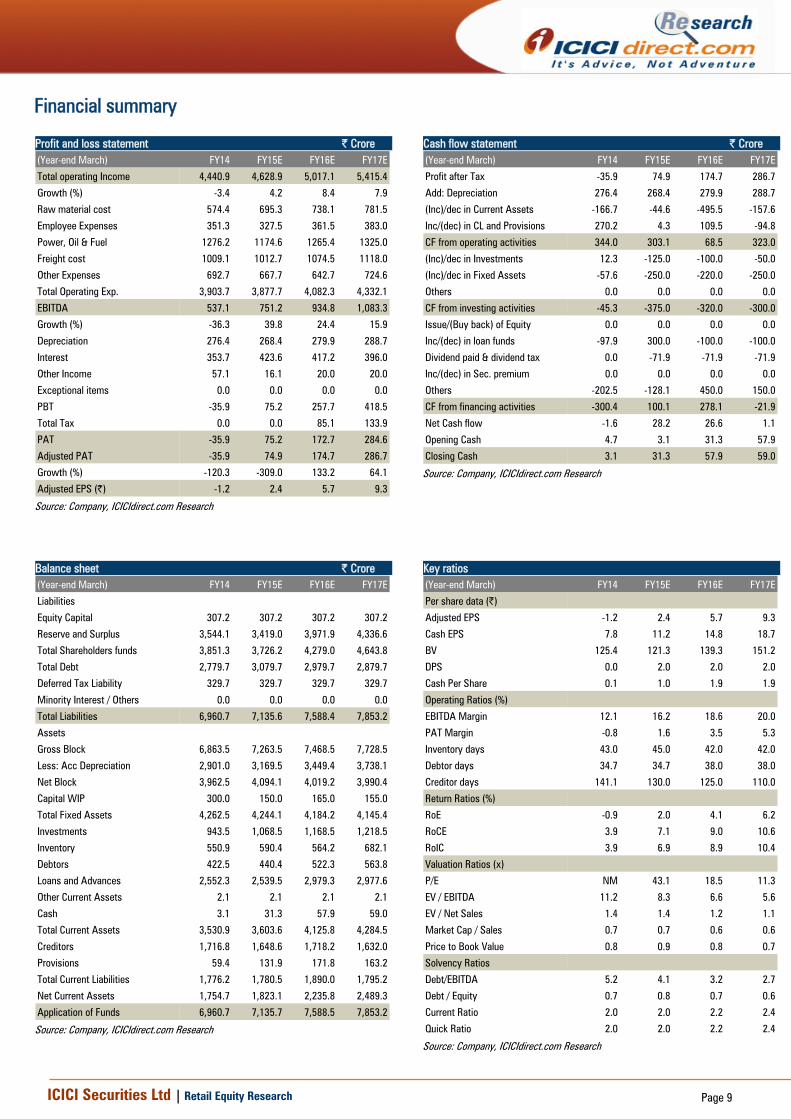
Financial summary Profit and loss statement | Crore (Year-end March) FY14 FY15E FY16E FY17E
Total operating Income 4,440.9 4,628.9 5,017.1 5,415.4
Growth (%) -3.4 4.2 8.4 7.9
Raw material cost 574.4 695.3 738.1 781.5
Employee Expenses 351.3 327.5 361.5 383.0
Power, Oil & Fuel 1276.2 1174.6 1265.4 1325.0
Freight cost 1009.1 1012.7 1074.5 1118.0
Other Expenses 692.7 667.7 642.7 724.6
Total Operating Exp. 3,903.7 3,877.7 4,082.3 4,332.1
EBITDA 537.1 751.2 934.8 1,083.3
Growth (%) -36.3 39.8 24.4 15.9
Depreciation 276.4 268.4 279.9 288.7
Interest 353.7 423.6 417.2 396.0
Other Income 57.1 16.1 20.0 20.0
Exceptional items 0.0 0.0 0.0 0.0
PBT -35.9 75.2 257.7 418.5
Total Tax 0.0 0.0 85.1 133.9
PAT -35.9 75.2 172.7 284.6
Adjusted PAT -35.9 74.9 174.7 286.7
Growth (%) -120.3 -309.0 133.2 64.1
Adjusted EPS (|) -1.2 2.4 5.7 9.3
Source: Company, ICICIdirect.com Research
Cash flow statement | Crore (Year-end March) FY14 FY15E FY16E FY17E
Profit after Tax -35.9 74.9 174.7 286.7
Add: Depreciation 276.4 268.4 279.9 288.7
(Inc)/dec in Current Assets -166.7 -44.6 -495.5 -157.6
Inc/(dec) in CL and Provisions 270.2 4.3 109.5 -94.8
CF from operating activities 344.0 303.1 68.5 323.0
(Inc)/dec in Investments 12.3 -125.0 -100.0 -50.0
(Inc)/dec in Fixed Assets -57.6 -250.0 -220.0 -250.0
Others 0.0 0.0 0.0 0.0
CF from investing activities -45.3 -375.0 -320.0 -300.0
Issue/(Buy back) of Equity 0.0 0.0 0.0 0.0
Inc/(dec) in loan funds -97.9 300.0 -100.0 -100.0
Dividend paid & dividend tax 0.0 -71.9 -71.9 -71.9
Inc/(dec) in Sec. premium 0.0 0.0 0.0 0.0
Others -202.5 -128.1 450.0 150.0
CF from financing activities -300.4 100.1 278.1 -21.9
Net Cash flow -1.6 28.2 26.6 1.1
Opening Cash 4.7 3.1 31.3 57.9
Closing Cash 3.1 31.3 57.9 59.0
Source: Company, ICICIdirect.com Research
Balance sheet | Crore (Year-end March) FY14 FY15E FY16E FY17E
Liabilities
Equity Capital 307.2 307.2 307.2 307.2
Reserve and Surplus 3,544.1 3,419.0 3,971.9 4,336.6
Total Shareholders funds 3,851.3 3,726.2 4,279.0 4,643.8
Total Debt 2,779.7 3,079.7 2,979.7 2,879.7
Deferred Tax Liability 329.7 329.7 329.7 329.7
Minority Interest / Others 0.0 0.0 0.0 0.0
Total Liabilities 6,960.7 7,135.6 7,588.4 7,853.2
Assets
Gross Block 6,863.5 7,263.5 7,468.5 7,728.5
Less: Acc Depreciation 2,901.0 3,169.5 3,449.4 3,738.1
Net Block 3,962.5 4,094.1 4,019.2 3,990.4
Capital WIP 300.0 150.0 165.0 155.0
Total Fixed Assets 4,262.5 4,244.1 4,184.2 4,145.4
Investments 943.5 1,068.5 1,168.5 1,218.5
Inventory 550.9 590.4 564.2 682.1
Debtors 422.5 440.4 522.3 563.8
Loans and Advances 2,552.3 2,539.5 2,979.3 2,977.6
Other Current Assets 2.1 2.1 2.1 2.1
Cash 3.1 31.3 57.9 59.0
Total Current Assets 3,530.9 3,603.6 4,125.8 4,284.5
Creditors 1,716.8 1,648.6 1,718.2 1,632.0
Provisions 59.4 131.9 171.8 163.2
Total Current Liabilities 1,776.2 1,780.5 1,890.0 1,795.2
Net Current Assets 1,754.7 1,823.1 2,235.8 2,489.3
Application of Funds 6,960.7 7,135.7 7,588.5 7,853.2
Source: Company, ICICIdirect.com Research
Key ratios (Year-end March) FY14 FY15E FY16E FY17E
Per share data (|)
Adjusted EPS -1.2 2.4 5.7 9.3
Cash EPS 7.8 11.2 14.8 18.7
BV 125.4 121.3 139.3 151.2
DPS 0.0 2.0 2.0 2.0
Cash Per Share 0.1 1.0 1.9 1.9
Operating Ratios (%)
EBITDA Margin 12.1 16.2 18.6 20.0
PAT Margin -0.8 1.6 3.5 5.3
Inventory days 43.0 45.0 42.0 42.0
Debtor days 34.7 34.7 38.0 38.0
Creditor days 141.1 130.0 125.0 110.0
Return Ratios (%)
RoE -0.9 2.0 4.1 6.2
RoCE 3.9 7.1 9.0 10.6
RoIC 3.9 6.9 8.9 10.4
Valuation Ratios (x)
P/E NM 43.1 18.5 11.3
EV / EBITDA 11.2 8.3 6.6 5.6
EV / Net Sales 1.4 1.4 1.2 1.1
Market Cap / Sales 0.7 0.7 0.6 0.6
Price to Book Value 0.8 0.9 0.8 0.7
Solvency Ratios
Debt/EBITDA 5.2 4.1 3.2 2.7
Debt / Equity 0.7 0.8 0.7 0.6
Current Ratio 2.0 2.0 2.2 2.4
Quick Ratio 2.0 2.0 2.2 2.4
Source: Company, ICICIdirect.com Research

ICICI Securities Ltd | Retail Equity Research Page 10
ICICIdirect.com coverage universe (Cement)
CMP M Cap(|) TP(|) Rating (| Cr) FY14 FY15E FY16E FY17E FY14 FY15E FY16E FY17E FY14 FY15E FY16E FY17E FY14 FY15E FY16E FY17E
ACC* 1551 1,635 HOLD 28,392 19.0 21.4 16.1 14.4 141 146 134 134 9.9 8.3 10.2 10.5 14.0 14.1 11.9 12.4Ambuja Cement* 250 241 HOLD 35,091 19.7 15.5 14.6 12.3 164 165 163 149 11.4 8.3 8.1 8.7 13.6 9.2 9.1 9.7UltraTech Cem 3008 3,240 HOLD 85,550 23.8 21.6 16.5 12.6 253 227 199 181 11.9 10.8 12.7 15.9 12.5 11.9 13.1 15.7Shree Cement^ 11084 11,200 HOLD 37,236 27.4 25.2 20.4 17.0 300 248 225 225 13.0 11.0 12.8 14.1 16.7 13.5 15.3 15.9Heidelberg Cem* 78 105 BUY 1,972 37.2 12.2 10.2 8.4 99 88 89 86 -0.5 6.2 8.2 10.2 -4.9 7.6 7.6 10.2India Cement 103 127 BUY 3,226 11.2 8.3 6.6 5.6 71 68 66 65 3.9 7.1 9.0 10.6 -0.9 2.0 4.1 6.2JK Cement 680 735 BUY 4,406 5.5 7.8 10.9 14.7 130 93 91 86 5.2 8.5 9.7 14.7 5.2 8.5 9.7 14.7JK Lakshmi Cem 379 458 BUY 4,449 18.3 15.9 11.7 8.4 139 106 99 89 6.1 7.7 9.6 13.5 7.1 9.4 12.6 15.7Mangalam Cem 281 322 BUY 750 22.8 12.1 7.3 5.6 54 54 56 55 2.1 6.2 12.1 15.4 5.8 4.4 10.8 13.9
RoE (%)RoCE (%)EV/Tonne ($)EV/EBITDA (x)Company
*CY14E, CY15E, CY16E ; ^JY15E,JY16E,JY17E. # Target price achieved Source: Company, ICICIdirect.com Research

ICICI Securities Ltd | Retail Equity Research Page 11
RATING RATIONALE ICICIdirect.com endeavours to provide objective opinions and recommendations. ICICIdirect.com assigns ratings to its stocks according to their notional target price vs. current market price and then categorises them as Strong Buy, Buy, Hold and Sell. The performance horizon is two years unless specified and the notional target price is defined as the analysts' valuation for a stock. Strong Buy: >15%/20% for large caps/midcaps, respectively, with high conviction; Buy: >10%/15% for large caps/midcaps, respectively; Hold: Up to +/-10%; Sell: -10% or more;
Pankaj Pandey Head – Research [email protected]
ICICIdirect.com Research Desk, ICICI Securities Limited, 1st Floor, Akruti Trade Centre, Road No. 7, MIDC, Andheri (East) Mumbai – 400 093

ICICI Securities Ltd | Retail Equity Research Page 12
ANALYST CERTIFICATION We /I, Rashesh Shah, CA, Research Analysts, authors and the names subscribed to this report, hereby certify that all of the views expressed in this research report accurately reflect our views about the subject issuer(s) or securities. We also certify that no part of our compensation was, is, or will be directly or indirectly related to the specific recommendation(s) or view(s) in this report.
Terms & conditions and other disclosures: ICICI Securities Limited (ICICI Securities) is a full-service, integrated investment banking and is, inter alia, engaged in the business of stock brokering and distribution of financial products. ICICI Securities is a wholly-owned subsidiary of ICICI Bank which is India’s largest private sector bank and has its various subsidiaries engaged in businesses of housing finance, asset management, life insurance, general insurance, venture capital fund management, etc. (“associates”), the details in respect of which are available on www.icicibank.com. ICICI Securities is one of the leading merchant bankers/ underwriters of securities and participate in virtually all securities trading markets in India. We and our associates might have investment banking and other business relationship with a significant percentage of companies covered by our Investment Research Department. ICICI Securities generally prohibits its analysts, persons reporting to analysts and their relatives from maintaining a financial interest in the securities or derivatives of any companies that the analysts cover. The information and opinions in this report have been prepared by ICICI Securities and are subject to change without any notice. The report and information contained herein is strictly confidential and meant solely for the selected recipient and may not be altered in any way, transmitted to, copied or distributed, in part or in whole, to any other person or to the media or reproduced in any form, without prior written consent of ICICI Securities. While we would endeavour to update the information herein on a reasonable basis, ICICI Securities is under no obligation to update or keep the information current. Also, there may be regulatory, compliance or other reasons that may prevent ICICI Securities from doing so. Non-rated securities indicate that rating on a particular security has been suspended temporarily and such suspension is in compliance with applicable regulations and/or ICICI Securities policies, in circumstances where ICICI Securities might be acting in an advisory capacity to this company, or in certain other circumstances. This report is based on information obtained from public sources and sources believed to be reliable, but no independent verification has been made nor is its accuracy or completeness guaranteed. This report and information herein is solely for informational purpose and shall not be used or considered as an offer document or solicitation of offer to buy or sell or subscribe for securities or other financial instruments. Though disseminated to all the customers simultaneously, not all customers may receive this report at the same time. ICICI Securities will not treat recipients as customers by virtue of their receiving this report. Nothing in this report constitutes investment, legal, accounting and tax advice or a representation that any investment or strategy is suitable or appropriate to your specific circumstances. The securities discussed and opinions expressed in this report may not be suitable for all investors, who must make their own investment decisions, based on their own investment objectives, financial positions and needs of specific recipient. This may not be taken in substitution for the exercise of independent judgment by any recipient. The recipient should independently evaluate the investment risks. The value and return on investment may vary because of changes in interest rates, foreign exchange rates or any other reason. ICICI Securities accepts no liabilities whatsoever for any loss or damage of any kind arising out of the use of this report. Past performance is not necessarily a guide to future performance. Investors are advised to see Risk Disclosure Document to understand the risks associated before investing in the securities markets. Actual results may differ materially from those set forth in projections. Forward-looking statements are not predictions and may be subject to change without notice. ICICI Securities or its associates might have managed or co-managed public offering of securities for the subject company or might have been mandated by the subject company for any other assignment in the past twelve months. ICICI Securities or its associates might have received any compensation from the companies mentioned in the report during the period preceding twelve months from the date of this report for services in respect of managing or co-managing public offerings, corporate finance, investment banking or merchant banking, brokerage services or other advisory service in a merger or specific transaction. ICICI Securities or its associates might have received any compensation for products or services other than investment banking or merchant banking or brokerage services from the companies mentioned in the report in the past twelve months. ICICI Securities encourages independence in research report preparation and strives to minimize conflict in preparation of research report. ICICI Securities or its analysts did not receive any compensation or other benefits from the companies mentioned in the report or third party in connection with preparation of the research report. Accordingly, neither ICICI Securities nor Research Analysts have any material conflict of interest at the time of publication of this report. It is confirmed that Rashesh Shah, CA, Research Analysts of this report have not received any compensation from the companies mentioned in the report in the preceding twelve months. Compensation of our Research Analysts is not based on any specific merchant banking, investment banking or brokerage service transactions. ICICI Securities or its subsidiaries collectively or Research Analysts do not own 1% or more of the equity securities of the Company mentioned in the report as of the last day of the month preceding the publication of the research report. Since associates of ICICI Securities are engaged in various financial service businesses, they might have financial interests or beneficial ownership in various companies including the subject company/companies mentioned in this report. It is confirmed that Rashesh Shah, CA, Research Analysts do not serve as an officer, director or employee of the companies mentioned in the report. ICICI Securities may have issued other reports that are inconsistent with and reach different conclusion from the information presented in this report. Neither the Research Analysts nor ICICI Securities have been engaged in market making activity for the companies mentioned in the report. We submit that no material disciplinary action has been taken on ICICI Securities by any Regulatory Authority impacting Equity Research Analysis activities. This report is not directed or intended for distribution to, or use by, any person or entity who is a citizen or resident of or located in any locality, state, country or other jurisdiction, where such distribution, publication, availability or use would be contrary to law, regulation or which would subject ICICI Securities and affiliates to any registration or licensing requirement within such jurisdiction. The securities described herein may or may not be eligible for sale in all jurisdictions or to certain category of investors. Persons in whose possession this document may come are required to inform themselves of and to observe such restriction.