Embed Size (px)
Citation preview

DISCLOSURE APPENDIX CONTAINS ANALYST CERTIFICATIONS AND THE STATUS OF NON US ANALYSTS. FOR OTHER IMPORTANT DISCLOSURES, visit www.credit-suisse.com/researchdisclosures or call +1 (877) 291-2683 US Disclosure: Credit Suisse does and seeks to do business with companies covered in its research reports. As a result, investors should be aware that the Firm may have a conflict of interest that could affect the objectivity of this report. Investors should consider this report as only a single factor in making their investment decision.
CREDIT SUISSE SECURITIES RESEARCH & ANALYTICS BEYOND INFORMATION®
Client-Driven Solutions, Insights, and Access
28 January 2013
Asia Pacific/India
Equity Research
Consumer Discretionary / Consumer Staples
India Consumer Survey 2013 THEME
A sum of different parts
Figure 1: Urban mean household income dropped 3%, but rose 6% in rural India
16
17
18
19
20
21
22
Total Urban Rural
Mean monthly household income 2011 ('000 Rs) 2012
Source: Credit Suisse India Consumer Survey 2013
■ Consumer optimism still falling. The decline in Indian consumer optimism
observed in 2011 intensified on the back of continued adverse macro
conditions. Compared to 2011, more people expect lower salary increases
and expect personal finances to worsen, making it a bad time for large-ticket
purchases. Only 5% of consumers we surveyed expect inflation to fall.
Confidence in the government is also waning.
■ Signs of down-trading in discretionary items. Not surprisingly there was
a temporary reversal in 2012 of the up-trading trend observed in 2011. The
preference for purchasing unbranded products again rose. Fewer people
bought smartphones and more now want to buy an entry-level car. This
trend is reflected in the commentary of many companies who operate in
discretionary consumption categories and are indicating a growth slowdown.
■ Rural doing better than urban. Spending patterns show a significant
divergence across rural and urban India. While the mean household income
of urban India declined 3%, it increased 6% in rural India. Car penetration
has stagnated in urban India, but doubled in the past two years in rural.
Monthly ARPU in urban India fell ~15%, but showed a small increase in rural.
■ Low penetration bodes well for long-term growth. Another silver lining for
the long-term growth potential of India is low penetration across categories.
Of the eight countries surveyed, ownership of cars, smartphones and
electronic items is the lowest in India. They are among the lowest
consumers of items, such as beer, spirits, meat and cigarettes. While
spending on education has come off this year, at ~10% of household income
it is still pretty high compared to other countries. This, combined with the
greater participation of rural India and lower income categories, bodes well
for India’s consumption story. Our top picks in the Indian consumption
universe are: ITC, Bajaj Auto, Titan, HDFC Bank and Emami.
Research Analysts
Arnab Mitra
91 22 6777 3806
Akshay Saxena
91 22 6777 3825
28 January 2013
India Consumer Survey 2013 2
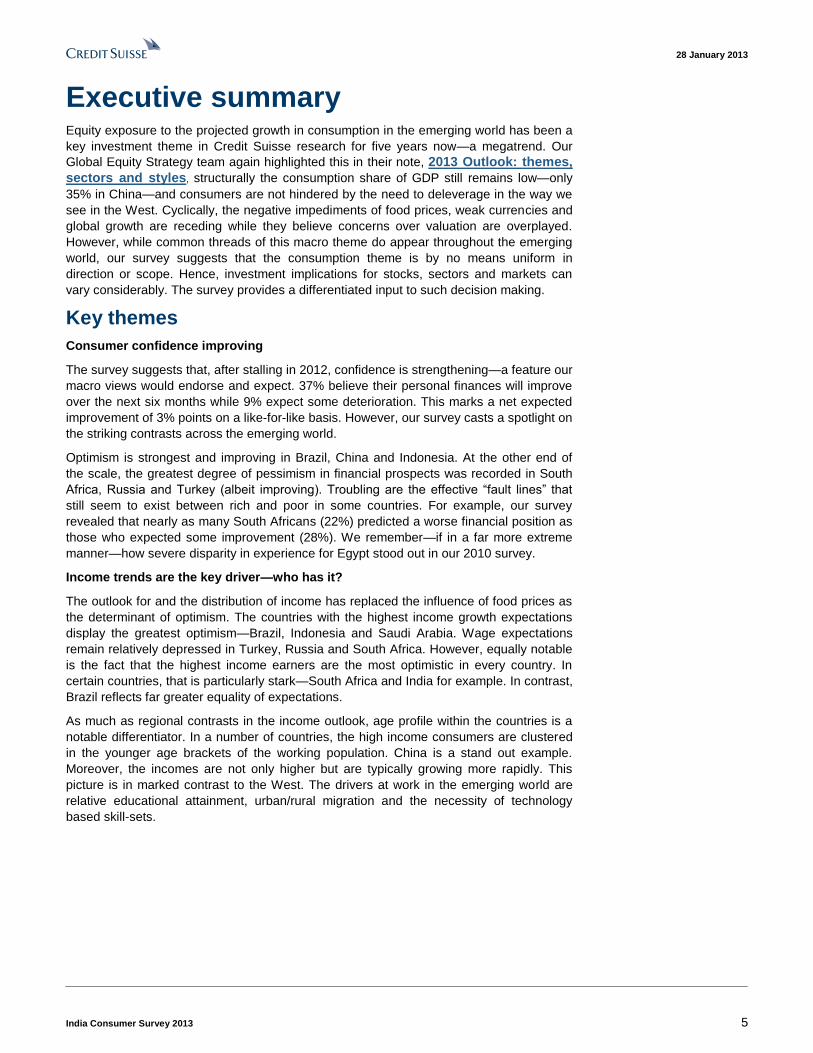
Introduction We are delighted to publish the third edition of the Credit Suisse Global Emerging
Consumer Survey and its accompanying Databook. At a time when investor confidence in
the outlook for global growth is improving, it is opportune to review the dynamics and
drivers of what is a key component of the prospects for global growth —the role played by
the consumer in the emerging world. The analysis carried in this report, provides insights
not available from public sources of economic information.
To undertake this project, the Credit Suisse Research Institute has again engaged the
leading global market research firm Nielsen to conduct face to face interviews with over
14,000 consumers across eight emerging economies posing more than 125 questions to
help reflect a granular picture of their spending habits, future intentions and importantly the
factors that influence them.
The 2013 survey has again been refreshed to address new issues—social and
economic—and alongside Brazil, China, India, Indonesia, Russia, Saudi Arabia and
Turkey, we have added South Africa. The detailed analysis of the differing demographic,
income and rural/urban characteristics underlines that these emerging consumers cannot
be viewed in a generic fashion.
Analysts from across the breadth of Credit Suisse’s global research team have drawn out
the key trends and investment conclusions for stocks both in the emerging and developed
world. These are detailed in the pages that follow.

28 January 2013
India Consumer Survey 2013 3
Research analysts Research Analyst Telephone Email
Arnab Mitra 91 22 6777 3806 [email protected]
Akshay Saxena 91 22 6777 3825 [email protected]
Credit Suisse India research team, lead Research Analysts for this report in bold
Ashish Gupta 91 22 6777 3895 [email protected]
Abhishek Bansal 91 22 6777 3968 [email protected]
Akshay Saxena 91 22 6777 3825 [email protected]
Amish Shah 9122 6777 3743 [email protected]
Anantha Narayan 91 22 67773730 [email protected]
Anubhav Aggarwal 9122 6777 3808 [email protected]
Arnab Mitra 91 22 6777 3806 [email protected]
Badrinath Srinivasan 91 22 6777 3715 [email protected]
Chunky Shah 91 22 6777 3872 [email protected]
Ishan Mahanjan 91 22 6777 3839 [email protected]
Jatin Chawla 91 22 6777 3719 [email protected]
Kush Shah 91 22 6777 3862 [email protected]
Neelkanth Mishra 9122 6777 3716 [email protected]
Prashant Kumar 9122 6777 3942 [email protected]
Ravi Shankar 91 22 6777 3869 [email protected]
Sagar Rastogi 91 22 6777 3851 [email protected]
Sanjay Mookim 65 6212 3017 [email protected]
Sunil Tirumalai 91 22 6777 3714 [email protected]
Vikash Patwari 91 22 6777 3747 [email protected]

28 January 2013
India Consumer Survey 2013 4
Focus table and charts Figure 2: Key themes
Themes
1 Consumer
optimism still
falling
Consumers are clearly seeing a lowering of optimism. Few expect inflation to fall and more people are
now postponing their major purchase decisions. Confidence in the government is waning and compared
to the year before people are less confident about salary rises and the state of their personal finances.
Figure 3, p 10-11
2 Down-trading in
discretionary
items
A reversal of the up-trading trend seen before in discretionary items, as people now buy more
unbranded products and there is a fall in mean purchase value across categories, such as apparel,
shoes, etc.
Figure 4, p 12
3 Rural doing better
than urban
A divergence in income and spending patterns between rural and urban India. Be it growth in income or
proliferation of branded goods, car penetration or spending on mobiles—rural has done better than urban
Figure 5, p 13-14
4 Low penetration
bodes well for
long-term growth
India is still among the lowest penetrated of all countries across categories implying high growth
potential. Spending on education is still pretty high with the highest percentage of people wishing to
send children to private schools in India. India continues to build on a solid base to capitalise on the
demographic dividend that bodes well for Indian consumption story
Figure 6, p 15-16
Source: Credit Suisse India Consumer Survey 2013
Figure 3: More people postponing their major purchase
decisions
Figure 4: After a decline last year, the preference for
unbranded goods in discretionary has again risen
0%
10%
20%
30%
40%
50%
% respondents who feelnot a good time to make
major purchase
% expecting personalfinances to get worse
% feeling govt. iseffective in solving
problems
2010 2011 2012
0%
10%
20%
30%
40%
50%
60%
70%
80%
Apparels Sports shoes Watches Jewellery Perfumes
% respondents buying unbranded in 2010 2011 2012
Source: Credit Suisse India Consumer Survey 2013 Source: Credit Suisse India Consumer Survey 2013
Figure 5: While mean household income of urban India
declined 3%, it increased 6% for rural India
Figure 6: India’s penetration across categories much
lower than global average implying high growth potential
16
17
18
19
20
21
22
Total Urban Rural
Mean monthly household income 2011 ('000 Rs) 2012
0 10 20 30 40 50 60
Cars
Cigarettes
LCD TV
Acess to internet
Beer
Spirits
Other countries average India
Source: Credit Suisse India Consumer Survey 2013 Source: Credit Suisse India Consumer Survey 2013
28 January 2013
India Consumer Survey 2013 5
Executive summary Equity exposure to the projected growth in consumption in the emerging world has been a
key investment theme in Credit Suisse research for five years now—a megatrend. Our
Global Equity Strategy team again highlighted this in their note, 2013 Outlook: themes,
sectors and styles, structurally the consumption share of GDP still remains low—only
35% in China—and consumers are not hindered by the need to deleverage in the way we
see in the West. Cyclically, the negative impediments of food prices, weak currencies and
global growth are receding while they believe concerns over valuation are overplayed.
However, while common threads of this macro theme do appear throughout the emerging
world, our survey suggests that the consumption theme is by no means uniform in
direction or scope. Hence, investment implications for stocks, sectors and markets can
vary considerably. The survey provides a differentiated input to such decision making.
Key themes
Consumer confidence improving
The survey suggests that, after stalling in 2012, confidence is strengthening—a feature our
macro views would endorse and expect. 37% believe their personal finances will improve
over the next six months while 9% expect some deterioration. This marks a net expected
improvement of 3% points on a like-for-like basis. However, our survey casts a spotlight on
the striking contrasts across the emerging world.
Optimism is strongest and improving in Brazil, China and Indonesia. At the other end of
the scale, the greatest degree of pessimism in financial prospects was recorded in South
Africa, Russia and Turkey (albeit improving). Troubling are the effective “fault lines” that
still seem to exist between rich and poor in some countries. For example, our survey
revealed that nearly as many South Africans (22%) predicted a worse financial position as
those who expected some improvement (28%). We remember—if in a far more extreme
manner—how severe disparity in experience for Egypt stood out in our 2010 survey.
Income trends are the key driver—who has it?
The outlook for and the distribution of income has replaced the influence of food prices as
the determinant of optimism. The countries with the highest income growth expectations
display the greatest optimism—Brazil, Indonesia and Saudi Arabia. Wage expectations
remain relatively depressed in Turkey, Russia and South Africa. However, equally notable
is the fact that the highest income earners are the most optimistic in every country. In
certain countries, that is particularly stark—South Africa and India for example. In contrast,
Brazil reflects far greater equality of expectations.
As much as regional contrasts in the income outlook, age profile within the countries is a
notable differentiator. In a number of countries, the high income consumers are clustered
in the younger age brackets of the working population. China is a stand out example.
Moreover, the incomes are not only higher but are typically growing more rapidly. This
picture is in marked contrast to the West. The drivers at work in the emerging world are
relative educational attainment, urban/rural migration and the necessity of technology
based skill-sets.
28 January 2013
India Consumer Survey 2013 6
Discretionary spending back on track
Understanding what younger, wealthier and typically better educated consumers will
spend their money upon is a key investment theme as this is where growth is likely to be
strongest. This would structurally point to areas of discretionary spending. Our survey
illustrates that this theory is borne out in practice. The survey asks consumers what
categories of spending they have been spending most upon and effectively what they
expect to prioritise looking forward. Having stalled last year, discretionary spending looks
back on track and should maintain its momentum.
In terms of specifics, meat and protein gets a higher profile on the menu. A thirst for
technology, smartphones and tablets, is supported by ever greater expansion in internet
penetration. This was a theme last year and is if anything an even stronger one. Bigger
ticket items such as cars and property also display strong prospects though notably
without the typical appetite for borrowing we have historically seen in the West.
Interestingly, the outlook for services such as healthcare and education seems more
muted. However, it seems the state is increasingly stepping in to supply the former while
private educational spend has simply been exceptionally strong in recent years and seeing
a moderation from a high base. It remains a structural story in our view, with India still
displaying it best of all.
Key discretionary spending plays from our analysts are detailed below. We would
also highlight our custom Delta One Emerging Consumer Discretionary basket,
based on direct and indirect plays ‘CSGLEMDS Index’.
Brand recognition… momentum and critical mass
The track record being built by the survey is allowing us to delve deeper into our analysis
of brands. We can analyse with the help of our Databook brands displaying momentum,
where local brands hold sway over global rivals and the income sensitivity of brands.
Important themes have emerged: (i) the significance of the unbranded segment of
spending; (ii) the resilience of domestic brands in the essential areas of spending space
and their attractiveness to acquisitive global companies; and (iii) the aspirational quality (or
lack thereof) of specific brands in the discretionary space, which plays to the international
names.
With improving income trends being the key driver of the emerging consumer structurally,
and also a key differentiator of the immediate outlook in the survey as suggested above,
we specifically analyse brands with this theme in mind. With high income earners being
where income growth expectations and optimism are the highest, we want to identify
which brands exhibit momentum or dominance in this category. Equally, at the low income
end where a transition from unbranded to branded products is likely, we wish to be
positioned to exploit that. We would be concerned about brands that are losing momentum
and also those whose attractions peter out markedly higher up the income scale given this
is the direction of travel in emerging consumer markets.
The table and scorecard identifies from our brands database, those listed companies
owning brands in emerging markets that either dominate their space or have momentum
with low or high income earners.
We display below those where we have Outperform or Neutral ratings. These form the
constituents of our Custom Delta One Emerging Brands Basket ‘CSEMBRND Index’.
28 January 2013
India Consumer Survey 2013 7
Country highlights
Key highlights include:
Brazil: The beat goes on
The Brazilian consumer remains the most optimistic in our survey, with confidence raised
year-on-year despite an economic slowdown. A definitive characteristic of this confidence
is its breadth; both low and high income consumers are confident, unlike the findings for
many other developing economies. Although an implicit savings ratio seems to have
increased, it remains substantially lower than the other larger economies. Momentum
remains in discretionary products such as technology, fashion and spirits. Education is
also a priority.
China: An educated consumer
Optimism amongst the Chinese consumer remains relatively robust against a weaker
economic background. Much of this increased strength can be attributed to the low income
brackets rather than the high. Attitudes surrounding savings remain unhindered, although
the routes adopted to achieve this are changing; the increased role of the stock market
and life products for savings. The key feature of spending is a heavy focus on technology
and education, with the strongest spend in smartphones out of any country surveyed.
India: A sum of different parts
Although the optimism of the Indian consumer remains robust, there is an increasing
divergence between the confidence levels of rich and poor consumers: poor consumers
demonstrate a sharp decline in confidence. Spending momentum in education continues
to stride ahead, supported by numerous government initiatives. Discretionary spend
categories are the stronger areas within India though appear relatively more mute vs.
other countries, with India in fact being the only country surveyed showing a fall in the
smartphones bought for example. Aggressive promotion of property investment has led to
positive expectations for the direction of property prices.
Indonesia: BRIC becomes BIIC?
The Indonesian consumer continues to grow increasingly confident, corresponding with
the trend growth seen in the Indonesian economy. The increases in minimum wages have
contributed to the relatively steeper growth in confidence amongst the lower earners.
Rising incomes and lowered food prices have resulted in increased spending on
discretionary goods, with fashion and holidays being items of choice. As the vast majority
of Indonesia remains offline, technology growth remains concentrated in basic mobile
phones rather than internet enabled devices such as smartphones.
Russia: The poor BRIC relation
Low optimism, poor income growth and a large disparity between the expectations of rich
and poor consumers characterised Russia in 2012. Inflation rates are forecast to be one of
the highest out of our survey. With a large proportion of income being devoted to food,
Russian consumers have been constrained in spending elsewhere, though this should
ease. At present, only discretionary spend categories in reach of the rich remain robust,
with others on the whole weak. Technology is the strongest feature.
Saudi Arabia: Contrasting fortunes
Although the Saudi Arabian consumer remains one of the most optimistic in our survey,
optimism has dropped relatively year-on-year post 2011’s boost from the major
government initiatives for employment and pay. It remains highly progressive in relation to
incomes. There is high growth in highly penetrated markets, in particular, computers,
smartphones, fashion apparel and perfumes. There remains considerable structural
opportunity for the financial industry to tap into the deep pool of savings which are
currently predominantly held in bank accounts.

28 January 2013
India Consumer Survey 2013 8
South Africa: Challenges and opportunities
South Africa is a new edition to the Credit Suisse Emerging Consumer Survey for 2013.
Consumer optimism levels in South Africa fall toward the lower end of the survey
spectrum. The polarity of experience within the population is concerning. Nearly as many
South African consumers predicted a worse financial position as those who expected
some improvement. Despite broad pay rises for many, it does not appear to have
completely assuaged negative perceptions of the financial outlook of low income earners
which has impacted the pattern of spending and its relative position vs other countries in
the survey. A major distinguishing feature of South Africa is the institutionalised savings
and a more developed banking system.
Turkey: Potential emerging
While optimism is relatively weak compared to other countries in the survey, Turkey has
seen an improvement in overall confidence, with greatest improvement amongst the
higher earners. They are comparable with Saudi Arabia. Spending patterns more generally
are beginning to look like those of a middle-income country, with smartphones, computers,
internet access, cars and holidays seeing some of the strongest gains. Growth in alcohol
spend has not been deterred by recent tax hikes. Bank penetration remains poor,
indicating a structural opportunity.
28 January 2013
India Consumer Survey 2013 9
CS India Consumer Survey 2013 Our comprehensive consumer survey for India interviewed 2,602 respondents across 10
cities and rural areas, and asked more than 100 questions. This report discusses the key
themes and implications for the Indian market.
Consumer optimism still falling The decline in Indian consumer optimism observed last year has further intensified on the
back of continued adverse macro conditions: high inflation and slower growth. Consumers
are clearly more worried. Compared to last year, more people expect lower salary
increases and personal finances to worsen, making it a bad time for large-ticket purchases
this time around. Only 5% of consumers we surveyed expect inflation to fall, clearly
indicating that the Reserve Bank of India’s (RBI) worries over high inflation expectations
becoming entrenched are not unfounded. Confidence in the government is also waning,
with only ~35% respondents believing that it is effective in solving problems against ~50%
the year before. The savings culture remains conservative with most savings channelled
towards banks and gold, etc. With increasing economic uncertainty, Indian consumers’
savings rate, already among the highest in the world, further rose in 2012.
Signs of down-trading in discretionary items Given the economic slowdown, not surprisingly there was a temporary reversal in 2012 of
the up-trading trend observed in 2011. The preference for purchasing unbranded products
again rose this year. Even though more people continued to buy items, such as apparel,
shoes, watches and perfumes, there was a fall in mean purchase values with consumers
preferring to reduce discretionary spending in order to save more. Fewer people bought
smartphones (though mobile penetration went up) and more now want to buy an entry-
level car. More consumers are also postponing major purchase decisions. This trend is
reflected in the commentary of many companies who operate in discretionary consumption
categories and are indicating a slowdown in growth rates.
Rural doing better than urban
Spending patterns show a significant divergence across rural and urban India. While the
mean household income of urban India declined 3%, it increased 6% for rural India. Car
penetration has stagnated in urban India, but doubled in the past two years in rural India.
Monthly average revenue per unit (ARPU) on mobile phones for urban India fell ~15%,
while for rural Indians it showed a small increase. Moreover, this down-trading trend is
prevalent much more in urban India. People from rural areas are still buying more branded
products. With India’s rural: urban population ratio still highly skewed at 70:30, strong rural
performance would continue to support growth for Indian consumer companies.
Low penetration bodes well for long-term growth Another silver lining for the long-term growth potential of India is the low penetration
across categories. Of the eight countries surveyed, ownership of cars, smartphones and
electronic items is the lowest in India. They are among the lowest consumers of items,
such as beer, spirits, meat and cigarettes, and have the lowest access to the Internet.
While spending on education has come off this year, at ~10% of household income it is
still pretty high compared to other countries. India has the highest percentage of people
wanting to send children to private schools. Moreover, while falling this year, over a longer
period the nutrient content in dietary patterns is also rising, with more people consuming
meat and dairy products. As a result, India is building a solid base to capitalise on the
demographic dividend that the country is expected to enjoy in the coming decades.
This, combined with the greater participation of rural India and lower income categories
(those at the bottom of pyramid), bodes well for India’s consumption story. We advise
investors to buy brands and market leaders in their respective segments. Our top picks in
the Indian consumption universe are: ITC, Bajaj Auto, Titan, HDFC Bank and Emami.

28 January 2013
India Consumer Survey 2013 10
Consumer optimism still falling In 2011, we observed a fall in the optimism of Indian consumers across most categories.
This year (2012) with continued adverse macro conditions (high inflation and greater
economic uncertainty), consumers have become much more worried. Confidence in the
government is also dropping with just ~35% respondents believing the government is
effective in solving problems against ~50% the year before.
More than 60% of respondents we surveyed expect inflation to increase further and just
~5% expect it to come down in the next 12 months. This is a worrying trend indicating the
high inflation expectations that have been entrenched in people’s minds. Inflation seems to
have hit the lower-income group the hardest with a much higher percentage of rural and
low-income population being concerned about inflation.
Figure 7: Just ~3% of people expect inflation to get lower Figure 8: Confidence in government is coming down
% respondents expecting
inflation to be Higher62%
Expecting inflation to
remain same Same33%
Expecting inflation to be
Lower5%
0
10
20
30
40
50
60
Total Urban Rural
How effective govt. in solving problems 2011 2012
Source: Credit Suisse India Consumer Survey 2013 Source: Credit Suisse India Consumer Survey 2013
Just ~30% respondents saw salary hikes in 2012 and the quantum of wage hikes also
came down slightly. On the other hand, income of ~20% respondents came down in 2012.
Consequently fewer people feel this this is a good time to make a major purchase (the
number fell from 73% in 2010 to 66% in 2011 and 59% in 2012).
Figure 9: Only ~30% saw salary increases in 2012 while
~22% of respondents had their salaries fall
Figure 10: More people are postponing purchase
decisions
% whose income
remained same in last one year
44%
Increase34%
Decrease22%
0%
20%
40%
60%
80%
Good Time to make major purchase Not a good time to buy
2010 2011 2011
Source: Credit Suisse India Consumer Survey 2013 Source: Credit Suisse India Consumer Survey 2013
28 January 2013
India Consumer Survey 2013 11
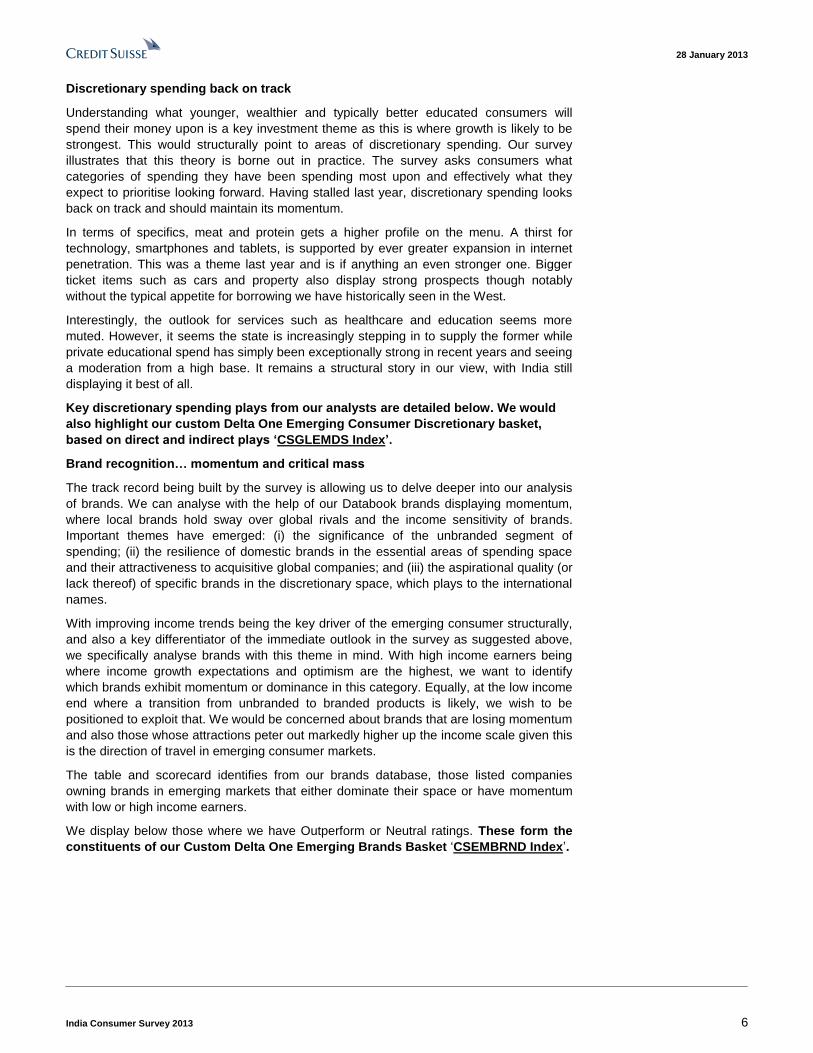
There are now instances of buying/upgrade decisions being postponed as people cut
down on lavish spending because of the economic uncertainty. While two years ago
Indians were highly confident about their personal finances, past two years have seen a
significant deterioration. The respondents expecting their personal finances to get worse
increased from 3% in 2010 to 11% in 2012.
Consumers remained extremely risk averse, and keenness to invest in the stock market
remained low with just ~4% respondents trading in stock markets. Preference towards
gold and insurance is increasing and bank account savings remained steady.
Figure 11: 7% respondents expect their personal finances
to get worse from 3% last year
Figure 12:Just 4% invest money directly in stock markets
0%
10%
20%
30%
40%
50%
60%
Expect Personalfinances to get better in
next 6 months
About the same Worse
2010 2011 2011
0
20
40
60
80
100
BankAccount
StockMarket
Cash MututalFund
Property Gold Insurance
% using that saving channel 2011 2012
Source: Credit Suisse India Consumer Survey 2013 Source: Credit Suisse India Consumer Survey 2013
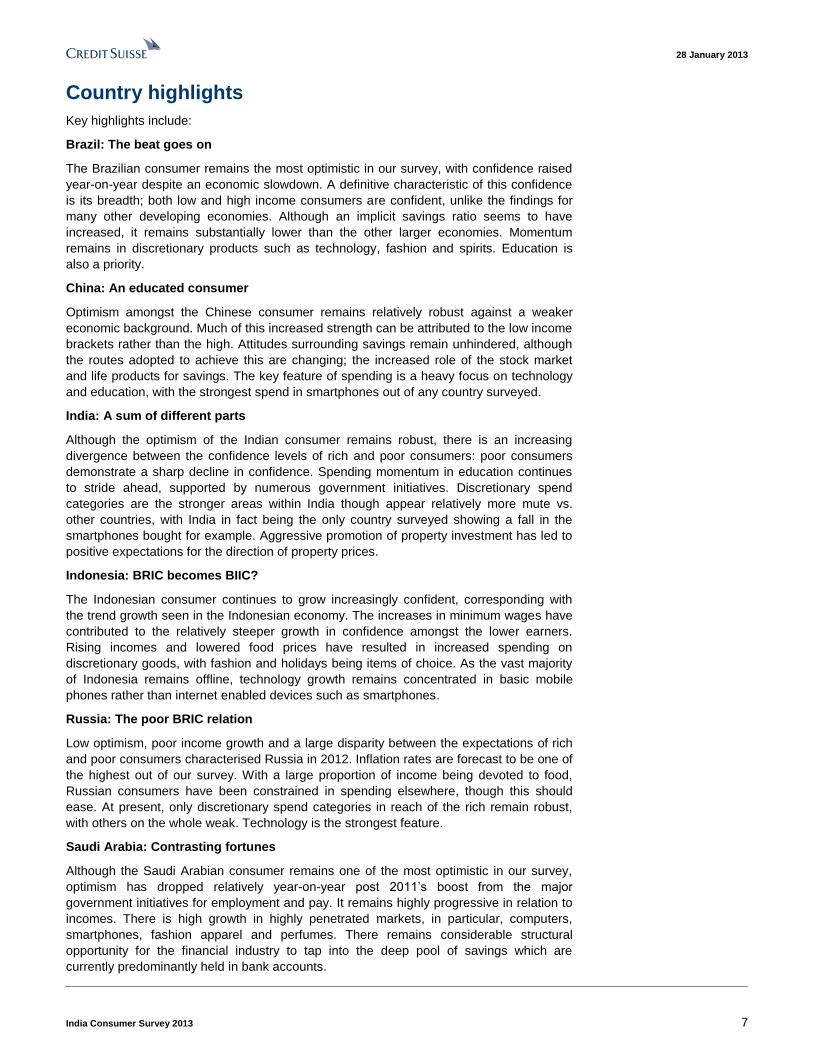
With falling optimism and uncertainty about future, Indians are now saving more with the
percentage of income saved increasing from ~28% in 2011 to ~32% in 2012 while cutting
down on spending. The most notable changes in the overall spending trend were an
increase in food spending (which would have happened on account of high inflation in
food) and reductions in both education and housing spending.
Figure 13: Indians are saving more and cutting down expenditures on housing and
education
-4.0%
-2.0%
0.0%
2.0%
4.0%
0%
10%
20%
30%
40%
Food Education Housing Savings
% income allocated 2011 2012 Difference (RHS)
Source: Credit Suisse India Consumer Survey 2013

28 January 2013
India Consumer Survey 2013 12
Signs of down-trading in discretionary items Given the economic slowdown, not surprisingly there was a temporary reversal in 2012 of
up-trading trend observed in the prior years. Even though more people continued to buy
items like apparels, shoes, watches and perfumes, there was a fall in mean purchase
values with consumers preferring to cut down on discretionary spending to save more.
While 2011 survey showed Indian consumer becoming brand conscious, there was a trend
reversal in 2012. Demand for unbranded items after decreasing drastically for each of the
items in 2011 increased again in 2012. While over a two-year period, the preference for
branded products has increased, 2012 saw some slowdown.
Figure 14: Other than jewellery, mean value of purchases
came down for all other categories
Figure 15: After a decline in 2011, preference for
unbranded goods again went up
-40%
-30%
-20%
-10%
0%
10%
20%
30%
Apparels Sports shoes Watches Jewellery Perfumes
Increase in mean spending over last year 2011 2012
0%
10%
20%
30%
40%
50%
60%
70%
80%
Apparels Sports shoes Watches Jewellery Perfumes
% respondents buying unbranded in 2010 2011 2012
Source: Credit Suisse India Consumer Survey 2013 Source: Credit Suisse India Consumer Survey 2013
Fewer people bought smartphones (even though mobile phone penetration went up)
compared with that in 2011. Similarly, while over a longer period there has been a clear
trend towards ‘up-gradation’ in cars (costing more than Rs400,000), more respondents in
our survey wanted to buy an entry level car. All these point to people cutting down on
lavish spending in the wake of economic uncertainty.
Figure 16: No. of people owning smartphones came down Figure 17: More people now want to buy cheaper cars
0%
5%
10%
15%
20%
25%
30%
35%
2010 2011 2012
People not owning mobiles Owning smartphones
0%
10%
20%
30%
40%
50%
2010 2011 2012
% respondents wishing to spend less than Rs400k on car purchase
Source: Credit Suisse India Consumer Survey 2013 Source: Credit Suisse India Consumer Survey 2013
28 January 2013
India Consumer Survey 2013 13
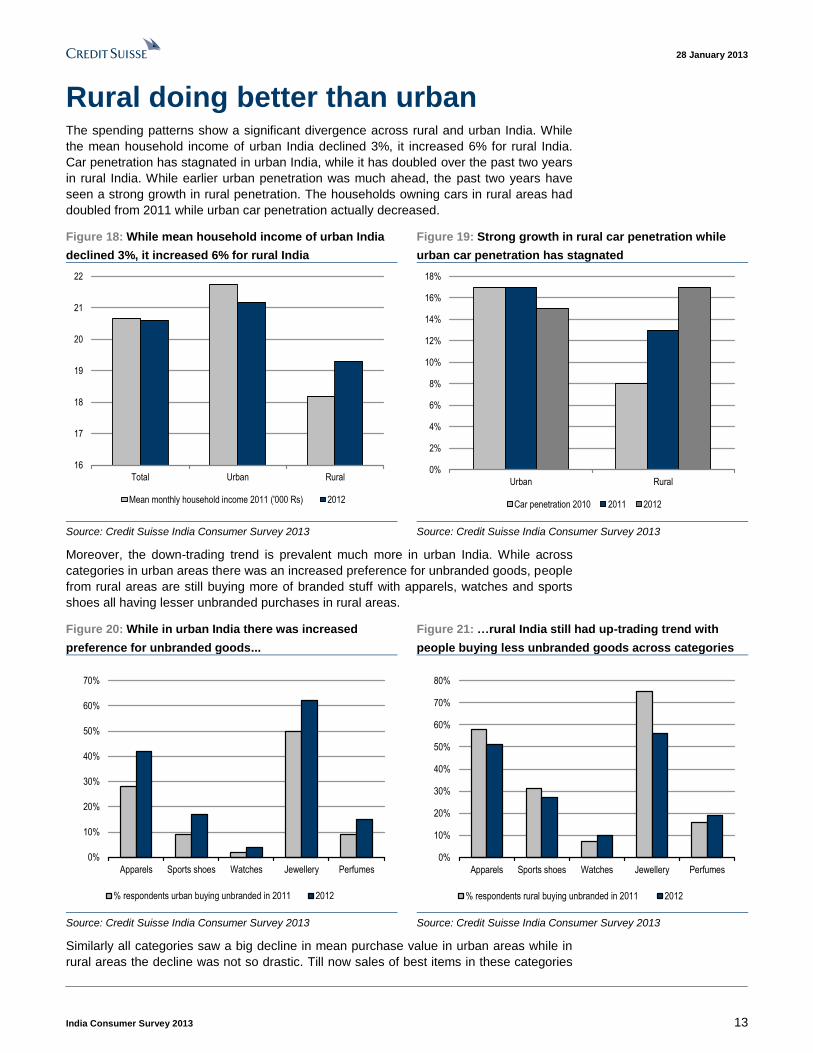
Rural doing better than urban The spending patterns show a significant divergence across rural and urban India. While
the mean household income of urban India declined 3%, it increased 6% for rural India.
Car penetration has stagnated in urban India, while it has doubled over the past two years
in rural India. While earlier urban penetration was much ahead, the past two years have
seen a strong growth in rural penetration. The households owning cars in rural areas had
doubled from 2011 while urban car penetration actually decreased.
Figure 18: While mean household income of urban India
declined 3%, it increased 6% for rural India
Figure 19: Strong growth in rural car penetration while
urban car penetration has stagnated
16
17
18
19
20
21
22
Total Urban Rural
Mean monthly household income 2011 ('000 Rs) 2012
0%
2%
4%
6%
8%
10%
12%
14%
16%
18%
Urban Rural
Car penetration 2010 2011 2012
Source: Credit Suisse India Consumer Survey 2013 Source: Credit Suisse India Consumer Survey 2013
Moreover, the down-trading trend is prevalent much more in urban India. While across
categories in urban areas there was an increased preference for unbranded goods, people
from rural areas are still buying more of branded stuff with apparels, watches and sports
shoes all having lesser unbranded purchases in rural areas.
Figure 20: While in urban India there was increased
preference for unbranded goods...
Figure 21: …rural India still had up-trading trend with
people buying less unbranded goods across categories
0%
10%
20%
30%
40%
50%
60%
70%
Apparels Sports shoes Watches Jewellery Perfumes
% respondents urban buying unbranded in 2011 2012
0%
10%
20%
30%
40%
50%
60%
70%
80%
Apparels Sports shoes Watches Jewellery Perfumes
% respondents rural buying unbranded in 2011 2012
Source: Credit Suisse India Consumer Survey 2013 Source: Credit Suisse India Consumer Survey 2013
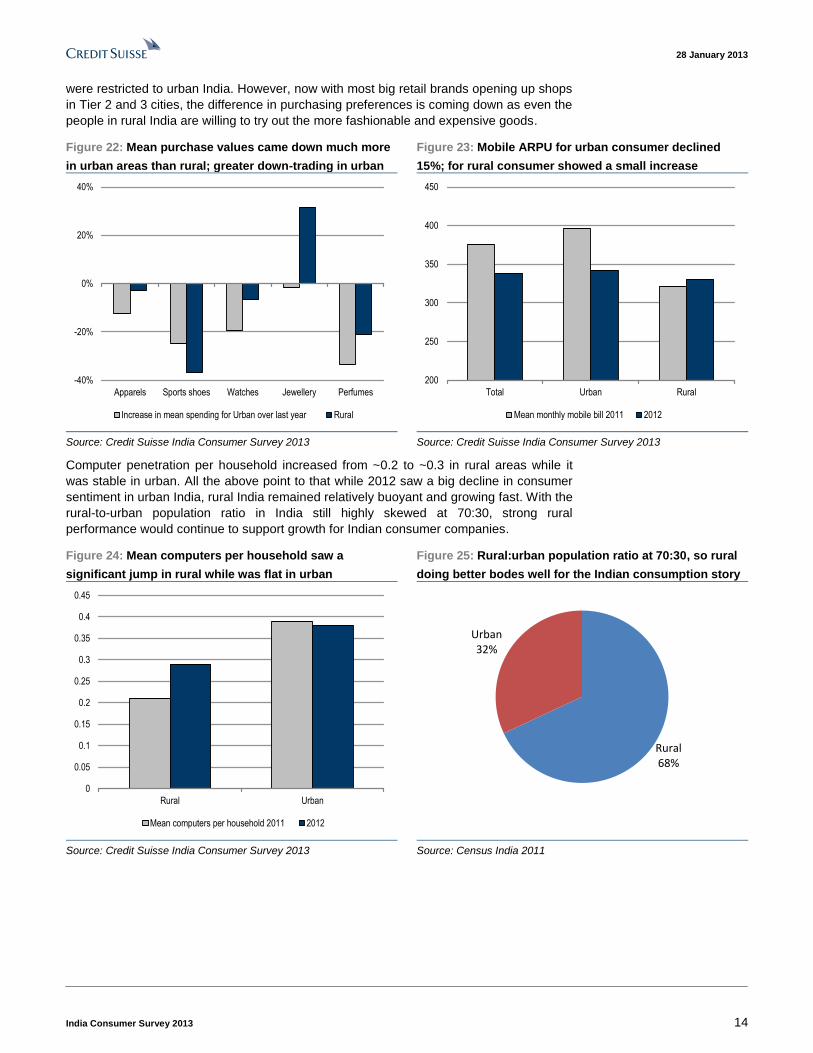
Similarly all categories saw a big decline in mean purchase value in urban areas while in
rural areas the decline was not so drastic. Till now sales of best items in these categories
28 January 2013
India Consumer Survey 2013 14
were restricted to urban India. However, now with most big retail brands opening up shops
in Tier 2 and 3 cities, the difference in purchasing preferences is coming down as even the
people in rural India are willing to try out the more fashionable and expensive goods.
Figure 22: Mean purchase values came down much more
in urban areas than rural; greater down-trading in urban
Figure 23: Mobile ARPU for urban consumer declined
15%; for rural consumer showed a small increase
-40%
-20%
0%
20%
40%
Apparels Sports shoes Watches Jewellery Perfumes
Increase in mean spending for Urban over last year Rural
200
250
300
350
400
450
Total Urban Rural
Mean monthly mobile bill 2011 2012
Source: Credit Suisse India Consumer Survey 2013 Source: Credit Suisse India Consumer Survey 2013
Computer penetration per household increased from ~0.2 to ~0.3 in rural areas while it
was stable in urban. All the above point to that while 2012 saw a big decline in consumer
sentiment in urban India, rural India remained relatively buoyant and growing fast. With the
rural-to-urban population ratio in India still highly skewed at 70:30, strong rural
performance would continue to support growth for Indian consumer companies.
Figure 24: Mean computers per household saw a
significant jump in rural while was flat in urban
Figure 25: Rural:urban population ratio at 70:30, so rural
doing better bodes well for the Indian consumption story
0
0.05
0.1
0.15
0.2
0.25
0.3
0.35
0.4
0.45
Rural Urban
Mean computers per household 2011 2012
Rural68%
Urban32%
Source: Credit Suisse India Consumer Survey 2013 Source: Census India 2011

28 January 2013
India Consumer Survey 2013 15
Low penetration bodes well for long-term growth Another silver lining for the long-term growth potential is low penetration in India across
categories. Out of all the eight countries surveyed, ownership of cars, smartphones and
electronic items is the lowest in India. They are among the lowest consumers of items like
beer, spirits, meat, cigarettes and LCD TVs, and have the lowest access to Internet.
Figure 26: Fewest Indians own cars... Figure 27: …and fewest people have Internet access
0
20
40
60
80
100
Brazil China India Indonesia Russia Saudi Turkey SouthAfrica
% respondents owning cars
0
20
40
60
80
100
Brazil China India Indonesia Russia Saudi Turkey SouthAfrica
% respondents with access to internet
Source Credit Suisse India Consumer Survey 2013 Source: Credit Suisse India Consumer Survey 2013
Figure 28: Cigarette penetration is the lowest... Figure 29: …and so is alcohol penetration
0
10
20
30
40
50
60
Brazil China India Indonesia Russia Saudi Turkey SouthAfrica
% of cigarette smokers
0 10 20 30 40 50 60 70 80
Brazil
China
India
Russia
Turkey
SA
% of Spirits consumers % of beer drinkers
Source: Credit Suisse India Consumer Survey 2013 Source: Credit Suisse India Consumer Survey 2013
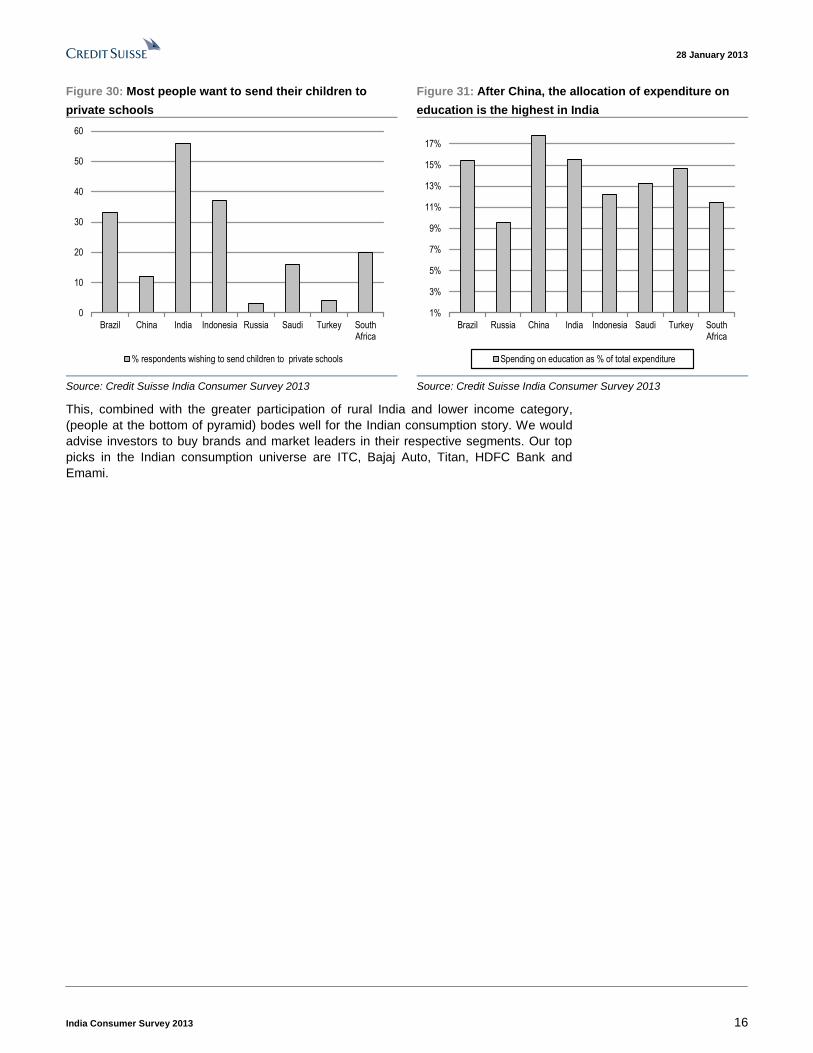
While the spending on education came off in 2012, at ~10% of household income it is still
pretty high and compares favourably to other countries. India has the highest percentage
of people who want to send their children to private schools. Moreover, while there was a
drop in 2012, over a longer period the nutrient content in the dietary patterns is also going
up with more and more consuming meat and dairy products, meaning that India is building
a solid base to capitalise on the demographic dividend that the country is expected to
enjoy in the coming decades.
28 January 2013
India Consumer Survey 2013 16
Figure 30: Most people want to send their children to
private schools
Figure 31: After China, the allocation of expenditure on
education is the highest in India
0
10
20
30
40
50
60
Brazil China India Indonesia Russia Saudi Turkey SouthAfrica
% respondents wishing to send children to private schools
1%
3%
5%
7%
9%
11%
13%
15%
17%
Brazil Russia China India Indonesia Saudi Turkey SouthAfrica
Spending on education as % of total expenditure
Source: Credit Suisse India Consumer Survey 2013 Source: Credit Suisse India Consumer Survey 2013
This, combined with the greater participation of rural India and lower income category,
(people at the bottom of pyramid) bodes well for the Indian consumption story. We would
advise investors to buy brands and market leaders in their respective segments. Our top
picks in the Indian consumption universe are ITC, Bajaj Auto, Titan, HDFC Bank and
Emami.
28 January 2013
India Consumer Survey 2013 17
Key findings of the survey We interviewed respondents on their spending patterns and outlook across several
sectors like autos, food and beverages, personal care, branded goods, computers, mobile
phones, property, Internet, travel, education and healthcare. Below are some interesting
findings in each of the sectors.
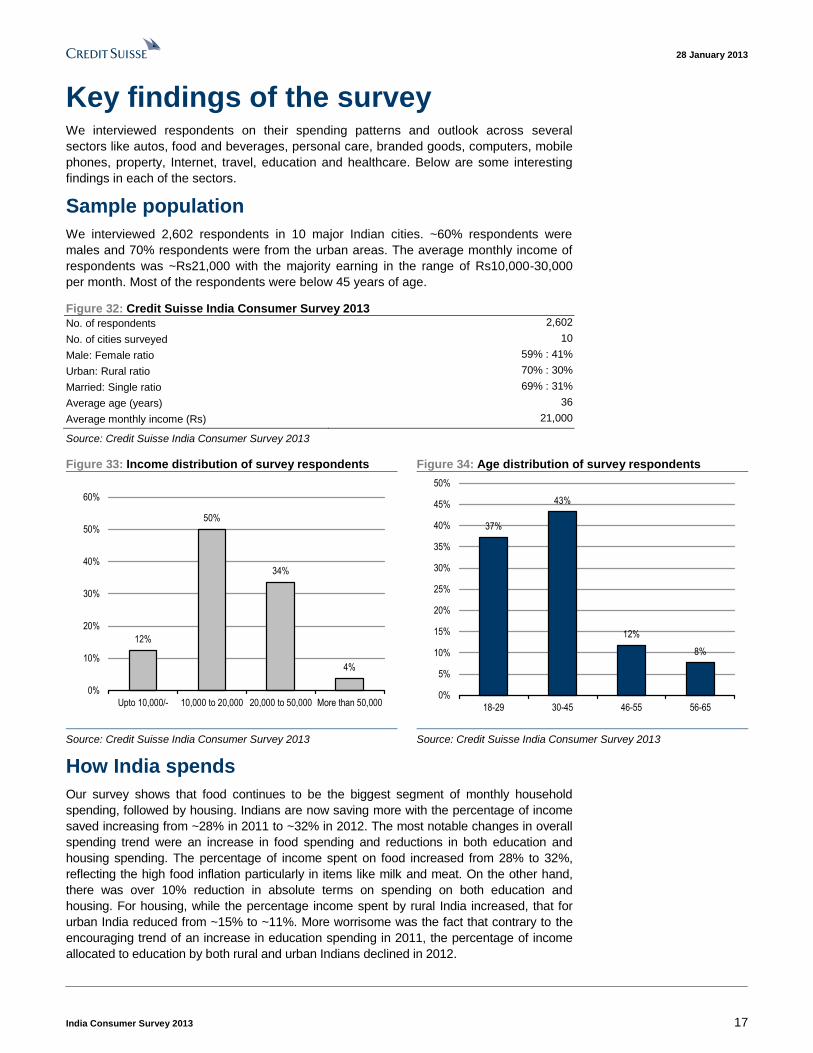
Sample population
We interviewed 2,602 respondents in 10 major Indian cities. ~60% respondents were
males and 70% respondents were from the urban areas. The average monthly income of
respondents was ~Rs21,000 with the majority earning in the range of Rs10,000-30,000
per month. Most of the respondents were below 45 years of age.
Figure 32: Credit Suisse India Consumer Survey 2013
No. of respondents 2,602
No. of cities surveyed 10
Male: Female ratio 59% : 41%
Urban: Rural ratio 70% : 30%
Married: Single ratio 69% : 31%
Average age (years) 36
Average monthly income (Rs) 21,000
Source: Credit Suisse India Consumer Survey 2013
Figure 33: Income distribution of survey respondents Figure 34: Age distribution of survey respondents
12%
50%
34%
4%
0%
10%
20%
30%
40%
50%
60%
Upto 10,000/- 10,000 to 20,000 20,000 to 50,000 More than 50,000
37%
43%
12%
8%
0%
5%
10%
15%
20%
25%
30%
35%
40%
45%
50%
18-29 30-45 46-55 56-65
Source: Credit Suisse India Consumer Survey 2013 Source: Credit Suisse India Consumer Survey 2013
How India spends
Our survey shows that food continues to be the biggest segment of monthly household
spending, followed by housing. Indians are now saving more with the percentage of income
saved increasing from ~28% in 2011 to ~32% in 2012. The most notable changes in overall
spending trend were an increase in food spending and reductions in both education and
housing spending. The percentage of income spent on food increased from 28% to 32%,
reflecting the high food inflation particularly in items like milk and meat. On the other hand,
there was over 10% reduction in absolute terms on spending on both education and
housing. For housing, while the percentage income spent by rural India increased, that for
urban India reduced from ~15% to ~11%. More worrisome was the fact that contrary to the
encouraging trend of an increase in education spending in 2011, the percentage of income
allocated to education by both rural and urban Indians declined in 2012.

28 January 2013
India Consumer Survey 2013 18
Figure 35: Food constitutes the biggest segment of the
monthly household spending
Figure 36: Indians are now saving more; spending on
food also increased
Housing11%
Auto6%
Education10%
Food32%Home &
Personal Care6%
Healthcare6%
Savings24%
Entertainment5%
0.0%
5.0%
10.0%
15.0%
20.0%
25.0%
30.0%
35.0%
2010 2011 2012
% income spent on Food % of income saved
Source: Credit Suisse India Consumer Survey 2013 Source: Credit Suisse India Consumer Survey 2013
Figure 37: Spending on housing fell in urban India… Figure 38: …while spending on education fell overall
0%
4%
8%
12%
16%
20%
Rural Urban
% spent on housing in 2010 2011 2012
0%
4%
8%
12%
16%
Rural Urban
% spent on education in 2010 2011 2012
Source: Credit Suisse India Consumer Survey 2013 Source: Credit Suisse India Consumer Survey 2013
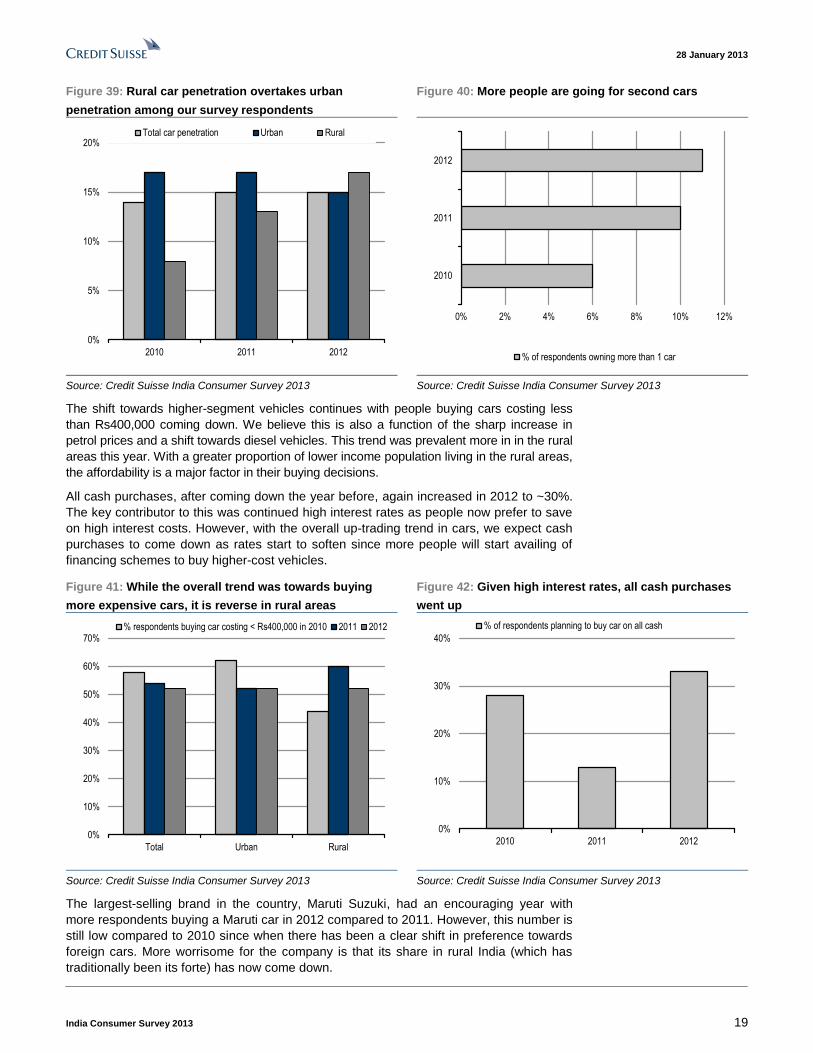
Autos
India has among the world’s most under-penetrated car market with less than 15% of the
people in our survey owning cars (actual household penetration stands much lower at just
~7%). Among the respondents in our survey, rural penetration has now crossed urban
penetration. While earlier urban penetration was double that of rural, the past two years
have seen strong growth in rural penetration. Households owning cars in rural areas had
doubled from 2011. On the other hand, urban penetration went down, which seems to
indicate that with rising fuel costs people in cities are using more public transport. A similar
pattern is observed in two-wheelers. Among the respondents in our survey, ~70% of
households own a two-wheeler much higher than the Indian average of ~30% with more
people in rural areas owning a two-wheeler than in urban areas. In reality, the gap
between rural and urban penetration is much less in two-wheelers than in four-wheelers.
People owning multiple cars went up from 6% to 11% indicating more members in
households need individual cars for their daily travel.
28 January 2013
India Consumer Survey 2013 19
Figure 39: Rural car penetration overtakes urban
penetration among our survey respondents
Figure 40: More people are going for second cars
0%
5%
10%
15%
20%
2010 2011 2012
Total car penetration Urban Rural
0% 2% 4% 6% 8% 10% 12%
2010
2011
2012
% of respondents owning more than 1 car
Source: Credit Suisse India Consumer Survey 2013 Source: Credit Suisse India Consumer Survey 2013
The shift towards higher-segment vehicles continues with people buying cars costing less
than Rs400,000 coming down. We believe this is also a function of the sharp increase in
petrol prices and a shift towards diesel vehicles. This trend was prevalent more in in the rural
areas this year. With a greater proportion of lower income population living in the rural areas,
the affordability is a major factor in their buying decisions.
All cash purchases, after coming down the year before, again increased in 2012 to ~30%.
The key contributor to this was continued high interest rates as people now prefer to save
on high interest costs. However, with the overall up-trading trend in cars, we expect cash
purchases to come down as rates start to soften since more people will start availing of
financing schemes to buy higher-cost vehicles.
Figure 41: While the overall trend was towards buying
more expensive cars, it is reverse in rural areas
Figure 42: Given high interest rates, all cash purchases
went up
0%
10%
20%
30%
40%
50%
60%
70%
Total Urban Rural
% respondents buying car costing < Rs400,000 in 2010 2011 2012
0%
10%
20%
30%
40%
2010 2011 2012
% of respondents planning to buy car on all cash
Source: Credit Suisse India Consumer Survey 2013 Source: Credit Suisse India Consumer Survey 2013
The largest-selling brand in the country, Maruti Suzuki, had an encouraging year with
more respondents buying a Maruti car in 2012 compared to 2011. However, this number is
still low compared to 2010 since when there has been a clear shift in preference towards
foreign cars. More worrisome for the company is that its share in rural India (which has
traditionally been its forte) has now come down.

28 January 2013
India Consumer Survey 2013 20
Figure 43: Preference for Maruti cars increased over 2011
but is still down since 2010
Figure 44: No. of people wish to buy Maruti in future
increased slightly
0%
10%
20%
30%
40%
50%
60%
Total Urban Rural
% of respondents buying Maruti Suzuki in 2010 2011 2012
0%
10%
20%
30%
40%
50%
2010 2011 2012
% of respondents likely to buy Maruti Suzuki in future
Source: Credit Suisse India Consumer Survey 2013 Source: Credit Suisse India Consumer Survey 2013
Food and beverages
Eating and drinking habits in India have traditionally been influenced by cultural factors
rather than affordability. Overall, alcohol and meat consumption in India is very low. In our
survey, ~30% of people were vegetarians (with a significant percentage of meat-eaters
restricting meat consumption to less than 10% of the total intake). Similarly less than 10%
respondents consumed alcohol.
Compared to 2011 when there was an increase in meat-eaters, 2012 saw a decline, which
was larger in rural areas (the proportion of meat-eaters in rural areas decreased from 77%
to 54%). This was probably driven by lower affordability of meat as there has been quite a
big increase in meat prices over the course of 2011. Demand for spirits broadly remained
stable as there was no change in the number of alcohol consumers. Over the long term,
we believe the trend in 2012 will reverse and there will be a steady increase in both meat-
eaters and alcohol consumers as the present generation gives lesser importance to older
traditions and wants to try out new things.
Figure 45: Demand for meat is down driven by rural Figure 46: No. of alcohol consumers remained stable
40%
50%
60%
70%
80%
Total Urban Rural
% of meat-eaters in 2010 2011 2012
0% 2% 4% 6% 8%
2010
2011
2012
Alcohol Consumers
Source: Credit Suisse India Consumer Survey 2013 Source: Credit Suisse India Consumer Survey 2013

28 January 2013
India Consumer Survey 2013 21
The usage of dairy products remains encouraging. More than 90% respondents consume
dairy products and this number remained stable versus 2011. However, like meat,
respondents are worried about high inflation in milk and few of them want to spend more
on milk in future compared to 2011. All the items—meat, eggs and milk—saw large price
increases in 2012. With price moderation, the intake of meat and milk should remain
robust as people get conscious about the nutrient content in their diet.
Figure 47: People will spend less on dairy products... Figure 48:…and meat due to high inflation
40%
50%
60%
70%
80%
2010 2011 2012
Expecting to spend more on dairy products in future
0% 5% 10% 15% 20% 25% 30%
2010
2011
2012
Expecting to consume more meat in future
Source: Credit Suisse India Consumer Survey 2013 Source: Credit Suisse India Consumer Survey 2013
Just ~10% of respondents smoke cigarettes in India with penetration being slightly higher
in rural (12% in rural versus 10% in urban). India’s cigarette potential stands quite low
compared to that of other emerging countries indicating high growth potential.
Figure 49: India’s cigarette penetration stands at 10%... Figure 50: …much less compared to other countries
6% 8% 10% 12% 14%
Total
Urban
Rural
% of cigarette smokers
0%
10%
20%
30%
40%
50%
60%
Brazil China Indonesia India Russia
% of cigarette smokers
Source: Credit Suisse India Consumer Survey 2013 Source: Credit Suisse India Consumer Survey 2013

28 January 2013
India Consumer Survey 2013 22
Personal care
Use of personal care products is also on an upswing in all categories and across most
segments. Among our survey respondents, the usage of skincare products is quite high
with more than 90% of them using such products. This number has risen significantly over
the past two years. Moreover, many respondents are willing to spend considerably more
on personal care products in the future, indicating that people are getting much more
conscious of their looks and hygiene. Not surprisingly, higher-income people are using
more of these products, though this trend is visible across most segments.
Figure 51: Usage of personal care products going up significantly
50%
60%
70%
80%
90%
% respondents who spent on skin care products in last 3months
% expecting to spend more on these products in future
2010 2011 2012
Source: Credit Suisse India Consumer Survey 2013
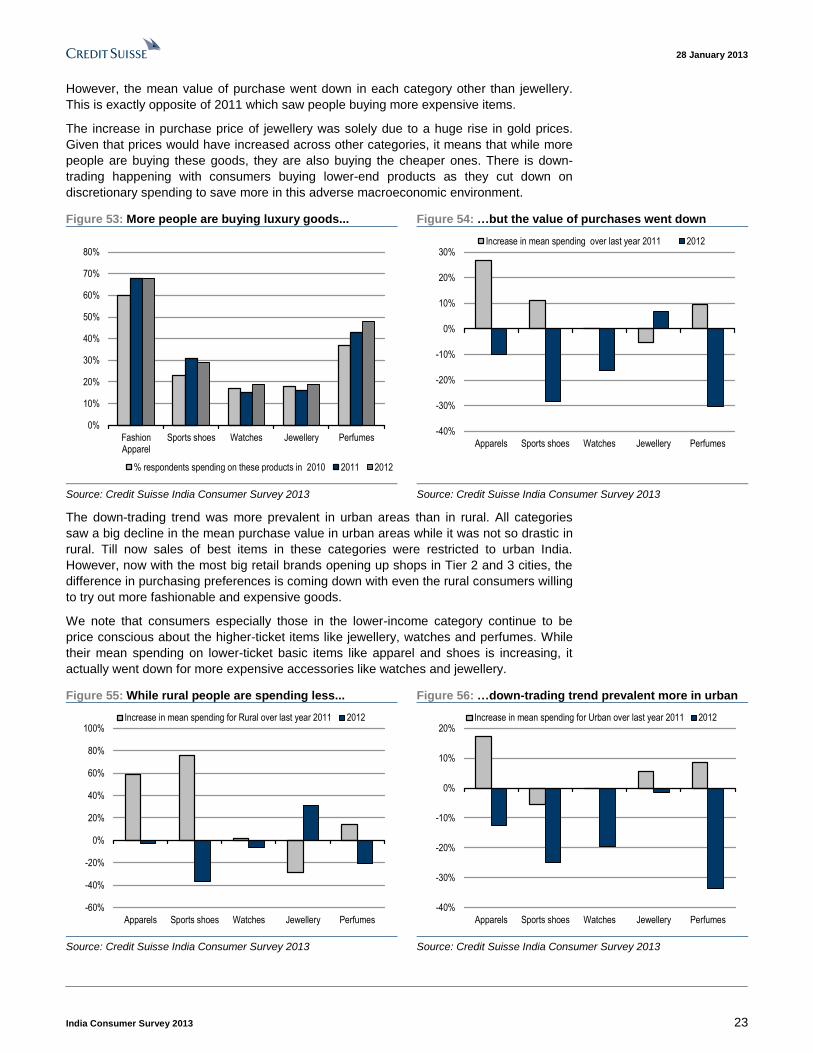
Luxury goods
Nearly all categories of luxury goods (fashion apparel, shoes, watches, jewellery and
perfumes) saw an increase in demand with a greater percentage of respondents reporting
having bought these goods recently as compared to those in 2011. Of the total money
spent on these luxury goods, jewellery still remains by far the biggest across income
categories. Indians have typically been large consumers of gold (predominantly in the
jewellery form) for both consumption and investment purposes.
Figure 52: Jewellery still remains by far the largest category
9% 8% 10% 8% 8% 9% 10% 11% 10%
8% 8%9%
7% 8% 8% 8% 7% 7%
9% 7%10%
8% 10% 10% 9% 11%8%
70% 72%64%
71% 70% 69% 69% 68% 72%
4% 5% 6% 5% 4% 4% 4% 4% 4%
0%
20%
40%
60%
80%
100%
Overall Up to 7500/- Rs. 7501to10000/-
Rs. 10001 to15000/-
Rs. 15001 to20000/-
Rs. 20001 to30000/-
Rs. 30001 to40000/-
Rs. 40001 to50000/-
More thanRs.50000/-
Proportion spent on Apparels Sports shoes Watches Jewellery Perfumes
Source Credit Suisse India Consumer Survey 2013
28 January 2013
India Consumer Survey 2013 23
However, the mean value of purchase went down in each category other than jewellery.
This is exactly opposite of 2011 which saw people buying more expensive items.
The increase in purchase price of jewellery was solely due to a huge rise in gold prices.
Given that prices would have increased across other categories, it means that while more
people are buying these goods, they are also buying the cheaper ones. There is down-
trading happening with consumers buying lower-end products as they cut down on
discretionary spending to save more in this adverse macroeconomic environment.
Figure 53: More people are buying luxury goods... Figure 54: …but the value of purchases went down
0%
10%
20%
30%
40%
50%
60%
70%
80%
FashionApparel
Sports shoes Watches Jewellery Perfumes
% respondents spending on these products in 2010 2011 2012
-40%
-30%
-20%
-10%
0%
10%
20%
30%
Apparels Sports shoes Watches Jewellery Perfumes
Increase in mean spending over last year 2011 2012
Source: Credit Suisse India Consumer Survey 2013 Source: Credit Suisse India Consumer Survey 2013
The down-trading trend was more prevalent in urban areas than in rural. All categories
saw a big decline in the mean purchase value in urban areas while it was not so drastic in
rural. Till now sales of best items in these categories were restricted to urban India.
However, now with the most big retail brands opening up shops in Tier 2 and 3 cities, the
difference in purchasing preferences is coming down with even the rural consumers willing
to try out more fashionable and expensive goods.
We note that consumers especially those in the lower-income category continue to be
price conscious about the higher-ticket items like jewellery, watches and perfumes. While
their mean spending on lower-ticket basic items like apparel and shoes is increasing, it
actually went down for more expensive accessories like watches and jewellery.
Figure 55: While rural people are spending less... Figure 56: …down-trading trend prevalent more in urban
-60%
-40%
-20%
0%
20%
40%
60%
80%
100%
Apparels Sports shoes Watches Jewellery Perfumes
Increase in mean spending for Rural over last year 2011 2012
-40%
-30%
-20%
-10%
0%
10%
20%
Apparels Sports shoes Watches Jewellery Perfumes
Increase in mean spending for Urban over last year 2011 2012
Source: Credit Suisse India Consumer Survey 2013 Source: Credit Suisse India Consumer Survey 2013
28 January 2013
India Consumer Survey 2013 24
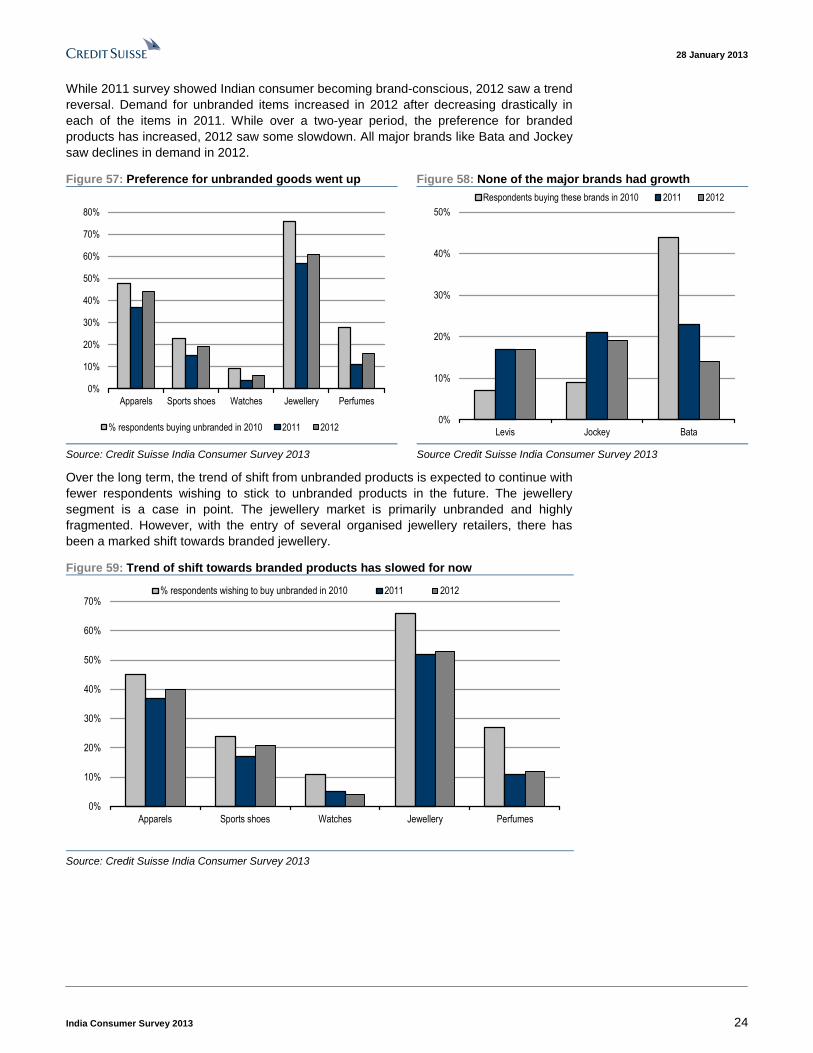
While 2011 survey showed Indian consumer becoming brand-conscious, 2012 saw a trend
reversal. Demand for unbranded items increased in 2012 after decreasing drastically in
each of the items in 2011. While over a two-year period, the preference for branded
products has increased, 2012 saw some slowdown. All major brands like Bata and Jockey
saw declines in demand in 2012.
Figure 57: Preference for unbranded goods went up Figure 58: None of the major brands had growth
0%
10%
20%
30%
40%
50%
60%
70%
80%
Apparels Sports shoes Watches Jewellery Perfumes
% respondents buying unbranded in 2010 2011 2012
0%
10%
20%
30%
40%
50%
Levis Jockey Bata
Respondents buying these brands in 2010 2011 2012
Source: Credit Suisse India Consumer Survey 2013 Source Credit Suisse India Consumer Survey 2013
Over the long term, the trend of shift from unbranded products is expected to continue with
fewer respondents wishing to stick to unbranded products in the future. The jewellery
segment is a case in point. The jewellery market is primarily unbranded and highly
fragmented. However, with the entry of several organised jewellery retailers, there has
been a marked shift towards branded jewellery.
Figure 59: Trend of shift towards branded products has slowed for now
0%
10%
20%
30%
40%
50%
60%
70%
Apparels Sports shoes Watches Jewellery Perfumes
% respondents wishing to buy unbranded in 2010 2011 2012
Source: Credit Suisse India Consumer Survey 2013

28 January 2013
India Consumer Survey 2013 25
Electronic goods
Penetration of most electronic goods remains low in the country and replacement/
upgradation of these happens after a much longer time compared to that in other countries.
Hence very few respondents have purchased these items over the past 12 months.
Moreover, the purchases were skewed towards lower-priced items like desktop PCs.
Figure 60: Buying electronic goods still remains low
0
2
4
6
8
10
Computer Camera DVD player Smart Phone LCD TV Notebook
% respondents who bought these products last year Likely to buy in near future
Source: Credit Suisse India Consumer Survey 2013
In the cable TV, penetration of DTH (direct to home) remains low. Moreover, people
expecting to shift to DTH/cable are less now than in 2011. There is no incentive to shift to
DTH and high prices deter customers from making the shift.
Figure 61: DTH penetration is still low Figure 62: Fewer people are willing to shift to DTH
0%
10%
20%
30%
40%
50%
60%
70%
80%
90%
DTH (direct-to-home) Cable Television
% people with access to cable/ DTH 2011 2012
0%
10%
20%
30%
40%
50%
60%
70%
% people expecting shift to DTH Cable Television
2010 2011 2012
Source: Credit Suisse India Consumer Survey 2013 Source: Credit Suisse India Consumer Survey 2013
28 January 2013
India Consumer Survey 2013 26
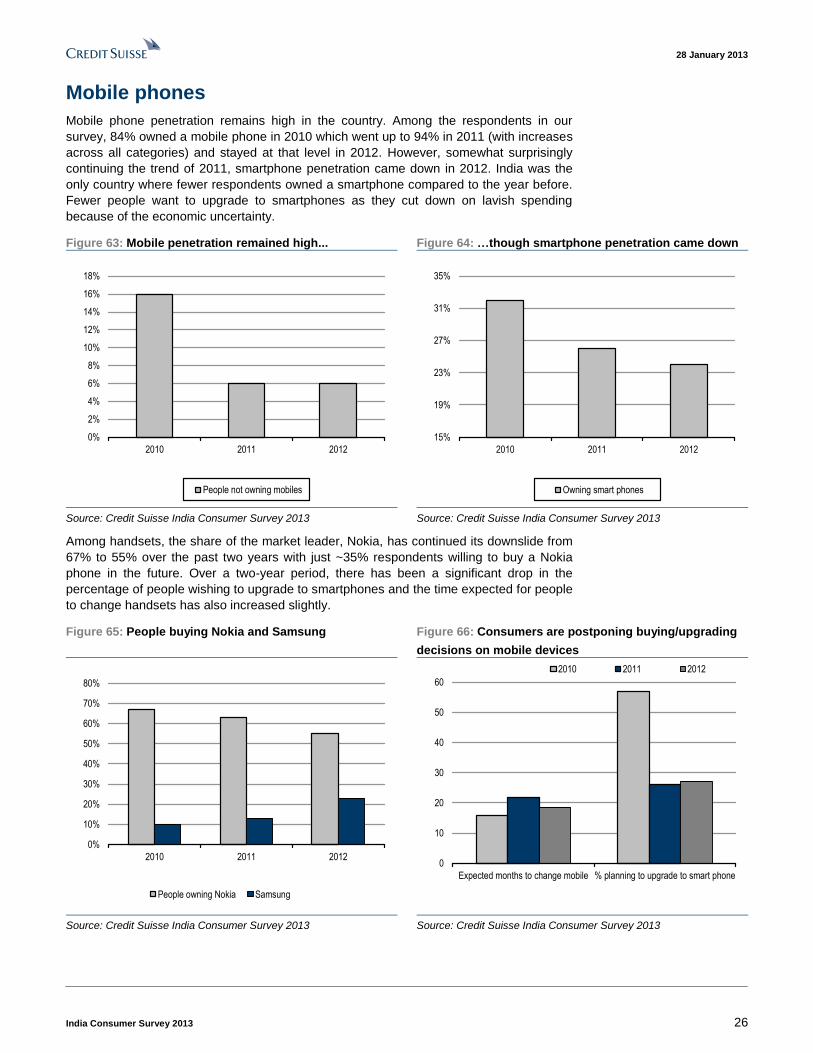
Mobile phones
Mobile phone penetration remains high in the country. Among the respondents in our
survey, 84% owned a mobile phone in 2010 which went up to 94% in 2011 (with increases
across all categories) and stayed at that level in 2012. However, somewhat surprisingly
continuing the trend of 2011, smartphone penetration came down in 2012. India was the
only country where fewer respondents owned a smartphone compared to the year before.
Fewer people want to upgrade to smartphones as they cut down on lavish spending
because of the economic uncertainty.
Figure 63: Mobile penetration remained high... Figure 64: …though smartphone penetration came down
0%
2%
4%
6%
8%
10%
12%
14%
16%
18%
2010 2011 2012
People not owning mobiles
15%
19%
23%
27%
31%
35%
2010 2011 2012
Owning smart phones
Source: Credit Suisse India Consumer Survey 2013 Source: Credit Suisse India Consumer Survey 2013
Among handsets, the share of the market leader, Nokia, has continued its downslide from
67% to 55% over the past two years with just ~35% respondents willing to buy a Nokia
phone in the future. Over a two-year period, there has been a significant drop in the
percentage of people wishing to upgrade to smartphones and the time expected for people
to change handsets has also increased slightly.
Figure 65: People buying Nokia and Samsung Figure 66: Consumers are postponing buying/upgrading
decisions on mobile devices
0%
10%
20%
30%
40%
50%
60%
70%
80%
2010 2011 2012
People owning Nokia Samsung
0
10
20
30
40
50
60
Expected months to change mobile % planning to upgrade to smart phone
2010 2011 2012
Source: Credit Suisse India Consumer Survey 2013 Source: Credit Suisse India Consumer Survey 2013
28 January 2013
India Consumer Survey 2013 27
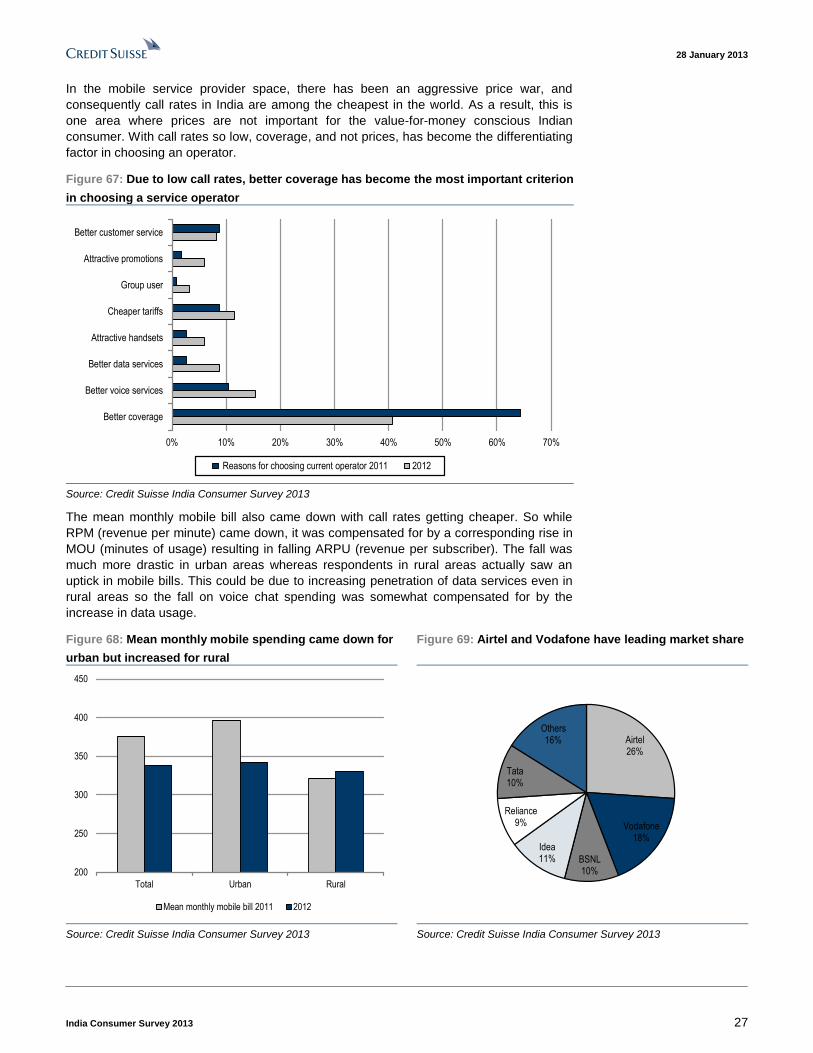
In the mobile service provider space, there has been an aggressive price war, and
consequently call rates in India are among the cheapest in the world. As a result, this is
one area where prices are not important for the value-for-money conscious Indian
consumer. With call rates so low, coverage, and not prices, has become the differentiating
factor in choosing an operator.
Figure 67: Due to low call rates, better coverage has become the most important criterion
in choosing a service operator
0% 10% 20% 30% 40% 50% 60% 70%
Better coverage
Better voice services
Better data services
Attractive handsets
Cheaper tariffs
Group user
Attractive promotions
Better customer service
Reasons for choosing current operator 2011 2012
Source: Credit Suisse India Consumer Survey 2013
The mean monthly mobile bill also came down with call rates getting cheaper. So while
RPM (revenue per minute) came down, it was compensated for by a corresponding rise in
MOU (minutes of usage) resulting in falling ARPU (revenue per subscriber). The fall was
much more drastic in urban areas whereas respondents in rural areas actually saw an
uptick in mobile bills. This could be due to increasing penetration of data services even in
rural areas so the fall on voice chat spending was somewhat compensated for by the
increase in data usage.
Figure 68: Mean monthly mobile spending came down for
urban but increased for rural
Figure 69: Airtel and Vodafone have leading market share
200
250
300
350
400
450
Total Urban Rural
Mean monthly mobile bill 2011 2012
Airtel26%
Vodafone18%
BSNL10%
Idea11%
Reliance9%
Tata10%
Others16%
Source: Credit Suisse India Consumer Survey 2013 Source: Credit Suisse India Consumer Survey 2013
28 January 2013
India Consumer Survey 2013 28
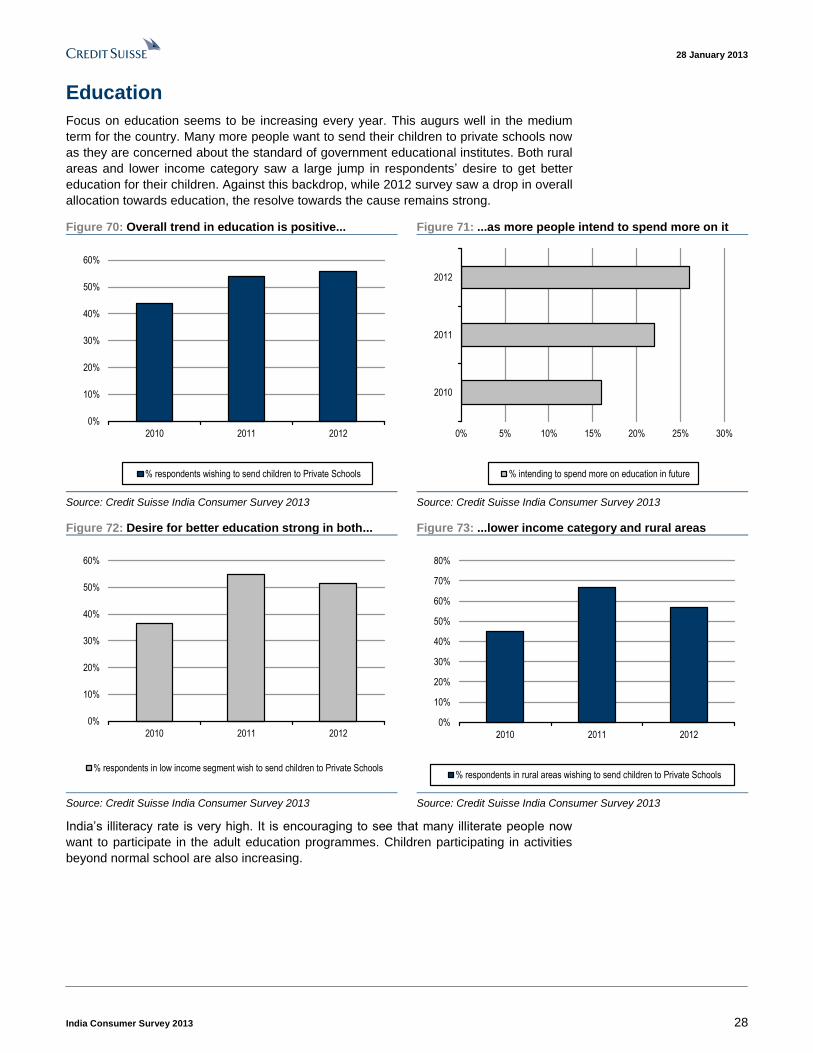
Education
Focus on education seems to be increasing every year. This augurs well in the medium
term for the country. Many more people want to send their children to private schools now
as they are concerned about the standard of government educational institutes. Both rural
areas and lower income category saw a large jump in respondents’ desire to get better
education for their children. Against this backdrop, while 2012 survey saw a drop in overall
allocation towards education, the resolve towards the cause remains strong.
Figure 70: Overall trend in education is positive... Figure 71: ...as more people intend to spend more on it
0%
10%
20%
30%
40%
50%
60%
2010 2011 2012
% respondents wishing to send children to Private Schools
0% 5% 10% 15% 20% 25% 30%
2010
2011
2012
% intending to spend more on education in future
Source: Credit Suisse India Consumer Survey 2013 Source: Credit Suisse India Consumer Survey 2013
Figure 72: Desire for better education strong in both... Figure 73: ...lower income category and rural areas
0%
10%
20%
30%
40%
50%
60%
2010 2011 2012
% respondents in low income segment wish to send children to Private Schools
0%
10%
20%
30%
40%
50%
60%
70%
80%
2010 2011 2012
% respondents in rural areas wishing to send children to Private Schools
Source: Credit Suisse India Consumer Survey 2013 Source: Credit Suisse India Consumer Survey 2013
India’s illiteracy rate is very high. It is encouraging to see that many illiterate people now
want to participate in the adult education programmes. Children participating in activities
beyond normal school are also increasing.

28 January 2013
India Consumer Survey 2013 29
Figure 74: High no. of people still want adult education Figure 75: Participation in extra activities is increasing
0%
2%
4%
6%
8%
10%
12%
14%
2010 2011 2012
% of respondents in rural taking adult continuation education
0% 10% 20% 30% 40%
2010
2011
2012
Children participating in activities outside normal courses
Source: Credit Suisse India Consumer Survey 2013 Source: Credit Suisse India Consumer Survey 2013
Travel
Holiday is predominantly limited to domestic destinations in India. There was even greater
preference for domestic tourist destinations this time around. Previous year’s trend of a
higher proportion of respondents in rural areas going on holidays reversed this time
around. Rural people going on holiday went down while that in urban increased.
Air travel is still an under-penetrated category in India and respondents using air travel
remained low (as air fares went up), but those using road travel (car/bus) went up. This is
another sign that people are cutting down on lavish spending.
Figure 76: Penetration of air travel remained low Figure 77: Preference for domestic tourism went up
0%
10%
20%
30%
40%
50%
60%
Car Bus Train Aeroplane
% respondents using particular mode in 2010 2011 2012
0%
10%
20%
30%
40%
50%
60%
70%
80%
90%
Home Domestic touristdestination
International
Holiday destination 2010 2011 2012
Source: Credit Suisse India Consumer Survey 2013 Source: Credit Suisse India Consumer Survey 2013
Internet
Just 24% of respondents surveyed had access to Internet (actual Internet penetration is
even lower at ~10%). While the overall number is similar to that in 2011, Internet users
increased significantly in higher-income categories. However, India is still far behind other
emerging countries. E-commerce is also on an upward trajectory in India, with
respondents using Internet for online shopping going up in almost all the categories like
books, electronics and clothes.

28 January 2013
India Consumer Survey 2013 30
Figure 78: Only ~24% have access to Internet, though this
is increasing especially in higher-income categories
Figure 79: Internet penetration still low in country
17% 19%24%
83% 81%76%
0%
20%
40%
60%
80%
100%
2010 2011 2012
% repondents with access to internet No access to internet
76
70
24
9
71
86
51
0
20
40
60
80
100
Brazil China India Indonesia Russia Saudi Turkey
Internet Penetration
Source: Credit Suisse India Consumer Survey 2013 Source: Credit Suisse India Consumer Survey 2013
Healthcare
The state of healthcare is quite poor in the country primarily due to under-investment by
government especially in the rural areas. Less than 40% of respondents have access to
free healthcare from state which, though an improvement over the past two years, is still
very low. Patients largely pay out from their own pockets. About ~34% of respondents
were regular purchasers of medicines implying that they had chronic problems (regular
medicines required like in diabetes). The share of medicines for acute diseases stands
much higher at 66% (actual chronic: acute ratio is 25:75)
Figure 80: Despite a steady increase, less than 34% of
patients have access to healthcare from state
Figure 81: Respondents who are regular purchasers of
medicines (chronic problems) constitute 34%
0%
10%
20%
30%
40%
50%
Total Urban Rural
Access to free health-care from state 2010 2011 2012
Regular purchaser
of medicine (Chronic
problems)34%
Not regular purchaser
66%
Source: Credit Suisse India Consumer Survey 2013 Source: Credit Suisse India Consumer Survey 2013
28 January 2013
India Consumer Survey 2013 31
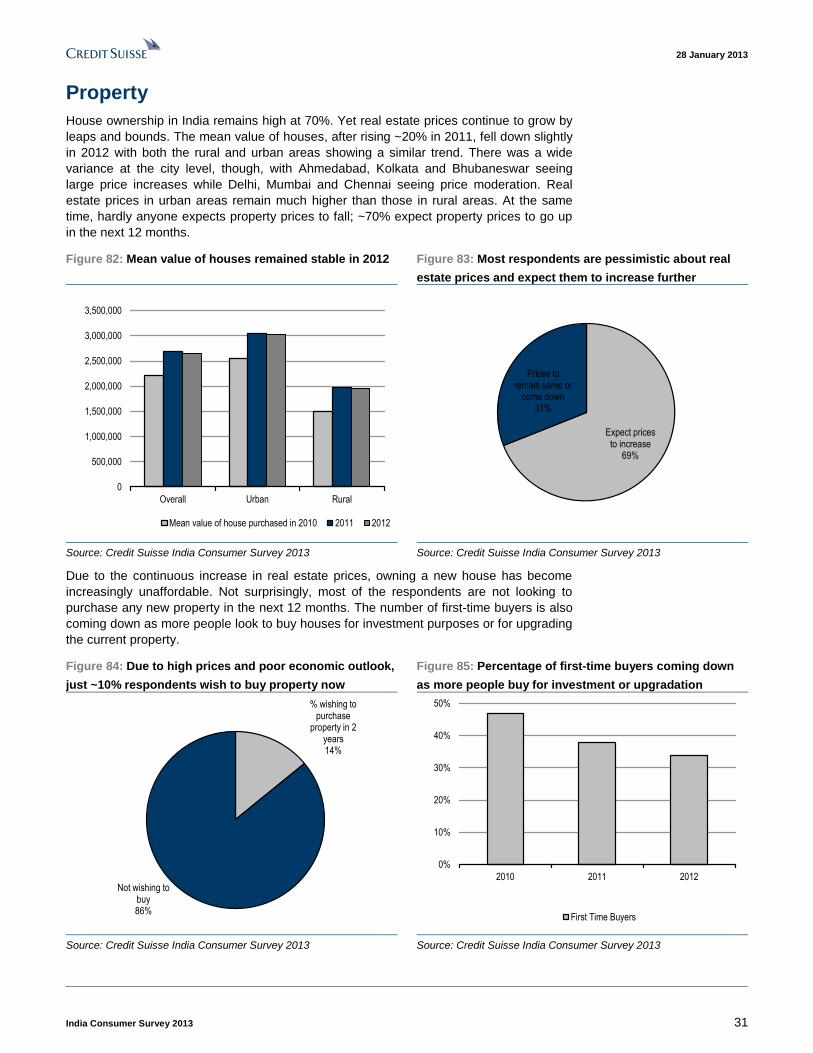
Property
House ownership in India remains high at 70%. Yet real estate prices continue to grow by
leaps and bounds. The mean value of houses, after rising ~20% in 2011, fell down slightly
in 2012 with both the rural and urban areas showing a similar trend. There was a wide
variance at the city level, though, with Ahmedabad, Kolkata and Bhubaneswar seeing
large price increases while Delhi, Mumbai and Chennai seeing price moderation. Real
estate prices in urban areas remain much higher than those in rural areas. At the same
time, hardly anyone expects property prices to fall; ~70% expect property prices to go up
in the next 12 months.
Figure 82: Mean value of houses remained stable in 2012 Figure 83: Most respondents are pessimistic about real
estate prices and expect them to increase further
0
500,000
1,000,000
1,500,000
2,000,000
2,500,000
3,000,000
3,500,000
Overall Urban Rural
Mean value of house purchased in 2010 2011 2012
Expect prices to increase
69%
Prices to remain same or
come down31%
Source: Credit Suisse India Consumer Survey 2013 Source: Credit Suisse India Consumer Survey 2013
Due to the continuous increase in real estate prices, owning a new house has become
increasingly unaffordable. Not surprisingly, most of the respondents are not looking to
purchase any new property in the next 12 months. The number of first-time buyers is also
coming down as more people look to buy houses for investment purposes or for upgrading
the current property.
Figure 84: Due to high prices and poor economic outlook,
just ~10% respondents wish to buy property now
Figure 85: Percentage of first-time buyers coming down
as more people buy for investment or upgradation
% wishing to purchase
property in 2 years14%
Not wishing to buy86%
0%
10%
20%
30%
40%
50%
2010 2011 2012
First Time Buyers
Source: Credit Suisse India Consumer Survey 2013 Source: Credit Suisse India Consumer Survey 2013
28 January 2013
India Consumer Survey 2013 32
Asia Pacific / India
Tobacco
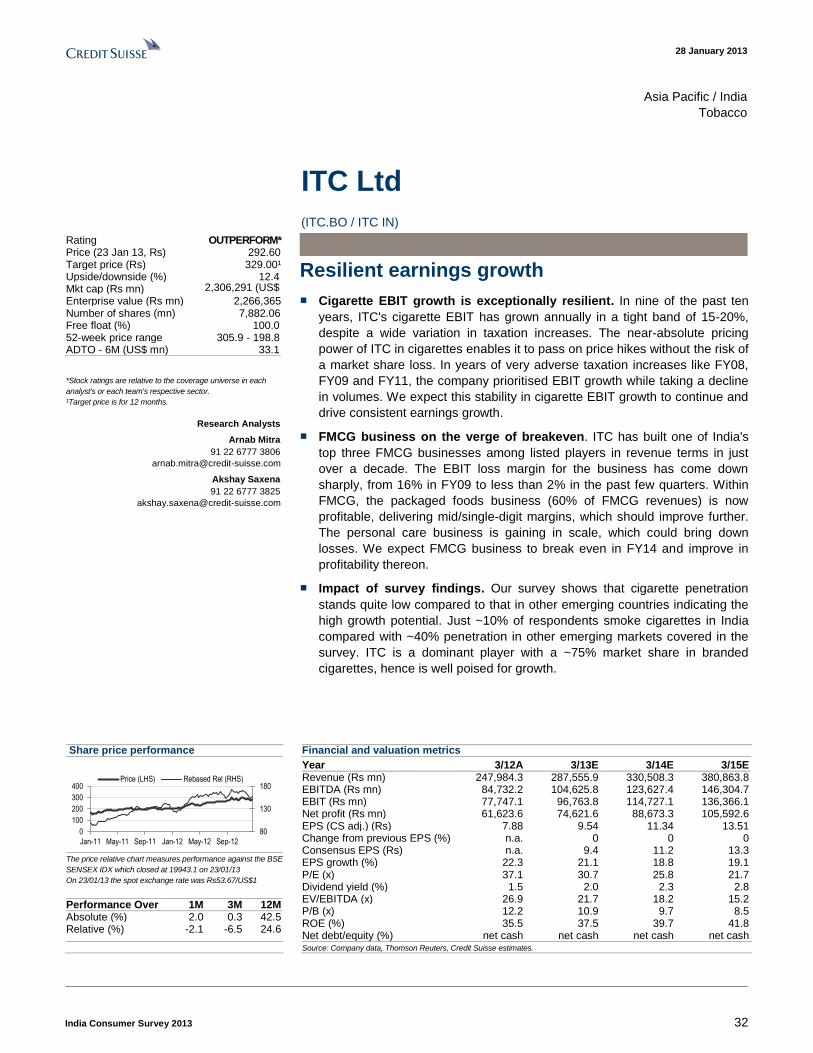
ITC Ltd
(ITC.BO / ITC IN)
Resilient earnings growth
■ Cigarette EBIT growth is exceptionally resilient. In nine of the past ten
years, ITC's cigarette EBIT has grown annually in a tight band of 15-20%,
despite a wide variation in taxation increases. The near-absolute pricing
power of ITC in cigarettes enables it to pass on price hikes without the risk of
a market share loss. In years of very adverse taxation increases like FY08,
FY09 and FY11, the company prioritised EBIT growth while taking a decline
in volumes. We expect this stability in cigarette EBIT growth to continue and
drive consistent earnings growth.
■ FMCG business on the verge of breakeven. ITC has built one of India's
top three FMCG businesses among listed players in revenue terms in just
over a decade. The EBIT loss margin for the business has come down
sharply, from 16% in FY09 to less than 2% in the past few quarters. Within
FMCG, the packaged foods business (60% of FMCG revenues) is now
profitable, delivering mid/single-digit margins, which should improve further.
The personal care business is gaining in scale, which could bring down
losses. We expect FMCG business to break even in FY14 and improve in
profitability thereon.
■ Impact of survey findings. Our survey shows that cigarette penetration
stands quite low compared to that in other emerging countries indicating the
high growth potential. Just ~10% of respondents smoke cigarettes in India
compared with ~40% penetration in other emerging markets covered in the
survey. ITC is a dominant player with a ~75% market share in branded
cigarettes, hence is well poised for growth.
Share price performance
80
130
180
0
100
200
300
400
Jan-11 May-11 Sep-11 Jan-12 May-12 Sep-12
Price (LHS) Rebased Rel (RHS)
The price relative chart measures performance against the BSE
SENSEX IDX which closed at 19943.1 on 23/01/13
On 23/01/13 the spot exchange rate was Rs53.67/US$1
Performance Over 1M 3M 12M Absolute (%) 2.0 0.3 42.5 Relative (%) -2.1 -6.5 24.6
Financial and valuation metrics
Year 3/12A 3/13E 3/14E 3/15E Revenue (Rs mn) 247,984.3 287,555.9 330,508.3 380,863.8 EBITDA (Rs mn) 84,732.2 104,625.8 123,627.4 146,304.7 EBIT (Rs mn) 77,747.1 96,763.8 114,727.1 136,366.1 Net profit (Rs mn) 61,623.6 74,621.6 88,673.3 105,592.6 EPS (CS adj.) (Rs) 7.88 9.54 11.34 13.51 Change from previous EPS (%) n.a. 0 0 0 Consensus EPS (Rs) n.a. 9.4 11.2 13.3 EPS growth (%) 22.3 21.1 18.8 19.1 P/E (x) 37.1 30.7 25.8 21.7 Dividend yield (%) 1.5 2.0 2.3 2.8 EV/EBITDA (x) 26.9 21.7 18.2 15.2 P/B (x) 12.2 10.9 9.7 8.5 ROE (%) 35.5 37.5 39.7 41.8 Net debt/equity (%) net cash net cash net cash net cash
Source: Company data, Thomson Reuters, Credit Suisse estimates.
Rating OUTPERFORM* Price (23 Jan 13, Rs) 292.60 Target price (Rs) 329.00¹ Upside/downside (%) 12.4 Mkt cap (Rs mn) 2,306,291 (US$
42,972) Enterprise value (Rs mn) 2,266,365 Number of shares (mn) 7,882.06 Free float (%) 100.0 52-week price range 305.9 - 198.8 ADTO - 6M (US$ mn) 33.1
*Stock ratings are relative to the coverage universe in each
analyst's or each team's respective sector.
¹Target price is for 12 months.
Research Analysts
Arnab Mitra
91 22 6777 3806
Akshay Saxena
91 22 6777 3825

28 January 2013
India Consumer Survey 2013 33
Asia Pacific / India
Automobile Manufacturers
Bajaj Auto Limited
(BAJA.BO / BJAUT IN)
Distinctly global
■ Main investment thesis. We expect the Indian two-wheeler industry to grow
at about 12% p.a. over the next few years. Increasing penetration in rural
India, driven by rising incomes and improving infrastructure, and higher
ownership among women in urban areas are the key growth drivers. Bajaj is
the second largest player in Indian two-wheeler market with a ~25% market
share in motorcycles. Bajaj has high free cash flow generation given its
higher margins and lower capex requirements.
■ Robust export growth complements domestic story. While exports have
been lacklustre in FY13 on account of issues with end-markets, Bajaj has
started gaining share from the Chinese, evident from the steep decline in
Chinese exports. We reckon on a lower base most of these end-markets will
witness healthy growth and that combined with even faster market share
gains for Bajaj (with currency benefits kicking in from FY14) will drive healthy
20% growth in export volumes. The export tie-up with Kawasaki will also
start bearing results from 2H FY14, in our view.
■ Margins set to expand on improved currency realisations. We expect
Bajaj’s margins to improve ~100 bp YoY in FY14 largely on account of better
export realisation which will move up from Rs50/US$ to Rs55/US$.
Potentially margins can expand much more (10% greater realisations on
exports which are 35% of sales) but we are building in lesser improvement
given that we expect the company to pass on a part of the benefit to its
customers. Also a part of the improvement in export margins will be negated
by the decline in DEPB rates which have gone down from 5.5% to 2%.
■ Impact of survey findings. Our survey results point to still good growth
potential for two-wheelers especially in smaller cities. Given the brand
positioning of Bajaj and its wide sales and service network, it is extremely
well positioned to cater to this growth. We also observe that an increased
appetite for credit, which if combined with higher availability of financing,
could provide an upside risk to industry growth rates.
Share price performance
80
130
180
1200
1700
2200
Jan-11 May-11 Sep-11 Jan-12 May-12 Sep-12
Price (LHS) Rebased Rel (RHS)
The price relative chart measures performance against the BSE
SENSEX IDX which closed at 19943.1 on 23/01/13
On 23/01/13 the spot exchange rate was Rs53.67/US$1
Performance Over 1M 3M 12M Absolute (%) -3.3 15.4 29.0 Relative (%) -7.4 8.6 11.1
Financial and valuation metrics
Year 3/12A 3/13E 3/14E 3/15E Revenue (Rs mn) 195,946.5 205,419.4 247,617.1 282,957.0 EBITDA (Rs mn) 37,099.7 37,782.1 48,336.5 56,312.9 EBIT (Rs mn) 35,632.4 36,177.3 46,589.4 54,423.5 Net profit (Rs mn) 30,454.0 31,128.5 38,623.7 44,642.7 EPS (CS adj.) (Rs) 105.35 107.68 133.61 154.43 Change from previous EPS (%) n.a. 0 0 0 Consensus EPS (Rs) n.a. 108 130 148 EPS growth (%) -11.9 2.2 24.1 15.6 P/E (x) 19.3 18.9 15.2 13.2 Dividend yield (%) 2.2 2.2 2.7 2.9 EV/EBITDA (x) 14.4 13.8 10.3 8.4 P/B (x) 9.7 7.7 6.2 4.9 ROE (%) 55.9 45.5 45.0 41.6 Net debt/equity (%) net cash net cash net cash net cash
Source: Company data, Thomson Reuters, Credit Suisse estimates.
Rating OUTPERFORM Price (23 Jan 13, Rs) 2,036.25 Target price (Rs) 2,537.00¹ Upside/downside (%) 24.6 Mkt cap (Rs mn) 589,224 (US$ 10,979) Enterprise value (Rs mn) 520,258 Number of shares (mn) 289.37 Free float (%) 50.0 52-week price range 2,214.0 - 1,447.2 ADTO - 6M (US$ mn) 14.8
*Stock ratings are relative to the coverage universe in each
analyst's or each team's respective sector.
¹Target price is for 12 months.
Research Analysts
Jatin Chawla
91 22 6777 3719
Akshay Saxena
91 22 6777 3825
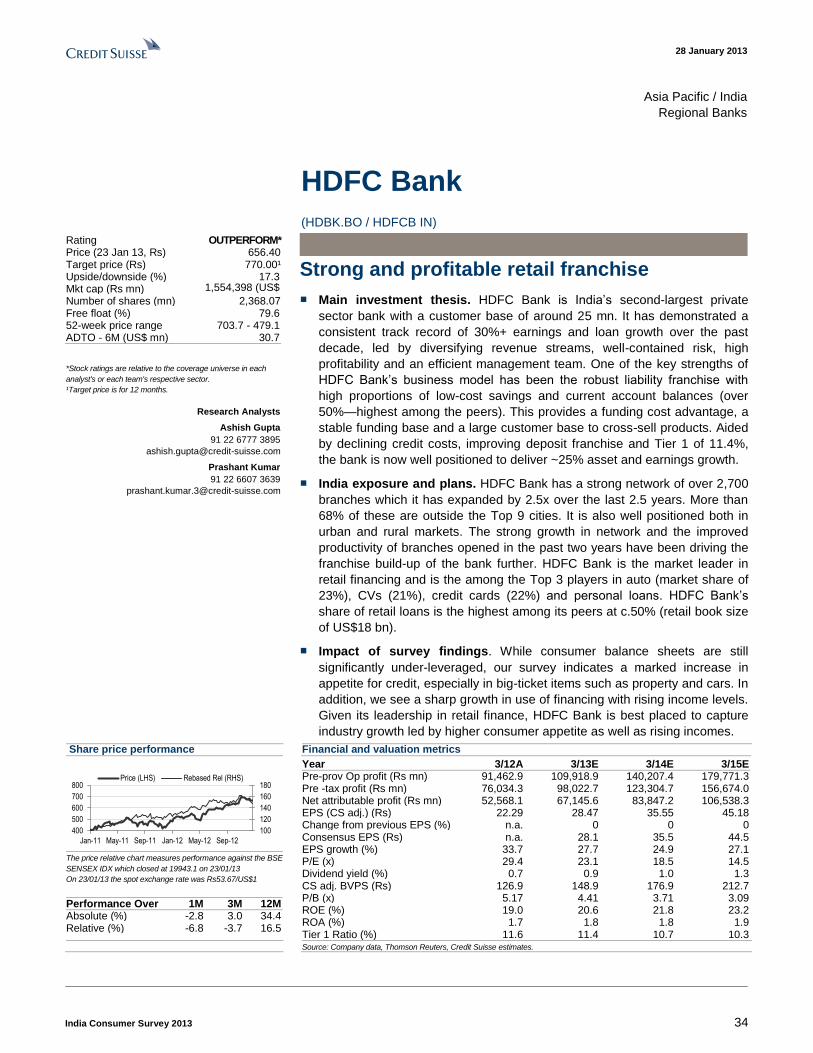
28 January 2013
India Consumer Survey 2013 34
Asia Pacific / India
Regional Banks
HDFC Bank
(HDBK.BO / HDFCB IN)
Strong and profitable retail franchise
■ Main investment thesis. HDFC Bank is India’s second-largest private
sector bank with a customer base of around 25 mn. It has demonstrated a
consistent track record of 30%+ earnings and loan growth over the past
decade, led by diversifying revenue streams, well-contained risk, high
profitability and an efficient management team. One of the key strengths of
HDFC Bank’s business model has been the robust liability franchise with
high proportions of low-cost savings and current account balances (over
50%—highest among the peers). This provides a funding cost advantage, a
stable funding base and a large customer base to cross-sell products. Aided
by declining credit costs, improving deposit franchise and Tier 1 of 11.4%,
the bank is now well positioned to deliver ~25% asset and earnings growth.
■ India exposure and plans. HDFC Bank has a strong network of over 2,700
branches which it has expanded by 2.5x over the last 2.5 years. More than
68% of these are outside the Top 9 cities. It is also well positioned both in
urban and rural markets. The strong growth in network and the improved
productivity of branches opened in the past two years have been driving the
franchise build-up of the bank further. HDFC Bank is the market leader in
retail financing and is the among the Top 3 players in auto (market share of
23%), CVs (21%), credit cards (22%) and personal loans. HDFC Bank’s
share of retail loans is the highest among its peers at c.50% (retail book size
of US$18 bn).
■ Impact of survey findings. While consumer balance sheets are still
significantly under-leveraged, our survey indicates a marked increase in
appetite for credit, especially in big-ticket items such as property and cars. In
addition, we see a sharp growth in use of financing with rising income levels.
Given its leadership in retail finance, HDFC Bank is best placed to capture
industry growth led by higher consumer appetite as well as rising incomes.
Share price performance
100
120
140
160
180
400
500
600
700
800
Jan-11 May-11 Sep-11 Jan-12 May-12 Sep-12
Price (LHS) Rebased Rel (RHS)
The price relative chart measures performance against the BSE
SENSEX IDX which closed at 19943.1 on 23/01/13
On 23/01/13 the spot exchange rate was Rs53.67/US$1
Performance Over 1M 3M 12M Absolute (%) -2.8 3.0 34.4 Relative (%) -6.8 -3.7 16.5
Financial and valuation metrics
Year 3/12A 3/13E 3/14E 3/15E Pre-prov Op profit (Rs mn) 91,462.9 109,918.9 140,207.4 179,771.3 Pre -tax profit (Rs mn) 76,034.3 98,022.7 123,304.7 156,674.0 Net attributable profit (Rs mn) 52,568.1 67,145.6 83,847.2 106,538.3 EPS (CS adj.) (Rs) 22.29 28.47 35.55 45.18 Change from previous EPS (%) n.a. 0 0 0 Consensus EPS (Rs) n.a. 28.1 35.5 44.5 EPS growth (%) 33.7 27.7 24.9 27.1 P/E (x) 29.4 23.1 18.5 14.5 Dividend yield (%) 0.7 0.9 1.0 1.3 CS adj. BVPS (Rs) 126.9 148.9 176.9 212.7 P/B (x) 5.17 4.41 3.71 3.09 ROE (%) 19.0 20.6 21.8 23.2 ROA (%) 1.7 1.8 1.8 1.9 Tier 1 Ratio (%) 11.6 11.4 10.7 10.3
Source: Company data, Thomson Reuters, Credit Suisse estimates.
Rating OUTPERFORM* Price (23 Jan 13, Rs) 656.40 Target price (Rs) 770.00¹ Upside/downside (%) 17.3 Mkt cap (Rs mn) 1,554,398 (US$
28,962) Number of shares (mn) 2,368.07 Free float (%) 79.6 52-week price range 703.7 - 479.1 ADTO - 6M (US$ mn) 30.7
*Stock ratings are relative to the coverage universe in each
analyst's or each team's respective sector.
¹Target price is for 12 months.
Research Analysts
Ashish Gupta
91 22 6777 3895
Prashant Kumar
91 22 6607 3639

28 January 2013
India Consumer Survey 2013 35
Asia Pacific / India
Department Stores
Titan Industries
(TITN.BO / TTAN IN)
The glitter is intact
■ Compelling structural growth story. Branded jewellery is a high growth
market, as over 90% of the Indian jewellery market is unorganised which is
likely to gradually lose share to the organised retailers like Titan. Titan's
management has created an aspirational brand in this market (Tanishq) with
a strong competitive advantage of having the trust associated with the Tata
brand. As the company is investing aggressively in retail space expansion,
we expect market share gains for the company to continue.
■ Near-term demand has bottomed out, space expansion will drive
strong volume growth from FY14. Demand for jewellery has been very
weak in the past four quarters with a 20-40% YoY volume decline. However,
we are clearly seeing signs of demand bottoming out. We do not expect a
sharp recovery but a gradual return of consumer buying. With Titan in the
process of doubling its retail space over FY11-13, we expect strong 15-20%
volume growth with a lag of 12-18 months. Historically there has been a
strong correlation between space addition and market share gains by Titan.
■ Quality business model deserves rich valuations, in our view. Titan's
ROCE moved up from 26% in FY09 to 50% in FY12, while ROIC moved up
from 28% to 114% in the same period. Titan has evolved itself into a high
quality business model especially in jewellery with return ratios comparable
to FMCG companies. It is also one of the few companies in India to have
successfully run a franchisee-based retail model which limits the need of
capital expenditure when the company is expanding faster. With the
medium-term growth headroom being high, Titan deserves to trade at rich
valuations despite the near-term slowdown it is facing.
■ Impact of survey findings. Our survey shows that over a two-year period,
there has been a clear shift towards branded jewellery and watches which
should benefit Titan. While other discretionary items like apparel and shoes
have seen a fall in purchase value, jewellery has seen a big increase with
more people buying it, indicating that despite the rise in gold price, demand
for jewellery remains intact. Share price performance
80
130
180
0
100
200
300
400
Jan-11 May-11 Sep-11 Jan-12 May-12 Sep-12
Price (LHS) Rebased Rel (RHS)
The price relative chart measures performance against the BSE
SENSEX IDX which closed at 19943.1 on 23/01/13
On 23/01/13 the spot exchange rate was Rs53.67/US$1
Performance Over 1M 3M 12M Absolute (%) -5.0 -3.6 38.7 Relative (%) -9.0 -10.4 20.9
Financial and valuation metrics
Year 3/12A 3/13E 3/14E 3/15E Revenue (Rs mn) 88,383.8 100,885.5 122,018.3 143,388.5 EBITDA (Rs mn) 8,329.4 9,926.9 12,448.6 15,123.6 EBIT (Rs mn) 7,880.4 9,318.8 11,748.4 14,331.3 Net profit (Rs mn) 6,001.6 7,286.7 9,025.5 11,163.8 EPS (CS adj.) (Rs) 6.76 8.21 10.17 12.57 Change from previous EPS (%) n.a. 0 0 0 Consensus EPS (Rs) n.a. 8.4 10.4 12.8 EPS growth (%) 39.4 21.4 23.9 23.7 P/E (x) 39.4 32.5 26.2 21.2 Dividend yield (%) 1.6 1.4 1.7 2.1 EV/EBITDA (x) 27.2 22.7 17.7 14.2 P/B (x) 16.3 12.2 9.3 7.3 ROE (%) 48.5 43.0 40.4 38.8 Net debt/equity (%) net cash net cash net cash net cash
Source: Company data, Thomson Reuters, Credit Suisse estimates.
Rating OUTPERFORM Price (23 Jan 13, Rs) 266.35 Target price (Rs) 341.00¹ Upside/downside (%) 28.0 Mkt cap (Rs mn) 236,462 (US$ 4,406) Enterprise value (Rs mn) 225,215 Number of shares (mn) 887.79 Free float (%) 50.0 52-week price range 311.8 - 194.7 ADTO - 6M (US$ mn) 8.9
*Stock ratings are relative to the coverage universe in each
analyst's or each team's respective sector.
¹Target price is for 12 months.
Research Analysts
Arnab Mitra
91 22 6777 3806
Akshay Saxena
91 22 6777 3825

28 January 2013
India Consumer Survey 2013 36
Asia Pacific / India
Personal Products
Emami Ltd
(EMAM.BO / HMN IN)
The niche advantage
■ Unique portfolio and strong innovation track record. Emami has a
unique portfolio of products with high market shares in niche segments, thus
largely side-stepping intense competition. In our view, Emami's management
also has the best track record of innovation, with the company drawing more
than 40% of its revenues from products launched post 2005. We are excited
over the potential of the current pipeline of ramp-ups such as pain ointments,
OTC products and skin care extensions.
■ Margin expansion ahead. Emami faced severe margin pressure as its
largest input cost, menthol, moved up 350% over FY10-12. Menthol prices
have corrected by 40% from their peak and are now 10% lower than 2012
average prices. Emami has, however, continued to hike prices, as demand
remains strong. We expect EBITDA margins to expand 240 bp over FY13-15,
as the full benefit of commodity cost deflation plays out.
■ Emami's valuations attractive; could see a re-rating. Among mid-cap
consumer staples, Emami has one of the highest net cash positions,
dividend payout ratios and ROEs. With growth momentum coming back, we
expect the stock to at least trade in line with its larger mid-cap peers. We
value the stock at 24x one-year forward earnings, in line with our target
multiple for its mid-cap peers. The stock is the cheapest on P/E and PEG
bases among our consumer staple coverage universe.
■ Impact of survey findings. Our survey indicates that demand for personal
care products is also on an upswing across most segments. Among our
survey respondents, the usage of skincare products is quite high with more
than 90% of them using such products. This number has risen significantly
over the past two years. Moreover, many respondents are willing to spend
considerably more on personal care products in the future, indicating that
people are getting much more conscious of their looks and hygiene. The
trend of rural growth remaining strong also bodes well for Emami which has
a large share of revenues coming from the rural areas.
Share price performance
80
100
120
140
160
200
400
600
800
Jan-11 May-11 Sep-11 Jan-12 May-12 Sep-12
Price (LHS) Rebased Rel (RHS)
The price relative chart measures performance against the BSE
SENSEX IDX which closed at 19943.1 on 23/01/13
On 23/01/13 the spot exchange rate was Rs53.67/US$1
Performance Over 1M 3M 12M Absolute (%) -1.5 1.1 65.1 Relative (%) -5.6 -5.6 47.3
Financial and valuation metrics
Year 3/12A 3/13E 3/14E 3/15E Revenue (Rs mn) 14,535.1 17,165.7 20,390.9 24,247.3 EBITDA (Rs mn) 2,967.6 3,396.0 4,336.5 5,370.8 EBIT (Rs mn) 2,779.8 3,179.3 4,093.4 5,101.2 Net profit (Rs mn) 2,588.0 3,154.2 3,931.1 4,810.5 EPS (CS adj.) (Rs) 17.10 20.85 25.98 31.79 Change from previous EPS (%) n.a. 0 0 0 Consensus EPS (Rs) n.a. 20.7 24.6 29.1 EPS growth (%) 13.2 21.9 24.6 22.4 P/E (x) 33.9 27.8 22.3 18.3 Dividend yield (%) 1.4 1.4 1.8 2.2 EV/EBITDA (x) 29.2 25.2 19.3 15.2 P/B (x) 12.4 10.0 8.1 6.5 ROE (%) 37.1 39.9 40.1 39.6 Net debt/equity (%) net cash net cash net cash net cash
Source: Company data, Thomson Reuters, Credit Suisse estimates.
Rating OUTPERFORM Price (23 Jan 13, Rs) 580.25 Target price (Rs) 690.00¹ Upside/downside (%) 18.9 Mkt cap (Rs mn) 87,799 (US$ 1,636) Enterprise value (Rs mn) 85,615 Number of shares (mn) 151.31 Free float (%) 30.0 52-week price range 618.9 - 346.5 ADTO - 6M (US$ mn) 1.3
*Stock ratings are relative to the coverage universe in each
analyst's or each team's respective sector.
¹Target price is for 12 months.
Research Analysts
Arnab Mitra
91 22 6777 3806
Akshay Saxena
91 22 6777 3825

28 January 2013
India Consumer Survey 2013 37
Companies Mentioned (Price as of 23-Jan-2013)
Bajaj Auto Limited (BAJA.BO, Rs2036.25, OUTPERFORM, TP Rs2537.0) Emami Ltd (EMAM.BO, Rs580.25, OUTPERFORM, TP Rs690.0) HDFC Bank (HDBK.BO, Rs656.4, OUTPERFORM, TP Rs770.0) ITC Ltd (ITC.BO, Rs292.6, OUTPERFORM, TP Rs329.0) Maruti Suzuki India Ltd (MRTI.BO, Rs1574.2) Titan Industries (TITN.BO, Rs266.35, OUTPERFORM, TP Rs341.0)
Disclosure Appendix
Important Global Disclosures
Arnab Mitra and Akshay Saxena, each certify, with respect to the companies or securities that the individual analyzes, that (1) the views expressed in this report accurately reflect his or her personal views about all of the subject companies and securities and (2) no part of his or her compensation was, is or will be directly or indirectly related to the specific recommendations or views expressed in this report.
Price and Rating History for Bajaj Auto Limited (BAJA.BO)
BAJA.BO Closing Price Target Price
Date (Rs) (Rs) Rating
25-Jan-10 865.92 810.78 N
26-Jul-10 1263.30 1139.62
20-Oct-10 1485.15 1531.52
22-Aug-11 1482.10 1552.00 *
20-Oct-11 1615.95 1641.00
03-Jan-12 1496.70 1670.00
03-Apr-12 1647.70 1651.00
18-May-12 1532.95 1779.00
26-Jun-12 1559.20 1776.00
18-Jul-12 1522.35 1854.00 O
29-Aug-12 1627.25 2152.00
02-Oct-12 1812.25 2123.00
22-Oct-12 1782.50 2073.00
08-Jan-13 2198.60 2530.00
17-Jan-13 2051.90 2537.00
* Asterisk signifies initiation or assumption of coverage.
N EU T RA L
O U T PERFO RM
Price and Rating History for Emami Ltd (EMAM.BO)
EMAM.BO Closing Price Target Price
Date (Rs) (Rs) Rating
22-Aug-12 490.10 619.00 O *
29-Oct-12 571.60 690.00
* Asterisk signifies initiation or assumption of coverage.
O U T PERFO RM
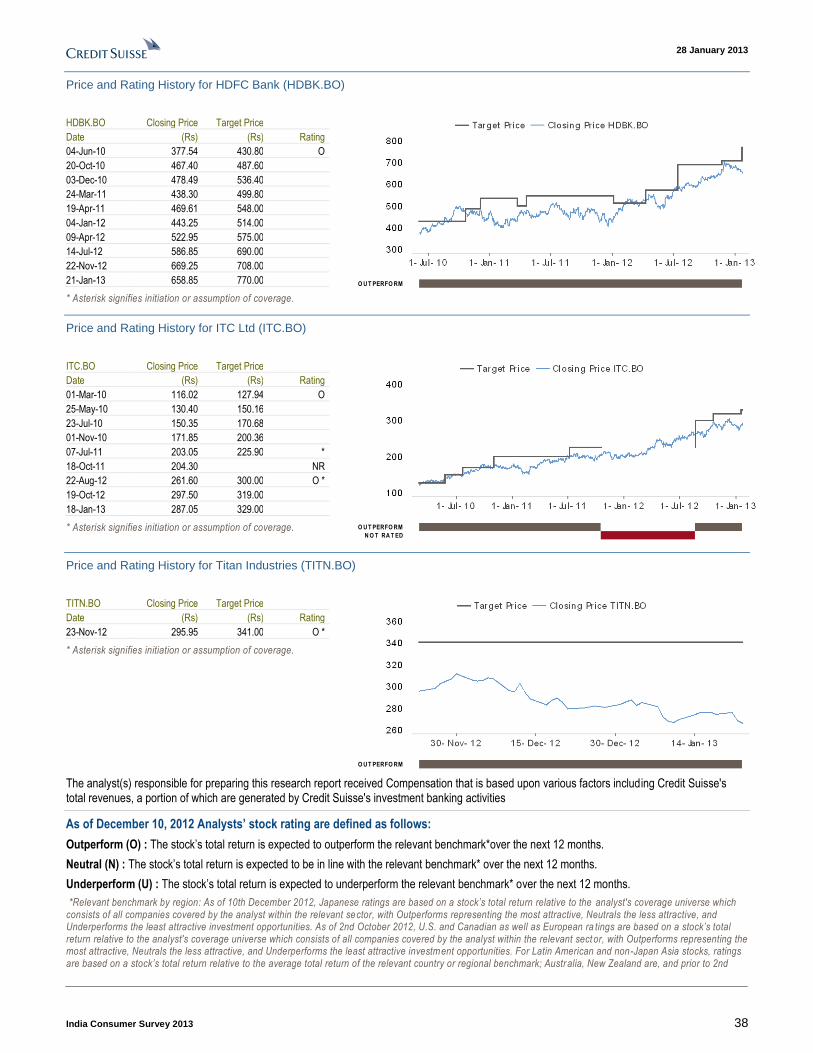
28 January 2013
India Consumer Survey 2013 38
Price and Rating History for HDFC Bank (HDBK.BO)
HDBK.BO Closing Price Target Price
Date (Rs) (Rs) Rating
04-Jun-10 377.54 430.80 O
20-Oct-10 467.40 487.60
03-Dec-10 478.49 536.40
24-Mar-11 438.30 499.80
19-Apr-11 469.61 548.00
04-Jan-12 443.25 514.00
09-Apr-12 522.95 575.00
14-Jul-12 586.85 690.00
22-Nov-12 669.25 708.00
21-Jan-13 658.85 770.00
* Asterisk signifies initiation or assumption of coverage.
O U T PERFO RM
Price and Rating History for ITC Ltd (ITC.BO)
ITC.BO Closing Price Target Price
Date (Rs) (Rs) Rating
01-Mar-10 116.02 127.94 O
25-May-10 130.40 150.16
23-Jul-10 150.35 170.68
01-Nov-10 171.85 200.36
07-Jul-11 203.05 225.90 *
18-Oct-11 204.30 NR
22-Aug-12 261.60 300.00 O *
19-Oct-12 297.50 319.00
18-Jan-13 287.05 329.00
* Asterisk signifies initiation or assumption of coverage.
O U T PERFO RM
N O T RA T ED
Price and Rating History for Titan Industries (TITN.BO)
TITN.BO Closing Price Target Price
Date (Rs) (Rs) Rating
23-Nov-12 295.95 341.00 O *
* Asterisk signifies initiation or assumption of coverage.
O U T PERFO RM
The analyst(s) responsible for preparing this research report received Compensation that is based upon various factors including Credit Suisse's total revenues, a portion of which are generated by Credit Suisse's investment banking activities
As of December 10, 2012 Analysts’ stock rating are defined as follows:
Outperform (O) : The stock’s total return is expected to outperform the relevant benchmark*over the next 12 months.
Neutral (N) : The stock’s total return is expected to be in line with the relevant benchmark* over the next 12 months.
Underperform (U) : The stock’s total return is expected to underperform the relevant benchmark* over the next 12 months.
*Relevant benchmark by region: As of 10th December 2012, Japanese ratings are based on a stock’s total return relative to the analyst's coverage universe which consists of all companies covered by the analyst within the relevant sector, with Outperforms representing the most attractive, Neutrals the less attractive, and Underperforms the least attractive investment opportunities. As of 2nd October 2012, U.S. and Canadian as well as European ra tings are based on a stock’s total return relative to the analyst's coverage universe which consists of all companies covered by the analyst within the relevant sector, with Outperforms representing the most attractive, Neutrals the less attractive, and Underperforms the least attractive investment opportunities. For Latin American and non-Japan Asia stocks, ratings are based on a stock’s total return relative to the average total return of the relevant country or regional benchmark; Australia, New Zealand are, and prior to 2nd

28 January 2013
India Consumer Survey 2013 39
October 2012 U.S. and Canadian ratings were based on (1) a stock’s absolute total return potential to its current share price and (2) the relat ive attractiveness of a stock’s total return potential within an analyst’s coverage universe. For Australian and New Zealand stocks , 12-month rolling yield is incorporated in the absolute total return calculation and a 15% and a 7.5% threshold replace the 10-15% level in the Outperform and Underperform stock rating definitions, respectively. The 15% and 7.5% thresholds replace the +10-15% and -10-15% levels in the Neutral stock rating definition, respectively. Prior to 10th December 2012, Japanese ratings were based on a stock’s total return relative to the average total return of the relevant country or regional benchmark.
Restricted (R) : In certain circumstances, Credit Suisse policy and/or applicable law and regulations preclude certain types of communications, including an investment recommendation, during the course of Credit Suisse's engagement in an investment banking transaction and in certain other circumstances.
Volatility Indicator [V] : A stock is defined as volatile if the stock price has moved up or down by 20% or more in a month in at least 8 of the past 24 months or the analyst expects significant volatility going forward.
Analysts’ sector weightings are distinct from analysts’ stock ratings and are based on the analyst’s expectations for the fundamentals and/or valuation of the sector* relative to the group’s historic fundamentals and/or valuation:
Overweight : The analyst’s expectation for the sector’s fundamentals and/or valuation is favorable over the next 12 months.
Market Weight : The analyst’s expectation for the sector’s fundamentals and/or valuation is neutral over the next 12 months.
Underweight : The analyst’s expectation for the sector’s fundamentals and/or valuation is cautious over the next 12 months.
*An analyst’s coverage sector consists of all companies covered by the analyst within the relevant sector. An analyst may cover multiple sectors.
Credit Suisse's distribution of stock ratings (and banking clients) is:
Global Ratings Distribution
Rating Versus universe (%) Of which banking clients (%)
Outperform/Buy* 43% (53% banking clients)
Neutral/Hold* 38% (47% banking clients)
Underperform/Sell* 16% (42% banking clients)
Restricted 3%
*For purposes of the NYSE and NASD ratings distribution disclosure requirements, our stock ratings of Outperform, Neutral, an d Underperform most closely correspond to Buy, Hold, and Sell, respectively; however, the meanings are not the same, as our stock ratings are determined on a relative basis. (Please refer to definitions above.) An investor's decision to buy or sell a security should be based on investment objectives, current holdin gs, and other individual factors.
Credit Suisse’s policy is to update research reports as it deems appropriate, based on developments with the subject company, the sector or the market that may have a material impact on the research views or opinions stated herein.
Credit Suisse's policy is only to publish investment research that is impartial, independent, clear, fair and not misleading. For more detail please refer to Credit Suisse's Policies for Managing Conflicts of Interest in connection with Investment Research: http://www.csfb.com/research and analytics/disclaimer/managing_conflicts_disclaimer.html
Credit Suisse does not provide any tax advice. Any statement herein regarding any US federal tax is not intended or written to be used, and cannot be used, by any taxpayer for the purposes of avoiding any penalties.
Price Target: (12 months) for Bajaj Auto Limited (BAJA.BO)
Method: Our Rs2,537 target price for Bajaj Auto is based on a P/E (price-to-earnings) of 17x Dec-14 earnings. Our valuation P/E is a 15% premium to the company's historic multiple, as we now have greater visibility on exports, and believe the company will witness robust growth in its FY14 exports.
Risk: Key risks that could impede achievement of our Rs2,537 target price for Bajaj Auto include:muted recovery in export markets and Honda gaining higher than expected share in domestic markets
Price Target: (12 months) for Emami Ltd (EMAM.BO)
Method: We value Emami at Rs 690 based on 24x Sep-14 earnings
Risk: Key risks to our Rs 690 target price for Emami is significant increase in competitive intensity in skin care segments where Emami operates or spike in raw material prices like menthol
Price Target: (12 months) for ITC Ltd (ITC.BO)
Method: We value ITC at Rs329 based on SOTP. We value cigarettes business at 27x Dec-14 earnings (in line with historical multiples) and FMCG business at 2x sales.
Risk: Key risks to our OUTPERFORM rating and Rs329 target price for ITC is abrupt change in taxation structure or government regulations which will hurt cigarettes sakes.
28 January 2013
India Consumer Survey 2013 40
Price Target: (12 months) for HDFC Bank (HDBK.BO)
Method: We are valuing HDFC Bank at 18x fwd earnings to arrive at our target price of Rs770.
Risk: Key upside risks to our target price of Rs770 for HDFC Bank are favourable Basel III guidelines, sustainable higher RoEs on use of hybrid capital, M&A activity in the longer-term. Downside risks are a reversal in asset environment, significant increase in competition, high stock valuations and significant slowdown in consumer lending.
Price Target: (12 months) for Titan Industries (TITN.BO)
Method: We value Titan Industries at its historic average multiple of 30x Sep-14 earnings giving us a target price of Rs 341.
Risk: Key risks that may impede achievement of our Rs341 target price for Titan Industries include a sharp correction in gold prices, an increase in gold import duties and competitive intensity leading to price wars on making charges.
Please refer to the firm's disclosure website at www.credit-suisse.com/researchdisclosures for the definitions of abbreviations typically used in the target price method and risk sections.
See the Companies Mentioned section for full company names
The subject company (EMAM.BO, HDBK.BO) currently is, or was during the 12-month period preceding the date of distribution of this report, a client of Credit Suisse.
Credit Suisse provided non-investment banking services to the subject company (HDBK.BO) within the past 12 months
Credit Suisse expects to receive or intends to seek investment banking related compensation from the subject company (EMAM.BO, TITN.BO, MRTI.BO) within the next 3 months.
Credit Suisse has received compensation for products and services other than investment banking services from the subject company (HDBK.BO) within the past 12 months
As of the end of the preceding month, Credit Suisse beneficially own 1% or more of a class of common equity securities of (MRTI.BO).
Important Regional Disclosures
Singapore recipients should contact Credit Suisse AG, Singapore Branch for any matters arising from this research report.
The analyst(s) involved in the preparation of this report have not visited the material operations of the subject company (BAJA.BO, EMAM.BO, ITC.BO, HDBK.BO, TITN.BO, MRTI.BO) within the past 12 months
Restrictions on certain Canadian securities are indicated by the following abbreviations: NVS--Non-Voting shares; RVS--Restricted Voting Shares; SVS--Subordinate Voting Shares.
Individuals receiving this report from a Canadian investment dealer that is not affiliated with Credit Suisse should be advised that this report may not contain regulatory disclosures the non-affiliated Canadian investment dealer would be required to make if this were its own report.
For Credit Suisse Securities (Canada), Inc.'s policies and procedures regarding the dissemination of equity research, please visit http://www.csfb.com/legal_terms/canada_research_policy.shtml.
As of the date of this report, Credit Suisse acts as a market maker or liquidity provider in the equities securities that are the subject of this report.
Principal is not guaranteed in the case of equities because equity prices are variable.
Commission is the commission rate or the amount agreed with a customer when setting up an account or at any time after that.
To the extent this is a report authored in whole or in part by a non-U.S. analyst and is made available in the U.S., the following are important disclosures regarding any non-U.S. analyst contributors: The non-U.S. research analysts listed below (if any) are not registered/qualified as research analysts with FINRA. The non-U.S. research analysts listed below may not be associated persons of CSSU and therefore may not be subject to the NASD Rule 2711 and NYSE Rule 472 restrictions on communications with a subject company, public appearances and trading securities held by a research analyst account.
Credit Suisse Securities (India) Private Limited ........................................................................................................ Arnab Mitra ; Akshay Saxena
For Credit Suisse disclosure information on other companies mentioned in this report, please visit the website at www.credit-suisse.com/researchdisclosures or call +1 (877) 291-2683.
28 January 2013
India Consumer Survey 2013 IA0144.doc
References in this report to Credit Suisse include all of the subsidiaries and affiliates of Credit Suisse operating under its investment banking division. For more information on our structure, please use the following link: https://www.credit-suisse.com/who_we_are/en/.This report may contain material that is not directed to, or intended for distribution to or use by, any person or entity who is a citizen or resident of or located in any locality, state, country or other jurisdiction where such distribution, publication, availability or use would be contrary to law or regulation or which would subject Credit Suisse AG or its affiliates ("CS") to any registration or licensing requirement within such jurisdiction. All material presented in this report, unless specifically indicated otherwise, is under copyright to CS. None of the material, nor its content, nor any copy of it, may be altered in any way, transmitted to, copied or distributed to any other party, without the prior express written permission of CS. All trademarks, service marks and logos used in this report are trademarks or service marks or registered trademarks or service marks of CS or its affiliates. The information, tools and material presented in this report are provided to you for information purposes only and are not to be used or considered as an offer or the solicitation of an offer to sell or to buy or subscribe for securities or other financial instruments. CS may not have taken any steps to ensure that the securities referred to in this report are suitable for any particular investor. CS will not treat recipients of this report as its customers by virtue of their receiving this report. The investments and services contained or referred to in this report may not be suitable for you and it is recommended that you consult an independent investment advisor if you are in doubt about such investments or investment services. Nothing in this report constitutes investment, legal, accounting or tax advice, or a representation that any investment or strategy is suitable or appropriate to your individual circumstances, or otherwise constitutes a personal recommendation to you. CS does not advise on the tax consequences of investments and you are advised to contact an independent tax adviser. Please note in particular that the bases and levels of taxation may change. Information and opinions presented in this report have been obtained or derived from sources believed by CS to be reliable, but CS makes no representation as to their accuracy or completeness. CS accepts no liability for loss arising from the use of the material presented in this report, except that this exclusion of liability does not apply to the extent that such liability arises under specific statutes or regulations applicable to CS. This report is not to be relied upon in substitution for the exercise of independent judgment. CS may have issued, and may in the future issue, other communications that are inconsistent with, and reach different conclusions from, the information presented in this report. Those communications reflect the different assumptions, views and analytical methods of the analysts who prepared them and CS is under no obligation to ensure that such other communications are brought to the attention of any recipient of this report. CS may, to the extent permitted by law, participate or invest in financing transactions with the issuer(s) of the securities referred to in this report, perform services for or solicit business from such issuers, and/or have a position or holding, or other material interest, or effect transactions, in such securities or options thereon, or other investments related thereto. In addition, it may make markets in the securities mentioned in the material presented in this report. CS may have, within the last three years, served as manager or co-manager of a public offering of securities for, or currently may make a primary market in issues of, any or all of the entities mentioned in this report or may be providing, or have provided within the previous 12 months, significant advice or investment services in relation to the investment concerned or a related investment. Additional information is, subject to duties of confidentiality, available on request. Some investments referred to in this report will be offered solely by a single entity and in the case of some investments solely by CS, or an associate of CS or CS may be the only market maker in such investments. Past performance should not be taken as an indication or guarantee of future performance, and no representation or warranty, express or implied, is made regarding future performance. Information, opinions and estimates contained in this report reflect a judgment at its original date of publication by CS and are subject to change without notice. The price, value of and income from any of the securities or financial instruments mentioned in this report can fall as well as rise. The value of securities and financial instruments is subject to exchange rate fluctuation that may have a positive or adverse effect on the price or income of such securities or financial instruments. Investors in securities such as ADR's, the values of which are influenced by currency volatility, effectively assume this risk. Structured securities are complex instruments, typically involve a high degree of risk and are intended for sale only to sophisticated investors who are capable of understanding and assuming the risks involved. The market value of any structured security may be affected by changes in economic, financial and political factors (including, but not limited to, spot and forward interest and exchange rates), time to maturity, market conditions and volatility, and the credit quality of any issuer or reference issuer. Any investor interested in purchasing a structured product should conduct their own investigation and analysis of the product and consult with their own professional advisers as to the risks involved in making such a purchase. Some investments discussed in this report may have a high level of volatility. High volatility investments may experience sudden and large falls in their value causing losses when that investment is realised. Those losses may equal your original investment. Indeed, in the case of some investments the potential losses may exceed the amount of initial investment and, in such circumstances, you may be required to pay more money to support those losses. Income yields from investments may fluctuate and, in consequence, initial capital paid to make the investment may be used as part of that income yield. Some investments may not be readily realisable and it may be difficult to sell or realise those investments, similarly it may prove difficult for you to obtain reliable information about the value, or risks, to which such an investment is exposed. This report may provide the addresses of, or contain hyperlinks to, websites. Except to the extent to which the report refers to website material of CS, CS has not reviewed any such site and takes no responsibility for the content contained therein. Such address or hyperlink (including addresses or hyperlinks to CS's own website material) is provided solely for your convenience and information and the content of any such website does not in any way form part of this document. Accessing such website or following such link through this report or CS's website shall be at your own risk. This report is issued and distributed in Europe (except Switzerland) by Credit Suisse Securities (Europe) Limited, One Cabot Square, London E14 4QJ, England, which is regulated in the United Kingdom by The Financial Services Authority ("FSA"). This report is being distributed in Germany by Credit Suisse Securities (Europe) This report is being distributed in the United States and Canada by Credit Suisse Securities (USA) LLC; in Switzerland by Credit Suisse AG; in Brazil by Banco de Investimentos Credit Suisse (Brasil) S.A or its affiliates; in Mexico by Banco Credit Suisse (México), S.A. (transactions related to the securities mentioned in this report will only be effected in compliance with applicable regulation); in Japan by Credit Suisse Securities (Japan) Limited, Financial Instruments Firm, Director-General of Kanto Local Finance Bureau (Kinsho) No. 66, a member of Japan Securities Dealers Association, The Financial Futures Association of Japan, Japan Investment Advisers Association, Type II Financial Instruments Firms Association; elsewhere in Asia/ Pacific by whichever of the following is the appropriately authorised entity in the relevant jurisdiction: Credit Suisse (Hong Kong) Limited, Credit Suisse Equities (Australia) Limited, Credit Suisse Securities (Thailand) Limited, Credit Suisse Securities (Malaysia) Sdn Bhd, Credit Suisse AG, Singapore Branch, Credit Suisse Securities (India) Private Limited regulated by the Securities and Exchange Board of India (registration Nos. INB230970637; INF230970637; INB010970631; INF010970631), having registered address at 9th Floor, Ceejay House, Dr.A.B. Road, Worli, Mumbai - 18, India, T- +91-22 6777 3777, Credit Suisse Securities (Europe) Limited, Seoul Branch, Credit Suisse AG, Taipei Securities Branch, PT Credit Suisse Securities Indonesia, Credit Suisse Securities (Philippines ) Inc., and elsewhere in the world by the relevant authorised affiliate of the above. Research on Taiwanese securities produced by Credit Suisse AG, Taipei Securities Branch has been prepared by a registered Senior Business Person. Research provided to residents of Malaysia is authorised by the Head of Research for Credit Suisse Securities (Malaysia) Sdn Bhd, to whom they should direct any queries on +603 2723 2020. This research may not conform to Canadian disclosure requirements. In jurisdictions where CS is not already registered or licensed to trade in securities, transactions will only be effected in accordance with applicable securities legislation, which will vary from jurisdiction to jurisdiction and may require that the trade be made in accordance with applicable exemptions from registration or licensing requirements. Non-U.S. customers wishing to effect a transaction should contact a CS entity in their local jurisdiction unless governing law permits otherwise. U.S. customers wishing to effect a transaction should do so only by contacting a representative at Credit Suisse Securities (USA) LLC in the U.S. Please note that this research was originally prepared and issued by CS for distribution to their market professional and institutional investor customers. Recipients who are not market professional or institutional investor customers of CS should seek the advice of their independent financial advisor prior to taking any investment decision based on this report or for any necessary explanation of its contents. This research may relate to investments or services of a person outside of the UK or to other matters which are not regulated by the FSA or in respect of which the protections of the FSA for private customers and/or the UK compensation scheme may not be available, and further details as to where this may be the case are available upon request in respect of this report. CS may provide various services to US municipal entities or obligated persons ("municipalities"), including suggesting individual transactions or trades and entering into such transactions. Any services CS provides to municipalities are not viewed as "advice" within the meaning of Section 975 of the Dodd-Frank Wall Street Reform and Consumer Protection Act. CS is providing any such services and related information solely on an arm's length basis and not as an advisor or fiduciary to the municipality. In connection with the provision of the any such services, there is no agreement, direct or indirect, between any municipality (including the officials, management, employees or agents thereof) and CS for CS to provide advice to the municipality. Municipalities should consult with their financial, accounting and legal advisors regarding any such services provided by CS. In addition, CS is not acting for direct or indirect compensation to solicit the municipality on behalf of an unaffiliated broker, dealer, municipal securities dealer, municipal advisor, or investment adviser for the purpose of obtaining or retaining an engagement by the municipality for or in connection with Municipal Financial Products, the issuance of municipal securities, or of an investment adviser to provide investment advisory services to or on behalf of the municipality. If this report is being distributed by a financial institution other than Credit Suisse AG, or its affiliates, that financial institution is solely responsible for distribution. Clients of that institution should contact that institution to effect a transaction in the securities mentioned in this report or require further information. This report does not constitute investment advice by Credit Suisse to the clients of the distributing financial institution, and neither Credit Suisse AG, its affiliates, and their respective officers, directors and employees accept any liability whatsoever for any direct or consequential loss arising from their use of this report or its content. Principal is not guaranteed. Commission is the commission rate or the amount agreed with a customer when setting up an account or at any time after that.
Copyright © 2013 CREDIT SUISSE AG and/or its affiliates. All rights reserved.
Investment principal on bonds can be eroded depending on sale price or market price. In addition, there are bonds on which investment principal can be eroded due to changes in redemption amounts. Care is required when investing in such instruments.
When you purchase non-listed Japanese fixed income securities (Japanese government bonds, Japanese municipal bonds, Japanese government guaranteed bonds, Japanese corporate bonds) from CS as a seller, you will be requested to pay the purchase price only.