Embed Size (px)
Citation preview

Please refer to Disclosures and Disclaimers at the end of the Research Report.
India Daily Ideas
INSTITUTIONAL USE ONLY 29 July 2013
PhillipCapital (India) Pvt. Ltd.
Contents Super Sector Stock / Ideas
1 Consumer HUL, Nestle, ATFL, Colgate, Dish TV, ZEEL, Trader Comments
2 Cyclicals JK Cement, JK Lakshmi, Heidelberg Cement
3 Defensives Wipro, Tata Communications
4 Financials PNB, BOI, Corporation Bank
1D 1W 1M 3M 12M BEST 1D 1W 1M 3M 6M 12M PER WORST 1D 1W 1M 3M 6M 12M PERSENSEX -0.3 -2.0 1.8 1.9 17.3 BSE100NIFTY -0.4 -2.4 0.8 -0.3 15.4 Ambuja Cements 4.6 -13.8 -4.2 -3.7 -9.1 -0.9 16.4 Canara Bank Ltd. -8.6 -15.6 -25.3 -36.3 -43.4 -22.7 N/ABANKEX -1.4 -4.7 -9.9 -17.1 2.7 Tata Global Beverages 3.0 0.4 16.5 8.5 5.8 29.7 20.2 Union Bank of India -8.1 -14.7 -28.1 -45.5 -46.2 -18.3 2.8BSE AUTO -0.6 -0.3 -0.6 -2.3 20.0 Idea Cellular 2.9 9.1 16.1 30.4 44.6 105.2 33.3 Hindalco Industries -7.6 -8.8 -5.4 -4.5 -18.1 -19.6 7.0BSE METALS -3.5 -6.7 -10.0 -18.6 -31.5 ITC 2.7 -0.1 13.6 13.6 20.6 44.9 32.7 Sesa Goa -6.3 -10.0 -8.1 -15.4 -28.3 -28.1 4.8BSE OIL -0.3 -3.2 -0.4 1.4 12.1 Reliance Power 2.2 -2.1 20.9 6.1 -14.9 -11.0 22.3 PNB -5.1 -5.6 -8.4 -24.0 -30.6 -16.7 N/ABSE POWER -0.3 -3.6 -2.3 -9.8 -13.6 Sun Pharma 2.2 3.5 10.8 18.7 57.0 77.3 59.0 Sterlite Industries -4.6 -7.5 -8.3 -16.5 -32.4 -24.1 4.3BSE REALTY -1.6 -2.4 -5.9 -26.0 -9.4 Ashok Leyland 2.1 -4.9 -27.9 -35.6 -41.5 -31.9 31.9 Bank Of India -4.6 -13.2 -20.9 -44.0 -46.1 -37.0 N/ABSE IT -0.1 2.0 15.8 27.6 38.6 Hero Honda Motors 2.0 5.2 12.2 13.1 3.0 -7.1 N/A United Spirits -4.5 -5.7 19.1 24.4 42.9 258.7 52.3BSE CONSUMER DU 0.1 -0.6 3.0 -15.4 1.0 Wipro 1.7 -2.0 9.4 12.0 5.3 28.4 13.9 United Breweries Ltd -4.1 -15.0 -2.8 -3.8 -3.7 28.9 67.2BSE CAPITAL GOOD -0.9 -10.2 -8.1 -14.2 -10.0 M&M 1.5 1.7 -7.5 -1.0 -0.3 30.0 11.8 HDIL -4.1 -4.9 0.4 -31.6 -53.4 -50.3 2.7BSETECK -0.2 1.8 14.2 21.8 35.1 Indian Oil Corporation 1.5 -0.5 -4.8 -26.0 -28.0 -14.4 7.8 Coal India Ltd -4.1 -4.7 -6.8 -9.9 -18.8 -20.2 9.8BSE Healthcare 0.2 -1.7 3.8 6.6 31.7 Glenmark Pharma 1.4 -1.7 8.1 23.8 17.5 55.9 21.0 Bharat Forge -3.6 -6.7 -6.1 -9.7 -11.1 -28.7 16.1BSE FMCG 0.1 -2.2 12.7 16.3 46.2 ACC 1.4 -5.1 -1.0 -2.6 -7.3 -6.3 17.9 JSPL -3.4 -9.8 -12.5 -36.9 -56.0 -51.8 5.1BSE PSU -1.5 -4.2 -7.5 -16.9 -17.8 Cipla 1.3 0.1 6.0 1.8 4.5 27.1 21.3 Hindustan Unilever -3.4 -3.4 13.4 33.3 41.6 44.9 39.8BSE 100 -0.5 -2.6 0.9 -0.9 14.8 Bajaj Auto 1.2 3.1 5.7 6.9 -0.2 28.1 16.6 REC -3.4 -11.9 -15.5 -24.1 -29.0 -7.5 4.3BSE 500 -0.6 -2.7 0.2 -2.3 11.3 NTPC 0.9 -1.7 -1.7 -9.5 -10.1 -7.7 10.5 Tata Motors -3.3 -1.6 3.0 -2.1 -4.5 36.2 5797.0Europe & US HPCL 0.8 2.7 -8.4 -25.9 -30.2 -30.3 6.8 IDBI -3.1 -2.3 -3.8 -23.9 -36.3 -19.8 N/ADow Jones 0.0 0.1 4.4 5.0 19.0 Divi's Laboratories 0.7 -3.0 -4.6 -13.0 -11.6 -11.2 17.1 Zee Entertainment -3.0 5.0 6.7 12.3 13.4 57.4 28.8S&P 500 0.1 0.0 5.3 6.2 22.1 SAIL 0.7 -2.8 -13.8 -30.4 -50.9 -47.5 6.7 Gail (India) -2.9 -4.1 1.9 -9.1 -9.1 -7.5 9.0NASDAQ 0.2 0.7 6.2 9.3 22.1 UltraTech Cement 0.6 -3.5 -0.6 -2.9 0.4 14.6 17.0 Jaiprakash Associates -2.9 -15.8 -22.0 -45.8 -51.6 -40.2 8.8S&P Europe -0.2 -0.6 3.4 -1.3 9.6 Hindustan Zinc Ltd 0.5 -1.5 0.1 -14.0 -19.5 -12.1 N/A LIC Housing -2.8 -9.3 -25.7 -25.0 -33.7 -24.1 6.8Brazil Bovespa 0.7 4.3 4.1 -10.0 -12.6 HDFC 0.5 0.3 -7.7 -6.8 0.3 19.6 22.8 Maruti Suzuki India -2.8 -5.2 -10.6 -18.2 -13.7 23.8 14.1Asia Exide Industries Ltd 0.4 -3.1 7.5 -3.4 6.6 3.1 17.5 GCPL -2.7 -9.3 5.9 0.9 19.3 35.7 N/ANikkei 225 -3.0 -3.6 3.3 1.8 64.9 Bharti Airtel 0.2 2.2 15.8 6.1 -3.3 9.9 29.3 Shriram Transport -2.7 -2.8 -9.8 -9.0 -17.1 14.7 8.8Hang Seng 0.3 2.6 5.6 -2.7 14.0 HCL Technologies 0.2 1.3 16.5 28.9 30.6 75.0 16.3 JSW Steel -2.6 -3.2 -16.1 -21.1 -36.4 -14.3 7.5S&P Asia 200 0.1 0.8 5.0 -1.6 19.8 Bharat Petroleum Corp 0.2 1.1 -4.0 -15.5 -14.4 -1.3 11.9 Adani Ports and Speci -2.6 -2.0 -4.2 -1.3 -1.6 25.4 15.9Straits 0.0 0.1 2.7 -3.7 7.9 NMDC 0.1 -3.0 -1.5 -15.7 -34.2 -43.6 N/A Adani Ports and Speci -2.6 -2.0 -4.2 -1.3 -1.6 25.4 15.9TWSE -0.2 0.5 1.1 1.5 14.4 BHEL 0.1 -8.6 -8.9 -17.0 -29.0 -23.7 7.3 PFC -2.1 -8.7 -16.0 -38.5 -40.5 -29.5 3.2Kospi 0.1 1.6 2.5 -1.5 4.5 Dabur India Ltd. 0.1 1.8 9.8 16.4 31.8 44.6 32.1 Reliance Comm -2.1 -7.4 13.8 34.0 65.8 148.7 22.8Baltic Dry Index -0.9 -4.9 -3.8 24.2 12.9 Satyam Computer Ser 0.0 0.0 -5.6 7.2 -7.4 36.7 9.9 Ranbaxy Labs -2.1 -6.3 -1.9 -33.4 -33.2 -37.0 12.9VIX Index -1.9 1.4 -24.6 -7.2 -23.8 Asian Paints 0.0 -1.6 9.7 8.0 14.7 44.9 39.5 Nestle India -2.0 -4.8 11.9 15.4 18.3 22.5 N/AAluminium -1.3 -0.6 1.6 -6.8 -5.6 Infosys Technologies 0.0 2.4 16.9 30.8 4.2 35.7 16.9 Reliance Infra -2.0 -4.4 6.3 -3.0 -28.6 -21.7 5.9Brent -0.1 -0.3 5.9 4.3 0.3 Federal Bank Ltd -0.1 -9.2 -15.3 -22.7 -31.4 -13.5 N/A SBI -1.9 -2.7 -9.7 -22.3 -28.2 -9.1 6.0Coal N/A 0.5 -7.5 -10.6 -5.4 Reliance Industries -0.1 -3.6 3.3 12.3 0.8 23.5 12.5 Tata Steel -1.9 -9.2 -20.1 -27.6 -45.1 -45.2 8.7Copper -2.1 -0.9 2.1 -2.1 -8.3 ICICI Bank -0.3 -2.8 -12.8 -19.1 -22.4 0.4 11.0 AXIS Bank -1.8 -7.0 -16.3 -24.9 -25.0 11.0 8.1Crude Oil (WTI) -0.3 -2.4 8.3 10.6 13.4 Cairn India -0.3 -1.4 4.9 -1.1 -7.1 -4.0 5.4 Crompton Greaves -1.8 -2.1 -1.5 -7.0 -20.9 -24.9 13.4Iron Ore 0.0 0.8 16.1 -1.1 7.2 Siemens -0.3 -3.9 -2.9 0.3 -16.3 -17.7 36.7 DLF -1.7 2.3 -4.9 -28.8 -34.7 -11.6 30.6Lead -1.1 1.1 1.1 1.3 8.7 Grasim Industries -0.4 -4.4 -2.5 -9.7 -10.3 -0.3 8.8 Yes Bank -1.7 -13.5 -20.3 -27.2 -28.3 4.0 8.6Nickel -2.3 -2.2 1.8 -8.9 -12.9 ONGC -0.4 -3.9 -7.9 -7.6 -8.7 9.6 10.1 Suzlon Energy -1.7 -7.0 -17.1 -47.0 -64.1 -56.0 -2.3Steel N/A N/A N/A N/A N/A IDFC -0.6 -8.0 -9.9 -26.2 -32.4 -9.5 8.4 Bank of Baroda -1.7 0.5 -0.3 -18.0 -32.4 -11.8 N/ATin 0.5 0.4 -1.1 -6.2 9.5 Tata Power Co. -0.6 -3.7 3.4 -6.7 -16.4 -6.0 16.9 Unitech -1.6 -8.4 -15.1 -35.5 -48.8 -12.7 11.7Zinc -1.2 -0.5 0.9 -2.2 0.7 Reliance Capital -0.7 0.3 10.3 3.9 -20.8 16.9 13.8 United Phosphorus -1.6 -3.9 4.0 2.1 3.3 16.9 6.8USD : INR -0.1 -0.5 -2.8 8.6 6.4 Colgate Palmolive(Ind -0.8 -3.6 6.4 3.6 5.5 26.9 34.4 Adani Power Limited -1.6 0.8 -3.6 -19.6 -33.2 -4.4 54.1EUR : INR 0.5 0.6 -0.9 10.8 15.1 Kotak Mahindra Bank -0.8 -1.5 -5.7 -4.2 1.1 28.3 31.8 ABB -1.5 -7.5 -12.0 5.1 -18.6 -30.7 43.4GBP : INR 0.7 0.4 -2.4 8.2 4.9 IndusInd Bank Ltd -0.8 -6.0 -10.0 -12.3 -2.5 28.2 15.9 HDFC Bank -1.5 -5.3 -3.6 -7.1 -1.2 10.3 18.1CHF : INR 0.9 1.0 -1.4 10.4 12.3 NHPC -0.8 -1.4 -4.3 -17.4 -35.1 -1.1 8.8 Cummins India Ltd. -1.4 -7.8 -8.4 -19.0 -14.7 -2.6 15.2JPY : INR 0.6 1.3 1.4 9.0 -14.9 Dr Reddy's Laboratorie -0.9 -2.1 3.8 15.4 18.5 41.8 N/A Adani Enterprises -1.2 -4.1 -6.7 -11.7 -22.7 10.6 9.2Dollar index -0.2 -0.9 -2.0 -0.8 -1.4 Tata Chemicals -0.9 -4.3 -3.3 -15.1 -25.2 -10.9 7.8 Lupin -1.2 -5.0 9.6 24.6 43.1 50.8 24.6USD: AUD 0.2 0.3 0.4 -10.4 -11.7 GMR Infrastructure -1.0 -2.5 -11.6 -26.5 -16.8 -30.4 -29.7 TCS -1.2 1.8 16.7 29.3 32.0 44.6 N/AUSD: CNY 0.0 -0.2 0.0 -0.6 -3.9 PGCIL -1.0 -2.5 -2.3 -2.0 -3.3 -5.0 10.6 Larsen & Toubro -1.0 -13.2 -9.7 -17.1 -20.5 -3.9 14.6USD:EURO 0.1 0.8 1.7 1.4 8.4USD:YEN -0.5 -1.9 -1.9 0.0 25.0 Source: Bloomberg
Super‐sector description: Consumer: FMCG, Media, Retail, Automobiles, Auto Ancillaries, Aviation, Hotels & Leisure Cyclicals: Metals, Oil & Gas, Fertilisers, Capital Goods, Engineering, Cement, Infrastructure Defensives: Pharmaceuticals, Telecom, IT Services Financials: Financial, Real Estate & Economy

Please refer to Disclosures and Disclaimers at the end of the Research Report.
Consumer Daily Ideas Stocks Featured: HUL, Nestle, ATFL, Colgate, Dish TV, ZEEL, Trader Comments INSTITUTIONAL USE ONLY 29 July 2013
PhillipCapital (India) Pvt. Ltd.
Contents Stock/Sector Ticker Reco News/Analysis
1 HUL HUVR IN SELL HUL Q1FY14 Result Update – Revenue growth sluggish as volume growth is below than expectations. Maintain SELL
recommendation
2 Nestle India NEST IN SELL Nestle Q2CY13 Result Update: In line with expectations. Maintain SELL recommendation
3 AgroTech Foods ATFL IN UR AgroTech Foods Q1FY14 Result Review: Disappoints expectations
4 Colgate India CLGT IN SELL Colgate Q1FY14 Result Preview
5 Zee
Entertainment ZEEL IN Neutral Zee Entertainment Q1FY14 Results – Strong operating performance
6 Dish TV DITV IN BUY Dish TV Q1FY14 Result review – Bloated operating costs
7 Trader Comments
% CNG 1D 1W 1M 3M 12M BEST 1D 1W 1M 3M 6M 12M PER WORST 1D 1W 1M 3M 6M 12M PERSENSEX -0.3 -2.0 1.8 1.9 17.3 CONSUMER/ MEDIA/ RETAILNIFTY -0.4 -2.4 0.8 -0.3 15.4 Jet Airways 17.4 6.9 -12.0 -35.1 -33.0 22.6 25.5 Dish TV -8.2 -7.7 -14.2 -22.0 -27.7 -22.5 6543.8BSE FMCG 0.1 -2.2 12.7 16.3 46.2 Rel Broadcast 4.6 16.0 22.4 50.1 15.3 6.8 N/A Kewal Kiran -7.8 -4.6 -3.1 6.8 4.5 48.7 N/ABSE AUTO -0.6 -0.3 -0.6 -2.3 20.0 Info Edge 3.8 3.1 9.3 -7.5 -3.8 1.5 29.7 United Spirits -4.5 -5.7 19.1 24.4 42.9 258.7 52.3BSE 100 -0.5 -2.6 0.9 -0.9 14.8 Bata India 3.4 -2.3 8.9 28.0 15.1 2.8 26.6 Zydus Wellness -4.5 -9.1 2.1 47.8 30.1 51.8 22.6BSE 500 -0.6 -2.7 0.2 -2.3 11.3 Tata Global Bev. 3.0 0.4 16.5 8.5 5.8 29.7 20.2 United Breweries -4.1 -15.0 -2.8 -3.8 -3.7 28.9 67.2Europe & US ITC 2.7 -0.1 13.6 13.6 20.6 44.9 32.7 Provogue -3.9 -12.8 -12.6 -34.6 -52.3 -56.9 N/ADow Jones Ind 0.0 0.1 4.4 5.0 19.0 Simbhaoli Sugar 2.6 -5.5 13.6 -2.2 -23.9 -40.1 N/A VIP Ind. -3.8 -4.5 -6.7 -25.3 -41.3 -31.7 N/AS&P 500 0.1 0.0 5.3 6.2 22.1 HMVL 2.4 0.2 0.8 -11.3 -15.3 7.6 N/A Raymond -3.4 -10.1 -15.4 -25.6 -43.2 -37.8 10.0NASDAQ 0.2 0.7 6.2 9.3 22.1 HT Media 1.4 3.4 2.2 -4.8 -4.9 17.6 11.8 HUL -3.4 -3.4 13.4 33.3 41.6 44.9 39.8S&P Europe -0.2 -0.6 3.4 -1.3 9.6 Mah. Holidays 0.7 2.0 6.5 2.9 -13.7 -8.0 17.9 Pidilite Ind. -3.4 -4.8 4.3 11.2 29.2 67.7 28.1Brazil Bovespa 0.7 4.3 4.1 -10.0 -12.6 EIH 0.6 -2.9 -1.3 -15.1 -28.1 -33.6 31.9 Zee Ent. -3.0 5.0 6.7 12.3 13.4 57.4 28.8Asia TV Today 0.5 -7.2 -4.6 -8.2 -12.9 14.2 8.8 Berger Paints -2.8 -7.3 0.7 20.3 35.6 71.5 30.4Nikkei 225 -3.0 -3.6 3.3 1.8 64.9 Bajaj Corp 0.5 3.4 1.8 5.9 7.4 86.2 18.8 Future Retail -2.7 -8.0 -8.1 -44.2 -56.6 -30.6 12.4Hang Seng 0.3 2.6 5.6 -2.7 14.0 Page Ind. 0.3 0.1 9.6 26.6 32.5 54.4 N/A GCPL -2.7 -9.3 5.9 0.9 19.3 35.7 N/AS&P Asia 200 0.1 0.8 5.0 -1.6 19.8 Titan Ind. 0.3 0.0 16.3 -4.6 -3.3 15.2 27.6 DB Corp. -2.6 -0.5 9.8 12.5 8.0 33.0 17.2Straits 0.0 0.1 2.7 -3.7 7.9 Dabur 0.1 1.8 9.8 16.4 31.8 44.6 32.1 Network 18 Media & In -2.6 -6.3 -8.3 -11.3 -21.2 1.6 N/ATWSE -0.2 0.5 1.1 1.5 14.4 Asian Paints 0.0 -1.6 9.7 8.0 14.7 44.9 39.5 DCHL -2.3 -11.9 -9.2 -28.7 -40.6 -86.1 N/AKOSPI 0.1 1.6 2.5 -1.5 4.5 ENIL 0.0 -1.4 0.7 -5.0 1.9 10.7 13.8 Balrampur Chini -2.3 -9.4 0.1 -22.0 -10.3 -28.4 7.0Baltic Dry -0.9 -4.9 -3.8 24.2 12.9 Radico Khaitan -0.2 -1.4 -4.6 -25.2 -35.9 -14.0 N/A King Air -2.2 -11.2 7.7 -37.1 -66.1 -53.9 N/ACoffee 0.0 -2.0 0.4 -10.3 -36.3 Tilaknagar Ind -0.3 -6.7 8.4 -20.4 -32.9 4.4 9.7 Nestle India -2.0 -4.8 11.9 15.4 18.3 22.5 N/ACotton 0.3 1.4 1.3 2.9 13.5 GSKConsumer -0.3 -5.3 -2.7 31.0 32.1 88.5 40.9 Sun TV -2.0 -5.6 -0.4 -10.1 -19.1 44.7 18.0Crude Oil, WTI -0.3 -2.4 8.3 10.6 13.4 Emami -0.3 -1.9 3.6 18.3 28.3 52.5 31.0 Cox & Kings -2.0 -6.2 -12.2 -14.8 -20.0 -10.8 5.6Gold -0.4 -0.6 7.6 -10.0 -18.2 Shoppers Stop -0.3 -2.8 -8.3 -2.8 -15.3 6.1 117.4 Gillette India -1.9 -9.8 4.6 8.3 -6.0 -5.9 N/ANewsprint N/A 0.0 -0.3 -2.1 -4.8 Indian Hotels Co. -0.4 -2.0 -0.3 -17.9 -22.9 -14.8 43.0 Jubl Foodworks -1.8 -2.2 9.9 5.0 -5.4 0.9 43.3Palm Oil -0.7 0.5 -3.6 1.6 -20.7 Marico -0.4 -1.1 4.0 -2.6 -3.1 11.1 26.8 Navneet Pub. -1.7 -3.9 2.9 7.0 -5.1 8.4 11.0Soyabean Oil -1.4 -1.4 -6.5 -5.1 -16.1 Kansai Nerolac -0.6 0.0 -0.2 -1.5 9.0 30.5 27.0 P&G Hyg.&H -1.7 -2.2 5.6 13.6 17.6 29.0 N/ASugar 0.0 0.0 -6.0 -8.5 -26.6 DEN -0.7 -0.5 -5.2 -17.5 -23.9 50.4 30.6 Agro Tech Foods -1.4 -3.4 3.5 5.5 5.6 20.4 26.7Tea 0.0 0.0 2.0 28.2 66.7 Colgate India -0.8 -3.6 6.4 3.6 5.5 26.9 34.4 Jyothy Lab. -1.3 -2.2 -3.1 -0.1 15.3 45.0 31.4Wool 0.6 -0.4 -4.3 0.8 -5.8 Shree Renuka Sug -0.8 -8.3 13.7 -26.6 -35.9 -37.9 6.4 Akzo Nobel India -1.2 -2.5 0.1 14.2 16.7 26.9 N/ASteel N/A N/A N/A N/A N/A Triveni Eng. -0.8 -5.6 -6.6 -10.0 -22.3 -26.9 N/A Hotel Leela Venture -1.1 7.4 7.4 -12.7 -33.6 -39.6 -2.4Aluminium -1.3 -0.6 1.6 -6.8 -5.6 Jag Prakashan -0.8 -0.7 9.2 -4.0 -18.0 0.7 12.9 NDTV -1.1 0.3 1.8 21.4 37.6 85.4 N/ARubber -2.4 -12.6 -1.4 15.0 3.0 Hathway -0.9 -2.6 -0.8 9.4 7.2 48.1 59.0 Britannia -1.1 0.5 6.3 26.6 48.6 52.1 30.3USD : INR -0.1 -0.5 -2.8 8.6 6.4 Rel Mediawaorks -0.9 1.0 7.5 -9.0 -34.7 -11.8 N/A Spice Jet -1.0 -9.4 -6.9 -32.9 -46.5 -0.2 16.6EUR : INR -0.1 -0.5 -2.8 8.6 6.4 Eros Intnal. -0.9 -2.9 2.4 -25.0 -35.9 -20.8 6.3GBP : INR 0.5 0.6 -0.9 10.8 15.1 Bajaj Hind. -1.0 -8.7 -2.1 -29.4 -38.6 -51.7 N/ACHF : INR 0.7 0.4 -2.4 8.2 4.9 AUTOSJPY : INR 0.9 1.0 -1.4 10.4 12.3 Ceat 3.6 3.3 14.1 12.2 15.4 27.4 N/A Bharat Forge -3.6 -6.7 -6.1 -9.7 -11.1 -28.7 16.1MYR : INR 0.6 1.3 1.4 9.0 -14.9 Ashok Leyland 2.1 -4.9 -27.9 -35.6 -41.5 -31.9 31.9 Tata Motors -3.3 -1.6 3.0 -2.1 -4.5 36.2 5797.0
Hero Motocorp Ltd 2.0 5.2 12.2 13.1 3.0 -7.1 N/A Maruti Suzuki -2.8 -5.2 -10.6 -18.2 -13.7 23.8 14.1Banco Products 1.9 -2.6 1.8 -9.8 -41.0 -42.2 N/A TVS Motor -1.7 -2.9 -4.6 -19.7 -28.6 -17.2 9.1Escorts 1.9 -6.2 11.3 42.7 23.4 46.0 8.1 Amtek Auto -1.2 -2.5 -4.4 -3.7 -13.4 -33.1 N/AMahindra & Mahindra 1.5 1.7 -7.5 -1.0 -0.3 30.0 11.8 Motherson Sumi -1.1 -7.6 3.4 8.1 3.0 89.4 14.9Eicher Motors 1.4 -3.1 12.9 26.5 36.2 90.4 24.8 Apollo Tyres -1.0 -3.2 20.9 -28.2 -19.6 -14.0 5.1Bajaj Auto 1.2 3.1 5.7 6.9 -0.2 28.1 16.6 JK Tyre & Ind. -0.9 -2.2 -1.7 -10.9 -12.3 14.4 2.4Sona Koyo Steering 1.0 -2.1 3.7 12.0 -9.2 -9.7 N/A MRF -0.5 -0.4 6.8 1.0 5.7 42.8 7.8Greaves Cotton 0.7 -3.1 -3.4 -14.7 -21.3 -1.8 8.6 Amara Raja Batteries -0.1 2.8 -0.4 -3.8 -20.7 75.3 N/AExide Ind. 0.4 -3.1 7.5 -3.4 6.6 3.1 17.5

29 July 2013 / INDIA EQUITY RESEARCH / CONSUMER DAILY IDEAS
– 3 of 24 –
CONSUMER Naveen Kulkarni (+9122 6667 9947 / [email protected]) Ennette Fernandes (+9122 6667 9764 / [email protected])
HUL (HUVR IN: SELL, TP: Rs. 580, CMP: Rs. 664) Q1FY14 Result Update – Revenue growth sluggish as volume growth is below than expectations. Maintain SELL recommendation HUL reported Q1FY14 numbers were below our estimates on revenue and volume growth but the earnings growth was in‐line with our expectations on account of better than expected cost management. During the earnings conference call the management indicated that the sharp deceleration in volume growth is on account of slowdown in the economy and certain intrinsic problems in Fair and Lovely brand. While the intrinsic problems are likely to be resolved over the next 6 months, we believe, the sluggishness in economic growth coupled with 10 years high valuations will translate to de‐rating over the medium term. We maintain our Sell rating on the stock valuing the company at 30x FY15E earnings at Rs 580 which implies a downside of 13% from the current levels. The key takeaways of the results and conference call are as follows: Soaps and detergents segment growth driven by volume; EBIT growth continues to remain robust: The skin cleansing category registered double digit volume growth but continued to witness further price deflation. The soaps and detergents category grew by 8% YoY primarily driven by volume growth. In the detergents category Surf and Rin sustained double digit growth while the volume growth in wheel brand continued to gain traction. The segment EBIT growth was robust at 14% YoY as margins in the segment as segment margins improved by 70bps YoY and 90bps QoQ. Personal care revenue growth continues to disappoint and EBIT margin slide continues but H2FY14 could see improvement: The personal care segment reported a mere 2% revenue growth and EBIT margins declined by 90bps YoY and 90bps QoQ. The segment has been severely impacted by the slowdown in the skincare category. The company’s flagship brand Fair and Lovely has been impacted in media dark regions of India after the re‐launch of the product with a new packaging colour as lack of awareness in these regions has led to consumers believing the product to be spurious. The management has indicated that they have plans to resolve the issue by H2FY14. The other categories registered robust growth. Hair care grew in double digits driven by volumes and Oral care also registered double digit growth. The color cosmetics category registered double digit volume growth. EBIDTA margins improve notwithstanding sluggish revenue growth and increase in royalty charges: The EBIDTA margins improved by 70bps YoY driven by gross margin improvement of 180bps and sluggish growth in employee expenses (up 3% YoY). Other operating expenses grew by 11% YoY. PAT adjusted for exceptional grew by 4% YoY. Maintain estimates; Revise target price upwards, Maintain Sell: We have largely maintained our estimates for FY14E and FY15E. We revise our target price upwards as we roll forward our valuation multiple on FY15E earnings to Rs 580 valuing the company at 30x FY15E earnings. Quarterly results table (Rs mn) Q1FY14 Q4FY13 QoQ, % Q1FY13 YoY, %
Net sales 66,875 63,671 5.0 62,502 7.0Growth, % 7.0 12.5 13.7 Total income 68,090 64,658 5.3 63,788 6.7Operating expenses 57,234 54,940 4.2 54,123 5.7EBITDA 10,856 9,718 11.7 9,665 12.3Margin, % 16.2 15.3 15.5 Depreciation 664 614 8.2 576 15.3EBIT 10,192 9,104 12.0 9,088 12.1Margin, % 15.2 14.3 14.5 Interest paid 62 60 3.5 53 Other Non‐Operating Income 1,768 1,058 67.0 2,185 ‐19.1Pre‐tax profit 11,897 10,102 17.8 11,221 6.0Tax provided 3,047 2,293 32.9 2,675 13.9

29 July 2013 / INDIA EQUITY RESEARCH / CONSUMER DAILY IDEAS
– 4 of 24 –
Minority Interest 0 0 Net Profit 8,850 7,809 13.3 8,546 3.6Reported PAT 10,193 7,903 29.0 13,311 ‐23.4Growth, % 3.6 16.9 48.4Margin, % 13.2 12.3 13.7Extraordinary items: Gains/(Losses) 1,343 94 6,047 Reported Fully Dilluted EPS, Rs 4.1 3.6 13.3 4.0 3.6
Source: Company, PhillipCapital India Research Estimates
Nestle (NEST IN: SELL, TP: Rs. 4800, CMP: Rs. 5450) Q2CY13 Result Update: In line with expectations. Maintain SELL recommendation Nestle Q2CY13 results were largely in line with ours and consensus estimates. After several quarters of below than expected results, the company has met expectations on parameters of marginal improvement in volume growth and operating leverage benefits. However, we believe that in a slowing macroeconomic environment, Nestle’s ability to deliver traction in volume growth can be under pressure, thereby placing the company’s operating performance significantly below the sector for the remaining quarters of CY13. Increasing competitive intensity across categories including Baby Foods is a key risk for Nestle as it can hinder the volume growth recovery prospects in the medium term. Considering the uninspiring fundamentals and material risks, the rich valuations remain unjustified. We maintain our SELL recommendation on the stock. Estimated volume growth meets expectations, but does not signify marked improvement and remains significantly below the sector volume growth: Nestle reported revenue growth of 11.4% YoY largely in line with our expectations. Exports sales (c.8%) growth robust at 47% YoY on account of low base effect of revenue degrowth in Q2FY12. Domestic sales growth trends improved sequentially from 7.7% YoY in Q1CY13 to 9.2% YoY in Q2CY13. For Q2CY13 we estimate company volume growth at 4% YoY which is in line with our estimates and estimate domestic volume growth at 2 – 2.5% YoY. While the volume growth has initiated signs of recovery it is important to note that it does not signify a marked improvement and continues to remain significantly below the sector volume growth. We estimate Volume growth trends to improve hereon but challenging macroeconomic environment and high competitive intensity can place pressure on expected pace of recovery. Gross margin expands by 20 bps YoY, rising inflation in Milk, Wheat and Skimmed Milk powder is a key concern: Gross profit reported growth of 12% YoY with Gross margin expansion to 54.8%. The company continues to benefit from soft inflation in key inputs (c. 18% to RM) like Cocoa, Sugar and Coffee; however inflationary pressure is rising in inputs (c. 56%) in Skimmed Milk powder and Wheat. Gross margins are expected to improve in CY13E assuming normalized input cost inflation. EBIDTA growth at 14% YoY, EBITDA margins improve by 40 bps YoY aided by operating leverage benefits: EBITDA margin expansion to 22% was also contributed by operating leverage benefits. We estimate increasing utilization of new capacity addition to have improved cost economics for Nestle. In the medium term, increase in royalty is expected to largely negate the realisation of operating cost savings. Adjusted earnings growth at 11.5% YoY: Earnings growth was largely in line with expectations. Nestle reported PAT growth of 10% YoY, however adjusted PAT growth was better at 11.5% YoY. We estimate the company will deliver an earnings growth of just 9% in CY13 on account of sluggish revenue growth, rising depreciation costs, higher advertising costs and effective tax rate. Maintain estimates, revise target price, Maintain SELL recommendation: We have largely maintained our estimates. We value the company at 33x (earlier 30x) CY13E earnings at revised target price of Rs 4800 (earlier Rs. 4400). Considering the significant downside from the current levels, we maintain our Sell recommendation.

29 July 2013 / INDIA EQUITY RESEARCH / CONSUMER DAILY IDEAS
– 5 of 24 –
AgroTech Foods (ATFL IN: UR, CMP: Rs. 553) Q1FY14 Result Review AgroTech Foods Q1FY14 results disappointed ours as well as consensus estimations significantly by 10%. The miss was primarily on the revenue growth • Revenue growth at ~8% YoY: Revenue growth has slowed down considerably from the average revenue growth of 19% YoY in
H2FY13. H2FY13 growth rate had improved primarily on account of low base of negative growth. However, the base in Q1FY13 was also muted at 3.6% YoY. Hence the sluggish 8% YoY revenue growth on this base disappointed expectations.
• Expect Snack foods business to have maintained traction but slow growth in key brand Sundrop and degrowth in Crystal are estimated to be the key laggards: We expect Snack Foods to have maintained robust growth at ~30% YoY. The management has been confident of delivering strong growth in the Snack foods segment since the past few quarters. However, we expect the growth rates in the key brand Sundrop to have underperformed at 7 – 8% YoY post the high double digit growth since the past two quarters. Crystal growth had reported degrowth in Q4Fy13 which we estimate to have extended in Q1FY14 also.
• Gross margins expand by 145 bps YoY: Gross margins have expanded to 31.6% by 145 bps YoY, largely in line with our estimates. Key drivers are estimated to be Price growth in Sundrop brand, improved product mix, soft inflation in Sunflower oil. Gross Profit growth is at 13% YoY.
• EBITDA margins have expanded by 110 bps YoY to 5.9%: Reported EBITDA growth is robust at 32% YoY enabled by the gross profit growth. While Ad to sales ratio is down by 100 bps YoY to 5.5% in Q1FY14 the Other operating expenses have increased by 120 bps YoY. Other operating expenses are estimated to be higher on account of costs associated with the newly commissioned Gujarat plant. But we also expect the AdPro mix in Q1FY14 to factor in higher promotional spends than media expenses.
• Lower PAT growth at 16% YoY: Pat growth was lower than EBITDA on account of higher depreciation costs and lower Other Income. Reported Pat was Rs. 63.5 mn against our expectation of Rs. 69 mn.
Key factors to watch in the concall: Brandwise growth, update on Sundrop Peanut butter, competitive landscape, input inflation Colgate (CLGT IN: SELL, TP: Rs. 1250, CMP: Rs. 1444) Q1FY14 Result Preview • Volume growth expected at 9% YoY: We expect the volume growth rate to be lower on a sequential basis from 12% YoY in
Q4FY13 to 9% YoY in Q1FY14. We estimate price growth at 5% YoY in Q1FY14 • Revenue growth expected at 14.5% YoY: We estimate revenues at Rs. 8.4 bn, with revenue growth of 14.5% YoY • Gross margins expected to expand by 100 bps YoY: Higher realizations, soft input inflation is expected to drive gross margin
expansion by 100 bps YoY to 60.3% • Ad to sales ratio expected to expand by 80 bps YoY: We expect Advertising expense growth of ~23% YoY, with 100 bps YoY
increase in Ad to sales ratio to 12.2%. High competitive intensity is expected to place pressure on advertising spends. EBITDA growth is expected at 13% YoY.
• PAT growth is estimated at 14% YoY: We estimate PAT at Rs. 1.33 bn with PAT growth of 14% YoY Key factors to watch: Volume growth, Ad to sales ratio and earnings growth Colgate India Q1FY14 Estimates (Rs mn.) Jun‐13 Mar‐13 QoQ (%) Jun‐12 YoY (%) Volume Growth YoY % 9.0 12.0 11.0 Price Growth YoY % 5.0 6.3 9.0 Revenues 8,424 8,116 3.8% 7,361 14.5% Gross Profit 5082 4895 3.8% 4364 16.5% Gross margin (%) 60.3% 60.3% 59.3% EBITDA 1836 1688 8.8% 1625 13.0% EBITDA margin (%) 21.8% 20.8% 22.1% PAT 1,338 1,233 8.5% 1,174 14.0% EPS (Rs) 9.84 9.07 8.5% 8.63 14.0%

29 July 2013 / INDIA EQUITY RESEARCH / CONSUMER DAILY IDEAS
– 6 of 24 –
MEDIA Naveen Kulkarni (+9122 6667 9947 / [email protected]) Vivekanand Subbaraman (+9122 6667 9766 / [email protected])
Zee Entertainment (ZEEL IN: Neutral, TP: Rs. 270, CMP: Rs. 252) Q1FY14 Results – Strong operating performance Zee Entertainment’s reported Q1FY14 results were ahead of expectations on account of EBITDA margin beat. The company’s revenue growth was a mixed bag as advertising revenue growth exceeded estimates, while subscription revenue growth disappointed. EBITDA margins were much ahead of ours and consensus estimates on account of lower than expected programming costs. We believe that the company will see an improvement in subscription revenue trajectory leading to a continuation of strong revenue growth. We maintain our neutral rating on the back of the recent run up in the stock price. Below we outline key highlights of the results and management commentary in the earnings call: Advertising revenue surprises positively, but subscription growth subdued – ZEEL’s total revenue stood at Rs 9.7bn, up 16% YoY and 1% QoQ; marginally below estimates. The company’s advertising revenue growth surprised positively, growing 19% YoY and 11% QoQ to Rs 5.3bn. Advertising revenue growth was sharp on account of price increases that ZEEL has taken commensurate to its ratings improvements. The management also mentioned that the TV broadcasting industry will transition to the TRAI advertising guidelines restricting advertising to 12 minutes per clock hour by October 2013 and further price increases would be taken to compensate for the decline in inventory. Subscription revenue growth was below estimates, growing 17% YoY while declining 7% QoQ. Domestic subscription revenue grew 27% YoY while declining 6% QoQ while international subscription revenue was down 6% YoY despite currency headwinds. Notwithstanding rating improvements in the regional channels, we believe that the company’s ad revenue growth will moderate in FY14 and build 13.5% YoY ad revenue growth as we note that the ratings in the flagship channel have dipped below those seen last year. EBITDA surprises positively on account of sharply lower programming costs – ZEEL’s EBITDA stood at Rs 2.9bn, up 25% YoY and 20% QoQ, while its EBITDA margins improved by 230bps YoY and 420bps QoQ to 30.0%. The positive surprise on EBITDA is due to subdued programming costs, which were up just 9% YoY, while declining 12% QoQ. The company maintains that its non‐sports operating costs will increase by 15‐16% as it will make new investments in Q2 and Q3FY14. The company had earlier guided for FY14 sports business losses getting contained at Rs 870mn (sports loss in FY13); however, now due to the INR depreciation against the USD, the company mentioned this number could get exceeded. We expect the company’s FY14 EBITDA margins to improve 150bps YoY in FY14 due to continued operating leverage benefits. PAT surpasses estimates owing to EBITDA beat – ZEEL’s PAT stood at Rs 2.2bn, up 44% YoY and 25% QoQ. Despite tax rate at 36.5% during the quarter, the company’s PAT exceeded estimates on account of EBITDA beat. We estimate that company’s earnings to grow at a 22% CAGR from FY13‐15 on the back of continued subscription growth led by implementation of digitisation. Valuations capture robust growth prospects; maintain Neutral – We marginally upgrade our estimates on account of the better than expected EBITDA performance of the company. We now value the company at 24x FY15 earnings (rolling over from FY14) valuing the company at Rs 270. Considering the limited upside from CMP, we maintain our neutral rating on the company. Dish TV (DITV IN: BUY, TP: Rs. 52, CMP: Rs. 64) Q1FY14 Result review – Bloated operating costs Dish TV’s (Dish) reported Q1FY14 results were significantly lower than estimates on account of bloating of operating cost structure. While the company’s operating performance was back on track, as indicated by its ARPU improvement, subscription revenue growth and continued muted churn; we note that the company’s cost structure has increased on account of renegotiation of content deals and increased market participation. While we remain optimistic on the DTH industry’s improving structure, we note that operating cost inflation isn’t likely to show any respite. Thus, our EBITDA and PAT estimates see a sharp cut despite no material change in revenue estimates. Owing to the sharp correction witnessed in the stock, our reduced target price still implies a significant upside; hence we maintain our BUY rating. Below are key highlights of the result and the conference call.

29 July 2013 / INDIA EQUITY RESEARCH / CONSUMER DAILY IDEAS
– 7 of 24 –
• Revenue growth and operating metrics in line with estimates – Dish’s revenue stood at Rs 5.8bn, growing 11% YoY and 4% QoQ, in line with estimates. The company added 0.2mn net subscribers, implying a gross subscriber addition of 0.4mn on account of reduced monthly churn, which stood at 0.6%. Dish and the rest of the DTH industry participants had increased STB prices progressively to Rs 2200 during the quarter and had also done away with the free one month viewing period. This increase in entry barrier is resulting in lower gross adds; but importantly, is resulting in persistently lower churn; a key positive. Subscription revenue stood at Rs 5.3bn, up 16% YoY and 6% QoQ, driven by ARPU improvement of 3% QoQ (adjusted) and 6% YoY to Rs 165. Dish mentioned that the pack price increase taken on 4th April 2013, with the base pack price at Rs 220; has percolated to 60% of the subscriber base. The remaining benefits of the package price increase will be witnessed in Q2FY14.
• EBITDA significantly below estimates due to high operating costs – Dish TV’s Q1FY14 EBITDA stood at Rs 1.2bn, declining 22% YoY, but growing 1.4% QoQ; significantly lower than estimates on account of high operating costs. The company mentioned that programming costs have been impacted on account of certain costs being denominated in US$, viz. transponder cost, middle‐ware costs, encryption costs etc. The company also mentioned that this year, the content deal with IndiaCast is up for negotiation. In view of the bloated operating cost structure, we sharply downgrade out EBITDA estimate 18% in FY14 and 20% in FY15.
• PAT loss came in at Rs 304mn – On account of the lower than expected EBITDA, Dish TV’s PAT loss for the quarter stood at Rs 304mn, on account of lower than expected depreciation expenses. We note that the company’s depreciation costs have declined QoQ and YoY, reflecting the improving quality of subscribers and reduced writeoffs.
• Cutting estimates, but maintain BUY rating – While raising our ARPU estimates, we incorporate the bloated operating cost structure resulting in resulting in revenue, EBITDA and EPS downgrades. We continue to value the company on a DCF basis maintaining our September 2014 target price of Rs 64. Our target price implies an EV/EBITDA of 12.6x in FY14 and 10.8x in FY15. Maintain our BUY rating.
Trader Comments • Bata today opened its largest store in India at Viviana Mall, Thane‐W. Spread across 20,000 sq.ft, the store offers an extensive
range of more than 2,500 styles of footwear and accessories like handbags, sunglasses, clutches, scarves. Bata has continued to focus on improvements in shoe designs through constant research and development. The footwear collection has been vastly improved during the years with the Company launching trendy and fashionable designs which has been well received by the modern day young customer.
• West Bengal govt imposes additional 5% VATon tobacco products with retrospective effect from 25th April 2013. The resolution was cleared by the state assembly test. Post this, effectively west Bengal state vat rate on cigarettes has been hiked from 20% to 35% for FY14. There has been lack of clarity on what was the final vat rate for Bengal so that stands resolved. This policy action alone increases ITC’s vat rate by 150 bps yoy, we had already included the same in our estimates.
• Global retailers are getting into smaller details such as demanding that they be allowed to procure items like bread and locks from big domestic companies under the mandatory 30% sourcing norms in multi‐brand segment, but DIPP is having none of that.
• Emami Ltd is scouting for acquisitions to strengthen its market position, for which it is ready to use cash reserves of Rs 300 crore and leverage its borrowing potential. Emami has been focussing on international expansion, specially in the neighbouring markets such as Sri Lanka, Bangladesh, Bhutan, Maldives, Pakistan and Afghanistan, along with Gulf countries, Russia and CIS regions with key brands Boroplus, Navratna, Fair and Handsome and Zandu.
• Maruti Suzuki India Ltd (MSIL) is set to enter the light commercial vehicles (LCVs) segment in the next two years. The new product will compete with LCVs already in the market such as Mahindra & Mahindra’s Genio and Maxximo Plus, Tata Motors’ Ace and Ashok Leyland’s Dost in the sub‐one tonne to 1.25 tonne category. Prices of these vehicles range between Rs 3.5 lakh and Rs 6.50 lakh (ex‐showroom).

29 July 2013 / INDIA EQUITY RESEARCH / CONSUMER DAILY IDEAS
– 8 of 24 –
Upcoming results & Events calendar Sector Date Company Name Results/ Events
29th July 2013 Colgate Palmolive India Ltd. Q1FY14 Earnings Release
30th July 2013 Havells India Ltd. Q1FY14 Earnings Release
31st July 2013 United Spirits Ltd. Q1FY14 Earnings Release
1st August 2013 GlaxoSmithKline Consumer Healthcare Ltd. Q2CY13 Earnings Release
2nd August 2013 Bajaj Corp. Ltd. Annual General Meeting
2nd August 2013 Berger Paints Ltd. Q1FY14 Earnings Release
3rd August 2013 Godrej Consumer Products Ltd. Q1FY14 Earnings Release
7th August 2013 Emami Ltd. Q1FY14 Earnings Release
7th August 2013 Zydus Wellness Ltd. Annual General Meeting
8th August 2013 Jubilant Foodworks Ltd. Annual General Meeting
12th August 2013 Marico Annual General Meeting
Consumer
12th August 2013 Britannia Industries Ltd. Q1FY14 Earnings Release
30th July 2013 Shoppers Stop Ltd. Q1FY14 Earnings Release
30th July 2013 Trent Ltd. Q1FY14 Earnings Release
30th July 2013 Pantaloon Fashion & Retail Limited Q1FY14 Earnings Release
Retail
1st August 2013 Titan Industries Ltd. Q1FY14 Earnings Releas
29th July 2013 TV18 Broadcast Ltd. Q1FY14 Earnings Release
2nd August 2013 Sun TV Network Ltd. Q1FY14 Earnings Release Media
2nd August 2013 TV Today Ltd. Q1FY14 Earnings Release
Auto & Auto Anc 30th July 2013 Swaraj Engines Q1FY14 Earnings Release
7th Aug 2013 Apollo Tyres Q1FY14 Earnings Release
13th Aug 2013 M&M Q1FY14 Earnings Release

Please refer to Disclosures and Disclaimers at the end of the Research Report.
Cyclicals Daily Ideas Stocks Featured: JK Cement, JK Lakshmi, Heidelberg Cement
INSTITUTIONAL USE ONLY 29 July 2013
PhillipCapital (India) Pvt. Ltd.
Contents Stock/Sector Ticker Reco News/Analysis
1 JK Cement JKCE IN UR 1Q FY14 Results
2 JK Lakshmi JKLC IN UR 1QFY14 Results
3 HeidelbergCement
India HEIM IN UR 2QCY13 Results
4 Trader Comments
% CNG Close 1D 1W 1M 3M 12M BEST 1D 1W 1M 3M 6M 12M PER WORST 1D 1W 1M 3M 12M PERSENSEX 19748 -0.3 -2.0 1.8 1.9 17.3 Capital GoodsNIFTY 5886 -0.4 -2.4 0.8 -0.3 15.4 Blue Star 1.5 0.4 -3.9 -2.7 -5.5 -15.1 15.9 Emco -4.8 -12.8 -10.6 -29.4 -50.3 N/ABSE Cap Goods 8374 -0.9 -10.2 -8.1 -14.2 -10.0 BHEL 0.1 -8.6 -8.9 -17.0 -29.0 -23.7 7.3 Jyoti Structures -4.4 -5.2 -9.8 -38.1 -50.1 2.2BSE METAL 6979 -3.5 -6.7 -10.0 -18.6 -31.5 Voltamp Trans. -0.1 -1.5 -1.8 5.1 1.6 -18.2 N/A TRIL -4.4 10.3 2.9 -29.1 -39.5 5.7BSE OIL 8865 -0.3 -3.2 -0.4 1.4 12.1 Siemens India -0.3 -3.9 -2.9 0.3 -16.3 -17.7 36.7 TRF -3.0 -5.3 -7.6 -37.8 -61.1 -20.4BSE 100 5855 -0.5 -2.6 0.9 -0.9 14.8 KEC Intl. -0.5 -11.2 -5.1 -42.7 -50.8 -46.3 4.9 Alstom T&D India Ltd -2.6 -6.8 -3.2 4.6 -9.2 12.3BSE 500 7181 -0.6 -2.7 0.2 -2.3 11.3 Tecpro Systems -0.5 -16.9 -18.6 -58.3 -75.2 -75.5 1.9 Bharat Bijlee -2.3 -3.4 -9.8 -25.5 -44.9 N/AEurope & US L&T -1.0 -13.2 -9.7 -17.1 -20.5 -3.9 14.6 Thermax -2.1 -2.2 -1.2 2.8 22.6 20.0Dow Jones Ind 15559 0.0 0.1 4.4 5.0 19.0 Voltas -1.3 3.4 3.0 -2.1 -13.8 -16.8 11.2 Crompton Greaves -1.8 -2.1 -1.5 -7.0 -24.9 13.4S&P 500 1692 0.1 0.0 5.3 6.2 22.1 McNally Bharat Eng -1.3 -7.5 -0.9 -40.9 -53.0 -50.8 2.6 Elecon Eng -1.7 -5.6 -9.9 -25.4 -50.3 4.4NASDAQ 3613 0.2 0.7 6.2 9.3 22.1 ABB -1.5 -7.5 -12.0 5.1 -18.6 -30.7 43.4 BGR Energy -1.5 -11.4 -19.0 -43.8 -60.8 4.6S&P Europe 2694 -0.2 -0.6 3.4 -1.3 9.6 CementBrazil Bovespa 49422 0.7 4.3 4.1 -10.0 -12.6 Ambuja Cements 4.6 -13.8 -4.2 -3.7 -9.1 -0.9 16.4 Birla Corp -7.0 -8.5 -0.1 -15.8 0.2 N/AAsia ACC 1.4 -5.1 -1.0 -2.6 -7.3 -6.3 17.9 Century Textile -5.7 -2.3 -10.2 -18.6 -16.5 37.2Nikkei 225 14130 -3.0 -3.6 3.3 1.8 64.9 India Cements 1.3 -6.9 -6.1 -35.6 -38.3 -32.3 6.0 Mangalam Cem -4.9 -10.3 -13.7 -24.9 -22.2 N/AHang Seng 21969 0.3 2.6 5.6 -2.7 14.0 Ultratech Cem 0.6 -3.5 -0.6 -2.9 0.4 14.6 17.0 Kesoram Ind. -4.8 -11.4 -11.9 -31.3 -46.2 N/AS&P Asia 200 5042 0.1 0.8 5.0 -1.6 19.8 JK Lakshmi Cem 0.2 -7.0 -26.6 -27.6 -49.1 -17.5 N/A Madras Cement -4.1 -12.4 -23.3 -27.3 10.6 N/AStraits 3236 0.0 0.1 2.7 -3.7 7.9 Dalmia Bharat -0.4 0.1 0.1 -6.0 -21.5 N/A N/A Orient Paper & Ind. -4.0 -9.5 -13.8 -10.5 -90.1 0.7TWSE 8149 -0.2 0.5 1.1 1.5 14.4 Shree Cement -0.5 -0.9 -5.8 -0.3 0.9 44.4 N/A Prism Cement -2.4 -7.4 -12.6 -27.5 -39.3 N/AKOSPI 1911 0.1 1.6 2.5 -1.5 4.5 JK Cement -1.2 -6.7 -10.7 -21.8 -36.8 -0.1 6.5Baltic Dry Index 1082 -0.9 -4.9 -3.8 24.2 12.9 OCL India -1.6 -2.5 -1.8 -5.5 -5.5 49.2 N/ABaltic dirty tanker 653 0.5 0.5 13.2 N/A 1.6 FertilizersVIX Index 13 -1.9 1.4 -24.6 -7.2 -23.8 Rallis India 2.5 5.2 13.0 23.9 21.7 30.9 20.3 Zuari Ind. -7.0 -6.6 -6.6 -33.5 -63.8 N/AAluminium 1761 -1.3 -0.6 1.6 -6.8 -5.6 Coromandel Intl. 2.2 -4.6 -7.4 -14.7 -24.8 -27.6 9.3 Dhanuka Agritech -3.0 -3.6 8.3 18.7 46.9 N/ABrent 108 -0.1 -0.3 5.9 4.3 0.3 Nagarjuna Agri 1.0 7.5 16.6 10.2 -17.7 -14.6 N/A Rashtriya Chemicals -1.8 -6.1 -8.5 -23.8 -40.3 5.4Coal 77 N/A 0.5 -7.5 -10.6 -5.4 GSFC -0.3 -3.2 -12.3 -3.2 -17.7 -21.8 N/A National Fertilizers -1.1 -7.9 -12.9 -38.2 -59.3 N/ACopper 6848 -2.1 -0.9 2.1 -2.1 -8.3 Tata Chem -0.9 -4.3 -3.3 -15.1 -25.2 -10.9 7.8 Deepak Fertilizers -1.1 -8.3 -3.4 -16.9 -29.5 4.2Crude Oil 104 -0.3 -2.4 8.3 10.6 13.4 Chambal Fertilizers -1.0 -4.7 -2.4 -36.3 -45.9 -48.9 4.8Iron Ore 134 0.0 0.8 16.1 -1.1 7.2 MetalsLead 2043 -1.1 1.1 1.1 1.3 8.7 SAIL 0.7 -2.8 -13.8 -30.4 -50.9 -47.5 6.7 Sandur Manganese -9.6 -10.8 28.6 48.4 2.1 N/ANickel 13780 -2.3 -2.2 1.8 -8.9 -12.9 Hindustan Zinc 0.5 -1.5 0.1 -14.0 -19.5 -12.1 N/A Hindalco -7.6 -8.8 -5.4 -4.5 -19.6 7.0Tin 19435 0.5 0.4 -1.1 -6.2 9.5 Jai Balaji Ind. 0.4 1.8 10.6 12.4 -15.0 -22.6 N/A Sesa Goa -6.3 -10.0 -8.1 -15.4 -28.1 4.8Zinc 1820 -1.2 -0.5 0.9 -2.2 0.7 NMDC 0.1 -3.0 -1.5 -15.7 -34.2 -43.6 N/A Sterlite Ind. -4.6 -7.5 -8.3 -16.5 -24.1 4.3USD : INR 59.04 -0.1 -0.5 -2.8 8.6 6.4 Bhushan Steel 0.1 -0.6 -0.8 1.0 3.7 -0.5 7.7 Coal India -4.1 -4.7 -6.8 -9.9 -20.2 9.8EUR : INR 78.37 0.5 0.6 -0.9 10.8 15.1 MOIL -0.2 -2.1 -2.4 -13.4 -23.8 -25.5 N/A Jayaswal NECO -4.1 -3.4 -0.7 -22.4 -44.7 N/AGBP : INR 91.00 0.7 0.4 -2.4 8.2 4.9 PSL/India -0.2 -2.9 -1.9 -28.4 -56.2 -59.0 N/A Tata Sponge Iron -3.5 -4.8 -11.6 -15.3 -27.3 N/ACHF : INR 63.62 0.9 1.0 -1.4 10.4 12.3 Orissa Minerals -0.3 -6.0 4.2 -24.0 -49.5 -52.8 N/A JSPL -3.4 -9.8 -12.5 -36.9 -51.8 5.1JPY : INR 0.60 0.6 1.3 1.4 9.0 -14.9 Guj. NRE Coke -0.3 -2.5 3.4 -17.4 -27.6 -15.0 11.7 Ratnamani Metals -3.1 -5.1 -4.5 8.6 18.2 N/ADollar index 81.51 -0.2 -0.9 -2.0 -0.8 -1.4 NALCO -0.5 -1.8 1.0 -17.9 -37.6 -43.7 N/A Sarda Energy -2.7 -3.3 -3.9 -12.5 -21.2 2.3USD: CNY 6.13 0.0 -0.2 0.0 -0.6 -3.9 GMDC -0.8 -5.3 -23.4 -35.8 -49.3 -47.7 4.5 JSW Steel -2.6 -3.2 -16.1 -21.1 -14.3 7.5USD:EURO 1.33 0.1 0.8 1.7 1.4 8.4 Maha. Seamless -0.8 -0.1 -3.4 -11.1 -17.2 -39.9 N/A Jindal Saw -2.6 -8.0 -18.3 -41.4 -62.6 5.2USD:YEN 97.76 -0.5 -1.9 -1.9 0.0 25.0 Uttam Galva Steels -1.0 -6.4 -11.5 -25.5 -50.3 -15.9 N/A Monnet Ispat -1.9 -6.9 -10.9 -44.0 -65.2 N/A
Usha Martin -1.3 -2.6 -4.0 -9.6 -23.6 -14.7 8.4 Tata Steel -1.9 -9.2 -20.1 -27.6 -45.2 8.7Adhunik Metaliks -1.5 0.7 -6.1 -22.8 -41.7 -26.7 2.4 Hindustan Copper -1.8 -10.3 -24.6 -44.6 -76.6 N/AMan Ind. -1.6 -5.7 -6.2 -11.8 -26.8 -10.3 N/A Godawari Power -1.7 -4.9 -3.9 -20.0 -40.2 1.8Indian Metals & Ferro -1.6 -3.8 -6.3 -21.1 -38.5 -33.1 6.9Oil & GasIOC 1.5 -0.5 -4.8 -26.0 -28.0 -14.4 7.8 Petronet LNG -3.0 -4.1 -3.9 -13.4 -15.4 N/AHPCL 0.8 2.7 -8.4 -25.9 -30.2 -30.3 6.8 GSPL -1.4 -6.3 -8.0 -22.1 -22.5 6.2Indraprastha Gas 0.7 -1.8 7.1 -7.6 10.3 25.3 N/A ONGC -0.4 -3.9 -7.9 -7.6 9.6 10.1BPCL 0.2 1.1 -4.0 -15.5 -14.4 -1.3 11.9 Cairn India -0.3 -1.4 4.9 -1.1 -4.0 5.4RIL -0.1 -3.6 3.3 12.3 0.8 23.5 12.5 Oil India -0.2 -3.2 -6.5 -2.6 9.2 8.3
Source: Bloomberg

29 July 2013 / INDIA EQUITY RESEARCH / CYCLICALS DAILY IDEAS
– 10 of 24 –
CEMENT Vaibhav Agarwal (+9122 6667 9967 / [email protected])
JK Cement 1Q FY14 Results (JKCE IN, Rating & Price Target: UR) • JK Cement announced below estimates 1QFY14 results. • Grey cement volumes registered a steep decline of 15.5% YoY; 17.3% QoQ which has been the key for deteriorating company
performance. • Net Sales grew by ‐11% YoY; ‐14% QoQ; EBITDA by ‐42% YoY; ‐31%QoQ and PAT by ‐55% YoY; ‐45%QoQ. • EBITDA margin was reported at 13.9% (21.3% YoY; 13.9% QoQ). • We will be hosting a conference call with the Management of JK Cement for a detailed discussion on these results. This call is
scheduled tomorrow at 04:30 PM IST. Dial in 022‐30650140. JK Lakshmi 1QFY14 Results (JKLC IN, Rating & Price Target: UR) • JK Lakshmi Cement announced relatively better results than JK Cement; however the results have been below expectations. • Volumes are ‐7% YoY; ‐6% QoQ while blended realisations seem to be ‐8% YoY; ‐9% QoQ. • EBITDA has been reported at Rs702mn with an EBITDA/tonne of Rs616 and an EBITDA margin of 15.4% (22.8% YoY; 17.8% QoQ). • PAT was reported at Rs157mn. • We will be hosting a conference call with the Management of JK Lakshmi Cement for a detailed discussion on these results. This
call is scheduled tomorrow at 03:00 PM IST. Dial in 022‐30650140. HeidelbergCement India 2QCY13 Results (HEIM IN, Rating & Price Target: UR) • HeidelbergCement India Limited announced lower than expected 2QCY13 results. • Volumes are expected to be up ~16% YoY;‐5% QoQ. • Realisations are expected to remain firm at ~Rs4000/tonne (+1% YoY; +2.5% QoQ). • EBITDA was reported at Rs318mn with an EBITDA/tonne of Rs353 and an EBITDA margin of 8.9% (12.1% YoY; 9.8% QoQ). • We are yet to see the full impact of cost optimization initiatives at HeidelbergCement India with its expansion. Opex/tonne
increased by 4.9% YoY; 3.6% QoQ. • We await further details on the results from Management of HeidelbergCement India Limited.
TRADER COMMENTS • As per media reports, Tata Steel has also joins the race to acquire Stemcor assets in Odisha. • The government has modified the New Coal Distribution Policy in view of the presidential directive asking Coal India to sign FSAs
(for 78,000MW) for the domestic coal quantity of 65%, 67% and 75% for annual contracted quantity (ACQ) for the remaining four years of the 12th Plan.
• Mr S K Tripathi (CMD of MSTC) is likely to get the additional charge of NMDC as steel ministry has decided to relieve Mr C S Verma (CMD of SAIL) to focus more on SAIL.
• JPMorgan Chase & Co. (JPM) said it plans to get out of the business of owning and trading physical commodities ranging from metals to oil after a U.S. Senate panel questioned whether banks are abusing their ownership of raw materials to manipulate markets. However, the firm will remain fully committed to its banking activities in the commodity markets, including financial derivatives and the vaulting and trading of precious metals.
29 July 2013 / INDIA EQUITY RESEARCH / CYCLICALS DAILY IDEAS
– 11 of 24 –
Upcoming results & Events calendar Sector Date Company Name Results/ Events
Metals & Mining 29th July 2013 Sesa Goa Q1FY14 results
30th July 2013 Jindal Steel & Power Q1FY14 results
31st July 2013 JSW Steel Q1FY14 results
3rd August 2013 Coal India Q1FY14 results
8th August 2013 NMDC Q1FY14 results
13th August 2013 Tata Steel Q1FY14 results
13th August 2013 Hindalco Q1FY14 results
Oil&Gas and Agri Inputs 30th July 2013 Petronet LNG Q1FY14 results
31st July 2013 Chambal Fertiliser Q1FY14 results
3rd August 2013 PI Industries Q1FY14 results
5th August 2013 Tata Chemicals Q1FY14 results
12th August 2013 ONGC Q1FY14 results
Capital Goods 1st August 2013 Cummins India Q1FY14 results
2nd August 2013 Siemens India Q1FY14 results
2nd August 2013 KEC International Q1FY14 results
3rd August 2013 BHEL Q3FY13 results
6th August 2013 Crompton Greaves Q1FY14 results
9th August 2013 ABB India Q2CY13 results
Infrastructure 30th July 2013 Reliance Infrastructure Q1FY14 results
30th July 2013 Havells Q1FY14 results
31st July 2013 IRB Infrastructure Q1FY14 results
1st Aug 2013 Adani Ports Q1FY14 results
7th Aug 2013 NCC Q1FY14 results
8th Aug 2013 ITNL Q1FY14 results
13th Aug 2013 GMR Infrastructure Q1FY14 results
Please refer to Disclosures and Disclaimers at the end of the Research Report.
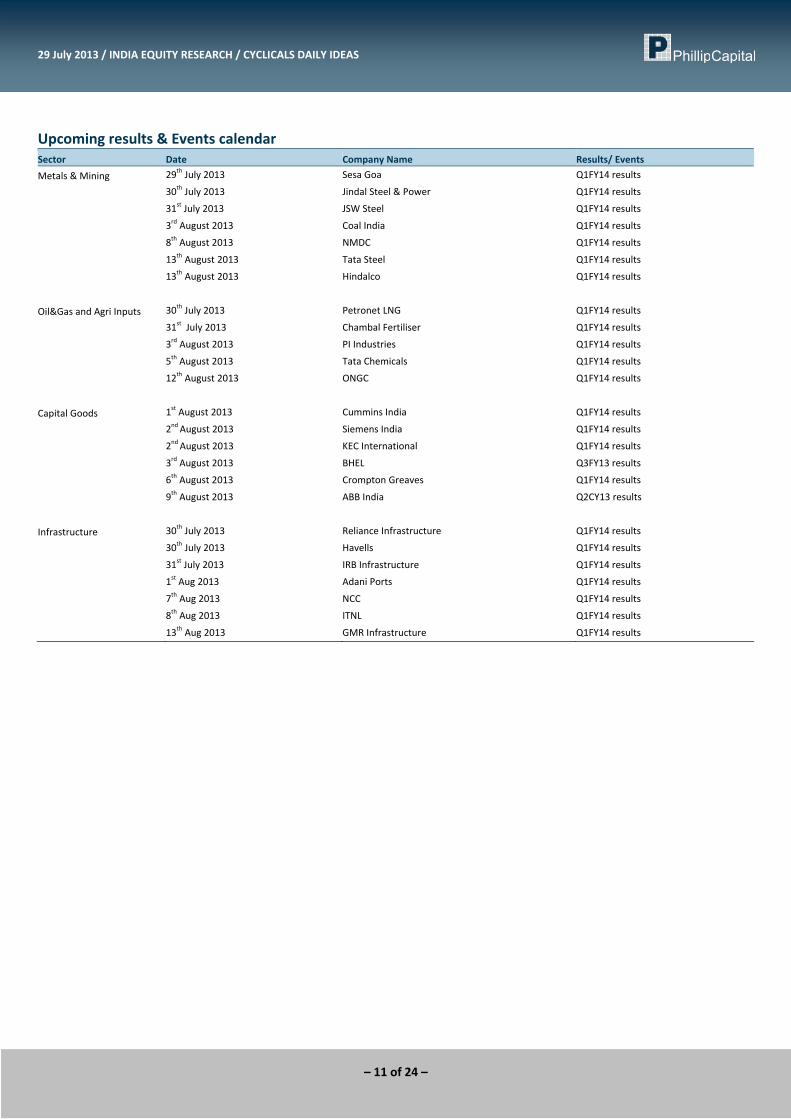
Defensive Daily Ideas Stocks Featured: Wipro, Tata Communications
INSTITUTIONAL USE ONLY 29 July 2013
PhillipCapital (India) Pvt. Ltd.
Contents Stock/Sector Ticker Reco News/Analysis
1 Wipro WPRO IN UR Wipro Q1FY14: muted quarter, marginally disappointing, strong Q2 rev growth guidance
2 Tata Comm TCOM IN BUY Tata Communications Q results – operating performance in line with expectations; profitability boosted by one‐time gains
3 Trader Comments
% C N G 1D 1W 1M 3M 12M B EST 1D 1W 1M 3M 6M 12M P ER WOR ST 1D 1W 1M 3M 6M 12M P ERSENSEX -0.3 -2.0 1.8 1.9 17.3 P harma/ H ealthcareNIFTY -0.4 -2.4 0.8 -0.3 15.4 Biocon 7.3 5.2 15.5 14.7 16.0 39.5 16.8 Vivimed Labs -20.0 -42.4 -46.5 -52.2 -59.7 -64.5 N/ABSET Healthcare 0.2 -1.7 3.8 6.6 31.7 Jubilant Life Science 5.2 -9.0 -30.3 -46.3 -58.5 -42.1 3.2 Aarti Drugs -7.7 -6.4 10.0 22.7 -8.0 79.5 N/ABSETECK -0.2 1.8 14.2 21.8 35.1 Sanofi India Ltd 4.5 2.7 2.3 -1.0 10.6 12.3 N/A Hiran Orgochem -6.8 0.0 -12.7 -10.4 -21.6 -58.9 N/ABSE IT -0.1 2.0 15.8 27.6 38.6 Granules India 2.6 3.1 37.8 6.1 11.8 14.6 N/A Vimta Labs -6.2 -13.1 4.0 19.7 24.9 1.5 N/ABSE 100 -0.5 -2.6 0.9 -0.9 14.8 Sun Pharm 2.2 3.5 10.8 18.7 57.0 77.3 59.0 Lotus Eye Care -6.0 -1.4 -1.7 -17.4 -29.8 -32.3 N/ABSE 500 -0.6 -2.7 0.2 -2.3 11.3 Nectar Lifes 1.9 -6.6 -3.7 -2.3 -21.6 -23.4 N/A M arksans Pharma -4.9 2.1 24.6 134.7 179.2 453.3 N/AEuro pe & US Glenmark Pharma 1.4 -1.7 8.1 23.8 17.5 55.9 21.0 Wyeth -4.5 -8.5 -11.9 -11.9 -19.0 -22.8 N/ADow Jones 0.0 0.1 4.4 5.0 19.0 IND Swift 1.4 0.8 7.6 -22.0 -53.9 -64.5 N/A Dishman Pharma -4.3 -14.2 -10.4 -25.5 -51.3 -19.1 N/AS&P 500 0.1 0.0 5.3 6.2 22.1 Cipla/India 1.3 0.1 6.0 1.8 4.5 27.1 21.3 Suven Life Science -3.9 -9.1 -5.1 -9.5 -16.1 60.1 N/ANASDAQ 0.2 0.7 6.2 9.3 22.1 Strides Arco lab 0.9 -8.9 -18.2 -12.6 -33.5 1.8 17.5 Opto Circuits India -3.7 -6.3 29.2 -57.0 -67.4 -83.2 1.4S&P Europe -0.2 -0.6 3.4 -1.3 9.6 GlaxoSmithKline Pha 0.8 -3.3 4.5 10.2 19.0 15.0 29.2 Elder Pharma -3.6 -4.8 0.6 -12.9 -15.0 10.5 7.4Brazil Bovespa 0.7 4.3 4.1 -10.0 -12.6 Divi's Lab 0.7 -3.0 -4.6 -13.0 -11.6 -11.2 17.1 Natco Pharma -2.9 -5.4 10.7 10.3 5.4 42.3 17.8A sia Hikal Ltd 0.5 -2.5 -2.2 -0.2 -13.0 28.4 N/A Torrent Pharma -2.9 -7.3 -0.1 20.2 14.2 25.1 14.5Nikkei 225 -3.0 -3.6 3.3 1.8 64.9 Aurobindo Pharma 0.4 3.4 -0.6 -6.5 -2.0 77.2 8.8 Ajanta Pharma -2.7 -10.3 16.8 29.3 57.3 178.9 15.9Hang Seng 0.3 2.6 5.6 -2.7 14.0 Cadila Healthcare 0.2 -4.6 -4.4 -4.5 -13.1 -14.1 18.5 Shasun Pharma -2.6 -12.1 21.5 -13.7 -37.0 -45.7 5.1S&P Asia 200 0.1 0.8 5.0 -1.6 19.8 Bal Pharma 0.0 -3.6 3.5 -6.9 -26.9 -11.7 N/A Orchid Chem -2.5 -11.0 -7.1 -31.3 -48.8 -58.1 N/AStraits 0.0 0.1 2.7 -3.7 7.9 Jupiter B ioscience 0.0 0.0 0.0 0.0 0.0 -43.3 N/A Twilight Litaka -2.3 -5.2 -25.0 -46.3 -70.8 -83.2 N/ATWSE -0.2 0.5 1.1 1.5 14.4 Abbott India -0.1 0.5 -3.3 1.4 -2.7 -1.9 N/A Ipca Labs -2.2 -0.6 -2.2 24.5 31.8 63.9 17.6KOSPI 0.1 1.6 2.5 -1.5 4.5 FDC/India -0.4 -1.4 -0.7 -0.2 -4.8 9.4 N/A Ranbaxy Labs -2.1 -6.3 -1.9 -33.4 -33.2 -37.0 12.9Baltic Dry -0.9 -4.9 -3.8 24.2 12.9 AstraZeneca Pharma -0.5 -1.2 -2.0 -5.8 -52.9 -58.9 N/A Apollo Hospitals -2.0 -3.3 -8.5 15.6 20.3 52.4 35.8USD : INR -0.1 -0.5 -2.8 8.6 6.4 Dr Reddy's Labs -0.9 -2.1 3.8 15.4 18.5 41.8 N/A Fortis Healthcare -1.8 -3.1 12.8 -2.7 -11.6 0.3 N/AEUR : INR 0.5 0.6 -0.9 10.8 15.1 Lupin -1.2 -5.0 9.6 24.6 43.1 50.8 24.6 Pfizer/India -1.7 -4.1 -4.2 0.2 -9.4 -14.6 N/AGBP : INR 0.7 0.4 -2.4 8.2 4.9 Ankur Drugs -1.2 -5.9 -16.8 -28.5 -49.9 -59.5 N/A Unichem Lab -1.7 -2.5 -1.6 -4.8 -16.0 8.8 9.9CHF : INR 0.9 1.0 -1.4 10.4 12.3 Indoco Remedies -1.3 -9.3 -0.4 -0.2 3.2 16.3 N/AJPY : INR 0.6 1.3 1.4 9.0 -14.9 T eleco mDollar -0.2 -0.9 -2.0 -0.8 -1.4 Idea Cellular 2.9 9.1 16.1 30.4 44.6 105.2 33.3 Tata Comm -4.3 -3.8 1.0 -30.6 -30.2 -36.1 -13.3USD: AUD 0.2 0.3 0.4 -10.4 -11.7 Bharti A irtel 0.2 2.2 15.8 6.1 -3.3 9.9 29.3 OnM obile Global -4.1 -6.7 -5.6 -28.0 -34.9 -24.4 5.4USD: CNY 0.0 -0.2 0.0 -0.6 -3.9 Tulip Telecom 0.0 -13.5 20.1 -56.1 -57.3 -91.4 N/A M TNL -3.7 -13.5 -16.8 -28.9 -42.1 -50.8 N/AUSD:EURO 0.1 0.8 1.7 1.4 8.4 Bharti Infratel Ltd -0.2 -2.5 -2.2 -16.9 -30.1 N/A 22.4 Reliance Comm -2.1 -7.4 13.8 34.0 65.8 148.7 22.8USD:YEN -0.5 -1.9 -1.9 0.0 25.0 GTL -2.0 -10.0 -3.9 -12.9 -41.8 -54.9 N/A
ITInfo Edge India 3.8 3.1 9.3 -7.5 -3.8 1.5 29.7 M astek -4.2 -8.0 -2.4 -13.1 -25.8 -0.7 5.9Tech M ahindra 3.3 7.7 14.9 28.8 21.6 69.9 12.0 Everonn Education L -3.9 -14.4 -8.4 -45.7 -69.0 -77.5 N/AM phasis 2.4 -1.8 7.7 7.0 8.1 3.1 11.1 Firstsource Solutions -3.7 -9.1 30.2 16.0 10.4 52.2 4.5Allied Digital 2.0 -7.1 33.7 6.0 -36.8 -51.1 N/A Persistent Systems -2.7 -0.9 4.8 0.5 -3.0 42.9 9.5Wipro 1.7 -2.0 9.4 12.0 5.3 28.4 13.9 eClerx Services Ltd -2.4 -12.6 -1.4 15.0 11.7 3.0 N/AInfinite Computer 1.5 -1.3 3.6 -14.1 -24.2 -17.4 3.2 Polaris Software Lab -2.3 -7.7 -4.9 -2.3 -4.4 0.2 4.7Sasken Communicat 1.4 -3.7 6.7 -10.9 -3.6 -4.2 9.9 3i Info tech -2.2 -11.0 -8.1 -21.6 -42.8 -54.6 N/AOracle Financial Sevi 1.4 4.3 7.6 10.2 -10.3 16.5 20.1 Info tech Enterprises -2.2 -1.0 -0.2 2.7 0.1 5.9 N/AM indTree 0.7 2.1 15.0 19.5 20.8 54.6 10.5 Tata Consultancy -1.2 1.8 16.7 29.3 32.0 44.6 N/AHexaware Tech 0.4 6.4 30.9 37.7 40.9 -2.5 9.5 Educomp Solutions L -1.1 -9.3 -14.9 -53.4 -76.5 -80.4 N/AHCL Tech 0.2 1.3 16.5 28.9 30.6 75.0 16.3 Zensar Technologies -1.0 -2.8 -3.3 -1.0 -5.5 -10.2 4.9Rolta India 0.0 -2.1 -6.9 -5.7 -8.0 -12.7 3.5 NIIT Ltd -0.9 -6.4 -10.9 -30.4 -38.3 -55.6 5.1Infosys Technologies 0.0 2.4 16.9 30.8 4.2 35.7 16.9 NIIT Tech -0.8 -6.8 -9.4 -6.4 -4.6 -15.6 6.7KPIT Cummins -0.2 1.3 8.3 35.0 14.4 9.2 N/AA D RWipro 0.1 2.6 13.3 6.7 -1.3 16.8 0.3 Tata Comm -4.7 -2.2 2.7 -36.9 -38.2 -42.1 -0.1Infosys Tech -0.2 4.4 21.0 22.2 -5.0 25.9 N/A Dr Reddy's Lab -0.5 -0.5 3.7 6.8 8.4 33.7 0.3
Source: Bloomberg

29 July 2013 / INDIA EQUITY RESEARCH / DEFENSIVE DAILY IDEAS
– 13 of 24 –
IT SERVICES Vibhor Singhal (+9122 6667 9949 / [email protected]) Varun Vijayan (+9122 6667 9992 / [email protected])
Wipro (WPRO IN, CMP:Rs 376, UR) Q1FY14: muted quarter, marginally disappointing, strong Q2 rev growth guidance Wipro reported IT Services revenues at US$1588m, flat QoQ came below our estimates of 1.3%. Revenue growth for Q1 was inline with the company guided range of ‐0.6% to 1.6%. Overall consolidated (IT Services + products) revenues came at Rs97.3bn, up 1.3% QoQ, below our estimates (Rs98.9b). Profit came at Rs16.2bn down 6% QoQ, while adjusting to the income from discontinued ops last qtr PAT grew by 3%. Wipro had a cross currency impact of ~110bps on revenues sequentially. EBIT margins came at 18.2%, up 40bps QoQ, marginally below our estimates. Overall growth was led by Europe (up 1.5% QoQ) ‐ in constant currency terms, while Americas (down 0.6% QoQ) and IME (down 1.5% QoQ) business dragged the revenues. Among verticals, BFSI (up 1.7% QoQ), E&U (up 5% QoQ) and retail (up 1% QoQ) supported the growth (in constant currency terms). Among services, the company saw a broad based flattish growth with Analytics (up 5.8% QoQ) being an exception. Other key facts: • Company had net additions of 1469 employees, bringing the headcount to 147281 employees (up 1% QoQ). • Utilization including trainees came at 64.7% and excluding trainees at 73.3% down by 130bps QoQ. • Attrition stood at 13.2% (LTM) down by 60bps QoQ. Voluntary attrition at 13%, while involuntary attrition at 4.9%. • It gave a quarterly revenue guidance of 2% to 3.9% for Q2FY14. The management expects a strong Q2 for the company owing to
a robust deal pipeline and improving decision making cycle. It also commented on a strong Europe business supported by regulatory adaptations, and an improving US for Wipro.
• IT Services space for the company remained strong for the quarter maintaining margins (EBIT) at 20%, while IT products space saw an unusual decline in revenues (down 14% YoY) along with a margin contraction of 60bps YoY (100bps QoQ). Wipro’s IT products give EBIT margins of ~1.6 to 3% with seasonal factors impacting each quarter.
• Wipro’s infrastructure services saw a revenue decline (down 1% QoQ) in the quarter. Management commented that the quarter saw some project closures (which impacted the growth in Q1) and renewals which would revive growth in the global infrastructure services space going forward.
• The company discontinued reporting realisations and volumes for the quarter to illustrate the volatility in each quarter owing to its non linear revenues kicking in. This move reduces the visibility of its future operations.
TELECOM Naveen Kulkarni (+9122 6667 9947 / [email protected]) Vivekanand Subbaraman (+9122 6667 9766 / [email protected])
Tata Communications (TCOM IN, BUY, CMP: Rs 159, TP: Rs UR) Q1FY14 results – operating performance in line with expectations; profitability boosted by one‐time gains Tata Communications’ (TCOM) Q1FY14 results were in line with expectations in terms of operating performance, but PAT was higher than estimates due to one‐time gains during the quarter. Below are details of the results: • Revenue marginally below estimes – TCom’s revenue stood at Rs 45.0bn, growing 10% YoY and 2% QoQ, slightly below
estimates. The company’s global voice segment (GVS) revenue grew 8.5% YoY and 1.6% QoQ, aided by favourable currency movements. TCom’s Global Data Management services (GDMS) grew 12% YoY and 3% QoQ while Neotel grew 4% YoY and 3% QoQ. However, in constant currency terms, Neotel’s growth was at a 18% YoY.
• EBITDA margins improve across the board – the Company’s EBITDA stood at Rs 6.5bn, growing 22% YoY and 34% QoQ, ahead of estimates. TCom’s EBITDA margins were ahead of estimates at 14.5%. EBITDA margins have improved across business segments with GVS margins at 11.3%, up 180bps YoY and 160bps QoQ, GMS margins improved to 16.7%, up 300bps QoQ but down 70bps QoQ. Neotel’s business margins saw the sharpest improvement and stood at 21% compared to 12.8% in Q1FY13 and 13.3% in Q4FY13.
• PAT ahead of estimates due to one‐off – PAT stood at 945mn, ahead of estimates due to an exceptional gain of Rs 2.2bn – (1) input credits against certain statutory obligations relating to earlier periods on account of ‘crystallization of the entitlement of these credits,’ (2) gain on sale of fixed assets (land) of Rs 1.9bn, (3) employee cost optimization expenses of Rs 63mn, (4) forex gain of Rs 156mn.

29 July 2013 / INDIA EQUITY RESEARCH / DEFENSIVE DAILY IDEAS
– 14 of 24 –
• Concall at 12PM IST on Monday, 29th July 2013 (Today) – Dial +91 22 3065 2569/+91 22 6629 5802 • Watch out for commentary on: business performance, sharp turnaround in Neotel business and talks of sale of the same, asset
monetisation potential (land sale), progress of new business investments.
Trader Comments • The country’s IT & ITeS industry would generate as many as 1.20 lakh jobs in 2013 even as campus hiring is likely to remain
subdued, experts say. While there has been a drop in campus hiring in IT sector as the industry reels under a economic downturn in the West, jobs added this year will see large hiring from the market. Last year, the campus hiring numbers had dipped from the normal and this year, it is not going to be any different. We estimate that there will be around 1,20,000 jobs created this year.
• With the $87 billion software export industry being hit by the new US immigration law, IT services industry body Nasscom has hired influential lobbyist, public relation and law firms to plead the case of Indian firms with Congressmen.

29 July 2013 / INDIA EQUITY RESEARCH / DEFENSIVE DAILY IDEAS
– 15 of 24 –
Upcoming results & Events calendar Sector Date Company Name Results/ Events
IT Services 29th July 2013 Persistent Systems Q1FY14 results
Geometric Q1FY14 results
3i Infotech Q1FY14 results
30th July 2013 Polaris FT Q1FY14 results
31st July 2013 HCL Tech Q4FY13 results
Telecom 31st July 2013 Bharti Airtel Ltd Q1FY14 results
Onmobile Global Ltd. Q2CY13 results
1st Aug 2013 Idea Cellular Q1FY14 results
Tata Teleservices Maharashtra Ltd Q1FY14 results

Please refer to Disclosures and Disclaimers at the end of the Research Report.
Financial Daily Ideas Stocks Featured: PNB, BOI, Corporation Bank
INSTITUTIONAL USE ONLY 29 July 2013
PhillipCapital (India) Pvt. Ltd.
Contents Stock/Sector Ticker Reco News/Analysis
1 PNB PNB IN Buy Q1FY14 Results – Stress shows no signs of abating
2 Bank of India BOI IN Neutral Q1FY14 Results – Stress on asset quality continues
3 Corporation Bank CRPBK IN Buy Q1FY14 Earnings Conference call invite
% CNG 1D 1W 1M 3M 12M BEST 1D 1W 1M 3M 6M 12M PER WORST 1D 1W 1M 3M 12M PERSENSEX -0.3 -2.0 1.8 1.9 17.3 BankingNIFTY -0.4 -2.4 0.8 -0.3 15.4 SKS Microfinance Ltd 4.9 4.4 -0.7 -21.4 -32.9 25.9 25.6 Canara Bank -8.6 -15.6 -25.3 -36.3 -22.7 N/A
BSE BANKEX -1.4 -4.7 -9.9 -17.1 2.7 South Indian Bank Ltd 0.9 -2.4 -2.6 -6.3 -17.2 -1.1 N/A Syndicate Bank -8.4 -15.6 -13.9 -20.2 2.0 3.2
BSE PSU -1.5 -4.2 -7.5 -16.9 -17.8 Housing Development 0.5 0.3 -7.7 -6.8 0.3 19.6 22.8 Union Bank of India -8.1 -14.7 -28.1 -45.5 -18.3 2.8
BSE REALTY -1.6 -2.4 -5.9 -26.0 -9.4 Federal Bank Ltd -0.1 -9.2 -15.3 -22.7 -31.4 -13.5 N/A City Union Bank Ltd -5.4 -12.5 -15.7 -14.7 4.2 6.7
BSE 100 -0.5 -2.6 0.9 -0.9 14.8 ING Vysya Bank Ltd -0.3 -4.8 -9.2 -8.8 -6.6 46.6 N/A Punjab National Bank -5.1 -5.6 -8.4 -24.0 -16.7 N/A
BSE 500 -0.6 -2.7 0.2 -2.3 11.3 ICICI Bank Ltd -0.3 -2.8 -12.8 -19.1 -22.4 0.4 11.0 Oriental Bank of Comm -5.0 -9.6 -24.0 -42.2 -26.3 N/A
Europe & America Development Credit Ba -0.5 -6.3 -1.6 -1.3 -2.2 19.2 7.2 Manappuram General -5.0 15.3 39.4 -15.6 -52.0 N/A
Dow Jones Industrial A 0.0 0.1 4.4 5.0 19.0 Infrastructure Develop -0.6 -8.0 -9.9 -26.2 -32.4 -9.5 8.4 Mahindra & Mahindra -4.7 -8.1 -11.5 0.5 70.7 12.0
S&P 500 0.1 0.0 5.3 6.2 22.1 Reliance Capital Ltd -0.7 0.3 10.3 3.9 -20.8 16.9 13.8 Bank of India -4.6 -13.2 -20.9 -44.0 -37.0 N/A
NASDAQ Composite 0.2 0.7 6.2 9.3 22.1 Kotak Mahindra Bank -0.8 -1.5 -5.7 -4.2 1.1 28.3 31.8 Jammu & Kashmir Ban -4.2 -9.7 -8.0 -14.5 24.7 5.0
S&P Europe -0.2 -0.6 3.4 -1.3 9.6 IndusInd Bank Ltd -0.8 -6.0 -10.0 -12.3 -2.5 28.2 15.9 Central Bank Of India -4.0 -13.4 -11.3 -22.2 -20.6 N/A
Brazil Bovespa 0.7 4.3 4.1 -10.0 -12.6 United Bank of India -0.9 -6.2 -11.3 -28.0 -42.9 -19.2 N/A Allahabad Bank -3.6 -10.4 -15.8 -44.3 -41.2 2.4
Asia Andhra Bank -0.9 -4.5 -9.4 -19.4 -34.7 -26.1 N/A Rural Electrification Co -3.4 -11.9 -15.5 -24.1 -7.5 4.3
Nikkei 225 -3.0 -3.6 3.3 1.8 64.9 Bajaj Finserv Ltd -1.3 -2.3 -4.3 -18.2 -26.1 -13.0 11.6 IDBI Bank Ltd -3.1 -2.3 -3.8 -23.9 -19.8 N/A
Hang Seng 0.3 2.6 5.6 -2.7 14.0 HDFC Bank Ltd -1.5 -5.3 -3.6 -7.1 -1.2 10.3 18.1 Dhanlaxmi Bank Ltd -3.0 -6.5 -3.7 -32.0 -37.9 N/A
S&P Asia 200 0.1 0.8 5.0 -1.6 19.8 Indian Overseas Bank -1.5 -5.3 -10.0 -29.5 -45.4 -35.9 N/A Dewan Housing Finan -2.9 -2.0 -7.0 -13.9 3.3 3.7
Straits 0.0 0.1 2.7 -3.7 7.9 Vijaya Bank -1.6 -6.1 -7.0 -21.4 -29.6 -18.9 4.0 Indian Bank -2.9 -10.0 -16.0 -41.4 -44.6 N/A
TWSE -0.2 0.5 1.1 1.5 14.4 Bank of Baroda -1.7 0.5 -0.3 -18.0 -32.4 -11.8 N/A Dena Bank -2.9 -12.1 -14.8 -36.0 -31.9 2.3
KOSPI 0.1 1.6 2.5 -1.5 4.5 Yes Bank Ltd -1.7 -13.5 -20.3 -27.2 -28.3 4.0 8.6 LIC Housing Finance L -2.8 -9.3 -25.7 -25.0 -24.1 6.8
Baltic Dry Index -0.9 -4.9 -3.8 24.2 12.9 Axis Bank Ltd -1.8 -7.0 -16.3 -24.9 -25.0 11.0 8.1 UCO Bank -2.7 -10.2 0.9 -9.5 -7.4 N/A
USD : INR -0.1 -0.5 -2.8 8.6 6.4 State Bank of India -1.9 -2.7 -9.7 -22.3 -28.2 -9.1 6.0 Shriram Transport Fina -2.7 -2.8 -9.8 -9.0 14.7 8.8
EUR : INR 0.5 0.6 -0.9 10.8 15.1 Power Finance Corp L -2.1 -8.7 -16.0 -38.5 -40.5 -29.5 3.2 Corp Bank -2.7 -7.2 -13.4 -20.0 -22.5 2.3
GBP : INR 0.7 0.4 -2.4 8.2 4.9 Karnataka Bank Ltd -2.4 -7.7 -14.0 -34.9 -39.7 2.6 4.3
CHF : INR 0.9 1.0 -1.4 10.4 12.3 Real EstateJPY : INR 0.6 1.3 1.4 9.0 -14.9 Godrej Properties Ltd -0.9 -5.5 -3.1 -14.2 -17.4 1.4 18.2 HDIL -4.1 -4.9 0.4 -31.6 -50.3 2.7
Dollar index -0.2 -0.9 -2.0 -0.8 -1.4 Phoenix Mills Ltd -1.1 -3.6 -6.5 -9.9 -7.0 32.3 20.2 Orbit Corp Ltd -2.8 -5.2 -5.2 -41.0 -64.8 7.5
USD: AUD 0.2 0.3 0.4 -10.4 -11.7 Unitech Ltd -1.6 -8.4 -15.1 -35.5 -48.8 -12.7 11.7 DLF Ltd -1.7 2.3 -4.9 -28.8 -11.6 30.6
USD: CNY 0.0 -0.2 0.0 -0.6 -3.9USD:EURO 0.1 0.8 1.7 1.4 8.4USD:YEN -0.5 -1.9 -1.9 0.0 25.0 Source: Bloomberg
29 July 2013 / INDIA EQUITY RESEARCH / FINANCIAL DAILY IDEAS
– 17 of 24 –
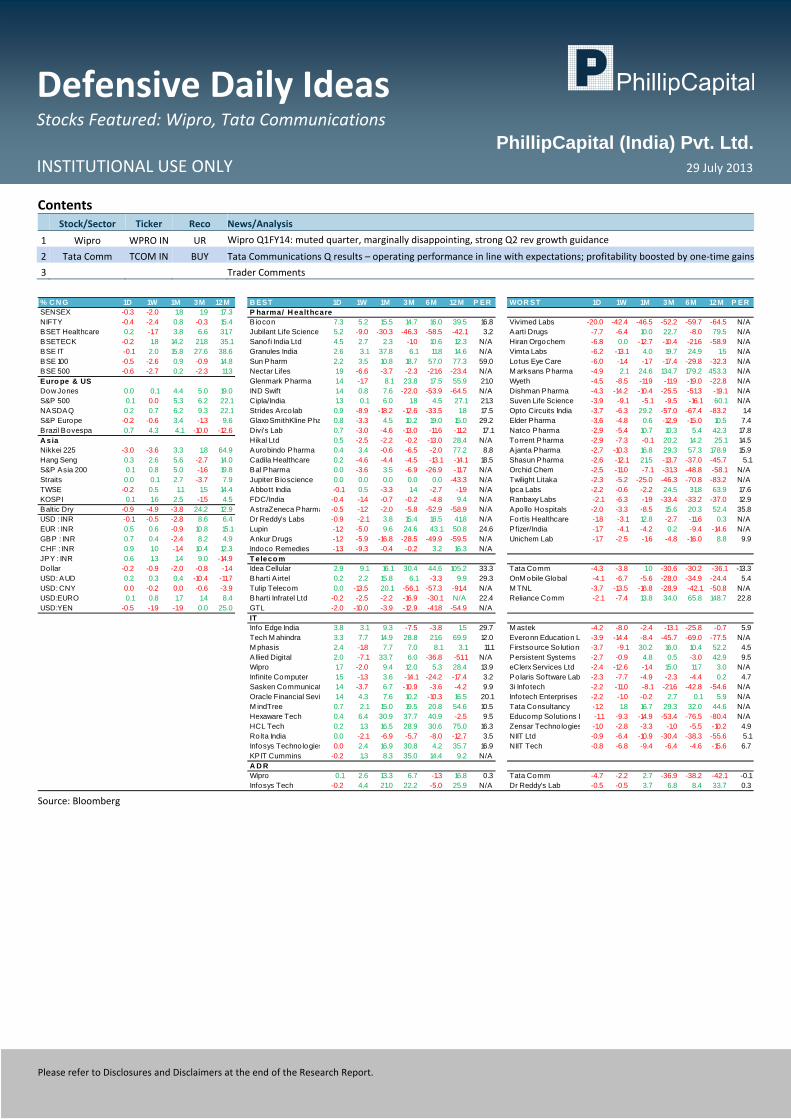
KEY ECONOMIC INDICATORS Latest 1M-Ago 3M-Ago 6M-Ago 12M-Ago KEY BANKING STATISTICS Latest 1M-Ago 3M-Ago 6M-Ago 12M-Ago
Policy rates Business growthRepo,% 7.3 7.3 7.8 8.0 8.0 Credit Growth (%) yoy 17.0 16.0 NA NA NAReverse Repo,% 6.3 6.3 6.8 7.0 7.0 Deposit Growth (%) yoy 17.4 13.1 NA NA NACRR,% 4.0 4.0 4.0 4.3 4.8 CD Ratio (%) 78.1 77.4 NA NA NASLR,% 23.0 23.0 23.0 23.0 24.0 Certificate of deposit outstanding Rs bn 3248 3719 3321 3276 2286Daily data Commercial paper outstanding Rs bn 1037 989 1231 1273 962Call Rate, % 9.5 6.9 7.0 7.9 8.0 Deposits rates91 day T-Bill, % 11.0 7.4 7.6 8.0 8.2 1yr Deposit rate (SBI) 8.75 8.75 8.75 8.50 9.001-Yr Bond Yield, % 8.7 7.7 7.5 7.8 7.9 Lending rates5-Yr Bond Yield, % 8.7 7.9 7.6 7.9 8.1 BPLR, % (SBI) 14.8 14.8 14.8 12.310-Yr Bond Yield,% 8.5 7.9 7.8 8.0 8.3 Mortgage rate, (HDFC Floating rate) 10.5 10.5 9.5 9.3 8.8USD : INR 59.0 60.7 54.4 53.9 55.5 BASE RATE, % (SBI) 10.5 8.4 8.4 8.7 9.2EUR : INR 78.4 79.1 70.7 72.5 68.1 Gsec yield (1yr) 11.0 7.4 7.6 8.0 8.2GBP : INR 91.0 93.3 84.1 84.7 86.7 Corporate Bond Yield (1yr AAA) 8.7 7.7 7.5 7.8 7.9CHF : INR 63.6 64.5 57.6 58.2 56.7 Corporate Bond Spread -2.3 0.2 -0.2 -0.2 -0.3JPY : INR 0.6 0.6 0.6 0.6 0.7 6M LIBOR 0.4 0.4 0.4 0.5 0.7Dollar index 81.5 83.1 82.1 79.6 82.7 Sector wise credit growthEURO:USD 1.3 1.3 1.3 1.3 1.2 AGRI 15.9 12.9 21.8 24.4 8.1USD:YEN 97.8 99.7 97.8 90.7 78.2 Retail 18.4 17.3 17.2 19.1 11.4Weekly data Housing 19.9 18.5 19.1 17.4 11.2Forex Reserves, $Bn 279 291 295 296 287 Credit Card 20.1 21.9 23.7 25.7 10.7Government Borrowing, Rs Bn 1950 1350 300 5100 2190 Personal Loan 32.2 32.8 28.4 31.4 11.2Monthly data SERVICES 9.4 11.2 11.1 13.2 15.2Inflation Commercial real estate 5.2 4.6 4.0 2.9 11.6 WPI,% 4.9 4.7 5.7 7.3 7.6 NBFC 8.5 15.8 16.5 30.3 30.9 CPI,% 10.7 10.2 12.1 9.6 10.2 Trade 26.1 24.9 27.6 25.7 15.7Index of Industrial Production,% -1.6 1.9 0.6 -1.0 2.5 INDUSTRY 14.5 13.4 16.0 17.7 19.18-core Industry,% 2.3 2.4 -2.4 2.2 7.2 Iron and steel 24.3 22.7 24.0 23.2 17.9Exports, $ Bn 23.8 24.5 30.7 25.5 24.9 Chemicals 39.5 41.5 37.3 22.0 13.6Imports, $ Bn 36.0 44.6 40.5 43.4 36.2 Textile 16.1 14.8 14.6 9.5 10.1Trade Deficit, $ bn -12.2 -20.1 -9.8 -17.8 -11.2 Food processing 21.8 14.6 17.3 25.0 19.1Quarterly data Telecom -4.0 -6.2 0.7 0.9 -6.0GDP,% 4.5 - 5.3 5.5 6.0 Power 33.3 26.5 30.4 23.5 23.0 Agriculture,% 1.1 - 1.2 2.9 4.1 Roads 17.4 14.8 17.7 19.5 25.8 Industry,% 2.3 - 1.1 0.8 0.9 Valuation (1yr forward P/ABV) Services,% 6.0 - 7.1 7.4 8.1 PSB 1.4 1.7 1.6 1.8 1.5Exports, $ Bn 84.8 - 74.2 72.6 80.0 Private 2.4 2.6 2.6 2.8 2.3Imports, $ Bn 130.4 - 132.6 120.4 131.7 Premium (Private-PSB) 1.0 0.9 1.0 1.0 0.8Trade Deficit, $ Bn -45.6 - -58.4 -47.8 -51.6 SBI 1.6 2.0 2.2 2.6 1.9Invisibles, $ Bn 27.5 - 26.6 26.7 17.7 ICICI Bank 2.0 2.0 2.3 2.3 2.1Current Account Deficit, $ Bn -18.2 - -31.8 -21.1 -34.0 AGRI 3.7 3.4 3.8 4.4 3.5Net capital flows, $ Bn 23.9 - 16.1 16.6 17.2 Source: Bloomberg

29 July 2013 / INDIA EQUITY RESEARCH / FINANCIAL DAILY IDEAS
– 18 of 24 –
FINANCIAL Manish Agarwalla (+9122 6667 9962 / [email protected]) Sachit Motwani, FRM (+9122 6667 9953 / [email protected])
PNB (PNB IN) Q1FY14 Results – Stress shows no signs of abating PNB’s performance slipped again owing to asset quality stress. Fresh slippages were a whopping Rs 36 bn of which Rs 17 bn was on account of Winsome Diamonds. To add to the woes were fresh restructuring of Rs 28 bn, largely constituted by one power account. The current stressed asset book now stands at 13.2% (12% as on FY13). Key highlights for Q1FY14 • NII grew by 5.7% YoY to Rs 39.1 bn driven by moderation in Advances growth of 3.6% YoY and 8 bps YoY decline in NIMs to
3.52%. On a QoQ basis, NIM was flat. Stable NIMs were on the back of 4 bps QoQ decline in yield on funds to 8.46% and 12 bps QoQ decline in cost of deposits to 5.28%.
• Gross Advances growth of 4.1% YoY was largely driven by overseas advances (on the back of INR depreciation). Domestic advances growth was significantly lower at 1.8% YoY. Substantial decline in Advances was seen in Agri (owing to change in classification), NBFC and Commercial real estate segment. Deposits growth was also subdued at 3% YoY due to shedding of bulk deposits (now 8.8% of the book). CASA declined by 1.3% QoQ to 39.6%.
• Other income growth of 15% YoY was largely driven by treasury gains. Opex growth was moderate even though the bank made a provision of Rs 1.8 bn in Q1FY14 on account of wage hike.
• Provisions remained elevated on the back of higher loan loss provision and provision on restructured advances. PCR declined by 4% QoQ to 54.7%.
• Asset quality stress continued with GNPAs increasing by 57 bps QoQ to 4.84% and NNPAs increasing by 63 bps QoQ to 2.98%. Slippages for Q1FY14 stood at Rs 36 bn of which Rs 17 bn was on account of Winsome exposure. The bank also restructured loans worth Rs 28 bn of which Rs 11 bn came from one power accounts (Bina Power Plant of JP Power). The outstanding standard restructured book increased to Rs 319 bn (Rs305bn as on FY13) and consequently stress asset component increased to 13.22% (NNPA + Restructured asset) of loan book (12% as on FYFY13).
Outlook and valuation PNB’s stressed asset book clearly reflects the ongoing economic stress which has also boiled down to its recent stock performance. The earnings growth over FY14‐15E will likely remain under pressure owing to a) moderation in top line growth on the back of slower advances growth and NIM compression, b) mounting stress with burgeoning slippages and restructuring and c) higher employee expenses. At CMP of Rs 596, the bank trades at 0.6x FY15E ABVPS of Rs 980. We maintain a Buy rating on the stock with a revised PT of Rs 850 (0.9x FY15 ABVPS) Result Update (Rs mn) Q1FY14 Q1FY13 YoY Gwth
Interest earned 104,045 105,450 ‐1.3
Interest expended 64,970 68,498 ‐5.2
Net interest income 39,075 36,951 5.7
Net interest margins 3.52 3.60 ‐0.1
Non interest income 13,421 11,660 15.1
Total Income 52,496 48,611 8.0
Total operating expenses 22,758 20,203 12.6
Payroll costs 16,159 14,197 13.8
Others 6,598 6,005 9.9
Pre‐provision Profit 29,738 28,409 4.7
Provisions & Contingencies 10665 10325 3.3
% Operating income 35.9 36.3
PBT 19,073 18,084 5.5
Provision for Taxes 6,320 5,627 12.3
% of PBT 33.1 31.1
Net Profit 12,753 12,457 2.4

29 July 2013 / INDIA EQUITY RESEARCH / FINANCIAL DAILY IDEAS
– 19 of 24 –
Equity 3,535 3,392 4.2
EPS, Rs 36.1 36.7 ‐1.8
Advances 3,050,656 2,944,679 3.6
Deposits 3,968,281 3,853,547 3.0
Advances / Deposits (%) 76.9 76.4 0.5
Gross NPAs 150906 99882 51.1
Gross NPAs (%) 4.8 3.3 1.5
Net NPAs 90600 49170 84.3
Net NPAs (%) 3.0 1.7 1.3
CAR – Total 11.8 12.6 ‐0.8
Source: Company, PhillipCapital India Research
Bank of India (BOI IN) Q1FY14 Results – Stress on asset quality continues Bank of India (BOI) asset quality remained under pressure as economic woes continued to impact the bank’s performance. PAT of Rs 9.64 bn (+8.6% YoY) was driven strong net interest income and trading gain but marred by high employee expenses and provision. Asset quality woes continued with slippages of Rs 19.9 bn in Q1FY14. The outstanding stressed asset book (Net NPA + standard restructured loan) declined from 7.7% to 7.3% due to lesser addition during the quarter. Key highlights during the quarter • NII increased by 24% YoY due to a sharp 23 bps YoY increase in NIM to 2.5%. The previous year’s (Q1FY13) margin was marred
by interest reversal on slippage and FITL creation on Air India restructuring. Sequentially the NIMs showed marginal improvement of 4bps. International NIMs continued its downward trajectory declining by another 2 bps QoQ to 1.04% due to limited high yield opportunities and lower margins in trade finance.
• Advances grew by 17.1% YoY driven by a 24% YoY increase in overseas book whereas domestic loan book increased by 14% YoY. The domestic credit growth was however driven by strong growth in agri and MSME book. Deposits growth of 22.4% YoY was also driven by a 37% YoY growth in foreign deposits. In domestic deposits, CASA growth remained muted at 16% YoY with a domestic CASA of 31.3%. The bank continued to shed bulk deposits taking total bulk deposit to 8.63% (differential interest deposit + CDs).
• Non‐interest income growth of 40.4% YoY was driven by higher treasury gains while fee income growth moderation continued. Operating expenses increased by 27% YoY due to provision on wage revision of Rs800mn. Provisions increased by 47% YoY to Rs6bn on account of higher loan loss provision.
• Asset quality stress continued with slippages increasing to Rs 19.86 bn (Rs 17 bn in Q4FY13). Slippages included one lumpy account of Rs 2.8 bn (Gems & Jewellery). The bank maintained PCR at 60.9%. The bank also restructured assets worth Rs7.5 bn taking the total standard restructured assets to Rs 162.3 bn (5.2% of the total book).
Valuation and outlook We retain our cautious outlook on asset quality in short term owing to moderation in general economic activity. BOI’s NIM has a scope for improvement given low domestic CD ratio (66%) and all time low NIMs in overseas business. However, rising G.sec yield, higher employee provisions, loan loss provisions (on the back of NPA seasoning), provision on restructuring and a likely higher tax outflow going forward may put pressure on earnings growth. At the CMP of Rs 184, the stock trades at 0.5x FY15E Adj BV. Though the valuation seems attractive we believe the economic slow down to prolong, resulting into more asset quality stress in short time. Hence we maintain our Neutral rating on the stock with a revised PT of Rs 240 (0.7x FY15E Adj BV). Result Update (Rs mn) Q1FY14 Q1FY13 YoY Gwth
Interest earned 85,412 77,092 10.8
Interest expended 60,042 56,656 6.0
Net interest income 25,370 20,436 24.1
Net interest margins 2.50 2.27 0.2
Non interest income 11,808 8,409 40.4
Total Income 37,178 28,844 28.9

29 July 2013 / INDIA EQUITY RESEARCH / FINANCIAL DAILY IDEAS
– 20 of 24 –
Total operating expenses 15,374 12,109 27.0
Payroll costs 9,625 7,432 29.5
Others 5,749 4,676 22.9
Pre‐provision Profit 21,804 16,736 30.3
Provisions & Contingencies 6946 4722 47.1
% Operating income 31.9 28.2
PBT 14,858 12,013 23.7
Provision for Taxes 5,217 3,139 66.2
% of PBT 35.1 26.1
Net Profit 9,642 8,875 8.6
Equity 5,966 5,745 3.9
EPS, Rs 16.2 15.4 4.6
Advances 3,094,320 2,641,616 17.1
Deposits 4,149,640 3,389,826 22.4
Advances / Deposits (%) 74.6 77.9 ‐3.4
Gross NPAs 94135 67518 39.4
Gross NPAs (%) 3.0 2.6 0.5
Net NPAs 64080 44134 45.2
Net NPAs (%) 2.1 1.7 0.4
CAR – Total 10.7 11.4 ‐0.8
Source: Company, PhillipCapital India Research
Corporation Bank, Earnings conference call invite – Q1FY14 We invite you to the Earnings Conference Call of 'Corporation Bank' for the quarter ended June 2013. Corporation Bank representative: Shri. A L Daultani – Executive Director Call Details Monday, July 29th, 2013, 12:00 Noon India Time 02:30 PM Singapore & HK Time 07:30 AM UK Time Call Leader Sachit Motwani (+91 98331 15145 / 022 6667 9953) Dial‐In‐Numbers Local Access Number: Mumbai: +91 22 3065 0140 / 6629 0360 All India Local Access: 6000 1221 / 3940 3977 International Numbers: USA ‐ 1 866 746 2133 UK: 0 808 101 1573 Singapore: 800 101 2045 Hong Kong: 800 964 448

29 July 2013 / INDIA EQUITY RESEARCH / FINANCIAL DAILY IDEAS
– 21 of 24 –
Results Calendar Banks/NBFCs Result Dates City Union Bank 29th July 2013 ‐ Q1FY14 Results Indian Bank 29th July 2013 ‐ Q1FY14 Results IDFC 29th July 2013 ‐ Q1FY14 Results Allahabad Bank 29th July 2013 ‐ Q1FY14 Results Sundaram Finance 29th July 2013 ‐ Q1FY14 Results Vijaya Bank 29th July 2013 ‐ Q1FY14 Results Syndicate Bank 29th July 2013 ‐ Q1FY14 Results IFCI 30th July 2013 ‐ Q1FY14 Results Andhra Bank 31st July 2013 ‐ Q1FY14 Results ICICI Bank 31st July 2013 ‐ Q1FY14 Results Cholamandalam Investment and Finance 31st July 2013 ‐ Q1FY14 Results Karnataka Bank 31st July 2013 ‐ Q1FY14 Results Canara Bank 1st Aug 2013 ‐ Q1FY14 Results Union Bank 1st Aug 2013 ‐ Q1FY14 Results BOB 1st Aug 2013 ‐ Q1FY14 Results PFC 2nd Aug 2013 ‐ Q1FY14 Results OBC 3rd Aug 2013 ‐ Q1FY14 Results REC 8th Aug 2013 ‐ Q1FY14 Results

29 July 2013 / INDIA EQUITY RESEARCH / FINANCIAL DAILY IDEAS
– 22 of 24 –
Economic Calendar Date Time Event Survey ECO IN Prior Revised
07/29/2013 04:31 UK Hometrack Housing Survey MoM Jul ‐‐ 0.30% 0.40% ‐‐
07/29/2013 04:31 UK Hometrack Housing Survey YoY Jul ‐‐ 1.30% 0.80% ‐‐
07/29/2013 05:20 JN Retail Trade YoY Jun 2.10% 1.60% 0.80% ‐‐
07/29/2013 05:20 JN Retail Sales MoM Jun 0.80% ‐0.20% 1.50% ‐‐
07/29/2013 05:20 JN Large Retailers' Sales Jun 3.60% 3.50% ‐0.40% ‐‐
07/29/2013 14:00 UK Net Consumer Credit Jun 0.7B ‐‐ 0.7B ‐‐
07/29/2013 14:00 UK Net Lending Sec. on Dwellings Jun 0.7B ‐‐ 0.3B ‐‐
07/29/2013 14:00 UK Mortgage Approvals Jun 59.7K ‐‐ 58.2K ‐‐
07/29/2013 14:00 UK M4 Money Supply MoM Jun 0.20% ‐‐ ‐0.10% ‐‐
07/29/2013 14:00 UK M4 Money Supply YoY Jun ‐‐ ‐‐ ‐0.10% ‐‐
07/29/2013 14:00 UK M4 Ex IOFCs 3M Annualised Jun 4.40% ‐‐ 4.30% ‐‐
07/29/2013 15:30 UK CBI Reported Sales Jul 10 ‐‐ 1 ‐‐
07/29/2013 19:30 US Pending Home Sales MoM Jun ‐1.00% ‐‐ 6.70% ‐‐
07/29/2013 19:30 US Pending Home Sales YoY Jun 11.50% ‐‐ 12.50% ‐‐
07/29/2013 20:00 US Dallas Fed Manf. Activity Jul 7.3 ‐‐ 6.5 ‐‐
29‐31 JUL CH Leading Index Jun ‐‐ ‐‐ 99.6 ‐‐
07/30/2013 05:00 JN Overall Household Spending YoY Jun 1.40% ‐‐ ‐1.60% ‐‐
07/30/2013 05:00 JN Jobless Rate Jun 4.00% ‐‐ 4.10% ‐‐
07/30/2013 05:00 JN Job‐To‐Applicant Ratio Jun 0.91 ‐‐ 0.9 ‐‐
07/30/2013 05:20 JN Industrial Production MoM Jun P ‐1.50% ‐‐ 1.90% ‐‐
07/30/2013 05:20 JN Industrial Production YoY Jun P ‐2.60% ‐‐ ‐1.10% ‐‐
07/30/2013 07:00 AU Building Approvals MoM Jun 2.00% ‐‐ ‐1.10% ‐‐
07/30/2013 07:00 AU Building Approvals YoY Jun 0.00% ‐‐ ‐3.20% ‐‐
07/30/2013 09:30 JN Vehicle Production YoY Jun ‐‐ ‐‐ ‐6.20% ‐‐
07/30/2013 10:30 JN Small Business Confidence Jul ‐‐ ‐‐ 49.6 ‐‐
07/30/2013 10:30 IN Bloomberg July India Economic Survey
07/30/2013 11:00 IN RBI Cash Reserve Ratio 30‐Jul 4.00% ‐‐ 4.00% ‐‐
07/30/2013 11:00 IN RBI Repurchase Rate 30‐Jul 7.25% ‐‐ 7.25% ‐‐
07/30/2013 11:00 IN RBI Reverse Repo Rate 30‐Jul 6.25% ‐‐ 6.25% ‐‐
07/30/2013 11:30 GE GfK Consumer Confidence Aug 6.9 ‐‐ 6.8 ‐‐
07/30/2013 12:30 GE CPI ‐ Saxony MoM Jul ‐‐ ‐‐ 0.10% 0.00%
07/30/2013 12:30 GE CPI ‐ Saxony YoY Jul ‐‐ ‐‐ 2.00% 1.90%
07/30/2013 13:30 GE CPI ‐ Brandenburg MoM Jul ‐‐ ‐‐ 0.20% 0.00%
07/30/2013 13:30 GE CPI ‐ Brandenburg YoY Jul ‐‐ ‐‐ 1.70% 1.50%
07/30/2013 13:30 GE CPI ‐ Hesse MoM Jul ‐‐ ‐‐ 0.20% 0.00%
07/30/2013 13:30 GE CPI ‐ Hesse YoY Jul ‐‐ ‐‐ 1.60% 1.40%
07/30/2013 14:00 UK Lloyds Business Barometer Jul ‐‐ ‐‐ 36 ‐‐
07/30/2013 15:30 GE CPI ‐ Bavaria MoM Jul ‐‐ ‐‐ 0.10% 0.00%
07/30/2013 15:30 GE CPI ‐ Bavaria YoY Jul ‐‐ ‐‐ 1.80% 1.70%
07/30/2013 17:30 GE CPI MoM Jul P 0.30% ‐‐ 0.10% ‐‐
07/30/2013 17:30 GE CPI YoY Jul P 1.70% ‐‐ 1.80% ‐‐
07/30/2013 17:30 GE CPI ‐ EU Harmonised MoM Jul P 0.30% ‐‐ 0.10% ‐‐

29 July 2013 / INDIA EQUITY RESEARCH / FINANCIAL DAILY IDEAS
– 23 of 24 –
Management Vineet Bhatnagar (Managing Director) (91 22) 2300 2999 Sajid Khalid (Head – Institutional Equities) (91 22) 6667 9972 Jignesh Shah (Head – Equity Derivatives) (91 22) 6667 9735
Research Automobiles Deepak Jain (9122) 6667 9758 Banking, NBFCs Manish Agarwalla (9122) 6667 9962 Sachit Motwani, CFA, FRM (9122) 6667 9953 Consumer, Media, Telecom Naveen Kulkarni, CFA, FRM (9122) 6667 9947 Ennette Fernandes (9122) 6667 9764 Vivekanand Subbaraman (9122) 6667 9766 Cement Vaibhav Agarwal (9122) 6667 9967 Economics Anjali Verma (9122) 6667 9969
Engineering, Capital Goods Ankur Sharma (9122) 6667 9759 Jishar Thoombath (9122) 6667 9986 Metals Dhawal Doshi (9122) 6667 9769 Dharmesh Shah (9122) 6667 9974 Infrastructure & IT Services Vibhor Singhal (9122) 6667 9949 Varun Vijayan (9122) 6667 9992 Raheel Arathodi (9122) 6667 9768 Oil&Gas, Agri Inputs Gauri Anand (9122) 6667 9943 Saurabh Rathi (9122) 6667 9951
Retail, Real Estate Abhishek Ranganathan, CFA (9122) 6667 9952 Neha Garg (9122) 6667 9996 Mid‐caps Kapil Bagaria (9122) 6667 9965 Raheel Arathodi (9122) 6667 9768 Technicals & Quant Neppolian Pillai (9122) 6667 9989 Shikha Khurana (9122) 6667 9948 Sr. Manager – Equities Support Rosie Ferns (9122) 6667 9971
Sales & Distribution Kinshuk Tiwari (9122) 6667 9946 Ashvin Patil (9122) 6667 9991 Shubhangi Agrawal (9122) 6667 9964 Kishor Binwal (9122) 6667 9989 Dipesh Sohani (9122) 6667 9756
Dilesh Doshi (Sales Trader) (9122) 6667 9747 Rajesh Ashar (Sales Trader) (9122) 6667 9746
Mayur Shah (Execution) (9122) 6667 9945
c Contact Information (Regional Member Companies)
SINGAPORE
Phillip Securities Pte Ltd 250 North Bridge Road, #06‐00 Raffles City Tower,
Singapore 179101 Tel : (65) 6533 6001 Fax: (65) 6535 3834
www.phillip.com.sg
MALAYSIA Phillip Capital Management Sdn Bhd B‐3‐6 Block B Level 3, Megan Avenue II,
No. 12, Jalan Yap Kwan Seng, 50450 Kuala Lumpur Tel (60) 3 2162 8841 Fax (60) 3 2166 5099
www.poems.com.my
HONG KONG Phillip Securities (HK) Ltd
11/F United Centre 95 Queensway Hong Kong Tel (852) 2277 6600 Fax: (852) 2868 5307
www.phillip.com.hk
JAPAN Phillip Securities Japan, Ltd
4‐2 Nihonbashi Kabutocho, Chuo‐ku Tokyo 103‐0026
Tel: (81) 3 3666 2101 Fax: (81) 3 3664 0141 www.phillip.co.jp
INDONESIA PT Phillip Securities Indonesia
ANZ Tower Level 23B, Jl Jend Sudirman Kav 33A, Jakarta 10220, Indonesia
Tel (62) 21 5790 0800 Fax: (62) 21 5790 0809 www.phillip.co.id
CHINA Phillip Financial Advisory (Shanghai) Co. Ltd.
No 550 Yan An East Road, Ocean Tower Unit 2318 Shanghai 200 001
Tel (86) 21 5169 9200 Fax: (86) 21 6351 2940 www.phillip.com.cn
THAILAND Phillip Securities (Thailand) Public Co. Ltd.
15th Floor, Vorawat Building, 849 Silom Road, Silom, Bangrak, Bangkok 10500 Thailand
Tel (66) 2 2268 0999 Fax: (66) 2 2268 0921 www.phillip.co.th
FRANCE King & Shaxson Capital Ltd.
3rd Floor, 35 Rue de la Bienfaisance 75008 Paris France
Tel (33) 1 4563 3100 Fax : (33) 1 4563 6017 www.kingandshaxson.com
UNITED KINGDOM King & Shaxson Ltd.
6th Floor, Candlewick House, 120 Cannon Street London, EC4N 6AS
Tel (44) 20 7929 5300 Fax: (44) 20 7283 6835 www.kingandshaxson.com
UNITED STATES Phillip Futures Inc.
141 W Jackson Blvd Ste 3050 The Chicago Board of Trade Building
Chicago, IL 60604 USA Tel (1) 312 356 9000 Fax: (1) 312 356 9005
AUSTRALIA PhillipCapital Australia
Level 37, 530 Collins Street Melbourne, Victoria 3000, Australia
Tel: (61) 3 9629 8380 Fax: (61) 3 9614 8309 www.phillipcapital.com.au
SRI LANKA Asha Phillip Securities Limited
Level 4, Millennium House, 46/58 Navam Mawatha, Colombo 2, Sri Lanka
Tel: (94) 11 2429 100 Fax: (94) 11 2429 199 www.ashaphillip.net/home.htm
INDIA PhillipCapital (India) Private Limited
No. 1, C‐Block, 2nd Floor, Modern Center , Jacob Circle, K. K. Marg, Mahalaxmi Mumbai 400011 Tel: (9122) 2300 2999 Fax: (9122) 6667 9955 www.phillipcapital.in
29 July 2013 / INDIA EQUITY RESEARCH / CONSUMER DAILY IDEAS
– 24 of 24 –
Disclosures and Disclaimers PhillipCapital (India) Pvt. Ltd. has three independent equity research groups: Institutional Equities, Institutional Equity Derivatives and Private Client Group. This report has been prepared by Institutional Equities Group. The views and opinions expressed in this document may or may not match or may be contrary at times with the views, estimates, rating, target price of the other equity research groups of PhillipCapital (India) Pvt. Ltd. This report is issued by PhillipCapital (India) Pvt. Ltd. which is regulated by SEBI. PhillipCapital (India) Pvt. Ltd. is a subsidiary of Phillip (Mauritius) Pvt. Ltd. References to "PCIPL" in this report shall mean PhillipCapital (India) Pvt. Ltd unless otherwise stated. This report is prepared and distributed by PCIPL for information purposes only and neither the information contained herein nor any opinion expressed should be construed or deemed to be construed as solicitation or as offering advice for the purposes of the purchase or sale of any security, investment or derivatives. The information and opinions contained in the Report were considered by PCIPL to be valid when published. The report also contains information provided to PCIPL by third parties. The source of such information will usually be disclosed in the report. Whilst PCIPL has taken all reasonable steps to ensure that this information is correct, PCIPL does not offer any warranty as to the accuracy or completeness of such information. Any person placing reliance on the report to undertake trading does so entirely at his or her own risk and PCIPL does not accept any liability as a result. Securities and Derivatives markets may be subject to rapid and unexpected price movements and past performance is not necessarily an indication to future performance. This report does not have regard to the specific investment objectives, financial situation and the particular needs of any specific person who may receive this report. Investors must undertake independent analysis with their own legal, tax and financial advisors and reach their own regarding the appropriateness of investing in any securities or investment strategies discussed or recommended in this report and should understand that statements regarding future prospects may not be realized. In no circumstances it be used or considered as an offer to sell or a solicitation of any offer to buy or sell the Securities mentioned in it. The information contained in the research reports may have been taken from trade and statistical services and other sources, which we believe are reliable. PhillipCapital (India) Pvt. Ltd. or any of its group/associate/affiliate companies do not guarantee that such information is accurate or complete and it should not be relied upon as such. Any opinions expressed reflect judgments at this date and are subject to change without notice Important: These disclosures and disclaimers must be read in conjunction with the research report of which it forms part. Receipt and use of the research report is subject to all aspects of these disclosures and disclaimers. Additional information about the issuers and securities discussed in this research report is available on request. Certifications: The research analyst(s) who prepared this research report hereby certifies that the views expressed in this research report accurately reflect the research analyst’s personal views about all of the subject issuers and/or securities, that the analyst have no known conflict of interest and no part of the research analyst’s compensation was, is or will be, directly or indirectly, related to the specific views or recommendations contained in this research report. The Research Analyst certifies that he /she or his / her family members does not own the stock(s) covered in this research report. Independence: PhillipCapital (India) Pvt. Ltd. has not had an investment banking relationship with, and has not received any compensation for investment banking services from, the subject issuers in the past twelve (12) months, and PhillipCapital (India) Pvt. Ltd does not anticipate receiving or intend to seek compensation for investment banking services from the subject issuers in the next three (3) months. PhillipCapital (India) Pvt. Ltd is not a market maker in the securities mentioned in this research report, although it or its affiliates may hold either long or short positions in such securities. PhillipCapital (India) Pvt. Ltd does not hold more than 1% of the shares of the company(ies) covered in this report. Suitability and Risks: This research report is for informational purposes only and is not tailored to the specific investment objectives, financial situation or particular requirements of any individual recipient hereof. Certain securities may give rise to substantial risks and may not be suitable for certain investors. Each investor must make its own determination as to the appropriateness of any securities referred to in this research report based upon the legal, tax and accounting considerations applicable to such investor and its own investment objectives or strategy, its financial situation and its investing experience. The value of any security may be positively or adversely affected by changes in foreign exchange or interest rates, as well as by other financial, economic or political factors. Past performance is not necessarily indicative of future performance or results. Sources, Completeness and Accuracy: The material herein is based upon information obtained from sources that PCIPL and the research analyst believe to be reliable, but neither PCIPL nor the research analyst represents or guarantees that the information contained herein is accurate or complete and it should not be relied upon as such. Opinions expressed herein are current opinions as of the date appearing on this material and are subject to change without notice. Furthermore, PCIPL is under no obligation to update or keep the information current. Copyright: The copyright in this research report belongs exclusively to PCIPL. All rights are reserved. Any unauthorized use or disclosure is prohibited. No reprinting or reproduction, in whole or in part, is permitted without the PCIPL’s prior consent, except that a recipient may reprint it for internal circulation only and only if it is reprinted in its entirety. Caution: Risk of loss in trading in can be substantial. You should carefully consider whether trading is appropriate for you in light of your experience, objectives, financial resources and other relevant circumstances. For U.S. persons only: This research report is a product of PhillipCapital (India) Pvt Ltd. which is the employer of the research analyst(s) who has prepared the research report. The research analyst(s) preparing the research report is/are resident outside the United States (U.S.) and are not associated persons of any U.S. regulated broker‐dealer and therefore the analyst(s) is/are not subject to supervision by a U.S. broker‐dealer, and is/are not required to satisfy the regulatory licensing requirements of FINRA or required to otherwise comply with U.S. rules or regulations regarding, among other things, communications with a subject company, public appearances and trading securities held by a research analyst account. This report is intended for distribution by PhillipCapital (India) Pvt Ltd. only to "Major Institutional Investors" as defined by Rule 15a‐6(b)(4) of the U.S. Securities andExchange Act, 1934 (the Exchange Act) and interpretations thereof by U.S. Securities and Exchange Commission (SEC) in reliance on Rule 15a 6(a)(2). If the recipient of this report is not a Major Institutional Investor as specified above, then it should not act upon this report and return the same to the sender. Further, this report may not be copied, duplicated and/or transmitted onward to any U.S. person, which is not the Major Institutional Investor. In reliance on the exemption from registration provided by Rule 15a‐6 of the Exchange Act and interpretations thereof by the SEC in order to conduct certain business with Major Institutional Investors, PhillipCapital (India) Pvt Ltd. has entered into an agreement with a U.S. registered broker‐dealer, Marco Polo Securities Inc. ("Marco Polo").Transactions in securities discussed in this research report should be effected through Marco Polo or another U.S. registered broker dealer PhillipCapital (India) Pvt. Ltd. Registered office: 2nd Floor, C‐Block, Modern Centre, Mahalaxmi, Mumbai – 400011