Embed Size (px)
Citation preview

Administrative Staff College of India, Hyderabad1
India- Energy Security(through self reliance)
Presented-KSG,Boston25 September 2006
ADMINISTRATIVE STAFF COLLEGE OF INDIAHyderabad

Administrative Staff College of India, Hyderabad2
Purpose of the Presentation
Economic Growth calls for increase in supply of energy. While India has registered a commendable rate of economic growth in the recent past, this has been achieved with unsatisfactory supply of energy.The energy supply situationcontinues to cause anxiety.Many fear that India’s aspiration to achieve 8% per year GDP growth in the next decade may be constrained by lack of energy supplies.
This presentation seeks to probe ways in which India could meet its energy demand to support such a high rate of growth .

Administrative Staff College of India, Hyderabad3
Content of presentation• What fuels are used in the economy?• What determines the choice of fuels in the different
sectors?• What is consumption of fuels now?• What would be the consumption of different fuels in the
future-(2031-32)?• How much of the requirement would be met from
domestic fuels resources, how much would be imported?• How to ensure energy security thro’ an optimal mix of
indigenous and imported fuels at all times, minimizing the total fuel cost to the economy?
Administrative Staff College of India, Hyderabad4
Energy Security definedES Should ensure that the Country -
(a)has on a sustainable basis adequate quantity to meet the needs of all people for productive needs
(b)the poor and remote area residents for all basic needs are supplied modern clean fuels at prices affordable by them of appropriate quality and the desired fuel form
* ES should ensure that the production ,transport and utilisation of energy is achieved all times with minimum adverse impact on environment.
* ES should be harmonious with the National Security plans

Administrative Staff College of India, Hyderabad5
IEP-Defn of Energy Security
• Should supply energy to all citizens irrespective of their ability to pay
• Shd. meet effective demand for safe and convenient forms of various energy needs at competitive prices
• Shd. Meet all contingency risks of disruptions at a specified confidence level
• Para 4.2 of IEP
Administrative Staff College of India, Hyderabad6
Integrated Energy Policy 2006
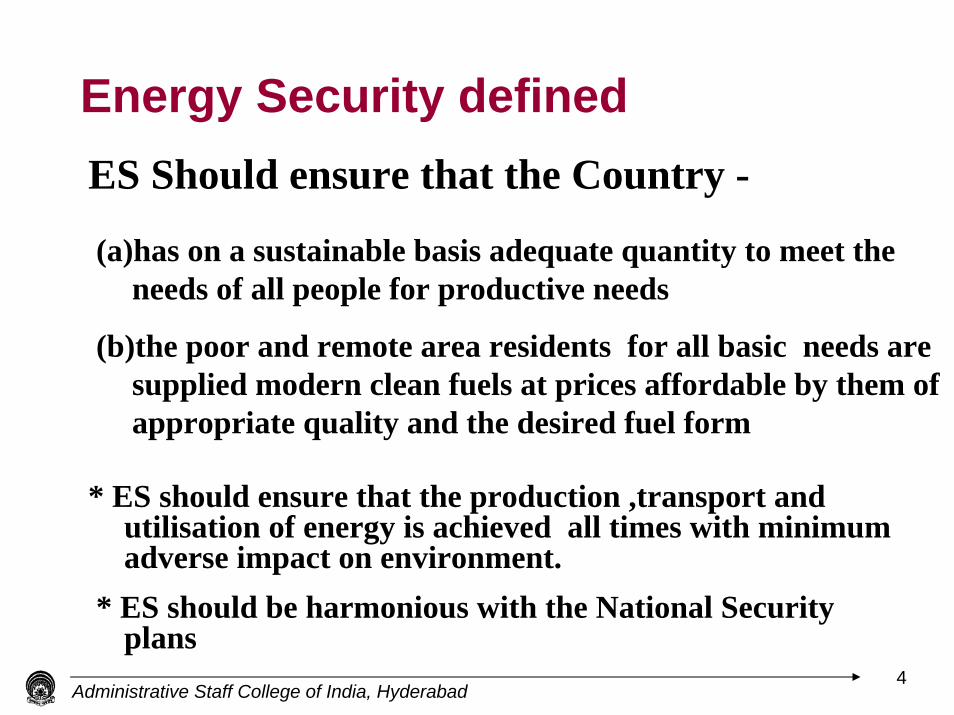
• Till recently too many diverse forecasts of India’s Energy Future.
• In Aug 2004 a committee of experts appointed by GOI to suggest a long term Integrated Energy Policy (IEP).
• In Aug 2006 the committee submitted its Report.• I was a member of the committee.• In the presentation I will broadly follow the IEP
recommendations but explicitly state my differences and the reasons for the same.

Administrative Staff College of India, Hyderabad7
Year Coal mmt
Oil Products
mmt
Natural GasBCM
Total ElectricityGeneration
BKWH
1980-81 109 32.26 2.4 119.
2005-06 380 107.75 32.0 678
Rate of Growth %(1981-06)
5.1 5.0 10.9 7.2
India’s Energy consumption
mmt= million metric tonnes

Administrative Staff College of India, Hyderabad8
Elasticity used for Projections:
Period TPES Electricity Elasticity Elasticity
• 2004 - 2012 0.75 0.95• 2012 - 2022 0.70 0.85• 2022 - 2032 0.67 0.78
Administrative Staff College of India, Hyderabad9
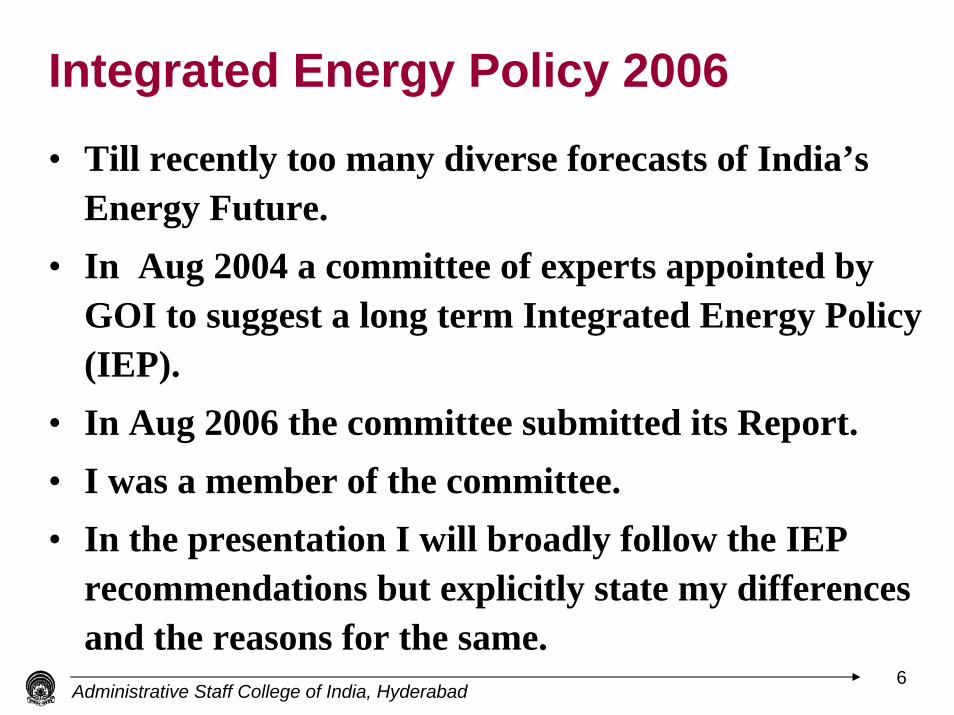
Energy needs of India:
Year TPES MTOE Electricity BkWhr
• 2006-07 389 761• 2011-12 521 1097• 2016-17 684 1524• 2021-22 898 2118• 2026-27 1166 2866• 2031-32 1514 3880

Administrative Staff College of India, Hyderabad10
Non-Power requirement of fuels
Year Coal MMT Oil MMT Natural GasBCM
• 2006-07 123 126 20
• 2011-12 164 158 30
• 2016-17 221 205 38
• 2021-22 299 266 56
• 2026-27 408 351 73
• 2031-32 562 469 100
MMT=million tonnes BCM=billion cubic metres
Administrative Staff College of India, Hyderabad11
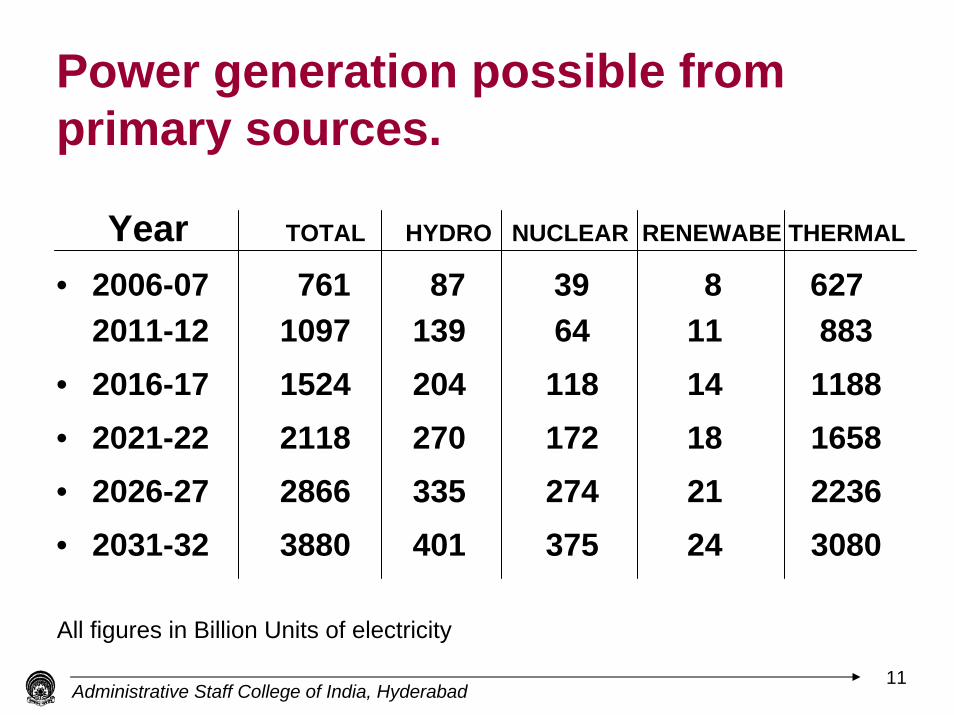
Power generation possible from primary sources.
Year TOTAL HYDRO NUCLEAR RENEWABE THERMAL
• 2006-07 761 87 39 8 627 2011-12 1097 139 64 11 883
• 2016-17 1524 204 118 14 1188• 2021-22 2118 270 172 18 1658 • 2026-27 2866 335 274 21 2236• 2031-32 3880 401 375 24 3080
All figures in Billion Units of electricity

Administrative Staff College of India, Hyderabad12
Electricity Production Generation from Coal and Natural Gas
YearTotal Thermal
Electricity (B kWhr)
Coal based generation
(Bkwhr)
Gas based
(BkWhr)
Coal requirement
(MMT)
Gas requirement
(BCM)
2003-04 498 433 65 318 112006-07 577 506 71 337 122011-12
812 700 112 463 192016-17
1089 894 195 603 332021-22
1521 1214 307 832 522026-27 2050 1595 455 1109 772031-32
2828 2125 703 1475 119

Administrative Staff College of India, Hyderabad13
Total Energy Requirement in Different forms in MTOE
YEAR Hydro MTOE
NuclearMTOE
CoalMTOE
OilMTOE
Natural Gas MTOE
TPESMTOE
2006-07 9 11 205 128 36 3892011-12 12 17 257 166 44 4962016-17 18 31 338 214 64 6652021-22 23 45 464 278 97 9072026-27 29 71 622 365 135 1222
2031-32 35 98 835 486 197 1651
Growth Rates 2032 (%)
5.6 9.1 5.8 5.5 7.0 6.0

Administrative Staff College of India, Hyderabad14
Total Energy Requirement in Different forms in Original Units
YEAR Hydro BKwh
NuclearBKwh
CoalMT
OilMT
Natural Gas BCM
TPESMTOE
2006-07 105 42 500 128 40 389
2011-12 140 65 627 166 49 4962016-17 209 118 824 214 71 6652021-22 267 172 1132 278 108 9072026-27 337 272 1517 365 150 12222031-32 407 375 2037 486 219 1651Growth Rates 2032 (%)
5.6 9.2 5.8 5.5 7.0 6.0

Administrative Staff College of India, Hyderabad15
Difference in Perception
• I am in full agreement with the forecast of TPCES• I disagree with the forecast for NG for non-power &
power needs. The non-power needs like fertilizer and petro-chemicals will not be globally competitive .Domestic and automobile use of gas can absorb a higher NG cost but the demand will be small.
• Power sector can absorb NG at US $ 4/mmbtu at most places and at US$ 6/mmbtu in Gujarat and Kerala

Administrative Staff College of India, Hyderabad16
Differences ( contd.)
• I also feel that the feasibility of achieving the high growth rate in Nuclear is dependent on two vital technical break-throughs and several unpredictable geopolitical factors
• I feel India’s potential for renewables has been under-estimated.

Administrative Staff College of India, Hyderabad17
Reserve Production Ratio of Fuels in India
Resources
(1)
Unit
(2)
Proved
(3)
Production in 2005-06
(4)
R/P Ration Yrs of Life
(5)
Coal (Reserve)
BtoeBt
38.1192.96
-0.40
-
Coal (Extractable)
BtoeBt
12.3030.00
-0.40
-77.5
Lignite (Extractable)
BtoeBt
1.2204.26
-0.028
153
Oil Mtoe 739 33 22
Gas MtoeBcm
831992
2932
29
Administrative Staff College of India, Hyderabad18
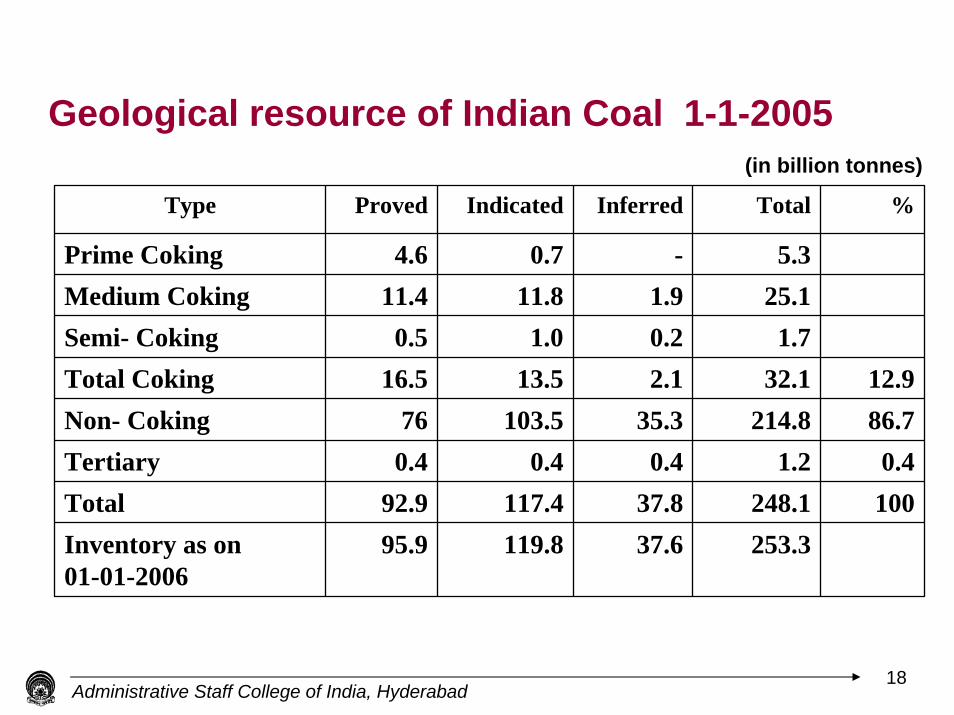
Geological resource of Indian Coal 1-1-2005 (in billion tonnes)
Type Proved Indicated Inferred Total %
Prime Coking 4.6 0.7 - 5.3Medium Coking 11.4 11.8 1.9 25.1Semi- Coking 0.5 1.0 0.2 1.7Total Coking 16.5 13.5 2.1 32.1 12.9Non- Coking 76 103.5 35.3 214.8 86.7Tertiary 0.4 0.4 0.4 1.2 0.4Total 92.9 117.4 37.8 248.1 100Inventory as on01-01-2006
95.9 119.8 37.6 253.3

Administrative Staff College of India, Hyderabad19
Geological Resource of Indian Coal 01-01-2005
(in billion tonnes)
Depth (m) Proved Indicated Inferred Total %
0-300 71 66.5 15 152.5 61.5300 – 600 6.5 39.5 17 63 25.50 – 600(for Jharia)
14 0.5 - 14.5 6
600 – 1200 1.5 10.5 6 18 7Total 93 117 38 248 100% 37.5 47 15.5 100

Administrative Staff College of India, Hyderabad20
Distribution of Coal Resources Among Coal Mining Categories
(In Billion Tonnes)
BlocksProved Indicated Inferred Total % Share
CIL 67.71 19.42 4.56 91.69 37.0Captive 9.55 15.86 2.70 28.11 11.30Non CIL 3.46 5.17 5.98 14.61 5.9Others (TISCO etc) 2.77 0.35 0 3.12 1.2Un-blocked 0.78 70.10 21.61 92.49 37.3Godavari Valley 8.26 6.08 2.58 16.92 7.0NE Region 0.43 0.10 0.37 0.90 0.3TOTAL 92.96 117.08 37.80 247.84 100

Administrative Staff College of India, Hyderabad21
How long will coal lastPlan Period
UptoDemand in
end year-MTTotal
Demand in five years-mt
Cumulative consumption
mt2011-12 627 2693 26932016-17 824 3628 63212021-22 1132 4890 112112026-27 1517 6623 178342031-32 2036 8883 2671Total upto2032
26,717
Note: Extractable coal from “Proved Blocks” is 30,000 MT.

Administrative Staff College of India, Hyderabad22
Survey for Coal Incomplete
• India’s land area is over 3.29 million Sq. Kms• On GSI,s information base only 10 to 12% of the
land as coal-bearing characteristics.• Of the potentially coal bearing areas just about
half has been surveyed by the three public sector agencies charged .
• A policy similar to NELP in oil sector is urgent in coal to accelerate exploration
Administrative Staff College of India, Hyderabad23
India- Climate Change Issues
• 1994 level of GHG emission was 1228mt of CO2 equivalent .<3% of global GHG
• In per- capita terms it is 23%of global average and 4% of of USA.
• Currently in PPP terms GHG emission is only 0.4 tonne of CO2 per US$1000 of GDP
• However India has a responsible nation is committed to reducing GHG through adopting Clean Coal technologies including CCS
• Collaboration with US,UK and EU

Administrative Staff College of India, Hyderabad24
Natural GasIndia has stepped up its quest for gas by resorting to NELP. The efforts to source gas from outside the country are also underway.
Blocks identified for exploration

Natural Gas – Supply Options The important initiatives to augment gas supplies to India already finalize and under vigorous pursuit are as follows.
2004-05 2009-10 2014-15 2019-20 2024-25
I. Domestic Supply 30 43* 43@ 45@ 45@
II. Coal Bed Methane 0 1 2 2 2
Sub Total (I + II) 30 44 45 47 47
III. Imports
A. LNG
1. Dahej Terminal 3 10 10 10 10
2. Hazira Terminal 0 3 3 3 3
3. Dabhol Terminal 0 - 7 7 7
4. Kochi Terminal 0 - 7 7 7
Sub Total (A) 3 13 27 27 27
B. Transnational Pipelines1. Iran-Pakistan-India Pipeline
0 0 - 22 22
2. Myanmar-Bangladesh-India Pipeline
0 - 11 11 11
Grand Total 33 57 83 105 105
Administrative Staff College of India, Hyderabad25
* includes 40 MMSCMD from Reliance K-G Basin.@ It is assumed that the additional gas finds will replace only the depleting production from the existing fields.

Administrative Staff College of India, Hyderabad26
India’s Oil Import Cost & impact
• Latest estimates show the oil import bill as - US $ 43 billion in 2005-06
US $ 66 billion in 2006-07(Likely)Which might be >25%of total imports
Crisil recent study suggests that if Crude price rises to US$ 100 /b India’s GDP growth rate will come down by 2%