Embed Size (px)
Citation preview

Please cite this paper as:
Herd, R. et al. (2011), “Financial Sector Reform in India:Time for a Second Wave?”, OECD Economics DepartmentWorking Papers, No. 879, OECD Publishing.http://dx.doi.org/10.1787/5kg8ghvzr2jk-en
OECD Economics DepartmentWorking Papers No. 879
Financial Sector Reform inIndia
TIME FOR A SECOND WAVE?
Richard Herd, Vincent Koen, Ila Patnaik,Ajay Shah
JEL Classification: D14, E44, E65, G21, G22, G23,G28, H63, H81, K22, K23, N20, Q14
Unclassified ECO/WKP(2011)48 Organisation de Coopération et de Développement Économiques Organisation for Economic Co-operation and Development 26-Jul-2011 ___________________________________________________________________________________________
English - Or. English ECONOMICS DEPARTMENT
FINANCIAL SECTOR REFORM IN INDIA: TIME FOR A SECOND WAVE? ECONOMICS DEPARTMENT WORKING PAPERS No. 879
by Richard Herd, Vincent Koen, Ila Patnaik and Ajay Shah
All Economics Department Working Papers are available through the OECD internet website at www.oecd.org/eco/workingpapers
JT03305453
Document complet disponible sur OLIS dans son format d'origine Complete document available on OLIS in its original format
ECO
/WK
P(2011)48 U
nclassified
English - O
r. English
Cancels & replaces the same document of 01 July 2011
ECO/WKP(2011)48
2
ABSTRACT/RESUMÉ
Financial sector reform in India: time for a second wave?
The Indian financial system has changed considerably since the 1990s. Interest rates have been deregulated and new entrants allowed in the banking and the securities business. The Indian equity market has become world-class. New private banks have emerged that are more customer-oriented than the older state-owned banks. Meanwhile, the scale of saving within the economy has expanded considerably, much as in East Asian economies during their high-growth period. This adds to the need for further financial-sector reform. In particular, banks need much greater freedom in asset allocation. While public-sector banks did appear sounder to the public during the 2007/08 crisis due to implicit government backing, they ought to be privatised to improve their governance and minimise the recurrent need for recapitalisation. The remaining obstacles to new entry have to be reduced. Financial inclusion is an important priority and restrictions on microfinance should be avoided. The regulatory and legal framework also needs to be overhauled, consolidating the diverse legislation. While such reforms would improve financial sector efficiency they would also likely have positive spillover effects on the rest of the economy and help sustain rapid growth. This Working Paper relates to the 2011 OECD Economic Survey of India (www.oecd.org/eco/surveys/india)
JEL Classification: D14, E44, E65, G21, G22, G23, G28, H63, H81, K22, K23, N20, Q14.
Keywords: bank privatisation; bank recapitalisation; financial sector reform; financial inclusion; financial regulation; India; interest rates; microfinance; private banks; public-sector banks.
**************************************
Le système financier indien : l’heure d’une deuxième vague de réformes a-t-elle sonné ?
Le système financier indien a considérablement changé depuis les années 90. Les taux d'intérêt ont été déréglementés et de nouveaux acteurs ont été autorisés dans le secteur bancaire et celui des opérations de marché et de titres. Le marché d'actions indien est de classe internationale. De nouvelles banques privées sont apparues, plus axées sur la satisfaction du client que les banques publiques plus anciennes. Par ailleurs, l'épargne intérieure a connu une expansion considérable, très similaire à celle qu'avaient connue les économies d'Asie de l'Est pendant leur période de forte croissance. Cela renforce la nécessité de nouvelles réformes du secteur financier. Les banques doivent notamment disposer d'une latitude nettement plus grande en matière de répartition de leurs actifs. Si les banques du secteur public ont paru plus solides au public lors de la crise de 2007/08, en raison de la garantie implicite de l'État dont elles bénéficiaient, il convient de les privatiser afin d'améliorer leur gouvernance et de minimiser la nécessité récurrente de les recapitaliser. Les obstacles à l'entrée de nouveaux acteurs qui subsistent doivent être réduits. L'inclusion financière revêt une importance prioritaire et les restrictions relatives à la microfinance devraient être évitées. Il est également nécessaire de remettre à plat le cadre législatif et réglementaire, en consolidant les différentes dispositions juridiques en vigueur. De telles réformes permettraient des gains d'efficience dans le secteur financier et auraient sans doute des effets d'entraînement positifs sur le reste de l'économie, contribuant ainsi à entretenir une croissance rapide. Ce Document de travail se rapporte à l'Etude économique de l'OCDE de l’Inde 2011 (www.oecd.org/eco/etudes/inde)
Classification JEL : D14, E44, E65, G21, G22, G23, G28, H63, H81, K22, K23, N20, Q14.
Mots-clés : privatisations bancaires; recapitalisations bancaires; réformes du secteur financier; inclusion financière; régulation financière; Inde; taux d’intérêt; microfinance; banques privées; banques du secteur public.
Copyright OECD 2011. Application for permission to reproduce or translate all, or part of, this material should be made to: Head of Publications Service, OECD, 2 rue André-Pascal, 75775 Paris CEDEX 16, France.
ECO/WKP(2011)48
3
TABLE OF CONTENTS
ABSTRACT/RESUMÉ .................................................................................................................................. 2
FINANCIAL SECTOR REFORM IN INDIA: TIME FOR A SECOND WAVE? ................................. 5
Credit markets ............................................................................................................................................ 6 The banking sector ..................................................................................................................................... 7
The impact of deregulation on the sector ............................................................................................. 9 Balance sheet quality ............................................................................................................................. 9 Meeting Basel III capital adequacy regulations ................................................................................. 11 Resolving weak banks ......................................................................................................................... 14 Constraints facing the banking system ............................................................................................... 15 New entry policies................................................................................................................................ 20 Rural co-operative credit societies ...................................................................................................... 21 Microfinance ......................................................................................................................................... 22 Mobile phone banking ......................................................................................................................... 24
Securities markets .................................................................................................................................... 25 Equities ................................................................................................................................................. 25 Bonds .................................................................................................................................................... 26 Asset management ............................................................................................................................... 27 Legal and regulatory arrangements ..................................................................................................... 29
Conclusions .............................................................................................................................................. 32
Bibliography ................................................................................................................................................ 34
Tables
1. Saving and investment rates ............................................................................................................ 5 2. Simulated impact of increases in non-performing assets on the performance of banks ......... 10 3. Capital adequacy ........................................................................................................................... 12 4. Various capital adequacy ratios: an international comparison ...................................................... 12 5. Recapitalisation of public-sector banks ......................................................................................... 14
Figures
1. National saving rates in India and selected East Asian economies ................................................ 6 2. Structure of the credit market .......................................................................................................... 6 3. Concentration of domestically controlled bank assets and the share of private banks ....... 7 4. Share of private banks in total bank assets ...................................................................................... 8 5. Bank credit to the private sector: international comparison ............................................................ 8 6. Gross and net non-performing loans: international comparison ................................................ 10 7. The cumulative distribution of the capital adequacy of domestic Indian banks ............................ 13 8. Direct bank lending to the agricultural sector ............................................................................... 18 9. Estimated margin between small savings and money market interest rates .................................. 19 10. Credit swap spreads for the largest private and public-sector banks ............................................. 20 11. Stock exchange turnover in the cash market ................................................................................. 26 12. Government bond turnover: an international comparison ............................................................. 26

ECO/WKP(2011)48
4
Boxes
Box 1. The evolution of development banks ........................................................................................... 7 Box 2. Areas of lending included in the priority sectors ....................................................................... 16 Box 3. Financial market regulatory institutions in India ...................................................................... 30 Box 4. Summary of recommendations for financial reform ................................................................. 33
ECO/WKP(2011)48
5
FINANCIAL SECTOR REFORM IN INDIA: TIME FOR A SECOND WAVE?
Richard Herd, Vincent Koen, Ila Patnaik and Ajay Shah1
A strong and efficient financial sector is essential for the optimal allocation of capital not just in advanced economies but also in emerging market economies, especially in fast-growing ones. India’s financial sector has undergone major reforms and a remarkable transformation since the 1990s but, in many respects, it still reflects the institutional set-up that was put in place when India was run as a directed economy. This paper looks at the extent and impact of the reforms so far before considering where further institutional, legal and regulatory changes are needed.
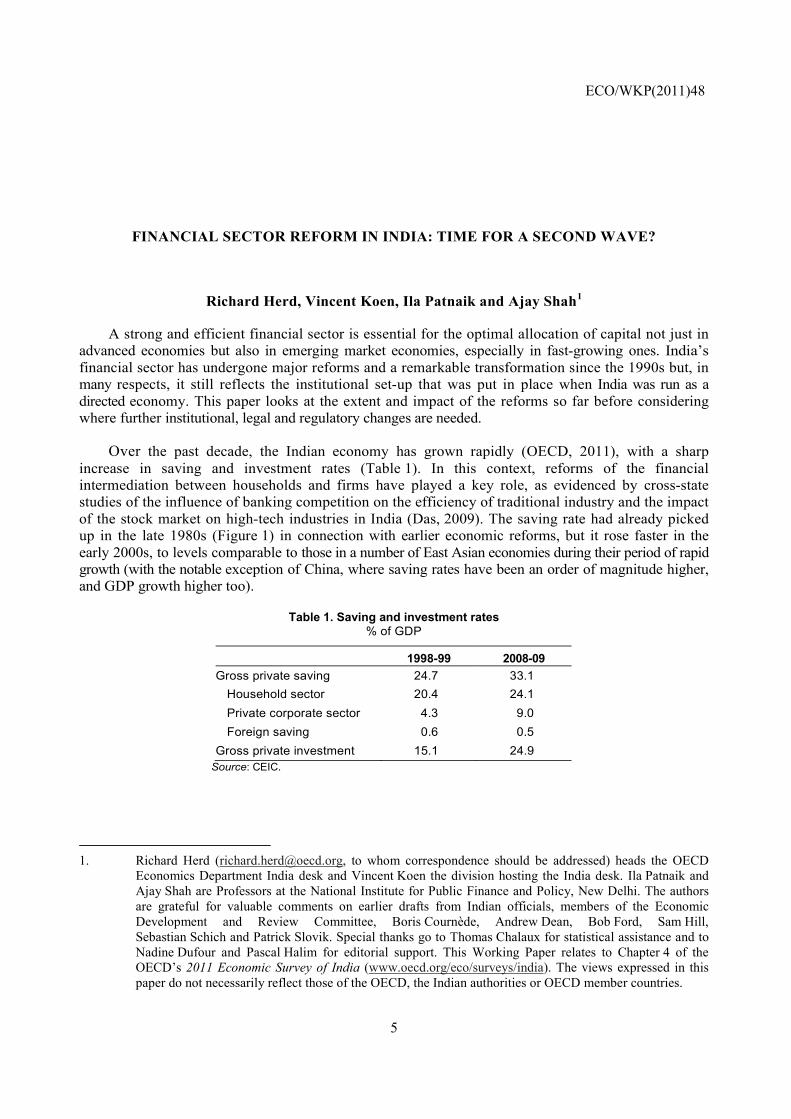
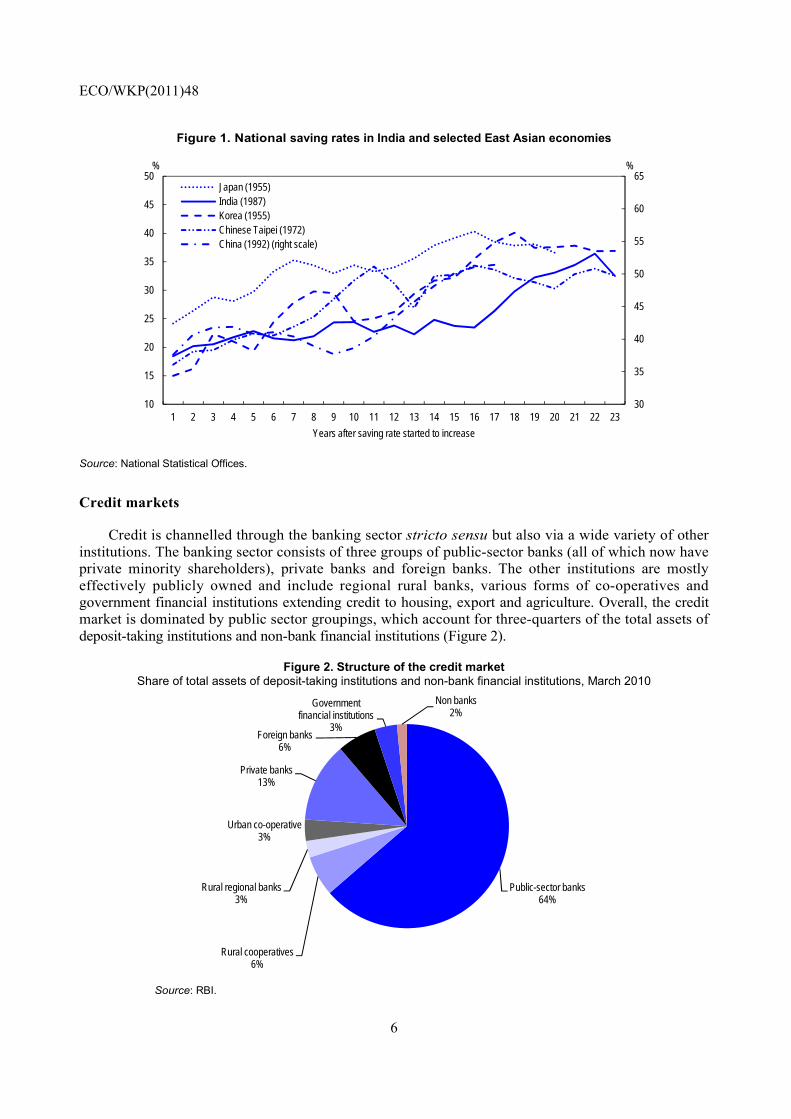
Over the past decade, the Indian economy has grown rapidly (OECD, 2011), with a sharp increase in saving and investment rates (Table 1). In this context, reforms of the financial intermediation between households and firms have played a key role, as evidenced by cross-state studies of the influence of banking competition on the efficiency of traditional industry and the impact of the stock market on high-tech industries in India (Das, 2009). The saving rate had already picked up in the late 1980s (Figure 1) in connection with earlier economic reforms, but it rose faster in the early 2000s, to levels comparable to those in a number of East Asian economies during their period of rapid growth (with the notable exception of China, where saving rates have been an order of magnitude higher, and GDP growth higher too).
Table 1. Saving and investment rates % of GDP
1998-99 2008-09 Gross private saving 24.7 33.1
Household sector 20.4 24.1 Private corporate sector 4.3 9.0 Foreign saving 0.6 0.5
Gross private investment 15.1 24.9 Source: CEIC.
1. Richard Herd ([email protected], to whom correspondence should be addressed) heads the OECD
Economics Department India desk and Vincent Koen the division hosting the India desk. Ila Patnaik and Ajay Shah are Professors at the National Institute for Public Finance and Policy, New Delhi. The authors are grateful for valuable comments on earlier drafts from Indian officials, members of the Economic Development and Review Committee, Boris Cournède, Andrew Dean, Bob Ford, Sam Hill, Sebastian Schich and Patrick Slovik. Special thanks go to Thomas Chalaux for statistical assistance and to Nadine Dufour and Pascal Halim for editorial support. This Working Paper relates to Chapter 4 of the OECD’s 2011 Economic Survey of India (www.oecd.org/eco/surveys/india). The views expressed in this paper do not necessarily reflect those of the OECD, the Indian authorities or OECD member countries.
ECO/WKP(2011)48
6
Figure 1. National saving rates in India and selected East Asian economies
30
35
40
45
50
55
60
65
10
15
20
25
30
35
40
45
50
1 2 3 4 5 6 7 8 9 10 11 12 13 14 15 16 17 18 19 20 21 22 23
%%
Years after saving rate started to increase
Japan (1955)India (1987)Korea (1955)Chinese Taipei (1972)China (1992) (right scale)
Source: National Statistical Offices.
Credit markets
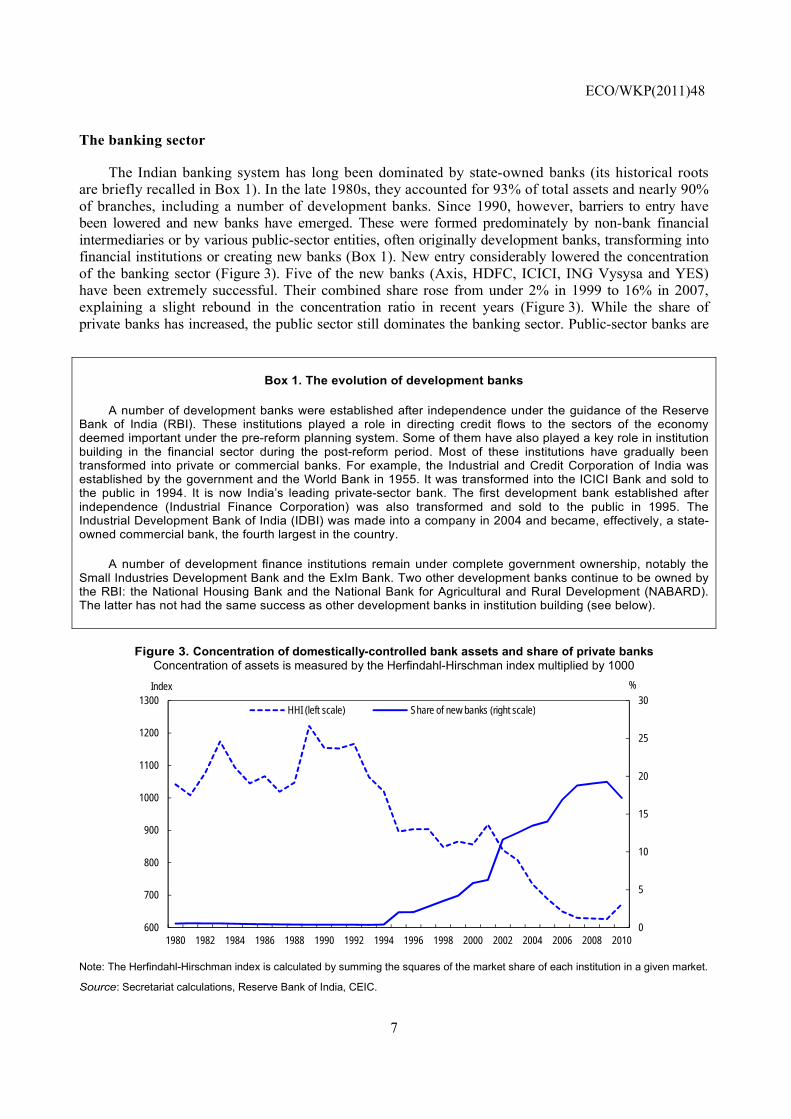
Credit is channelled through the banking sector stricto sensu but also via a wide variety of other institutions. The banking sector consists of three groups of public-sector banks (all of which now have private minority shareholders), private banks and foreign banks. The other institutions are mostly effectively publicly owned and include regional rural banks, various forms of co-operatives and government financial institutions extending credit to housing, export and agriculture. Overall, the credit market is dominated by public sector groupings, which account for three-quarters of the total assets of deposit-taking institutions and non-bank financial institutions (Figure 2).
Figure 2. Structure of the credit market Share of total assets of deposit-taking institutions and non-bank financial institutions, March 2010
Public-sector banks64%
Rural cooperatives 6%
Rural regional banks 3%
Urban co-operative3%
Private banks13%
Foreign banks6%
Government financial institutions
3%
Non banks2%
Source: RBI.
ECO/WKP(2011)48
7
The banking sector
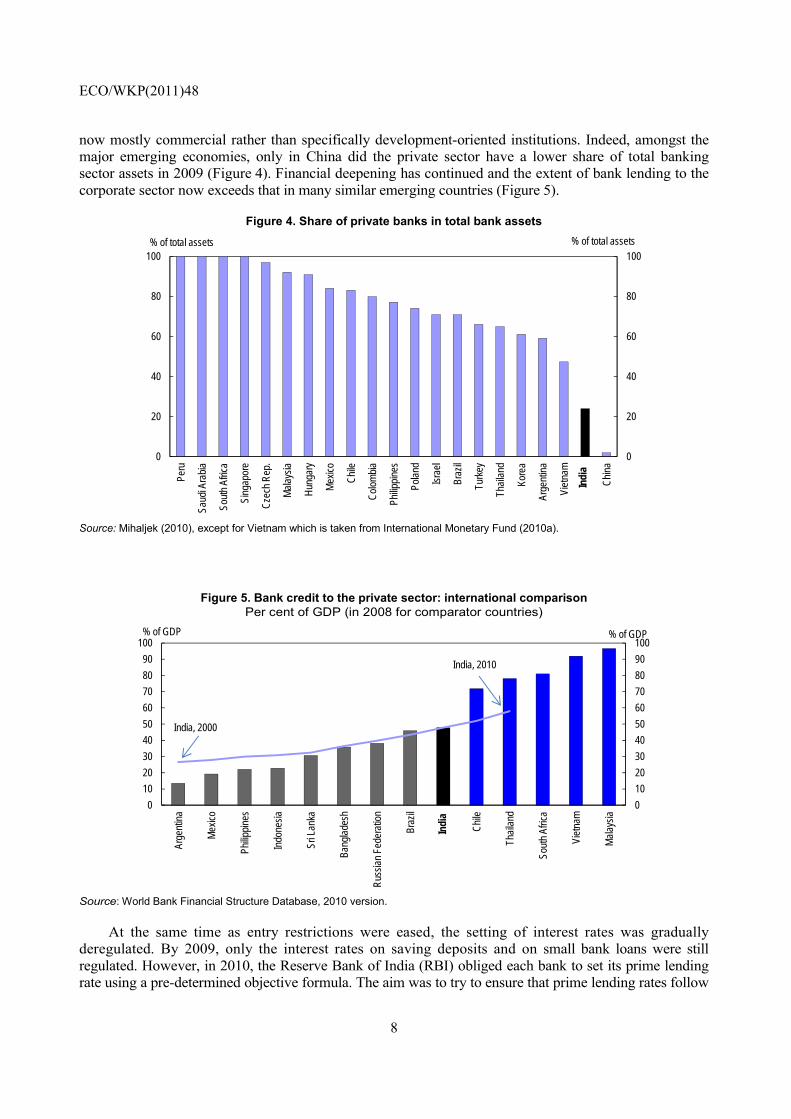
The Indian banking system has long been dominated by state-owned banks (its historical roots are briefly recalled in Box 1). In the late 1980s, they accounted for 93% of total assets and nearly 90% of branches, including a number of development banks. Since 1990, however, barriers to entry have been lowered and new banks have emerged. These were formed predominately by non-bank financial intermediaries or by various public-sector entities, often originally development banks, transforming into financial institutions or creating new banks (Box 1). New entry considerably lowered the concentration of the banking sector (Figure 3). Five of the new banks (Axis, HDFC, ICICI, ING Vysysa and YES) have been extremely successful. Their combined share rose from under 2% in 1999 to 16% in 2007, explaining a slight rebound in the concentration ratio in recent years (Figure 3). While the share of private banks has increased, the public sector still dominates the banking sector. Public-sector banks are
Box 1. The evolution of development banks
A number of development banks were established after independence under the guidance of the Reserve Bank of India (RBI). These institutions played a role in directing credit flows to the sectors of the economy deemed important under the pre-reform planning system. Some of them have also played a key role in institution building in the financial sector during the post-reform period. Most of these institutions have gradually been transformed into private or commercial banks. For example, the Industrial and Credit Corporation of India was established by the government and the World Bank in 1955. It was transformed into the ICICI Bank and sold to the public in 1994. It is now India’s leading private-sector bank. The first development bank established after independence (Industrial Finance Corporation) was also transformed and sold to the public in 1995. The Industrial Development Bank of India (IDBI) was made into a company in 2004 and became, effectively, a state-owned commercial bank, the fourth largest in the country.
A number of development finance institutions remain under complete government ownership, notably the Small Industries Development Bank and the ExIm Bank. Two other development banks continue to be owned by the RBI: the National Housing Bank and the National Bank for Agricultural and Rural Development (NABARD). The latter has not had the same success as other development banks in institution building (see below).
Figure 3. Concentration of domestically-controlled bank assets and share of private banks Concentration of assets is measured by the Herfindahl-Hirschman index multiplied by 1000
0
5
10
15
20
25
30
600
700
800
900
1000
1100
1200
1300
1980 1982 1984 1986 1988 1990 1992 1994 1996 1998 2000 2002 2004 2006 2008 2010
%Index
HHI (left scale) Share of new banks (right scale)
Note: The Herfindahl-Hirschman index is calculated by summing the squares of the market share of each institution in a given market.
Source: Secretariat calculations, Reserve Bank of India, CEIC.
ECO/WKP(2011)48
8
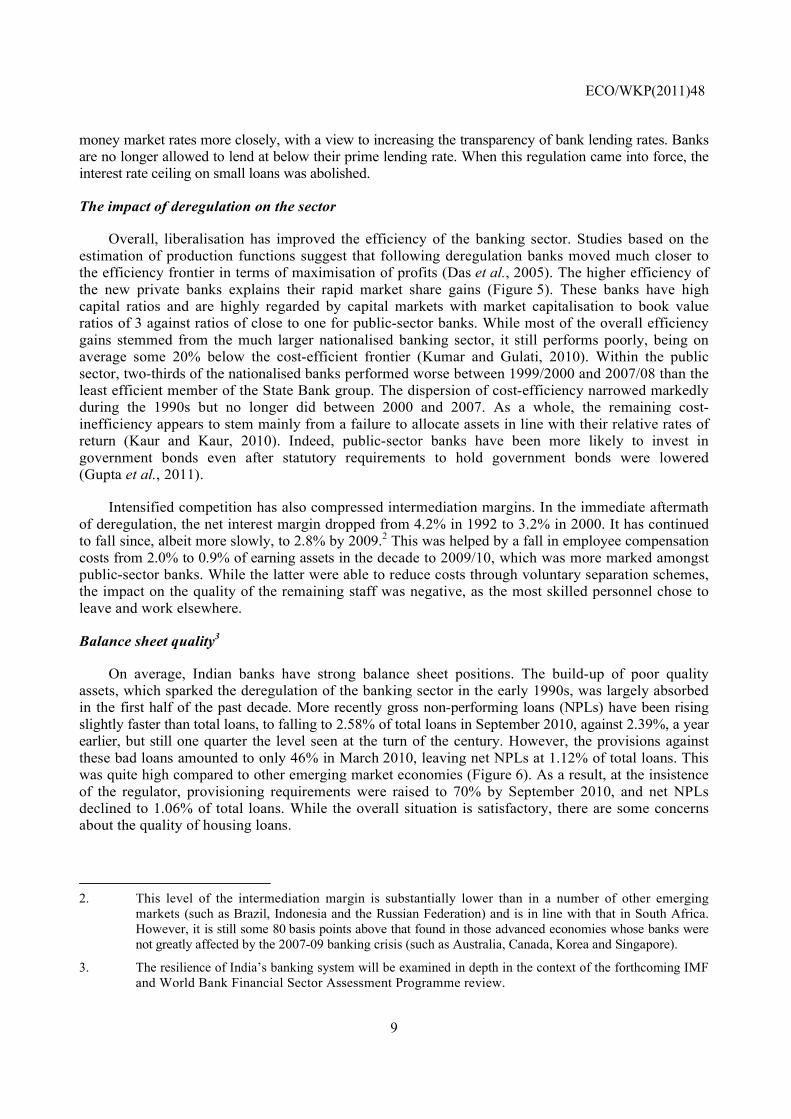
now mostly commercial rather than specifically development-oriented institutions. Indeed, amongst the major emerging economies, only in China did the private sector have a lower share of total banking sector assets in 2009 (Figure 4). Financial deepening has continued and the extent of bank lending to the corporate sector now exceeds that in many similar emerging countries (Figure 5).
Figure 4. Share of private banks in total bank assets
0
20
40
60
80
100
0
20
40
60
80
100
Peru
Saud
i Ara
bia
Sout
h Af
rica
Sing
apor
e
Cze
ch R
ep.
Mal
aysi
a
Hun
gary
Mex
ico
Chi
le
Col
ombi
a
Philip
pine
s
Pola
nd
Isra
el
Braz
il
Turk
ey
Thai
land
Kore
a
Arge
ntin
a
Viet
nam
Chi
na
% of total assets% of total assets
Indi
a
Source: Mihaljek (2010), except for Vietnam which is taken from International Monetary Fund (2010a).
Figure 5. Bank credit to the private sector: international comparison Per cent of GDP (in 2008 for comparator countries)
0
10
20
30
40
50
60
70
80
90
100
0
10
20
30
40
50
60
70
80
90
100
Arge
ntin
a
Mex
ico
Philip
pine
s
Indo
nesi
a
Sri L
anka
Bang
lade
sh
Rus
sian
Fed
erat
ion
Braz
il
Chi
le
Thai
land
Sout
h Af
rica
Viet
nam
Mal
aysi
a
% of GDP% of GDP
India, 2000
India, 2010
Indi
a
Source: World Bank Financial Structure Database, 2010 version.
At the same time as entry restrictions were eased, the setting of interest rates was gradually deregulated. By 2009, only the interest rates on saving deposits and on small bank loans were still regulated. However, in 2010, the Reserve Bank of India (RBI) obliged each bank to set its prime lending rate using a pre-determined objective formula. The aim was to try to ensure that prime lending rates follow
ECO/WKP(2011)48
9
money market rates more closely, with a view to increasing the transparency of bank lending rates. Banks are no longer allowed to lend at below their prime lending rate. When this regulation came into force, the interest rate ceiling on small loans was abolished.
The impact of deregulation on the sector
Overall, liberalisation has improved the efficiency of the banking sector. Studies based on the estimation of production functions suggest that following deregulation banks moved much closer to the efficiency frontier in terms of maximisation of profits (Das et al., 2005). The higher efficiency of the new private banks explains their rapid market share gains (Figure 5). These banks have high capital ratios and are highly regarded by capital markets with market capitalisation to book value ratios of 3 against ratios of close to one for public-sector banks. While most of the overall efficiency gains stemmed from the much larger nationalised banking sector, it still performs poorly, being on average some 20% below the cost-efficient frontier (Kumar and Gulati, 2010). Within the public sector, two-thirds of the nationalised banks performed worse between 1999/2000 and 2007/08 than the least efficient member of the State Bank group. The dispersion of cost-efficiency narrowed markedly during the 1990s but no longer did between 2000 and 2007. As a whole, the remaining cost-inefficiency appears to stem mainly from a failure to allocate assets in line with their relative rates of return (Kaur and Kaur, 2010). Indeed, public-sector banks have been more likely to invest in government bonds even after statutory requirements to hold government bonds were lowered (Gupta et al., 2011).
Intensified competition has also compressed intermediation margins. In the immediate aftermath of deregulation, the net interest margin dropped from 4.2% in 1992 to 3.2% in 2000. It has continued to fall since, albeit more slowly, to 2.8% by 2009.2 This was helped by a fall in employee compensation costs from 2.0% to 0.9% of earning assets in the decade to 2009/10, which was more marked amongst public-sector banks. While the latter were able to reduce costs through voluntary separation schemes, the impact on the quality of the remaining staff was negative, as the most skilled personnel chose to leave and work elsewhere.
Balance sheet quality3
On average, Indian banks have strong balance sheet positions. The build-up of poor quality assets, which sparked the deregulation of the banking sector in the early 1990s, was largely absorbed in the first half of the past decade. More recently gross non-performing loans (NPLs) have been rising slightly faster than total loans, to falling to 2.58% of total loans in September 2010, against 2.39%, a year earlier, but still one quarter the level seen at the turn of the century. However, the provisions against these bad loans amounted to only 46% in March 2010, leaving net NPLs at 1.12% of total loans. This was quite high compared to other emerging market economies (Figure 6). As a result, at the insistence of the regulator, provisioning requirements were raised to 70% by September 2010, and net NPLs declined to 1.06% of total loans. While the overall situation is satisfactory, there are some concerns about the quality of housing loans.
2. This level of the intermediation margin is substantially lower than in a number of other emerging
markets (such as Brazil, Indonesia and the Russian Federation) and is in line with that in South Africa. However, it is still some 80 basis points above that found in those advanced economies whose banks were not greatly affected by the 2007-09 banking crisis (such as Australia, Canada, Korea and Singapore).
3. The resilience of India’s banking system will be examined in depth in the context of the forthcoming IMF and World Bank Financial Sector Assessment Programme review.

ECO/WKP(2011)48
10
Figure 6. Gross and net non-performing loans: international comparison
-4 -2 0 2 4 6 8 10 12
Brazil
China
Thailand
Malaysia
Philippines
Russian Federation
Chile
Indonesia
Per cent of total loans
Net NPL Gross NPLIndia
Note: The data for all countries other than India refers to end 2009. For India, data refers to September 2010.
Source: International Monetary Fund (2010b) and Reserve Bank (2010b).
Stress tests conducted by the RBI in early 2010 (Reserve Bank of India, 2010a) suggested that NPLs would have to soar to pose a major threat to the system as a whole (Table 2). To establish banks’ resilience, the RBI started from a hypothetical baseline balance sheet for the banking system as of March 2010, on the assumption that the absolute amount of NPLs was up by 65% on March 2009, implying a ratio of NPLs to total loans of 3.4%. Then, the RBI tested the impact of further increases in NPLs. This test was undertaken on two bases. In the first, provisioning rates remained unchanged, in the second, they rose to 70%. Given that the latter is now the required provisioning rate, attention is focussed on this scenario. The stress test is mechanical in that it essentially models what happens to profits and equity, following arbitrary increases in NPLs. The stress test reveals the same pattern as the simulation of the impact of introducing Basel III regulations, in that the impact of a 50% increase in NPLs is concentrated on just 10 banks, accounting for only 10.2% of total bank assets. It would take an increase in NPLs of around 135% for half of the banks to be below the prescribed capital adequacy ratio.
Table 2. Simulated impact of increases in non-performing assets on the performance of banks
Gross NPLs gross loans
Capital adequacy
ratio
Share in total assets of banks whose
capital adequacy ratio falls below 9%
(%) (% of risk-weighted assets) (%)
March 2009 2.4 13.2 0.0 March 2010 baseline (65% increase in NPLs) 3.4 12.9 0.3
Stress on baseline: further increase in NPLs by 50% 5.2 11.6 10.2 58% 5.4 11.4 10.7 100% 6.9 10.0 39.9 129% 7.9 9.0 44.6 150% 8.6 8.2 61.6
Source: Reserve Bank of India, Financial Stability Report, March 2010.
ECO/WKP(2011)48
11
A more recent set of RBI stress tests quantifies the impact on capital adequacy and NPL ratios of hypothetical adverse macroeconomic shocks (Reserve Bank of India, 2010b). The RBI concluded that the financial system would be most sensitive to an external shock but that it could withstand a serious economic downturn.
The quality of the equity and liabilities is generally high as few Indian-owned banks have had recourse to hybrid capital, such as perpetual bonds or non-cumulative preference shares. For the system as whole, innovative instruments represent only 5% of Tier 1 capital under Basel II definitions. Few banks have significant exposure to senior debt either. Their liquidity position is also favourable. Few domestic Indian banks resort to the interbank market on a major scale. Only four have a net recourse to the interbank and short-term money market greater than 10%. Two are nationalised banks and the other two successful, well-capitalised private banks that have used the market to expand. Only a few banks rely on large deposits from a limited number of depositors (Reserve Bank of India, 2010a). On the other hand, the urban co-operative banks are vulnerable to a liquidity shock (stemming for example from a run on deposits), which underlines the need for them to improve their capital adequacy ratios, so as to avoid any loss of confidence.
Domestic Indian banks have a relatively small off-balance sheet gross exposure to derivatives and foreign exchange contracts, probably because of limited technical experience and the underdevelopment of credit and interest rate derivatives. The latter form of derivatives now accounts for almost half of the total stock of gross derivatives and the market is dominated by foreign banks. For the largest domestic bank group, the nominal value of such liabilities represents 49% of total liabilities, with a total gross exposure of $150 billion. However, banks hold asset positions that are broadly similar to their liability positions. Moreover, the market value of the net derivatives position is only a fraction of the gross amount. Thus, for domestic banks as a whole their credit equivalent amounts to only about 0.5% of total assets. The greatest exposure of domestic banks is found in a few rapidly-growing private banks. Foreign banks are far more exposed. Just six of them, with only 1.6% of total assets, account for one-third of the total derivative exposure of all Indian banks. The notional value of their stock of derivatives (at $1 trillion) amounted to 31 times their total assets, a ratio that is similar to that found amongst large US banks where the gross value of derivative positions can represent nearly 40 times the value of on-balance sheet assets.
Meeting Basel III capital adequacy regulations
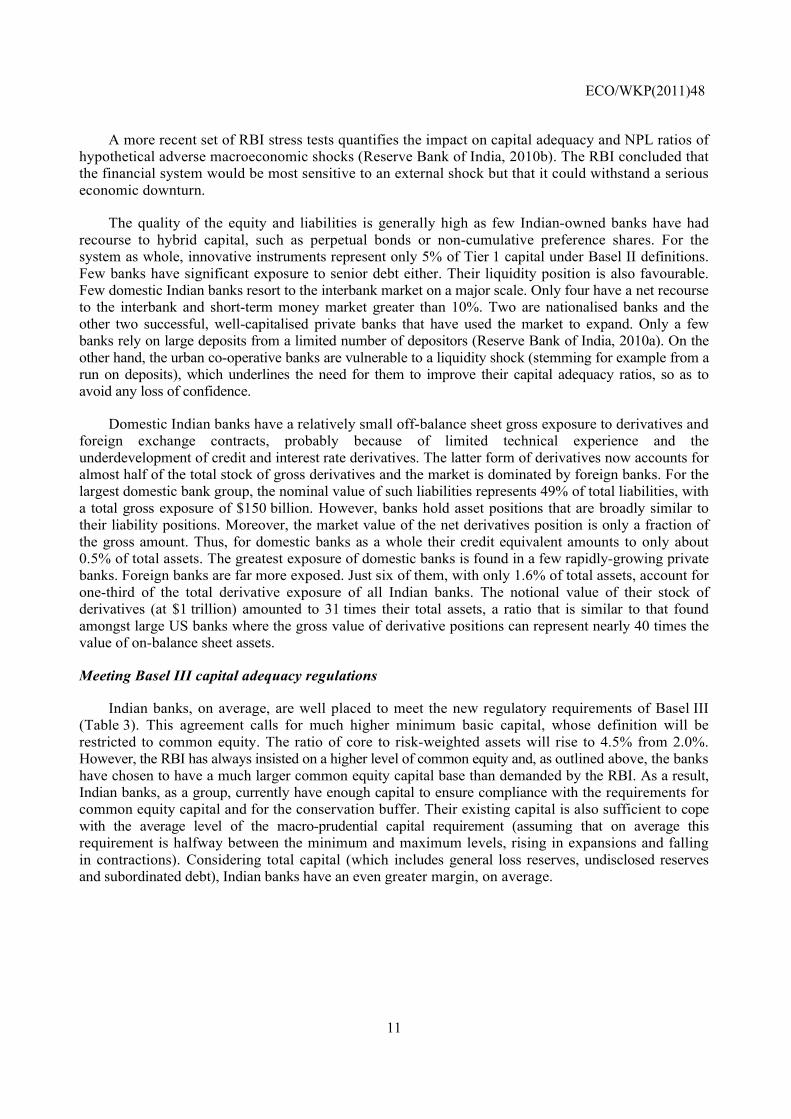
Indian banks, on average, are well placed to meet the new regulatory requirements of Basel III (Table 3). This agreement calls for much higher minimum basic capital, whose definition will be restricted to common equity. The ratio of core to risk-weighted assets will rise to 4.5% from 2.0%. However, the RBI has always insisted on a higher level of common equity and, as outlined above, the banks have chosen to have a much larger common equity capital base than demanded by the RBI. As a result, Indian banks, as a group, currently have enough capital to ensure compliance with the requirements for common equity capital and for the conservation buffer. Their existing capital is also sufficient to cope with the average level of the macro-prudential capital requirement (assuming that on average this requirement is halfway between the minimum and maximum levels, rising in expansions and falling in contractions). Considering total capital (which includes general loss reserves, undisclosed reserves and subordinated debt), Indian banks have an even greater margin, on average.
ECO/WKP(2011)48
12
Table 3. Capital adequacy
Norm Existing
RBI standard
Basel III standard
Actual as of 31st March
2010 % of risk-weighted assets Common equity (after deductions) 3.6 4.5 8.8 Conservation buffer 0.0 2.5 - Countercyclical buffer (on average) 0.0 1.25 - Common equity + conservation buffer + countercyclical buffer 3.6 8.25 8.8 Tier 1 (including the buffer) 6.0 9.75 10.0 Total capital (including the buffers) 9.0 11.75 14.5
Source: ICRA (2010).
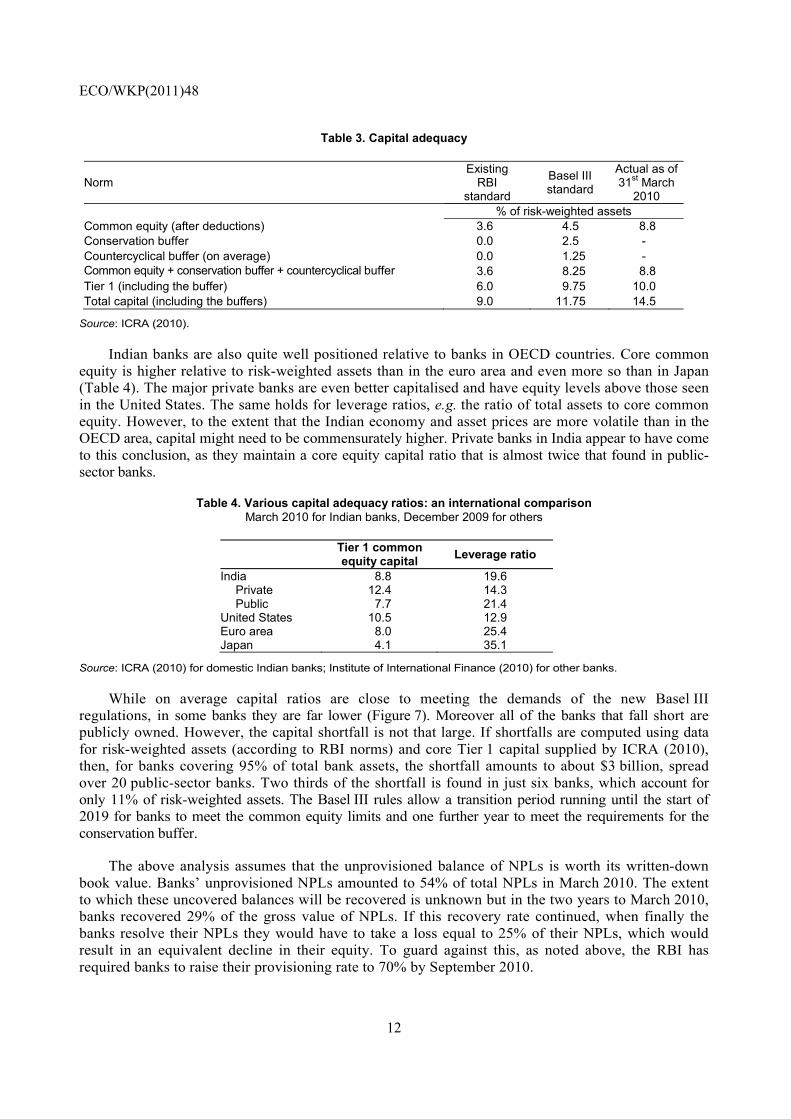
Indian banks are also quite well positioned relative to banks in OECD countries. Core common equity is higher relative to risk-weighted assets than in the euro area and even more so than in Japan (Table 4). The major private banks are even better capitalised and have equity levels above those seen in the United States. The same holds for leverage ratios, e.g. the ratio of total assets to core common equity. However, to the extent that the Indian economy and asset prices are more volatile than in the OECD area, capital might need to be commensurately higher. Private banks in India appear to have come to this conclusion, as they maintain a core equity capital ratio that is almost twice that found in public-sector banks.
Table 4. Various capital adequacy ratios: an international comparison March 2010 for Indian banks, December 2009 for others
Tier 1 common equity capital Leverage ratio
India 8.8 19.6 Private 12.4 14.3 Public 7.7 21.4
United States 10.5 12.9 Euro area 8.0 25.4 Japan 4.1 35.1
Source: ICRA (2010) for domestic Indian banks; Institute of International Finance (2010) for other banks.
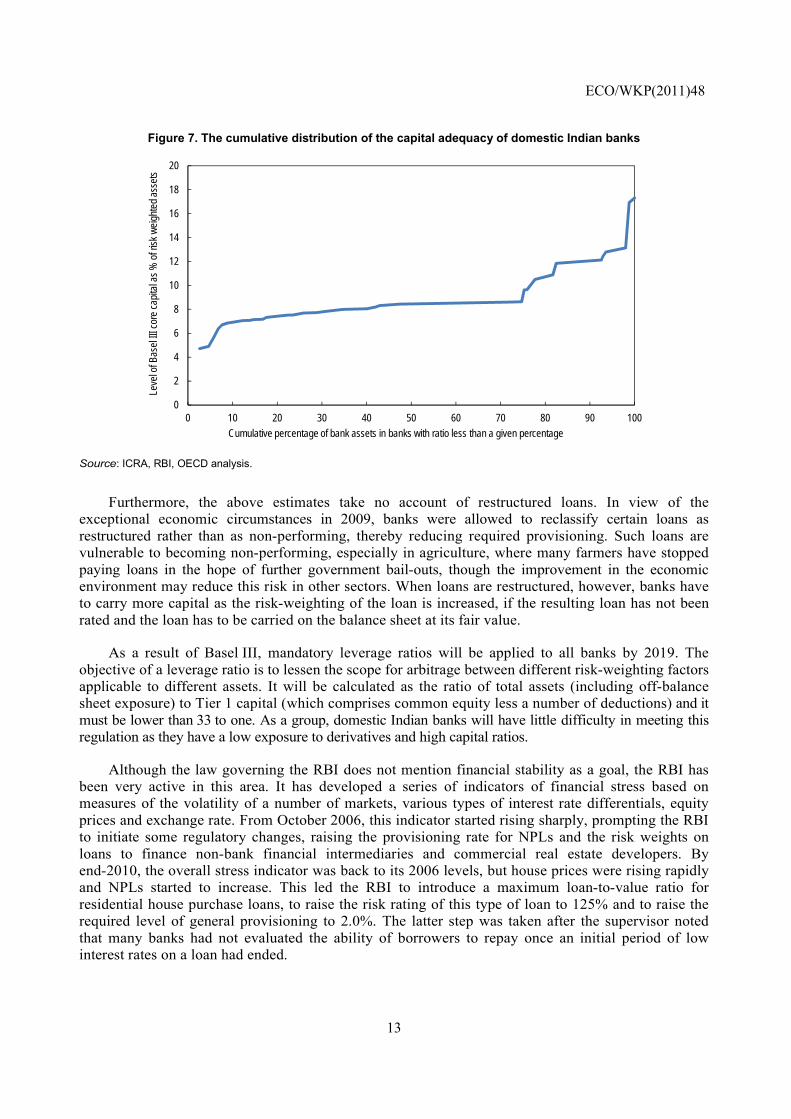
While on average capital ratios are close to meeting the demands of the new Basel III regulations, in some banks they are far lower (Figure 7). Moreover all of the banks that fall short are publicly owned. However, the capital shortfall is not that large. If shortfalls are computed using data for risk-weighted assets (according to RBI norms) and core Tier 1 capital supplied by ICRA (2010), then, for banks covering 95% of total bank assets, the shortfall amounts to about $3 billion, spread over 20 public-sector banks. Two thirds of the shortfall is found in just six banks, which account for only 11% of risk-weighted assets. The Basel III rules allow a transition period running until the start of 2019 for banks to meet the common equity limits and one further year to meet the requirements for the conservation buffer.
The above analysis assumes that the unprovisioned balance of NPLs is worth its written-down book value. Banks’ unprovisioned NPLs amounted to 54% of total NPLs in March 2010. The extent to which these uncovered balances will be recovered is unknown but in the two years to March 2010, banks recovered 29% of the gross value of NPLs. If this recovery rate continued, when finally the banks resolve their NPLs they would have to take a loss equal to 25% of their NPLs, which would result in an equivalent decline in their equity. To guard against this, as noted above, the RBI has required banks to raise their provisioning rate to 70% by September 2010.
ECO/WKP(2011)48
13
Figure 7. The cumulative distribution of the capital adequacy of domestic Indian banks
0
2
4
6
8
10
12
14
16
18
20
0 10 20 30 40 50 60 70 80 90 100
Leve
l of B
asel
III c
ore
capi
tal a
s %
of r
isk
wei
ghte
d as
sets
Cumulative percentage of bank assets in banks with ratio less than a given percentage
Source: ICRA, RBI, OECD analysis.
Furthermore, the above estimates take no account of restructured loans. In view of the exceptional economic circumstances in 2009, banks were allowed to reclassify certain loans as restructured rather than as non-performing, thereby reducing required provisioning. Such loans are vulnerable to becoming non-performing, especially in agriculture, where many farmers have stopped paying loans in the hope of further government bail-outs, though the improvement in the economic environment may reduce this risk in other sectors. When loans are restructured, however, banks have to carry more capital as the risk-weighting of the loan is increased, if the resulting loan has not been rated and the loan has to be carried on the balance sheet at its fair value.
As a result of Basel III, mandatory leverage ratios will be applied to all banks by 2019. The objective of a leverage ratio is to lessen the scope for arbitrage between different risk-weighting factors applicable to different assets. It will be calculated as the ratio of total assets (including off-balance sheet exposure) to Tier 1 capital (which comprises common equity less a number of deductions) and it must be lower than 33 to one. As a group, domestic Indian banks will have little difficulty in meeting this regulation as they have a low exposure to derivatives and high capital ratios.
Although the law governing the RBI does not mention financial stability as a goal, the RBI has been very active in this area. It has developed a series of indicators of financial stress based on measures of the volatility of a number of markets, various types of interest rate differentials, equity prices and exchange rate. From October 2006, this indicator started rising sharply, prompting the RBI to initiate some regulatory changes, raising the provisioning rate for NPLs and the risk weights on loans to finance non-bank financial intermediaries and commercial real estate developers. By end-2010, the overall stress indicator was back to its 2006 levels, but house prices were rising rapidly and NPLs started to increase. This led the RBI to introduce a maximum loan-to-value ratio for residential house purchase loans, to raise the risk rating of this type of loan to 125% and to raise the required level of general provisioning to 2.0%. The latter step was taken after the supervisor noted that many banks had not evaluated the ability of borrowers to repay once an initial period of low interest rates on a loan had ended.
ECO/WKP(2011)48
14
Resolving weak banks
Following the liberalisation of the banking system, some banks became too weak to continue to take deposits and were absorbed by stronger ones, sometimes voluntarily but mostly under instructions from the government and the RBI. Most of the absorbing banks were owned by the government but with significant private shareholding. Event studies show that even though the possibility of forced mergers had been anticipated, the share prices of the absorbing banks fell on the day of the announcement of the terms of merger (Jayadev and Sensarma, 2007). This suggests that minority private shareholders suffered a levy as the result of the forced merger. Supporting this finding, a comparison of the efficiency of Indian banks pre and post merger indicates that in forced mergers the acquiring bank has usually been weakened by the merger (Kaur and Kaur, 2010).
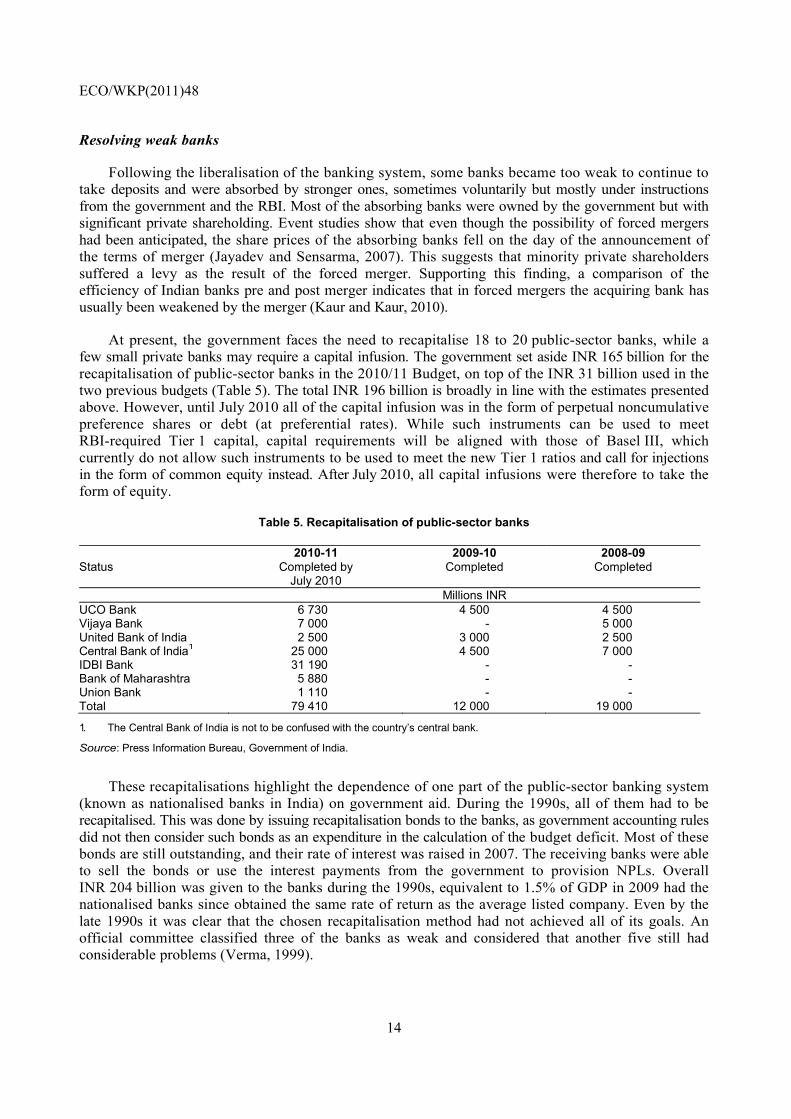
At present, the government faces the need to recapitalise 18 to 20 public-sector banks, while a few small private banks may require a capital infusion. The government set aside INR 165 billion for the recapitalisation of public-sector banks in the 2010/11 Budget, on top of the INR 31 billion used in the two previous budgets (Table 5). The total INR 196 billion is broadly in line with the estimates presented above. However, until July 2010 all of the capital infusion was in the form of perpetual noncumulative preference shares or debt (at preferential rates). While such instruments can be used to meet RBI-required Tier 1 capital, capital requirements will be aligned with those of Basel III, which currently do not allow such instruments to be used to meet the new Tier 1 ratios and call for injections in the form of common equity instead. After July 2010, all capital infusions were therefore to take the form of equity.
Table 5. Recapitalisation of public-sector banks
Status 2010-11
Completed by July 2010
2009-10Completed
2008-09 Completed
Millions INR UCO Bank 6 730 4 500 4 500 Vijaya Bank 7 000 - 5 000 United Bank of India 2 500 3 000 2 500 Central Bank of India1 25 000 4 500 7 000 IDBI Bank 31 190 - - Bank of Maharashtra 5 880 - - Union Bank 1 110 - - Total 79 410 12 000 19 000
1. The Central Bank of India is not to be confused with the country’s central bank.
Source: Press Information Bureau, Government of India.
These recapitalisations highlight the dependence of one part of the public-sector banking system (known as nationalised banks in India) on government aid. During the 1990s, all of them had to be recapitalised. This was done by issuing recapitalisation bonds to the banks, as government accounting rules did not then consider such bonds as an expenditure in the calculation of the budget deficit. Most of these bonds are still outstanding, and their rate of interest was raised in 2007. The receiving banks were able to sell the bonds or use the interest payments from the government to provision NPLs. Overall INR 204 billion was given to the banks during the 1990s, equivalent to 1.5% of GDP in 2009 had the nationalised banks since obtained the same rate of return as the average listed company. Even by the late 1990s it was clear that the chosen recapitalisation method had not achieved all of its goals. An official committee classified three of the banks as weak and considered that another five still had considerable problems (Verma, 1999).
ECO/WKP(2011)48
15
Today, the nationalised banks that require the biggest capital infusions relative to current market capitalisation are essentially the very ones that received considerable public support in the early 1990s and were still classified as in poor health in 1999. The government can either provide the equity itself, by increasing the level of state ownership and so going against the opening of the capital that has occurred in the past decade or by selling equity to the market. The problem with the latter route is that existing legislation forbids the government share falling below 51% and the margin between the existing government share and 51% will often not provide sufficient capital.
There have been previous efforts to reduce the government stake in the nationalised banks. The Committee on Banking Sector Reforms recommended to bring it down to 33%, together with other incentives to make them more dynamic (Narasimham, 1998). The 2000 Budget proposed such a measure but in the face of strong opposition from the unions it was not implemented. It is high time to push it through now and to go further by completely selling smaller public-sector banks in line with the Rajan Committee (2009) recommendations. The recent performance of these banks, however, suggests that in addition the government should become a passive shareholder and let private shareholders run these banks. Moreover, restrictions on the voting rights of large shareholders need to be removed, so that ownership can equate with control. In principle, the status of the employees should also be changed. At present, they are effectively civil servants. There is a uniform entrance examination and pay follows the recommendations of the Pay Commission. Moreover, poor lending decisions are subject to review by Ministers and the Central Vigilance Commission (an anti-corruption body). Such a situation creates an unduly bureaucratic structure. Reduction in the government share should also apply to the State Bank of India. At Independence, its colonial precursor (The Imperial Bank) was ten times larger than another colonial bank (HSBC). Today, the former is one-tenth the size of the latter.
A reform that would be limited to reducing the government shareholdings to one-third would be insufficient, however. Corporate governance needs to be improved so that the directors and chief executive are appointed by the shareholders and not the government. Public-sector banks, with reduced government holding, should no longer be governed by social objectives. Moreover, the employees of the nationalised banks should have the same employment status as those in private banks.
The need to increase the capital of the nationalised banks offers an opportunity to move away from a government-controlled system. According to the author of a government report on creating an international financial centre in Mumbai, “state-ownership (along with prolonged regulatory strangulation) has diminished the quality of Indian financial intermediation. It is responsible for the large institutional and market deformities that the Indian financial system now possesses. Areas of the financial system in which the State is predominant as owner (e.g. banking) are the areas in which financial firms and markets are least efficient, most poorly managed, most bureaucratic, most overstaffed, and least-well compensated, so creating too much room for petty malfeasance. They are also the areas in which Indian financial firms are the most technologically backward, least customer-orientated, least imaginative, least competitive, least innovative, and least prone to proper risk-management of their brands, human resources, financial capital, as well as their assets and liabilities” (Mistry, 2007).
Constraints facing the banking system
Branch opening policy
The banking system in India operates under a large number of constraints. The RBI has powers to control the management actions of banks that go well beyond the need for financial supervision. The banks must submit annual business plans to the RBI with, inter alia, the number of branches and
ECO/WKP(2011)48
16
automatic teller machines (ATMs) that they are going to open and their location. The RBI has the power to decide where the banks open branches. Before deregulation, it was necessary for banks to open four rural branches for every new urban branch. After deregulation, this ratio was reduced to one for one. These restrictions were eased in 2010 but restrictions on opening banks in areas with a population of 50 000 or more remain in place. Moreover, the restrictions are not just nation-wide, the RBI also decides the number of branches each bank shall have in each area. Banks are allowed to have smaller offices in shopping centres, for example, but the RBI restricts these offices to deposit taking. Banks are required to obtain a license to open a branch and permission is required to sell or exchange branches with other banks. The RBI now allows banks to install ATMs in locations separate from their branches without prior permission, but reserves the right to make banks move the ATMs once it knows where they have been installed. Only banks are allowed to own ATMs. In addition, the RBI determines the maximum amount that a client of one bank can withdraw from all third-party banks. It also determines the fees that all banks can charge their client for withdrawals.
Portfolio management
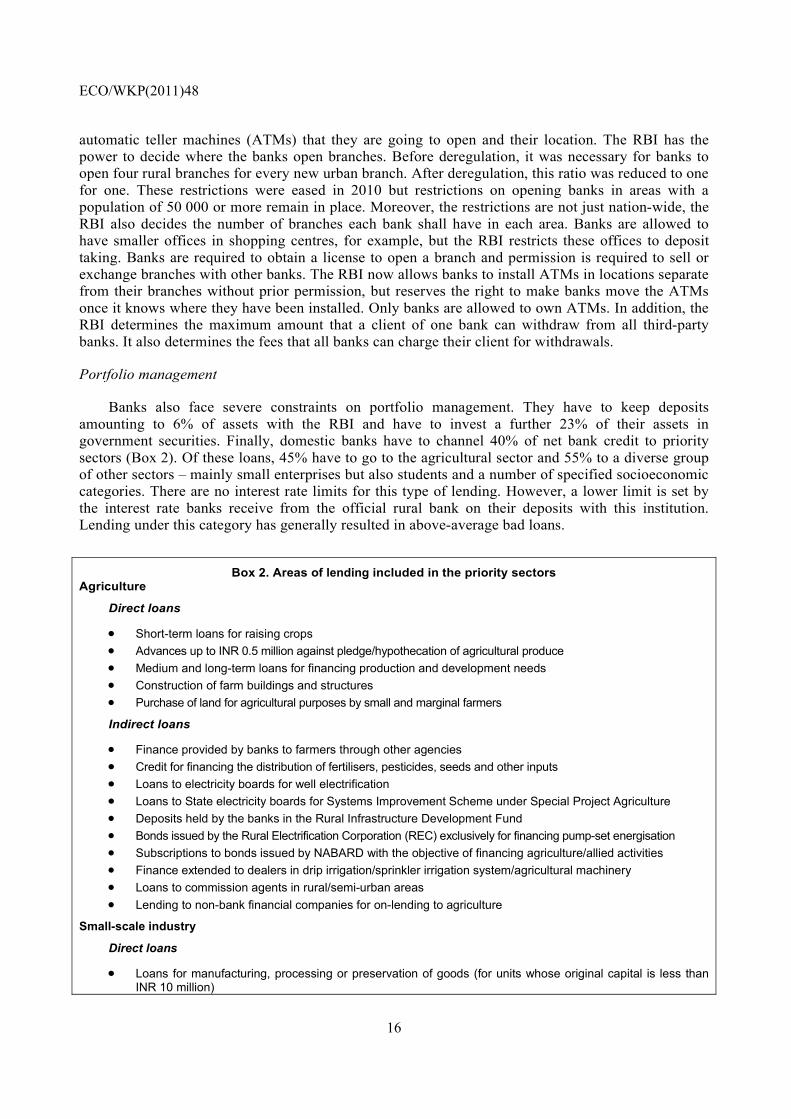
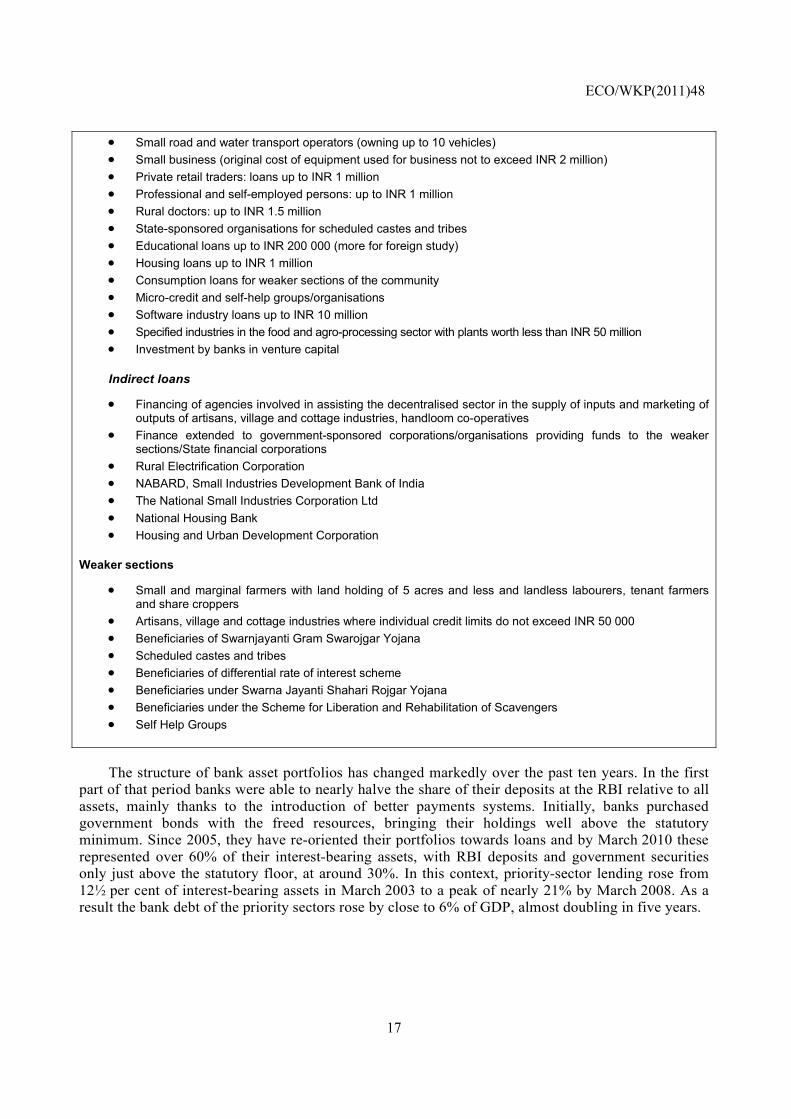
Banks also face severe constraints on portfolio management. They have to keep deposits amounting to 6% of assets with the RBI and have to invest a further 23% of their assets in government securities. Finally, domestic banks have to channel 40% of net bank credit to priority sectors (Box 2). Of these loans, 45% have to go to the agricultural sector and 55% to a diverse group of other sectors – mainly small enterprises but also students and a number of specified socioeconomic categories. There are no interest rate limits for this type of lending. However, a lower limit is set by the interest rate banks receive from the official rural bank on their deposits with this institution. Lending under this category has generally resulted in above-average bad loans.
Box 2. Areas of lending included in the priority sectors Agriculture
Direct loans
• Short-term loans for raising crops • Advances up to INR 0.5 million against pledge/hypothecation of agricultural produce • Medium and long-term loans for financing production and development needs • Construction of farm buildings and structures • Purchase of land for agricultural purposes by small and marginal farmers
Indirect loans
• Finance provided by banks to farmers through other agencies • Credit for financing the distribution of fertilisers, pesticides, seeds and other inputs • Loans to electricity boards for well electrification • Loans to State electricity boards for Systems Improvement Scheme under Special Project Agriculture • Deposits held by the banks in the Rural Infrastructure Development Fund • Bonds issued by the Rural Electrification Corporation (REC) exclusively for financing pump-set energisation • Subscriptions to bonds issued by NABARD with the objective of financing agriculture/allied activities • Finance extended to dealers in drip irrigation/sprinkler irrigation system/agricultural machinery • Loans to commission agents in rural/semi-urban areas • Lending to non-bank financial companies for on-lending to agriculture
Small-scale industry
Direct loans
• Loans for manufacturing, processing or preservation of goods (for units whose original capital is less than INR 10 million)
ECO/WKP(2011)48
17
• Small road and water transport operators (owning up to 10 vehicles) • Small business (original cost of equipment used for business not to exceed INR 2 million) • Private retail traders: loans up to INR 1 million • Professional and self-employed persons: up to INR 1 million • Rural doctors: up to INR 1.5 million • State-sponsored organisations for scheduled castes and tribes • Educational loans up to INR 200 000 (more for foreign study) • Housing loans up to INR 1 million • Consumption loans for weaker sections of the community • Micro-credit and self-help groups/organisations • Software industry loans up to INR 10 million • Specified industries in the food and agro-processing sector with plants worth less than INR 50 million • Investment by banks in venture capital
Indirect loans
• Financing of agencies involved in assisting the decentralised sector in the supply of inputs and marketing of outputs of artisans, village and cottage industries, handloom co-operatives
• Finance extended to government-sponsored corporations/organisations providing funds to the weaker sections/State financial corporations
• Rural Electrification Corporation • NABARD, Small Industries Development Bank of India • The National Small Industries Corporation Ltd • National Housing Bank • Housing and Urban Development Corporation
Weaker sections
• Small and marginal farmers with land holding of 5 acres and less and landless labourers, tenant farmers and share croppers
• Artisans, village and cottage industries where individual credit limits do not exceed INR 50 000 • Beneficiaries of Swarnjayanti Gram Swarojgar Yojana • Scheduled castes and tribes • Beneficiaries of differential rate of interest scheme • Beneficiaries under Swarna Jayanti Shahari Rojgar Yojana • Beneficiaries under the Scheme for Liberation and Rehabilitation of Scavengers • Self Help Groups
The structure of bank asset portfolios has changed markedly over the past ten years. In the first part of that period banks were able to nearly halve the share of their deposits at the RBI relative to all assets, mainly thanks to the introduction of better payments systems. Initially, banks purchased government bonds with the freed resources, bringing their holdings well above the statutory minimum. Since 2005, they have re-oriented their portfolios towards loans and by March 2010 these represented over 60% of their interest-bearing assets, with RBI deposits and government securities only just above the statutory floor, at around 30%. In this context, priority-sector lending rose from 12½ per cent of interest-bearing assets in March 2003 to a peak of nearly 21% by March 2008. As a result the bank debt of the priority sectors rose by close to 6% of GDP, almost doubling in five years.
ECO/WKP(2011)48
18
Agriculture as a target for lending
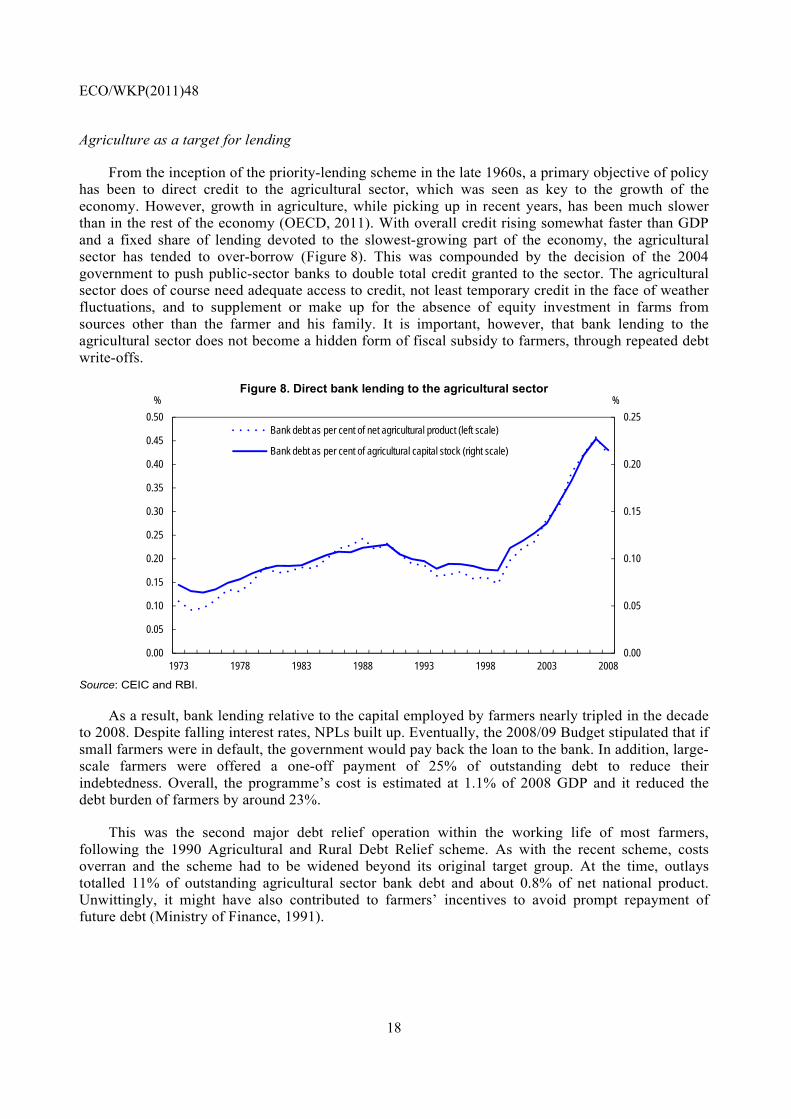
From the inception of the priority-lending scheme in the late 1960s, a primary objective of policy has been to direct credit to the agricultural sector, which was seen as key to the growth of the economy. However, growth in agriculture, while picking up in recent years, has been much slower than in the rest of the economy (OECD, 2011). With overall credit rising somewhat faster than GDP and a fixed share of lending devoted to the slowest-growing part of the economy, the agricultural sector has tended to over-borrow (Figure 8). This was compounded by the decision of the 2004 government to push public-sector banks to double total credit granted to the sector. The agricultural sector does of course need adequate access to credit, not least temporary credit in the face of weather fluctuations, and to supplement or make up for the absence of equity investment in farms from sources other than the farmer and his family. It is important, however, that bank lending to the agricultural sector does not become a hidden form of fiscal subsidy to farmers, through repeated debt write-offs.
Figure 8. Direct bank lending to the agricultural sector
0.00
0.05
0.10
0.15
0.20
0.25
0.00
0.05
0.10
0.15
0.20
0.25
0.30
0.35
0.40
0.45
0.50
1973 1978 1983 1988 1993 1998 2003 2008
%%
Bank debt as per cent of net agricultural product (left scale)
Bank debt as per cent of agricultural capital stock (right scale)
Source: CEIC and RBI.
As a result, bank lending relative to the capital employed by farmers nearly tripled in the decade to 2008. Despite falling interest rates, NPLs built up. Eventually, the 2008/09 Budget stipulated that if small farmers were in default, the government would pay back the loan to the bank. In addition, large-scale farmers were offered a one-off payment of 25% of outstanding debt to reduce their indebtedness. Overall, the programme’s cost is estimated at 1.1% of 2008 GDP and it reduced the debt burden of farmers by around 23%.
This was the second major debt relief operation within the working life of most farmers, following the 1990 Agricultural and Rural Debt Relief scheme. As with the recent scheme, costs overran and the scheme had to be widened beyond its original target group. At the time, outlays totalled 11% of outstanding agricultural sector bank debt and about 0.8% of net national product. Unwittingly, it might have also contributed to farmers’ incentives to avoid prompt repayment of future debt (Ministry of Finance, 1991).
ECO/WKP(2011)48
19
Administered interest rates
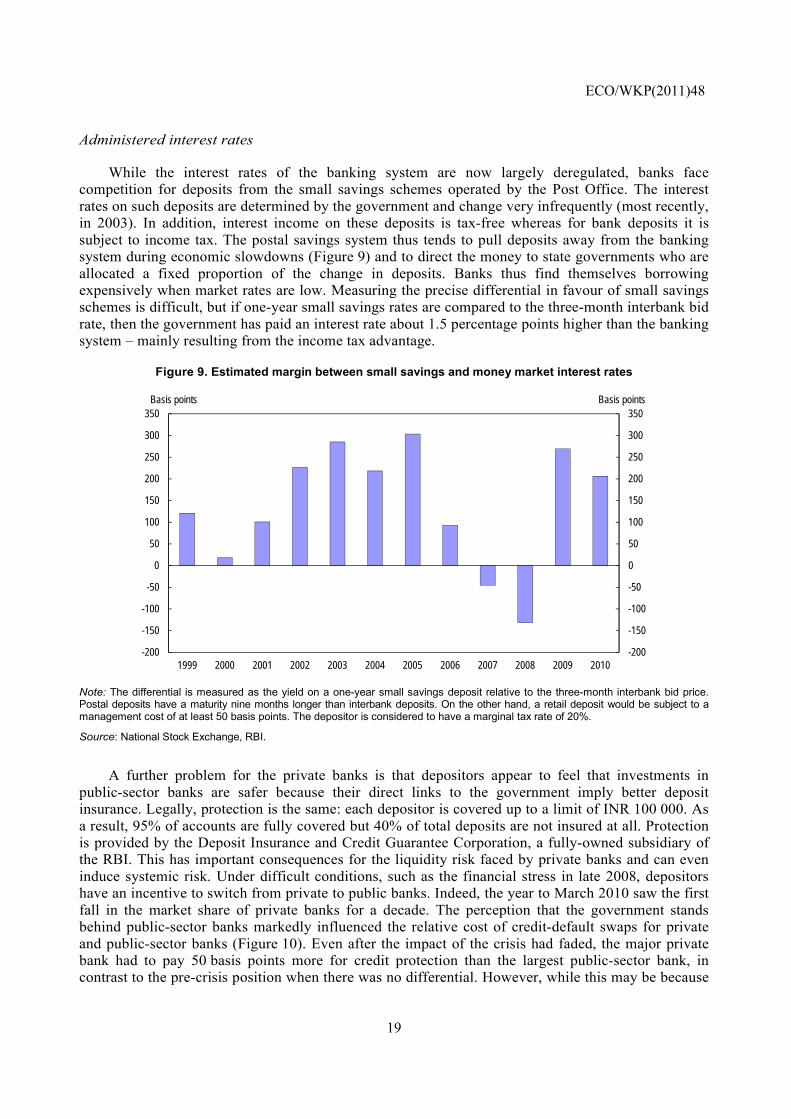
While the interest rates of the banking system are now largely deregulated, banks face competition for deposits from the small savings schemes operated by the Post Office. The interest rates on such deposits are determined by the government and change very infrequently (most recently, in 2003). In addition, interest income on these deposits is tax-free whereas for bank deposits it is subject to income tax. The postal savings system thus tends to pull deposits away from the banking system during economic slowdowns (Figure 9) and to direct the money to state governments who are allocated a fixed proportion of the change in deposits. Banks thus find themselves borrowing expensively when market rates are low. Measuring the precise differential in favour of small savings schemes is difficult, but if one-year small savings rates are compared to the three-month interbank bid rate, then the government has paid an interest rate about 1.5 percentage points higher than the banking system – mainly resulting from the income tax advantage.
Figure 9. Estimated margin between small savings and money market interest rates
-200
-150
-100
-50
0
50
100
150
200
250
300
350
-200
-150
-100
-50
0
50
100
150
200
250
300
350
1999 2000 2001 2002 2003 2004 2005 2006 2007 2008 2009 2010
Basis pointsBasis points
Note: The differential is measured as the yield on a one-year small savings deposit relative to the three-month interbank bid price. Postal deposits have a maturity nine months longer than interbank deposits. On the other hand, a retail deposit would be subject to a management cost of at least 50 basis points. The depositor is considered to have a marginal tax rate of 20%.
Source: National Stock Exchange, RBI.
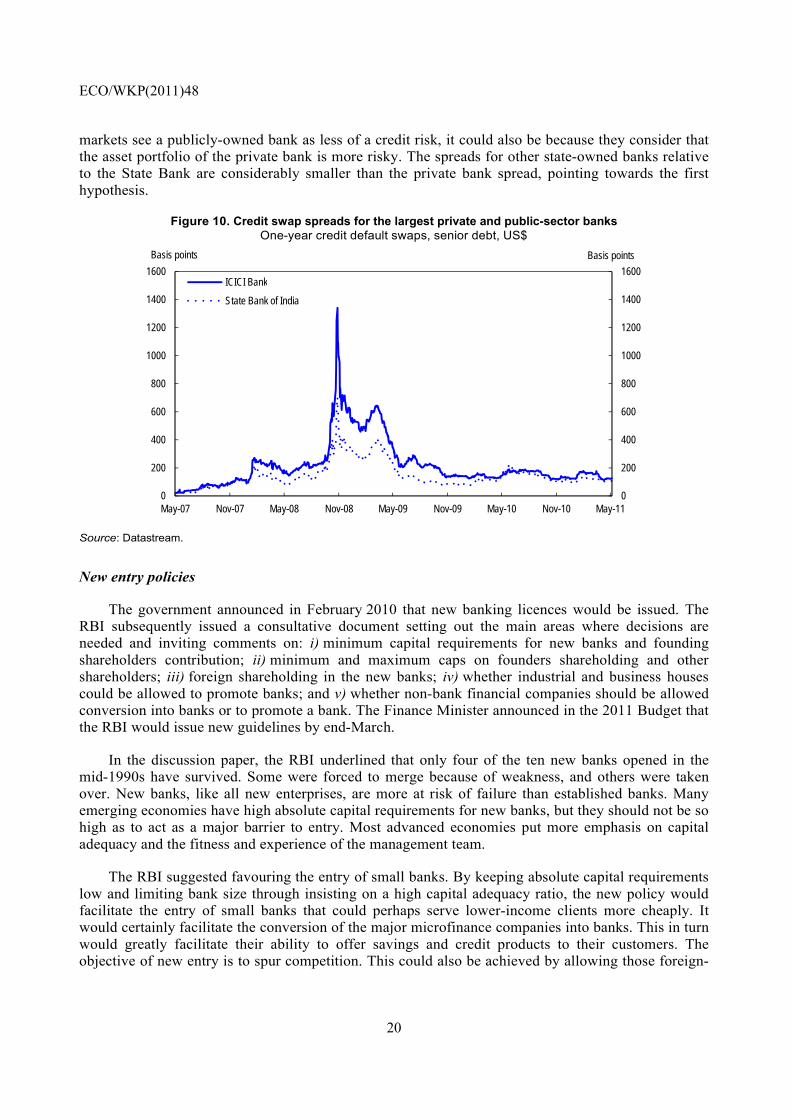
A further problem for the private banks is that depositors appear to feel that investments in public-sector banks are safer because their direct links to the government imply better deposit insurance. Legally, protection is the same: each depositor is covered up to a limit of INR 100 000. As a result, 95% of accounts are fully covered but 40% of total deposits are not insured at all. Protection is provided by the Deposit Insurance and Credit Guarantee Corporation, a fully-owned subsidiary of the RBI. This has important consequences for the liquidity risk faced by private banks and can even induce systemic risk. Under difficult conditions, such as the financial stress in late 2008, depositors have an incentive to switch from private to public banks. Indeed, the year to March 2010 saw the first fall in the market share of private banks for a decade. The perception that the government stands behind public-sector banks markedly influenced the relative cost of credit-default swaps for private and public-sector banks (Figure 10). Even after the impact of the crisis had faded, the major private bank had to pay 50 basis points more for credit protection than the largest public-sector bank, in contrast to the pre-crisis position when there was no differential. However, while this may be because
ECO/WKP(2011)48
20
markets see a publicly-owned bank as less of a credit risk, it could also be because they consider that the asset portfolio of the private bank is more risky. The spreads for other state-owned banks relative to the State Bank are considerably smaller than the private bank spread, pointing towards the first hypothesis.
Figure 10. Credit swap spreads for the largest private and public-sector banks One-year credit default swaps, senior debt, US$
0
200
400
600
800
1000
1200
1400
1600
0
200
400
600
800
1000
1200
1400
1600
May-07 Nov-07 May-08 Nov-08 May-09 Nov-09 May-10 Nov-10 May-11
Basis pointsBasis points
ICICI Bank
State Bank of India
Source: Datastream.
New entry policies
The government announced in February 2010 that new banking licences would be issued. The RBI subsequently issued a consultative document setting out the main areas where decisions are needed and inviting comments on: i) minimum capital requirements for new banks and founding shareholders contribution; ii) minimum and maximum caps on founders shareholding and other shareholders; iii) foreign shareholding in the new banks; iv) whether industrial and business houses could be allowed to promote banks; and v) whether non-bank financial companies should be allowed conversion into banks or to promote a bank. The Finance Minister announced in the 2011 Budget that the RBI would issue new guidelines by end-March.
In the discussion paper, the RBI underlined that only four of the ten new banks opened in the mid-1990s have survived. Some were forced to merge because of weakness, and others were taken over. New banks, like all new enterprises, are more at risk of failure than established banks. Many emerging economies have high absolute capital requirements for new banks, but they should not be so high as to act as a major barrier to entry. Most advanced economies put more emphasis on capital adequacy and the fitness and experience of the management team.
The RBI suggested favouring the entry of small banks. By keeping absolute capital requirements low and limiting bank size through insisting on a high capital adequacy ratio, the new policy would facilitate the entry of small banks that could perhaps serve lower-income clients more cheaply. It would certainly facilitate the conversion of the major microfinance companies into banks. This in turn would greatly facilitate their ability to offer savings and credit products to their customers. The objective of new entry is to spur competition. This could also be achieved by allowing those foreign-
ECO/WKP(2011)48
21
owned banks that are well established in the country to expand freely in those areas that are the most profitable to them. New investment from overseas banks should also be allowed freely.
Since new banks are at greater risk to fail, their creation needs to be accompanied by that of a strong deposit insurance institution and by legislation that levels the playing field between deposits at public-sector and private banks. Furthermore, winding-up methods for failing banks need to change. In the past, exit has involved forbearance followed by a forced merger with a stronger bank. An alternative would be a Deposit Insurance Corporation, independent of the RBI, and with powers to close down banks well before their capital was exhausted. Deposit insurance is well-placed to provide stability where there are a large number of banks with asset portfolios whose returns are not correlated. When a bank becomes very large, though, deposit insurance may not work for lack of adequate resources and the bank ends up being too big to fail in any case. In India, only one or two banks belong to this category.
Rural co-operative credit societies
The co-operative credit system could have played an extremely important role in bringing financial services to the poor and underprivileged across rural India. Its original purpose was to provide a way for village communities to free themselves from moneylenders. However, over time it became heavily dependent on State governments. To quote a 2004 government report “State policy came to be premised on the view that the government should ensure adequate supply of cheap institutional credit to rural areas through co-operatives. The State took responsibility for strengthening the institutions, by infusing additional capital and professional workforce. Both the State and the workforce then began to behave like patrons, rather than as providers of financial services. The State has used co-operatives to channel its development schemes, particularly subsidy-based programmes for the poor. As these institutions have a wide reach in the rural areas and also deal with finances, the choice was natural. The trend, however, also made co-operatives a conduit for distributing political patronage. This and the sheer magnitude of resources and benefits channelled through the societies, makes control of decision-making and management attractive to parties in power, for accommodating their members, to influence decisions through directives, and for individual politicians to be on the management boards of the co-operatives” (Vaidyanathan, 2004).
Following this report, the government embarked on an INR 160 billion ($3.5 billion) programme to restore the viability of these institutions. The major reason behind the decision to inject more money was their sheer reach, with branches in 100 000 villages. Moreover the co-operatives took substantial deposits from villagers that were not covered by deposit insurance. By 2009, 40% of the primary co-operatives had been fully recapitalised. This was a necessary step since these co-operatives were only recovering 60% of the loans they extended, had high overheads and were subject to fraud. The new regime for these co-operatives involves regulation by the RBI, democratic elections by members and installation of new management accounts. Detailed guidelines for accounting have been issued. As yet, these measures have not resulted in a marked improvement of performance. On the contrary, overdue loans rose to 59% of the total by March 2009, up from 36% a year earlier. No doubt the increase was linked to borrowers’ hope that their loans would qualify under the government’s 2008 debt waiver scheme. The higher-level co-operative societies have a better loan portfolio, but deposits with the primary societies are a sizeable part of their assets.
The co-operative sector remains the single most important regulatory and supervisory problem in the banking system. Over 20% of rural co-operative banks failed to meet statutory minimum capital requirements as of June 2010. The solvency ratios of these banks were poor, with 45% having a Tier 1 capital adequacy ratio of less than 6% (using Basel I standards) and eight having negative ratios (Reserve Bank of India, 2010b). This sector suffers from having overlapping regulators with conflicting interests. Regulation is split between the Registrar of Co-operative Societies and the
ECO/WKP(2011)48
22
Central Registrar of Co-operative Societies for management issues. Banking issues are dealt with by the National Agricultural and Rural Development Bank (NABARD) and the RBI. However, the co-operative banks are major clients of the NABARD, which itself is owned by the RBI. A clearer delineation of responsibilities is needed. First, the RBI should sell the NABARD to the government. Secondly, the regulatory and supervisory role should be transferred to the RBI. Finally, the Registrar of Co-operative Societies should only supervise societies with no banking or credit activities.
Regional rural banks (RRBs) were launched in 1975 in order to increase the availability of banking in rural areas. They were established by a sponsoring state-owned commercial bank which held 35% of their capital. The remainder was held by the central government (50%) and the state government in the area the bank served. They quickly expanded and by 1991 there were 196 banks with 14 443 branches. The number of branches and banks remained unchanged until 2005. Following a government decision, the number of banks was reduced to 82 but the number of branches rose to 15 181, with one village in three having a RRB branch. However, the initial expansion resulted in an explosion of bad loans: 40% were non-performing in 1993. While this level of NPLs was progressively lowered, according to the RBI an infusion of INR 29 billion would be needed to ensure a capital adequacy ratio of 9% by 2012. Indeed by September 2010, the sector still counted 14 banks with less than 5% Tier 1 capital as measured by the Basel I standards that are still used to regulate this sector, and seven had a capital adequacy ratio of less than 1%. In this sector, it has proved extremely difficult to align the incentives of politicians, stockholders and policymakers (Bhat and Thorat, 2001). Further progress would probably be easier to achieve if the banks were moved into the private sector.
Microfinance
Despite the incentives offered by the government and financial institutions, the extent to which India’s population uses traditional banking facilities is extremely limited. Only one-third of the population has a bank account and the penetration of bank accounts declines markedly at lower income levels, with only 14% of agricultural labourers having a bank account. This does not reflect a low physical presence on the ground: India has a high density of bank branches relative to other emerging economies. Rather, banking facilities are not used much because the cost of banking transactions is high for low-income groups. This, rather than the availability of banks appears to be the key constraint. Indeed, lower-income groups are as unlikely to have bank accounts in highly banked urban areas as in lightly banked rural areas. From that standpoint, there appears to be little justification for the micro-control over branch openings that the RBI exercises over commercial banks.
The poor, however, do need financial instruments to cope with high income variability. Studies of financial diaries show that low-income groups use various strategies to that effect, nearly all of which involve informal financial activities (Collins et al., 2009). These activities are local in character, with a cost structure that is adapted to the local area rather than based on national salary scales. The traditional provider of finance for the poor is the moneylender. Amongst the lower-income quartile, two-thirds of those who borrow outside the circle of friends and family use moneylenders. While the rates of interest appear high at over 3% per month (Banerjee and Duflo, 2007), the actual return to the moneylender is much lower due to frequent rescheduling of loans (Collins et al., 2009). The bulk of the high lending cost is due to the intense client monitoring needed to ensure that loans are repaid. Similar results are found in Pakistan (Aleem, 1990) and in the “pay-day” money lending business in the United States (Skiba and Tobacman, 2007).
The space between banks and moneylenders has been filled by new financial entities, which in India have taken two forms: self-help groups (SHGs) and micro-finance institutions (MFIs). SHGs are generally founded by civil society groups though many have also been set up by government agencies. On average, SHGs have 11 members (Srinivasan, 2010). They are based on regular saving
ECO/WKP(2011)48
23
by members, which provides the funds for lending to each other. At the same time, the groups can borrow from commercial banks to supplement their resources. The saving pool of the SHG can be used by the sponsor of the SHG when a borrower defaults. MFIs form joint borrowing groups to which borrowers belong. They do not offer saving accounts nor require members to have a saving record before borrowing, in contrast to SHGs. There is no formal joint liability but if one member defaults, no member can obtain any further credit, so repayment is guaranteed by peer pressure. As a result, the largest MFIs had a NPL ratio of only 0.9% in 2010 (SKS, 2010). MFIs do not aim to have a branch in every village but use staff to visit the group of borrowers.
Both SHGs and MFIs are closely linked to the banking system: banks’ lending to them counts towards their priority loan targets (Box 2). Total lending to these two sets of institutions almost quadrupled in the four years to March 2010, with lending to MFIs up by over 20 times. However, total lending to these groups still only represented 0.3% of the total advances of commercial and rural banks. Of the 14 largest MFIs, 13 are regulated by the RBI as non-bank financial companies that are not allowed to take deposits. MFIs have proved to be good clients of commercial banks with low levels of default. However, the performance of lending to SHGs has not been as satisfactory, with a modal recovery rate in the 80%-95% range in 2008/09 and even lower when the loan has come from a public-sector bank. While there are no figures for the default rate of SHGs set up by different institutions, local bankers think that SHGs set up by government agencies are politicised and oriented toward obtaining subsidies and grants (Harper, 2002).
In 2008, MFIs still had only one-third as many clients as SHGs but they were expanding much faster. The loan portfolio of MFIs in 2008 was equivalent to 1.3% of the lending of commercial banks, with 14 million borrowers, about three times the number of active “no frills” banks accounts.4 The cost of borrowing from the commercial MFIs appears to be similar to that from SHGs. In the year to March 2010, the five largest MFIs had an average portfolio yield of 26% and a rate of return on assets of 5% (Rosenberg et al., 2009). The sector is extremely competitive and India now has eight MFIs amongst the world’s top 50 (MIX, 2010). The inability of the MFIs to offer savings accounts, due to RBI regulations, cuts a route for saving that could be another way to improve wealth amongst the poor (Aniket, 2010).
The impact of microfinance appears to fall short of some the poverty-reducing claims that are made for the system. Randomised trials in Andhra Pradesh show little impact of microfinance on development goals such as better health and education and lower poverty – at least over a two-year period (Banerjee et al., 2010). However, such trials do suggest that business formation increases somewhat relative to control groups. Also, the constraint of weekly repayment enables many more borrowers to acquire durable goods, a result consistent with the finding that many consumers in advanced economies make decisions based on hyperbolic discounting (in which events in the far future are discounted at higher rates than those in the near future).
The environment for microfinance has been changing. In 2010, the Andhra Pradesh Parliament passed legislation that gives the government the power to fix interest rates on MFI lending and to determine the repayment schedules of MFI loans, deciding that loans should only be repaid once per month, instead of weekly. Both of these moves may well have an adverse impact on the availability of credit to clients of MFIs. The first could lower the profitability of the institutions while the second seems likely to increase default rates and so to reduce the willingness of companies to grant credit
4. The banks, under pressure from the government, have been trying to develop “no-frills” accounts for low-
income customers and, indeed, had three times as many such accounts as MFIs. However, only 10% of the accounts are actually used – most are dormant and serve merely to demonstrate compliance with government objectives.
ECO/WKP(2011)48
24
(Banerjee and Duflo, 2010). Even a small change, such as allowing a two-week grace period, has been found to increase defaults sufficiently to raise the cost of credit by 9 percentage points.
The new regulations in Andhra Pradesh followed well-publicised incidents where over-indebtedness was allegedly responsible for the suicide of MFI borrowers. Andhra Pradesh has been at the heart of the MFI revolution and the number of accounts was equivalent to one-third of all households, though many households had more than one loan outstanding. The penetration of SHGs is even greater, with as many borrowers as households (Srinivasan, 2010), but this has been aided by a state government scheme that holds the rate of interest on bank loans to SHGs to 3% and so makes groups dependent on the state government. Rather than to subsidise interest rates or impose caps on rates, the government should take steps to lower the risk of over-borrowing. One way to do this would be to promote the development of an adequate credit database like Teletrak in the United States for non-traditional borrowers. Adequate personal bankruptcy laws would also be essential, as a complement to greater credit disclosure. Schools also need to provide more information and training in the interpretation of financial information, so that borrowers are more aware of the costs of borrowing and the advantages of saving (OECD, 2010).
Mobile phone banking
MFIs have greatly increased financial inclusion and further improvements are coming from new technology. Mobile phones can be used to make money transfers and other financial transactions without the need for a physical presence at a bank branch or even without having to own a bank account at all (via the use of so-called mobile wallets). The development of mobile banking has followed two separate directions in emerging markets. These can be characterised as following an additive or transformational model.
In the additive model a bank provides a new interface for an existing to customer to make transactions. The bank controls the technology and the client uses the mobile phone as an alternative means of access to the account and can make a limited range of transactions through the phone. However, cash can only be obtained from bank accounts and transfers can only be made to existing customers of the banking system. This is the route chosen by the RBI for India.
The transformational model involves a telecom company providing what is essentially a money transfer system through its own network, computer system and local agents. The best-known example of such a service is in Kenya where the density of banks is less than one third that in India. The key here is a dense network of agents throughout the country who are able to accept cash from and provide cash to mobile phone owners. The major Kenyan system has 16 000 agents (equivalent to having 500 000 agents in India). The Kenyan system is now used by 40% of the population and half of the users do not have bank accounts. However, only 19% of the households in the lowest quartile of incomes are users against 65% of households in the upper income quartile, and most users are in urban areas.
In India, the major mobile companies are now forming alliances with banks in order to gain access to enter the market. Mobile penetration is high in India and banks are now allowed to have a much wider range of agents than in the past. However, with current regulations, it may be difficult for mobile banking to act as a vehicle for financial inclusion despite plummeting call charges (OECD, 2011) and the fact that, at 31% in December 2010, the penetration rate for mobile phones far outnumbers that of bank account holders (Telecom Regulatory Authority of India, 2010). Given the current absence of identity cards in India, the RBI should consider reducing know-your-customer regulations for people using mobile banking services and allow banking correspondents to open accounts, subject to a low use threshold for such accounts.
ECO/WKP(2011)48
25
Securities markets
Equities
From 1993 to 2001, the Ministry of Finance and the Securities and Exchange Board of India (SEBI) led a strong reform effort aiming at a fundamental transformation of the equity market. The changes were quite dramatic (Shah and Thomas, 2000; Green et al., 2010):
• A new governance model was set up for critical financial infrastructure such as exchanges, depositories and clearing corporations. It involved a three-way separation between shareholders, the management team and member financial firms. These three groups were held distinct in order to avoid conflicts of interest. The shareholders were configured to have an interest in liquid markets rather than to maximise dividends.
• Floor trading was replaced by electronic order books.
• Counterparty credit risk was eliminated through netting at the clearing corporation. This has supported a competitive environment where entry barriers are very low and there is a steady turnover of firms.
• Exchange membership for foreign securities firms was enabled, making it possible for foreign investors to transact through their familiar securities firms.
• Physical share certificates were eliminated through dematerialised settlement at multiple competing depositories.
• Exchange-traded derivatives trading commenced on individual stocks and indexes. The National Stock Exchange (NSE)-50 (Nifty) index became the underlying asset for one of the world’s biggest index derivatives contracts, with onshore trading at NSE, offshore trading at SGX in Singapore and CME in Chicago, and an entirely offshore over-the-counter (OTC) market.
• Asymmetric information problems were reduced through improvements in accounting standards and disclosure.
• The eligibility rules for foreign institutional investors (FIIs) were enlarged through time, so encouraging both foreign capital and a greater variety of views on market conditions.
The Indian equity market has thus taken on a significant role. The combined value of turnover of the National Stock Exchange (NSE) and Bombay Stock Exchange (relative to GDP) is greater than in many middle-income countries (Figure 11), and the derivatives market is even more liquid with the NSE ranking fifth worldwide in terms of the number of contracts traded. Indeed, this is the only global ranking in finance where India is found. In the larger setting of Indian finance, the equity market is the first place where modern finance and financial regulation have taken root. The institutional capabilities and experience associated with these reforms will help in transforming other components of the financial system. For example, in 2008, they served to establish a currency futures market. However, while the stock market is a very efficient allocator of finance for large companies, overall the banking system still provides more than twice as much capital to private corporations as the stock market (and bond borrowing provides only a tiny fraction of firms’ funding).
Equally strikingly, the market is a low-cost operator. The cost per trade paid to the exchange and the clearing operators is only 0.35 basis points, less than one third of the cost of a transaction in the Hong Kong market and lower than any Asian market except Japan. The overall competitiveness of the market is held back, though, by the high, 27 basis points transactions tax. If this tax were abolished, as in Japan, unit costs would likely fall below those in Japan, as turnover would rise significantly.
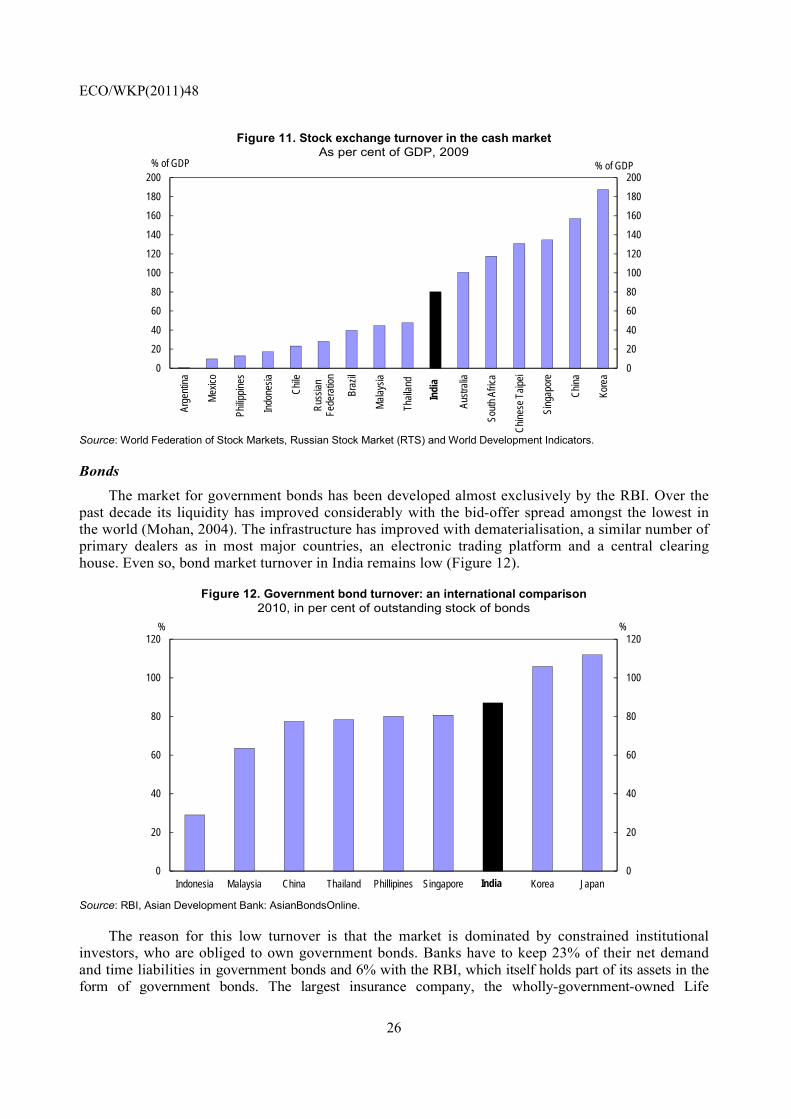
ECO/WKP(2011)48
26
Figure 11. Stock exchange turnover in the cash market As per cent of GDP, 2009
0
20
40
60
80
100
120
140
160
180
200
0
20
40
60
80
100
120
140
160
180
200Ar
gent
ina
Mex
ico
Philip
pine
s
Indo
nesi
a
Chi
le
Rus
sian
Fe
dera
tion
Braz
il
Mal
aysi
a
Thai
land
Aust
ralia
Sout
h Af
rica
Chi
nese
Tai
pei
Sing
apor
e
Chi
na
Kore
a
% of GDP% of GDP
Indi
a
Source: World Federation of Stock Markets, Russian Stock Market (RTS) and World Development Indicators.
Bonds
The market for government bonds has been developed almost exclusively by the RBI. Over the past decade its liquidity has improved considerably with the bid-offer spread amongst the lowest in the world (Mohan, 2004). The infrastructure has improved with dematerialisation, a similar number of primary dealers as in most major countries, an electronic trading platform and a central clearing house. Even so, bond market turnover in India remains low (Figure 12).
Figure 12. Government bond turnover: an international comparison 2010, in per cent of outstanding stock of bonds
0
20
40
60
80
100
120
0
20
40
60
80
100
120
Indonesia Malaysia China Thailand Phillipines Singapore Korea Japan
%%
India Source: RBI, Asian Development Bank: AsianBondsOnline.
The reason for this low turnover is that the market is dominated by constrained institutional investors, who are obliged to own government bonds. Banks have to keep 23% of their net demand and time liabilities in government bonds and 6% with the RBI, which itself holds part of its assets in the form of government bonds. The largest insurance company, the wholly-government-owned Life
ECO/WKP(2011)48
27
Insurance Company of India, must hold at least 50% of its investible funds in government bonds. Overall the constrained holders owned above 80% of the stock of central government debt in March 2010 and public-sector institutions themselves held two-thirds of the outstanding debt. Such owners generally do not trade their securities.
The RBI has now allowed the development of derivative markets for government securities, though foreign investors can only take part if they own the underlying security. Since the introduction of the market in September 2009, turnover has been low, mainly because the underlying government bond market is illiquid, which poses problems for the final settlement of the contracts. The RBI has never allowed cash settlement of bond derivatives, but this policy was reversed in March 2011. This should allow a considerable expansion of the fixed-interest derivative market. The government bond market could be improved notably by developing a term money market; creating a better market-making system and allowing greater short selling. At the same time, low market trading volumes make the market subject to manipulation and excess volatility. The absence of a good range of derivative markets reduced the efficiency of the transmission of monetary policy, so the new measure is a step towards a more fluid market.
The corporate bond market has not developed to its full potential in India. In part this is due to the absence of a fully developed and liquid government bond market. Corporate bonds need a liquid market in government paper to be able to hedge interest rate risks and to price in a rational fashion. At end 2010, the outstanding stock of corporate bonds was only 3.3% of GDP, against 10.6% in China, where the market has developed rapidly since 2007. Moreover, the market is illiquid and suffers from not having standardised issue terms. Steps have been taken to improve the market: SEBI has mandated centralised clearing of corporate bonds and the RBI allows banks to hold corporate bonds from the infrastructure sector on their balance sheet as hold-to-maturity assets. This means they do not have to mark them to their market value every year. In addition, the RBI allowed a CDS market to start in February 2011. However, the scope of the market is extremely limited as only firms that hold the underlying bond are allowed to purchase a CDS on that bond. Dealers in the market are required to have a high capital requirement in order to participate in the market, which is likely to rule out most primary dealers in government bonds. These measures are almost certain to limit the growth of the CDS market in the short term and hence harm the development of a corporate bond market. At present, foreign investors cannot freely purchase corporate bonds due to capital controls. In September 2010, the government raised the limit on the stock of corporate bonds that foreigners could hold by $5 billion to $20 billion. It was raised by a further $20 billion in February 2011, provided that the money is invested in the infrastructure sector. The allocation method chosen for these quotas is not ideal, as it proceeds by administrative action. Rather, the RBI should auction the quotas.
Asset management
India’s asset management industry has three major segments: life insurance, mutual funds and pension funds. Private wealth management, venture capital, private equity funds and hedge funds are relatively small in India. The first three sectors essentially provide the same service to investors: professional management of savings and certain amount of risk management in the case of the life insurance and pension sectors. They are gradually offering the same financial products, but bundled in different fashions and with different tax consequences for the investor. Thus the most rapidly growing part of the life insurance industry is the unit-linked policy business, in which a person saves part of the annual premium in a specified fund. At the end of the contract period, the person receives the exact value of the fund. This type of fund resembles the mutual fund industry in all but name. Finally, the pension industry has two components: the first is within the life insurance sector and the second is the government-controlled National Pension Scheme (NPS). In the latter, the investor can choose in which fund to invest the balance of the account.

ECO/WKP(2011)48
28
Both the life insurance and the mutual fund industry have undergone considerable change over the past 20 years, as they were opened to the private sector. In 2002, the mutual fund sector underwent a crisis when the publicly-owned UTI company was unable to meet the returns it had offered on some guaranteed products. As a result, its dominance ended and by March 2010, the private sector accounted for 78% of mutual fund assets. The total assets under management reached just under 10% of GDP. This is very low even compared with some other emerging economies, for example Brazil, where assets under management by the mutual fund industry are equivalent to 39% of GDP.
The life insurance industry was also opened to private sector participation but not until the turn of the century. Prior to 2000, only one state-owned life insurance company had been allowed. Since then, 22 private companies have entered the market, but by 2010 they still accounted for only 30% of total premium income and just 18% of assets. The private sector was concentrated in the unit-linked business, while the state-owned company had most of its liabilities represented by conventional life insurance contracts offering guaranteed returns. Total assets under management amounted to 14% of GDP for conventional insurance and pensions and a further 5.3% of GDP in unit-linked policies in 2010. Unit-linked policies are mainly owned by individuals and their holdings are now broadly equivalent to the investment of households in the mutual fund industry. Overall, the annual cost of managing these funds is equal to 4.4% of assets under management.
The pension fund industry was reformed in 2004. Until then, the pension fund sector was dominated by the government-run Life Insurance Company of India and the Employee Provident Fund. Since then the government has established the NPS. This fund was initially designed to replace the defined benefit pension scheme for civil servants by a defined contribution scheme, with the obligation to take 40% of the accumulated individual fund as a pension on retirement. By 2010, 22 states had moved their employees to the NPS. Moreover since 2009, it has been open to any individual. Fund members can choose to invest in three funds (equity, government securities, other debt) all of which follow passive investment rules designed, in the case of the equity fund, to replicate the movement of the Mumbai or NSE indices.
The management of the NPS funds is contracted to a number of management companies. Initially they were mostly in the public sector, but subsequently with the widening of possible membership, a number of private sector managers have been approved. The management fees set by the Pension Fund Regulatory and Development Authority (PFRDA) are extremely low, at 0.0009%. Clearly this is inadequate. For example, the management fee for the Thrift Savings Plan, the defined contribution part of the United States federal civil service pension plan, is over 300 times greater, at 2.8 basis points. This management fee (which by international standards is very low) was the outcome of a competitive bidding system, which ought to be adopted for the NPS as well.
The other administrative fees for the NPS while low in the absolute may constitute an initial barrier for those making very small contributions. At the minimum contribution level administrative expenses take 12% of the contribution in the initial years. However, averaged over a full lifetime of contributions, administrative costs may represent an annual charge of just 0.6% of the average assets under management. To overcome the initial costs of joining the NPS the government has introduced the Swavalamban Scheme, under which the central government will contribute INR 1 000 per year to each NPS account opened in 2010/11 and for the next five years. To be eligible, a person will have to make a contribution of between INR 1 000 and INR 12 000 per annum. By February 2011, nearly 0.5 million people had applied for this scheme. However, without mandated, or automatic, contributions it will be difficult to increase membership. Moreover, if the product is sold by the private sector, then costs are likely to rise dramatically.
ECO/WKP(2011)48
29
Looking ahead, a number of improvements could be made to the structure of the NPS. First, the administration and executive control of the NPS should be separated from the regulator of the NPS and other pensions. Second, the trustees of the new organisation should have their fiduciary responsibilities made clear, as with all other trustees. Amongst those with lower incomes, it is possible that contributing to the NPS could be made a condition of access to other more attractive government programmes such as healthcare. In urban areas, consideration could be given to mandating contributions both from the employees of companies in the so-called formal sector and amongst those working for smaller “unorganised” companies. The introduction of the new Pension Fund Regulatory and Development Authority in 2011, necessary since the first bill introduced in 2005 was never voted, offers an opportunity to implement these reforms.
The financial investments in these three sectors are overseen by separate regulators with different approaches. In general terms, the life insurance regulator has been the most generous in terms of the allowable costs and commission charges, while the pension fund regulator has required untenably low investment management fees. The emphasis of the securities regulator has been on reducing the costs to the investor of holding mutual funds. Entry charges have made illegal and a cap of 2¼ per cent has been imposed on management charges, with a separate ceiling for administration and remunerating the promoter of the fund. The impact of these different regulations has been regulatory arbitrage, with fund management companies preferring to sell mutual funds as unit-linked life insurance policies.
The emergence of regulatory arbitrage led to conflict between the securities and the insurance regulator that was finally settled when the Finance Minister gave the insurance regulator jurisdiction over unit-linked policies. Subsequently the insurance regulator ruled that all unit-linked policies must run for a minimum of five years and that annual expenses cannot exceed 4% of assets under management when an investment is made for five years. Clearly, these terms are far more favourable to providers of unit-linked policies than the rules applied to the mutual fund industry. Moreover, the long minimum period of investment can give rise to mis-selling of products. The maximum expenses allowed for unit-linked policies should be aligned with those of the mutual fund sector.
Legal and regulatory arrangements
Many of the laws governing the financial sector have been written decades ago, when the financial landscape was very different from today’s. New legislation has been introduced in recent years such as the 2005 Credit Information Companies Regulation Act, the 2006 Government Securities Act or the 2007 Payment and Settlement Systems Act. However, the need for further changes and for a more far-reaching overhaul of the legislative framework has been evident during the global financial crisis, which also highlighted issues such as the orderly resolution of failing banks and financial institutions, domestically as well as cross-border, home-host regulatory cooperation in information sharing or the convergence of Indian Accounting Standards with the International Financial Reporting Standards. The urgency to review and revamp legislation has been acknowledged and the creation of a Financial Sector Legislation Reforms Commission has been announced, which will report in 2013. The 2011 Budget announced that a number of laws would be modernised in the financial sector in the area of insurance, pensions and factoring. The latter will be an important step forward in the development of trade finance, while the interests of banks will be preserved by establishing a centralised credit register. The budget also proposes the establishment of a Mortgage Risk Guarantee Fund (MRGF), which will lower the credit risk faced by banks when they lend for house purchases by low-income households.
The current regulatory structure for financial markets consists of six bodies (Box 3). They cover banks, securities markets and financial intermediaries. The structure is complex, with overlapping mandates and institutions that in at least one case (the Ministry of Consumer Affairs) are far removed from the financial industry. The securities market is well regulated through SEBI. A noticeable feature of
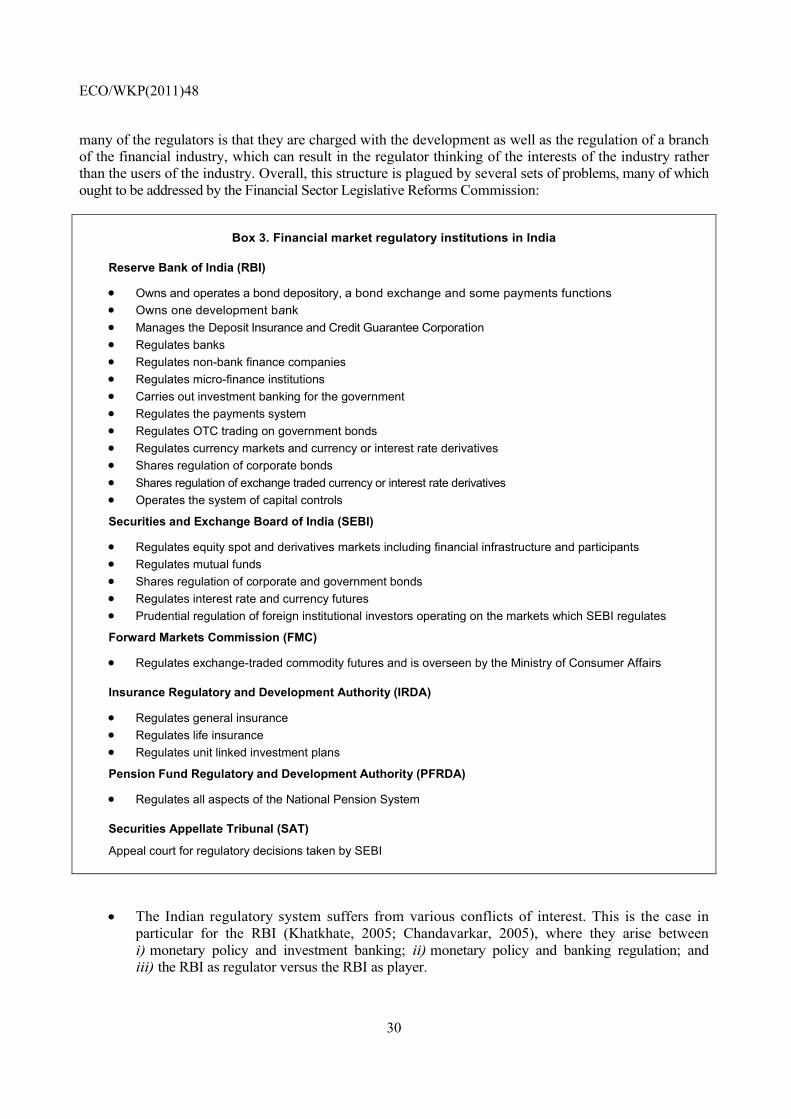
ECO/WKP(2011)48
30
many of the regulators is that they are charged with the development as well as the regulation of a branch of the financial industry, which can result in the regulator thinking of the interests of the industry rather than the users of the industry. Overall, this structure is plagued by several sets of problems, many of which ought to be addressed by the Financial Sector Legislative Reforms Commission:
Box 3. Financial market regulatory institutions in India
Reserve Bank of India (RBI)
• Owns and operates a bond depository, a bond exchange and some payments functions • Owns one development bank • Manages the Deposit Insurance and Credit Guarantee Corporation • Regulates banks • Regulates non-bank finance companies • Regulates micro-finance institutions • Carries out investment banking for the government • Regulates the payments system • Regulates OTC trading on government bonds • Regulates currency markets and currency or interest rate derivatives • Shares regulation of corporate bonds • Shares regulation of exchange traded currency or interest rate derivatives • Operates the system of capital controls
Securities and Exchange Board of India (SEBI)
• Regulates equity spot and derivatives markets including financial infrastructure and participants • Regulates mutual funds • Shares regulation of corporate and government bonds • Regulates interest rate and currency futures • Prudential regulation of foreign institutional investors operating on the markets which SEBI regulates
Forward Markets Commission (FMC)
• Regulates exchange-traded commodity futures and is overseen by the Ministry of Consumer Affairs
Insurance Regulatory and Development Authority (IRDA)
• Regulates general insurance • Regulates life insurance • Regulates unit linked investment plans
Pension Fund Regulatory and Development Authority (PFRDA)
• Regulates all aspects of the National Pension System
Securities Appellate Tribunal (SAT)
Appeal court for regulatory decisions taken by SEBI
• The Indian regulatory system suffers from various conflicts of interest. This is the case in particular for the RBI (Khatkhate, 2005; Chandavarkar, 2005), where they arise between i) monetary policy and investment banking; ii) monetary policy and banking regulation; and iii) the RBI as regulator versus the RBI as player.
ECO/WKP(2011)48
31
• Organised financial trading is regulated by the SEBI, the RBI and the Forward Markets Commission (FMC). This leads to inefficient partitioning within private financial firms as they have to create corporate structures that match the regulatory environment; for instance, a brokerage firm operating on the stock market (where it is subject to SEBI regulation) is forced to create a separate subsidiary to trade on commodity futures markets (FMC regulation) and another one to be a primary dealer (which involves an engagement with the RBI).
• When the financial system was dominated by public-sector firms which were seen as an extension of government, formal legal aspects of the regulatory process were neglected. Today, a modern legal process should involve: i) drafting subordinated legislation with public consultation and transparency so as to avoid mistakes and reduce legal risk; ii) respect of due process through a quasi-judicial process; iii) reasoned rulings placed in the public domain; iv) an appeals procedure at a specialised court, leading to the development of case law in the common law tradition; and v) full transparency of all aspects of the legal process through the web. The RBI handles bank supervision as well as the regular functions of a central bank. There are arguments for separating these functions. Central banks can face a conflict between the need to control inflation and the need to maintain financial stability (and when they manage government debt, there may be a conflict between the need to minimise borrowing costs and the need to control inflation). On the other hand, in the case of separate banking supervisors, co-ordination problems may arise between the supervisor, the central bank and the fiscal authorities. The case for or against a single financial supervisor also hinges on the degree of overlap in the business areas of financial companies. In any event, there is so far little international empirical evidence of the superiority of either system: both types of supervision have experienced problems during the recent international financial crisis and there is no unique solution. On balance, the existing structure appears to function well at the moment, even if the RBI remains overly inclined – albeit gradually less so – to issues regulations interfering with banks’ normal operational decisions. Changes need to be guided by country-specific situations which, in India’s case, would argue for the shedding of a number regulatory and ownership functions currently attributed to the RBI so that it could concentrate on core activities such as bank regulation and inflation control.
In order to reduce possible conflicts of interests at the RBI, a National Treasury Management Agency (NTMA) is being set up, to work as an agent of the Budget Division of the Department of Economic Affairs in the Ministry of Finance (Aziz, 2008). This should reduce the burden of conflicting claims upon decision-making at the RBI, improve fiscal outcomes through access to a professional investment banker without conflicts of interest, and improve the functioning of the bond market. A major political effort will be required to avoid the problems of delay that ensnared the implementation of the PFRDA.
Economies of scale and scope would be obtained by unifying into a single agency the supervision of all organised financial trading, covering spot and derivative trades, both OTC and on exchanges for all asset classes. This would require merging into a single agency the RBI functions related to the bond and currency markets, the SEBI functions related to the stock market and the FMC functions related to commodity futures markets. Hence, it would require replacing the 2006 RBI Amendment Act, the Forward Contracts Regulation Act, the Securities Contracts (Regulation) Act and the SEBI Act, by new unified legislation.
The current deposit insurance arrangements should be changed. A new Deposit Insurance Corporation (DIC) should be established to take over the role of the Deposit Insurance and Credit Guarantee Company (DICGC). It would have to monitor banks independently of the bank regulator, charge insurance premia to banks that vary with risk, ensure closure or merger of fragile banks before technical bankruptcy, and work as a channel for fiscal support in the event a bank is indeed insolvent but
ECO/WKP(2011)48
32
is considered too large to fail. At present, the existing deposit insurance institution is owned by the RBI. However, the payment of deposit insurance claims is a fiscal matter. Hence the new DIC should be a fully-owned subsidiary of the Ministry of Finance, which should ultimately make decisions about the use of taxpayer resources, rather than the RBI. The DIC would need to make some difficult decisions about cross-subsidisation. Scheduled commercial banks contributed 93% of the premiums to the existing DICGC but have generated no claims. On the other hand co-operative banks have generated claims more than double the premiums they have paid.
Even if all the presently envisaged reforms are enacted, India would have seven agencies in the financial sphere (RBI, SEBI, PFRDA, IRDA, NTMA, DIC and SAT). With the growing complexity of the financial system, problems of gaps, overlaps and conflicts become more and more frequent. For example, as noted, in 2010 there was a dispute between SEBI and IRDA on the regulatory treatment of insurance companies running fund management products. Many such difficulties have been simmering without achieving resolution. In addition, the financial stability function requires close coordination between financial agencies, given the need for new work on the bankruptcy process, achieving counter-cyclical capital requirements, and crisis response with the increasing domination of large complex financial institutions in an ever-more inter-connected financial system.
A recent response to these challenges has been the establishment of a new entity, the Financial Stability and Development Council (FSDC), whose role will be to improve the functioning of the financial system with respect to: financial stability; financial sector development; inter-regulatory coordination; financial literacy; financial inclusion; macroprudential supervision, including as regards the functioning of large financial conglomerates; and the coordination of the interaction with international financial sector bodies. The latter include the Financial Action Task Force, which India joined in 2010 in order to contribute to the international effort against money laundering and financial support of terrorism. The FSDC is a council of regulators, chaired by the Finance Minister and with a permanent secretariat. It may help to resolve inter-agency disputes.
Conclusions
The Indian financial system has made considerable progress since its liberalisation in the 1990s. The banking sector has been transformed by allowing a restricted number of new entrants into the market. A world-class stock exchange has emerged complemented by a large and vibrant equity derivatives markets. A sizeable microfinance industry has sprung up providing credit to low-income households in a way that the banking system cannot, which helps promote financial inclusion. But remnants of the former policy regime still remain in place. The RBI continues to see one its roles as micro-managing the banking system and deciding on the sectors to which bank credit should be directed. The potential main financial market (government bonds) is anaemic and suffers from having the owner, operator and regulator all in one and the same institution. This hampers the development of a bond-currency-derivative nexus and hinders the transmission of monetary policy impulses. At the same time, the legal framework is dated and to a large extent relies on laws drafted long before current financial markets came into existence; moreover, and partly for that reason, there is a tendency not to rely on the rule of law but to use administrative decisions that are without appeal.
The economy has reacted very well to the liberalisation in the 1990s and the saving rate has moved up to the levels of the East Asian economies in their high-growth period. The challenge for the authorities is to now put in place a second wave of financial reforms that will ensure that savings are put to an optimum use (Box 4).
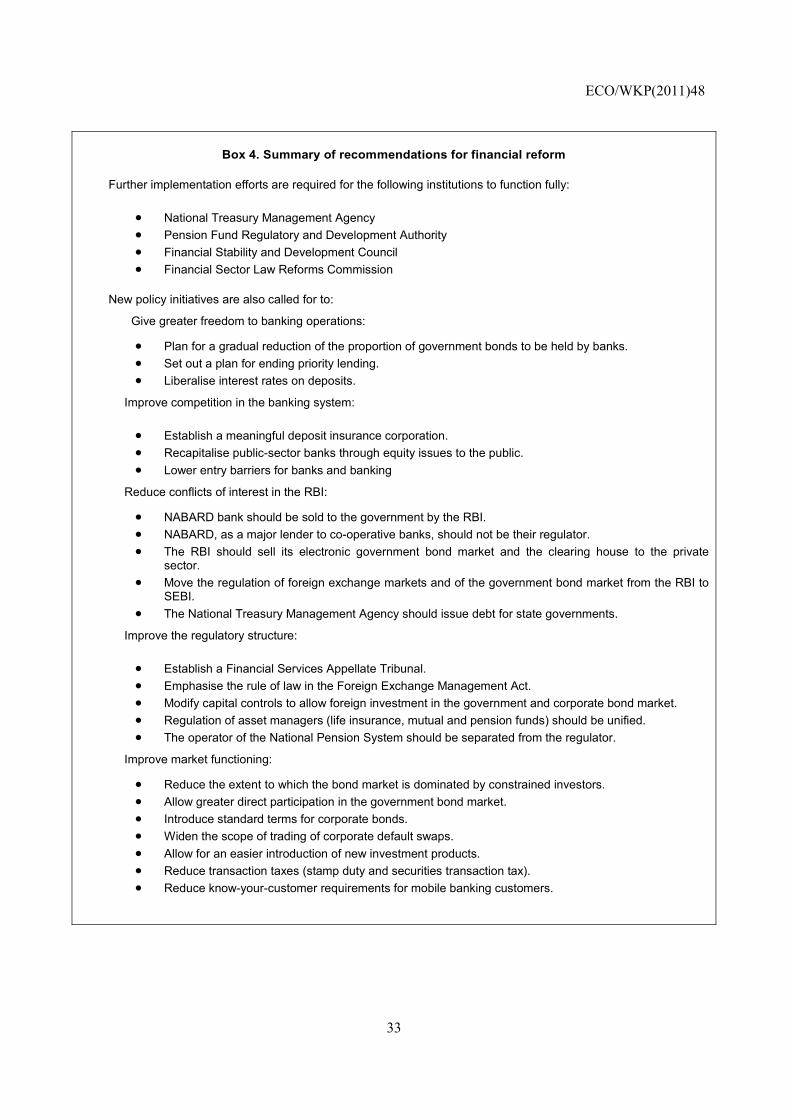
ECO/WKP(2011)48
33
Box 4. Summary of recommendations for financial reform
Further implementation efforts are required for the following institutions to function fully:
• National Treasury Management Agency • Pension Fund Regulatory and Development Authority • Financial Stability and Development Council • Financial Sector Law Reforms Commission
New policy initiatives are also called for to:
Give greater freedom to banking operations:
• Plan for a gradual reduction of the proportion of government bonds to be held by banks. • Set out a plan for ending priority lending. • Liberalise interest rates on deposits.
Improve competition in the banking system:
• Establish a meaningful deposit insurance corporation. • Recapitalise public-sector banks through equity issues to the public. • Lower entry barriers for banks and banking
Reduce conflicts of interest in the RBI:
• NABARD bank should be sold to the government by the RBI. • NABARD, as a major lender to co-operative banks, should not be their regulator. • The RBI should sell its electronic government bond market and the clearing house to the private
sector. • Move the regulation of foreign exchange markets and of the government bond market from the RBI to
SEBI. • The National Treasury Management Agency should issue debt for state governments.
Improve the regulatory structure:
• Establish a Financial Services Appellate Tribunal. • Emphasise the rule of law in the Foreign Exchange Management Act. • Modify capital controls to allow foreign investment in the government and corporate bond market. • Regulation of asset managers (life insurance, mutual and pension funds) should be unified. • The operator of the National Pension System should be separated from the regulator.
Improve market functioning:
• Reduce the extent to which the bond market is dominated by constrained investors. • Allow greater direct participation in the government bond market. • Introduce standard terms for corporate bonds. • Widen the scope of trading of corporate default swaps. • Allow for an easier introduction of new investment products. • Reduce transaction taxes (stamp duty and securities transaction tax). • Reduce know-your-customer requirements for mobile banking customers.
ECO/WKP(2011)48
34
Bibliography
Aleem, I. (1990), “Imperfect Information, Screening and the Costs of Informal Lending: A Study of a Rural Credit Market in Pakistan”, World Bank Economic Review, Vol. 4, No. 3.
Aniket, K. (2010), “Beyond Microcredit: Giving the Poor a Way to Save Their Way out of Poverty”, Trinity College, University of Cambridge, mimeo, February.
Aziz, J. (2008), Establishing a National Treasury Management Agency, Report of the Working Group on Debt Management, Department of Economic Affairs, Ministry of Finance, New Delhi.
Banerjee, A. and E. Duflo (2007), “The Economic Lives of the Poor”, Journal of Economic Perspectives, Vol. 21, No. 1.
Banerjee, A. and E. Duflo (2010), “Giving Credit Where it is Due”, Mimeo, March, MIT.
Banerjee, A., E. Duflo, R. Glennerster and C. Kinnan (2010), “The Miracle of Microfinance? Evidence from a Randomized Evaluation”, mimeo, MIT.
Baht, N. and Y. Thorat (2001), “India’s Regional Rural Banks: The Institutional Dimension of Reforms”, Journal of Micro Finance, Vol. 3, No. 1.
Chandavarkar, A. (2005), “Towards an Independent Federal Reserve Bank of India: A Political Economy Agenda for Reconstitution”, Economic and Political Weekly, August 27.
Cornett, M., L. Guo, S. Khaksari, and H. Tehranian (2010), “The Impact of State Ownership on Performance Differences in Privately-Owned Versus State-Owned Banks: An International Comparison”, Journal of Financial Intermediation, Vol. 19, No. 1.
Collins, D., J. Morduch, S. Rutherford and O. Ruthven (2009), Portfolios of the Poor: How the World’s Poor Live on $2 a Day, Princeton, NJ: Princeton University Press.
Das, A., N. Ashok and S.C. Ray (2005), “Liberalisation, Ownership and Efficiency in Indian Banking”, Economic and Political Weekly, March 19.
Das, D. (2009), “Role of Financial Intermediation in Promoting Productivity Growth: Evidence from India”, presentation to the Indira Gandhi Institute of Development Research, Annual Money and Finance Conference, January, Mumbai.
Green, C., R. Manos, V. Murinde and N. Suppakitjarak (2010), “Share Liquidity and Market Microstructure Reform: The Case of Screen-based Trading in Mumbai”, Asia-Pacific Journal of Financial Studies, Vol. 39, Issue 3.
Gupta, P., K. Kochhar and S. Panth (2011), “Bank Ownership and the Effects of Financial Liberalization: Evidence from India”, Working Paper 11/50, International Monetary Fund, Washington D.C.
Harper, M. (2002), “Promotion of Self Help Groups under the SHG Bank Linkage Programme in India”, paper presented at the Seminar on SHG-Bank Linkage Programme, NBARD, New Delhi.
ICRA (2010), “Proposed Basel III Guidelines: A Credit Positive for Indian Banks”, Gurgaon, September.
Institute of International Finance (2010), Interim Report on the Cumulative Impact on the Global Economy of Proposed Changes in the Banking Regulatory Framework, Washington, DC.
International Monetary Fund (2010a), “Vietnam: 2010 Article IV Consultation—Staff Report”, IMF Country Report No. 10/281, Washington D.C.
Intenational Monetary Fund (2010b), Global Financial Stability Report, October, Washington D.C.
Jayadev, M. and R. Sensarma (2007), “Mergers in Indian Banking: An Analysis”, mimeo, Indian Institute of Management, Bangalore.
ECO/WKP(2011)48
35
Kaur, P. and G. Kaur (2010), “The Impact of Mergers on the Cost Efficiency of Indian Commercial Banks”, Eurasian Journal of Business and Economics, Vol. 3, No. 5.
Khatkhate, D. (2005), “The Reserve Bank of India: A Study in the Separation and Attrition of Powers”, in D. Kapur and P.B. Mehta (eds), Public Institutions in India: Performance and Design, Oxford University Press.
Kumar, S. and R. Gulati (2010), “Dynamics of Cost-Efficiency in Indian Public Sector Banks: A Post-Deregulation Experience”, Paper presented to the Twelfth Annual Conference on Money and Finance in the Indian Economy, March, Mumbai.
Mihaljek, D. (2010), “Domestic Bank Intermediation In Emerging Market Economies during the Crisis: Locally Owned versus Foreign-Owned Banks”, in The Global Crisis and Financial Intermediation in Emerging Market Economies, Bank for International Settlements Paper 54, Basel.
Ministry of Finance (1991), Economic Survey, New Delhi, February.
Mistry, P. (2007), “The Mumbai-IFC Report: of Discourse, Garlands and Brickbats!”, Business Standard, 10 June.
MIX (2010), The 2009 Mix 100 Microfinance Institutions, The MicroFinance Information Exchange, January, Washington DC.
Mohan, R. (2004), “A Decade of Reforms in Government Securities Market in India and the Road Ahead”, Paper presented to the Annual Conference of the Fixed Income Money Market Dealers Association of India and Primary Dealers Association of India, March 20, Dubai.
Narasimham, M. (1998), Second Committee on Banking Sector Reforms, Reserve Bank of India.
OECD (2010), “Summary Record of the RBI-OECD Workshop Delivering Financial Literacy: Challenges, Strategies And Instruments”, Bangalore.
OECD (2011), OECD Economic Survey of India, OECD, Paris.
Rajan, R. (2009), A Hundred Small Steps: Report of the Committee on Financial Sector Reforms, Planning Commission, August, New Delhi.
Reserve Bank of India (2010a), Financial Stability Report, March, Mumbai.
Reserve Bank of India (2010b), Financial Stability Report, December, Mumbai.
Rosenberg, R., A. Gonzalez and S. Narain (2009), “The New Moneylenders: Are the Poor Being Exploited by High Microcredit Interest Rates?”, Occasional Paper 15, Consultative Group to Assist the Poor (CGAP), Washington D.C.
Shah, A. and S. Thomas (2000), “David and Goliath: Displacing a Primary Market”, Journal of Global Financial Markets, Vol. 1, No. 1.
Skiba, P. and J. Tobacman (2007), “The Profitability of Payday Loans”, Vanderbilt University Law School, mimeo.
SKS (2010), Red Herring Prospectus for the Initial Public Offering of SKS Microfinance, SEB I, Mumbai.
Srinivasan, N. (2010), Microfinance India: State of the Sector Report 2009, Sage India.
Telecom Regulatory Authority of India (2010), Consultation Paper on Quality of Service Requirements for Delivery of Basic Financial Services Using Mobile Phones, Consultation Paper No. 13.
Vaidyanathan, A. (2004), Final Report of the Task Force on the Revival of Cooperative Credit Institutions, 30 December, Ministry of Finance, New Delhi.
Verma, M.S. (1999), Report of the Working Group on Restructuring Weak Public Sector Banks, Reserve Bank of India, October, Mumbai.
ECO/WKP(2011)48
36
WORKING PAPERS
The full series of Economics Department Working Papers can be consulted at www.oecd.org/eco/workingpapers/
878. Policies to rebalance housing markets in New Zealand (July 2011) by Calista Cheung 877. The sharing of macroeconomic risk: Who loses (and gains) from macroeconomic shocks (July 2011) Rudiger Ahrend, Jens Arnold and Charlotte Moeser 876. Estonia: making the most of globalisation (June 2011) Robert Price and Andreas Wörgötter 875. The effects of downturns on labour force participation: evidence and causes (June 2011) Romain Duval, Mehmet Eris and Davide Furceri 874 A dynamic factor model for world trade growth (June 2011) Stéphanie Guichard and Elena Rusticelli 873. Towards a better understanding of the informal economy (May 2011) Dan Andrews, Aida Caldera Sánchez and Åsa Johansson 872. Tax competition between sub-central governments (May 2011) Hansjörg Blöchliger and José-Maria Pinero-Campos 871. The growth effects of current account reversals: the role of macroeconomic policies (May 2011) Luiz de Mello, Pier Carlo Padoan and Linda Rousová 870. Les politiques du logement en France (May 2011) Bénédicte Rolland 869. How important is wealth for explaining household consumption over the recent crisis? An empirical
study for the United States, Japan and the euro area (May 2011) Clovis Kerdrain 868. Adjusting fiscal balances for asset price cycles (May 2011) Robert Price and Thai-Thanh Dang 867. Improving the functioning of the housing market in the United Kingdom (May 2011) Christophe André 866. An analysis of demand for foreign exchange reserves (May 2011) Peter Vujanovic 865. Episodes of large capital inflows and the likelihood of banking and currency crises and sudden
stops (May 2011) Davide Furceri, Stephanie Guichard and Elena Rusticelli 864. The effect of episodes of large capital inflows on domestic credit (May 2011) Davide Furceri, Stephanie Guichard and Elena Rusticelli
ECO/WKP(2011)48
37
863. Medium-term determinants of international investment positions: the role of structural policies (May 2011) Davide Furceri, Stephanie Guichard and Elena Rusticelli 862. French social housing in an international context (May 2011) Kathleen Scanlon and Christine Whitehead 861. Making the French housing market work better (May 2011) by Hervé Boulhol 860. Surveillance by international institutions: lessons from the global financial and economic crisis (April 2011) by Kumiharu Shigehara and Paul Atkinson 859. France’s environmental policies: internalising global and local externalities (April 2011) by Balázs Égert 858. Bringing French public debt down: the options for fiscal consolidation (April 2011) by Balázs Égert 857. Policy frameworks in the post-crisis environment (April 2011) by Nigel Pain and Oliver Röhn 856. Global imbalances, exchange rate pegs and capital flows: a closer look (April 2011) by Paul van den Noord 855 Interest rate pass-through during the global financial crisis: the case of Sweden (April 2011) by Niels-Jakob Harbo Hansen and Peter Welz 854 What drives inflation in the major OECD Economies (April 2011) by Diego Moccero, Shingo Watanabe and Boris Cournède 853 Mitigation potential of removing fossil fuel subsidies: A general equilibrium assessment (April 2011) by J.M. Burniaux and J. Chateau 852 Enhancing labour utilisation in a socially inclusive society in Australia (April 2011) by Vassiliki Koutsogeorgopoulou 851 Meeting infrastructure needs in Australia (March 2011) by Claude Giorno 850 Restoring fiscal sustainability in Spain (March 2011) by Pierre Beynet, Andrés Fuentes, Robert Gillingham and Robert Hagemann 849. Drivers of homeownership rates in selected OECD countries (March 2011) by Dan Andrews and Aida Caldera Sánchez 848. How efficient are banks in Hungary? (February 2011) by Margit Molnár and Dániel Holló 847. Strengthening the macroeconomic policy framework in South Africa (February 2011) by Tatiana Lysenko and Geoff Barnard