Embed Size (px)
Citation preview
India: Greenhouse Gas Emissions 2007
INCCA Indian Network for Climate Change Assessment
Ministry of Environment and ForestsGovernment of India May 2010


India: Greenhouse Gas Emissions 2007
INCCA Indian Network for Climate Change Assessment
May 2010Ministry of Environment and ForestsGovernment of India

May 2010
Copy editing, layout and design: Ministry of Environment and Forests
Printed at: Print Process

Foreword ...........................................................................................................................................................
Executive Summary ............................................................................................................................................ i - ix
1. Context and Relevance .............................................................................................................................. 1
2. Climate Change Assessments in India ..................................................................................................... 2
3. Indian Network for Climate Change Assessment.................................................................................... 4
4. Greenhouse gas estimation - 2007 ........................................................................................................... 8
4.1 Coverage ......................................................................................................................................................... 8
4.2 Methodology, Activity data and Emission factors .................................................................................... 10
5. Energy ......................................................................................................................................................... 12
5.1 Methodology and Choice of Emission Factors ......................................................................................... 12
5.2 Overview of GHG Emissions from the Energy Sector ............................................................................ 13
5.3 Electricity Generation .................................................................................................................................... 13
5.4 Petroleum Refining and Solid Fuel Manufacturing .................................................................................. 14
5.5 Transport .......................................................................................................................................................... 14
5.6 Residential / Commercial and Agriculture / Fisheries ............................................................................. 15
5.7 Fugitive Emissions .......................................................................................................................................... 16
6. Industry ...................................................................................................................................................... 17
6.1 Methodology and Choice of Emission Factors ......................................................................................... 17
6.2 Overview of GHG Emissions from Industry ............................................................................................. 17
6.3 Minerals ........................................................................................................................................................... 19
6.4 Chemicals ........................................................................................................................................................ 20
6.5 Metals .............................................................................................................................................................. 20
6.6 Other Industries ............................................................................................................................................. 20
6.7 Non energy product use .............................................................................................................................. 20
6.8 A Desciption of Fossil Fule and Process Based Emissions ...................................................................... 20
7. Agriculture ................................................................................................................................................. 22
7.1 Overview of the Agriculture sector emissions ......................................................................................... 22
7.2 Enteric Fermentation ..................................................................................................................................... 23
7.3 Manure management ................................................................................................................................... 24
7.4 Rice Paddy cultivation ................................................................................................................................... 25
7.5 Agriculture soils .............................................................................................................................................. 26
7.6 Burning of Crop residue ............................................................................................................................... 27
Contents

8. Land Use, Land Use Change and Forestry ............................................................................................... 28
8.1 Methodology – GPG Approach ................................................................................................................. 28
8.2 estimating carbon stock changes ................................................................................................................ 29
8.3 Inventory Estimation ...................................................................................................................................... 30
8.4 Land use change matrix ................................................................................................................................ 31
8.5 Area under forests ......................................................................................................................................... 32
8.6 Carbon stock change in forest lands .......................................................................................................... 34
8.7 CO2 emissions and removal from non-forest land categories ............................................................... 34
8.8 Net GHG removal from LULUCF sector ................................................................................................... 36
9. Waste .......................................................................................................................................................... 38
9.1 Summary of GHG emissions from waste .................................................................................................. 38
9.2 Municipal Solid Waste .................................................................................................................................. 38
9.3 Waste water treatment and disposal .......................................................................................................... 40
10. Greenhouse Gas Emission Profile: Key Features .................................................................................... 43
10.1 Overview ......................................................................................................................................................... 43
10.2 Gas by Gas Emissions ................................................................................................................................... 43
10.3 Sectoral Emissions .......................................................................................................................................... 43
10.4 Comparison with 1994 GHG inventory .................................................................................................... 47
10.5 Per capita emissions ...................................................................................................................................... 48
11. Future Perspective ..................................................................................................................................... 51
11.1 Riding the Tier ladder .................................................................................................................................... 51
11.2 Capacity building ........................................................................................................................................... 54
Annexures
1. Sources of Activity Data ......................................................................................................................................... 55
2. References ................................................................................................................................................................ 57
3. Scientists/ Experts - India : Greenhouse Gas Emissions 2007 ......................................................................... 59
4. INCCA Institutions ................................................................................................................................................... 61
5. Glossary of Key Terms ............................................................................................................................................ 63

ForewordI am pleased to introduce the publication – India’s Greenhouse Gas Emissions 2007. This Report, being brought out
by the Indian Network of Climate Change Assessment (INCCA), provides updated information on India’s Greenhouse
Gas Emissions for the year 2007. Until today, the only official emissions estimates available were for the year 1994. This
was very inadequate. I had been keen that to enable informed decision-making and to ensure transparency, we should
publish updated emissions estimates. I am glad that our team of scientists took up this challenge and have prepared
this report with estimates for 2007 in record time. More than 80 scientists from 17 institutions across India have
contributed to this Assessment. I am particularly pleased that with this publication, India has become the first “non-
Annex I” (i.e. developing) country to publish such updated numbers. I am also happy to announce that we will publish
our emissions inventory in a two-year cycle going forward. We will be the first developing country to do so.
According to the results, India ranks 5th in aggregate GHG emissions in the world, behind USA, China, EU and Russia
in 2007. Interestingly, the emissions of USA and China are almost 4 times that of India in 2007. It is also noteworthy
that the emissions intensity of India’s GDP declined by more than 30% during the period 1994-2007, due to the
efforts and policies that we are proactively putting in place. This is a trend we intend to continue. As you are aware,
we have already announced our intent to further reduce the emissions intensity of our GDP by 20-25% between 2005
and 2020 even as we pursue the path of inclusive growth.
INCCA, launched on 14th October 2009, is a network comprising 127 research institutions, tasked with undertaking
research on the science of climate change and its impacts on different sectors of the economy across the various
regions of India. As I mentioned at the launch, we must make the “3 M’s” – Measurement, Modelling and Monitoring
– the essence of our policy making and we must build indigenous capacity for this. This report is a step in this direction.
I look forward to INCCA’s next major publication – a “4X4” assessment of the impacts of climate change on four
sectors – water resources, agriculture, forests and human health – in four critical regions of India – the Himalayan
region, North east, Western Ghats and Coastal India, which will be released in November 2010.
Once again, I congratulate our team of scientists who have put this assessment together. I look forward to the results
of the other upcoming studies of INCCA.
Minister of State (Independent Charge)Environment & ForestsGovernment of India
Jairam Ramesh
Jairam Ramesh


India: Greenhouse Gas Emissions 2007Page i
This assessment provides information on India’semissions of Greenhouse gases (Carbon Dioxide [CO2],Methane [CH4] and Nitrous Oxide [N2O]) emitted fromanthropogenic activities at national level from:
Energy;Industry;Agriculture;Waste; andLand Use Land Use Change & Forestrmy (LULUCF).
The distribution of GHG emissions by sector are shownin Figure ES1. Detailed emissions estimates are providedin Annexure.
A. KEY RESULTS
The net Greenhouse Gas (GHG) emissions from India,that is emissions with LULUCF, in 2007 were 1727.71million tons of CO2 equivalent (eq) of which
Executive Summary
- CO2 emissions were 1221.76 million tons;- CH4 emissions were 20.56 million tons; and- N2O emissions were 0.24 million tons
GHG emissions from Energy, Industry, Agriculture, andWaste sectors constituted 58%, 22%, 17% and 3% ofthe net CO2 eq emissions respectively.Energy sector emitted 1100.06 million tons of CO2 eq,of which 719.31 million tons of CO2 eq were emittedfrom electricity generation and 142.04 million tons ofCO2 eq from the transport sector.Industry sector emitted 412.55 million tons of CO2
eq.LULUCF sector was a net sink. It sequestered 177.03million tons of CO2.India’s per capita CO2 eq emissions including LULUCFwere 1.5 tons/capita in 2007.
Note:Other Energy: includes GHG emissions from petroleum refining, manufacturing of solid fuel, commercial & institutional sector, agriculture & fisheries and fugitiveemissions from mining, transport and storage of coal, oil and natural gas.Other Industry: includes GHG emissions from production of glass and ceramics, soda ash, ammonia, nitric acid, carbides, titanium dioxide, methanol, ethyleneoxide, acrylonitrile, carbon black, caprolactam, ferro alloys, aluminium, lead, zinc, copper, pulp and paper, food processing, textile, leather, mining and quarrying,non specific industries and use of lubricants and paraffin wax.Agriculture: includes GHG emissions from livestock, rice cultivation, agricultural soils and burning of crop residue.Waste: includes GHG emissions from municipal solid waste (MSW), industrial and domestic waste water.LULUCF: includes GHG emissions and removals from changes in forest land, crop land, grass land, wet land, settlements and combustion of fuel wood in forests.
Figure ES1: GHG emissions by sector in 2007 (million tons of CO2 eq). Figures on top indicate the emissions by sectorsand in brackets indicate % of emission of the category with respect to the net CO2 equivalent emissions. See glossary for
defination of CO2 equivalent.

Indian Network for Climate Change Assessment Page ii
B. 1994 AND 2007 GHG EMISSIONS - ACOMPARISON
The 1994 assessment is available in India’s Initial NationalCommunication to the UNFCCC. Both the 1994 and2007 assessments have been prepared using the IPCCguidelines for preparation of national greenhouse gasemissions by sources and removal by sinks. The distinctivekey features of the two assessments and theimprovements in the 2007 assessments are indicated inBox ES1.
The total GHG emissions without LULUCF have grownfrom 1251.95 million tons in 1994 to 1904.73 million tonsin 2007 at a compounded annual growth rate (CAGR)of 3.3% and with LULUCF the CAGR is 2.9%. Between1994 and 2007, some of the sectors indicate significantgrowth in GHG emissions such as cement production(6.0%), electricity generation (5.6%) and transport(4.5%). A comparative analysis of GHG emissions bysector is shown in Table ES1.
C. IMPLEMENTATION ARRANGEMENT
This assessment has been prepared under the aegis ofthe Indian Network for Climate Change Assessment(INCCA). An initiative being coordinated by the Ministry
1994 Assessment
Estimates made using only revised 1996 IPCC guidelines.
LULUCF included emissions from changes in forest land.
Emission factors were a mix of default factors taken fromIPCC and country specific (CS) emission factors. 26%of the source categories used CS factors.
The 1994 assessment splits the emissions from industryin to two parts - fossil fuel and process. The fossil fuelemissions are reported in Energy and process emissionsin Industry.
In 1994, 7% of the total CO2 eq emissions were madeusing Tier III approach.
2007 Assessment
Estimates made using revised IPCC 1996 guidelines(1997), IPCC Good Practice Guidance (2000), theLULUCF Good Practice Guidance (2003).
Carbon pools in addition to forests have been consideredin the LULUCF sector (crop land, grass land, settlements).
Emission factors were also a mix of default and CS butleading to improved accuracy as more number of CSshave been used in this assessment (35% of the sourcecategories used CS factors).
The 2007 assessment reports both fossil fuel related andprocess based emissions from Industry as a part of theIndustry sector.
In 2007, 12% of the emissions are made using Tier IIIapproach, implying greater accuracy.
Box ES1: 2007 and 1994 - Key Methodological Features and Improvements
1994 2007 CAGR
(%)
Electricity 355.03 (28.4%) 719.30 (37.8%) 5.6
Transport 80.28 (6.4%) 142.04 (7.5%) 4.5
Residential 78.89 (6.3%) 137.84 (7.2%) 4.4
Other Energy 78.93 (6.3%) 100.87 (5.3%) 1.9
Cement 60.87 (4.9%) 129.92 (6.8%) 6.0
Iron & Steel 90.53 (7.2%) 117.32 (6.2%) 2.0
Other
Industry 125.41 (10.0%) 165.31 (8.7%) 2.2
Agriculture 344.48 (27.6%) 334.41 (17.6%) -0.2
Waste 23.23 (1.9%) 57.73 (3.0%) 7.3
Total without
LULUCF 1251.95 1904.73 3.3
LULUCF 14.29 -177.03
Total with
LULUCF 1228.54 1727.71 2.9
Note: Figure in brackets indicate percentage emissions from eachsector with respect to total GHG emissions without LULUCF in 1994and 2007 respectively
Table ES1: A comparison of GHG emissions by sectorbetween 1994 and 2007 in million tons of CO2 eq.
of Environment and Forests, Government of India. (BoxES2 & Figure ES2).

India: Greenhouse Gas Emissions 2007Page iii
2007 Assessment
BCKV Bidhan Chandra Krishi Viswavidyalaya
CII Confederation of Indian Industry
CIMFR Central Institute of Mining & Fuel Research
CLRI Central Leather Research Institute
CMA Cement Manufacturing Association
CRRI Central Road Research Institute
FSI Forest Survey of India
IARI Indian Agricultural Research Institute
IGFRI Indian Grass & Fodder Research Institute
IISc Indian Institute of Science
IVRI Indian Veterinary Research Institute
NDRI National Dairy Research Institute
NEERI National Environment Engineering Research Institute
NPL National Physical Laboratory
NRCS National Remote Sensing Centre
PPAC Petroleum Planning and Analysis Cell
TERI The Energy and Resources Institute
Figure ES2: INCCA and Network for preparing the Greenhouse Gas Emissions – 2007. For the complete list ofinstitutions participating in INCCA, see Annexure 4.
Box ES2: Indian Network for Climate Change Assessment (INCCA)
Launched on October 14, 2009, the network comprises of 127 institutions and 228 scientists across India
Role
- Assess the drivers and implications of climate change through scientific research
- Prepare climate change assessments once every two years (GHG estimations and impacts of climate change,associated vulnerabilities and adaptation)
- Develop decision support systems
- Build capacity towards management of climate change related risks and opportunities

Indian Network for Climate Change Assessment Page iv
D. SECTORAL DESCRIPTION OF THEEMISSIONS
Energy: The energy sector emitted 1100.06 million tonsof CO2 eq due to fossil fuel combustion in electricitygeneration, transport, commercial/Institutionalestablishments, agriculture/fisheries, and energy intensiveindustries such as petroleum refining and manufacturingof solid fuels, including biomass use in residential sector.Fugitive emissions from mining and extraction of coal,oil and natural gas are also accounted for in the energysector. The distribution of the emissions across thesource categories in energy sector is shown in FigureES3.
Electricity Generation: The total greenhouse gasemissions from electricity generation in 2007 was719.31 million tons CO2 eq. This includes both gridand captive power. The CO2 eq emissions fromelectricity generation were 65.4% of the total CO2 eqemitted from the energy sector. Coal constituted about90% of the total fuel mix used.
Petroleum Refining and Solid Fuel Manufacturing:These energy intensive industries emitted 33.85 milliontons of CO2 eq in 2007. The solid fuels includemanufacturing of coke & briquettes.
Transport: The transport sector emissions are reportedfrom road transport, aviation, railways and navigation.In 2007, the transport sector emitted 142.04 million
tons of CO2 eq. Road transport, being the dominantmode of transport in the country, emitted 87% of thetotal CO2 equivalent emissions from the transportsector. The aviation sector in comparison only emitted7% of the total CO2 eq emissions. The rest wereemitted by railways (5%) and navigation (1%) sectors.The bunker emissions from aviation and navigationhave also been estimated but are not counted in thenational totals. (Figure ES4).
Residential & Commercial: The residential sector inIndia is one of the largest consumers of fuel outsidethe energy industries. Biomass constitutes the largestportion of the total fuel mix use in this sector.Commercial and institutional sector uses oil & naturalgas over and above the conventional electricity for itspower needs. The total CO2 eq emission fromresidential & commercial/institution sector was 139.51million tons of CO2 eq in 2007.
Agriculture & Fisheries: The agriculture/ fisheriesactivities together emitted 33.66 million tons of CO2
eq due to energy use in the sector other than gridelectricity.
Fugitive Emissions: CH4 escapes into the atmospheredue to mining of coal, and due to venting, flaring,transport and storage of oil and natural gas. The totalCO2 eq emissions from this source category in 2007was 31.70 million tons CO2 eq.
Figure ES3: GHG emissions from Energy Sector (million tons of CO2 eq).

India: Greenhouse Gas Emissions 2007Page v
Industry: Industrial activities together emitted 412.55million tons of CO2 eq of GHG in 2007. Industry sectoremissions have been estimated from manufacturing ofminerals, metals, chemicals, other specific industries, andfrom non-energy product use. The emissions covered inthe industry sector include fossil fuel combustion relatedemissions as well as the process based emissions. (FigureES5).
Cement and Other Minerals: The cement industryemitted 129.92 million tons of CO2, which is 32% ofthe total CO2 eq emissions from the Industry sector.The emissions cover the entire technology mix formanufacturing of cement in the country coveringlarge, medium and white cement plants. The otherminerals like glass and ceramic production and sodaash use together emit 1.01 million tons of CO2 eq.
Iron and Steel and Other Metals: The iron and steelindustry emitted 117.32 million tons of CO2 eq. Theestimate covers integrated and mini steel plants. Theproduction of other metals, namely, aluminum,ferroalloys, lead, zinc and copper production lead toan emission of 5.42 million tons of CO2 eq.
Chemicals: The chemical industries together emitted8.1% of the total GHG emissions from the industrysector (33.50 million tons). See figure ES5 and glossaryfor sub categories included.
Other Industries: Other industries comprising of pulp/paper, leather, textiles, food processing , mining andquarrying, and non specific industries comprising of
rubber, plastic, watches, clocks, transport equipment,furniture etc., together emitted 124.53 million tons.The rest of the emissions in the Industry sector camefrom the non-energy product uses and this sectoremitted 0.85 million tons of CO2 eq, and was mainlyfrom use of oil products and coal-derived oils primarilyintended for purposes other than combustion.
Agriculture: The agriculture sector emitted 334.41 milliontons of CO2 eq in 2007. Estimates of GHG emissionsfrom the agriculture sector arise from entericfermentation in livestock, manure management, ricepaddy cultivation, agricultural soils and on field burningof crop residue. (Figure ES6)
Livestock: Enteric fermentation in livestock released212.10 million tons of CO2 eq (10.1 million tons ofCH4). This constituted 63.4% of the total GHGemissions (CO2 eq) from agriculture sector in India.The estimates cover all livestock, namely, cattle,buffalo, sheep, goats, poultry, donkeys, camels, horsesand others. Manure management emitted 2.44 milliontons of CO2 eq.
Rice Cultivation: Rice cultivation emitted 69.87 milliontons of CO2 eq or 3.27 million tons of CH4. The
Note:Other Metals: includes GHG emissions from production offerroalloys, aluminium, lead, zinc and copper.Chemicals: includes GHG emissions from production of ammonia,nitric acid, adipic acid, caprolactam, carbide, titanium dioxide,petrochemicals and black carbon, methanol, ethylene, ethyleneoxide, acrylonitrile, ethylene diochloride and vinyl chloride,monomer and other chemicals (see glossary for details).Other Industries: includes GHG emissions from pulp and paper,food processing, textile and leather, mining and quarrying and nonspecific industries. It also includes emissions from non-energyproduct use.
Figure ES5: GHG emissions from Industry Sector (milliontons of CO2 eq).
Figurse ES4: GHG emissions from Transport Sector bymode of transport in 2007 (million tons of CO2 eq).

Indian Network for Climate Change Assessment Page vi
emissions cover all forms of water managementpracticed in the country for rice cultivation, namely,irrigated, rainfed, deep water and upland rice. Theupland rice are zero emitters and irrigatedcontinuously flooded fields and deep water rice emitmaximum methane per unit area.
Agricultural Soils and Field Burning of Crop Residue:Agricultural soils are a source of N2O, mainly due toapplication of nitrogenous fertilizers in the soils.Burning of crop residue leads to the emission of anumber of gases and pollutants. Amongst them, CO2
is considered to be C neutral, and therefore notincluded in the estimations. Only CH4 and N2O areconsidered for this report. The total CO2 eq emittedfrom these two sources were 50.00 million tons.
Land Use Land Use Change and Forestry: The estimatesfrom LULUCF sector include emission by sources andor removal by sinks from changes in forest land, cropland, grassland, and settlements. Wet lands have not beenconsidered due to paucity of data. The LULUCF sectorin 2007 was a net sink. It sequestered 177.03 million tonsof CO2. (Figure ES7)
Forest Land: This includes estimates of emissions andremoval from above and below ground biomass invery dense, moderately dense, open forests, and scrublands. Estimates indicate that forest land sequestered67.8 million tons of CO2 in 2007. However, fuel woodextracted non-sustainably from forests lead to anemission of 67.80 million tons of CO2 in 2007.
Crop Lands: The emission estimates have been madefrom net sown area as well as fallow land. The cropland sequestered 207.52 million tons of CO2 in 2007.
Grassland: Changes in Grassland resulted in theemission of 10.49 million tons of CO2 due to decreasein grass land area by 3.4 million ha between the twoperiods.
Settlements: Land converted to settlements thoughincreased by 0.01 million ha during the period,however, the conversions did not lead to an emissionbut a net removal of 0.04 million tons.
Waste: The waste sector emissions were 57.73 milliontons of CO2 eq from municipal solid waste management,domestic waste water and industrial waste watermanagement. (Figure ES8)
Municipal Solid Waste (MSW): Systematic disposalof solid waste is carried out only in the cities in Indiaresulting in CH4 emissions due to aerobic conditionsgenerated due to accumulation of waste over theyears. It is estimated that the MSW generation anddisposal resulted in the emissions of 12.69 milliontons of CO2 eq in 2007.
Waste Water: The waste water generation emissionsare the sum total of emissions from domestic wastewater and waste water disposal in industries. Wastewater management in both these categories togetheremitted 45.03 million tons of CO2
Figure ES7: GHG emissions and removals from LULUCFsector (million tons of CO2 eq).
Figure ES6: GHG emissions from Agriculture Sector(million tons of CO2 eq).

India: Greenhouse Gas Emissions 2007Page vii
Figure ES8: GHG emissions from waste(million tons of CO2 eq).
E. FUTURE DIRECTIONS
The robustness of the GHG inventory making process isdependent on the Tier of methodology used. Higher theTier, more representative is the emission estimated ofthe actual emissions. Of the total 1727.71 million tons ofCO2 equivalent emissions from India in 2007, 21% ofthe emissions have been estimated using Tier Imethodology, 67% by Tier II and 12% by Tier III.
Riding the Tier Ladder: For improving the inventoryestimations of key categories using Tier II and Tier Imethodologies, there is a need to move up the Tierladder. Strategies needed include improvement inassimilation of activity data representing nationalcircumstances, bridging data gaps, and eliminatinguncertainties by developing country specific GHGemission factors.
Capacity Building and National Greenhouse GasInventory Management System: Capacity building isessential at institutional and individual levels. Capacityat the institutional level addresses the needs of inventorypreparation at national, sectoral and point source levelthat requires collection and archiving of data on acontinuous basis. Establishment of a National InventoryManagement System is therefore necessary. It is alsoimportant to involve additional institutions with variedresearch experience, to widen the pool of researchersand enable the integration of latest practices.

Indian Network for Climate Change Assessment Page viii
CO2 emissions CO2 removals CH4 N2O CO2 equivalent
GRAND TOTAL 1497029.20 275358.00 20564.20 239.31 1727706.10ENERGY 992836.30 4266.05 56.88 1100056.89Electricity generation 715829.80 8.14 10.66 719305.34Other energy industries 33787.50 1.72 0.07 33845.32Transport 138858.00 23.47 8.67 142038.57Road transport 121211.00 23.00 6.00 123554.00Railways 6109.00 0.34 2.35 6844.64Aviation 10122.00 0.10 0.28 10210.90Navigation 1416.00 0.13 0.04 1431.13Residential 69427.00 2721.94 36.29 137838.49Commercial / Institutional 1657.00 0.18 0.04 1673.18Agriculture/ Fisheries 33277.00 1.20 1.15 33658.70Fugitive emissions 1509.40 31697.30INDUSTRY 405862.90 14.77 20.56 412546.53Minerals 130783.95 0.32 0.46 130933.27Cement production 129920.00 129920.00Glass & cermic production 277.82 0.32 0.46 427.14Other uses of soda ash 586.12 586.12Chemicals 27888.86 11.14 17.33 33496.42Ammonia production 10056.43 10056.43Nitric acid production 16.05 4975.50Carbide production 119.58 119.58Titanium dioxide production 88.04 88.04Methanol production 266.18 0.91 285.37Ethylene production 7072.52 9.43 7270.64EDC & VCM production 198.91 198.91Ethylene Oxide production 93.64 0.19 97.71Acrylonitrile production 37.84 0.01 37.98Carbon Black production 1155.52 0.03 1156.07caprolactum 1.08 336.22Other chemical 8800.21 0.56 0.20 8873.97Metals 122371.43 0.95 1.11 122736.91Iron & Steel production 116958.37 0.85 1.09 117315.63Ferroalloys production 2460.70 0.08 2462.29Aluminium production 2728.87 0.01 0.00 2729.91Lead production 84.13 0.00 0.01 86.38Zinc production 76.11 0.00 0.01 77.99Copper 63.25 0.01 0.00 64.70Other Industries 123969.17 2.37 1.65 124530.44Pulp and paper 5222.50 0.05 0.08 5248.35Food processing 27625.53 1.12 0.22 27717.25Textile and leather 1861.11 0.03 0.02 1867.94Mining and qurrying 1460.26 0.06 0.01 1464.62Non-specific industries 87799.77 1.11 1.32 88232.28
Greenhouse gas emissions by sources and removal by sinks from India in 2007 (thousand tons)
(contd…)
ANNEXURE

India: Greenhouse Gas Emissions 2007Page ix
CO2 emissions CO2 removals CH4 N2O CO2 equivalent
Note: LULUCF: Land Use Land Use Change & Forestry*Not included in the national totals.NE: Not estimated; NO: Not occuring
Non energy product use 849.49 849.49Lubricant 776.75 776.75Paraffin wax 72.75 72.75AGRICULTURE 13767.80 146.07 334405.50Enteric fermentation 10099.80 212095.80Livestock Manure management 115.00 0.07 2436.70Rice cultivation 3327.00 69867.00Soils 140.00 43400.00Burning of crop residue 226.00 6.00 6606.00LULUCF 98330.00 275358.00 -177028.00Forestland 67800.00 -67800.00Cropland 207520.00 -207520.00Grassland 10490.00 10490.00Settlement 38.00 -38.00Wetland NE NEOther land NO NOFuel wood use in forests 87840.00 87840.00Waste 2515.58 15.80 57725.18Municipal Solid waste 604.51 12694.71Domestic waste water 861.07 15.80 22980.47Industrial waste water 1050.00 22050.00Bunkers* 3454 0.03 0.10 3484.45Aviation Bunkers 3326 0.02 0.09 3355.31Marine bunkers 128 0.01 0.003 129.14


Context and Relevance
Climate change is recognized both as a threat and achallenge. The impact of human activities on climate andclimate systems is unequivocal. Climate has a significantrole in the economic development of India. Many sectorsof the economy are climate sensitive. Climate changehas origins in anthropogenic activities and is engagingthe attention of planners, governments, and politiciansworldwide. It is no longer a scientific question as towhether the climate is changing, but the question is thetiming and magnitude of Climate Change. Thegovernments of the countries across the world areengaged in working out the impacts and associatedvulnerabilities of their economies to impending projectedclimate change.
In India, the meteorological records indicate rise in themean annual surface air temperature by 0.4°C with notmuch variations in absolute rainfall. However, the ratesof change in temperatures and precipitation have beenfound to be varying across the region. The intensity andfrequency of heavy precipitation events have increasedin the last 50 years. The tide gauge observations in thelast four decades across the coast of India also indicatea rise in sea level at the rate of 1.06-1.25 mm/year. Further,some preliminary assessments point towards a warmerclimate in the future over India, with temperaturesprojected to rise by 2-4oC by 2050s. No change in totalquantity of rainfall is expected, however, spatial patternof the rainfall are likely to change, with rise in numberand intensity of extreme rainfall events.
The sea level is also projected to rise with cyclonicactivities set to increase significantly with warmer oceans.The continuous warming and the changing rainfall patternover the Indian region may jeopardize India’sdevelopment by adversely impacting the naturalresources such as water forests, coastal zones, andmountains on which more than 70% of the ruralpopulation is dependent.
The physiographic features and the geographic location,which control the climate of the country, bestows it withgreat wealth of its natural resources, surface and groundwater availability, forestry and vegetation. The regionabounds in very rich collection of flora and fauna, andsome of these locations exhibit a high degree of speciesendemism and constitute biodiversity hotspots of theworld. There is an ever increasing recognition of the needfor national level assessments which provides anopportunity to enhance our knowledge andunderstanding about the implication of both the currentclimate variability as well as the projected adverseimpacts of climate change.
India: Greenhouse Gas Emissions 2007Page 1
1

Indian Network for Climate Change Assessment Page 2
Climate Change Assessments in India
Recognition of the need for assessing the implicationsof Climate Change in India coincides with the emergenceof the issue of global warming in late eighties and earlynineties. Globally, the decade of 1990’s which saw theadoption of the United Nations Framework Conventionon Climate Change (UNFCCC) and the publication ofthe update on Climate Change 1992 by the InterGovernmental Panel on Climate Change (IPCC) couldbe taken as the beginning of preparation of the dedicatedassessments of climate change. In the Indian context,researchers initiated work in their own limited fields. Byall means the information was scattered, diffused andfragmented on various aspects of Climate Change. Theonly source of information on climate was availablethrough India’s Meteorology Department (IMD) and theIndian Institute of Tropical Meteorology (IITM) andcertain premier institutes such as Indian Institute ofScience (IISc) and the Indian Space ResearchOrganization (ISRO) and its associated institutions.
For the first time information on Climate Change wasconsolidated for the preparation of India report of theAsian development Bank’s study on Climate Change(ADB 1994). The study was limited to the compilation ofliterature and certain studies on impacts of ClimateChange on Agriculture, Water and Forests besides sealevel rise. During this period a nation wide campaign wasinstituted by MoEF to access the emission of CH4 fromrice paddy cultivation in India. The study had aninternational impact on the global as well as nationalemissions of CH4 (Parashar et al., 1994). The Asian
Development Bank study: Asia Least Cost GreenhouseGas Abatement Strategy (ALGAS) was yet anotherimportant assessment on Greenhouse Gases at the 1990level (ALGAS, 1998). These studies in effect provided theimpetus to the work relating to impacts of ClimateChange in the country. Publications such as ClimateChange and India in 2002, 2003 and 2004 (Shukla et al.,2002 and 2003; Mitra et al., 2004) documented aconsolidated picture on Climate Change Assessments.The chronology of greenhouse gas emission estimatesmade in the country is shown in Table 2.1.
In 2004, for the first time in a well coordinated anddedicated effort was made to produce assessingGreenhouse Gases of anthropogenic origin from sectorssuch as Energy, Agriculture, Industry, Land Use, Land UseChange and Forestry and Waste and efforts were alsomade to assess the climate change Impacts andvulnerability of key sectors of economy in India’s InitialNational Communication to the UNFCCC (NATCOM,2004).
Currently, 127 institutions are working on differentaspects of climate change. The National Action Plan onClimate Change (NAPC, 2008) calls for launch onmissions on Agriculture, Water, Solar, Energy, Forestry,Himalayan Ecosystems and Strategic Knowledge onClimate Change. The mission programmes are atadvanced stages of preparation and would contributeto advancing the state of knowledge in the variousaspects of Climate Change.
2

India: Greenhouse Gas Emissions 2007Page 3
Gases CO2, CH4 CO2, CH4 CO2, CH4, CH4 CO2, CH4, CO2, CH4,CH4 N2O, NOX, N2O N2O
CO, NMVOC
Sectors Fossil fuel Transport All India Biomass Rice – All sources All sourcesRice Coal mines Campaign Cement extended (1996 (1996Animals Rice Rice - Oil & natural campaign guidelines) guidelines)
Livestock seasonally gas, manure (organic andintegrated Crop residue, non organicapproach and soils, MSW soils)water regimesdefined
Emission Published Used Developed Default and Developed Default IPCC 30% CountryFactors Emission published developed Specific and
Factors Emission 70% DefaultFactors
Base Year 1990 1990 1992 1990 1998 1990-1995 1994Reference Mitra et al., Mitra et al, Parashar et al, ALGAS India, Gupta et al., Garg , NATCOM
1991 1992 1994, 1997 1998 1999 Bhattacharya 2004& Shukla, 2001
Table 2.1: Chronology of greenhouse gas assessments carried out in India

Indian Network for Climate Change Assessment Page 4
Indian Network for Climate Change Assessment
A national workshop towards preparation of aComprehensive Climate Change Assessment wasorganized by the Ministry of Environment & Forests atNew Delhi on October 14th, 2009. The workshop waschaired by Hon’ble Minister of Environment & Forestsand attended by nearly 200 scientists/ expertsrepresenting premier institutions such as IIT, IIM, IISc,Universities, and research development institutionsunder the Council of Industrial Research, IndianCouncil of Agricultural Research, governmentMinistries / Departments, autonomous institutions,Non-governmental Organizations and privatecompanies. The workshop was also attended byrepresentatives of the media. Scientists presented theirwork on multidisciplinary aspects of Climate Changepresently supported by the MoEF. Principal ScientificAdviser to the Government of India addressed theworkshop and released the document titled, ‘TowardsComprehensive Climate Change Assessment’. Theworkshop was also addressed by Secretary, Environment& Forests.
During this workshop, Hon’ble Minister Jairam Rameshannounced the establishment of Indian Network forClimate Change Assessment (INCCA). Emphasizing theneed for INCCA, Minister underscored the significanceof availability of authentic national data for analysing theimplications of Climate Change vis-a-vis theunderstanding of Science of Climate Change, Impacts,Vulnerability, Adaptation and Mitigation of ClimateChange. In this context, it was emphasized that the ‘3Ms - Measuring, Modelling and Monitoring” are thehallmarks of the initiatives relating to Climate Change.
The Indian Network for Climate Change Assessment(INCCA) has been conceptualized as a network basedscientific programme designed to:
Assess the drivers and implications of climate changethrough scientific researchPrepare climate change assessments once every twoyears (GHG estimations and impacts of climatechange, associated vulnerabilities and adaptation)Develop decision support systemsBuild capacity towards management of climate changerelated risks and opportunities
It is visualized as a mechanism to create new institutionsand engage existing knowledge institutions alreadyworking with the Ministry of Environment and Forests aswell as other agencies. Currently, the institutions of thevarious Ministries such as that of Ministry of Environment& Forests, Ministry of Earth Sciences, Ministry ofAgriculture, Ministry of Science & Technology, DefenceResearch and Development Organisation etc., along withthe research institutions of the Indian Space ResearchOrganisation, Council of Scientific and IndustrialResearch, Indian Council of Agriculture Research,Department of Science & Technology, Indian Council ofMedical Research, Indian Institute of Technology, IndianInstitute of Managements and prominent state andcentral Universities, and reputed Non GovernmentalOrganisations and Industry Associations are working inthe various studies on Climate Change
The scope of the programmes under INCCA has beendeveloped on the basis of the fundamental questionsthat we ask ourselves for climate proofing systems andthe society dependent on climate and include, inter alia:
Short, medium and long-term projections of climatechanges over India at sub regional scalesThe impacts of changes in climate on key sectors ofeconomy important at various regional scalesThe anthropogenic drivers of climate change i.e.greenhouse gas and pollutants emitted from varioussectors of the economy
3

India: Greenhouse Gas Emissions 2007Page 5
The processes through which GHGs and pollutantsinteract with the climate system and change the bio-physical environment
The mandate of INCCA would continue to evolve toinclude the new science questions that confronthumanity including the population living within the Indianregion. The aim of scientific research under INCCA isenvisaged to encompass research that will developunderstanding on the regional patterns of climate acrossIndia, how it is changing over time and likely to behavein the future. Consequently, INCCA will also focus onthe impacts of the changing climate on regionalecosystem hotspots, human systems and economicsectors. The following programmes are initiallycontemplated to be carried out under the aegis ofINCCA:
A provisional assessment of the Green House Gasemission profile of India for 2007 by sources andremoval by sinks presented in this document;An assessment of the impacts of climate change onwater resources, agriculture, forests and human healthin the Himalayan region, North eastern region,Western ghats and Coastal regions of India;Undertake an assessment of black carbon and itsimpact on ecosystems;Undertake a long-term ecological, social, andeconomic monitoring of ecosystems to identify
patterns and drivers of change that influences thesustainability of livelihoods dependent on thesesystems across India;Build capacity through thematic workshops andtraining programmes; andSynthesize information thus generated in appropriatecommunication packages for informed decisionmaking
A schematic representation of the programmes in INCCAare shown in figure 3.1.
The approaches of the scientific programmes underINCCA would be to further develop network of Indianinstitutions drawing upon knowledge institutions thathave so far contributed towards scientific knowledge andexpand the same encompassing more number ofinstitutions in the country. Besides, INCCA would harnessInvolvement of Indian as well as Indian expertise abroadand would focus on four zones, namely, the Himalayanregion, the North eastern plains, the Western Ghats &the Coastal region. The assessment would stress todevelop climate projection scenarios and their impactson systems to evaluate the associated vulnerabilities fordeveloping adaptation strategies.
The Ministry of Environment and Forests, wouldcoordinate the activities under INCCA, taking advantage
Figure 3.1: Programmes envisaged under INCCA

Indian Network for Climate Change Assessment Page 6
of the wide spread network of knowledge institutionsestablished by the Ministry for carrying out variousprojects in areas related to climate change such as thescience and impacts of climate change and associatedpolicy issues.
The MoEF, through a system of a wide consultativeprocess with scientists and experts, envisages formulatingthe emerging scientific questions in the area of climatechange research that will govern the development of theprogrammes. A more comprehensive implementationarrangement will be put in place during the operationalphase of the programme which will include a scientificadvisory committee for guidance and review of theactivities of the various programmes.
THE 2007 ASSESSMENT &IMPLEMENTATION ARRANGEMENT
The official Greenhouse gas Emission Profile of India at1994 level was prepared for the India’s Initial NationalCommunication submitted to the UNFCCC in June,2004. The reason for restricting the estimation upto 1994was in pursuance of the requirement of reporting towardsimplementation of the obligations under the UNFCCCand the guidelines enjoining upon all the developingcountries to provide information on Greenhouse gas
emissions by sources and removals by sinks at 1994 levelusing Intergovernmental Panel on Climate Changeguidelines 1996 (Revised). This is for reasons ofcomparability of data across countries for calculation ofglobal emission trends. The next level of common yearof reporting is the year 2000.
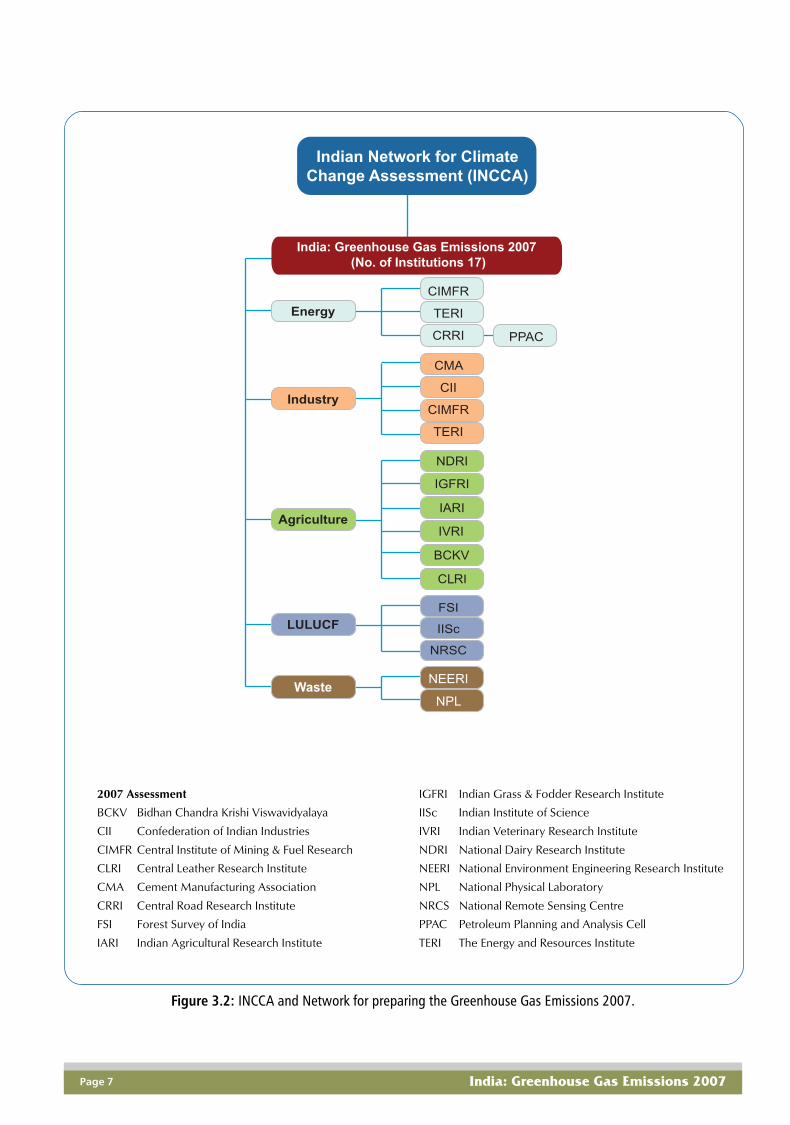
This assessment of greenhouse gas profile 2007 has beenworked out by a number of scientists/ experts drawnfrom the institutions which were involved in previousestimation as well as currently engaged in the preparationof inventories of greenhouse gases (see Annexure 3).These estimates though provisional fill the long felt needfor the latest emission data. For preparing the GHGemission inventory estimates presented in this document,expertise of a number of institutions has been pooled inacross the country and a network has been created thatcan generate information on a regular basis. The networkincludes institutions that have been working in the areaof greenhouse gas emission inventory developmentincluding the process of generation of country specificemission factors of GHGs for various anthropogenicactivities. It indeed makes the inventory scientificallyrobust. The network of institutions is drawn from a diversemix of premier national institutions currently workingunder various aspects of Climate Change with MoEF.(figure 3.2)
India: Greenhouse Gas Emissions 2007Page 7
Figure 3.2: INCCA and Network for preparing the Greenhouse Gas Emissions 2007.
2007 Assessment
BCKV Bidhan Chandra Krishi Viswavidyalaya
CII Confederation of Indian Industries
CIMFR Central Institute of Mining & Fuel Research
CLRI Central Leather Research Institute
CMA Cement Manufacturing Association
CRRI Central Road Research Institute
FSI Forest Survey of India
IARI Indian Agricultural Research Institute
IGFRI Indian Grass & Fodder Research Institute
IISc Indian Institute of Science
IVRI Indian Veterinary Research Institute
NDRI National Dairy Research Institute
NEERI National Environment Engineering Research Institute
NPL National Physical Laboratory
NRCS National Remote Sensing Centre
PPAC Petroleum Planning and Analysis Cell
TERI The Energy and Resources Institute

Indian Network for Climate Change Assessment Page 8
Greenhouse Gas Estimation - 2007
Towards fulfillment of its obligations of furnishinginformation relating to implementation of the Conventionin accordance with Article 4.1 and 12(1) of the UnitedNations Framework Convention on Climate Change,India has communicated its first national communicationto the UNFCCC in 2004 with GHG emission data forthe year 1994. Currently, India is preparing its secondnational communication for the base year 2000.However, there is a need for latest data on GHGemissions from the country, especially for informeddecision making. In this direction a network of institutionshave been put in place to prepared the 2007 GHGinventory (Refer to Figure 3.1).
4.1 COVERAGE
The 2007 assessment presents the estimates of CO2, CH4
and N2O emitted as a result of anthropogenic activitiesfrom various sectors of the economy at national level for
the year 2007. The sectors included are Energy, Industry,Agriculture, Land Use Land Use Change & Forestry andWaste. A schematic representation of the sectors, sourcecategories and the gases included in the present assessmentis shown in Figure 4.1.
An assessment of the collective emissions of CO2, CH4
and N2O expressed as Carbon Dioxide equivalent(CO
2 eq) has also been presented here, wherein CO
2
equivalent is the sum total of CO2, CH4 and N2O emittedin terms of their respective global warming potentials(GWP). Relative values of GWP of CO
2, CH
4 & N
2O are
presented in Table 4.1. For definition of GWP, see glossary.
By assigning a GWP value to a GHG, allows scientistsand policy makers to compare the potency of each gasto trap heat in the atmosphere relative to other gases.The heat trapping potential of other greenhouse gasesare measured and compared with CO2. The GWP of CO2
4
Source: IPCC AR4, 2007a
Industrial Designation Chemical Lifetime (years) Radiative Global Warming Potential for
or Common Name Formula Efficiency Given Time Horizon (100 yr)
(years) (W m–2 ppb–1)
Carbon dioxide CO2 Upto 100 yrs 1.4x10⁻⁵ 1
Methane CH4 12 3.7x10⁻⁴ 21
Nitrous oxide N2O 114 3.03x10⁻³ 310
Table 4.1: Global Warming Potential (GWP) of the GHGs

India: Greenhouse Gas Emissions 2007Page 9
Electricity Generation CO2, CH4, N2O
Other energy industries CO2, CH4, N2O
Road
Transport Rail CO2, CH4, N2O
Aviation
ENERGY Navigation
Residential CO2, CH4, N2O
Commercial/ institutional CO2, CH4, N2O
Agriculture/ fisheries CO2, CH4, N2O
FugitiveCoal mining
CH4Oil & Natural gas
Minerals Cement, Lime, glass,
ceramics, soda ash
Industry Metals Iron, steel, Ferro alloys, zinc,
aluminum, magnesium, lead
Chemicals Ammonia, nitric acid, adipic acid,
carbonates, others CO2, CH4, N2O
Textiles, leather, paper, food
Other industries processing, food & beverages,
non specified industries,
mining & quarrying
Non energy products Lubricant use,
from fuels Paraffin wax use CO2
Enteric fermentation in livestock CO2, CH4, N2O
Manure management
Agriculture Rice cultivation CH4
Agricultural soils N2O
Burning of crop residue CH4, N2O
Land Use, Land Forest land
Use Change & Crop land CO2
Forestry Grass land
Settlements
Waste Municipal Solid Waste
Wsate WaterCH4, N2O
SECTOR EMISSION CATEGORY GAS
Figure 4.1: Sectors, emission categories and emissions presented in this assessment(Also see glossary for details)

Indian Network for Climate Change Assessment Page 10
is taken as one and accordingly CH4 has a GWP of 21and N
2O has a GWP of 310.
4.2 METHODOLOGY, ACTIVITY DATAAND EMISSION FACTORS
Methodology: The estimates presented here have beencalculated using standard methodologies contained inthe Revised 1996 IPCC Guidelines for NationalGreenhouse Gas Inventories (IPCC, 1997), the IPCCGood Practice Guidance and Uncertainty Managementin National Greenhouse Gas Inventories (IPCC 2000),and the IPCC Good Practice Guidance for Land Use,Land-Use Change, and Forestry (IPCC 2003).
The simplest representation of the methodology usedfor estimating particular GHG emission from each sourcecategory is when activity data for a source category ismultiplied by respective emission factor to obtainemissions from that source category for a specific gas.To calculate the total emissions of a gas from all its sourcecategories, the emissions are summed over all sourcecategories (see equation below).
EmissionsGas
= ∑Category
A
x
EF
Here EmissionsGas is the emissions of a given gas from allits source categories, A is the amount of individual sourcecategory utilized that generates emissions of the gasunder consideration, EF is the emission factor of a givengas by type of source category (emissions per unit ofactivity data utilized).
Activity data: Activity data for 2007 have been primarilyderived from the published documents of the variousministries and organizations of the Government of India,from industry associations (such as the CementManufacturers’ Association (CMA) of India) and fromreputed data organizations such as the CMIE. SeeAnnexure 1 for a comprehensive list of activity datasources.
Emission factors: The emission factors used in this reportare a mix of default emission factors available in IPCCpublications (1997, 2000, 2003 and 2006) and countryspecific emission factors. Default
emission factors have
been used for gases and categories where countryspecific factors are not available. Some of the countryspecific emission factors used in this document include
emissions factors of CO2 from coal (Choudhury et al.,2004), CH
4 from coal mining (Singh A K, 2004), N
2O
from nitric acid production (Rao et al. ,2004), CO2 fromcement (Rao et al., 2006), CH4 from rice (Gupta etal., 2004), CH
4 from enteric fermentation in livestock
(Swamy et al., 2006), N2O from soils (Pathak et al.,2002); CH4 from Municipal solid waste (Jha et al.,2007) amongst others. See Annexure 2 for completelist of references.
Tier of estimation: Tiers of estimation of GHGs is anIPCC parlance suggesting the level of complexity appliedin estimating the GHG emissions from a particular sourcecategory. The Tiers of estimate range between Tier I. II,& III. Higher Tier implies a more data intensive effort (seebox 4.3). For example, CH4 from rice cultivation isestimated by using Tier III approach, where by the totalrice area is divided into areas characterizing differentwater management practices in the country. The GHGemission factors used for estimating CH
4 from these
areas are actual measurements carried out thatrepresent CH4 emission/unit area covering a eachdif ferent
water management practice. Efforts are
generally made to use a Tier II or III (i.e a data intensiveapproach) for categories that are identified as keyemissions categories (see Chapter 11, for more detailson key categories).

India: Greenhouse Gas Emissions 2007Page 11
Box 4.3: Methodology Tiers
Tier I approach employs activity data that are relativelycoarse, such as nationally or globally availableestimates of deforestation rates, agriculturalproduction statistics, and global land cover maps.
Tier 2 use the same methodological approach as Tier1 but applies emission factors and activity data whichare defined by the country.
Tier 3 approach uses higher order methods are usedincluding models and inventory measurement systemstailored to address national circumstances, repeatedover time, and driven by disaggregated levels.
In this report, Tier III approach has been applied toestimate CH4 from enteric fermentation in livestock, CH4
from rice paddy cultivation, CO2 from cement, and CH4
from coal mining. Tier II approach has been used forestimating CO2 from coal combustion for electricitygeneration, CO2 from iron and steel production, CO2
from road transport sector, N2O from soils, GHGs fromcrop residue burning, and CH4 from industrial waste waterand municipal solid waste. Rest of the emission categoriesuse Tier I methodology.

Indian Network for Climate Change Assessment Page 12
Energy
Carbon emissions = ∑ fuel consumption expressed in energy units for electricity generationFuel type x carbon emission factor - carbon stored x fraction oxidised
Non CO2 emissions = ∑ fuel consumption x Net Calorific value of Fuel x gas-specific emission factorsFuel type
The energy systems of most economies are largely drivenby the combustion of fossil fuels, namely, coal, oil andnatural gas and are the major sources of emissionsamongst all other sectors. Fossil fuel combustion oxidizesthe carbon in the fuel and it is emitted as CO
2. Some C is
also released in the form of CO, CH4, and non-methanehydro carbons which is oxidised to CO2 in 10-11 years.Also emitted are N
2O, SO
2, and black carbon. This
document includes CO2, CH4 and N2O emitted fromfossil fuel combustion in
Electricity generation;Transportation including road, rail, aviation &navigation;Commercial, institutional, residential, agriculture andfisheries and;
Fugitive emissions from coal mining & handling, andfrom exploration of oil and natural gas and theirtransport and storage are also accounted for in thissector.
5.1 METHODOLOGY AND CHOICE OFEMISSION FACTORS
The IPCC 1996 revised guidelines (IPCC, 1997)methodology has been used for estimating the GHGemission from various types of fossil fuel combusted inthe energy sector. The general equation representing theemissions is shown in the box below.
The emission factors of the fossil fuels such as coal, oiland natural gas are the most important considerationsin estimating the GHG emissions from combustion ofthese fuels. In India, coal as a fuel constitutes more than50% of the total fossil fuel mix of the country used forenergy related activities. This document uses the countryspecific CO2 emission factors derived on the basis of NetCalorific Values (NCVs) of different types of coalproduced in the country, namely, coking, non coking andlignite (NATCOM, 2004; Choudhry et al., 2006). SeeTable 5.2 for the list of NCVs and CO2 emission factorsused for various fuels for the present estimations. Thenon-CO2 emissions have been estimated using non-CO2
default emission factors for different fuel types publishedin IPCC, 1997 & 2006.
5

India: Greenhouse Gas Emissions 2007Page 13
Table 5.3: GHG emissions in ‘000 tons (or Giga gram) from the energy sector in 2007
CO2 CH4 N2O CO2 equivalent
GRAND TOTAL 1497029.20 20564.20 239.31 1727706.10ENERGY 992836.30 4266.05 56.88 1100056.89Electricity generation 715829.80 8.14 10.66 719305.34Other energy industries 33787.50 1.72 0.07 33845.32Transport 138858.00 23.47 8.67 142038.57
Road transport 121211.00 23.00 6.00 123554.00Railways 6109.00 0.34 2.35 6844.64Aviation 10122.00 0.10 0.28 10210.90Navigation 1416.00 0.13 0.04 1431.13
Residential 69427.00 2721.94 36.29 137838.49Commercial / Institutional 1657.00 0.18 0.04 1673.18Agriculture/ Fisheries 33277.00 1.20 1.15 33658.70Fugitive emissions 1509.40 31697.30Bunkers* 3454 0.03 0.10 3484.45Aviation Bunkers 3326 0.02 0.09 3355.31Marine bunkers 128 0.01 0.003 129.14
5.2 OVERVIEW OF GHG EMISSIONSFROM THE ENERGY SECTOR
In 2007, the energy sector in India emitted 1100.06million tons of CO2 equivalent. Out of this 992.84 milliontons were emitted as CO2, 4.27 million tons as CH4 and0.057 million tons as N2O (Table 5.3). About 65.4% ofthe total CO2 equivalent emissions from the energy sectorwas from the electricity generation. This includesemission from electricity produced for distributionthrough grids as well as for captive generation ofelectricity in various industries (Figure 5.1). The transportsector emitted 12.9% of the total CO2 equivalentemissions in 2007. The residential sector has a rural andurban spread, and therefore it combusts both fossil fuelas well as biomass which together emitted 12.6% of thetotal GHG emitted from the energy sector. Rest of the9.2% GHG emissions were from fuel combusted in thecommercial and residential sector, in agriculture andfisheries, the fugitive emissions from coal mining, and fromextraction, transport and storage of oil and natural gas.(figure 5.1)
5.3 ELECTRICITY GENERATION
The Total installed capacity for electricity generation fromthermal power plants in India in 2007 was 89275.84 MW
Note: ‘000 tons= 1Giga Gram = 109 grams and 1 million ton = 1012 grams*Bunkers not added to the total emissions from the energy sector nor to the national totals
NCV (Tj/kt) CO2 EF (t/Tj)
Coking coal 24.18 93.61Non-coking Coal 19.63 95.81Lignite 9.69 106.15Diesel 43 74.1Petrol 44.3 69.3Kerosene 43.8 71.9Fuel oil 40.4 77.4Light distillates 43.0 74.1CNG 48 56.1LPG 47.3 63.1Lubricants 40.2 73.3ATF 44.1 71.5
Table 5.2: NCV and CO2 emission factors of differenttypes of fuel used for estimation
Note: NCV- Net Calorific Value; EF- Emission Factor; Tj = 1012Joule;1 Joule = 2.39x 10⁻⁴Kcal
(CEA, 2008). Additionally captive power generation,especially used in the industries for dedicated powersupply was around 11600 MW. For electricity generationin 2007, coal utilization was 90% of the total fuel mix.Natural gas and oil constituted 8% and 2% of the fuelmix respectively. It is estimated that in 2007, the totalGHG emissions from electricity generation was 719.31million tons CO2 eq of which 715.83 million tons was

Indian Network for Climate Change Assessment Page 14
emitted as CO2, 8.14 thousand tons as CH4 and 10.66thousand tons as N2O. The distribution of the emissionsby fuel type are shown in figure 5.2. It is clear that 90%of the emissions of CO2, CH4 and N2O were due to coalcombusted in this activity.
5.4 PETROLEUM REFINING & SOLIDFUEL MANUFACTURING
All combustion activities supporting the refining ofpetroleum products is included here. Does not includeevaporative emissions occurring at the refinery. Theseemissions are reported separately under fugitiveemissions. It also includes emissions arising from fuelcombustion for the production of coke, brown coalbriquettes and patent fuel. The total CO2 equivalentemissions from solid fuel manufacturing and petroleumrefining in 2007 was 33.85 million tons, and out of this97% of the emissions were from solid fuel manufacturing.
5.5 TRANSPORT
The transport sector emissions include all GHG emissionsfrom road transport, railways, aviation and navigation.Due to rapid economic growth in India over the last twodecades the demands for all transport services,particularly road transport and aviation has increasedmanifold, it has a share of 4.5% in India’s GDP. The totalnumber of registered vehicles in the country hasincreased from 5.4 million in 1981 to 99.6 million in 2007(figure 5.3). Two wheelers and cars constitute nearly 88%of the total vehicles at the national level (MoRTH, 2008).
The total commercial energy consumption in the
transport sector in 2007 is estimated to be 1766.6 PJ,that includes an array of fuels, such as diesel, petrol, coal,ATF, kerosene, LDO, FO, CNG, and LPG. Dieselcomprises 65% of total energy used in the road transportsector, followed by petrol (24%) and ATF (7%)respectively. The rest (4%) constitute of coal, LDO, FO,CNG & LPG (Figure 5.4).
Consequently, it is estimated that the transport sectoremitted 142.04 million tons of CO2 eq in 2007, of which138.86 million tons were emitted as CO
2, 0.023 million
tons as CH4 and 0.009 million tons as N2O (refer to table5.1). The road transport sector emitted 123.55 milliontons of CO
2 eq, which is 87% of the total emissions from
the transport sector. In terms of specific gases, the roadtransport sector emitted, 121.21 million tons of CO2,
Figure 5.1: GHG emission distribution from the energy sector (million tons of CO2 eq)
Figure 5.2: Fuel mix and GHG emissions in million tonsfrom electricity generation

India: Greenhouse Gas Emissions 2007Page 15
5.6 RESIDENTIAL/ COMMERCIAL ANDAGRICULTURE/FISHERIES
Energy consumed in the residential sector is primarilyused for cooking, lighting, heating and householdappliances. Usage of LPG as the primary source ofcooking by households in urban India exceededconsumption of the same by rural households by 48%.Biomass fuels such as fuel wood, crop residues, andanimal dung continue to be the dominant fuels used byrural households. In the commercial sector, key activitiesinclude lighting, cooking, space heating/cooling,pumping, running of equipments and appliances. Sourcesof energy for the sector are grid based electricity, LPG,kerosene, diesel, charcoal and fuel wood. Data for LPGand Kerosene have been obtained from Ministry ofPetroleum and Natural Gas (MoPNG).
Commercial and institutional sector also sees extensiveuse of captive power generation across the country dueto frequent power shortages in various seasons. Thesepower generation units generally run on diesel. In urbansector the important sources of energy are kerosene(10%), firewood & chips (22%) and LPG (57%). Biomassfuels such as fuel wood, crop residue and animal dungcontinue to be the dominant fuel used by rural households.
In 2007, the residential sector emitted 137.84 million tonsof CO
2 equivalent, of which 69.43 million tons were in
the form of CO2 emissions, mainly from fossil fuel use inthe residential sector (refer to table 5.3). The CH4 andN
2O emissions were 2.72 million tons and 0.036 million
Figure 5.3: Growth in transport sector(‘000 number of vehicles)
Figure 5.4: Distribution of fuel use in thetransport sector in 2007 (in PJ)
0.023 million tons of CH4 and 0.006 million tons of N2O.Aviations emitted 10.21 millions of CO
2 equivalent in
2007 and is the second largest emitter in transport sector.Almost the entire emissions from aviation sector wasemitted as CO
2 (10.12 million tons). The railways emission
are mostly driven by diesel, with very small use of otherliquid fuels. The coal use in railways has become minimal.The railways emitted 6.84 million tons of CO
2 eq in 2007,
and again more than 90% of the emissions were in theform of CO2. The navigation emitted 1.43 million tonsof CO
2 equivalent and out of this 1.41 million tons were
emitted as CO2. (Figure 5.5).
Figure 5.5: CO2 equivalent emission distribution fromvarious modes of transport within the transport sector

Indian Network for Climate Change Assessment Page 16
tons of CH4 and N2O respectively. The CH4 emissionsare driven by the biomass consumption in the residentialsector.
The commercial/institutional sector used fossil fuel forits energy needs and emitted 1.67 million tons of CO2
eq, of which more than 99% was CO2 (1.65 million tons).The agriculture and fisheries sector emitted 33.7 milliontons of CO2 equivalent, and again more than the 99% ofthe emissions were in the form of CO2.
5.7 FUGITIVE EMISSIONS
Fossil fuels such as coal, or natural gas when extracted,produced, processed or transported, emit significantamount of methane to the atmosphere. The totalemission from these two sources, comprise only of CH4
emission and India emitted 31.69 million tons CO2 eq. Itconstitutes 97.8% of the total CH4 emitted from theenergy sector. CH4 emissions from both surface mining
and underground mining of coal have been estimatedby using country specific emission factors measured insample coal mines of different gassiness across the India.Further the emission estimates combine the emissionsduring mining and post mining activities. (Table 5.4) :coal mining lead to 0.73 million tons
CH4 emission from oil and natural gas industries occurdue to leakage, evaporation and accidental releases fromoil and gas industry. Emissions from venting and flaringare activities that are managed as part of normaloperations at field processing facilities and oil refineries.Each of these three major categories is in turn dividedinto several subcategories. Venting and flaring emissionsoccur at several stages of the oil and gas productionprocess. The structure of the categories means that asingle process can contribute greenhouse gas emissionsto two or more categories of emissions. Emission factorsfor estimating CH4 from oil and natural gas systems isgiven in Table 5.5.
Table 5.5: CH4 emission from Oil and natural gas systems
Table 5.4: Country specific emission factors for estimating CH4 emission from coal mining activities
Emission Factor(m3 CH
4 / tons)
Underground Mines Mining Deg. I 2.91Deg. II 13.08Deg.III 23.64
Post-Mining Deg. I 0.98Deg. II 2.15Deg.III 3.12
Surface Mines Mining 1.18Post-Mining 0.15
Emission factor/unit of activity
No. of Wells 0.003 Gg/wellOil Production 0.000334 Gg/’000 tonsRefinery Throughput 6.75904×10⁻⁵
Gg/million tonsGas Production 0.003556 Gg/MMCMGas Processing 0.010667 Gg/MMCMGas distribution 0.010667 Gg/MMCMLeakage 0.006482 Gg/MMCMFlaring 0.000641 Gg/MMCM
Source : IPCC (2000,2006)

India: Greenhouse Gas Emissions 2007Page 17
Industry
The industry sector includes emissions from fossil fuelcombustion and the emissions related to various processto manufacture industrial goods. The categories coveredunder this sector are:
Minerals - Cement, glass production, ceramics;Chemicals - Ammonia, nitric acid, Carbides, TitaniumOxide, Methanol, Ethylene, EDC and VCMproduction, Carbon black, and Caprolactam etc.;Metal - Iron and steel, Ferro alloys, Aluminum, lead,zinc & copper;Other industries - textiles, leather, food & beverages,food processing paper & pulp, non specified industriesand mining and quarrying;Non energy product uses of Lubricant and paraffinwax.
While the GDP has increased in India, the share ofindustry in the increased GDP has remained constant at27% between 1990 and 2007. The annual growth of theoverall Index of Industrial Production (IIP), a measure ofthe absolute level and percentage growth of industrialproduction, has shown a steady increasing trend between2000 and 2007. The growth rate has doubled with growthrate increasing from 5% to 10.6% (Ministry of Statistics& Programme Implementation, 2009), a sign of a fastemerging economy.
6.1 METHODOLOGY AND CHOICE OFEMISSION FACTORS
For estimating the GHG emissions from the Industrysector, the IPCC 1996 revised guidelines (IPCC, 1997)have been used for each of the categories. The activitydata for the various industries are sourced from nationalstatistical organizations, from listed companies, theannual reports of ministries of the Government of India,research organizations, trade magazines and otherpublications of the sector associations (see Annexure 1).
The energy conversion units and the emission factorsused for fossil fuel combustion related to fossil andbiomass are same as indicated in table 5.2 in the energysector. The emission factors used for the process part ofthe emissions are presented in Table 6.1. For cement andnitric acid production the CO2 and N2O are based oncountry specific circumstances (Rao et al., 2004).
6.2 OVERVIEW OF GHG EMISSIONSFROM INDUSTRY
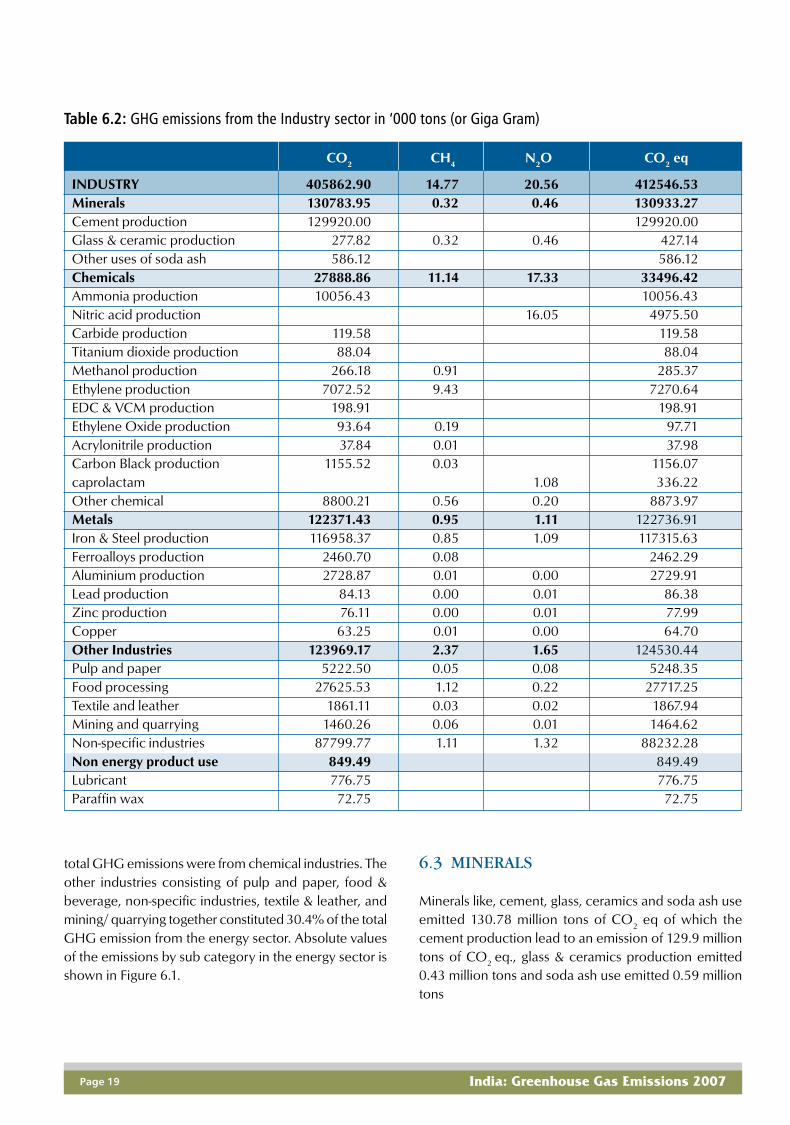
The summary of GHG emissions from the Industry sectoris given in Table 6.2. In 2007, the total CO2 equivalentemission from this sector was 412.55 million tons. Itemitted 405.86 million tons of CO2, 0.15 million tons ofCH4 and 0.21 million tons of N2O. 31.7% of the totalCO2 equivalent emissions from Industry sector were frommineral industries where as 28.4% of the total GHGemissions were from metal industries. About 8.1% of the
6

Indian Network for Climate Change Assessment Page 18
Category Gas Emission factor Source
Cement production CO2 0.537 t CO2/t Clinker produced (incorporates CKD) CMA, 2010Glass production CO2 0.21 t CO2/t glass (Container Glass); 0.22 t CO2/t glass IPCC 2006
(Fibre Glass); 0.03 t CO2/t glass (speciality glass)
Other sources of CO2 0.41492 t CO2/t carbonate IPCC 2006soda ashAmmonia CO
2Carbon content of natural gas has been taken as 99.5% and NATCOM 2004
production carbon oxidation factor has been taken as 14.4 kg C/GJFuel requirement = Middle point value of the range Oral communication7.72 - 10.5 million Kcal/tonne of Ammonia by Fertilizer
Association of IndiaCaprolactam N2O 9 kg N2O/t chemical produced IPCC 2006productionCarbide production CO2 1.1 t CO2/t CaC2 produced IPCC 2006Titanium dioxide CO2 1.385 tons CO2/tons TiO2 produced IPCC 2006production (Avg. of EFs)Methanol CO2 0.67 tons CO2/tons methanol produced IPCC 2006
CH4 2.3 kg CH4/tons methanol produced IPCC 2006Ethylene CO
21.73 t CO
2/tons ethylene produced IPCC 2006
CH4 3 kg CH4/t ethylene produced IPCC 2006EDC & VCM CO2 0.296 t CO2/tons EDC produced; IPCC 2006
0.47 tons CO2/tons VCM produced
Ethylene Oxide CO2 0.863 tons CO2/t Ethylene oxide produced IPCC 2006CH4 1.79 kg CH4/tons Ethylene oxide produced IPCC 2006
Acrylonitrile CO2
1 ton CO2/ton acrylonitrile produced IPCC 2006
CH4 0.18 kg CH4/ton acrylonitrile produced IPCC 2006Carbon black CO2 2.62 ton CO2/ton carbon black produced IPCC 2006
CH4
0.06 kg CH4/ton carbon black produced IPCC 2006
Iron & Steel CO2 1.46 ton CO2/ton production (BOF); 0.08 ton CO2/ton IPCC 2006production production (EAF); 1.72 ton CO2/ton production (OHF);
0.7 ton CO2/ton production (DRI)
Ferroalloys CO2 4.8 ton CO2/ ton ferrosilicon produced; 1.5 ton CO2/ton IPCC 2006production ferromanganese produced; 1.1 kg CH4/ t ferrosilicon
producedCH4 1.1 kg CH4/ton ferrosilicon produced IPCC 2006
Aluminium CO2 1.65 ton CO2/ton aluminium produced IPCC 2006production (Avg. of EFs)
Lead production CO2 0.58 ton CO2/ton lead produced (Imperial smelting IPCC 2006furnace); 0.25 t CO2/ton lead produced (direct smelting);0.2 ton CO
2/ton lead produced (secondary production)
Zinc production CO2 0.53 ton CO2/ton zinc produced (pyro-metallurgical process) IPCC 2006Lubricant use CO2 20 ton-C/TJ (Carbon content); 0.2 (ODU factor -oxidised IPCC 2006
during use factor)Paraffin wax use CO2 20 ton-C/TJ (Carbon content); 0.2 (ODU factor -oxidised IPCC 2006
during use factor)
Table 6.1: Emission factors used for estimating process emissions
India: Greenhouse Gas Emissions 2007Page 19
CO2 CH4 N2O CO2 eq
INDUSTRY 405862.90 14.77 20.56 412546.53Minerals 130783.95 0.32 0.46 130933.27Cement production 129920.00 129920.00Glass & ceramic production 277.82 0.32 0.46 427.14Other uses of soda ash 586.12 586.12Chemicals 27888.86 11.14 17.33 33496.42Ammonia production 10056.43 10056.43Nitric acid production 16.05 4975.50Carbide production 119.58 119.58Titanium dioxide production 88.04 88.04Methanol production 266.18 0.91 285.37Ethylene production 7072.52 9.43 7270.64EDC & VCM production 198.91 198.91Ethylene Oxide production 93.64 0.19 97.71Acrylonitrile production 37.84 0.01 37.98Carbon Black production 1155.52 0.03 1156.07caprolactam 1.08 336.22Other chemical 8800.21 0.56 0.20 8873.97Metals 122371.43 0.95 1.11 122736.91Iron & Steel production 116958.37 0.85 1.09 117315.63Ferroalloys production 2460.70 0.08 2462.29Aluminium production 2728.87 0.01 0.00 2729.91Lead production 84.13 0.00 0.01 86.38Zinc production 76.11 0.00 0.01 77.99Copper 63.25 0.01 0.00 64.70Other Industries 123969.17 2.37 1.65 124530.44Pulp and paper 5222.50 0.05 0.08 5248.35Food processing 27625.53 1.12 0.22 27717.25Textile and leather 1861.11 0.03 0.02 1867.94Mining and quarrying 1460.26 0.06 0.01 1464.62Non-specific industries 87799.77 1.11 1.32 88232.28Non energy product use 849.49 849.49Lubricant 776.75 776.75Paraffin wax 72.75 72.75
Table 6.2: GHG emissions from the Industry sector in ‘000 tons (or Giga Gram)
total GHG emissions were from chemical industries. Theother industries consisting of pulp and paper, food &beverage, non-specific industries, textile & leather, andmining/ quarrying together constituted 30.4% of the totalGHG emission from the energy sector. Absolute valuesof the emissions by sub category in the energy sector isshown in Figure 6.1.
6.3 MINERALS
Minerals like, cement, glass, ceramics and soda ash useemitted 130.78 million tons of CO
2 eq of which the
cement production lead to an emission of 129.9 milliontons of CO2 eq., glass & ceramics production emitted0.43 million tons and soda ash use emitted 0.59 milliontons

Indian Network for Climate Change Assessment Page 20
6.4 CHEMICALS
Emission estimates have been made on account ofcombustion of fossil fuel and processes involved in theproduction of chemicals such as ammonia, nitric acid,carbide, methanol, titanium dioxide, adipic acid, ethylene,carbon black and caprolactam. The total amount of GHGemitted from this sector in 2007 was 33.50 million tonsof CO2 equivalent. Total amount of CO2 produced fromthis sector was 27.89 million tons. CH
4 and N
2O emissions
were 0.11 & 0.17 million tons respectively.
6.5 METALS
The metal production emissions are estimated fromproduction of iron and steel, aluminum and from othermetals such as zinc, lead, magnesium, ferro alloys andcopper. The total GHG emission from this sector was122.74 million tons which constituted 29.7% of the totalGHG emitted from this category in the industry sector.The total amount of CO
2 emitted from this category is
122.37 million tons; miniscule emissions are emitted inthe form of CH4 and N2O.
6.6 OTHER INDUSTRIES
These include emissions from pulp and paper production,food and beverage, textile & leather, non-specifiedindustries, and mining/quarrying activities. The non-
specified industries include Manufacture of rubber andplastics products, medical, precision and opticalinstruments, watches and clocks, other transportequipment, furniture, recycling etc. for which data is notavailable separately. Other industries emitted together124.5 million tons of CO2 equivalents in 2007, of which123.9 million tons were emitted as CO2. Minisculeamounts of CH4 and N2O were also emitted from thissector, which constituted less than 1% of the total GHGemission from this sector.
6.7 NON-ENERGY PRODUCT USE
Includes emission of GHGs due to use oil products andcoal-derived oils primarily intended for purposes otherthan combustion. This category includes CO2 emissionsfrom use of paraffin wax and lubricant and together theyemitted 849.5 thousand tons of CO2 which is 0.2% ofthe total GHG emission from this sector.
6.8 A DESCRIPTION OF FOSSIL FUELAND PROCESS BASED EMISSIONS
This section highlights the differences in process and fossilfuel combustion related CO2 emissions from industries.As an example, the major industries such as cement, ironand steel, chemicals and non-ferrous metal productionhave been included. Figure 6.2 depicts the relativeemissions due to fossil fuel combustion and processemissions in these industries.
Figure 6.1: CO2 emission in Million tonsfrom Industry
Figure 6.2: Relative CO2 emissions in million tons due tofossil fuel combustion and process emissions in different
industries

India: Greenhouse Gas Emissions 2007Page 21
Cement industry - emitted 129.92 million tons of CO2. 56% of these emissions were from process and 44%from fossil fuel combustion. These emissions are fromdiverse types technologies for manufacturing cement inIndia. See Table 6.3 for the technological status of Indiancement industry. (Figure 6.2)
Iron and steel - Emits 116.96 million tons of CO2. Thefossil fuel combustion and process related emissionsconstitute 59% and 41% of the total emissions relatedfrom this industry respectively, (Figure 6.2)
Table 6.3: Technological Status of Indian Cement Industry as of Dec, 2007
**Grinding capacitySource: CMA Basic Data, Annual Publication – 1994 to 2009
Mini-Vertical Mini-Rotary Wet Semi-Dry Dry GrindingShaft Kiln kiln Process Units
No of Plants 193 17 26 4 107 29
Total Capacity
(million tones) 1.51 3.11 5.71 1.80 146.56 20.3
Percent of total cement 0.84 1.73 3.18 1.00 81.87 11.34
capacity
Average kiln 30 -75 200-800 150-900 600-1300 2400-10,000 **600-2500
Capacity [TPD]
Fuel consumption 850-1000 900-1000 1200-1400 900-1000 670- 775 Nil (except
(Kcal/kg. Clinker) for captive
power plants)
Power Consumption 110-125 110-125 115-130 110-125 85-92 **35-45
(Kwh/tonne of cement)
Chemicals - All chemicals, together emit 37.9 million tonsof CO2. Out of this 49.6% is from process relatedemissions and 50.4% of the CO2 emissions are due tofossil fuel combustion. (figure 6.2)
Non-Ferrous metals - Constituting of aluminium, zinc,lead and copper together emitted 2.95 million tons ofCO
2. 45% of these emissions were from process and
55% from fossil fuel combustion in non-ferrous metalindustries. (Figure 6.2)

Indian Network for Climate Change Assessment Page 22
Agriculture
Figure: 7.1: CO2 equivalent emissions fromAgriculture sector (million tons)
7.1 OVERVIEW OF THE AGRICULTURESECTOR EMISSIONS
Agriculture sector emitted 334.41 million tons of CO2
equivalent, of which 13.76 million tons is CH4 and 0.15million tons is N
2O. Enteric fermentation constituted 63%
of the total CO2 equivalent emissions from this sector, 21%of the emissions were from rice cultivation. Crop soilsemitted 13% of the total CO
2 equivalent emission from
agriculture. Rest 2.7% of the emissions are attributed toLivestock manure management and burning of cropresidue (Table 7.1 and Fig. 7.1).
The GHG emissions from the agriculture sector areemitted mainly in the form of CH4. These are due toenteric fermentation and from rice paddy cultivation.N2O is also emitted from this sector and is mainly fromthe agricultural fields due to application of fertilizers. Thesources of emissions included in the agriculture sectorare:
LivestockEnteric fermentationAnimal manure
Rice cultivationUplandIrrigated - continuously flooded, singular aeration,multiple aerationRainfed - drought prone, flood proneDeep water
Agriculture soilsDirect emissionsIndirect emissions
Field burning of agriculture crop residue
CH4 N2O CO2 eq.
13767.80 146.07 334405.50Enteric fermentation 10099.80 212095.80Manure management 115.00 0.07 2436.70Rice cultivation 3327.00 69867.00Soils 140.00 43400.00Crop residue 226.00 6.00 6606.00
Table 7.1: Summary of GHG emissions from theagriculture sector in thousand tons
7

India: Greenhouse Gas Emissions 2007Page 23
Species Livestock population (in ‘000)1997 2003 CAGR 2007
Crossbred cattle 20099 24686 3.48 28306.0Indigenous cattle 178782 160495 -1.7 148348.2Total cattle 198881 185181 -1.2 176654.2Buffaloes 89918 97922 1.4 103522.0Yaks 59 65 1.6 69.3Mithuns 177 278 7.8 176136.0Total bovines 289035 283446 -0.3 279727.1Sheep 57494 61469 1.1 64320.0Goats 122721 124358 0.2 125546.0Pigs 13291 13519 0.3 13635.0Horses & ponies 827 751 0.01 800.0Mules 221 176 -0.1 200.0Donkeys 882 650 -6.5 458.0Camels 912 632 -6.2 465.0Total livestock 485385 485002 -0.01 484733.5
Table 7.2: Livestock population estimates for 2007
7.2 ENTERIC FERMENTATION
In India, livestock rearing is an integral part of its cultureand is an important component of the agriculturalactivities. Although the livestock includes cattle,buffaloes, sheep, goat, pigs, horses, mules, donkeys,camels and poultry, the bovines and the small ruminantsare the most dominant feature of Indian agrarianscenario, and constitute major source of methaneemissions. Traditionally cattle are raised for draughtpower for agricultural purposes, and cows and buffaloesfor milk production. The cattle and buffaloes provideeconomic stability to farmers in the face of uncertaintiesassociated with farm production in dry land/rain-fedcropped areas. Currently, most of the cattle are low-producing non-descript, indigenous breeds and only asmall percentage (5-10 per cent) is of a higher breed(cross-bred and higher indigenous breeds). Even in thecase of buffaloes, there are very few high yield animals(10–20 per cent). Sheep rearing is prevalent in many areasbecause of smaller herd sizes, which are easy to raiseand manage, providing year-round gainful employmentto the small and marginal farmers.
Cattle and buffalo, which are the main milk-producinganimals in the country, constitute 61 per cent of the totallivestock population in India. The average milk producedby dairy cattle in India is 2.1 kg/day,
Whereas, buffaloes produce 3.5 kg/day (MOA, 2004),which is much less than the milk produced by cattle inthe developed countries (IPCC Revised Guidelines,1997). This is mainly due to the poor quality of feedavailable to the cattle, specially domesticated in ruralhouseholds, in spite of the low-energy value of feedintake.
The livestock census is carried out every 5 years. Thelast census data is available for 2003. To estimate thelivestock population for 2007, the 2003 data isextrapolated using the compounded annual growth rateof each type of livestock between 1997 and 2003 (seetable 7.2).
In order to estimate the CH4 emission from livestock, ata higher tier, the cattle population has been divided intodairy and nondairy categories, with sub classification intoindigenous and cross-bred types for different age groups(MOA, 2005). The dairy cattle has been characterizedas cross bred, it has high milk yield and calves once in ayear. The indigenous cattle have the typical characteristicof having lower body weights as compared to cross bredsand they have lower milk yield and also calve once ayear. The Lactating buffalo are classified as dairy buffalo.Non dairy cattle & buffalo include calves below one year,adults beyond calving age, and those within one to twoyears of age.
Source: MOA, 2005

Indian Network for Climate Change Assessment Page 24
Using the emission factors provided in the report(NATCOM, 2004), it is estimated that the Indian livestockemitted 9.65 million tons in 2007 (see table 5.10). Thisconstitutes 96% of the total CH4 released from this sector.Buffalo is the single largest emitter of CH4, as it constitutes60% of the total CH4 emission from this category, simplybecause of its large number compared to any otherlivestock species and also because of the large CH4
emission factor with respect to others.
Using the same approach for extrapolating thepopulation of other livestock, namely, goats, sheep,chicken, camels, and others, and using the IPCC defaultCH4 emission factors for these species (IPCC, 2002), it isestimated that the total CH4 emitted from thesecategories is 36 thousand tons. The total CH4 emittedfrom enteric fermentation in livestock is thus 10.09 milliontons.
7.3 MANURE MANAGEMENT
Not much systematic management of manure fromlivestock is done in India. It is mainly converted into dungcakes and is used for energy purposes in rural areas. It isestimated that about 0.115 million tons of CH4 and 0.07thousand tons of N2O are emitted from this source.
Methodology and emission factor choices: The dungmanagement practices vary in dif ferent regionsdepending upon the need of the fuel and manure as wellas the available fuel resources and climatic conditions ofthe regions. Dung management systems, generallyfollowed in India, are as follows:
Dung cakes
The dung of stall fed cattle and buffaloes, irrespective oftheir age, production status, and feeding is collected andon an average 50% is converted in dung cake daily inthe morning mainly by the women folk of the householdin India. The collected dung is mixed with the residualfeed (mainly straws) of animals and dung cake of circularshape (weighing 0.5 to 2.5 kg) is prepared by hand andput out in the sun for drying. Drying is generallycompleted within 3-5 days during summer season and7-10 days during winter season. After drying, the dungcakes are staked in to a conical structure, which isplastered with dung on the upper surface before onsetting the monsoon season. Some farmers store this
source of fuel in the closed rooms. Under the prevailingsituation methane emission is not expected from thedung cake. It is contrary to the IPCC (1997) whichindicates 5-10% methane emission during the course ofdrying of dung cake.
Dung cake making is practiced almost in all the states inIndia except in Himachal Pradesh, Jammu & Kashmir andNorth-Eastern regions. Fuel requirements in these statesare generally met through fuel wood. Dung of all otherspecies such as pigs, camel, goat, sheep etc. is not utilizedfor making the dung cake. Manure: Indian farmers stilldepend upon organic manure for maintaining the soilfertility as this system is sustainable for the economy ofthe farmers. To convert the cattle and buffalo dung intomanure, excess dung remaining from dung cake makingis collected on the heap nearby to the cattle shed. Theresidual feed (unfit for mixing in dung cake) and ash(available due to the use of dung cake as source of fuel)are also put on the heap. However during monsoonseason when dung cake making practice is stopped dueto the rains, whole quantity of daily collection of dunggoes to this heap. The dung, thus collected is exposed tothe weather conditions and methane emission isexpected from the inner core of the heap due to theanaerobic fermentation of organic matter. IPCC (1997)also attributed this fact. The manure thus prepared isgenerally carted to the fields at the time of soilpreparations after the monsoon season or at the time ofneed.
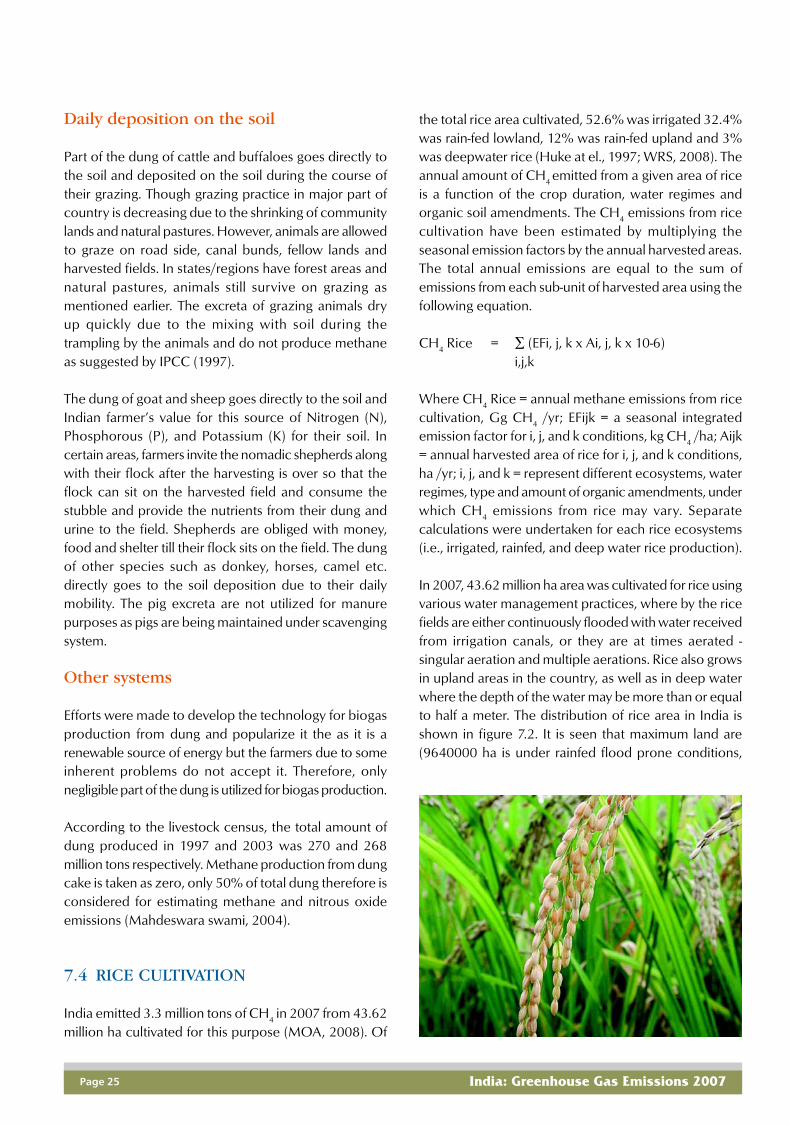
India: Greenhouse Gas Emissions 2007Page 25
Daily deposition on the soil
Part of the dung of cattle and buffaloes goes directly tothe soil and deposited on the soil during the course oftheir grazing. Though grazing practice in major part ofcountry is decreasing due to the shrinking of communitylands and natural pastures. However, animals are allowedto graze on road side, canal bunds, fellow lands andharvested fields. In states/regions have forest areas andnatural pastures, animals still survive on grazing asmentioned earlier. The excreta of grazing animals dryup quickly due to the mixing with soil during thetrampling by the animals and do not produce methaneas suggested by IPCC (1997).
The dung of goat and sheep goes directly to the soil andIndian farmer’s value for this source of Nitrogen (N),Phosphorous (P), and Potassium (K) for their soil. Incertain areas, farmers invite the nomadic shepherds alongwith their flock after the harvesting is over so that theflock can sit on the harvested field and consume thestubble and provide the nutrients from their dung andurine to the field. Shepherds are obliged with money,food and shelter till their flock sits on the field. The dungof other species such as donkey, horses, camel etc.directly goes to the soil deposition due to their dailymobility. The pig excreta are not utilized for manurepurposes as pigs are being maintained under scavengingsystem.
Other systems
Efforts were made to develop the technology for biogasproduction from dung and popularize it the as it is arenewable source of energy but the farmers due to someinherent problems do not accept it. Therefore, onlynegligible part of the dung is utilized for biogas production.
According to the livestock census, the total amount ofdung produced in 1997 and 2003 was 270 and 268million tons respectively. Methane production from dungcake is taken as zero, only 50% of total dung therefore isconsidered for estimating methane and nitrous oxideemissions (Mahdeswara swami, 2004).
7.4 RICE CULTIVATION
India emitted 3.3 million tons of CH4 in 2007 from 43.62million ha cultivated for this purpose (MOA, 2008). Of
the total rice area cultivated, 52.6% was irrigated 32.4%was rain-fed lowland, 12% was rain-fed upland and 3%was deepwater rice (Huke at el., 1997; WRS, 2008). Theannual amount of CH4 emitted from a given area of riceis a function of the crop duration, water regimes andorganic soil amendments. The CH4 emissions from ricecultivation have been estimated by multiplying theseasonal emission factors by the annual harvested areas.The total annual emissions are equal to the sum ofemissions from each sub-unit of harvested area using thefollowing equation.
CH4 Rice = ∑ (EFi, j, k x Ai, j, k x 10-6)i,j,k
Where CH4 Rice = annual methane emissions from ricecultivation, Gg CH4 /yr; EFijk = a seasonal integratedemission factor for i, j, and k conditions, kg CH4 /ha; Aijk= annual harvested area of rice for i, j, and k conditions,ha /yr; i, j, and k = represent different ecosystems, waterregimes, type and amount of organic amendments, underwhich CH4 emissions from rice may vary. Separatecalculations were undertaken for each rice ecosystems(i.e., irrigated, rainfed, and deep water rice production).
In 2007, 43.62 million ha area was cultivated for rice usingvarious water management practices, where by the ricefields are either continuously flooded with water receivedfrom irrigation canals, or they are at times aerated -singular aeration and multiple aerations. Rice also growsin upland areas in the country, as well as in deep waterwhere the depth of the water may be more than or equalto half a meter. The distribution of rice area in India isshown in figure 7.2. It is seen that maximum land are(9640000 ha is under rainfed flood prone conditions,

Indian Network for Climate Change Assessment Page 26
and 20% each of the area are cultivated under irrigatedmultiple aeration or single aeration condition. Thecontinuously flooded land is only 15% of the total areaavailable for rice cultivation. The upland rice area is5234000 ha and is a net sink of CH4, as no anaerobicconditions are generated at these heights.
Table 7.3 gives the CH4 emission estimates made anddetails the emission factors used and area covered undereach water management regime. Irrigated flood proneemissions constituted 45% of the total CH4 emission from
this category. The next highest emitting source wasirrigated continuously flooded (26%) and irrigated singleaeration constituted 14% of the emission. Rainfeddrought prone, deep water and irrigated multiple aerationcontributed 6%, 5% and 4% of the CH
4 emitted from
this source (see figure 7.3).
7.5 AGRICULTURE SOILS
Nitrous Oxide is produced naturally in soils through theprocesses of nitrification and denitrification. Nitrificationis the aerobic microbial oxidation of ammonium tonitrate, and denitrification is the anaerobic microbialreduction of nitrate to nitrogen gas (N2). Nitrous oxide isa gaseous intermediate in the reaction sequence ofdenitrification and a by-product of nitrification that leaksfrom microbial cells into the soil and ultimately into theatmosphere. One of the main controlling factors in thisreaction is the availability of inorganic Nitrogen (N) inthe soil. This methodology, therefore, estimates N2Oemissions using human-induced net N additions to soils(e.g., synthetic or organic fertilizers, deposited manure,crop residues, sewage sludge), or of mineralization of Nin soil organic matter following drainage / managementof organic soils, or cultivation/land-use change on mineralsoils (e.g., Forest Land/Grassland/Settlements convertedto Cropland).
The emissions of N2O that result from anthropogenic Ninputs or N mineralization occur through both a directpathway (i.e., directly from the soils to which the N is
Figure 7.2: Distribution of rice area under variouswater management practices in India in 2007. Here
MA- Multiple aeration, SA- Single aeration andCF- Continuously flooded
Ecosystem Water Rice Emission Methaneregime Area Coeff. (‘000
2007 2007 tons) (000’ ha) (kg ha-1)
Irrigated CF* 6427 162 1042SA 8517 66 562.1MA 8898 18 160.1
Rainfed DP 3577 70 635FP 9640 190 679
Deep water DW 1309 190 249Upland 5234 0 0Total 3327
Table 7.3: Methane emission from rice cultivation
Figure 7.3: CH4 emission distribution in million tons fromrice cultivation in 2007
0.25(6%)
0.68(21%)
0.64(19%)
0.16(5%)
0.56(17%)
1.04(32%)
Note: CF - Continuously floodedSA - Single AerationMA - Multiple AerationDP - Drought ProneFP - Flood Prone

India: Greenhouse Gas Emissions 2007Page 27
added/released), and through two indirect pathways: (i)following volatilization of NH3 and NOx from managedsoils and from fossil fuel combustion and biomassburning, and the subsequent redeposition of these gasesand their products NH4 + and NO3 - to soils and waters;and (ii) after leaching and runoff of N, mainly as NO3 -from managed soils. Therefore total N2O emitted fromsoils can be represented as:
N2O-N TOTAL = N2O-N DIRECT + N2O-N INDIRECT
Using the above methodology the total N2O emissionsfrom India is estimated to be 0.14 million tons in 2007.With respect to 1994, N2O emissions from this categoryhave significantly reduced (by 16%). This is mainly dueto the use of India specific emission factors that are lowerby almost 30% than the IPCC default values. The previousemission factors were 0.93 kg ha_1N2O–N for all typesof crop regimes. The revised emission factors used forrice–wheat systems are 0.76 for rice and 0.66 kg ha_1
N2O –N for wheat for urea application without anyinhibitors (Pathak et al., 2002).
7.6 BURNING OF CROP RESIDUE
Crop residue is burnt in the fields in many Indian statessuch as Uttar Pradesh, Punjab, West Bengal, Haryana,Bihar, Madhya Pradesh, Himachal Pradesh, Maharashtra,Gujarat Chhattisgarh, Jharkhand, Tamil Nadu, Uttaranchaland Karnataka producing CO, CH4, N2O, NOx, NMHCs,SO2 and many other gases. In this report only the CH4
and N2O emissions have been reported.
Non-CO2 emissions from crop residue burning werecalculated using the equation given below.
EBCR = ∑ crops (A x B x C x D x E x F )
Where, EBCR= Emissions from residue BurningA = Crop productionB = Residue to crop ratioC = Dry matter fractionD = Fraction burntE = Fraction actually oxidizedF = Emission factor
The estimation of emission of targeted species wasarrived at by first estimating the amount of biomassactually burnt in the field using the IPCC revised inventorypreparation guidelines (IPCC, 1996). Currently, wastesfrom nine crops viz., rice, wheat, cotton, maize, millet,sugarcane, jute, rapeseed-mustard and groundnut, aresubjected to burning. The state-wise crop productionfigures for 2007 (MOA, 2008) were used as the basicactivity data. The dry matter fraction of crop residue istaken as 0.8 (Bhattacharya and Mitra, 1998), 0.25 asfraction burned (IPCC, 1997) in field and 0.9 as thefraction actually oxidized (IPCC, 1997). Crop specificvalues of carbon fraction were as per IPCC default values.The default N/C ratios were taken from IPCC (2006).Further, the emission ratio was calculated using emissionfactors given by Andreae and Merlet (2001) which arethe default factors mentioned in IPCC (2006) nationalinventory preparation guidelines. Using thismethodology, 0.23 million tons of CH4 and 0.006 milliontons of N2O was emitted from burning of crop residuein India in 2007.

Indian Network for Climate Change Assessment Page 28
Land Use, Land Use Change and Forestry
Land Use, Land Use Change and Forestry (LULUCF) is akey component of the Greenhouse Gas Emission Profile.It involves estimation of carbon stock changes, CO2
emissions and removals and non-CO2 GHG emissions.The IPCC has developed three GHG inventory guidelinesfor land use sector viz. Revised 1996 Guidelines for LUCF(IPCC, 1997); IPCC Good Practice Guidelines forLULUCF (IPCC, 2003); and the latest IPCC, 2006guidelines which includes Agriculture Forest and OtherLand Categories (AFOLU).
India used the Revised 1996 Guidelines for LULUCF sectorfor preparation of GHG inventory information for itsInitial National Communication. The inventory showedthat LUCF sector was a marginal source of GHG
emissions (14.2 million tons of CO2 eq) for the inventoryyear 1994. The revised 1996 IPCC Guidelines has manylimitations and the inventory estimation is incompletesince all land categories are not included and theuncertainty of GHG inventory is estimated to be high.Thus IPCC developed Good Practice Guidance (GPG)for the land use sectors covering all the land usecategories for the inventory. The developed countries(Annex I Countries in UNFCCC) are required to use theGPG approach for LULUCF sector. Further, thedeveloping countries (Non-Annex I countries) such asIndia are encouraged to use the GPG approach.
India has an option of using the Revised 1996 IPCCGuidelines or the IPCC – 2003 GPG approach or theIPCC – 2006, AFOLU Guidelines. Even though India hasa choice to use the elements of IPCC – 2006 AFOLUGuidelines, however, the reporting tables are not yetdeveloped for the IPCC 2006 Guidelines by the UNFCCC.India has decided to shift to IPCC – 2003 GPG approachsince the reporting tables are available for the LULUCFsector.
8.1 METHODOLOGY – GPG APPROACH
IPCC GPG2003 adopted three major advances over IPCC1996 Guidelines. They include:
Introduction of three hierarchical tiers of methods thatrange from default data and simple equations to useof country-specific data and models to accommodatenational circumstancesLand use category based approach for organizing themethodologiesProvides guidelines for all the 5 carbon pools.
IPCC GPG2003 adopted six land categories to ensureconsistent and complete representation of all land
8

India: Greenhouse Gas Emissions 2007Page 29
categories, covering the total geographic area of acountry. The land use categories and the sub-categories,and the relevant gases and C-pools used in the GPG2003are given below:
Land Categorieso Forest land, crop land, grassland, wetland,
settlements and others.o Sub-categories:Land remaining in the same category (eg. Forest landremaining forest land)Land converted to other category (eg. Crop landconverted to Forest land)CO2 emissions and removal is estimated for all theCarbon-pools namely;o Above ground biomass (AGB), below ground
biomass (BGB), soil carbon, dead organic matter(DOM) and woody litter
Non-CO2 gases estimated include;o CH4, N2O, CO and NOx
Table 8.1 highlights the differences between the GPG2003 and IPCC 1996 Guidelines. The description of thecarbon pools is given in the Table 8.2.
8.2 ESTIMATING CARBON STOCKCHANGES
CO2 emissions and removals or the Carbon stock changeis the dominant source of GHG in LULUCF sector.Carbon stock change is the sum of changes in stocks ofall the carbon pools in a given area over a period of time,which could be averaged to annual stock changes. Ageneric equation for estimating the changes in carbon
GPG 2003 IPCC 1996
Land category based approach covering forest Approach based on four categories namely 5A to 5Dland, cropland, grassland, wetland, settlement (refer to Section 5.1of IPCC 1996) All land categoriesand others not included such as coffee, tea, coconut etc. Lack of
clarity on agro-forestry
These land categories are further sub divided into; Forest and grassland categories defined in 5A and 5B- land remaining in the same use category differently- other land converted to this land category
Methods given for all carbon pools; AGB, BGB, Methods provided mainly for above ground biomassdead organic matter and soil carbon and all and soil carbon.non-CO2 gases - Assumes as a default that changes in carbon stocks
in dead organic matter pools are not significant andcan be assumed to be zero, i.e. inputs balance losses.- Similarly, below ground biomass increment orchanges are generally assumed to be zero
Key source/sink category analysis provided for Key source/sink category analysis not providedselecting significant- land categories- sub-land categories- C-pools- CO2 and non-CO2 gases
Three tier structure presented for choice of Three tier structure approach presented but its appli-methods, Activity Data and Emission Factors cation to choice of methods, AD and EF not provided
Biomass and soil carbon pools linked particularly Changes in stock of biomass and soil carbon in a givenin Tier 2 and 3 vegetation or forest type not linked
Table 8.1: Methods adopted in GPG2003 and IPCC 1996

Indian Network for Climate Change Assessment Page 30
stock for a given land-use category or project is givenbelow:
Annual carbon stock change for a land-use category isthe sum of changes in all carbon pools
∆CLUi = ∆CAB + ∆CBB + ∆CDW + ∆CLI + ∆CSC
Where:
∆CLUi is carbon stock change for a land-use category, AB= above-ground biomass, BB = below-ground biomass,DW = deadwood, LI = litter and SC = soil carbon
The equation requires the stock change to be estimatedfor each of the pools. The changes in the carbon poolcould be estimated using the two approaches based onIPCC guidelines (IPCC 2003 and IPCC 2006).
Carbon ‘Gain–Loss’: Annual carbon stock change in agiven pool as a function of gains and losses (‘Gain–Loss’Method)
∆C = ∆CG
– ∆CL
Where:
∆C is annual carbon stock change in the pool, ∆CG is theannual gain of carbon and ∆C
L is the annual loss of carbon.
Carbon ‘Stock–Change’ or ‘Stock–Difference’: Carbonstock change in a given pool as an annual averagedifference between estimates at two points in time (Stock-Difference method)
∆C = (Ct2 – Ct1)
(t2– t1)Where:
∆C is the annual carbon stock change in the pool, Ct1
the carbon stock in the pool at time t1 and C
t2 the carbon
stock in the same pool at time t2.
8.3 INVENTORY ESTIMATION
India has estimated GHG inventory for the year 2007.India has adopted Tier – II approach, where much of theactivity data and emission and removal factors wereobtained from national sources.
Carbon Pool Description
Living biomass Above-ground All biomass of living vegetation, both woody and herbaceous, above the soilbiomass including stems, stumps, branches, bark, seeds and foliage.Below-ground All biomass of live roots. Fine roots of less than 2 mm diameter (the suggestedbiomass minimum) are often excluded because these often cannot be distinguished
empirically from soil organic matter.Dead organic Deadwood All non-living woody biomass not contained in the litter, either standing, lyingmatter on the ground, or in the soil. Deadwood includes wood lying on the surface,
dead roots, and stumps larger than or equal to 10 cm in diameter.Litter All non-living biomass with a size greater than the limit for soil organic matter
(the suggested minimum is 2 mm) and less than the minimum diameterchosen for deadwood (e.g. 10 cm) lying dead and in various states ofdecomposition above or within the mineral organic soil. This includes thelitter layer as usually defined in soil typologies. Live fine roots above themineral or organic soil (of less than the suggested minimum for below-groundbiomass) are included whenever they cannot be empirically distinguishedfrom the litter.
Soil Soil organic Organic carbon in mineral soils to a specified depth chosen and appliedmatter consistently through a time series. Live and dead fine roots within the soil (of
less than the suggested minimum for below-ground biomass) are includedwherever they cannot be empirically distinguished from the soil organic matter.
Table 8.2: Definition of carbon pools according to GPG (2003)

India: Greenhouse Gas Emissions 2007Page 31
Main land Sub-categories Disaggregated level C-pools Non-CO2 gasescategories (based on transformation)
Forest land Forest land remaining forest land - Tropical Wet Evergreen Above- Tropical Dry Deciduous ground- Tropical Thorn Forest biomass,
Land converted to forest land - Plantations Below- etc ground
Crop land Crop land remaining crop land - Irrigated, unirrigated biomass, and CH4, N2O- Annual crops Dead
Land converted to crop land - Plantation; Coconut, organic
coffee, tea, etc. matter,Grassland Grassland remaining grassland - Climatic regions litter and
Land converted to grassland soil carbonWetland Wetland remaining wetland - Wetland, Peat land
Land converted to wetland - Flooded landSettlements Settlement remaining settlement - Rural
Land converted to settlements - Urban
Table 8.3: Main and sub land categories, carbon pools and non-CO2 gases for GHG inventory for LULUCF sector
Activity Data: GHG inventory is estimated for the year2007, by taking the activity data for area for 2007-08.Land use change matrix is prepared using land use datafor 2006-07 and 2007-08. Area under forest is obtainedfrom FSI, 2009 and area under other land categories foryears 2006-07 and 2007-08 is obtained from NRSC landuse data. Approach -2 of IPCC GPG-2003 was adopted.Activity data is required for the land categories, sub-categories and final disaggregated land use systemsaccording to Table 8.3. The crucial data required forestimating inventory is the land use change matrix thatprovides data on area remaining in the same categoryand area converted from one land use category to theother during the inventory year.
The activity data for the land use categories is given inTable 8.4. Cropland dominates the land use system inIndia followed by forestland.
8.4 LAND USE CHANGE MATRIX
GHG inventory is estimated for the land use categoryremaining in the same category as well as land usecategory subjected to land use change. Table 8.5 providesthe land use change matrix for the inventory year 2007,based on data from Forest Survey of India (FSI, 2009)and National Remote Sensing Centre (NRSC, 2008). Itcan be observed that forest area has marginally increased,
Table 8.4: Land use pattern of India in 2007
whereas the net sown (cropped) area has declined. Thegrassland area has also decreased. Figure 8.1 shows theland use map of India generated from AWiFS.
Land use Sub-category Area (M ha)
Forest Very dense 8.35Moderately dense 31.90Open 28.84Land convertedto forest 0.07Sub total 69.16
Cropland Net sown area 139.72Fallow 41.29Sub total 181.01
Grassland Grazing land 8.05Scrub 21.12Other wasteland +Gullied / Ravines 31.85Shifting cultivation 0.26Sub total 61.28
Wetland /Flooded Land Wetland 6.08Settlement Settlement 2.07Other land Other land 9.05GRAND TOTAL 328.65
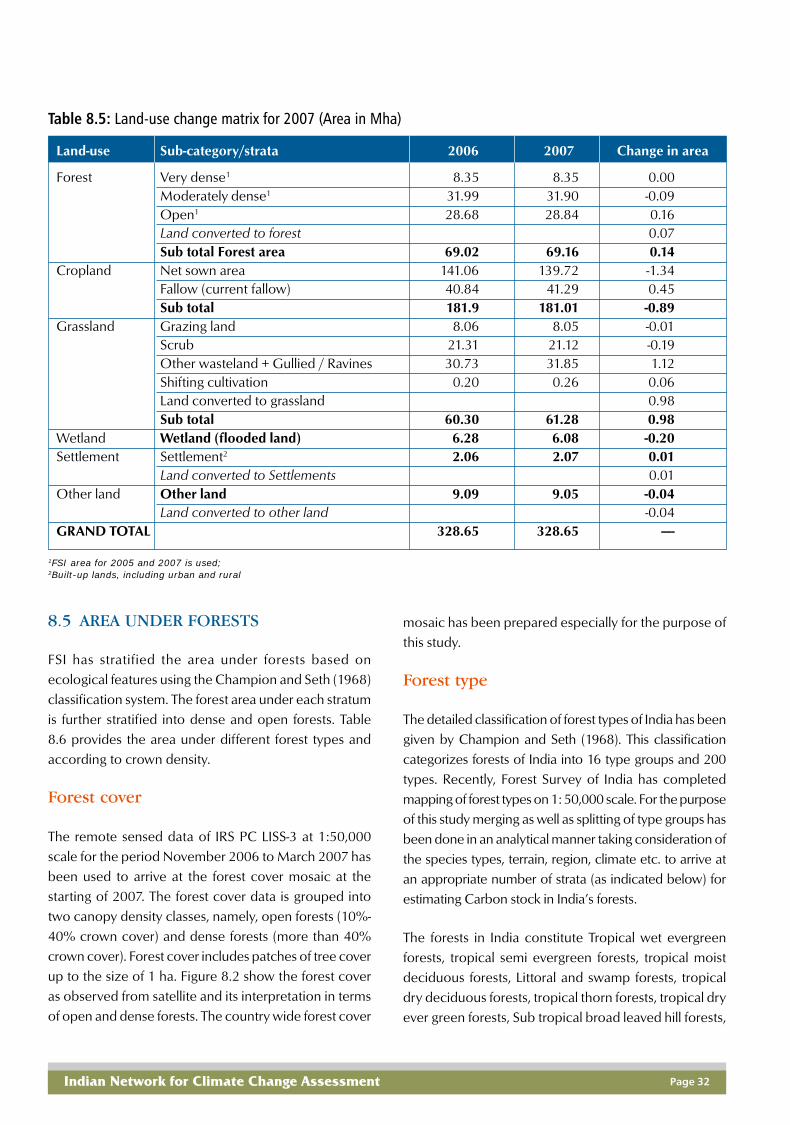
Indian Network for Climate Change Assessment Page 32
Land-use Sub-category/strata 2006 2007 Change in area
Forest Very dense1 8.35 8.35 0.00Moderately dense1 31.99 31.90 -0.09Open1 28.68 28.84 0.16Land converted to forest 0.07Sub total Forest area 69.02 69.16 0.14
Cropland Net sown area 141.06 139.72 -1.34Fallow (current fallow) 40.84 41.29 0.45Sub total 181.9 181.01 -0.89
Grassland Grazing land 8.06 8.05 -0.01Scrub 21.31 21.12 -0.19Other wasteland + Gullied / Ravines 30.73 31.85 1.12Shifting cultivation 0.20 0.26 0.06Land converted to grassland 0.98Sub total 60.30 61.28 0.98
Wetland Wetland (flooded land) 6.28 6.08 -0.20Settlement Settlement2 2.06 2.07 0.01
Land converted to Settlements 0.01Other land Other land 9.09 9.05 -0.04
Land converted to other land -0.04GRAND TOTAL 328.65 328.65 —-
Table 8.5: Land-use change matrix for 2007 (Area in Mha)
1FSI area for 2005 and 2007 is used;2Built-up lands, including urban and rural
8.5 AREA UNDER FORESTS
FSI has stratified the area under forests based onecological features using the Champion and Seth (1968)classification system. The forest area under each stratumis further stratified into dense and open forests. Table8.6 provides the area under different forest types andaccording to crown density.
Forest cover
The remote sensed data of IRS PC LISS-3 at 1:50,000scale for the period November 2006 to March 2007 hasbeen used to arrive at the forest cover mosaic at thestarting of 2007. The forest cover data is grouped intotwo canopy density classes, namely, open forests (10%-40% crown cover) and dense forests (more than 40%crown cover). Forest cover includes patches of tree coverup to the size of 1 ha. Figure 8.2 show the forest coveras observed from satellite and its interpretation in termsof open and dense forests. The country wide forest cover
mosaic has been prepared especially for the purpose ofthis study.
Forest type
The detailed classification of forest types of India has beengiven by Champion and Seth (1968). This classificationcategorizes forests of India into 16 type groups and 200types. Recently, Forest Survey of India has completedmapping of forest types on 1: 50,000 scale. For the purposeof this study merging as well as splitting of type groups hasbeen done in an analytical manner taking consideration ofthe species types, terrain, region, climate etc. to arrive atan appropriate number of strata (as indicated below) forestimating Carbon stock in India’s forests.
The forests in India constitute Tropical wet evergreenforests, tropical semi evergreen forests, tropical moistdeciduous forests, Littoral and swamp forests, tropicaldry deciduous forests, tropical thorn forests, tropical dryever green forests, Sub tropical broad leaved hill forests,

India: Greenhouse Gas Emissions 2007Page 33
Figure 8.2: Digitized forest cover of India in 2007
Figure 8.1: Land use and land cover mapof India (2007-2008) using multi-
temporal IRS P6 AWiFS data
Source: National Remote Sensing Center, India
Source: Forest Survey of India

Indian Network for Climate Change Assessment Page 34
Sub tropical pine forests, Sub tropical Dry evergreenforests, Montane wet temperate forests, Himalayan Moisttemperate forests, Himalayan dry temperate forests, Subalpine forests, Moist Alpine scrub, Dry Alpine scrub,Plantations and tree outside forests.
Strata
Stratification for this study has been done taking theabove two layers, namely, forest cover and forest type.The stratification was done in GIS framework by overlayof the two layers. Thus the forest types were furtherclassified into two canopy density classes and each suchclass represented a strata. The total number of strata is30. Figure 8.6 shows the distribution of these 30 foreststrata spread across India in the beginning of 2007.
Emission and removal factors
The rate of growth or change for different carbon poolsfor different land categories and land use changecategories is obtained from literature and fieldmeasurements. The carbon stocks and rates of changevalues on an annual basis are likely to vary for differentregions, management practices and land use systems.Very limited data is available for rates of change in differentcarbon pools for different land use categories. Some ofthe references used for this work are Puri 1950; Sekharand Rawat, 1960; Pant, 1981; John, 2000; Dhand et al.,2003 and Gupta et al., 2003. Inventory is estimated largelyusing tier 2 approach using nationally available data.
Assessment of Carbon stock from forests
For assessing the Carbon stock in forests of the country,data from 15439 sample plots have been analysed (seethe spread of the plots in figure 8.4). For this, the sampleplots were overlaid on the above strata layer in GIS.Through GIS, strata information of each plot wasattached. In the sample plot layer, the informationattached includes woody biomass, foliage, litter, humus,dead wood, climbers, shrubs, herbs and Soil Carbon.
The equations used for estimating growing stock,biomass and the C stock are as follows:
Growing Stock = Total area of each strata x
Average
volume of the corresponding stratum
Here growing stock refers to woody volume that includesall trees above 10 cm DBH.
Further Biomass of the woody growing stock is estimatedusing the following equation:
Biomass = Growing stock x Specific GravitywhereSpecific gravity = Oven dry weight/ Green volume
andC stock = Biomass x Carbon fractionWhere the carbon fraction corresponds to the differenttypes of biomass in the forest.
The Carbon stock has been estimated for the followinglevels:
The total Carbon stock estimates have been made interms of
Above ground biomassBelow ground biomassSoil Carbon
8.6 CARBON STOCK CHANGE INFOREST LANDS
In order to estimate the change in C stock in Indianforests during 2007 a comparison with C stock in 2005has been made by distributing the forest cover in 2005into the different 30 strata in the same ratio as in 2007.A net CO2 removal during 2007, based on 2005 and2007 stock changes, is estimated to be 67.8 million tons(or Tg) by Indian forests, (Table 8.6).
8.7 CO2 EMISSIONS AND REMOVALFROM NON-FOREST LAND CATEGORIES
The net emissions/removals from non-forest landcategories are given in Table 8.7 The emissions andremovals are estimated using nationally available dataCO2 stock change on per hectare basis in land remaining

India: Greenhouse Gas Emissions 2007Page 35
Figure 8.3: Distribution 30 forest strata across India
Figure 8.4: Spread of forest sample plots
Source: Forest Survey of India
Source: Forest Survey of India

Indian Network for Climate Change Assessment Page 36
in the same category. Grassland remaining grassland is anet source of about 10 Mt CO2, whereas cropland andsettlements land categories are a net sink.
8.8 NET GHG REMOVAL FROM LULUCFSECTOR
The net CO2 emission / removal for LULUCF sector is
given in Table 8.8. This includes CO2 net emissions and
removals from land categories. The net CO2 emissions
include gain and loss of CO2. The loss of CO
2 is largely
due to extraction and use of fuelwood from felling oftrees. Thus the net CO
2 emissions / removal estimate
shows that the sector is a net sink of 177.03 million tonsCO
2. The sector is a net sink due to uptake of CO
2 by the
cropland followed by forest land.
This is a preliminary estimate, likely to be subjected tohigh uncertainty, and may change with improved activitydata and emission factor estimates.
Carbon pools C stock in million C stock in million Change in C stock CO2 removal in milliontons 2005 tons 2007 in million tons tons during 2007
(2005 - 2007) A B C=A-B D=C*44/12
Above ground biomass 2337 2349 6 22.0
Below ground biomass 682 685 1.5 5.5
Soil Carbon 4270 4292 11 40.3
Total 7289 7326 18.5 67.8
Table 8.6: Change in C stock between 2005 and 2007 in forest land category
Net change in carbon stock of 37 Mt during 2005 and 2007 is divided by two years to get 18.5 Mt for the year 2007, which is further multipliedby 44/12 to convert to CO2

India: Greenhouse Gas Emissions 2007Page 37
Land use MAI in MAI in MAI in MAI in MAI in Net DC Net changecategories perennial perennial total soil total (Mt C) in CO2
aboveground belowground perennial carbon carbon E = D x (Mt)biomass biomass biomass (t/ha/y) (t/ha/y) Area F = E x(t/ha/y) (t/ha/y)1 (t/ha/y) D = (A 3.6666
A B A+B C +B)/2+C [+ is emission;- is removal]
Cropland—Cropland 0.130 0.046 0.176 0.220 0.308 56.60 - 207.52
Grassland—Grassland 0.003 0.001 0.004 -0.056 -0.054 -2.86 +10.49
Settlement—Settlement 0.008 0.002 0.010 0.000 0.005 0.01 - 0.038
Wetland—Wetland — — — — — — —
Other land — — — — — — —
Table 8.7: CO2 emissions and removals for biomass and soil carbon for land categories with land remaining inthe same categories
1Below ground biomass was calculated as a fraction (0.26) of the total biomass: IPCC default conversion factorMAI: Mean Annual Increment
Table 8.8: Total GHG emissions from LULUCF for 2007 in Gg
Removal (-) Emission (+)Source of fuelwood is not known, so assumed to come from all land categories. About 8.7% of the fuelwood consumption is estimated to comefrom felling of trees leading to net CO2 emission.Non-CO2 estimates are not reported due to absence of activity data and emission data. Non-CO2 emissions from crop residue burning isreported in Agriculture sector.
Land use categories CO2 emissions/ removals CO2 loss due to fuelwood use Net CO2 emissions/(Gg CO
2) (GgCO
2) leading to net CO
2 emission removal (GgCO
2)
Forestland -67,800
Cropland -207,520
Grassland +10,490 +87,840
Wetland
(Flooded land) NE
Settlement -38
Other land NO
TOTAL -264,868 +87,840 -177,028

Indian Network for Climate Change Assessment Page 38
Waste
The main greenhouse gases emitted from wastemanagement is CH4. It is produced and released intothe atmosphere as a by-product of the anaerobicdecomposition of solid waste, where-by methanogenicbacteria break down organic matter in the waste.Similarly, wastewater becomes a source of CH
4 when
treated or disposed anaerobically. It can also be a sourceof nitrous oxide (N2O) emissions as well due to proteincontent in domestically generated waste water .
The greenhouse gases and their source categoriesconsidered in this document include:
Municipal solid waste disposal resulting in CH4
emissionDomestic waste water disposal emitting CH
4 and N
2O
Industrial waste water disposal leading to CH4
emissions
9.1 SUMMARY OF GHG EMISSIONSFROM WASTE
The total GHG released from waste sector in 2007 was57.73 million tons of CO
2 equivalent, of which, 2.52
million tons was emitted as CH4 emitted and 0.16 milliontons as N2O (table 9.1). Domestic waste water is thedominant source of CH
4 emission in India, it emitted 40%
of the total CO2 equivalent emissions from the waste
sector. 38% of the emissions came from disposal andtreatment of Industrial waste water and 22% of theemissions were from Municipal solid waste disposal.Figure 9.1 shows the absolute values of GHG emissionfrom this sector and also the emission distribution acrossits sub categories.
9.2 MUNICIPAL SOLID WASTE
In India, waste is only systematically collected anddisposed at waste disposal sites in cities, resulting in CH
4
emission from anerobic conditions. In rural areas, wasteis scattered and as a result the aerobic conditions prevailwith no resulting CH
4 emission. MSW in Indian cities is
Table 9.1: GHG emissions from waste sector (thou-sand tons)
CH4 N2O CO2 eq
2515.58 15.8 57725.18Municipal Solid waste 604.51 12694.71Domestic waste water 861.07 15.8 22980.47Industrial waste water 1050 22050
Figure 9.1: GHG emission from waste sector in thousandtons and its distribution across sub categories
9

India: Greenhouse Gas Emissions 2007Page 39
Box 9.1: Estimation of CH4 generated from MSW – A Case Study of Chennai
disposed in landfills by means of open dumping, howevera small fraction is used for composting in some of thecities. In the mega cities such as Delhi, Mumbai, Kolkataand Chennai the MSW generation rate is over riding thepopulation growth rate. As an example of CH4 emissionsfrom solid waste management in a mega city is given inBox 9.1. The rate of disposal of MSW varies from city tocity therefore the estimation of CH4 generated from MSWat a national level becomes highly uncertain unless yearwise data on MSW generation is incorporated in theestimates. In the present estimate IPCC 2000 guidelineshave been used and an average CH4 emission factorderived from a study by NEERI in 69 cities (NEERI, 2005)has been applied.
Greenhouse gas emission inventory from two landfillsof Chennai has been generated by measuring the sitespecific GHG emission factors in conjunction withrelevant activity data as well as using the IPCCmethodologies for CH4 inventory preparation. Chambertechnique was used for GHG flux sampling. Ambientand MSW temperatures at the study sites were alsorecorded. MSW soil samples were analyzed formoisture contents. Gas samples were analyzed for CH4
and CO2 by Gas Chromatograph.
In Chennai, emission flux have been found to be rangedfrom 1.0 to 23.5 mg CH
4 m-2 h-1, 6 to 460 µg N
2O m-2 h-
1 and 39 to 906 mg CO2 m2 h-1 at Kodungaiyur (KDG)
landfill and 0.9 to 433 mg CH4 m-2 h-1, 2.7 to 1200 µg
N2O m-2h-1 and 12.3 to 964.4 mg CO
2 m-2h-1 at Perungudi
(PDG) landfill. Total annual CH4 emission has beenestimated, based on these measurements, to be about0.12 Gg in Chennai from municipal solid waste
management for the year 2000 which is lower thanthe value computed using IPCC, 1996Tier 2methodologies.
The GHG emission fluxes showed wide variationswithin each site and between the KDG and PGDdumping grounds although the composition of MSWwas largely similar. This may be due to theheterogeneous nature of landfill and uneven height andcompaction across the landfill areas. Other reasons forvariation in fluxes at different points within a site (KDGor PGD) may be attributed to the changes in moisturecontent, compaction and age of the MSW. MaximumCH4 flux was observed at the locations with 1.5-2.5 mof top layer containing wastes dumped over a periodof 1 to 3 years. Lower emission of CH
4 has been
attributed to lower height of MSW deposits in thelandfill area, uncontrolled leaching of organic matter,open burning of MSW in landfill and climatic conditions.
Methodology, choice of emission factors and CH4
emission: The first order decay methodology has beenused for estimating CH4 from land fills (IPCC, 2002).According to this methodology CH4 generated in thedisposal sites is represented as
Methane emittedT = (∑CH4 generated – RT) x (1 – OXT)
RT = Methane recovered in year T, GgOXT = Oxidation factor in year T (fraction)
For all practical purposes the methane recovered fromwaste is taken to be zero as methane recovery is almostnon-existent, except for in few (2-3) small pilot projectsbeing carried out in metro cities.
Source: Jha et. al., 2007

Indian Network for Climate Change Assessment Page 40
CH4 generation potential of the waste that is disposed ina certain year decreases gradually throughout thefollowing decades. In this process, the release of CH4
from this specific amount of waste also decreases. Thepresent estimates are based on the first order decaymodel which is an improvement over the massbalance approach used in earlier reports, and is basedon an exponential factor that describes the fractionof degradable material which degrades into CH4 eachyear. One key input in the model is the amount ofdegradable organic matter (DDOCm) in waste. It isrepresented as
DDOCm = W x DOC x DOCf X MCF
where
DDOCm = mass of decomposable DOC depositedm GgW = mass of waste deposited, GgDOC = degradable organic carbon in the year of
deposition, fraction, Gg C/Gg wasteDOCt = fraction of DOC that can decompose (fraction)MCF = CH4 correction factor for aerobic decomposition
in the year of deposition (fraction)
The CH4 potential that is generated throughout the yearsis estimated on the basis of the amounts and compositionof the waste disposed and the waste managementpractices at the disposal sites. The basis for the calculationis the amount of Decomposable Degradable OrganicCarbon (DDOCm) as defined above. DDOCm is the partof the organic carbon that degrades under the anaerobicconditions in solid waste disposal sites.
Thus methane generated in a year can be calculated as
Methane generated in year TCH4 = DDOCm decopomT x F x 16/12
whereF = Fraction of CH4 by volume16/12 = molecular weight ratio, CH4/C
CH4 EmittedT = (∑ CH4 generatedX,T – RT ) x (1 – OXT)
whereRT = recovered CH4 in year T, GgOXT = oxidation factor in year T, (fraction)
On an average for all cities waste generation rate is 0.55
Year 2007
Urban population (million) 352.8Waste generation rate (kg/capita/day) 0.55MSW generated (‘000 tons) 70818Quantity of waste reaching the landfill site 49572(‘000 tons)DDOCm disposed (‘000 tons) 1082.46DDOCm Accumulated (‘000 tons) 5843.00DDOCm decomposed (‘000 tons) 906.77Methane emitted (‘000 tons) 604.51
Table 9.2: CH4 emitted from land fill sites in India
kg/capita/day and that 70% of the waste is reaching thelandfill site (NEERI, 2005). Further IPCC default factors(IPCC, 2002) such as the methane correction factor of0.4, fraction of degradable organic carbon thatdecomposes (DOCf) as 0.5, fraction of methane in landfillgas as 0.5, rate constant (K) as 0.17 year -1 are used in theestimation. The factor related to degradable organiccarbon fraction (DOC) in the waste disposed is taken as0.11 (NEERI, 2005). Considering that the amount ofrecovered methane is zero and oxidation factor is zero,the total methane emitted in 2007 from solid wastedisposal site is estimated to be 604.51 Gg (see table 9.2).
9.3 WASTE WATER TREATMENT ANDDISPOSAL
CH4) is emitted from waste water when it is treated ordisposed anaerobically. Wastewater originates from avariety of domestic, commercial and industrial sourcesand may be treated on site (uncollected), sewered to acentralized plant (collected) or disposed untreatednearby or via an outfall. In this document the followingestimates have been made:
CH4 and N2O from domestic waste waterCH4 from Industrial waste water
Over view of GHG emission from wastewater in India
Total CO2 equivalent emissions from waste watergenerating sources in India in 2007 was 45 million tons,which is 82% of the total CO2 equivalent emissions fromthe waste sector. The total methane emitted in 2007 was1.9 million tons and N2O emitted was 15.8 thousand tons.See Table 9.3

India: Greenhouse Gas Emissions 2007Page 41
Methodology and choice of emissionfactors
This section describes the methodological aspects andchoice of emission factors for estimating CH
4 and N
2O
emissions from domestic and industrial waste watermanagement.
Domestic waste water
Emissions from domestic wastewater handling areestimated for both urban and rural centers. Domesticwastewater have been categorized under urban high,urban low & rural, since the characteristics of themunicipal wastewater vary from place to place & dependon factors, such as economic status, food habits of thecommunity, water supply status and climatic conditionsof the area. In India, it is estimated that about 22,900million liters per day (MLD) of domestic wastewater isgenerated from urban centers (class I and II cities) against13,500 MLD industrial wastewater. The rural watergenerated is not handled in any way therefore as itdecomposes in an aerobic condition, it is not a sourceof CH4. Waste water treatment and discharge pathwaysfor the wastewater generated in the urban areas issubstantial and about 49.2% of the wastewater generatedfrom the urban centers is not collected and treatment isprovided to only 72% of what is collected. Anaerobicroute as a treatment is used in about a quarter of thewastewaters treated. It yields about 0.6 kg of methaneper kg BOD (NSS. 2002) treated theoretically. Use ofadvanced technologies in wastewater treatment in Indiais still at infancy as wastewater treatment is provided onlyin Class I and II cities. Sewage contributes to 60% of thetotal pollution load in terms of biological oxygen demandwhich is beneficial if recovered through the anaerobicroute.
CH4 emissions estimates have been made using Tier IIapproach of IPCC by incorporating country specificemission factors and country specific data. Emission
estimates have been arrived at by using reliable andaccepted secondary data generated by variousGovernment and Private Agencies working in therespective areas in the country. The annual methaneemissions from domestic wastewater can be expressedas (IPCC, 2002):
Td = {∑ (Ui x Tij x EFi)} (TOW – S) – R i, j
Where,
Td – Total domestic methane emissionUi – Fraction of population in income group i in
inventory yearTij – Degree of utilization of treatment/discharge
pathway or systemi – Income group: rural, urban high income and
urban low income.j – Each treatment/discharge pathway or system
EFi – Emission factor, kg CH4 / kg BOD.TOW–Total organics in wastewater in inventory year,
kg BOD/yrS – Organic component removed as sludge inventory
year, kg BOD/yrR – Amount of CH4 recovered in inventory year,
kg CH4/yr.
N2O emissions occur as emission from wastewater afterdisposal of effluent into waterways, lakes, or the sea. Thesimplified general equation to estimate N2O fromwastewater is:
N2OEmissions = NEffluents x EFEffluents x 44/28
Where,
N2O emissions - N2O emissions in inventory year, kgN2O /yr
NEFFLUENT - Nitrogen in the effluent discharged toaquatic environments, kg N/yr
EFEFFLUENT - Emission factor for N2O emissions fromdischarged to wastewater, kg N2O -N/kg N
The factor 44/28 is the conversion of kg N2O -N into kgN2O
Here the total nitrogen in the effluent is estimated byusing the following equation
Activity CH4 N2O CO2 equivalent
Domestic 861 15.8 22979Industrial 1050 22050Total 1911 15.8 45029
Table 9.3: GHG emitted from waste water sector(‘000 grams)

Indian Network for Climate Change Assessment Page 42
Industry Unit Waste watergenerated
Iron & Steel Million tons 76.55Fertilizers Thousand tons 23417Beer Thousand liters 560556.5Meat Million tons 3.5Sugar Thousand tons 38112Coffee Tons 386778.5Soft Drink Million bottles 2187.3Pulp & Paper Thousand tins 6242.5Petroleum Million tins 208.5Rubber Thousand tons 3015Leathers Thousand tons 104515
Table 9.4: Waste water generated in major indus-tries in India
Where,
NEFFLUENT – Total annual amount of nitrogen in thewastewater effluent, kg N/yr
P – Human populationPr – Annual per capita protein consumption,
kg/person/yrFNPR – Fraction of nitrogen in protein, default =
0.16, kg N/kg proteinFNON-CON – Factor for non-consumed protein added
to the wastewaterF IND-COM – Factor for industrial and commercial co-
discharged protein into the sewer systemN SLUDGE – Nitrogen removed with sludge (default =
zero), kg N/y.
Industrial waste water: The general equation to estimateCH4 emissions from industrial wastewater is presentedin equation below:
Ti = ∑i (TOWi – Si) EFi – Ri
Where,
Ti – CH4 emission in inventory year, kg CH4/yr; i –Industrial sector.
TOWi – Total organically degradable material in wastewater for industry i in inventory year, kg COD/year.
Si – Organic component removed as sludge ininventory year, kg COD/year (Default Value 0.35).
EFi – Emission factor for industry i, kg CH4 kg/CODfor treatment/discharge pathway or systemused in inventory year.
Ri – Amount of CH4 recovered in inventory year,kg CH4/year.
Industrial waste water
CH4 emission from waste water has been estimatedbased on the waste water produced in Industries. Steel,fertiliser, beer, meat production, sugar, coffee, soft drinks,pulp and paper, petroleum refineries, rubber and tanneyindustries together emit 95% of the methane generatedfrom waste water in India. These industries have beenincluded for estimating CH4 from industrial waste water.Table 9.4 gives the waste water generated from theseindustries in 2007. In some industries, CH4 is recovered,and in the present calculations, CH4 recovered for energypurposes in sugar, beer and dairy industries has beensubtracted from the total CH4 estimated to be emittedfrom these industries (recovery rate was 70%, 75% and75% respectively).

India: Greenhouse Gas Emissions 2007Page 43
Greenhouse Gas Emission Profile: Key Features
10.1 OVERVIEW
India emitted 1727.71 million tons of CO2 equivalents(CO
2 eq.) in 2007 with LULUCF. CO
2 eq. is the sum total
of CO2, CH4 and N2O emitted in terms of their respectiveglobal warming potentials. See Box 10.1 for the keyresults. This section describes the emissions by gases, bysector and also compares 2007 emissions with the 1994emissions that was published in India’s Initial NationalCommunication to the UNFCCC.
10.2 GAS BY GAS EMISSIONS
Carbon dioxide: The total CO2 emitted from India was1497.03 million tons. Of this the energy sector emitted923 million tons. The industry sector emitted 405.9million tons of CO2 and the land use land use changeand forestry (LULUCF) sector emitted 98.3 million tons.The LULUCF sector also sequestered 27.5 million tons.(Figure 10.1)
Methane: Total CH4 emitted in 2007 was 20.5 milliontons. The energy sector emitted 4.27 million tons of CH4.The industry sector emitted 0.15 million tons of CH
4.
13.77 million tons and 2.52 million tons of CH4 wereemitted from agriculture and waste sectors respectively.CH
4 emissions from the agriculture sector is the largest
and it is 77.1% of the total CH4 emitted in 2007 (figure10.2). Within the agriculture sector CH4 emitted due toenteric fermentation in livestock constitutes more thanhalf (56.6%) of the total of CH4 emitted in 2007.
Nitrous oxide: The total N2O emissions from India in
2007 were 0.24 million tons. The energy sector emitted0.06 million tons of N2O. The industry sector emitted0.02 million tons. The agriculture sector emitted 0.15million tons and the waste sector contributed 0.02 milliontons to the total N2O emitted in 2007. The agriculturesector alone contributes more than half (60%) of the totalN2O emitted from the country. N2O from agriculturalsoils alone constitute 58% of the total N2O emitted in2007 from all sectors. (Figure 10.3)
10.3 SECTORAL EMISSIONS
Energy: The energy sector emitted 1100.06 million tonsof CO2 eq due to fossil fuel combustion in electricitygeneration, transport, commercial/Institutionalestablishments, agriculture/fisheries, and energy intensiveindustries such as petroleum refining and manufacturing
10
Box 10.1: Key Results
The total net Greenhouse Gas (GHG) emissionsfrom India in 2007 were 1727.71 million tons of CO2
equivalent (eq) of which
- CO2 emissions were 1221.76 million tons;
- CH4 emissions were 20.56 million tons; and
- N2O emissions were 0.24 million tons
GHG emissions from Energy, Industry, Agriculture,and Waste sectors constituted 58%, 22%, 17% and3% of the net CO2 eq emissions respectively.
Energy sector emitted 1100.06 million tons of CO2
eq, of which 719.31 million tons of CO2 eq wereemitted from electricity generation and 142.04million tons of CO2 eq from the transport sector.
Industry sector emitted 412.55 million tons of CO2 eq.
LULUCF sector was a net sink. It sequestered 177.03million tons of CO2.
India’s per capita CO2 eq emissions includingLULUCF were 1.5 tons/capita in 2007.
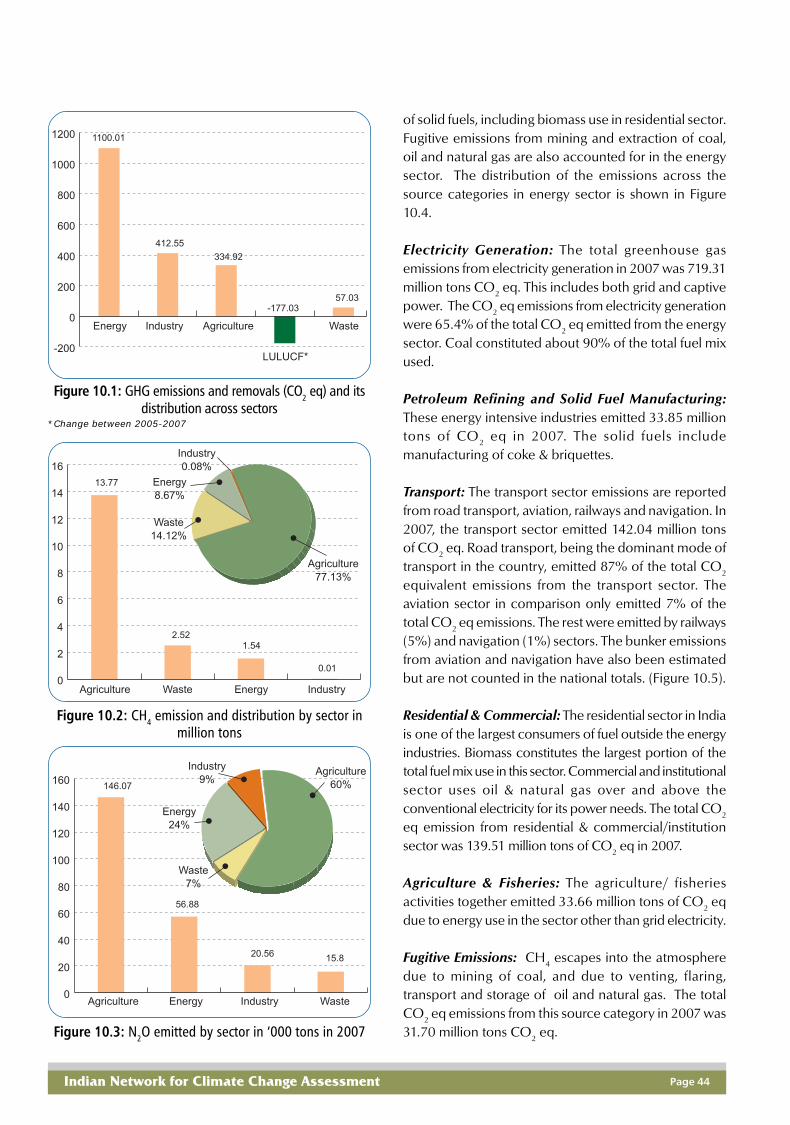
Indian Network for Climate Change Assessment Page 44
Figure 10.1: GHG emissions and removals (CO2 eq) and itsdistribution across sectors
*Change between 2005-2007
Figure 10.2: CH4 emission and distribution by sector inmillion tons
Figure 10.3: N2O emitted by sector in ‘000 tons in 2007
of solid fuels, including biomass use in residential sector.Fugitive emissions from mining and extraction of coal,oil and natural gas are also accounted for in the energysector. The distribution of the emissions across thesource categories in energy sector is shown in Figure10.4.
Electricity Generation: The total greenhouse gasemissions from electricity generation in 2007 was 719.31million tons CO2 eq. This includes both grid and captivepower. The CO2 eq emissions from electricity generationwere 65.4% of the total CO2 eq emitted from the energysector. Coal constituted about 90% of the total fuel mixused.
Petroleum Refining and Solid Fuel Manufacturing:These energy intensive industries emitted 33.85 milliontons of CO2 eq in 2007. The solid fuels includemanufacturing of coke & briquettes.
Transport: The transport sector emissions are reportedfrom road transport, aviation, railways and navigation. In2007, the transport sector emitted 142.04 million tonsof CO2 eq. Road transport, being the dominant mode oftransport in the country, emitted 87% of the total CO2
equivalent emissions from the transport sector. Theaviation sector in comparison only emitted 7% of thetotal CO2 eq emissions. The rest were emitted by railways(5%) and navigation (1%) sectors. The bunker emissionsfrom aviation and navigation have also been estimatedbut are not counted in the national totals. (Figure 10.5).
Residential & Commercial: The residential sector in Indiais one of the largest consumers of fuel outside the energyindustries. Biomass constitutes the largest portion of thetotal fuel mix use in this sector. Commercial and institutionalsector uses oil & natural gas over and above theconventional electricity for its power needs. The total CO2
eq emission from residential & commercial/institutionsector was 139.51 million tons of CO2 eq in 2007.
Agriculture & Fisheries: The agriculture/ fisheriesactivities together emitted 33.66 million tons of CO2 eqdue to energy use in the sector other than grid electricity.
Fugitive Emissions: CH4 escapes into the atmospheredue to mining of coal, and due to venting, flaring,transport and storage of oil and natural gas. The totalCO2 eq emissions from this source category in 2007 was31.70 million tons CO2 eq.

India: Greenhouse Gas Emissions 2007Page 45
Figure 10.4: GHG emissions from Energy Sector (million tons of CO2 eq).
Industry: Industrial activities together emitted 412.55million tons of CO2 eq of GHG in 2007. Industry sectoremissions have been estimated from manufacturing ofminerals, metals, chemicals, other specific industries, andfrom non-energy product use. The emissions covered inthe industry sector include fossil fuel combustion relatedemissions as well as the process based emissions. (Figure10.6).
Cement and Other Minerals: The cement industryemitted 129.92 million tons of CO2, which is 32% of thetotal CO2 eq emissions from the Industry sector. Theemissions cover the entire technology mix formanufacturing of cement in the country covering large,medium and white cement plants. The other minerals
like glass and ceramic production and soda ash usetogether emit 1.01 million tons of CO2 eq.
Iron and Steel and Other Metals: The iron and steelindustry emitted 117.32 million tons of CO2 eq. Theestimate covers integrated and mini steel plants. Theproduction of other metals, namely, aluminum,ferroalloys, lead, zinc and copper production lead to anemission of 5.42 million tons of CO2 eq.
Chemicals: The chemical industries together emitted 8%of the total GHG emissions from the industry sector(33.50 million tons).
Figure 10.5: GHG emissions from Transport Sector bymode of transport in 2007 (million tons of CO2 eq).
Figure 10.6: GHG emissions from Industry Sector (milliontons of CO2 eq).

Indian Network for Climate Change Assessment Page 46
Other Industries: Other industries comprising of pulp/paper, leather, textiles, food processing , mining andquarrying, and non specific industries comprising ofrubber, plastic, watches, clocks, transport equipment,furniture etc., together emitted 124.53 million tons. Therest of the emissions in the Industry sector came fromthe non-energy product uses and this sector emitted 0.85million tons of CO2 eq, and was mainly from use of oilproducts and coal-derived oils primarily intended forpurposes other than combustion.
Agriculture: The agriculture sector emitted 334.41 milliontons of CO2 eq in 2007. Estimates of GHG emissionsfrom the agriculture sector arise from entericfermentation in livestock, manure management, ricepaddy cultivation, agricultural soils and on field burningof crop residue. (Figure 10.7)
Livestock: Enteric fermentation in livestock released212.10 million tons of CO2 eq (10.1 million tons of CH4).This constituted 63.4% of the total GHG emissions (CO2
eq) from agriculture sector in India. The estimates coverall livestock, namely, cattle, buffalo, sheep, goats, poultry,donkeys, camels, horses and others. Manuremanagement emitted 2.44 million tons of CO2 eq.
Rice Cultivation: Rice cultivation emitted 69.87 milliontons of CO2 eq or 3.33 million tons of CH4. Theemissions cover all forms of water managementpracticed in the country for rice cultivation, namely,irrigated, rainfed, deep water and upland rice. The uplandrice are zero emitters and irrigated continuously
flooded fields and deep water rice emit maximummethane per unit area.
Agricultural Soils and Field Burning of Crop Residue:Agricultural soils are a source of N2O, mainly due toapplication of nitrogenous fertilizers in the soils. Burningof crop residue leads to the emission of a number ofgases and pollutants. Amongst them, CO2 is consideredto be C neutral, and therefore not included in theestimations. Only CH4 and N2O are considered for thisreport. The total CO2 eq emitted from these two sourceswere 50.00 million tons.
Land Use Land Use Change and Forestry: The estimatesfrom LULUCF sector include emission by sources andor removal by sinks from changes in forest land, cropland, grassland and settlements. Wet lands have not beenconsidered due to paucity of data. The LULUCF sectorin 2007 was a net sink. It sequestered 177.03 million tonsof CO2 in 2007. (Figure 10.8)
Forest Land: This includes estimates of emissions andremoval from above and below ground biomass in verydense, moderately dense, open forests, and scrub lands.Estimates indicate that forest land sequestered 67.8million tons of CO2 in 2007. However, fuel woodextracted non-sustainably from forests lead to an emissionof 67.80 million tons of CO2 in 2007.
Crop Lands: The emission estimates have been madefrom net sown area as well as fallow land. The crop landsequestered 207.52 million tons of CO2 in 2007.
Figure 10.7: GHG emissions from Agriculture Sector(million tons of CO2 eq).
Figure 10.8: GHG emissions and removals from LULUCFsector (million tons of CO2 eq).

India: Greenhouse Gas Emissions 2007Page 47
Grassland: Changes in Grassland resulted in the emissionof 10.49 million tons of CO2 due to decrease in grassland area by 3.4 million ha between the two periods.
Settlements: Land converted to settlements thoughincreased by 0.01 million ha during the period, however,the conversions did not lead to an emission but a netremoval of 0.04 million tons.
Waste: The waste sector emissions were 57.73 milliontons of CO2 eq from municipal solid waste management,
Figure 10.9: GHG emissions from Waste Sector (milliontons of CO2 eq).
domestic waste water and industrial waste watermanagement. (Figure 10.9)
Municipal Solid Waste (MSW): Systematic disposal ofsolid waste is carried out only in the cities in India resultingin CH4 emissions due to aerobic conditions generateddue to accumulation of waste over the years. It isestimated that the MSW generation and disposal resultedin the emissions of 12.69 million tons of CO2 eq in 2007.
Waste Water: The waste water generation emissions arethe sum total of emissions from domestic waste waterand waste water disposal in industries. Waste watermanagement in both these categories together emitted45.03 million tons of CO2
10.4 COMPARISON WITH 1994 GHGINVENTORY
The 1994 assessment is available in India’s Initial NationalCommunication to the UNFCCC. Both the 1994 and2007 assessments have been prepared using the IPCCguidelines for preparation of national greenhouse gasinventories by sources and removal by sinks. Thedistinctive key features of the two and the improvementsin the 2007 assessments are indicated in Box 10.2.
A gas by gas comparison indicates that the CO2 emissionshave increased by 381.15 million tons between 1994 and
1994 Assessment
Estimates made using only revised 1996 IPCC guidelines.
LULUCF included emissions from changes in forest land.
Emission factors were a mix of default factors taken fromIPCC and country specific (CS) emission factors. 26%of the source categories used CS factors.
The 1994 assessment splits the emissions from industryin to two parts - fossil fuel and process. The fossil fuelemissions are reported in Energy and process emissionsin Industry.
In 1994, 7% of the total CO2 eq emissions were madeusing Tier III approach.
2007 Assessment
Estimates made using revised IPCC 1996 guidelines(1997), IPCC Good Practice Guidance (2000), theLULUCF Good Practice Guidance (2003).
Carbon pools in addition to forests have been consideredin the LULUCF sector (crop land, grass land, settlements).
Emission factors were also a mix of default and CSemission factors but leading to improved accuracy asmore number of CSs have been used in this assessment(35% of the source categories used CS factors).
The 2007 assessment reports both fossil fuel related andprocess based emissions from Industry as a part of theIndustry sector.
In 2007, 12% of the emissions are made using Tier IIIapproach, implying greater accuracy.
Box 10.2: 2007 and 1994 - Key Methodological Features and Improvements

Indian Network for Climate Change Assessment Page 48
2007 with LULUCF. Without LULUCF, CO2 emissionshave increased from 817.02 million tons in 1994 to1497.03 million tons in 2007. The CH4 emissions haveonly grown by 2.48 million tons with respect to 1994.The N2O emissions have grown by 0.061 million tonsbetween 1994 and 2007, A comparative analysis of thegas by gas emissions is shown in Table 10.1
A Sectoral comparison of the emissions in 1994 and 2007is provided in Table 10.2. Emissions from electricitygeneration, cement and waste are growing at a fasterrate with respect to others. The compounded annualgrowth rates are 5.6%, 6.0% and 7.3%. These are mainlyassociated with the needs of the growing economy. Thesummary of the GHG emissions of India from all sectorsin 2007 emissions is provided in Table 10.3.
10.5 PER CAPITA EMISSIONS
The population in India in 2007 was 1.15 billionapproximately representing 17% of global population(UNSTAT, 2007). The per capita GHG emission withoutLULUCF is estimated to be 1.7 tons of CO
2 equivalent/
capita and with LULUCF it is 1.5 tons/capita. In terms ofCO2, the per capita emission was 1.3 tons CO2 per capitaor 0.35 tons of C per capita. In comparison, in 1994, thepopulation was 897 million, comprising 15.8% of worldpopulation. The per capita GHG emissions in 1994 were
Figure 10.10: Comparison of per capita emissions(tons/capita)
1994 2007 CAGR(%)
Electricity 355.03 (28.4%) 719.30 (37.8%) 5.6Transport 80.28 (6.4%) 142.04 (7.5%) 4.5Residential 78.89 (6.3%) 137.84 (7.2%) 4.4Other Energy 78.93 (6.3%) 100.87 (5.3%) 1.9Cement 60.87 (4.9%) 129.92 (6.8%) 6.0Iron & Steel 90.53 (7.2%) 117.32 (6.2%) 2.0OtherIndustry 125.41 (10.0%) 165.31 (8.7%) 2.2Agriculture 344.48 (27.5%) 334.41 (17.6%) -0.2Waste 23.23 (1.9%) 57.73 (3.0%) 7.3Total withoutLULUCF 1251.95 1904.73 3.3LULUCF 14.29 -177.03Total withLULUCF 1228.54 1727.71 2.9
Note: Figure in brackets indicate percentage emissions from eachsector with respect to total GHG emissions without LULUCF in 1994and 2007 respectively
Table 10.2: A comparison of emissions by sectorbetween 1994 and 2007 in million tons of CO2 eq
1994 2007 CAGR(%)
CO2 withLULUCF 793.49 1221.70 3.4CO2
withoutLULUCF 817.02 (65.3%) 1497.03 (74.6%) 4.8CH4 18.08 (30.3%) 20.56 (21.5%) 1.0N2O 0.178 (4.4%) 0.24 (3.9%) 2.3CO2 eqwithLULUCF 1228.50 1727.70 2.9CO2 eqwithoutLULUCF 1252.00 1904.70 3.3
Table 10.1: Gas by gas comparison between 1994and 2007 in million tons of CO2 eq
accordingly 1.4 t CO2 eq/ capita, 0.9 tons CO2/ capitaor 0.24 tons C/capita. (Figure 10.10)
Note: Figures in brackets represent percentage emissions withrespect to total CO2 eq. emissions without LULUCF

India: Greenhouse Gas Emissions 2007Page 49
CO2 emissions CO2 removals CH4 N2O CO2 equivalent
GRAND TOTAL 1497029.20 275358.00 20564.20 239.31 1727706.10ENERGY 992836.30 4266.05 56.88 1100056.89Electricity generation 715829.80 8.14 10.66 719305.34Other energy industries 33787.50 1.72 0.07 33845.32Transport 138858.00 23.47 8.67 142038.57
Road transport 121211.00 23.00 6.00 123554.00Railways 6109.00 0.34 2.35 6844.64Aviation 10122.00 0.10 0.28 10210.90Navigation 1416.00 0.13 0.04 1431.13
Residential 69427.00 2721.94 36.29 137838.49Commercial / Institutional 1657.00 0.18 0.04 1673.18Agriculture/ Fisheries 33277.00 1.20 1.15 33658.70Fugitive emissions 1509.40 31697.30INDUSTRY 405862.90 14.77 20.56 412546.53Minerals 130783.95 0.32 0.46 130933.27Cement production 129920.00 129920.00Glass & ceramic production 277.82 0.32 0.46 427.14Other uses of soda ash 586.12 586.12Chemicals 27888.86 11.14 17.33 33496.42Ammonia production 10056.43 10056.43Nitric acid production 16.05 4975.50Carbide production 119.58 119.58Titanium dioxide production 88.04 88.04Methanol production 266.18 0.91 285.37Ethylene production 7072.52 9.43 7270.64EDC & VCM production 198.91 198.91Ethylene Oxide production 93.64 0.19 97.71Acrylonitrile production 37.84 0.01 37.98Carbon Black production 1155.52 0.03 1156.07caprolactam 1.08 336.22Other chemical 8800.21 0.56 0.20 8873.97Metals 122371.43 0.95 1.11 122736.91Iron & Steel production 116958.37 0.85 1.09 117315.63Ferroalloys production 2460.70 0.08 2462.29Aluminium production 2728.87 0.01 0.00 2729.91Lead production 84.13 0.00 0.01 86.38Zinc production 76.11 0.00 0.01 77.99Copper 63.25 0.01 0.00 64.70Other Industries 123969.17 2.37 1.65 124530.44Pulp and paper 5222.50 0.05 0.08 5248.35Food processing 27625.53 1.12 0.22 27717.25Textile and leather 1861.11 0.03 0.02 1867.94Mining and quarrying 1460.26 0.06 0.01 1464.62Non-specific industries 87799.77 1.11 1.32 88232.28
Table 10.3: Greenhouse gas emissions by sources and removal by sinks from India in 2007 (thousand tons)
(contd. on next page)

Indian Network for Climate Change Assessment Page 50
CO2 emissions CO2 removals CH4 N2O CO2 equivalent
(contd…)
Note: LULUCF: Land Use Land Use Change & Forestry*Not included in the national totals.NE: Not estimated; NO: Not occuring
Non energy product use 849.49 849.49Lubricant 776.75 776.75Paraffin wax 72.75 72.75AGRICULTURE 13767.80 146.07 334405.50Enteric fermentation 10099.80 212095.80Livestock Manure management 115.00 0.07 2436.70Rice cultivation 3327.00 69867.00Soils 140.00 43400.00Burning of crop residue 226.00 6.00 6606.00LULUCF 98330.00 275358.00 -177028.00Forestland 67800.00 -67800.00Cropland 207520.00 -207520.00Grassland 10490.00 10490.00Settlement 38.00 -38.00Wetland NE NEOther land NO NOFuel wood use in forests 87840.00 87840.00Waste 2515.58 15.80 57725.18Municipal Solid waste 604.51 12694.71Domestic waste water 861.07 15.80 22980.47Industrial waste water 1050.00 22050.00Bunkers* 3454 0.03 0.10 3484.45Aviation Bunkers 3326 0.02 0.09 3355.31Marine bunkers 128 0.01 0.003 129.14

India: Greenhouse Gas Emissions 2007Page 51
Future Perspective
The robustness of an inventory making process isdependent on the tier of methodology used forestimating the same. Higher the tier, more representativeis the emission estimated using the same with respect tothe actual emissions. Of the total 1727.7 million tons ofCO2 equivalent emissions from India in 2007, 21% ofthe emissions have been estimated using Tier Imethodology, 67% by Tier II and 12% by Tier IIImethodology (see figure 11.1).
In the present work, Tier III methodology has been usedfor the categories relating to enteric fermentation inlivestock, rice cultivation and cement production. Thismeans that the estimates are data intensive and emissionfactors used are very closely representing the emissionsper unit of activity. For example, in the case of cementproduction, 85% of the cement plants have beensurveyed to collect the data on coal used by type, annualClinker & Cement production by Variety and co-generation data for large, medium and small plants toestimate the GHG emission from this source by processand from combustion of fuel. Similarly, in the case ofenteric fermentation, the dairy cattle and buffalo being
the dominating source of emission within this categoryhave been classified according to age groups, to distinguishbetween, lactating cattle, old and calves which havedifferent CH4 emitting properties. Further new bornemission factors have been estimated across these agegroups through measurements and using representativefeed intakes in the various agro-ecological zones.
Tier II approach has been used for electricity generation,road transportation, agricultural soils, industrial wastewater and municipal solid waste. These estimates havebeen made using relatively detailed data on type ofvehicles and country specific emission factors for someof their components. Wherever, the Tier I approach hasbeen used for estimating GHG emissions, the emissionfactors are sourced from IPCC publications, and theactivity data are less detailed with respect to Tier II andTier III approaches.
Table 11.1 below identifies the Tier of methodology andthe corresponding emission factors used to estimate thegreenhouse gases from each category. The table alsoindicates the key categories identified on the basis oftheir relative emissions with respect to the total CO2
equivalent emissions from the country in 2007. Thisanalysis does not include LULUCF categories, as per theGPG guidance 2000. A key category, essentially is thebasis for planning improvements in the GHG emissioninventory from various source categories.
11.1 RIDING THE TIER LADDER
About 17 categories in Table 11.1 have been identifiedas key categories. Of these 3 already use Tier IIImethodology. Six use Tier II and the rest use Tier I. It isapparent that all the key categories using Tier II and TierI methodologies, need to move up the Tier ladder toincrease the reliability of the 95% of the emissions from
Figure 11.1: Emissions and Tiers of methodology used for2007 GHG emission profile
11

Indian Network for Climate Change Assessment Page 52
CO2 eq Cumulative % of total Tier Used Emission factors(’000 tons) CO2 eq used
Electricity generation 719305.34 719305.34 37.12065 Tier II CS+DEnteric fermentation 212095.8 931401.14 48.06611 Tier III CS+DResidential 137838.487 1069239.627 55.17944 Tier I DCement production 129920 1199159.627 61.88412 Tier III CS+DRoad transport 123554 1322713.627 68.26028 Tier II CS+DIron & Steel production 117315.631 1440029.257 74.3145 Tier II CS+DNon-specific industries 88232.28 1528261.537 78.86784 Tier I CS+DRice cultivation 69384 1597645.537 82.44849 Tier III CSSoils 43400 1641045.537 84.6882 Tier II CS+DOther energy industries 33845.32 1674890.857 86.43483 Tier I CS+DAgriculture/ Fisheries 33658.7 1708549.557 88.17183 Tier I CS+DFugitive emissions 31697.295 1740246.852 89.8076 Tier III CSFood processing 27717.25 1767964.102 91.23799 Tier I CS+DDomestic waste water 22980.47 1790944.572 92.42392 Tier I DIndustrial waste water 22050 1812994.572 93.56184 Tier II CS+DMunicipal Solid waste 12694.71 1825689.282 94.21697 Tier II CS+DAviation 10210.9 1835900.182 94.74391 Tier I DAmmonia production 10056.4336 1845956.616 95.26289 Tier I DOther chemical 8873.9664 1854830.582 95.72084 Tier I DEthylene production 7270.63715 1862101.219 96.09605 Tier I DRailways 6844.64 1868945.859 96.44928 Tier I CS+DBurning of crop residue 6606 1875551.859 96.79019 Tier I DPulp and paper 5248.35 1880800.209 97.06104 Tier I DNitric acid production 4975.5 1885775.709 97.3178 Tier I CSAluminium production 2729.90853 1888505.618 97.45868 Tier I DFerroalloys production 2462.2939 1890967.912 97.58575 Tier I DLivestock Manure management 2436.7 1893404.612 97.7115 Tier I DTextile and leather 1867.94 1895272.552 97.8079 Tier I DCommercial / Institutional 1673.18 1896945.732 97.89424 Tier I DMining and quarrying 1464.62 1898410.352 97.96983 Tier I DNavigation 1431.13 1899841.482 98.04368 Tier I DCarbon Black production 1156.07397 1900997.556 98.10334 Tier I DLubricant 776.746667 1901774.303 98.14343 Tier I DOther uses of soda ash 586.120901 1902360.423 98.17368 Tier I DGlass & ceramic production 427.144416 1902787.568 98.19572 Tier I DCaprolactam 336.218963 1903123.787 98.21307 Tier I DMethanol production 285.369075 1903409.156 98.2278 Tier I DEDC & VCM production 198.9093 1903608.065 98.23806 Tier I DCarbide production 119.5832 1903727.648 98.24423 Tier I DEthylene Oxide production 97.714015 1903825.362 98.24928 Tier I DTitanium dioxide production 88.037525 1903913.4 98.25382 Tier I DLead production 86.3830122 1903999.783 98.25828 Tier I DZinc production 77.9890514 1904077.772 98.2623 Tier I DParaffin wax 72.7466667 1904150.519 98.26606 Tier I DCopper 64.7 1904215.219 98.2694 Tier I DAcrylonitrile production 37.978538 1904253.197 98.27136 Tier I D
Table 11.1: Key category analysis
D- Default Emission Factor; CS – Country Specific

India: Greenhouse Gas Emissions 2007Page 53
the country. Further, an uncertainty analysis along withthe key category analysis will together identify thecategories that are most critical in terms of theircontribution to the total GHG inventory from a sectoror country itself. Once it is done, strategies need to bemade to climb the tier ladder. The measures in placeshould be towards improving the assimilation of activitydata, bridging data gaps, comparing data with all datainformation sources, and improving the emission factorswhich may be a function of several parameterscontributing to the process of emission. Figure 11.2indicates the steps necessary for improving therobustness of the inventory estimates as well as theinventory making process itself.
Some of the activities that can be carried out to makethe improvements can be the following:
Energy sectorContinuous improvement of NCV of coalSampling of coal at power plant for estimating NCVof different types of coal entering the plantsOn line measurement of CO2 emission at each stackof large power plants that constitute 90% of the totalemission of CO2 from this sourceEstimating GHG emission factor by kilometer traveledby each vehicle type and using the same data in roadtransport GHG emission models ( e.g. COPART)Bridging activity data gaps, especially for ascertainingenergy use in commercial, residential, agriculturesectors. Therefore ascertaining the allocation of diesel
and biomass consumptions are key data requirementsfor these sector.
IndustryMeasuring plant specific CO2 emission in large steelplantsBridging data gaps in various industries, especially nonspecific industries amongst others - enhance role ofindustry associationsDetermining CO2 emission factor for ammoniaproduction and improving the activity data for thesame through sample survey
AgricultureUpdating CH4 emission factor from continuouslyflooded fields, by ascertaining area of flooding throughremote sensingFocusing on measurement of CH4 emission factorfrom prominent species of dairy cattle in IndiaUpdating N2O emission factors for crop soils in India-extending regional coverage
WasteUpdating data for estimating CH4 emission factorsfrom waste water in industriesMeasuring CH4 emission factors from MSW in metrocities in India (Delhi, Kolkata, Chennai & Mumbai)
Land use land Use Change and ForestryContinuous categorisation of land use for 20 yearprevious to the year of estimate.
Figure 11.2: Towards improvement in the estimates

Indian Network for Climate Change Assessment Page 54
11.2 CAPACITY BUILDING
Capacity building is essential at two levels- one is buildingcapacity at the institutional level and one at the individuallevel. Building capacity at the institutional level is essentialto address the needs of inventory preparation for variouspurposes, be it at national scale, sectoral scale or atinstallation level. Therefore there is a need to have aNational Inventory Management System. This will alsoinclude additional involvement of institutions with variedresearch experience to widen the pool of institutions thatwill look at the various aspects of inventory development.The individual capacity building is another aspect thatneeds improvement of the skills of individuals on acontinuous basis to be in consonance with the latestdevelopments in the process and subject of inventorypreparation for various sectors, including energy,Industry, Agriculture, Land Use land use change andforests, and waste management.
Establishment of National Inventory ManagementSystem: Building on the base of knowledge institutionsalready engaged in the preparation of a nationalassessment a National Inventory Management System(NIMS) under the MoEF can be developed. The NIMSmay address the requirements of documentation,archiving and continuous updating of the databases aswell as the QA/QC and uncertainty management issuesof the GHG inventories being developed across theyears. The NIMS mandate should address thedevelopment of Systemic tools and procedures fordocumenting methodologies, creation of databases ofemission factors and activity data for each point sourceand the various disaggregated sources that add up togenerate the national GHG Emission profiles across eachyear. The NIMS mandate may include:
Undertake data management and collection on anannual basis;Devise strategies for data generation andimprovement;Establish systems for data archiving and recordkeeping;Ensure mechanisms for synchronization and cross-feeding between emission inventories, national energybalances and relevant sector surveys;Provide guidance for technical peer reviews,procedures for QA/ QC and uncertainty management.
A web based data base management system may furtherhelp in wider accessibility of data to concernedstakeholders and also towards visualisation of GHG datathus generated.
Enhanced networking and Individual capacity building:The present network of institutions involved in thisassessment is only estimating the GHG emissions bysector. GHG inventory preparation is a much largerexercise, as it involves data generation, collection,archival, literature survey for emission factors,determination of country specific emission factors,undertaking QA/QC and uncertainty analysis amongstother activities. For each of these skilled approach isrequired and therefore trained manpower is necessarythat will also improve methodologies of estimation withrespect to the International methodologies available andmay be develop new methodologies to reflect thenational circumstances of specific activities that are keycategories in the entire GHG inventory. This can be doneby enlarging the base of institutions involved in thispresent activity which can skilfully steer each and everyactivity required for GHG inventory preparation. Otherthan the enhancement in the institutional base, it is alsoimportant to train manpower in the latest techniques ofinventory preparation as well as bring in new capacity tocarry forward the work.

India: Greenhouse Gas Emissions 2007Page 55
CEA, 2007. Public Electricity Supply, All India Statistics, General Review.
CEA, 2008. Annual Report 2007-2008, Central Electricity Authority, Ministry of Power, Government of India.
Census, 2001, Government of India
CMA, 2010. CMA Annual Report. Basic data, Annual publication – 1994 2009.
CMIE, 2009. Economic Intelligence Services: Energy. Published by Centre for Mintoring Indian Economy.
CPCB, 1982. Minimal National Standards Oil Refineries, Central Board for the Prevention and Control of Water Pollution,
New Delhi, 1981-82.
CPCB, 1986. Pollution Control Handbook, 1986, Pp. 172.
CPCB, 1992. Comprehensive Industry Document, on Slaughterhouse, Meat and seafood Processing, CPCB, New
Delhi 1992, pp. 33-35, 47-48.
CPCB, 1996. Comprehensive Industry Document for Soft Drink Manufacturing Units, Bakeries and Confectioneries,
COINDS/52/1995-96, January 1996a, CPCB, New Delhi.
CPCB, 1996. Comprehensive Industry Document on Natural Rubber Processing, CPCB, New Delhi 1995-96b, pp. 8-
10, 24-33.
CPCB, 2001. Comprehensive Industry Document series, Textile Industry, CPCB, 1999-2000, PP23-27.
CPCB. 1981. Comprehensive Industry Document, Oil Refineries, Central Board for the Prevention and Control of
Water Pollution, New Delhi, 1980-81, pp. 15, 65.
CPCB., 1984. Comprehensive Industry Document series, Minimal National Standards Straight Nitrogenous Fertilizer
Industry, Central Board for the Prevention and Control of Water Pollution, New Delhi, 1984-85,pp. 1,8.
CSO, 2008. Annual report 2007-08, Dept. of Chemicals & Petrochemicals; Central
ES, 2009. Economic Survey 2008-09
FAI, 2008. Fertilizer Statistics 2007-08, Fertilizer Association of India.
FAO, 2008. Food and Agriculture Organisation, 2008 (http://www.fao.org/corp/statistics/en/)
FSI, 2009. FSI survey on Assessing Forest cover, trees outside forests, forest strata, woody biomass and Soil Carbon of
Indian Forests. Forest Survey of India, Ministry of Environment and Forests, GOI.
IISI, 2009. International Iron and Steel Institute Yearbooks, 2005-2008.
MOA, 200 Livestock Census, 1997 and 2003
MOA, 2005. 17th Indian Livestock Census, - All India Summary Report. Department of Animal Husbandry and Dairing,
Ministry of Agriculture
MoA, 2008. Agricultural Statistics at a Glance 2008. Directorate of Economics and Statistics, Department of Agriculture
and Cooperation (DAC), Ministry of Agriculture, Government of India.
MOC, 2008. Coal Directory of India. - Coal Controller’s Organisation, Ministry of Coal, Government of India.
MOPNG, 2007. Ministry of Power Notification dated 12th March, 2007 available at http://www.bee-india.nic.in/
notifications/SO394(E)_English.pdf.
Sources of Activity Data
Annexure 1

Indian Network for Climate Change Assessment Page 56
MoPNG, 2008a. Indian Petroleum & Natural Gas Statistics. 2007-2008, Ministry of Petroleum and Natural Gas,
Government of India.
MoPNG, 2008b. Performance of Chemical & Petrochemical Industry at a Glance, 2001-07, Monitoring and valuation
Division, Dept. of Chemicals and Petrochemicals, Ministry of Petroleum and Natural Gas, Government of India.
MoRTH, 2008. Motor Transport Statistics of India. Transport Research Wing, Ministry of Road Transport and Highways,Government of India
SAIL, 2000. Statistics for Iron & Steel Industry in India 2000
SFR, 2009. India State of Forest Report 2009. Published by the Forest Survey of India, Ministry of Environment and
Forests, Government of India.
UNSTAT, 2010. Population data, UN population (http://na.unep.net/datasets/mapservices.php)
WRS, 2008. World Rice Statistics, 2008. IRRI, Manila.

India: Greenhouse Gas Emissions 2007Page 57
References
ADB. 1994. Climate Change in Asia: India Country Report. Asian Development Bank, Manila.ALGAS, 1998. Asia least cost greenhouse gas abatement strategy project, Country Case study India. Asian Development
Bank, Manila.Bhattacharya, S. and Mitra, A.P. (1998) Greenhouse gas emission India for the base year 1990, Center for Global Change,
National Physical Laboratory, New Delhi. pp. 118.Champion H G and Seth S K, 1968. A revised survey of the forest types of India. Ministry of Environment and Forests,
Government of India.Choudhury, A., Roy, J., Biswas, S., Chakraborty, C. C. and Sen, K., Determination of carbon dioxide emission factors from
coal combustion. In Climate Change and India: Uncertainty Reduction in Greenhouse Gas Inventory Estimates (edsMitra, A. P., Sharma, Sharma, S., Bhattacharya, S., Garg, A., Devotta, S. and Sen, K.), Universities Press, Hyderabad, 2004.
Dhand, Vivek, Tripathi, A.K., Manhas, R.K., Negi, J.D.S. and Chauhan, P.S., 2003. Estimation of Carbon Content in someForest tree species, Indian Forester, Vol. 129, july 2003, No.7, Page No. 920.
Francis, K. John, 2000. Estimating Biomass and Carbon Content Sampling in Puerto Rican Secondary Forests, CaribbeanJournal of Science, Vol. 36 No. 3-4, 346-350, 2000, Page No. 348
Gaikwad, S. A., Kumar, S., Devotta, S. and R. N. Singh, Methane emissions from solid waste management in India and itsuncertainty analysis, 2004. . In Climate Change and India: Uncertainty Reduction in Greenhouse Gas Inventory Estimates(eds Mitra, A. P., Sharma, S., Bhattacharya, S., Garg, A., Devotta, S. and Sen, K.), Universities Press, Hyderabad.
Garg Amit, Bhattacharya Sumana, Shukla P.R. and Dadhwal V.K., (2001). Sectoral and regional Greenhouse Gases Emissionsfor India. Atmospheric Environment 35, 2679-2695.
Griggs DJ and BA Callender . IPCC/OECD/IEA. UK Meteorological Office, Bracknell.Gupta, Prabhat K, S N Das, T K Adya, H Pathak, R Ramesh, N Purkait, K K Baruah, L Venkataratnam, Gulab Singh, CSP Iyer,
Vandana Gupta, C Sharma, Pratul Sharma, Vaishali Pradhan, Nahar Singh, S Koul, Khem Singh, P Johri, S C Garg and A PMitra. 2004. Reducing uncertainties in methane emissions from rice cultivation, 2004. . In Climate Change and India:Uncertainty Reduction in Greenhouse Gas Inventory Estimates (eds. Mitra, A. P., Sharma, S., Bhattacharya, S., Garg, A.,Devotta, S. and Sen, K, Universities Press, Hyderabad.
Gupta, Sangeeta and Uniyal B.M. , 2003. Indian woods - Their Medicinal importance and Identification Indian Forester vol.129 October 2003 No.10, Page no. 1227-1239
Huke, R.E., Huke, E.H., 1997. Rice Area by Type of Culture: South, Southeast, and East Asia . IRRI, Los Baños, Philippines, 59pp
IPCC AR4. 2007a. The Physical Science Basis. Working Group I Report of the intergovernmental Panel on Climate Change..Editors: Solomon, S., D. Qin, M. Manning, Z. Chen, M. Marquis, K.B. Averyt, M. Tignor and H.L. Miller . CambridgeUniversity Press, Cambridge, United Kingdom and New York, NY, USA.
IPCC, 1997. Revised 1996 IPCC Guidelines for National Greenhouse Gas Inventories. Editors: JT Houghton, LG Meira Filho,B Lim, K Treanton, I Mamaty, Y Bonduki,
IPCC, 2000. Good Practice Guidance and Uncertainty Management in National Greenhouse Gas Inventories , editors: JPenman, D Kruger, I Galbally, T Hiraishi, B Nyenzi, S Emmanul, L Buendia, R Hoppaus, T Martinsen, J Meijer, K Miwa andK Tanabe. Published for the IPCC by the Institute for Global Environmental Strategies, Japan ISBN 4-88788-000-6.
IPCC, 2003. Good Practice Guidance for Land Use, Land-Use Change and Forestry. Edited by Jim Penman, Michael Gytarsky,Taka Hiraishi, Thelma Krug, Dina Kruger, Riitta Pipatti, Leandro Buendia, Kyoko Miwa, Todd Ngara, Kiyoto Tanabe andFabian Wagner. Published by the Institute for Global Environmental Strategies (IGES) for the IPCC ISBN 4-88788-003-7,
Jha Arvind K. , C. Sharma , Nahar Singh, R. Ramesh, R. Purvaja, Prabhat K. Gupta, 2007. Greenhouse gas emissions frommunicipal solid waste management in Indian mega-cities: A case study of Chennai landfill sites. Chemosphere 71 (2008)750–758.
Mitra A P, 1992. Greenhouse Gas Emission in India - 1992 Update, Editor: A P Mitra. Global Change Scientific Rep. No.4,CSIR, August 1992.
Mitra A P., 1991. Greenhouse Gas Emission in India A Preliminary Report. Editor: A P Mitra. Global Change ScientificReport number no. 1, CSIR, June 1991.
Mitra A P., Subodh Sharma, Sumana Bhattacharya, Amit Garg, Sukumar Devotta, and Kalyan Sen. 2004. Climate Changeand India: Uncertainty Reduction in Greenhouse Gas Inventory Estimates. Editors: Mitra A P., Subodh Sharma, SumanaBhattacharya, Amit Garg, Sukumar Devotta, and Kalyan Sen. Universities Press India.
Annexure 2
Indian Network for Climate Change Assessment Page 58
NAPCC, 2008. National Action Plan on Climate Change, Government of India.NATCOM, 2004. India’s Initial National Communication to the UNFCC. Ministry of Environment and Forests, Government
of India.NEERI, 2005. Assessment of status of Municipal Solid Waste Management in metro cities, state capitals, class -1 cities and
class – II towns.Pant, M.M, 1981. Wood to Alleviate India’s energy crisis, Indian Forester, 1971-1985 , Cd# 7, File No. 107, 107_12_8.pdf,
page No. 800.Parashar D C, Prabhat K Gupta and Sumana Bhattacharya, 1997. Recent methane budget estimates from Indian rice paddy
fields. Indian Journal of Radio and Space Physics., vol. 26, pp. 237-243.Parashar DC, A. P. Mitra, Prabhat K Gupta, J Rai, R C Sharma, N Singh, S Kaul, G Lal, A Chaudhury, H S Ray, S N Das, K M
Parida, S B Rao, S P Kanungo, T Ramasami, B U Nair, M Swamy, G Singh, S K Gupta, A R Singh, B K Saikia, A K S Barua,M G Pathak, C S P Iyer,. M Gopla Krishnan, P V Sane, S N Singh, R Banerjee, N Sethunathan, T K Adhya, V R Rao, P Palit,A K Saha, N N Purkait, G S Chaturvedi, S P Sen, M Sen, B Sarkar, A Banik, B H Subbaraya, S Lal, S Venkataramani, and SK Sinha. 1994. Methane Budget From Paddy Fields In India, Current Science, 66(12), P-938-941.
Pathak, H., Bhatia, A., Shiv Prasad, Jain, M.C., Kumar, S., Singh, S. and Kumar, U., 2002. Emission of nitrous oxide from soil inrice-wheat systems of Indo-Gangetic plains of India. J. Environ. Monitoring Assessment 77(2):163-178.
Prabhat K. Gupta, C. Sharma, Sumana Bhattacharya and A.P. Mitra, 2002. Scientific basis for establishing country greenhousegas estimates for rice-based agriculture: An Indian case study. Nutrient Cycling in Agro-ecosystems, Springer Netherlands,Volume 64, Numbers 1-2 October, 2002. pp 19-31. Press, Hyderabad, 2004.
Puri, G.S., 1950. The Ecology of the humus layer in some english forests, Indian forester, 1943-1952, Oct 1950, File No. 76,76_10_4, CD#4, page no. 426.
Rao, P. V., Qureshi, M. S. and Devotta, S., GHG emission measurements in industrial processes. In Climate Change andIndia: Uncertainty Reduction in Greenhouse Gas Inventory Estimates (eds Mitra, A. P., Sharma, S., Bhattacharya, S., Garg,A., Devotta, S. and Sen, K.), Universities Press, Hyderabad, 2004. 16. Singh, A. K., Methane emission from coal miningand handling activities in India. In Climate Change and India: Uncertainty Reduction in Greenhouse Gas InventoryEstimates (eds Mitra, A. P., Sharma, S., Bhattacharya, S., Garg, A., Devotta, S. and Sen, K.), Universities Press, Hyderabad,2004.
Sekhar, A.C. & Rawat, N.S., 1960. A note on Mechanical properties of Prosopis Juliflora, Indian Forester ,1953- 1960, FileNo.86, 86_8_5, CD# 5, Page No.486.
Shukla P R, Subodh K Sharma, N H Ravindranath, Amit Garg, SumanaBhatacharya, 2003. Climate Change and India:Vulnerability Assessment and Adaptation. Editors: Shukla P R, Subodh K Sharma, N H Ravindranath, Amit Garg,SumanaBhatacharya. Universities Press India.
Shukla, P R., Subodh K Sharma, P Venkata Ramana, 2002. Climate Change and India: Issues concerns and opportunities.Editors: Shukla, P R., Subodh K Sharma, P Venkata Ramana. Published Tata Mcgraw Hill, India.
Singh, A. K., Saxena, M. and Singhal, S. K., Uncertainties in emission estimates from the road transport sector. In ClimateChange and India: Uncertainty Reduction in Greenhouse Gas Inventory Estimates (eds Mitra, A. P., Sharma, S., Bhattacharya,S., Garg, A., Devotta, S. and Sen, K.), Universities Press, Hyderabad, 2004.
Swamy, M., Singhal, K. K., Gupta, P., Mohini, M., Jha, Arvind K. and Singh, N., 2004. Reduction in uncertainties fromlivestock emissions. In Climate Change and India: Uncertainty Reduction in Greenhouse Gas Inventory Estimates (edsMitra, A. P., Sharma, S., Bhattacharya, S., Garg, A., Devotta, S. and Sen, K.), Universities Press, Hyderabad, 2004.

India: Greenhouse Gas Emissions 2007Page 59
Central Institute of Mining and Fuel Research Mr. Subhasis BiswasDhanbad, Jharkhand, India Dr. Ajay Kumar Singh
Mr. Ashim ChoudhuryDr. Pinaki Sarkar Mr. Santi Glopal SahuMr. A. K. AdakDr. J. RoyMr. John KispottaMr. Vinod Atmaram MendheMr. Shyam Nath Hazari
The Energy and Resources Institute (TERI) Dr. Pradeep Kumar DadhichDarbari Seth Block, India Habitat Place Mr. Prabhat UpadhyayaLodhi Road, New Delhi Dr. Heena Zia
Dr. Atul KumarMr . Shashank JainMr. Abhishek Nath
Central Road Research Institute Dr. Anil SinghP.O. CRRI, Delhi-Mathura Road Dr. S. GangopadhyayNew Delhi Mr. Chander Bhan
Petroleum Planning and Analysis Cell, New Delhi Mr. Vijay Sethi
Cement Manufacturers’ Association Dr. S. P. GhoshCMA Tower, Noida (U.P.) Mr. Jainender Kumar
Mr. K.K. Roy ChowdhuryMr. Piyuesh AggarwalMr. Ashok SharmaMr. C.S.PantMr. Srinivas KasirajuMr. Harish UniyalMrs. Meenu KaliaMr. Harish PapnaiDr. R. BhargavaMr. B.K. ModiMr. Naveen Sharma
Central Leather Research Institute, Chennai Dr. T. P. SastryMr. D. ChandramouliDr. A. B. MandalDr. Giriyappa KollannavarMr. S.Nithiyanantha VasagamMs. V. ShashirekhaDr. Mahadeswara Swamy
Scientists/ Experts - India : Greenhouse Gas Emissions 2007
Annexure 3

Indian Network for Climate Change Assessment Page 60
Confederation of Indian Industry Dr. Suman MajumdarCII-ITC Centre of Excellence for Sustainable Development Ms. Seema AroraNew Delhi Ms. Esha Sar
Ms. Trayee Banerjee
Indian Agricultural Research Institute Dr. Arti BhatiPusa, New Delhi Dr. Niveta Jain
Dr. Himanshu PathakDr. P K Aggarwal
Bidhan Chandra Krishi Viswavidyalaya, Dr. Biswapati Mandal
Mohanpur, Nadia, West Bengal Mr. Kaushik BatabyalMr. Nimai Senapati
National Dairy Research Institute Dr. Madhu MohiniKarnal, Haryana K. K. Singhal
A.K. Tyagi
Forest Survey of India, Mr.Subhash AshutoshKaulagarh Road Mr. Rajesh KumarDehradun Raj Kumar Bajpai
Indian Institute of Science Prof. N. H. RavindranathBangalore Ms. Shilpa Swarnim
Ms. Nitasha Shrama
National Remote Sensing Centre Dr. M. S. R. MurthyDept. of Space, GOI,Hyderabad Dr. C. S. Jha
National Environmental Engineering Research Institute, Mr. J.K. BhattacharyyaNagpur, Maharastra Mr. M. Karthik,
Dr. S.P.M. Prince WilliamDr. Tapas NandyMr. Pawan Aswale
National Physical Laboratory Dr. Prabhat GuptaDr. K. S. Krishnan Marg, New Delhi Dr. C Sharma
Mr. Manojeet ChakrabortyDr. Nahar SinghMr. Shivraj Sahai
Indian Grassland & Fodder Research Institute Dr. Sultan SinghDr. S. K. NagDr. A. K. MisraDr. B. P. Khushwaha
Indian Veterinary Research Institute, Izatnagar Dr. A.K. VermaDr. Putan SinghDr. V. B. Chaturvedi
Ministry of Environment and Forests Dr. Subodh K SharmaGovernment of India Dr. Sumana Bhattacharya, NATCOM Cell
Ms. Pooja Kotiyal, NATCOM CellMs. Sudatta Ray

India: Greenhouse Gas Emissions 2007Page 61
Annexure 4
1. Advance Research Centre For Bamboo and Rattans,Aizawl
2. Alkali Manufacturers’ Association of India, NewDelhi
3. Arid Forest Research Institute, Jodhpur4. Bidhan Chandra Krishi Vishwavidyalaya, Kolkata5. Bureau of Energy Efficiency, New Delhi6. Cement Manufacturers’ Association, Noida7. Central Glass and Ceramic Research Institute,
Kolkata8. Central Institute of Mining and Fuel Research,
Dhanbad9. Central Leather Research Institute, Chennai10. Central Mines Planning & Design Institute, Dhanbad11. Central Road Research Institute, New Delhi12. Central Statistical Organization (CSO)13. Centre for Forest Research and Human Resource
development , Chhindwara14. Centre for Social Forestry and Eco Rehabilitation,
Allahabad15. Coal India Ltd, Kolkata16. Confederation of Indian Industry, New Delhi17. Damodar Valley Corporation, Jharkhand18. Eastern Coal Field Ltd, West Bengal19. Fertiliser Association of India, New Delhi20. Forest Research Centre, Hyderabad21. Forest Survey of India, Dehradun22. Himalayan Forest Research Institute, Shimla23. Holtec Consulting Engineers Ltd, Gurgaon24. India Semiconductors Association, Bangalore25. Indian Agricultural Research Institute, New Delhi26. Indian Bureau of Mines, Nagpur27. Indian Chemical Council, Mumbai28. Indian Council of Forest Research and Education,
Dehradun29. Indian Grassland and Fodder Research Institute,
Jhansi30. Indian Institute of Petroleum, Dehradun
GHG INVENTORY ESTIMATES
31. Indian Institute of Remote Sensing , Dehradun32. Indian Institute of Science, Bangalore33. Indian Lead Zinc Development Association, New
Delhi34. Indian Veterinary Research Institute, Izatnagar35. Industries Association Of India, New Delhi36. Institute of Forest Genetics and Tree breeding,
Coimbatore37. Institute of Forest Productivity , Ranchi38. Institute of Wood Science and Technology ,
Bangalore39. Jadavpur University, Kolkata40. Mahanadi Coal Field Ltd, Orissa41. Ministry of New & Renewable Energy, New Delhi42. Ministry of Petroleum & Natural Gas, New Delhi43. Naively Lignite Corporation Ltd., Tamil Nadu44. National Bureau of Soil Survey Land Use Planning,
Nagpur45. National Dairy Research Institute, Karnal46. National Environmental Engineering Research
Institute, Nagpur47. National Institute of animal nutrition and physiology,
Bangalore48. National Physical Laboratory, New Delhi49. National Remote Sensing Centre, Hyderabad50. Neyveli Lignit Corporation Ltd.51. North Eastern Coal Field Ltd, Assam52. Petroleum Conservation Research Association,
New Delhi53. Petroleum Conservation Research Association,54. Petroleum Planning and Research Cell, New Delhi55. Rain Forest Research Institute, Jorhat56. South Eastern Coal Field Ltd, Chhattisgarh57. Steel Authority of India, New Delhi58. The Energy and Resources Institute, New Delhi59. Tropical Forest Research Institute, Jabalpur60. University of Agriculture Sciences, Bangalore
INCCA Institutions

Indian Network for Climate Change Assessment Page 62
IMPACTS, VULNERABILITY & ADAPTATION ASSESSMENTS
1. Action for Food Production, Udaipur2. Anand Agricultural University, Anand3. Andaman & Nicobar Islands Forest & Plantation
Corporation Limited, Port Blair4. Arete Glaci-er & Water Consultants Pvt. Ltd, New
Delhi5. Central Inland Fisheries Research Institute,
Barrackpore6. Central Institute for Cotton Research, Nagpur7. Central Marine Fisheries Research Institute, Kochi8. Central Plantation Crop Research Institute, Kerala9. Central Potato Research Institute, Jalandhar10. Central Research Institute for Dryland Agriculture,
Hyderabad11. Central Soil & Water Conserv. Res. & Trng. Institute,
Dehradun12. Central Soil Salinity Research Institute, RRS,
Lucknow, UP13. Central Water Commission, New Delhi14. Dr. Y.S. Parmar University of Horticulture and
Forestry, Shimla15. Forest Survey of India, Dehradun16. Global hydrological solution, New Delhi17. Department of Science and Technology,
Government of Sikkim18. Himachal Pradesh Krishi Viswa Vidyalaya, Palampur19. Himalayan Institute of Mountaineering, Darjeeling20. ICAR Complex for NE Hill Region, Meghalaya21. ICAR Institute of Eastern Region, Patna, Bihar22. Indian Agricultural Research Institute, New Delhi23. Indian Institute of Horticulture Research, Bangalore24. Indian Institute of Management Ahmadabad25. Indian Institute of Science, Bangalore26. Indian Institute of Soil Science, Bhopal27. Indian Institute of Sugarcane Research, Lucknow28. Indian Institute of Technology Bombay, Mumbai29. Indian Institute of Technology Delhi, New Delhi30. Indian Institute of Tropical Meteorology, Pune31. Indian Meteorological Department, New Delhi32. Indian Mountaineering Foundation, New Delhi33. INRM Pvt. Lmt, New Delhi34. Institute of Economic Growth, New Delhi35. Institute of Home Economics, New Delhi
36. Integrated Institute of Minerals & MaterialsTechnology, Bhubaneshwar
37. Integrated Research and action for Development,New Delhi
38. Jadavpur University, Kolkata39. Jawahar Institute of Mountaineering and Winter
Sports, Pahalgam, Kashmir40. Kalpana Kalyan Society, Bali41. M.S. Swaminathan Research Foundation, Chennai42. Maharana Pratap University of Agriculture and
Technology, Udaipur43. Maulana Azad National Institute of Technology,
Bhopal44. National Bureau of Soil Survey and Land Use
Planning, Nagpur45. National Environmental Engineering Research
Institute, Nagpur46. National Institute of Malaria Research, New Delhi47. National Institute of Oceanography, Goa48. National Physical Laboratory, New Delhi49. National Research Centre for Soybean, Indore50. Navsari Agricultural University, Surat51. NRC on Agroforestry, Jhansi, Uttar Pradesh52. Prayatna Samiti, Bedla Road, Udaipur53. PROGRESS, Banswara54. Project Directorate on Poultry, Hyderabad55. Punjab Agricultural University, Jalandhar56. Rajasthan Bal Kalyan Samiti, Udaipur57. Reef Watch Marine Conservation, Mumbai58. Regional Horticulture Fruit Station, Moshobra,
Shimla59. Regional Horticulture Research Station, Sharbo,
Kinaur60. Tamil Nadu Agriculture University, Coimbatore61. The Energy and Resources Institute, New Delhi62. Tocklai Experiment Station, Jorhat63. University of Agricultural Sciences, Dharwad64. University of Kashmir, Department of Geology and
Geophysics, Sri Nagar65. Vallabhbhai Patel Chest Institute, New Delhi66. Winrock International India, New Delhi.67. Zoological Survey of India, Port Blair

India: Greenhouse Gas Emissions 2007Page 63
Annexure 5
Glossary of Key Terms
Agriculture: This includes emissions from entericfermentation, manure management, ricecultivation, managed soils and burning of cropresidue.
CAGR: The compound annual growth rate is calculatedby taking the nth root of the total percentage growthrate, where n is the number of years in the periodbeing considered.
Chemicals: In this document chemicals includeproduction of ammonia, nitric acid, adipic acid,caprolactam, carbide, titanium dioxide,petrochemicals and black carbon, methanol,ethylene, ethylene oxide, acrylonitrile, ethylenedichloride and vinyl chloride, monomer and otherchemicals (dyes and pigments, inorganic acidsexcept nitric acid, acyclic hydrocarbons, basicorganic chemicals, inorganic compounds, alkaliesand other inorganic bases except ammonia,synthetic aromatic products, luminophores, etc).
CO2 Equivalent: It is the sum total of all GreenhouseGases in terms of their global warming potential.In this document the CO2 equivalent includes thesum of Carbon dioxide, Methane multiplied by itsGWP (21) and Nitrous oxide multiplied by its GWP(310).
Country Specific Data: Data for either activities oremissions that are based on research carried outon-site either in a country or in a representativecountry.
Emission Factor: A coefficient that quantifies theemissions or removals of a gas per unit activity.Emission factor are often based on a sample ofmeasurement data, averaged to develop arepresentative rate of emission for a given activitylevel under a given set of operating conditions.
Emissions: The release of greenhouse gases and / or theirprecursors into the atmosphere over a specifiedarea and a period of time.
Energy: This category included all GHG emissions arising
from combustion of fossil fuel and fugitive releaseof GHG’s. Emissions from the non-energy use arenot included here and are reported under theindustry sector. This category includes emissionsdue to fuel combustion from energy industries(electricity generation, petroleum ref ining,manufacturing of solid fuel), transport, commercial/ institutional, residential, agriculture / forestry /fisheries, and fugitive emissions from coal miningand handling and from oil and natural gas.
Enteric Fermentation: A process of digestion inherbivores (plant – eating animals) which producesmethane as a by-product.
Estimation: The process of calculating emissions and /or removal
Flaring: Deliberate of burning of natural gas and wastegas / vapour streams, without energy recovery.
Fossil Fuel Combustion: Is the intentional oxidation offossil fuel that provides heat or mechanical workto process.
Fugitive Emission: Emission that are not emitted throughan intentional release through stack or vent. Thiscan include leaks from plants, pipelines and duringmining.
Global Warming Potential (GWP): GWPs are calculatedas a ratio of radiative forcing of 1 kilogramgreenhouse gas emitted to the atmosphere to thatfrom 1 kilogram CO2 over a period of time (e.g..100 years).
Good Practice: Is a set of procedures intended to ensurethat GHG inventories are accurate, that neither overnor underestimated and that uncertainties arereduced as far as possible. It covers choiceestimation methods, quality assurance and qualitycontrol, quantification of uncertainties andprocesses for data archiving and reporting.
INCCA: Indian Network for Climate Change Assessment- an initiative being coordinated by the Ministry ofEnvironment and Forests, Government of India.

Indian Network for Climate Change Assessment Page 64
Industry: This includes emissions from industrialprocesses and emissions due to fossil fuelcombustion in manufacturing industries. Theemissions are estimated from mineral industry(cement, lime, glass, ceramics, soda ash use),chemical industries (ammonia, nitric acid, adipicacid, caprolactam, carbide, titanium dioxide,petrochemicals and black carbon, methanol,ethylene, etc.), metal industry (iron and steel,ferroalloys, aluminium, magnesium, lead, sink, etc.),other industry and non-energy products from fuelsand solvent use (paraffin wax and lubricants).
Land Cover: The type of vegetation, rock, water, etc.covering the earth surface.
Land Use: The type of activity being carried out by unitof land
Land Use Land Use Change and Forestry (LULUCF):Includes emissions and removal from changes inareas of forest land, crop land, grass land, wet land,settlements and other lands.
Million Tons: equal to 106 tons.
Non Energy Products: Primary or secondary fossil fuelswhich act as diluent. Examples, lubricants, paraffinwax, bitumen, etc.
Non Energy Use: Use of fossil fuels as feedstock,reductant or non-energy products.
Non-specific industries: Includes rubber, plastic, medicalprecetion equipments, watches, clocks, othertransport, furniture, re-cycling etc.
Other Energy: Includes GHG emissions from petroleumrefining, manufacturing of solid fuel, commercial& institutional sector, agriculture & fisheries andfugitive emissions from mining, transport andstorage of coal, oil and natural gas.
Other Industry: Includes GHG emissions fromproduction of food processing, textile, leather,mining and quarrying, non specific industries anduse of lubricants and paraffin wax.
Other Minerals: In this document other minerals referto glass and ceramics production and soda ash use.
Per Capita Emissions: GHG emissions in CO2 eq perperson.
Removals: Removal of greenhouse gases and or theirprecursors from the atmosphere by a sink
Sequestration: The process of storing carbon in a carbonpool.
Sink: Any process, activity or mechanism which removesgreenhouse gases from the atmosphere.
Source: Any process or activity which releases agreenhouse gas.
Tier I: Its approach employs activity data that arerelatively coarse, such as nationally or globallyavailable estimates of deforestation rates;agriculture production statistics and global landcover maps.
Tier II: It uses the same methodological approach as Tier1 but it applies emission factors and activity datawhich are defined by the country
Tier III: Applies higher order methods are used includingmodels and inventory measurement systemstailored to address national circumstances,repeated over time, and driven by disaggregatedlevels.
Uncertainty: Lack of knowledge of the true value of avariable.
Waste: Includes methane emissions from anaerobicmicrobial decomposition of organic matter in solidwaste disposal sites and methane produced fromanaerobic decomposition of organic matter by

Contact
Dr. Subodh K SharmaAdviserMinistry of Environment and ForestsRoom No. 112, Paryavaran BhawanCGO Complex, Lodi RoadNew Delhi – 110003Tel/Fax : 91-11-24360861Email : [email protected]


![Greenhouse Gas Emissions and Emissions Trading in North … · 2020. 2. 23. · 2002] Stephenson-Greenhouse Gas Emissions, Kyoto and U.S. Response 45 greenhouse gas molecules. This](https://img.pdfslide.net/doc/110x75/60facf56e286b02f9b10de99/greenhouse-gas-emissions-and-emissions-trading-in-north-2020-2-23-2002-stephenson-greenhouse.jpg)