Embed Size (px)
Citation preview

India Smart Cities and Bus Systems UITP India Bus Seminar 2016

Image: Steve McCurry
Indian Cities and Mobility Scenario

• 2009 : 15260 buses sanctioned for 67 cities. 14000 buses purchased for 63 cities
• Nine cities adopted BRTS systems • 2013-14 - Additional 10000 buses
and ancillary infrastructure was sanctioned for Rs 4500 crores but only Rs 20% was utilized
• Failure to build institutions (SPVs)
to operate the bus systems, lack of robust fare policies and non adherence to schedule and routes
• Few agencies (Karnataka State
Road Transport Corporation and Navi Mumbai Municipal Corporation) planned and implemented support infrastructure (bus stops, bus depots and operation centers)
Bus Systems Under JnNURM
Image: www.thebetterindia.com
Image: www.newslinechannel.com
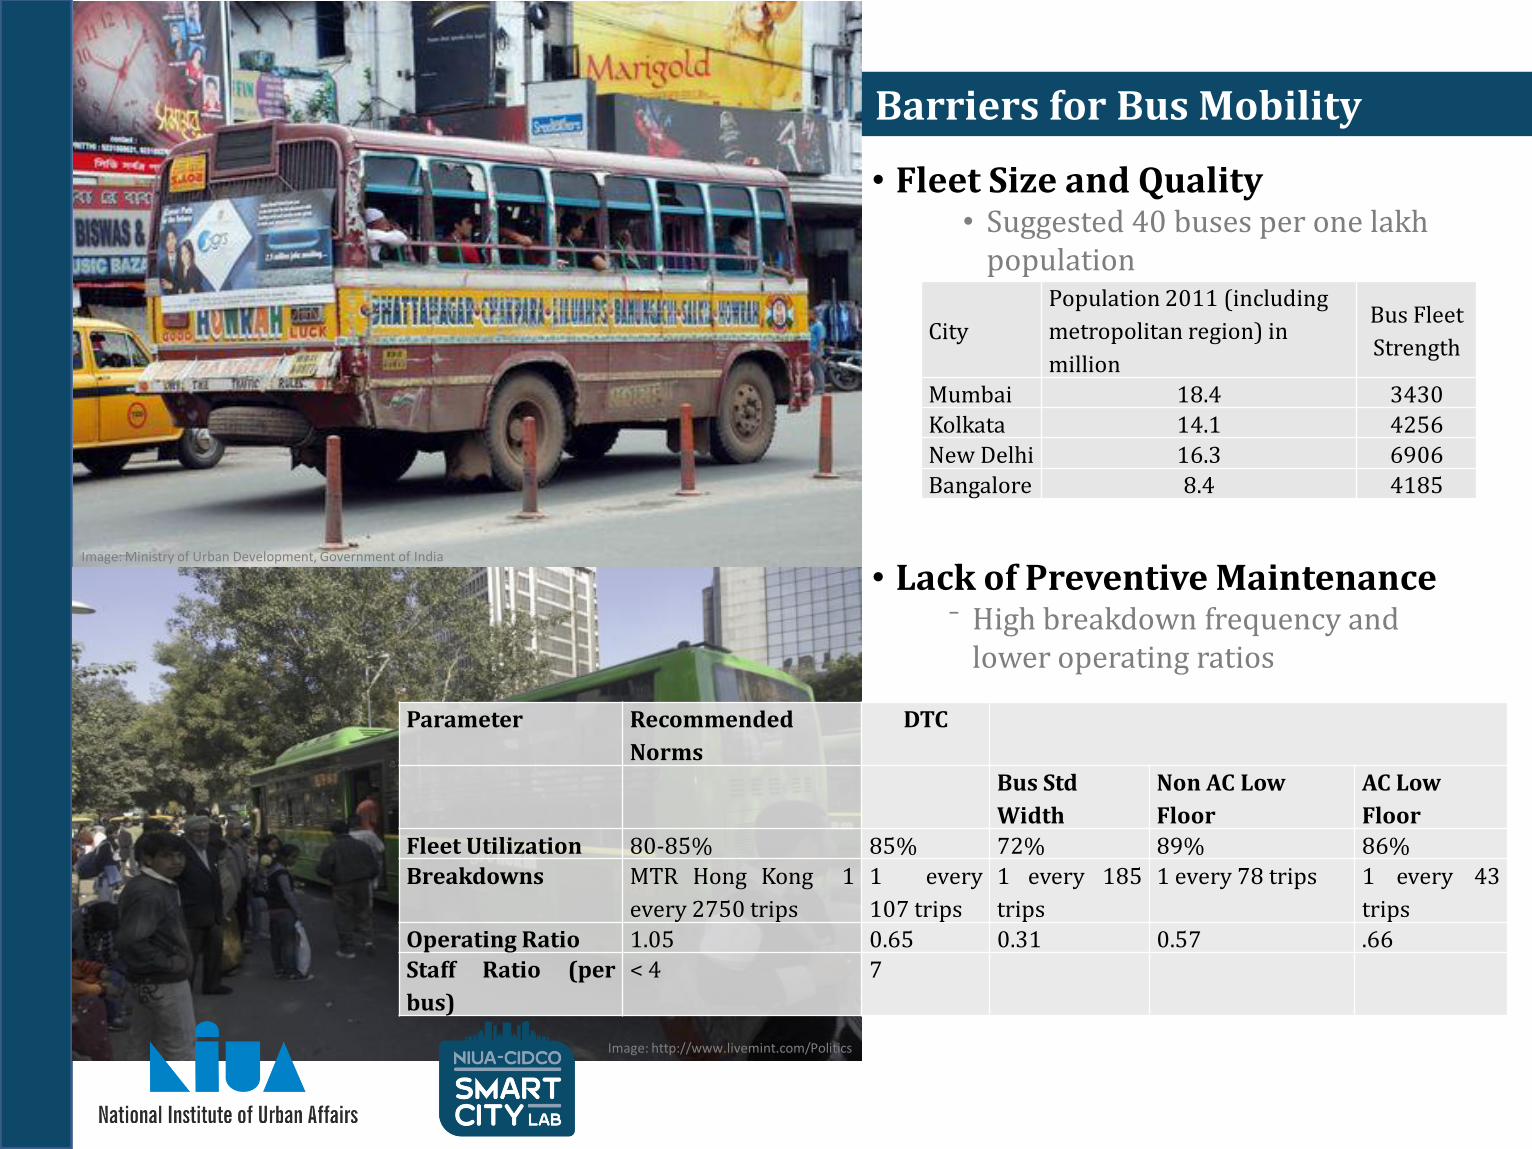
• Fleet Size and Quality • Suggested 40 buses per one lakh
population
Barriers for Bus Mobility
City
Population 2011 (including
metropolitan region) in
million
Bus Fleet
Strength
Mumbai 18.4 3430
Kolkata 14.1 4256
New Delhi 16.3 6906
Bangalore 8.4 4185
• Lack of Preventive Maintenance ⁻ High breakdown frequency and
lower operating ratios
Parameter Recommended
Norms
DTC
Bus Std
Width
Non AC Low
Floor
AC Low
Floor
Fleet Utilization 80-85% 85% 72% 89% 86%
Breakdowns MTR Hong Kong 1
every 2750 trips
1 every
107 trips
1 every 185
trips
1 every 78 trips 1 every 43
trips
Operating Ratio 1.05 0.65 0.31 0.57 .66
Staff Ratio (per
bus)
< 4 7
Image: http://www.livemint.com/Politics
Image: Ministry of Urban Development, Government of India

• Lack of feeder services at intermediate and final destinations
• Congestion
• Cities with population more than 8 million:
• average trip length of 10.4 km
• average speed of 17 kmph (as against the stated speed of 30kmph)
• The average speed is projected to reduce to half ( 9kmph) by 2021 and one-third (6 kmph) by 2031.
• Vehicle Restraint Measures, Road Space Allocation, Parking Management
• Role of Technology • Bus Signal Prioritization • Real Time Passenger
Information Systems
Barriers for Bus Mobility
Image: The Hindu
Image:adelaidenow.com.au
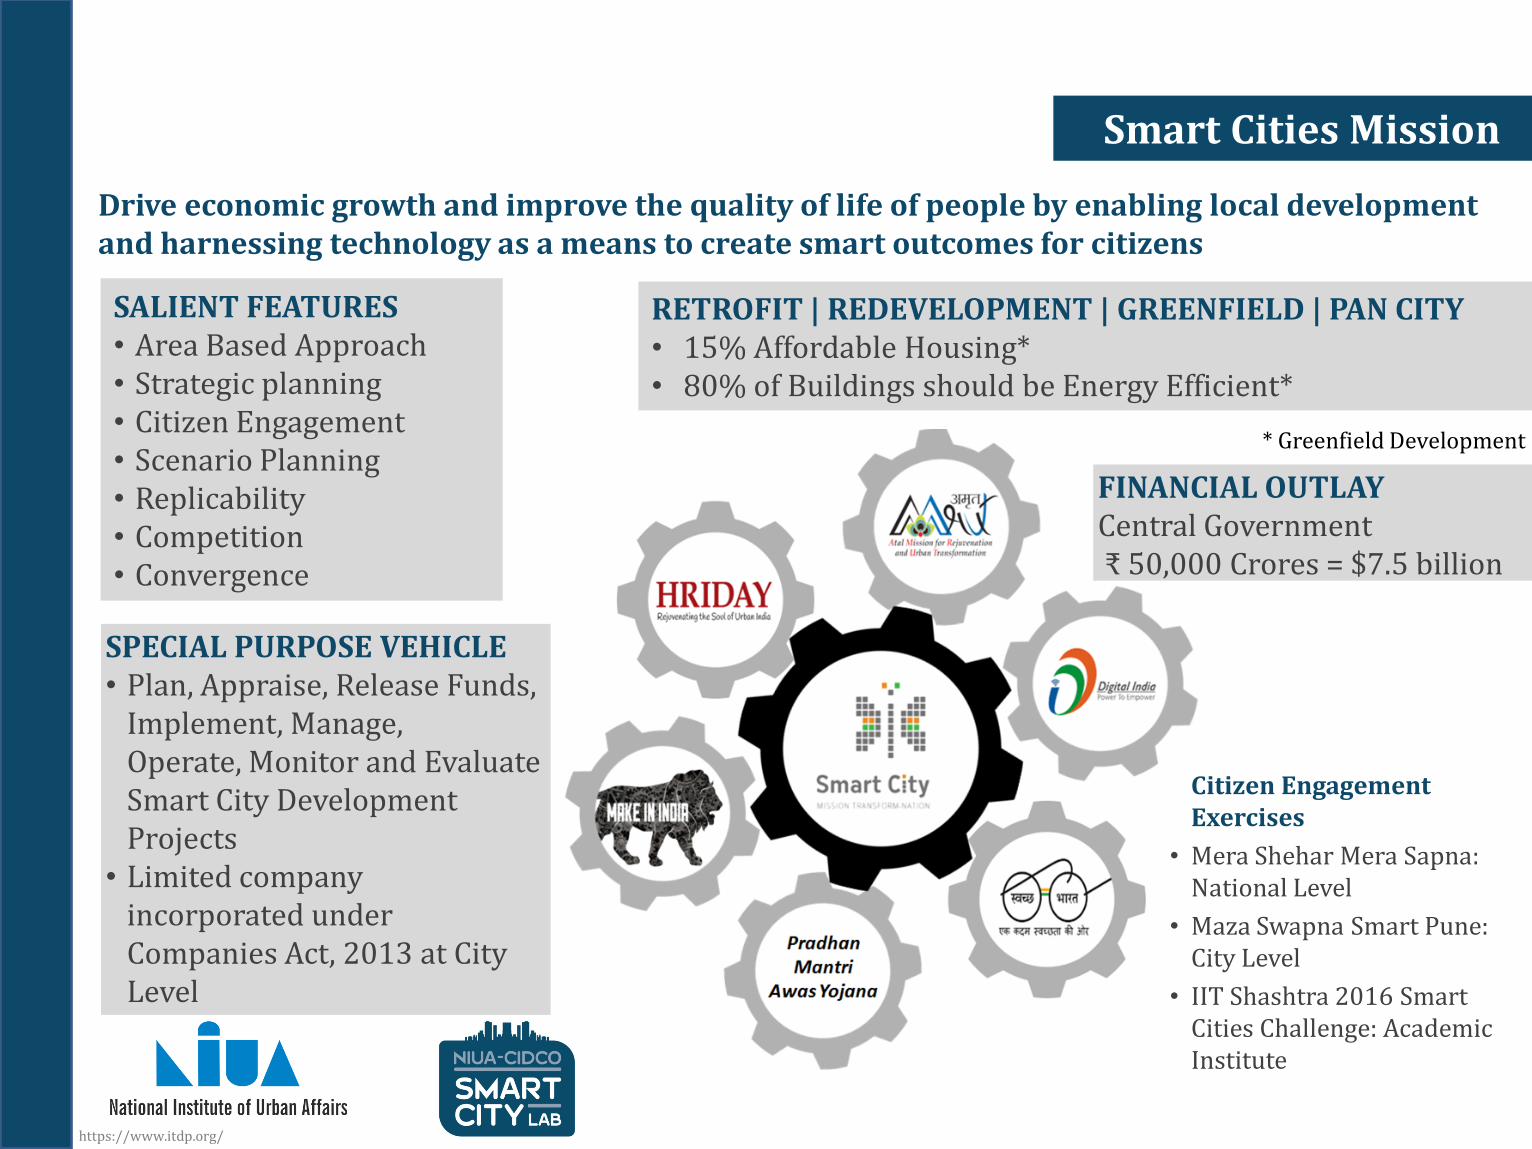
Drive economic growth and improve the quality of life of people by enabling local development and harnessing technology as a means to create smart outcomes for citizens
https://www.itdp.org/
SALIENT FEATURES • Area Based Approach • Strategic planning • Citizen Engagement • Scenario Planning • Replicability • Competition • Convergence
Smart Cities Mission
RETROFIT | REDEVELOPMENT | GREENFIELD | PAN CITY • 15% Affordable Housing* • 80% of Buildings should be Energy Efficient*
* Greenfield Development
SPECIAL PURPOSE VEHICLE • Plan, Appraise, Release Funds,
Implement, Manage, Operate, Monitor and Evaluate Smart City Development Projects
• Limited company incorporated under Companies Act, 2013 at City Level
FINANCIAL OUTLAY Central Government ₹ 50,000 Crores = $7.5 billion
Citizen Engagement Exercises
• Mera Shehar Mera Sapna: National Level
• Maza Swapna Smart Pune: City Level
• IIT Shashtra 2016 Smart Cities Challenge: Academic Institute

Scoring Criteria
Smart Cities Mission

Smart Cities Mission Mobility Projects for 20 cities
• Total Central and State Govt for 100 Smart Cities: $ 14.9 Billion
• 20 Lighthouse Cities
• Total Smart City Investment – $7.2 Billion
• Integrated mobility projects as part
of SCP – 214
• Total budget committed to 214 projects - $1.78 Billion
• 25% of budget for Mobility • NMT (Bicycle and Pedestrian
Infrastructure) - $390 Million
• Mobility ICT/ITS Systems - $ 233 Million
• Investment Average - $50/capita

Smart Cities Mission Bus Mobility Projects for 20 cities
• Public Transportation - 62 projects at
$500 million • Bus Systems – 28 projects at $200 Million
• Physical Infrastructure - $133 Million
• Bus related ICT/ITS Systems - $30 Million
• Clean Fuel - $22 Million
• BRTS based Transit Oriented
Development proposed by Ahmedabad
• Intermodal hubs proposed by Ahmedabad and Jaipur
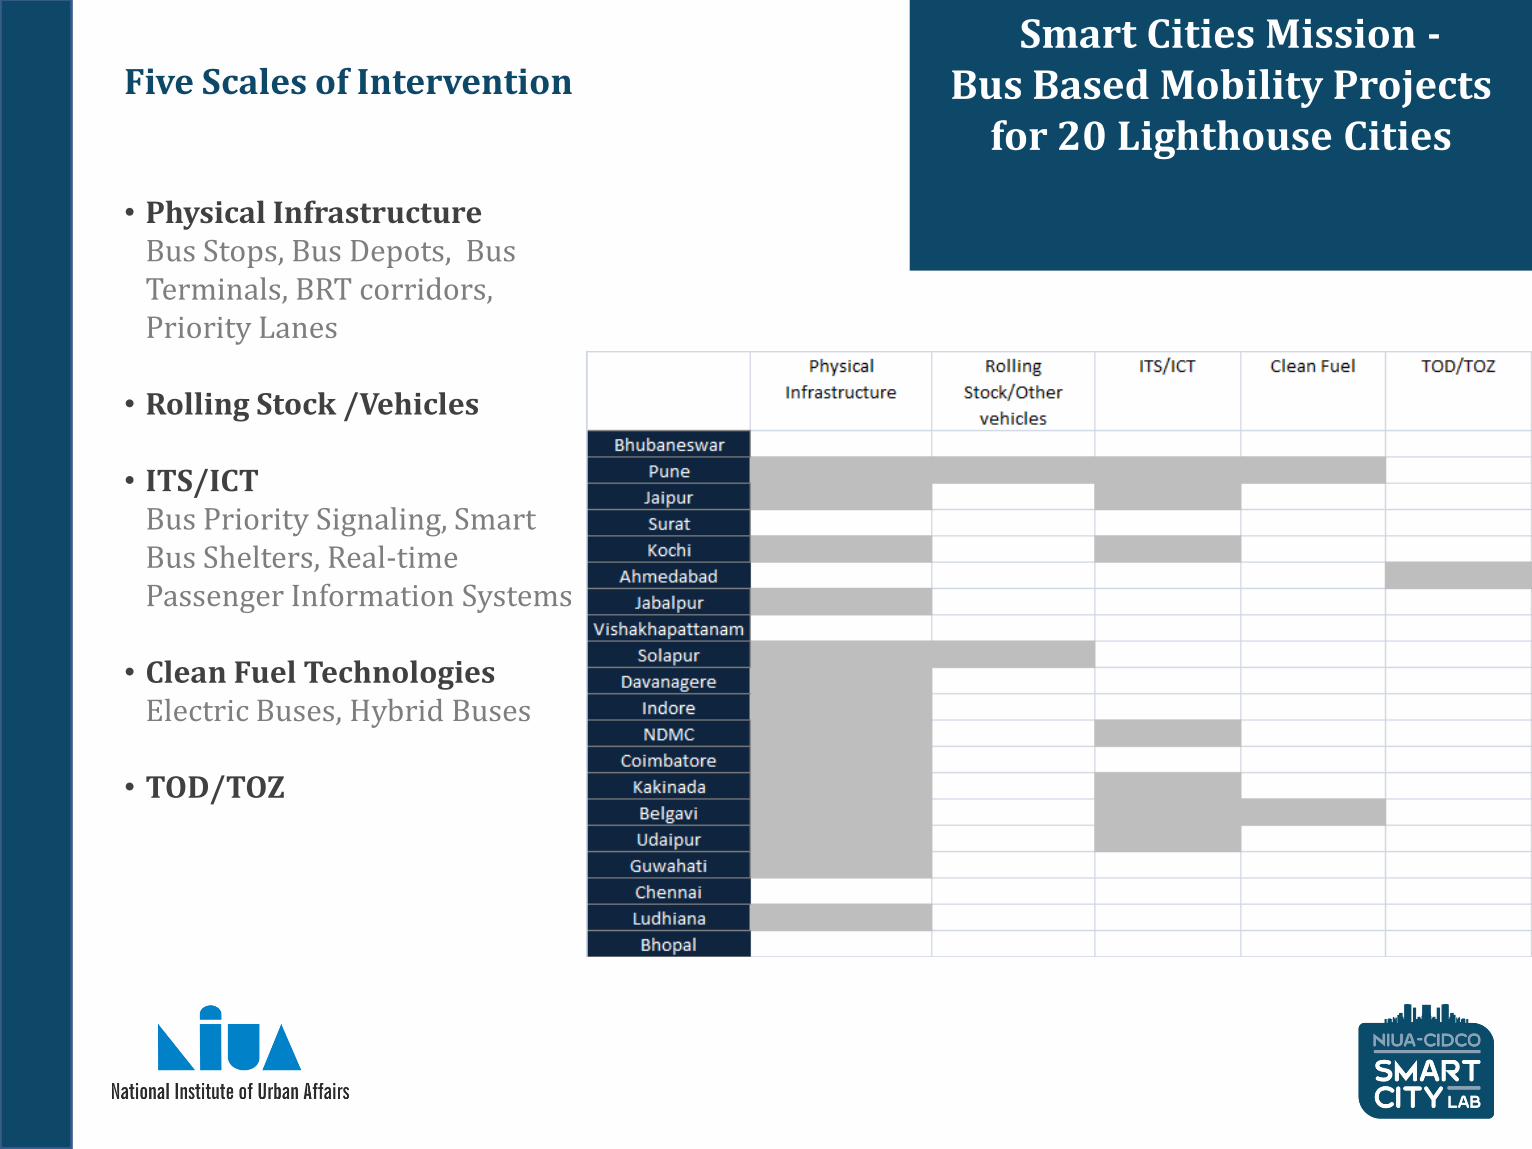
Smart Cities Mission - Bus Based Mobility Projects
for 20 Lighthouse Cities
Five Scales of Intervention • Physical Infrastructure Bus Stops, Bus Depots, Bus
Terminals, BRT corridors, Priority Lanes
• Rolling Stock /Vehicles
• ITS/ICT Bus Priority Signaling, Smart
Bus Shelters, Real-time Passenger Information Systems
• Clean Fuel Technologies Electric Buses, Hybrid Buses • TOD/TOZ
Sources
• Traffic & Transportation Policies and Strategies in Urban Areas in India,2007, Ministry of Urban Development and Wilbur Smith Associates
• http://pib.nic.in/newsite/PrintRelease.aspx?relid=98191 • 2004, Bus Regulation and Planning, Module 3c, A Source Book for Policy Makers in Developing Countries,
GIZ • July 2014, Operational Statistics, Delhi Transport Corporation • Tiwari Geetam and Jain Himani, December 2008, Bicycles in Urban India, Urban Transport Journal, IUT • Urban India 2011: Evidence, India Institute for Human Settlements