Embed Size (px)
Citation preview
304
Study of Solvation Consequences of 1-Butyl-1-Methylpyrrolidinium Bromide and Chloride Prevailing in Protic Solvent System
Mahendra Nath Roy*, Kanak Roy, Mitali Kundu, Biraj Kumar Barman
Department of Chemistry, University of North Bengal, Darjeeling - 734 013, West Bengal, India.
Received 04th May 2015; Revised 05th June 2015; Accepted 18th June 2015
ABSTRACTElectrolytic conductivities, densities, viscosities, and Fourier transform infrared (FTIR) studies of 1-buty-1-methyl pyrrolidiniumbromide ([BMPyrr][Br]) and 1-butyl-1-methylpyrrolidiniumchloride ([BMPyrr][Cl]) have been studied in methanol at different temperatures. The limiting molar conductivities, association constants, and the distance of closest approach of the ions have been analyzed using the Fuoss conductance equation (1978) for ion-pair formation. Ion-solvent interactions have been interpreted in terms of apparent molar volumes and viscosity B-coefficients which are obtained from the results of density and viscosity measurements. The limiting apparent molar volumes, experimental slopes derived from the Masson equation and viscosity A and B coefficients using the Jones–Dole equation have been interpreted in terms of ion-ion and ion-solvent interactions respectively. The FTIR spectra for the methanol, as well as the ionic liquids in methanol have also been recorded. The experimental results have been discussed in terms of ion-dipole interactions, hydrogen bonds formation, structural aspect, and configurational theory.
Key words: Solvation consequence, Ion-pair formation, Viscosity, Density, Conductance, Fourier transform infrared spectra.
1. INTRODUCTIONIn many academic and industrial research areas, ionic liquids (ILs) have been considered as attractive compounds for extensive studies due to their unique properties, such as ability to dissolve variety of chemicals, wide liquids range, negligible vapor pressure, high thermal stability, large electrochemical window and their potential as “designer solvents” and “green” replacements of volatile organic solvents used in reaction involving inorganic, organic and bio-catalysis, etc., [1-3]. They are also used in solar cells and battery industries as a heat transfer fluids and current conducting liquids respectively [4-6]. These types of application are better understood by the solvation phenomena and ionic association behavior of salts in diverse solvent systems.
On the other hand, to examine the nature, mode and magnitude of ion-ion, ion-solvent interactions in non-aqueous solution systems are of great importance to industrialists, technologists and theoreticians as many chemical reactions occurs in these solvent systems [7].
The physical properties such as melting point, density, viscosity, and hydrophobicity or hydrophilicity can be
customized by replacing the cations and anions [8] of the studied ILs. Polar anionic functional groups (here, Br− and Cl−) are able to interact with polar solvents. Owing to their diversity of structural and chemical properties they are capable to participate in most types of interactions, i.e. H-bonding, ion-dipole, dipole-dipole, van der Waals forces [9,10].
Our present work is mainly focused on the comparative study of solvation consequences of ILs 1-butyl-1-methylpyrrolidiniumbromide ([BMPyrr][Br]) and 1-butyl-1-methylpyrrolidiniumchloride ([BMPyrr][Cl]) in methanol at different temperatures. To ascertain this interaction phenomena Fourier transform infrared (FTIR) spectroscopic technique is also used in this study.
2. EXPERIMENTAL2.1. Source and Purity of SamplesThe ILs selected for this work puriss grade were procured from Sigma-Aldrich, Germany and used as purchased. The mass fraction purity of the ILs were ≥0.99.
Spectroscopic grade methanol was procured from Sigma-Aldrich, Germany and used as purchased. The
Indian Journal of Advances in
Chemical ScienceAvailable online at www.ijacskros.com
Indian Journal of Advances in Chemical Science 3(4) (2015) 304-314
*Corresponding Author: E-mail: [email protected] Tel.: +91-353-2776381, Fax: +91-353-2699001

Indian Journal of Advances in Chemical Science 3(4) (2015) 304-314
305
mass fraction of purity of the methanol was 0.995. The purity of the solvent was checked by measuring the density, viscosity and conductivity values, which was in good agreement with the literature values as shown in Table 1.
2.2. Apparatus and ProcedureAll the stock solutions of the electrolytes (ILs) in studied solvent were prepared by mass (weighed by Mettler Toledo AG-285 with uncertainty 0.0003 g). The working solutions were obtained by mass dilution of the stock solutions.
The specific conductance of ILs were measured by a systronics-308 conductivity bridge of accuracy ±0.01%, using a dip-type immersion conductivity cell, CD-10, with a cell constant of approximately (0.1±0.001) cm−1. Measurements were carried out in a thermostat water bath maintaining a deviation of ±0.01 K from the experimental temperatures. The cell was calibrated by the method proposed by Lind et al. [11] and cell constant was measured based on 0.01 M aqueous KCl solution. During all the measurements, cell constant was maintained within the range of 1.10-1.12 cm−1. The conductance data were reported at a frequency of 1 kHz and the accuracy was ±0.3%.
The solvent density and experimental solutions densities (ρ) were measured by means of vibrating u-tube Anton Paar digital density meter (DMA 4500M) with a precision of ±0.00005 gcm−3 maintained at ±0.01 K of the desired temperature. It was calibrated by triply-distilled water and passing dry air.
The viscosities were measured using a Brookfield DV-III ultra-programmable rheometer with spindle size-42 fitted to a Brookfield digital bath TC-500. The viscosities were obtained using the following equation.
η = (100/RPM) × TK × torque × SMC
Where, RPM, TK (0.09373) and SMC (0.327) are the speed, viscometer torque constant and spindle multiplier constant respectively. It was calibrated against the standard viscosity samples supplied with the instrument, water and aqueous CaCl2 solutions [12]. Temperature of the experimental solution was maintained ±0.01°C using Brookfield Digital TC-500 thermostat bath. Viscosities were measured with an accuracy of ±1%. Each measurement
reported herein is an average of triplicate reading with a precision of 0.3%.
Infrared spectra of ILs in methanol were recorded in 8300 FTIR spectrometer (Shimadzu, Japan). The details of the instrument have already been described [5].
3. RESULTS AND DISCUSSIONThe solvent properties are given in Table 1. The concentrations and molar conductance (Λ) of ILs in Methanol at different temperatures are given in Table 2. Conversions of specific conductance (κ) to molar conductance (Λ) have been done by using the following equation.
Λ = (103 κ)/c (1)
Linear curve (Λ vs. √c) was obtained and extrapolation of √c=0 evaluated the initial limiting molar conductance for the electrolyte at infinite dilution shows in Figure 1.
3.1. Ion-pair FormationThe ion-pair formation in case of conductometric study of [BMPyrr] [Br] and [BMPyrr][Cl] in Methanol are analyzed using the Fuoss conductance (6) equation. The equation was used for analyzing the linear variation conductance data in higher or moderate relative permittivity solvents. For a given set of conductivity values (cj, Λj; j=1…….n), three variable parameters, i.e. Λ0, KA, and R have been derived from the said equation. Here, Λ0 is the limiting molar conductance, KA is the observed association constant and R is the association distance, i.e. the maximum center to center distance between the ions in the solvent separated ion-pairs. There is no precise method [8] for determining the R value but in order to treat the data in our system,
Table 1: Density (ρ), viscosity (ƞ) and relative permittivity (ε) of the solvents at different temperatures.
Solvent Temp (K) ρ 10−3/kg m−3 η/mPas εMethanol 293.15 0.79159 0.594 32.70
303.15 0.78180 0.507 -313.15 0.77232 0.449 -
Figure 1: Plot of molar conductance (∧) versus √C of 1-butyl-1-methylpyrrolidiniumbromide in methanol at 293.15K (▲), 303.15K (♦), 313.15K (+) and 1-butyl-1-methylpyrrolidiniumchloride in methanol at 293.15K (●), 303.15K(■), 313.15K (×).

Indian Journal of Advances in Chemical Science 3(4) (2015) 304-314
306
R value is assumed to be, R = a + d, where a is the sum of the crystallographic radii of the ions and d is the average distance corresponding to the side of a cell occupied by a solvent molecule. The distance, d is given in Equation 2 [9]
d 1.183 M1/ 3= ( ) /ρ (2)
Where, M is the molecular mass and ρ is the density of the solvent.
Thus, the Fuoss conductance equation may be represented as follows:
Λ Λ= + +P R Eo X L[( ) ]1 (3)
P= − −1 1α γ( ) (4)
γ γ= −12 2
K c fA
(5)
− = +ln / ( )f Rβκ κ2 1 (6)
β ε= ( )e k Tr B
2/ (7)
K K K KA R R S= − = +/ ( ) / ( )1 1α (8)
Where, Λ0 is the limiting molar conductance, KA is the observed association constant, R is the association distance, RX is the relaxation field effect, EL is the electrophoretic counter current, k is the radius of the ion atmosphere, ε is the relative permittivity of the solvent mixture, e is the electron charge, c is the molarity of the solution, kB is the Boltzmann constant, KS is the association constant of the contact pairs, KR is the association constant of the solvent-separated pairs, γ is the fraction of solute present as unpaired ion, α is the fraction of contact pairs, f is the activity coefficient, T is the absolute temperature and β is twice the Bjerrum distance.
The computations were executed using the program proposed by Fuoss. The initial Λ0 values for the iteration procedure are obtained from Shedlovsky extrapolation of the data [13]. By putting the number of data, n, followed by ε, η (viscosity of the solvent), initial Λ0 value, T, ρ (density of the solvent), mole fraction of the first component, molar masses, M1 and M2 along with cj, Λj values where j=1, 2 ……. n and an instruction to cover preselected range of R values.
The best value of a parameter is the one when equations are best fitted to the experimental data corresponding to minimum standard deviation, δ, for a sequence of predetermined R values. The standard deviation, δ, was calculated by the following equation:
δ2 2= − −∑[ ( ) ( )] / ( )Λ Λj jcal obs n m (9)
Table 2: The concentration (c) and molar conductance (Λ) of [BMPyrr][Br] and [BMPyrr][Cl] in methanol at 293.15, 303.15, 313.15 K respectively.
[BMPyrr][Br] [BMPyrr][Cl]c·104 mol−1·dm−3
Λ·104 S−1·m2·mol−1
c·104 mol−1·dm−3
Λ·104 S−1·m2·mol−1
293.13 K6.99 94.09 6.99 95.5917.75 90.00 17.75 91.4225.64 87.58 25.64 89.2231.68 86.00 31.68 87.8536.44 85.06 36.44 86.7741.96 84.00 41.96 85.7547.34 83.00 47.34 84.8351.28 82.25 51.28 84.1854.30 81.85 54.30 83.7456.68 81.25 56.68 83.4058.61 80.95 58.61 83.0960.20 80.45 60.20 82.8661.54 80.12 61.54 82.61
303.15 K6.99 102.26 6.99 104.8317.75 98.25 17.75 100.3525.64 96.25 25.64 98.2831.68 94.78 31.68 96.8736.44 93.69 36.44 95.7741.96 92.56 41.96 94.7247.34 91.46 47.34 93.7751.28 90.78 51.28 93.1654.30 90.12 54.30 92.6456.68 89.56 56.68 92.4458.61 89.12 58.61 92.1360.20 88.68 60.20 91.8961.54 88.25 61.54 91.61
313.15 K6.99 117.5 6.99 120.1517.75 111.52 17.75 113.5225.64 108.21 25.64 110.3231.68 106.56 31.68 108.2536.44 105.12 36.44 106.8041.96 103.56 41.96 105.2547.34 102.01 47.34 103.7251.28 101.12 51.28 102.7454.30 100.35 54.30 102.0856.68 100.12 56.68 101.5758.61 99.45 58.61 101.1860.20 99.15 60.20 100.8361.54 98.65 61.54 100.58
[BMPyrr][Br]=1-butyl-1-methylpyrrolidiniumbromide, [BMPyrr][Cl]=1-butyl-1-methylpyrrolidiniumchloride
Indian Journal of Advances in Chemical Science 3(4) (2015) 304-314
307
Where, n is the number of experimental points and m is the number of fitting parameters. The conductance data were evaluated by fixing the distance of closest approach R with two fitting parameters (i.e. m=2). No significant minima were observed in the curve of δ versus R for studied ILs in methanol and R values were arbitrarily preset at the center to center distance of the solvent separated ion pair. Thus, R values is assumed to be R = a + d, with terms having usual significance. The limiting ionic conductances have been calculated from the appropriate division of the limiting molar conductivity value of tetrabutylammonium tetraphenylborate as the “reference electrolyte” method along with a numerical evaluation of ion-pair formation constants (KP≈KA).
Finally, the corresponding limiting molar conductance (Λo), association constant (KA), co-sphere diameter (R) and standard deviations of experimental Λ (δ) obtained from Fuoss conductance equation for both ILs at 293.15 K, 303.15 K, and 313.15 K, respectively are given in Table 3. Table 3 shows that KA values increases with the increasing temperature for both ILs. With increasing temperature the number of free ions per unit volume decreases and hence the tendency of ion pair formation increases. The data in Table 3 reveals that the anion species dependence of the association constant of the ILs follows the order: Br− > Cl−. Considering the fact that Cl− anion has a much smaller size, higher surface charge density and thus stronger electrostatic interaction with the cation relative to the Br−. This suggest that the high solvation of the Cl- anion significantly reduces its association with the cation [BMPyrr+] in methanol, which shapes the order observed experimentally. The plausible solvation consequences of the ILs in methanol are depicted in Schemes 1 and 2.
The standard Gibbs free energy change of solvation, ΔGo, for ILs in methanol is given by the following equation [14].
∆G RT KoA= − ln (10)
The negative values of standard Gibbs free energy obtained from Table 4 reflect the consideration of participation of specific covalent interaction in the ion-association process.
Table 5 shows the value of ionic conductance (λ0±)
and ionic Walden product (λ0±η) (product of ionic
conductance and viscosity of the solvent) along with Stokes’ radii (rs) and crystallographic radii (rc) of ILs in methanol at different temperatures.
3.2. Apparent Molar VolumeThe measured values of densities of [PMB][Br] and [PMB][Cl] in methanol at 293.15, 303.15, and 313.15 K are reported in Table 1. The densities of
the electrolytes in methanol increase linearly with the concentration at the studied temperatures. For this purpose, the apparent molar volumes ϕv were determined from the solution densities using the following equation and the values are given in Table 6.
φ ρ ρ ρ ρ ρV M m= − −( )/ / 0 0
(11)
Where, M is the molar mass of the solute, m is the molality of the solution, ρ and ρ0 are the densities of the solution and solvent, respectively. The apparent molar volumes ϕv were found to decrease with increasing molality (m) of ILs in solvents and increase
Table 3: Limiting molar conductance (Λ0), association constant (KA), co-sphere diameter (R) and standard deviations of experimental Λ (δ) obtained from Fuoss conductance equation for [BMPyrr][Br] and [BMPyrr][Cl] in methanol at 293.15 K, 303.15 K, and 313.15 K respectively.
ILs Λo·104 S−1·m2·mol−1
KA/dm3 mol−1 R/Å Δ
293.15 K[BMPyrr][Br] 99.08 54.52 9.94 0.15[BMPyrr][Cl] 100.07 53.86 9.80 0.12
303.15 K[BMPyrr][Br] 107.42 56.23 9.92 0.11[BMPyrr][Cl] 108.09 55.48 9.83 0.15
313.15 K[BMPyrr][Br] 123.64 60.35 9.99 0.13[BMPyrr][Cl] 126.56 58.55 9.84 0.17
[BMPyrr][Br]=1-butyl-1-methylpyrrolidiniumbromide, [BMPyrr][Cl]=1-butyl-1-methylpyrrolidiniumchloride, ILs=Ionic liquids
Table 4: Walden product (Λo ƞ) and standard Gibb’s free energy change (ΔG°) of [BMPyrr][Br] and [BMPyrr][Cl] in methanol at 293.15 K, 303.15 K, and 313.15 K respectively.
ILs Λo·η·104 S−1·m2·mol−1 mPa
ΔG° kJ−1·mol−1
293.15 K[BMPyrr][Br] 78.43 −33.24[BMPyrr][Cl] 79.21 −33.14
303.15 K[BMPyrr][Br] 83.98 −33.50[BMPyrr][Cl] 84.51 −33.39
313.15 K[BMPyrr][Br] 95.49 −34.08[BMPyrr][Cl] 97.74 −33.84
[BMPyrr][Br]=1-butyl-1-methylpyrrolidiniumbromide, [BMPyrr][Cl]=1-butyl-1-methylpyrrolidiniumchloride, ILs=Ionic liquids
Indian Journal of Advances in Chemical Science 3(4) (2015) 304-314
308
with increasing temperature for the system under study. Which are shown in Figure 2a and b.
The limiting apparent molar volumes φV
0 were calculated using a least-squares treatment to the plots of ϕv versus √c using the following Masson equation [12].
φ φV V VS c= + √⋅0 * (12)
Where, φV
0 is the limiting apparent molar volume at infinite dilution and SV
* is the experimental slope.
The values of φV
0 and SV
* are reported in Table 7. From Table 7, it is observed that φV
0 values are positive for both the ILs in solvent and is highest in case of [BMPyrr][Br] compared to [BMPyrr][Cl]. This indicate the presence of strong ion–solvent interactions and the extent of interactions increases from [BMPyrr][Cl] to [BMPyrr][Br].
On the contrary, the SV
* indicates the extent of ion-ion interaction. The values of S
V
* show that the extent of ion-ion interaction is higher in case of [BMPyrr][Br] than [BMPyrr][Cl]. Owing to a quantitative comparison, the magnitude of φV
0 are much greater than S
V
* , in every solutions. This suggests that ion-solvent interactions dominate over ion-ion interactions in all the solutions. The values of φV
0 also support the fact that higher ion-solvent interaction in methanol leads to lower conductance of [BMPyrr][Br] than [BMPyrr][Cl], discussed earlier.
3.3. Temperature Dependent Limiting Apparent Molar VolumeThe temperature dependent general polynomial equation for φV
0 are as follows:
φV
0 = + +a T0 1
a a T2
2
(13)
Table 5: Limiting ionic conductance (λ0±), ionic Walden product (λ0
±ƞ), stokes’ radii (rs), and crystallographic radii (rc) of [BMPyrr][Br] and [BMPyrr][Cl] in methanol at 293.15 K, 303.15 K and 313.15 K respectively.
ILs Ion ± (S·m2·mol−1) λ0±η (S·m2·mol−1mPa) rs (Å) rc (Å)
293.15 K[BMPyrr][Br] BMPyrr+ 56.89 33.79 3.54 3.42
Br− 42.19 25.05 1.92 1.95[BMPyrr][Cl] BMPyrr+ 57.31 34.04 3.44 3.42
Cl− 42.76 25.39 1.83 1.81303.15 K
[BMPyrr][Br] BMPyrr+ 58.17 29.49 3.54 3.42Br− 49.23 24.95 1.86 1.95
[BMPyrr][Cl] BMPyrr+ 58.27 29.54 3.44 3.42Cl− 49.82 25.25 1.85 1.81
313.15 K[BMPyrr][Br] BMPyrr+ 68.39 30.68 3.34 3.42
Br− 55.25 24.80 1.75 1.95[BMPyrr][Cl] BMPyrr+ 70.80 31.78 3.27 3.42
Cl− 55.75 25.03 1.90 1.81[BMPyrr][Br]=1-butyl-1-methylpyrrolidiniumbromide, [BMPyrr][Cl]=1-butyl-1-methylpyrrolidiniumchloride, ILs=Ionic liquids
Scheme 1: “Ball and stick” representation of methanol and ions of ionic liquids.
Scheme 2: Solvation consequences of ionic liquids at different temperatures.

Indian Journal of Advances in Chemical Science 3(4) (2015) 304-314
309
Where, a0, a1, a2 are the empirical coefficients depending on the solute, mass fraction (w1) of the co-solute ILs, and T is the Kelvin temperature. The values of these coefficients are presented in Table 8.
The limiting apparent molar expansibilities,ϕE
0 , can be obtained by the following equation,
φ δφ δE V
P
T a a T0 0
1 22= ( ) = + (14)
Where, ϕE
0 is the change in magnitude with the change of temperature at constant pressure. The values of ϕ
E
0 for different solutions of the studied ILs at different Kelvin are reported in Table 9. The Table 9 reveals that ϕ
E
0 is positive for all the ILs in the studied solvent and studied temperatures. This fact can be ascribed to the absence of caging or packing effect for the ILs in solutions.
Helper [15] developed a technique of examining the sign of δϕ δ
EP
T0( ) for the solute in terms of long-
range structure-making and breaking capacity of the solute in the mixed solvent systems using the general thermodynamic expression,
δφ δ δ φ δE
PV
P
T T a0 2 0 2
22( ) = ( ) = (14a)
If the sign of δϕ δE
P
T0( ) is positive or a small
negative, the molecule is a structure maker; otherwise, it is a structure breaker [16]. From Table 9 the δϕ δ
EP
T0( ) values for ILs in methanol are small
negative implies predominantly that the molecules are structure makers in all of the experimental solutions.
3.4. Viscosity CalculationThe viscosity data have been analyzed using Jones–Dole equation [12].
η η/ /0
1−( ) √ = + √c A B c (15)
Where, η and η0 are the viscosities of the solution and solvent respectively. The values of A-coefficient and B-coefficient are obtained from the straight line by plotting η η/ /
01−( ) √c against √c which are reported
in Table 6 and Figure 3. The positive value of B-coefficients indicates the ion-solvent interaction and small positive value of A-coefficients indicates the ion-ion interaction in solution.
Figure 3: (a) Plot of (η/η0−1)/√c versus √C of 1-butyl-1-methylpyrrolidiniumbromide at 293.15 K (●), 303.15 K (▲) and 313.15 K (♦), (b) Plot of (η/η0−1)/√c versus √C of 1-butyl-1-methylpyrrolidiniumchloride at 293.15 K (●), 303.15 K (▲) and 313.15 K (♦).
b
a
Figure 2: (a) Plot of apparent molar volume φ V versus √C 1-butyl-1-methylpyrrolidiniumbromide at 293.15K (●), 303.15K (▲) and 313.15K(♦), (b) Plot of apparent molar volume (φ V ) versus √C at 1-butyl-1-methylpyrrolidiniumchloride at 293.15 K (●), 303.15 K (▲) and 313.15 K (♦).
b
a
Indian Journal of Advances in Chemical Science 3(4) (2015) 304-314
310
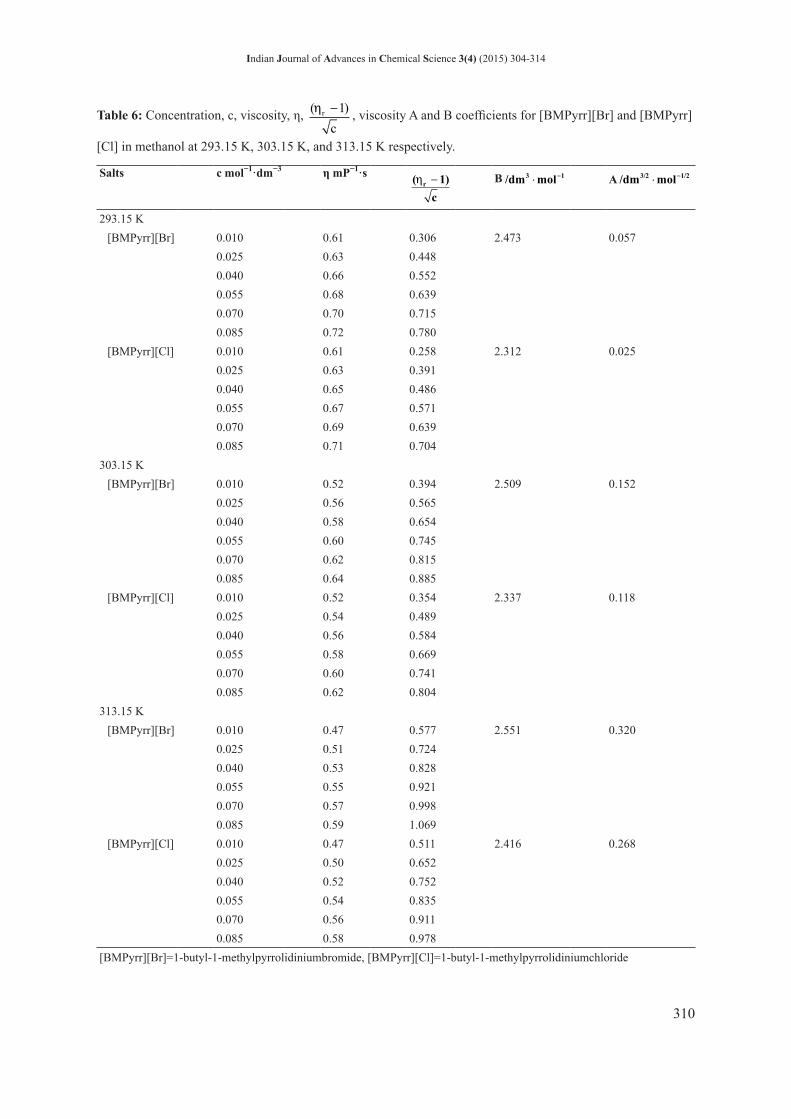
Table 6: Concentration, c, viscosity, η, ( )ηr
c
−1 , viscosity A and B coefficients for [BMPyrr][Br] and [BMPyrr]
[Cl] in methanol at 293.15 K, 303.15 K, and 313.15 K respectively.
Salts c mol−1·dm−3 η mP−1·s ( )ηrc− 1 B /dm mol 13 ⋅ − A /dm mol3/2 1/2⋅ −
293.15 K[BMPyrr][Br] 0.010 0.61 0.306 2.473 0.057
0.025 0.63 0.4480.040 0.66 0.5520.055 0.68 0.6390.070 0.70 0.7150.085 0.72 0.780
[BMPyrr][Cl] 0.010 0.61 0.258 2.312 0.0250.025 0.63 0.3910.040 0.65 0.4860.055 0.67 0.5710.070 0.69 0.6390.085 0.71 0.704
303.15 K[BMPyrr][Br] 0.010 0.52 0.394 2.509 0.152
0.025 0.56 0.5650.040 0.58 0.6540.055 0.60 0.7450.070 0.62 0.8150.085 0.64 0.885
[BMPyrr][Cl] 0.010 0.52 0.354 2.337 0.1180.025 0.54 0.4890.040 0.56 0.5840.055 0.58 0.6690.070 0.60 0.7410.085 0.62 0.804
313.15 K[BMPyrr][Br] 0.010 0.47 0.577 2.551 0.320
0.025 0.51 0.7240.040 0.53 0.8280.055 0.55 0.9210.070 0.57 0.9980.085 0.59 1.069
[BMPyrr][Cl] 0.010 0.47 0.511 2.416 0.2680.025 0.50 0.6520.040 0.52 0.7520.055 0.54 0.8350.070 0.56 0.9110.085 0.58 0.978
[BMPyrr][Br]=1-butyl-1-methylpyrrolidiniumbromide, [BMPyrr][Cl]=1-butyl-1-methylpyrrolidiniumchloride
Indian Journal of Advances in Chemical Science 3(4) (2015) 304-314
311
Table 7: Concentration, c, density, ρ, apparent molar volume, ϕV, limiting apparent molar volume φV
0 and experimental slope for [BMPyrr][Br]and [BMPyrr][Cl]at methanol 293.15 K, 303.15 K and 313.15 K respectively.
ILs c mol−1·dm−3 ρ·10−3 kg m−3 φV ·106/m3·mol−1 φV
0 ·106/m3·mol−1S
V
* ·106/m3·mol−3/2·dm3/2
293.15 K[BMPyrr][Br] 0.010 0.79162 276.87 293.60 −144.91
0.025 0.79180 268.250.040 0.79209 261.250.055 0.79247 255.360.070 0.79295 250.060.085 0.79348 245.35
[BMPyrr][Cl] 0.010 0.79161 221.97 238.02 −141.930.025 0.79180 213.050.040 0.79216 205.890.055 0.79265 200.150.070 0.79320 195.440.085 0.79382 191.35
303.15 K[BMPyrr][Br] 0.010 0.78229 280.17 297.93 −151.62
0.025 0.78251 271.220.040 0.78288 264.190.055 0.78341 257.280.070 0.78401 252.050.085 0.78471 247.16
[BMPyrr][Cl] 0.010 0.78227 225.89 242.5.5 −149.60.025 0.78249 215.410.040 0.78285 208.310.055 0.78332 202.530.070 0.78389 197.400.085 0.78453 193.03
313.15 K[BMPyrr][Br] 0.010 0.77237 283.77 301.2 −157.3
0.025 0.77261 273.670.040 0.77301 265.970.055 0.77355 259.170.070 0.77421 253.950.085 0.77501 249.26
[BMPyrr][Cl] 0.010 0.77235 228.09 244.6 −150.10.025 0.77259 217.260.040 0.77299 209.860.055 0.77352 204.100.070 0.77419 199.100.085 0.77497 195.01
[BMPyrr][Br]=1-butyl-1-methylpyrrolidiniumbromide, [BMPyrr][Cl]=1-butyl-1-methylpyrrolidiniumchloride, ILs=Ionic liquids

Indian Journal of Advances in Chemical Science 3(4) (2015) 304-314
312
From Table 6, it is clear that the values of the B-coefficient are positive and much higher than A-coefficient, thereby suggesting the solute-solvent interactions are dominant over the solute-solute interactions. The B-coefficient [17] value obtained from the viscosity measurements gives the important information regarding the extent of solvation of the solute molecules and the effects on the structure of the solvents in the local vicinity of the solute molecule in solution. The higher B-coefficient values for higher viscosity values are due to the solvated solutes molecule associated by the solvent molecules by solute-solvent interactions. These types of interactions are strengthened with rise in temperature and thus the values of B-coefficient increases with increase in temperature. These results are in good agreement with those obtained from φV
0 to SV
* values, discussed earlier. Thus, the trend of ion-solvent interaction is [BMPyrr][Br] > [BMPyrr][Cl].
3.5. FTIR SpectroscopyWith the help of FTIR spectroscopy, the molecular interactions existing between the ILs and the methanol can be studied. At first the IR spectra of pure methanol was studied. The stretching frequencies of the key groups are given in Table 10 and Figure 4.
Table 8: Values of empirical coefficients (A0, A1, and A2) of equation 4 for ionic liquids in methanol at 293.15-313.15 K respectively.
Solvent mixture a0·106 m−3·mol−1 a1·106 m−3·mol−1·K−1 a2·106 m−3·mol−1·K−2
MeOH+[BMPyrr][Br]293.15 K −10.19 1.622 −0.002303.15 K −10.19 1.622 −0.002313.15 K −10.19 1.622 −0.002
MeOH+[BMPyrr][Cl]293.15 K −960.3 7.605 −0.012303.15 K −960.3 7.605 −0.012313.15 K −960.3 7.605 −0.012
[BMPyrr][Br]=1-butyl-1-methylpyrrolidiniumbromide, [BMPyrr][Cl]=1-butyl-1-methylpyrrolidiniumchloride
Table 9: Limiting apparent molar expansibilities (φE
0 ) for ionic liquids in methanol at 293.15K to 313.15K respectively.
Solvent mixture φE0 ·106 m−3·mol−1·K−1 ∂ ∂( )φ
ET
P
0
106 m−3·mol−1·K−2
MeOH+[BMPyrr][Br]T/K 293.15 303.15 313.15 −0.004
0.4494 0.4094 0.3694MeOH+[BMPyrr][Cl]
T/K 293.15 303.15 313.15 −0.0240.5694 0.3994 0.0894
[BMPyrr][Br]=1-butyl-1-methylpyrrolidiniumbromide, [BMPyrr][Cl]=1-butyl-1-methylpyrrolidiniumchloride
Figure 4: Infrared-spectra of, (a) Pure methanol, (b) CH3OH + 1-butyl-1-methylpyrrolidiniumchloride and (c) CH3OH + 1-butyl-1-methylpyrrolidiniumbromide.

Indian Journal of Advances in Chemical Science 3(4) (2015) 304-314
313
In case of pure methanol a broad peak is observed at 3384.7, attributed to the H-bonded O-H vibrational stretching. However, the broad peak is shifted toward the narrower peak with low intensity at 3429.8 and 3418.3 in the IR spectra of [BMPyrr][Br]+CH3OH and [BMPyrr][Cl]+CH3OH respectively. The shifting of frequency indicates that H-bonding between the molecules of the methanol is disrupted [18] by the addition of the ILs. This is due to the interaction of the ions of ILs (BMPyrr+, Br-, Cl-) with the −OH group of methanol. The plausible H-bonding interactions between methanol and ILs are shown in Scheme 3.
4. CONCLUSIONFrom the thorough study it is evident that the ion-solvent interaction increases for both the investigated ILs with increasing temperature. It is also pronounced that the ion-solvent interactions is greater for [BMPyrr][Br] compared to [BMPyrr][Cl] and it can be modulated by changing the anion for a particular cation in the same solvent.
5. ACKNOWLEDGMENTThe authors are deeply grateful to the Departmental Special Assistance Scheme, Department of Chemistry, NBU under the University Grants Commission, New Delhi (No. 540/27/DRS/2007, SAP-1) for financial support and instrumental facilities in order
to continue this research work. Kanak Roy is also thankful to “Rajiv Gandhi National Fellowship,” UGC, New Delhi Ref UGC letter No. F1-17.1/2012-13/RGNF-2012-13-SC-WES-17229, for sanctioning research fellowship and financial assistance. Mitali Kundu is also thankful to “UGC-BSR Research Fellowship for Meritorious Students in Science” Ref. UGC Letter No. F.25-1/2013-14(BSR)/7-133/2007(BSR) under SAP, for sanctioning research fellowship and financial assistance. One of the authors, Prof. M. N. Roy is thankful to University Grant Commission, New Delhi, Government of India for being awarded one time Grant under Basic Scientific Research via the Grant-in-Aid No. F.4-10/2010 (BSR) regarding his active service for augmenting of research facilities to facilitate further research work.
6. REFERENCES1. (a) T. Welton, (1999) Room-temperature ionic
liquids. Solvents for synthesis and catalysis, Chemical Reviews, 99: 2071-2084. (b) D. Ekka, M. N. Roy, (2014) Qualitative and quantitative analysis of ionic solvation of individual ions of imidazolium based ionic liquids in significant solution systems by conductance and FT-IR spectroscopy, RSC Advances, 4: 19831-19845.
2. A. Bhattacharjee, M. N. Roy, (2010) Ion association and solvation behavior of tetra alkylammonium iodides in binary mixtures of dichloromethane + N, N-dimethylformamide probed by a conductometric study, Physical Chemistry Chemical Physics, 12: 14534-14542.
3. D. Ekka, M. N. Roy, (2012) Conductance, a contrivance to explore ion association and solvation behavior of an ionic liquid (tetrabutylphosphonium tetrafluoroborate) in acetonitrile, tetrahydrofuran, 1,3-dioxolane and their Binaries, The Journal of Physical Chemistry B, 116: 11687-11694.
4. D. Ekka, M. N. Roy, (2013) Molecular interactions of α-amino acids insight into aqueous β-cyclodextrin systems, Amino Acids, 45: 755-777.
5. M. Deetlefs, K. Seddon, M. Shara, (2006) Predicting physical properties of ionic liquids, Physical Chemistry Chemical Physics, 8: 642.
6. R. M. Fuoss,(1978)Conductance-concentration function for the paired ion model. The Journal of Physical Chemistry, 82: 2427-2440.
7. O. Poovych, R. P. T. Tomkins, (1981) Non Aqueous Solution Chemistry, Ch. 4. New York: Wiley-Interscience.
8. B. Per, (1977) Ionic association and ion solvent interactions. The conductance of lithium bromide in acetone-water mixture at 15-35°C, Acta Chemica Scandinavica, 31: 869-876.
9. B. S. Krumgalz, (1983) Separation of limiting equivalent conductances into ionic contributions in non-aqueous solutions by indirect methods,
Scheme 3: Plausible polymeric association of methanol through H-bonding in path (a) and ion-dipole interaction of ionic liquids and methanol in path (b).
Table 10: Stretching frequencies of the functional groups present in the pure methanol and change of frequency after addition of [BMPyrr][Br] and [BMPyrr][Cl] in methanol.
Stretching frequencies (cm−1)Solvents Pure
methanolMeOH+
[BMPyrr][Br]MeOH+
[BMPyrr][Cl]CH3OH O-H (3384.7) O-H (3429.8) O-H (3418.3)[BMPyrr][Br]=1-butyl-1-methylpyrrolidiniumbromide, [BMPyrr][Cl]=1-butyl-1-methylpyrrolidiniumchloride
Indian Journal of Advances in Chemical Science 3(4) (2015) 304-314
314
Journal of the Chemical Society, Faraday Transactions I, 79: 571-587.
10. M. Delsignore, H. Farber, S. Petrucci, (1985) Ionic conductivity and microwave dielectric relaxation of LiAsF6 and LiClO4 in dimethyl carbonate, The Journal of Physical Chemistry, 89: 4968-4973.
11. J. E. Lind Jr, J. J. Zwolenik, R. M. Fuoss, (1959) Calibration of conductance cells at 25° with aqueous solutions of potassium chloride, Journal of the American Chemical Society, 81: 1557-1559.
12. G. Jones, M. Dole, (1929) The viscosity of aqueous solutions of strong electrolytes with special reference to barium chloride, Journal of the American Chemical Society, 51: 2950-2964.
13. S. Gill, M. S. Chauhan, (1984) Transport studies of ion-solvent interactions in acetonitrile-rich regions of benzene and ethanol, Zeitschrift für Physikalische Chemie NF, 140: 139.
14. J. Barthel, M. B. Rogac, R. Neueder, (1999) Conductivity of sodium chloride in water + 1,4-dioxane mixtures at temperatures from 5 to 35°C I. Dilute solutions, Journal of Solution Chemistry, 28: 1071.
15. L. G. Helper, (1969) Studies on viscosities and densities of R4NX in ME+ water mixtures of different temperatures, Canadian Journal of Chemistry, 47: 4613-4618.
16. M. N. Roy, V. K. Dakua, B. Sinha, (2007) Partial molar volumes, viscosity B-coefficients, and adiabatic compressibilities of sodium molybdatein aqueous 1,3-dioxolane mixtures from 303.15 to 323.15K, International Journal of Thermophysics, 28: 1275-1284.
17. F. J. Millero, (1971) Molal volumes of electrolytes, Chemical Reviews, 71: 147-176.
18. M. Pagliai, (2003) Hydrogen bond in liquid methanol, The Journal of Chemical Physics, 119: 6655-6662.
*Bibliographical Sketch
Dr. Mahendra Nath Roy is a Professor of Physical Chemistry and Program Coordinator of SAP, DRS-III in the University of North Bengal, Darjeeling. His research interests are in the areas of host-guest inclusion complexes, Ionic Liquids, Solution Thermodynamics, and Polymer Chemistry. His contribution has been recognized by the publication of a large number of high impact research articles (Total-174, International-126 and National-48) and Books (Total-4, International-01 and National-03). He is the life member of ICS, ISC, CRSI, and JTR. He has been awarded one-time grant amounting Rs.7.00 lac by UGC, New Delhi under basic scientific research (BSR) as he has singly produced nineteen (19) Ph.D. students. He has also received “Prof. Suresh C. Ameta Award” from Indian Chemical Society, Kolkata.
Mr. Kanak Roy has been doing his Ph. D Research work under the guidance of Prof. M. N. Roy since December, 2014. He completed his M.Sc. in Chemistry from University of North Bengal in the year of 2010 and he qualified UGC NET (LS). He has attended many seminars and conferences for presenting his research work.
Ms. Mitali Kundu obtained M.Sc. degree in Organic Chemistry from University of North Bengal in the year of 2011. Currently she has been doing her Ph. D work under the supervision of Prof. Mahendra Nath Roy, Department of Chemistry, NBU. She has attended many seminars and conferences and highlighted her research work.
Mr. Biraj Kumar Barman obtained M.Sc. degree in Organic Chemistry from Jadavpur University, Kolkata and he qualified WBCSC-SET. Currently he has been doing his Ph. D work under the supervision of Prof. Mahendra Nath Roy, Department of Chemistry, NBU. He has attended many seminars and conferences for presenting his research work.