Embed Size (px)
Citation preview

Indian Ocean warming – its extent, and impact on the monsoon and marine productivity
Roxy M. K., K. Ritika, A. Modi, P. Terray, R. Murtugudde, K. Ashok, B. N. Goswami, S. Masson, V. Valsala, P. Swapna, S. Prasanna Kumar and M. Ravichandran
Indian Institute of Tropical Meteorology, Pune
WIO
RIO
Indian Ocean warming: o Western Indian Ocean experienced strong,
monotonous warming during the last centuryo Links to asymmetry and skewness in ENSO
forcingo Largest ‘in-phase’ contributor to global SST
warmingPotential Impacts:
o Weakening of the monsoono Reduction in marine phytoplankton
WIO RIO
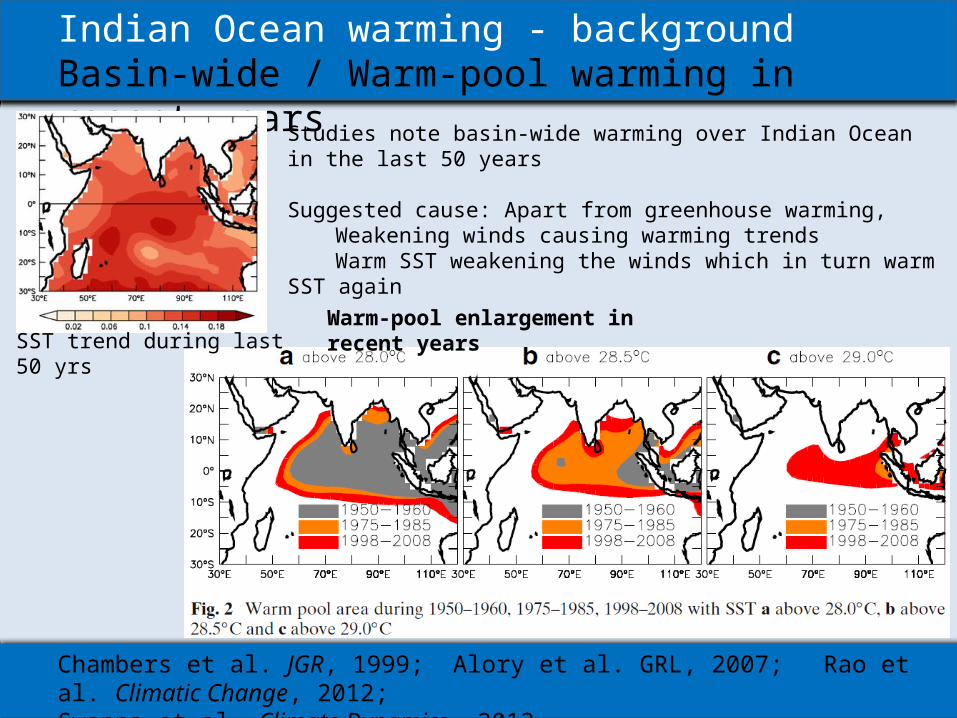
Indian Ocean warming - backgroundBasin-wide / Warm-pool warming in recent years
Chambers et al. JGR, 1999; Alory et al. GRL, 2007; Rao et al. Climatic Change, 2012; Swapna et al. Climate Dynamics, 2013
Studies note basin-wide warming over Indian Ocean in the last 50 years
Suggested cause: Apart from greenhouse warming,Weakening winds causing warming trendsWarm SST weakening the winds which in turn warm
SST again
Warm-pool enlargement in recent yearsSST trend during last 50
yrs
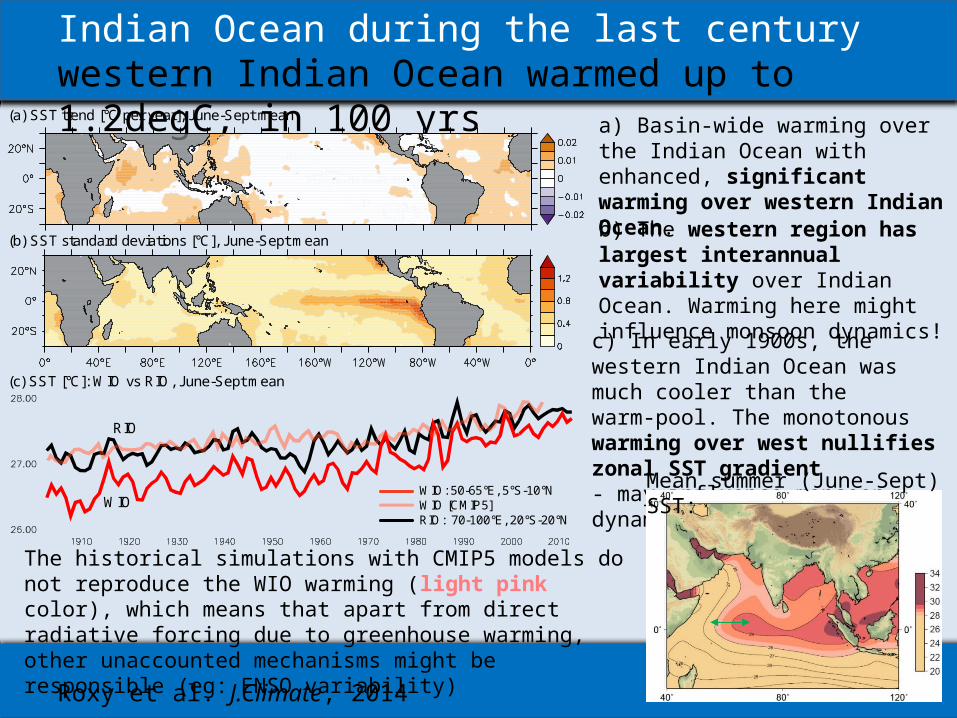
Indian Ocean during the last centurywestern Indian Ocean warmed up to 1.2degC, in 100 yrs
Roxy et al. J.Climate, 2014
a) Basin-wide warming over the Indian Ocean with enhanced, significant warming over western Indian Ocean.b) The western region has largest interannual variability over Indian Ocean. Warming here might influence monsoon dynamics!c) In early 1900s, the western
Indian Ocean was much cooler than the warm-pool. The monotonous warming over west nullifies zonal SST gradient - may influence monsoon dynamics.
(a) SST trend [°C per year], June-Sept mean
(b) SST standard deviations [°C], June-Sept mean
(c) SST [°C]: WIO vs RIO, June-Sept mean
WIO
RIO
WIO: 50-65°E, 5°S-10°NWIO [CMIP5]RIO: 70-100°E, 20°S-20°N
The historical simulations with CMIP5 models do not reproduce the WIO warming (light pink color), which means that apart from direct radiative forcing due to greenhouse warming, other unaccounted mechanisms might be responsible (eg: ENSO variability)
Mean summer (June-Sept) SST:
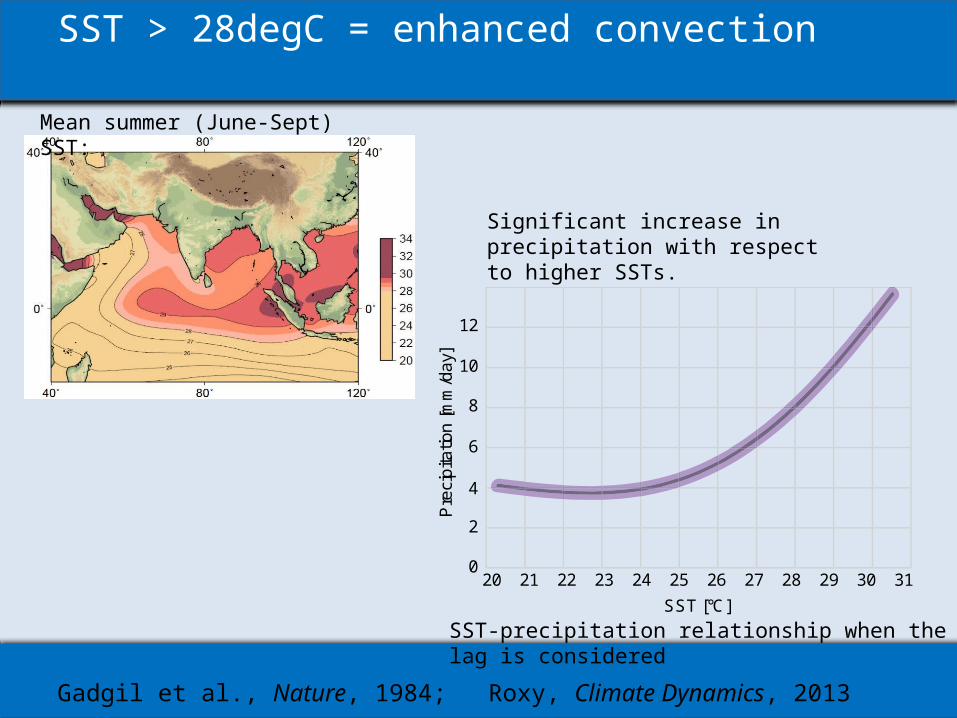
SST > 28degC = enhanced convection
Gadgil et al., Nature, 1984; Roxy, Climate Dynamics, 2013
20 21 22 23 24 25 26 27 28 29 30 31
12
10
8
6
4
2
0
SST [°C]
Pre
cip
itatio
n [m
m/d
ay]
Significant increase in precipitation with respect to higher SSTs.
SST-precipitation relationship when the lag is considered
Mean summer (June-Sept) SST:

Asymmetry in ENSO forcingInfluence of El Niño > La Niña
(a) Mean Walker circulation
(b) El Nino Composite - Walker circulation anomalies
(c) La Nina Composite - Walker circulation anomalies
hPa
hPa
hPa
(a) Climatological mean SST [°C]
(b) El Niño Composite - SST anomalies [°C]
(c) La Niña Composite - SST anomalies [°C]
El Niño induce significant easterly anomalies and positive SST anomalies over w.Indian Ocean
but... La Niña events does not result in significant anomalies over the Indian Ocean
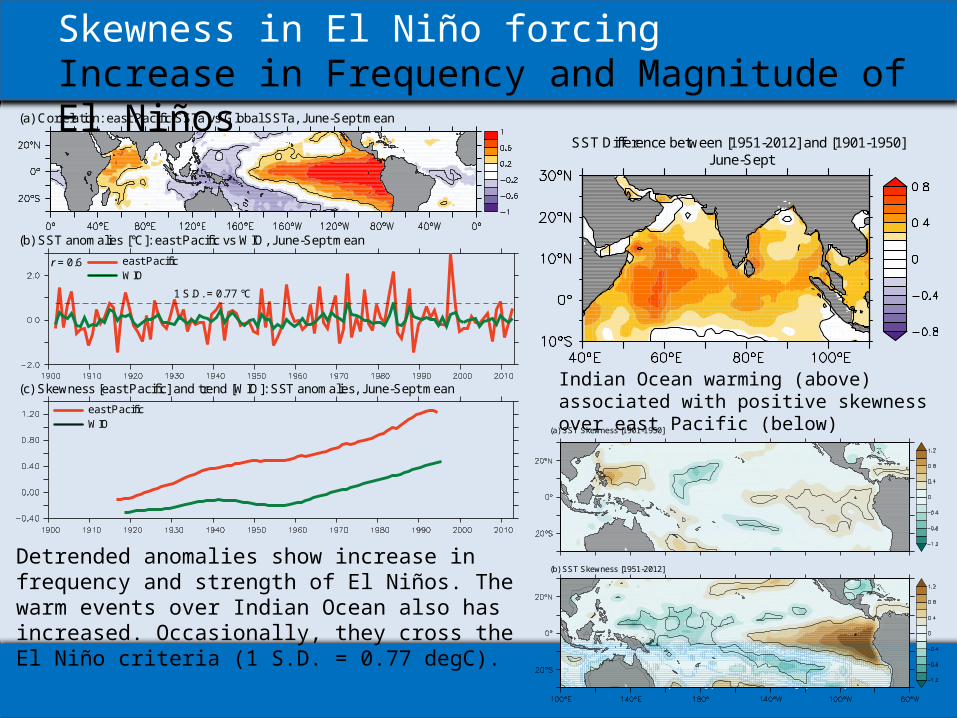
Skewness in El Niño forcingIncrease in Frequency and Magnitude of El Niños(a) Correlation: east Pacific SSTa vs Global SSTa, June-Sept mean
(b) SST anomalies [°C]: east Pacific vs WIO, June-Sept mean
1 S.D. = 0.77 °C
r = 0.6
(c) Skewness [east Pacific] and trend [WIO]: SST anomalies, June-Sept mean
east PacificWIO
east PacificWIO
(a) SST Skewness [1901-1950]
(b) SST Skewness [1951-2012]
SST Difference between [1951-2012] and [1901-1950]June-Sept
Detrended anomalies show increase in frequency and strength of El Niños. The warm events over Indian Ocean also has increased. Occasionally, they cross the El Niño criteria (1 S.D. = 0.77 degC).
Indian Ocean warming (above) associated with positive skewness over east Pacific (below)
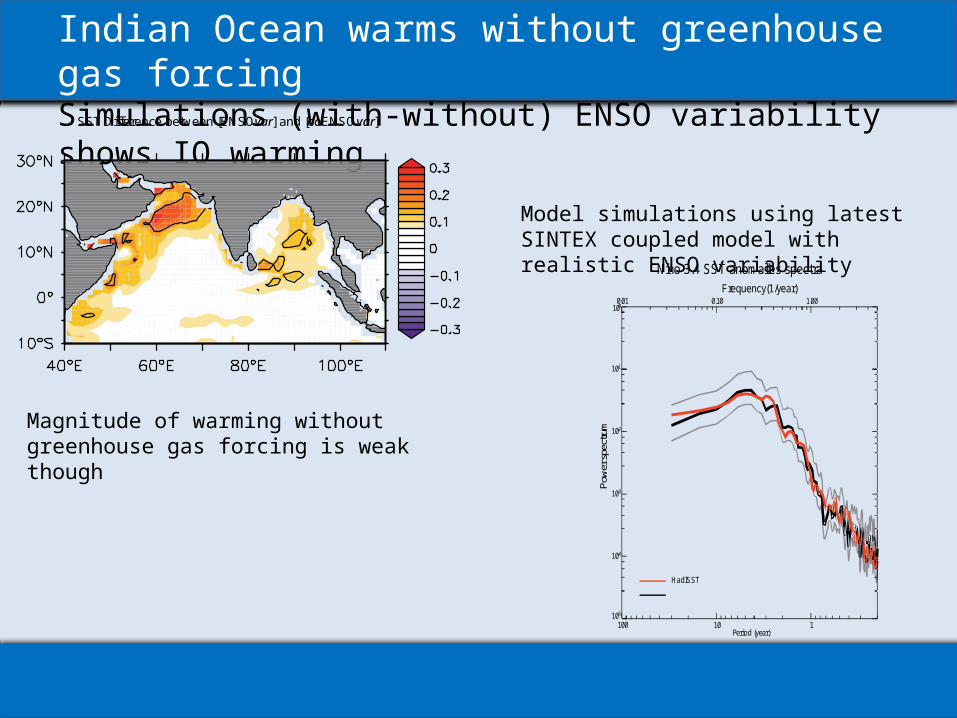
Indian Ocean warms without greenhouse gas forcingSimulations (with-without) ENSO variability shows IO warming
Nino 3.4 SST anomalies spectra
10-5
10-4
10-3
10-2
10-1
100
Pow
er s
pect
rum
100 10 1Period (year)
0.01 0.10 1.00Frequency(1/year)
HadISST
SST Difference between [ENSOvar] and [noENSOvar]
Model simulations using latest SINTEX coupled model with realistic ENSO variability
Magnitude of warming without greenhouse gas forcing is weak though

Largest contributor to global warming?Indian Ocean warming “in phase” with global warming
Correlation: Annual global mean SSTa vs annual SSTa
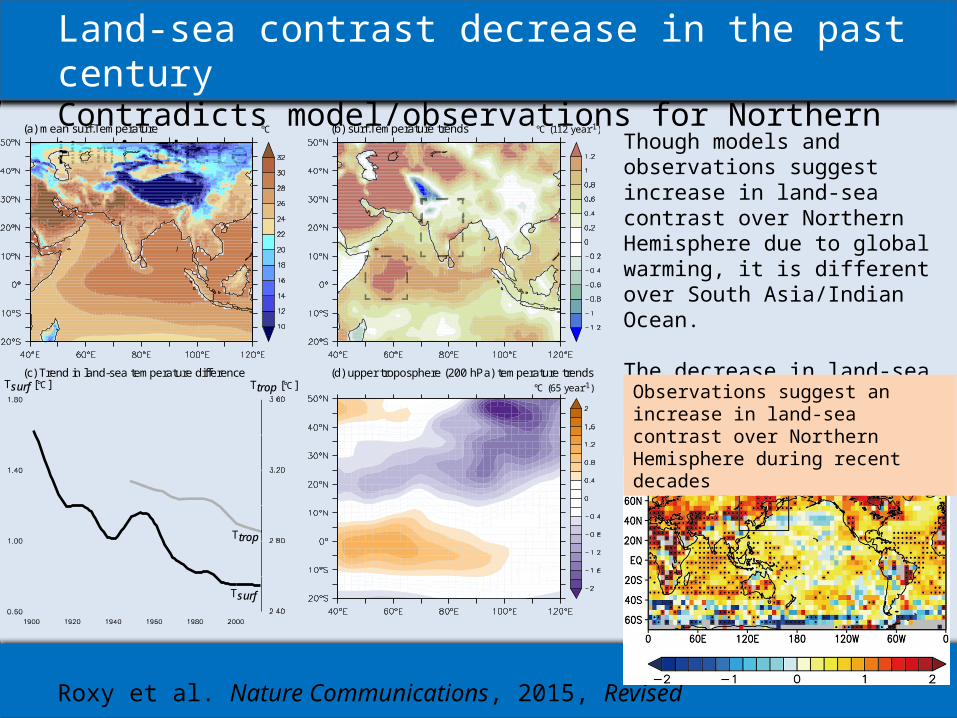
Land-sea contrast decrease in the past centuryContradicts model/observations for Northern Hemisphere
Roxy et al. Nature Communications, 2015, Revised
(c) Trend in land-sea temperature difference
(a) mean surf.Temperature °C (b) surf.Temperature trends °C (112 year-1)
Tsurf [°C] Ttrop [°C]
Tsurf
Ttrop
(d) upper troposphere (200 hPa) temperature trends°C (65 year-1)
Though models and observations suggest increase in land-sea contrast over Northern Hemisphere due to global warming, it is different over South Asia/Indian Ocean.
The decrease in land-sea contrast reflects in tropospheric temperature gradients also.Observations suggest an increase in land-sea contrast over Northern Hemisphere during recent decades
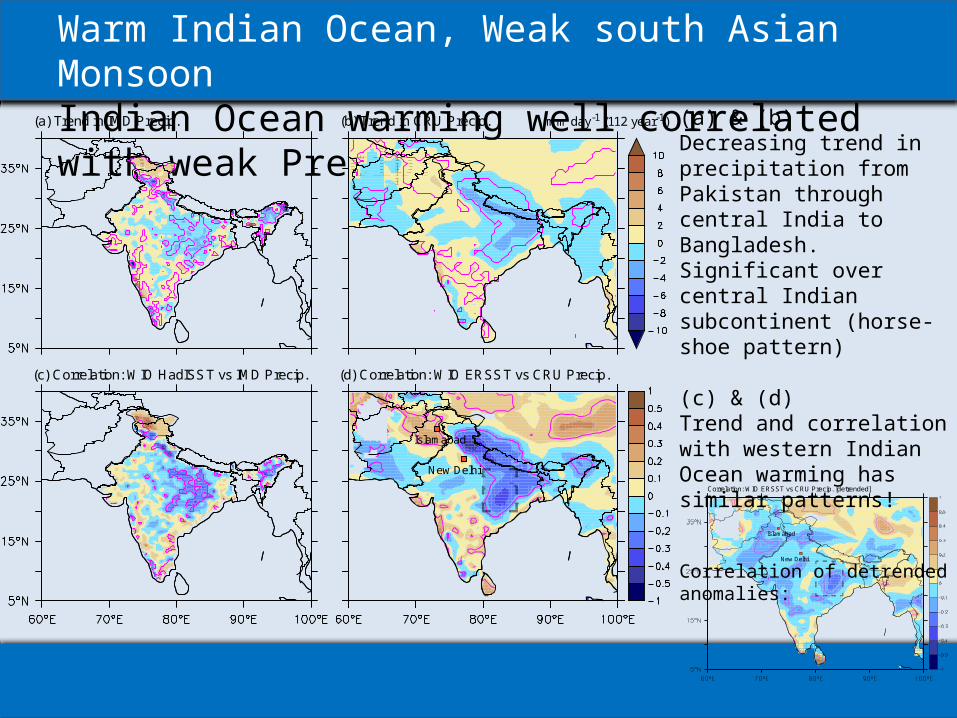
Warm Indian Ocean, Weak south Asian MonsoonIndian Ocean warming well correlated with weak Precip.
(a) Trend in IMD Precip. (b) Trend in CRU Precip. mm day-1 (112 year-1)
(c) Correlation: WIO HadISST vs IMD Precip. (d) Correlation: WIO ERSST vs CRU Precip.
New Delhi
Islamabad
Correlation: WIO ERSST vs CRU Precip. [detrended]
New Delhi
Islamabad
(a) & (b) Decreasing trend in precipitation from Pakistan through central India to Bangladesh. Significant over central Indian subcontinent (horse-shoe pattern)
(c) & (d)Trend and correlation with western Indian Ocean warming has similar patterns!
Correlation of detrended anomalies:
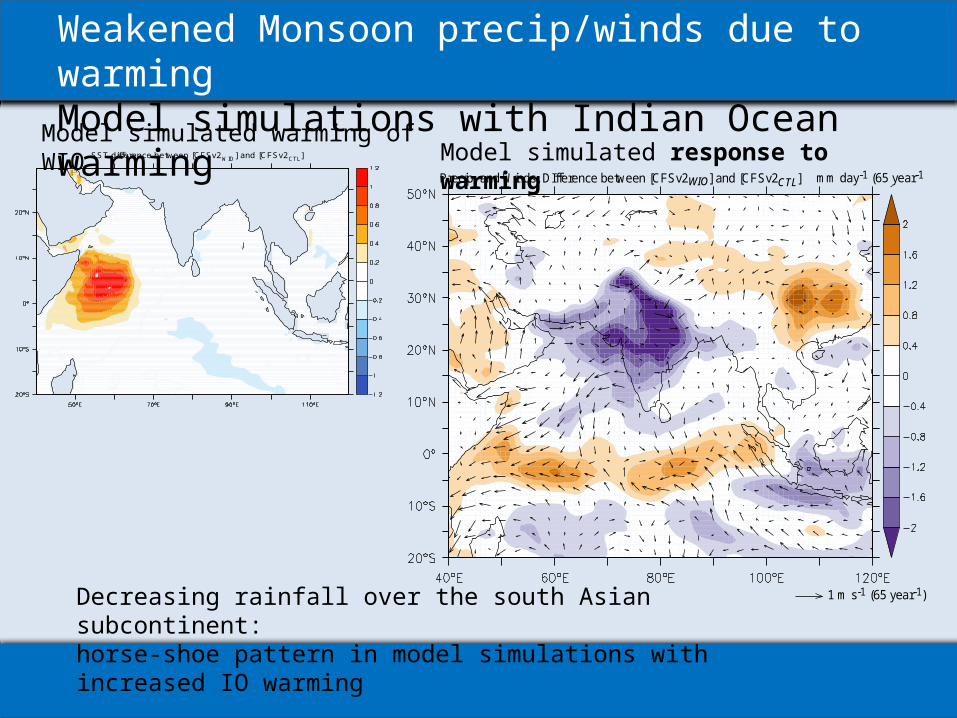
Weakened Monsoon precip/winds due to warmingModel simulations with Indian Ocean warming
Precip. and Winds, DIfference between [CFSv2WIO] and [CFSv2CTL]
1 m s-1 (65 year-1)
mm day-1 (65 year-1
Decreasing rainfall over the south Asian subcontinent: horse-shoe pattern in model simulations with increased IO warming
SST difference between [CFSv2WIO] and [CFSv2CTL]
Model simulated warming of WIOModel simulated response to warming
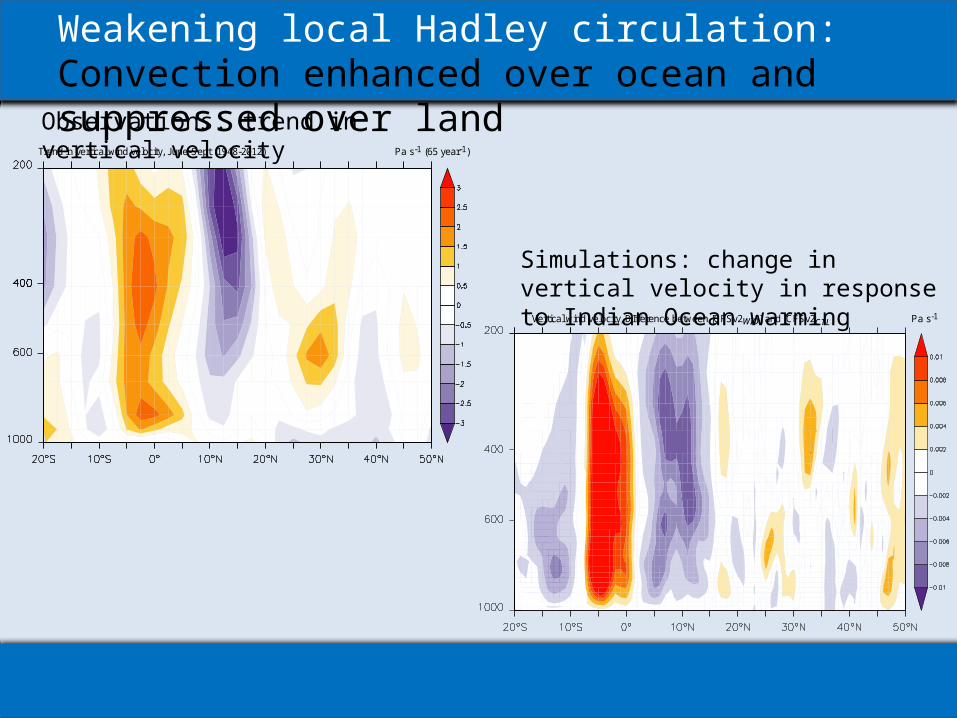
Weakening local Hadley circulation: Convection enhanced over ocean and suppressed over land
Trend in vertical wind velocity, June-Sept (1948-2012) Pa s-1 (65 year-1)
Vertical wind velocity, DIfference between [CFSv2WIO] and [CFSv2CTL] Pa s-1
Observations: trend in vertical velocity
Simulations: change in vertical velocity in response to Indian Ocean warming
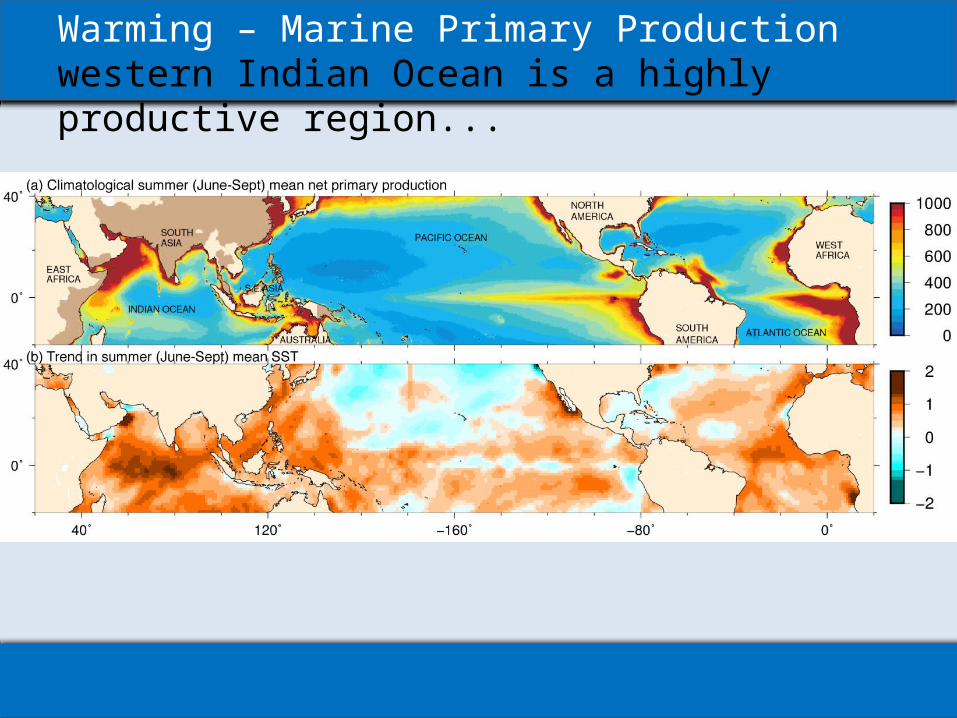
Warming – Marine Primary Productionwestern Indian Ocean is a highly productive region...
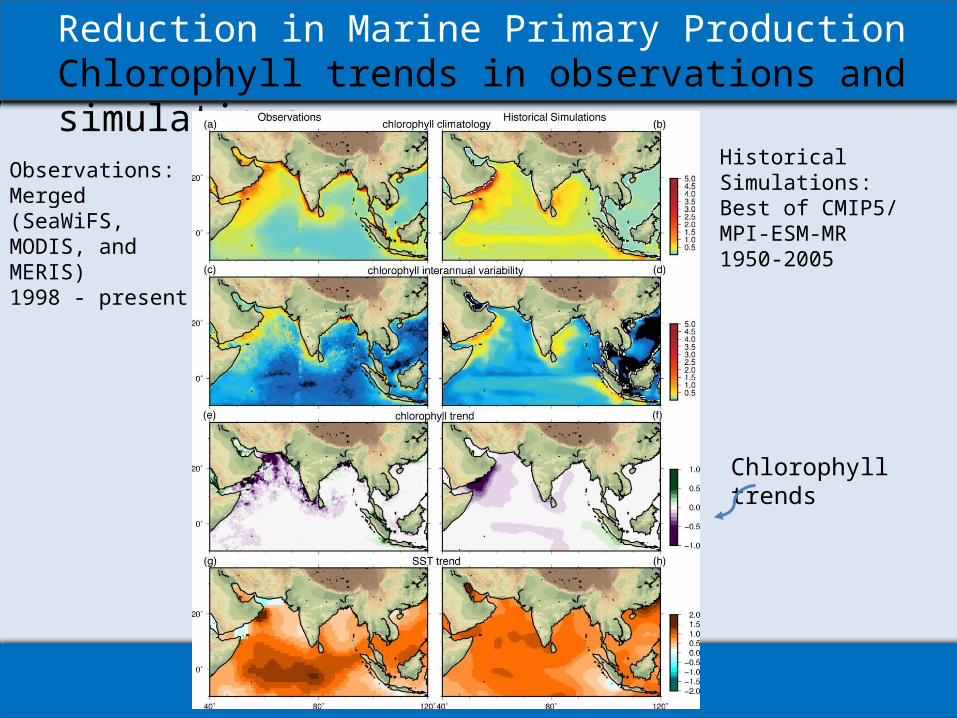
Reduction in Marine Primary ProductionChlorophyll trends in observations and simulations
Chlorophyll trends
Observations:Merged (SeaWiFS, MODIS, and MERIS)1998 - present
Historical Simulations:Best of CMIP5/MPI-ESM-MR1950-2005
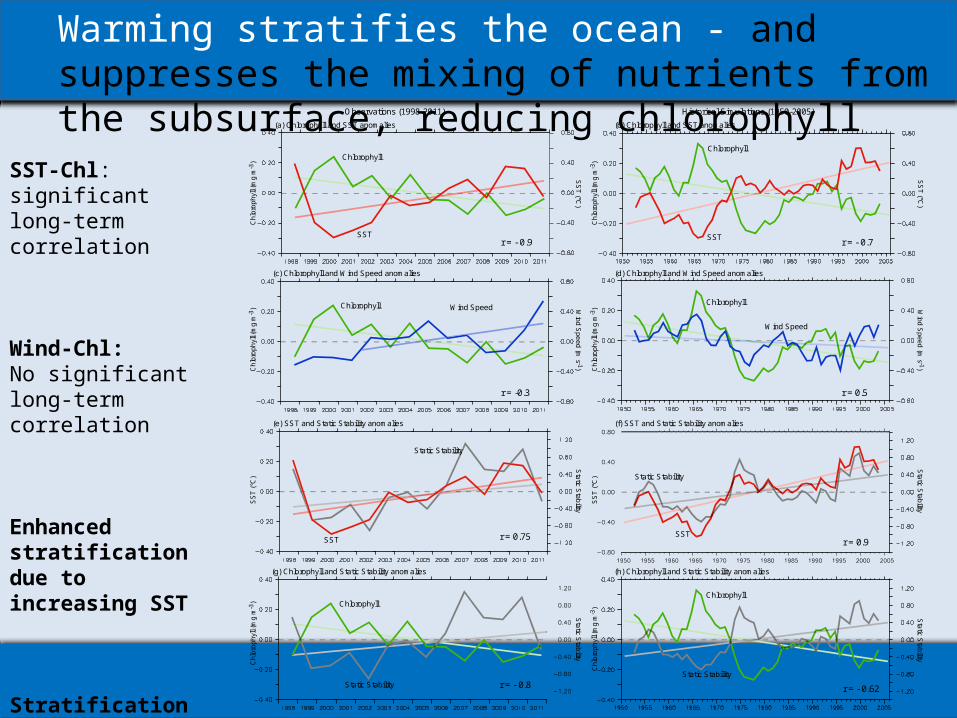
Warming stratifies the ocean - and suppresses the mixing of nutrients from the subsurface, reducing chlorophyll
Chlorophyll
SST
Chlorophyll
SST
Ch
loro
ph
yll (
mg
m-3
)
Ch
loro
ph
yll (
mg
m-3
)
SS
T (°C
)
(b) Chlorophyll and SST anomalies
r = - 0.7r = - 0.9
SS
T (°C
)
(a) Chlorophyll and SST anomalies
Chlorophyll
Wind Speed
Ch
loro
ph
yll (
mg
m-3
) Win
d S
pe
ed
(m s -1)
(d) Chlorophyll and Wind Speed anomalies
r = 0.5
Chlorophyll
Ch
loro
ph
yll (
mg
m-3
)
r = -0.3
(c) Chlorophyll and Wind Speed anomalies
Win
d S
pe
ed
(m s -1)
Wind Speed
(f) SST and Static Stability anomalies
Sta
tic Sta
bility
SS
T (
°C)
SST
Static Stability
r = 0.9
(e) SST and Static Stability anomalies
Static Stability
r = 0.75
Static Stability
Sta
tic Sta
bility
SS
T (
°C)
SST
Chlorophyll
Static Stability
Ch
loro
ph
yll (
mg
m-3
)
(h) Chlorophyll and Static Stability anomalies
r = - 0.62
Sta
tic Sta
bility
Chlorophyll
Static Stability
Ch
loro
ph
yll (
mg
m-3
)
r = - 0.8
(g) Chlorophyll and Static Stability anomalies
Sta
tic Sta
bility
Historical Simulations (1950-2005)Observations (1998-2011)
SST-Chl:significant long-term correlation
Wind-Chl: No significant long-term correlation
Enhanced stratification due to increasing SST
Stratification highly correlated to the reduction in Chl
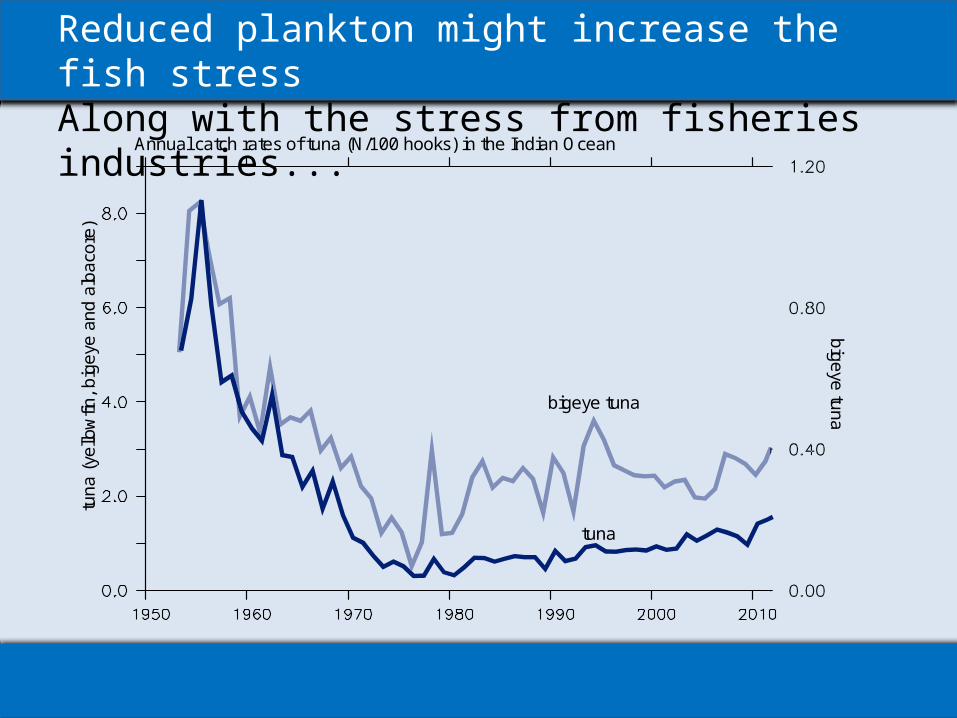
Reduced plankton might increase the fish stressAlong with the stress from fisheries industries...
Annual catch rates of tuna (N/100 hooks) in the Indian Ocean
tun
a (
yello
wfin
, b
ige
ye a
nd
alb
aco
re)
big
eye
tun
a
bigeye tuna
tuna

Indian Ocean warming – its extent, and impact on the monsoon and marine productivity
Indian Ocean warming: o Western Indian Ocean experienced
strong, monotonous warming during last century
o Links to asymmetry and skewness in ENSO forcing
o Largest ‘in-phase’ contributor to global SST warming
New Delhi
Islamabad
Potential Impacts:o Weakening of the monsoono Reduction of marine
phytoplankton
WIO
RIO