Embed Size (px)
Citation preview

1
EDITORIAL BOARD
R. Parameswaran
W.A. Balakumaran
P. Manoharan
R. Kumar
G. Varadarajan
G.S. Swaminathan
Printed at Sunitha Printers, Chennai – 600 014
VOL: 10 No. 3 JULY – SEPTEMBER 2011
QUARTERLY JOURNAL OF SAFETY ENGINEERS ASSOCIATIONBlock III , Flat No. 28, Maanasarovar Apartments, 11-A, Arcot Road, Chennai – 600 116.
Tel : 044-24764101 E-mail: [email protected] Website: www.seaindia.org
INDIAN SAFETY ENGINEERSEA (INDIA)
Inside....Page
NEBOSH Course Update 2
From the Desk of President 2
28th ProfessionalDevelopment Programme 3
Job stress andCardiovascular Disease 7
Arc Flash 8
CASE STUDIES 10-11
Fatal during Hydrostatictesting
Combustion of iron powder
Explosion in drying sectionof a membrane electrolysisunit
Environmental Effects ofBiodiesel 12
IN THE NEWS 14-15
Project to phase out mercuryuse in private healthcareorganizations
Metrowater to Earn CarbonCredit
C S R Disclosures MadeMandatory
Health Tip 15
Factory Visit to TOSHIBA JSW
Turbine & Generator Pvt. Ltd.,Manali New Town
On 13th August 2011, Safety Engineers Association has arranged
factory visit to Toshiba JSW Turbine & Generator Pvt. Ltd which
is located at Manali new town, Chennai. 22 members participated
in the factory visit. Toshiba has made elaborate arrangements for the
visit and the visit was very useful for the members to understand the
nature of work and the best safety practices followed by Toshiba JSW
Turbine & Generator Pvt. Ltd.
Members were explained about the systematic and innovative way
in which the construction and machine erection along with safety
are planned and executed. The activities at the site involve civil,
electrical and mechanical works and all the safety requirements
associated with each of the activity were explained. Members were
impressed to see how safely the construction as well manufacturing
functions were taken care, including the legal compliance for the
both.
The SEA members were wondering about the methodology followed
by the Toshiba for each and every activity from the design stage itself.
We appreciate Toshiba's effort to achieve zero accident till date.
On behalf of SEA India, Mr. Balakumaran & Mr. Thiruvengadam,
thanked the management of Toshiba JSW for all the arrangements
made satisfactorily.
2
NEBOSH Course Update
FROM THE DESK OF PRESIDENTDear Members,
This time I have to start with the sad news on the demise of our beloved Patron
Dr. S. Maruthappa on 15-09-2011. With deep regret and profound sorrow let us mourn
his death and pray for his soul to rest in peace and give enough strength for his bereaved
family members to bear the loss.
In the last quarter, our 55th Executive Committee meeting was held on 16-07-2011 and
the 28th Technical Meet was held on 18-09-2011. Our journal "Indian safety Engineer"
for the second quarter 2011 was released in time and hopefully the next one will also
reach you soon, and in time.
Mumbai Chapter of SEA had their second Executive Committee meeting held on 02-07-2011. They have
combined their EC meeting with their Technical Meet, in which two topics were presented. Their membership
drive seems to be giving good results.
SEA (India) website, www.seaindia.org is recently updated. Your comments and suggestions for improvements
are welcome. Recommend to your professional colleagues to view the site and advise them to use it for enrolling
as member or for applying for Nebosh course. Service providers may choose to use the link for propagating
their new products or services to the members and others.
I see improvements in networking among the members using our SEA India Group mail under Yahoo Groups
of Emails. But it can still improve.
Ninth batch of NEBOSH IGC course was conducted during 25th August to 8th September 2011 and one
more set of our members have appeared for the examination.
As you know we have started to offer lectures to the students of the engineering colleges in order to give
them an insight into safety engineering before they come out of the college as young engineers.
Remember to propagate safety, On the job, and Off the job as well.
Best Wishes!
S. Ulaganathan
President, SEA India
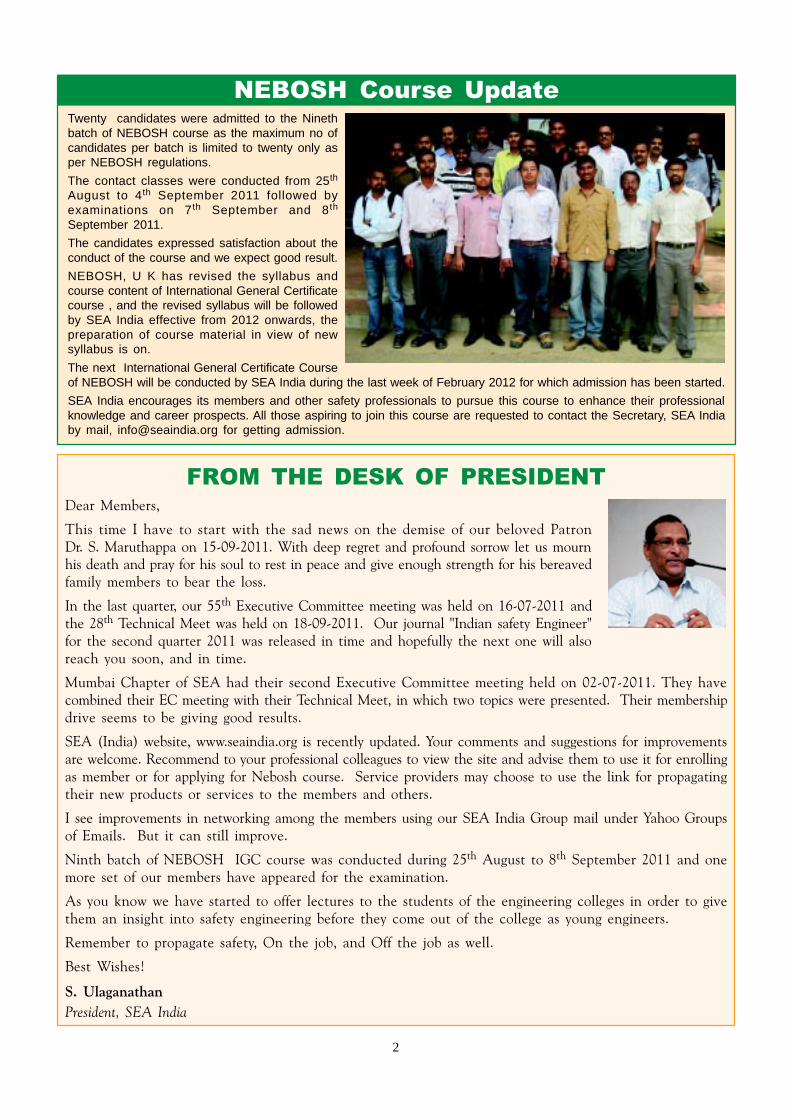
Twenty candidates were admitted to the Ninethbatch of NEBOSH course as the maximum no ofcandidates per batch is limited to twenty only asper NEBOSH regulations.
The contact classes were conducted from 25th
August to 4th September 2011 followed byexaminations on 7th September and 8th
September 2011.
The candidates expressed satisfaction about theconduct of the course and we expect good result.
NEBOSH, U K has revised the syllabus andcourse content of International General Certificatecourse , and the revised syllabus will be followedby SEA India effective from 2012 onwards, thepreparation of course material in view of newsyllabus is on.
The next International General Certificate Courseof NEBOSH will be conducted by SEA India during the last week of February 2012 for which admission has been started.
SEA India encourages its members and other safety professionals to pursue this course to enhance their professionalknowledge and career prospects. All those aspiring to join this course are requested to contact the Secretary, SEA Indiaby mail, [email protected] for getting admission.

3
(Contd. on next page)
HOMAGE
Dr S Maruthappa
Safety Engineers Association has lost one of its very senior members in the demise
of Dr. S. Maruthappa. Being one of the early members of the association, his
contributions to the professional forum were significant. He is a well known and
highly recognised expert in the field of fire safety across India.
He was also one of the accredited tutors for taking classes in the NEBOSH
International General Certificate courses conducted by Safety Engineers Association.
His unstinted efforts and active participation, even at his elder years were truly
setting example to the young safety professionals.
When his services were recognized by Government of India by awarding him the
“Life Time Achievement Award” in the year 2007, the association took pleasure in congratulating him
with a trophy and a certificate. The association also recognised his services in the safety field by awarding
him the prestigious "Patron" position, in the year 2010 which he was holding till his unfortunate demise.
His passing away is a great and non compensable loss to the Fire & Safety fraternity at large. We at
Safety Engineers Association mourn his death and extend our sincere prayers for his departed soul to
rest in peace.
(1932–2011)
28th PROFESSIONAL DEVELOPMENT PROGRAMME
Twenty Eighth Professional
Development Programme was
held on Sunday, 18th September
2011 at Chennai.
Mr S Suresh , Mr A Sivakumar
and Mr Maria Selvam of
Environmental & Geo Spatial
Solutions, Chennai delivered the
talk on “B O W T I E - As a tool
for Efficient Risk Management”.
The meet was followed by lunch
and presentation of Certificate to
the participants and a Gift to the
lucky winner among the
participants.
Large number of SEA Members
participated in the technical meet
and enriched their knowledge.
The salient topics discussed during
the programme is given below for
the sake of SEA India members
who could not attend the
programme.
1. Bowtie Risk Management
Methodology: The Bowtie
methodology does more than just
visually presenting all of the risks.
It also provides a visual
representation of your Safety
Critical Elements (SEC). In
Bowtie, the SCE is known as a
Barrier or Control that prevents,
controls or mitigates major
accident scenarios. Besides
identifying SCE's, Bowties also look
into the factors that might reduce
or defeat their effectiveness (called
Escalation Factors in Bowtie
theory). This increases the
awareness and insight into what
factors might indirectly influence
the safety performance, and also
gathers the practical knowledge in
the organisation and makes it
explicit. This is also one of the
reasons why Bowties are used for
organisational learning. But even
more important, it allows
organisations to think one step
ahead and foresee complex
interactions without the need for
an incident to occur.
Besides being ideal for visualising
the SCE's and their Escalation
Factors, Bowties are also good at
building a system for managing
SCE's. Managing Safety Critical
Elements in BowTieXP is done by
defining activities and
responsibilities that assure the
integrity of the SCE. This builds a
Safety Management System that is
firmly rooted in a Bowtie risk
analysis in which each activity can
be traced back to the reasons for
doing it. This also increases
acceptance of an SMS because
everyone can see the risk context
in the Bowtie.
A Bowtie is a diagram that
visualizes the risk you are dealing
with in just one easy to understand
picture. The diagram is shaped like
a Bowtie creating a clear
differentiation between proactive

4
(Contd. from previous page)
(Contd. on next page)
and reactive risk management.
The power of a Bowtie diagram is
that it shows you a summary of
several plausible risk scenarios in a
single picture. In short its provides
a simple, visual explanation of a risk
that would be much more difficult
to explain. Mastering Bowtie
methodology enables HSE and
Risk professionals to undertake
qualitative risk assessments using
the leading BowTie Analysis
software and best practices.
There are 8 main steps in creating
a Bowtie diagram
1. Identify Hazards
2. Identify Top Events
3. Identify Threats
4. Evaluate Consequences
5. Identify Proactive/preventive
Controls
6. Identify Reactive Controls
7. Identify Escalation Factors
8. Identify Escalation Factor
Controls
2. Introduction to Risk and
Risk assessment Tools
There has been a paradigm shift in
the government's focus from its
rescue, relief, and restoration-
centric approach to a planning,
prevention/mitigation and
preparedness approach. It has
been realised that effective
Industrial Disaster Management
(CDM) is possible by the adoption
of preventive and mitigation
strategies as most industrial disasters
are preventable in comparison to
natural disasters that are difficult to
predict and prevent provided a
proper Risk Management concept
is adopted.
Risk may be defined more broadly
as the probability of occurrence of
an adverse outcome and the
severity of the consequences if the
outcome does occur. The elements
of risk are hazards, vulnerabilities,
threats and consequences.
Managing risk is an integral part of
good management and is
something many managers do
already in one form or another.
Risk management begins with the
assessment of risk. It provides a
structured way of identifying and
analysing potential risks, and
devising and implementing
responses appropriate to their
impact. These responses generally
draw on strategies of risk
prevention, risk transfer, impact
mitigation or risk acceptance. Risk
analysis is the process of identifying
risks, estimating their likelihoods
and evaluating potential
consequences.
The common methods that are in
use to address the risk are Check
List, flow chart, Risk Inspection,
HAZOP, HAZAN, Decision Tree
method, Hazard Indices etc. One
of the most powerful and
increasingly popular risk
assessment techniques is the ‘Bow-
tie’ method. This method goes
beyond the usual risk assessment
snapshot and puts emphasis on the
linkage. It thus can help to ensure
that risks are truly managed, rather
than just analysed. It forces
practitioners into undertaking a
Summary of a Bowtie Diagram
comprehensive and structured
approach to risk assessment, and it
is also an excellent means of
communicating risk issues to non-
specialists.
3. Safety Culture & Resilience
Building
Safety Culture is the latest
preoccupation of management and
safety professionals of industrial
organizations across developed
economies. They are increasingly
challenged by the concepts and
workings of Safety Culture which
is being hailed as the panacea
especially for achieving further
improvements in organizations
that are already in the league of
world-class safety performers.
For these organizations, Safety
Culture follows the lineage of
Technological Standards and
Safety Management Systems
which they had relied upon in the
1980's to achieve improved safety
performance. Whilst that may be
so, Safety Culture is a much more
fuzzy and intangible subject than
its predecessors. This prompted a
major oil company to describe
Safety Culture thus:
“It's never easy to define, and
impossible to touch: yet safety
culture and leadership form the
bedrock for safe and reliable
operations in any organization”.
Viewed against this backdrop, it is
a matter of time when
managements and safety
professionals in Indian industries
would likewise be contending with

5
(Contd. from previous page)
(Contd. on next page)
the complexities of Safety Culture.
Let's now take a closer look at
Safety Culture.
4. Case for Positive Safety
Culture
Major disasters like Bhopal,
Flixborough, ChernobyI, Piper
Alpha, Clapham Junction, and
more recently Texas City Refinery
and Deepwater Horizon, have
highlighted lapses in the
management of risks inherent in
industrial operations. These
disasters have revealed that
complex systems broke down
disastrously despite the adoption of
the full range of engineering and
technical safeguards because people
failed to do what they were
supposed to do. These were not
simple, individual errors, but
malpractices that corrupted large
parts of the social system that
makes organizations function.
The last two incidents, which
unfortunately occurred under
charge of a single corporate
management, have shown that
technological standards and
management systems are not
enough to avert incidents. Safety
needs to become an inherent part
of the every member of the
organization, from the chief
executive officer to the operator or
technician at the shop-floor, if it
were to ensure that nothing falls
through the 'safety net'. Safety has
therefore to become a primary
consideration in every activity at
every level of the organization.
Thus, Safety Culture can be
construed as the extent to which
Safety features in the
organizational culture of the
establishment.
Definition of Safety Culture
Safety Culture is variously defined
by different organizations. Its
definition ranges from
The traditional:
“....the way we do things round
here.”
To the more formal definition:
“The product of individual and
group values, attitudes,
perceptions, competencies and
patterns of behaviour that
determine commitment to and the
style and proficiency of an
organization’s health and safety
management" (of the Advisory
Committee for Safety in Nuclear
Installations).
Where are we now in Safety
Culture?
Since Safety Culture is part and
parcel of the organizational culture,
an organization aspiring to
leverage Safety Culture for
improved safety performance needs
first to understand where it stands
in term of making Safety an
integral feature of the
organizational culture.
To answer this question effectively,
we need to have an organizational
consensus on the following two
points:
1. An Understanding of What is
Safety Culture - a definition
shared by all across the
Corporation
2. The Strategy and Methodology
to measure the Maturity of
Safety Culture in the
Corporation
While there are many tools with
varying levels of complexity to
measure the maturity of Safety
Culture, cursory self-diagnosis:
Organizations committed to
building a Safety Culture aspire to
promote an organizational culture
that:
• Is committed to conducting its
operations free of any incident
or injury,
• Creates a mindset that is
intolerant of any injury
• Emphasizes the Human side of
Safety Performance
• Promotes personal
responsibility and ownership
for safe work performance
• Instills genuine safety behavior
in people for both self and
others
• Makes people care for one
another at all times
• Believes in proactively
managing safety
• Assures all workers go home
safely to their family each day
• Seeks success instead of
avoiding failure
Stages of Safety Culture
Improvement
Generally organizations take the
following path of maturity in Safety
Culture:

6
(Contd. from previous page)
Dependent Culture
• Emphasis on management and
supervisory control
• Extensive use of discipline to
enforce safety measures
• Heavy reliance on written
safety rules and procedures
• Safety performance is
dependent on the level of
management commitment to
enforcing rules and procedures
Independent Culture
• Focus is on personal
commitment to and
responsibility for safety
• Relies on all employees
developing their own personal
safety standards and adhering
to these standards
• While there will still be
company safety rules and
procedures, employees look
after their own safety and
make active choices to keep
themselves safe
Interdependent Culture
• Team commitment is the
dominant factor
• Employees' Sense of
responsibility for safety beyond
their own work
• Caring for the safety of others
• Share a common belief in the
importance of safety
Improving Safety Culture
There is no one best way to
improve Safety Culture. However,
the following two vital focus areas
have been identified to offer high
returns
Employee Involvement and
empowerment through the Self
Managing Teams Approach
• They have an established
track record
• Widely adopted in the
manufacturing industry
• Being adopted in safety critical
industries
• Day-to-day control devolved
to frontline employees
• Supervisors become coaches
• A UK study attests to the
positive results from this
approach on Safety Culture
Supervisory safety management
skills
• The Supervisor has long been
recognized as the key
individual in the management
of safety
• Their proximity to worksite
gives them the ability to know
if safety measure are working
in practice
• Recent research in the offshore
oil industry identified a
number of supervisor attributes
impacting subordinates' safety
behaviour, including less risk
taking.
• Workers with positive safety
behaviours indicated that their
supervisors had following
attributes:
• Valuing their subordinates
– Visiting the worksites
frequently
– Facilitation of work group
participation in decision
making
– Effective safety communi-
cation.
GREEN HOUSE GAS
As you are aware, rising Green House Gas (GHG) levels in atmosphere and emergence of
climate change is one of the greatest challenges facing countries, Government and other
stakeholders and various initiatives are being developed to limit GHG concentrations in earth's
atmosphere. One such standard which is under consideration is ISO 14067, which details the
requirement for quantification and communication of carbon footprints. This standard is under
consideration in ISO.
DISCLAIMER: All information contained in this Journal, were obtained from sources, believed to be reliable and are collated, based ontechnical knowledge and experience, currently available with the Editorial Board of SEA (India). While SEA (India) recommends referenceto or use of the contents by its members and subscribers, such reference to or use of contents by its members or subscribers or thirdparties, are purely voluntary and not binding. Therefore the Editorial Board of this Journal or SEA (India) assumes no liability or responsibilitywhatsoever towards any bad or undesired consequences.

7
(Contd. on next page)
JOB STRESS AND CARDIOVASCULAR DISEASE
A number of well-known factors
are related to increased risk for
cardiovascular disease (CVD).
These risk factors include smoking,
obesity, low density lipoprotein
(the "bad" cholesterol), lack of
exercise, and blood pressure,
among others. Using two large
U.S. data sets, Murphy found that
hazardous work situations, jobs
that required vigilance and
responsibility for others, and work
that required attention to devices
were related to increased risk for
cardiovascular disability These
included jobs in transportation
(e.g., air traffic controllers, airline
pilots, bus drivers, locomotive
engineers, truck drivers),
preschool teachers, and craftsmen.
Among 30 studies , most have
found an association between
workplace stressors and CVD.
Job strain and CVD. Job strain
refers to the combination of low
work-related decision latitude and
high workload Fredikson, Sundin,
and Frankenhaeuser (1985) found
that job strain was related to
increased activity in the
sympathoadrenomedullary and
adrenocortical axes] Belki? et al.
(2000) found that many of the 30
studies mentioned above
indicated that decision latitude
and psychological workload
exerted independent effects on
CVD; two studies found
synergistic effects, consistent with
the strictest version of the strain
model. A review of 17 longitudinal
studies having reasonably high
internal validity found that 8
showed a significant relation
between job strain and CVD and
3 more showed a nonsignificant
relation The findings, however,
were clearer for men than for
women, on whom data were more
sparse.
Effort-reward imbalance and
CVD. An alternative model of job
stress is the effort-reward
imbalance model. That model
holds that high work-related effort
coupled with low control over
job-related intrinsic (e.g.,
recognition) and extrinsic (e.g.,
pay) rewards triggers high levels of
activation in neurohormonal
pathways that, cumulatively, are
thought to exert adverse effects on
cardiovascular health. At least five
studies of men have linked effort-
reward imbalance with CVD.
Job loss. OHP-related research has
also shown that job loss adversely
affects cardiovascular health as
well as health in general.
Adverse working conditions and
economic insecurity linked to
psychological distress and reduced
job satisfaction
What is meant by psychological
distress. A number of well-
designed longitudinal studies have
adduced evidence for the view
that adverse working conditions
contribute to the development of
psychological distress. Before
turning to those studies, the reader
should note that psychological
distress refers to feelings of
demoralization that are aversive to
people, and often drive them to
seek professional help, without the
individuals necessarily meeting
criteria for a psychiatric disorder.
Psychological distress is often
expressed in affective (depressive)
symptoms, psychophysical or
psychosomatic symptoms (e.g.,
headaches, stomachaches, etc.),
and anxiety symptoms. The
relation of adverse working
conditions to psychological distress
is thus an important avenue of
research. Job satisfaction is
included in this section because it
is a key variable in a great deal of
research on organizations and is
related to a host of health
outcomes
Working conditions and
psychological distress. Parkes
(1982) conducted one of the
methodologically soundest studies
of the relation of working
conditions to psychological distress
in British student nurses. She
found that in this "natural
experiment," student nurses
experienced higher levels of
distress and lower levels of job
satisfaction in medical wards than
in surgical wards; compared to
surgical wards, medical wards make
greater affective demands on the
nurses. In another
methodologically sound study,
Frese (1985) showed that
objective working conditions give
rise to subjective stress and
psychosomatic symptoms in blue
collar German workers. In
addition to the above studies, a
number of other well-controlled
longitudinal studies have
implicated work stressors in the
development of psychological
distress and reduced job
satisfaction.
Work and mental disorder
Schizophrenia. In a case-control
study, Link, Dohrenwend, and

8
(Contd. from previous page)
Skodol found that, compared to
depressed and well control
subjects, schizophrenic patients
were more likely to have had jobs,
prior to their first episode of the
disorder, that exposed them to
"noisesome" work characteristics
(e.g., noise, humidity, heat, cold,
etc.). The jobs tended to be of
higher status than other blue collar
jobs, suggesting that downward
drift in already-affected individuals
does not account for the finding.
One explanation involving a
diathesis-stress model suggests that
the job-related stressors helped
precipitate the first episode in
already-vulnerable individuals.
There is some support for the
finding from data collected in the
Epidemiologic Catchment Area
(ECA) study.
Depression. Using data from the
ECA study, Eaton, Anthony,
Mandel, and Garrison (1990)
found that members of three
occupational groups, lawyers,
secretaries, and special education
teachers (but not other types of
teachers), showed elevated rates
of DSM-III major depression,
adjusting for social demographic
factors. The ECA study involved
representative samples of
American adults from five U.S.
geographical areas, providing
relatively unbiased estimates of the
risk of mental disorder by
occupation; however, because the
data were cross-sectional, no
conclusions bearing on cause-and-
effect relations are warranted.
Evidence from a Canadian
prospective study indicated that
individuals in the highest quartile
of occupational stress are at
increased risk for an episode of
major depression. A meta-analysis
that pooled the results of 11 well-
designed longitudinal studies
indicated that a number of facets
of the psychosocial work
environment (e.g., low decision
latitude, high psychological
workload, lack of social support at
work, effort-reward imbalance,
and job insecurity) increase the
risk of common mental disorders
such as depression.
Alcohol use. Another study based
on cross-sectional ECA data
found high rates of alcohol abuse
and dependence in the
construction and transportation
industries as well as among waiters
and waitresses, controlling for
sociodemographic factors. Within
the transportation sector, heavy
truck drivers and material movers
were at especially high risk. A
prospective study of ECA subjects
who were followed one year after
the initial interviews provided
data on newly incident cases of
alcohol abuse and dependence
This study found that workers in
jobs that combined low control
with high physical demands were
at increased risk of developing
alcohol problems although the
findings were confined to men.
Workplace interventions
Industrial organizations
OHP interventions often concern
both the health of the individual
and the health of the
organization. Adkins (1999)
described the development of one
such intervention, an
organizational health center
(OHC) at a California industrial
complex. The OHC helped to
improve both organizational and
individual health as well as help
workers manage job stress.
Innovations included labor-
management partnerships, suicide
risk reduction (there had
previously been elevated suicide
risk at the complex), conflict
mediation, and occupational
mental health support. OHC
practitioners also coordinated their
services with previously
underutilized local community
services in the same city, thus
reducing redundancy in service
delivery.
Hugentobler, Israel, and Schurman
(1992) detailed a different, multi-
layered intervention in a mid-sized
Michigan manufacturing plant.
The hub of the intervention was
the Stress and Wellness Committee
(SWC) which solicited ideas from
workers on ways to improve both
their well-being and productivity.
Innovations the SWC developed
included improvements that
ensured two-way communication
between workers and
management and reduction in
stress resulting from diminished
conflict over issues of quantity
versus quality. Both the
interventions described by Adkins
and Hugentobler et al. had a
positive impact on productivity.
NIOSH-related interventions.
Currently there are efforts under
way at NIOSH to help reduce the
incidence of preventable disorders
(e.g., sleep apnea) among heavy-
truck and tractor-trailer drivers
and, concomitantly, the life -
threatening accidents to which
the disorders lead improve the
health and safety of workers who
are assigned to shift work or who
work long hours, and reduce the
incidence of falls among iron
workers.
Courtesy: Wikipidia

9
ARC FLASH
An arc flash is an electrical
breakdown of the resistance of air
resulting in an electric arc which
can occur where there is sufficient
voltage in an electrical system and
a path to ground or lower voltage.
An arc flash with 1000 amperes or
more can cause substantial damage,
fire or injury. Temperatures can
reach or exceed 35,000 degrees
fahrenheit at the arc terminals. The
massive energy released in the fault
rapidly vaporizes the metal
conductors involved, blasting
molten metal and expanding plasma
outward with extreme force. A
typical arc flash incident can be
inconsequential but could
conceivably easily produce a more
severe explosion. The result of the
violent event can cause destruction
of equipment involved, fire, and
injury not only to the worker but also
to nearby people.
In addition to the explosive blast of
such a fault, destruction also arises
from the intense radiant heat
produced by the arc. The metal
plasma arc produces tremendous
amounts of light energy from far
infrared to ultraviolet. Surfaces of
nearby people and objects absorb this
energy and are instantly heated to
vaporizing temperatures. The effects
of this can be seen on adjacent walls
and equipment - they are often
ablated and eroded from the radiant
effects.
In general, arc flash incidents which
ignite clothing are highly improbable
on systems operating at less than 208
volts phase to phase (120V to
ground) when fed by less than a
125 kVA transformer, as 120 volts
does not provide sufficient energy to
cause an arc flash hazard. Most
480V electrical services have
sufficient capacity to cause an arc
flash hazard. Medium-voltage
equipment (above 600V) is higher
energy and therefore a higher
potential for an arc flash hazard.
As an example of the energy released
in an arc flash incident, consider a
single phase-to-phase fault on a
480V system with 20,000 amps of
fault current. The resulting power
is 9.6 MW. If the fault lasts for 10
cycles at 60 Hz, the resulting energy
would be 1.6 megajoules. For
comparison, TNT releases 2175 J/g
or more when detonated (a
conventional value of 4,184 J/g is
used for TNT equivalent). Thus,
this fault energy is equivalent to 380
grams (approximately 0.8 pounds) of
TNT. The character of an arc flash
blast is quite different from a
chemical explosion (more heat and
light, less mechanical shock), but
the resulting devastation is
comparable. The rapidly expanding
superheated vapor produced by the
arc can cause serious injury or
damage, and the intense UV, visible,
andIR light produced by the arc can
temporarily and sometimes even
permanently blind or cause eye
damage to people.
There are four different arc flash type
events to be assessed when designing
safety programs:
• Open Air Arc Flashes
• Ejected Arc Flashes
• Equipment Focused Arc Flashes
(Arc-in-a-box)
• Tracking Arc Flashes
Protecting personnel
There are many methods of
protecting personnel from arc flash
hazards. This can include personnel
wearing arc flash personal protective
equipment (PPE) or modifying the
design and configuration of
electrical equipment. The best way
to remove the hazards of an arc flash
is to de-energize electrical
equipment when interacting with it,
however de-energizing electrical
equipment is in and of itself an arc
flash hazard. In this case then one
of the newest solutions is to allow
the operator to stand far back from
the electrical equipment by
operating equipment remotely.
Arc flash protection equipment
With recent increased awareness of
the dangers of arc flash, there have
been many companies that offer arc
flash personal protective equipment
(PPE). The materials are tested for
their arc rating. The arc rating is the
maximum incident energy resistance
demonstrated by a material prior to
breakopen or at the onset of a
second-degree skin burn. Arc rating
is normally expressed in cal/cm2 or
small calories of heat energy per
square centimeter.
Selection of appropriate PPE, given
a certain task to be performed, is
normally handled in one of two
possible ways. The first method is to
consult a hazard category
classification table, like that found
in NFPA 70E. Table 130.7(C)(9)(a)
lists a number of typical electrical
tasks are various voltage levels and
recommends the category of PPE that
should be worn. For example when
working on 600 V switchgear and
performing a removal of bolted
covers to expose bare, energized
parts, the table recommends
Category 3 Protective Clothing
System. This Category 3 system
corresponds to an ensemble of PPE
that together offers protection up to
25 cal/cm2 (105 J/cm2 or 1.05 MJ/
m2). The minimum rating of PPE
necessary for any category is the
maximum available energy for that
category. For example, a Category
3 arc-flash hazard requires PPE
rated for no less than 25 cal/cm2
(1.05 MJ/m2).
The second method of selecting PPE
is to perform an arc flash hazard
calculation to determine the
(Contd. on next page)

10
CASE STUDIES
CASE STUDY 1
Fatal during Hydrostatic testing
Description
Hydrostatic test was to be carried on
30" Pipe and the preparation of
pressurization started in the morning.
During the pressurization, 3 crew
were on the top of the pipe rack
which was at a height of 13m from
the ground, checking the conditions,
and one foreman was on the ground
directing them. Before reaching the
highest pressure, 30" pipe burst at
the 45degree joint located 9m from
the ground. The force of the blast
threw one pipe fitter 14m from the
top of the pipe rack . He hit the
scaffolding on the other side, fell
down from 7 m height and died as a
result of skull fracture.
Possible Causes for the accident
The test pressure might have been
wrongly selected
The leakage before bursting would
have not been noticed
Air would have trapped inside the
pipe during the test preparation
Remedial action:
Risk assessment is the basic need for
carrying out work at such a height
involving high risk.
Consideration should be given to the
impact of pipe failure when such a
large- sized piping system is tested
Maximum allowable test pressure
should be ascertained before
undertaking the high pressure
testing.
During pressurization, leakage if any
should be monitored with special
care on joints.
Trapping of air inside the pipe should
be prevented by adequate draining
Rigid work platform should be
constructed when work is to be
carried on at such height
Good communication should be
ensured among co workers.
CASE STUDY 2
Combustion of iron powder
Description
“Atomized” iron powder was being
manufactured and sold to the
automotive and other industries for
the production of metal parts using
powder metallurgy.
(Contd. on next page)
available incident arc energy. IEEE
1584 provides a guide to perform
these calculations given that the
bolted fault current, duration of
faults, and other general equipment
information is known. Once the
incident energy is calculated the
appropriate ensemble of PPE that
offers protection greater than the
energy available can be selected.
PPE provides protection after an arc
flash incident has occurred and
should be viewed as the last line of
protection. Reducing the frequency
and severity of incidents should be
the first option and this can be
achieved through a complete arc
flash hazard assessment and through
the application of technology such
as high resistance grounding which
has been proven to reduce the
frequency and severity of incidents.
Reducing hazard by design
Three key factors determine the
intensity of an arc flash on personnel.
These factors are the quantity of
fault current available in a system,
the time fault until an arc flash is
cleared, and the distance an
individual is from an arc. Various
design and equipment configuration
choices can be made to affect these
factors and in turn reduce the arc
flash hazard.
Fault current
Fault current can be limited by using
current limiting devices such as
grounding resistors or fuses. If the
fault current is limited to 5 amperes
or less, then many ground faults self-
extinguish and do not propagate into
phase-to-phase faults.
Arcing time
Arcing time can be reduced by
temporarily setting upstream
protective devices to lower setpoints
during maintenance periods or by
employing zone-selective
interlocking protection (ZSIP).
Arcing time can significantly be
reduced by protection based on
detection of arc-flash light. Optical
detection is often combined with
overcurrent information. Light and
current based protection can be set
up with dedicated arc-flash
protective relays or by using normal
protective relays equipped with arc-
flash option.
The most efficient means to reduce
arcing time is to use an arc
eliminator that will extinguish the
arc within a few milliseconds.
Distance
The distance from an arc flash
source within which an unprotected
person has a 50% chance of receiving
a second degree burn is referred to
as the "flash protection boundary".
Those conducting flash hazard
analyses must consider this
boundary, and then must determine
what PPE should be worn within the
flash protection boundary. Remote
operators or robots can be used to
perform activities that are high risk
for arc flash incidents, such as
inserting draw-out circuit breakers
on a live electrical bus.
Arc Flash....
(Contd. from previous page)

11
Two maintenance mechanics
inspected a bucket elevator that had
been reported to be malfunctioning
due to a misaligned belt. The bucket
elevator, located downstream of an
annealing furnace, conveyed fine
iron powder to storage bins. The two
mechanics were standing alone on
an elevated platform near the top of
the bucket elevator, which had been
shut down and was out of service
until maintenance personnel could
inspect it. When the bucket
elevator was restarted, the
movement immediately lofted
combustible iron dust into the air.
The dust got ignited and the flames
engulfed the workers causing
injuries. A dust collector associated
with the elevator was reported to
have been out of service for the two
days leading to the incident.
Possible causes for the accident
"Tests conducted on samples of
metal powder - collected from the
plant - determined that this material
is combustible,".
Investigation revealed significant
quantities of metal dust on surfaces
within close proximity to the
incident locations. This was of
particular concern as metal dust
flash fires present a greater burn
injury threat than flammable gas or
vapor flash fires. Metal dust fires
have the potential to radiate more
heat and some metals burn at
extremely high temperatures in
comparison to other combustible
materials." In addition to visible dust
particles in the air, 2 to 3-inch layers
of dust were observed on flat
surfaces, rafters, and railings
throughout the facility.
Remedial action
The standards prescribed for dust
collection systems, dust cleaning
frequency, and building construction
and egress provisions should strictly
be adheared.
An alarm system shall be installed in
the area to give warning before the
reach of flash point.
Care should be taken to see that
Flash point of dust particle is never
reached.
CASE STUDY 3
Explosion in drying section of a
membrane electrolysis unit
Description
After a one day shut down of the
chlor-alkali plant due to
maintenance requirement in the
chlorine consumer's plant, the
chlorine production was restarted
and, while the current intensity was
increased, the chlorine gas pipeline
leading to the drying unit exploded,
causing an emission of chlorine.
In addition, broken parts of the
chlorine pipeline hit other pipelines
and concentrated sulphuric acid
leaked out in the containment basin.
The automatic emergency system
immediately shut down the
electrolysis unit.
Due to an increase in hydrogen
concentration in the gaseous
chlorine of a membrane electrolysis
unit, the drying section exploded
partially, leading to a chlorine leak.
A concentrated sulphuric acid pipe
was also damaged causing an
additional acid leak.
The emergency system based on
differential pressure shut down the
unit directly when the pipe
exploded, stopping the production of
chlorine.
20 workers were evacuated but none
was injured.
Possible causes for the accident
The examination of ion-exchange
membranes by the manufacturer
showed some damages on two of
(Contd. from previous page) them, which were probably the cause
of the hydrogen mixing in chlorine.
It is well known that even very low
ignition energy can start the
explosion, and static electricity in
polymer equipment could have been
the source.
During the preparatory works,
unusual increase of the brine loop
pH was not detected by the operator.
In addition, unusual decrease of the
cells differential voltage was also
overseen when the plant was re-
started.
The wet chlorine gas pipeline was
not equipped with a hydrogen
analyser.
Remedial action
The following remedial actions are
suggested
• To have a fast detection of
hydrogen concentration
increase at the outlet of the cells
plus an additional monitoring
system of the possible membrane
damages (voltage/current,
quality of products …).
• To Installation of a hydrogen
detector in the chlorine header
connected to the emergency
system.
• Continuous monitoring of
differential voltage by groups of
cells.
• Improvement of internal
structure of the drying towers for
preventing static electricity.
• Improvement of DCS graphics
for better visibility of important
alarms.
• Training of workers to increase
their basic knowledge and help
them in detecting important
safety information.
• Update the start-up procedure
(including putting the drying
unit in line).

12
ENVIRONMENTAL EFFECTS OF BIODIESEL
Fossil fuels are non-renewable
resources because they take
millions of years to form, and
reserves are being depleted much
faster than new ones are being
made. The production and use of
fossil fuels raise environmental
concerns. A global movement
toward the generation of
renewable energy is therefore
under way to help meet increased
energy needs.
The burning of fossil fuels
produces around 21.3 billion
tonnes (21.3 gigatonnes) of
carbon dioxide (CO2) per year,
but it is estimated that natural
processes can only absorb about
half of that amount, so there is a
net increase of 10.65 billion
tonnes of atmospheric carbon
dioxide per year (one tonne of
atmospheric carbon is equivalent
to 44/12 or 3.7 tonnes of carbon
dioxide)
Biodiesel refers to a vegetable oil-
or animal fat-based diesel fuel
consisting of long-chain alkyl
(methyl, propyl or ethyl) esters.
Biodiesel is typically made by
chemically reacting lipids (e.g.,
vegetable oil, animal fat (tallow))
with an alcohol.
Greenhouse gas emissions
The incentive for using biodiesel
is its capacity to lower greenhouse
gas emissions compared to those of
fossil fuels. If this is true or not
depends on many factors.
Especially the effects from land
use change have potential to cause
even more emissions than what
would be caused by using fossil
fuels alone.
Carbon dioxide is one of the major
greenhouse gases. Although the
burning of biodiesel produces
carbon dioxide emissions similar to
those from ordinary fossil fuels, the
plant feedstock used in the
production absorbs carbon dioxide
from the atmosphere when it
grows. Plants absorb carbon
dioxide through a process known
as photosynthesis which allows it
to store energy from sunlight in
the form of sugars and starches.
After the biomass is converted
into biodiesel and burnt as fuel the
energy and carbon is released
again. Some of that energy can be
used to power an engine while the
carbon dioxide is released back
into the atmosphere.
When considering the total
amount of greenhouse gas
emissions it is therefore important
to consider the whole production
process and what indirect effects
such production might cause. The
effect on carbon dioxide emissions
is highly dependent on
production methods and the type
of feedstock used. Calculating the
carbon intensity of biofuels is a
complex and inexact process, and
is highly dependent on the
assumptions made in the
calculation. A calculation usually
includes:
• Emissions from growing the
feedstock (e.g. Petrochemicals
used in fertilizers)
• Emissions from transporting
the feedstock to the factory
• Emissions from processing the
feedstock into biodiesel
Other factors can be very
significant but are sometimes not
considered. These include:
• Emissions from the change in
land use of the area where the
fuel feedstock is grown.
• Emissions from transportation
of the biodiesel from the
factory to its point of use
• The efficiency of the biodiesel
compared with standard diesel
• The amount of Carbon
Dioxide produced at the tail
pipe. (Biodiesel can produce
4.7% more)
• The benefits due to the
production of useful by-
products, such as cattle feed
or glycerine
If land use change is not
considered and assuming today's
production methods, biodiesel
from rapeseed and sunflower oil
produce 45%-65% lower
greenhouse gas emissions than
petrodiesel. However, there is
ongoing research to improve the
efficiency of the production
process. Biodiesel produced from
used cooking oil or other waste fat
could reduce CO2 emissions by
(Contd. on next page)
13
as much as 85%. As long as the
feedstock is grown on existing
cropland, land use change has
little or no effect on greenhouse
gas emissions. However, there is
concern that increased feedstock
production directly affects the rate
of deforestation. Such clearcutting
cause carbon stored in the forest,
soil and peat layers to be released.
The amount of greenhouse gas
emissions from deforestation is so
large that the benefits from lower
emissions (caused by biodiesel use
alone) would be negligible for
hundreds of years. Biofuel
produced from feedstocks such as
palm oil could therefore cause
much higher carbon dioxide
emissions than some types of fossil
fuels.
Deforestation
If deforestation, and monoculture
farming techniques were used to
grow biofuel crops, biodiesel may
become a serious threat to the
environment:
• Increasing the emission of
climate change gases rather
than helping curb them
• Damaging ecosystems and
biodiversity
• Exacerbating social conflict
The demand for cheap oil from
the tropical regions is of rising
concern. In order to increase
production, the amount of arable
land is being expanded at the cost
of tropical rainforest Feedstock
oils produced in Asia, South
America and Africa are currently
less expensive than those
produced in Europe and North
America suggesting that imports to
these wealthier nations are likely
to increase in the future.
In the Philippines and Indonesia
forest clearing is already underway
for the production of palm oil.
Indigenous people are forced to
move and their livelihood is
destroyed when forest is cleared to
make room for oil palm
plantations. In some areas the use
of pesticides for biofuel crops are
disrupting clean water supplies,
and the loss of habitat caused by
deforestation is threatening many
species of unique plants and
animals. One example is the
already-shrinking populations of
orangutans on the Indonesian
islands of Borneo and Sumatra,
which face extinction if
deforestation continue at its
projected rate.
This should be compared with the
ecological degradation associated
with oil production. For instance,
oil production from the Athabasca
Oil Sands in Canada has required
the clear cutting of vast swathes of
the Boreal forest to create open
pit mines, and the consumption of
vast amounts of water and natural
gas. Another example is the oil
production in the Niger Delta,
which has destroyed fisheries and
mangrove forests, and led to
health problems among the local
population.
Pollution
In the United States, biodiesel is
the only alternative fuel to have
successfully completed the Health
Effects Testing requirements (Tier
I and Tier II) of the Clean Air Act
(1990).
Biodiesel can reduce the direct
tailpipe-emission of particulates,
small particles of solid combustion
products, on vehicles with
particulate filters by as much as 20
percent compared with low-sulfur
(< 50 ppm) diesel. Particulate
emissions as the result of
production are reduced by around
50 percent compared with fossil-
sourced diesel. (Beer et al., 2004).
Biodiesel has a higher cetane
rating than petrodiesel, which can
improve performance and clean
up emissions compared to crude
petro-diesel (with cetane lower
than 40). Biodiesel contains fewer
aromatic hydrocarbons:
benzofluoranthene: 56%
reduction; Benzopyrenes: 71%
reduction.
Biodegradation
A University of Idaho study
compared biodegradation rates of
biodiesel, neat vegetable oils,
biodiesel and petroleum diesel
blends, and neat 2-D diesel fuel.
Using low concentrations of the
product to be degraded (10 ppm)
in nutrient and sewage sludge
amended solutions, they
demonstrated that biodiesel
degraded at the same rate as a
dextrose control and 5 times as
quickly as petroleum diesel over a
period of 28 days, and that
biodiesel blends double the rate of
petroleum diesel degradation
through co-metabolism.
Courtesy: Wikipidia
(Contd. from previous page)

14
IN THE NEWS
Project to phase out mercury use in private healthcare organizationsThe Tamil Nadu Pollution Control Board (TNPCB) has launched a project to phase out use of mercury in privatehealthcare organisations. The project is based on a study done by the United Nations Development Programmeon disposal of biomedical waste in developing countries.
A dozen private healthcare institutions, including hospitals, dental clinics and blood banks in the city, are partof a project to replace outdated equipment, said T.N. Ravishankar, national secretary, Indian Medical Association,College of General Practitioners.
According to doctors, traditionally the thermometer is placed in the armpit of children to prevent them from chewingon the instrument thus leading to accidental ingestion of mercury. However, studies done by various organisationshave found that it is not accidental ingestion as much as improper disposal of mercury that causes extensive damage.Mercury from damaged thermometers and BP apparatus when disposed of without proper precaution couldcontaminate the environment.
Organic mercury compound is a highly toxic substance which could contaminate the groundwater, soil and foodchain. Depending on the dosage and level of mercury poisoning, it could cause vision, hearing, speech impairment,respiratory ailments, neurological and gastrointestinal problems and lead to death. Children and pregnant mothersare particularly vulnerable.
TNPCB officials said several workshops were conducted to raise awareness of the need to shift from conventionalequipment to technologically improved versions. The workshops were a result of the policy framework documentprepared in 2007 by the Union Ministry of Health for providing guidance on the processes for infection control andbiomedical waste management.
Doctors say in government hospitals digital thermometers are increasingly used, but aneroid BP devices are yetto catch up.
P. Ramachandran, Director, Institute of Child Health, said though official instructions have not been received, thenew purchases for thermometers and BP devices comply with the decision to opt for internationally accepted devices.
Putting to rest fears of inaccuracy, he said the digital thermometer is durable, sensitive and reads the temperatureaccurately. The aneroid BP apparatus (sphygmomanometer) also provides accurate reading but is yet to be acceptedby all doctors. Secretary of Nursing Council G. Josephine says nursing students are taught about the newtechnological devices as part of their education though there is no emphasis on the need to shift to newer devices.
Source: The Hindu
Metrowater to Earn Carbon Credit
Chennai Metro Water will soon earn carbon credit for its efforts in reducing carbon dioxide emissions in four ofits Sewerage Treatment Plants. The process of obtaining carbon credit has reached the final stage with the consultantset to register the project with the United Nations Body. According to officials of the Chennai Metro Water, SGSIndia, the consultant has prepared the assessment certificate after validating the level of Green House GasesEmission and the efforts of generating electricity from sewage. About 32MW or 32000 units of electricity is generatedfrom a total of 264 million litres of sewage received in a day in the Sewerage Treatment Plants. This meets thepower requirement of the facilities. Nearly 61200 Tonnes of Green House Gases is estimated to be reduced perannum through the initiative.
The project has been approved by the Ministry of Environment and Forest. The consultant would register withthe United Nations Framework Convention on climate Change shortly by paying Rs 4.5 lac to obtain EmissionReduction Certificate. This would help earning carbon credit under the " Clean Development Mechanism". The wateragency has saved electricity worth nearly Rs 23 crores since August2005. It will generate a revenue of 4.4 croreper annum by trading its credit in International Market, said a senior official of the Metro Water. The water agencyexpect to receive the incentive within six months.
"We will implement the Eco-Friendly project in four of the remaining five projects in a phased manner. A comprehensivepackage has been provided to install equipments to generate electricity in the upcoming Sewarage Treatment Plants"said the official.
– Source: The Hindu
15
IN THE NEWS
C S R Disclosures Made MandatoryMaking it mandatory for India to disclose its C S R activities to stakeholders, the Government has released aset of guidelines for all business including MNCs.
Observance of these would be voluntary. " We can keep making rules and people will keep circumventing them.We do not want to work with a stick, because if the end goal is not achieved, the purpose itself is defeated" saidMr R P N Singh, Minister of State for Corporate Affairs. The M C A also felt that the scope of the term C S Ris limited and it has been renamed as Responsible Business.
There are nine broad principles in the National Voluntary Guidelines on Social, Environmental and EconomicalResponsibilities of business. These are the well beings of Employees, human Rights, Environmental Consideration,Equitable Development, Safe and Sustainable Goods and being responsive towards stack holders.
The standing committee of Finance had suggested that two percent of average of net profit for the preceding threeyears of companies be made mandatory for companies with a net worth of Rs 500 or more or those that havean annual turnover of atleast Rs 1000crores or companies with a net profit of Rs 5 crores or more.
While reporting the Responsible Business, the Government suggests making disclosures on the recyclable rawmaterials used, total number of contractual employees, percentage of women employees, energy efficient technologiesand total water consumed among other things.
Lauding the Public sector units for whom it is mandatory to spend two percent profit after tax on C S R activities,Mr Murli Deora, Minister of Corporate Affairs said, “The private corporate sector has come a long way from thedays of Adhoc Charity”.
Source: Business Line
HEALTH TIP
STROKE IDENTIFICATION: A neurologist says that if he can get to a stroke victim within 3 hourshe can totally reverse the effects of a stroke...totally. He said the trick was getting a stroke recognized,diagnosed, and then getting the patient medically cared for within 3 hours, which is tough.
RECOGNIZING A STROKE: Some don't die. They end up in a helpless, hopeless irreversible conditioninstead.
Remember the '3' steps,
STR. Read and Learn!
Sometimes symptoms of a stroke are difficult to identify. Unfortunately, the lack of awareness spellsdisaster.
The stroke victim may suffer severe brain damage when people nearby fail to recognize the symptomsof a stroke.
Now doctors say a bystander can recognize a stroke by asking three simple questions :
S * Ask the individual to SMILE ..
T * = TALK. Ask the person to SPEAK A SIMPLE SENTENCE (Coherently) (eg 'It is sunny out today').
R * Ask him or her to RAISE BOTH ARMS .
If he or she has trouble with ANY ONE of these tasks, call the ambulance and describe the symptomsto the dispatcher.
Another 'sign' of a stroke is
1. Ask the person to 'stick' out their tongue.
2. If the tongue is 'crooked', if it goes to one side or the other, that is also an indication of a stroke.

16