Embed Size (px)
Citation preview

June 27, 2016

Outline
• Agriculture in India
• Release of national level estimates
• Collection of primary data by States
- Area
- Yield
• Other sources of data on area, production and yield
- Crop Weather Watch Group (CWWG)
- Forecasting Agricultural Output using Space, Agro-
meteorology and Land-based observations (FASAL)
• Validation of Data

Agricultural Development in India
• Five-fold increase in food grain production since 1950-51
• Moved away from food dependency to a net food
exporter
• Largest producer of milk, annual output of 138 MT in
2013-14
• India is world’s biggest producer of pulses
• Second largest producer of sugarcane, Rice and Wheat
• Ranks second in fish production and aquaculture, next
only to China
• Agriculture offers livelihood to 55% of the country’s
workforce
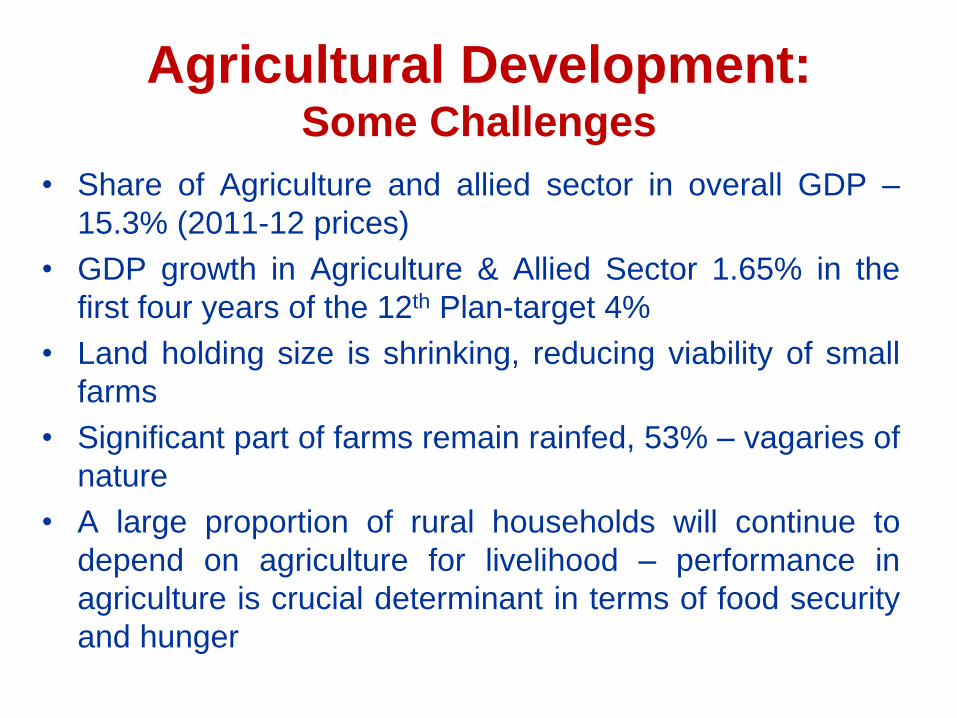
Agricultural Development:
Some Challenges
• Share of Agriculture and allied sector in overall GDP –
15.3% (2011-12 prices)
• GDP growth in Agriculture & Allied Sector 1.65% in the
first four years of the 12th Plan-target 4%
• Land holding size is shrinking, reducing viability of small
farms
• Significant part of farms remain rainfed, 53% – vagaries of
nature
• A large proportion of rural households will continue to
depend on agriculture for livelihood – performance in
agriculture is crucial determinant in terms of food security
and hunger
5
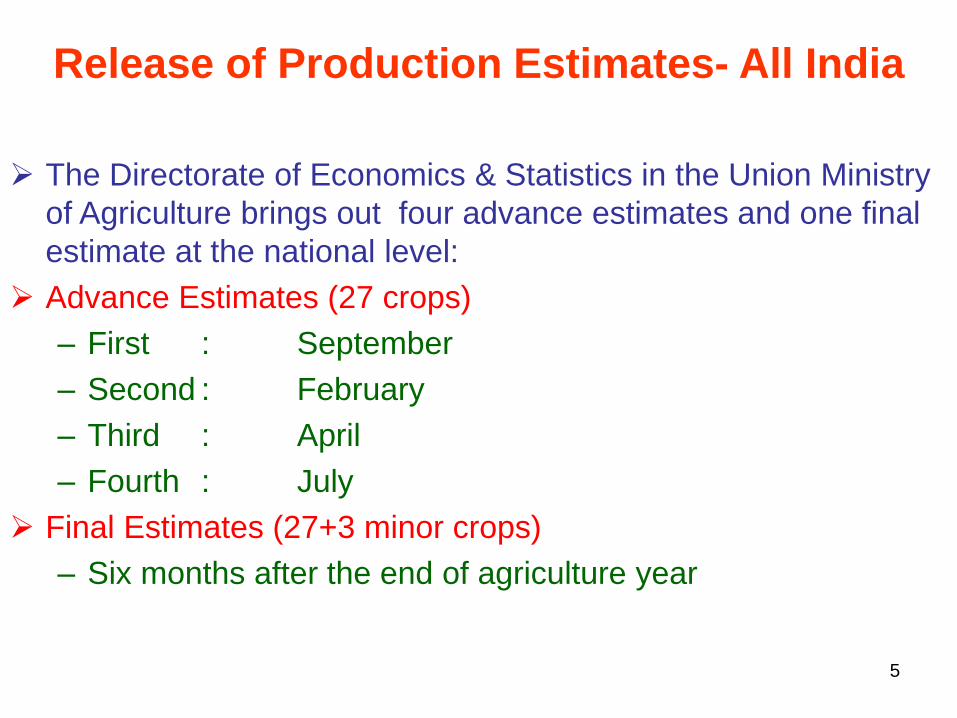
The Directorate of Economics & Statistics in the Union Ministry
of Agriculture brings out four advance estimates and one final
estimate at the national level:
Advance Estimates (27 crops)
– First : September
– Second : February
– Third : April
– Fourth : July
Final Estimates (27+3 minor crops)
– Six months after the end of agriculture year
Release of Production Estimates- All India

6
• 27 major crops:
rice, wheat, jowar, bajra, maize, ragi, barley,
small millets, tur (arhar), gram, urad, moong,
other kharif pulses, other rabi pulses, groundnut,
rapeseed & mustard, soyabean, nigerseed,
castorseed, sunflower, safflower, linseed,
sesamum, sugarcane, cotton, jute and mesta.
3 minor crops:
guarseed, sanhemp and tobacco.

7
Collection of Primary Data
State Governments have designated one of its Departments as
State Agricultural Statistics Authorities (SASAs) which are
responsible for providing agricultural data at prescribed intervals
to DES for finalizing Advance/Final Estimates.
SASAs vary from State to State and are in one of the following
State Departments:
Deptt. of Agriculture (Gujarat, Haryana, Jharkhand,
Maharashtra Punjab, UP, Uttarakhand and WB)
Deptt. of Economics & Statistics (AP, Assam, Bihar, J&K,
Karnataka, Kerala, Orissa, Rajasthan and TamilNadu)
Deptt. of Land Records ( Chattisgarh, HP and MP),
8
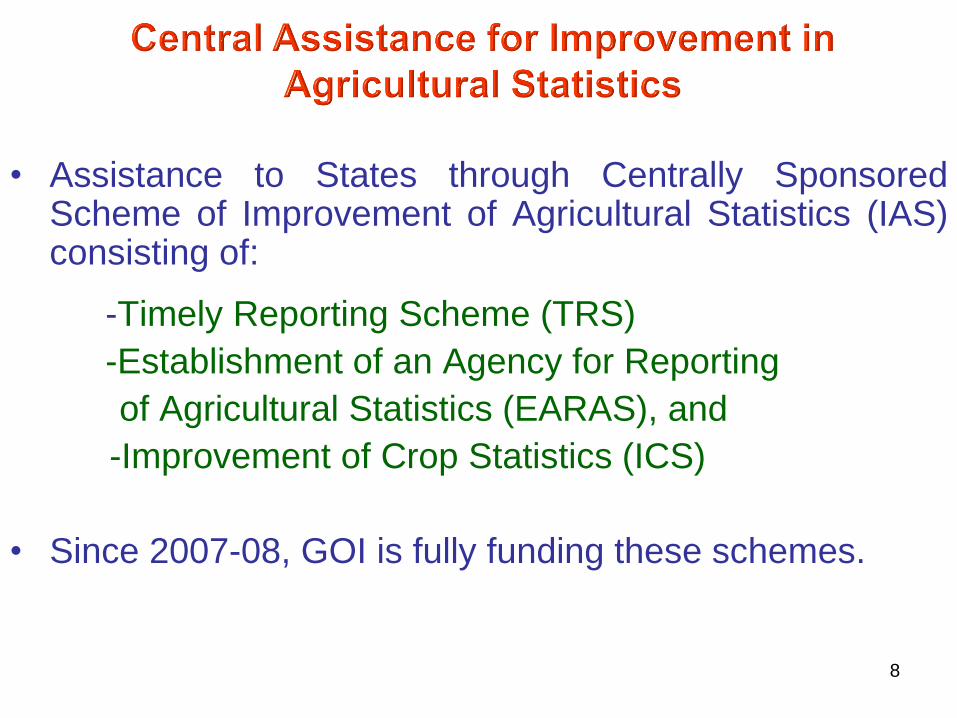
• Assistance to States through Centrally Sponsored Scheme of Improvement of Agricultural Statistics (IAS) consisting of:
-Timely Reporting Scheme (TRS)
-Establishment of an Agency for Reporting
of Agricultural Statistics (EARAS), and
-Improvement of Crop Statistics (ICS)
• Since 2007-08, GOI is fully funding these schemes.

• Primary responsibility of collection of crop statistics rests with State Governments.
• Crop Statistics has 2 components-
Area sown
Average yield
June 27, 2016
CROP STATISTICS

States/UTs classified into 3 broad groups-
• Land record or Temporarily Settled States- area statistics collected by complete enumeration (86% area)
• Non-Land record or Permanently Settled States- area statistics collected through sample surveys (9% area)
• Satisfactory system of collection of area statistics yet to be developed (5% area).
June 27, 2016
AREA STATISTICS

Yield estimation - General Crop Estimation
Surveys (GCES) conducted in different
States/UTs.
Total 65 crops - 51 food crops and 14 non-
food crops covered under General Crop
Estimation Survey (GCES)
June 27, 2016
YIELD ESTIMATION
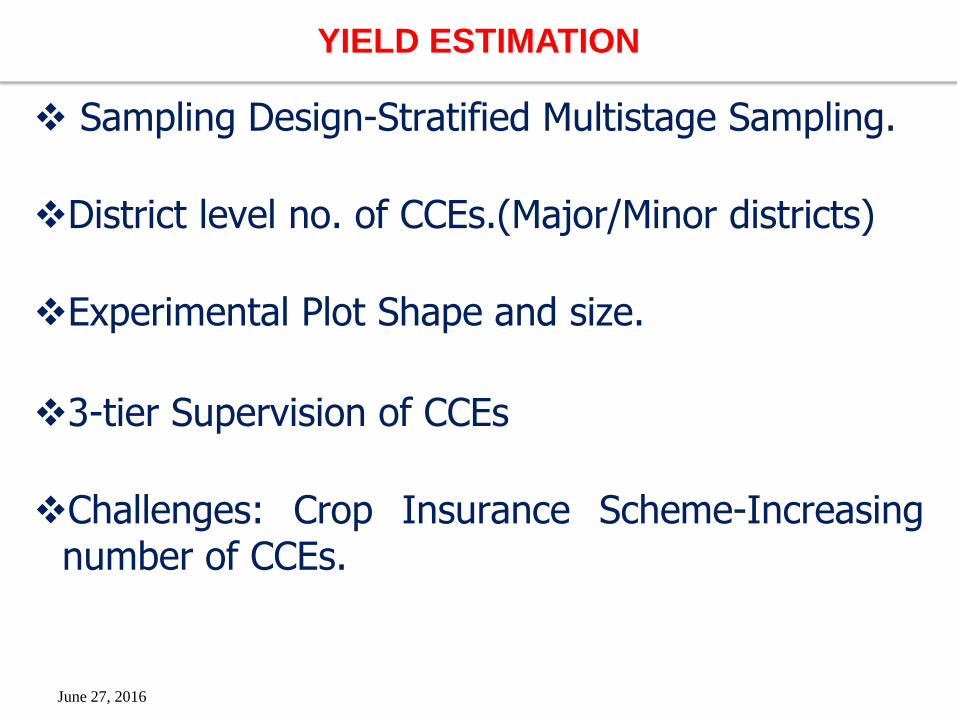
Sampling Design-Stratified Multistage Sampling.
District level no. of CCEs.(Major/Minor districts)
Experimental Plot Shape and size.
3-tier Supervision of CCEs
Challenges: Crop Insurance Scheme-Increasing number of CCEs.
June 27, 2016
YIELD ESTIMATION
June 27, 2016
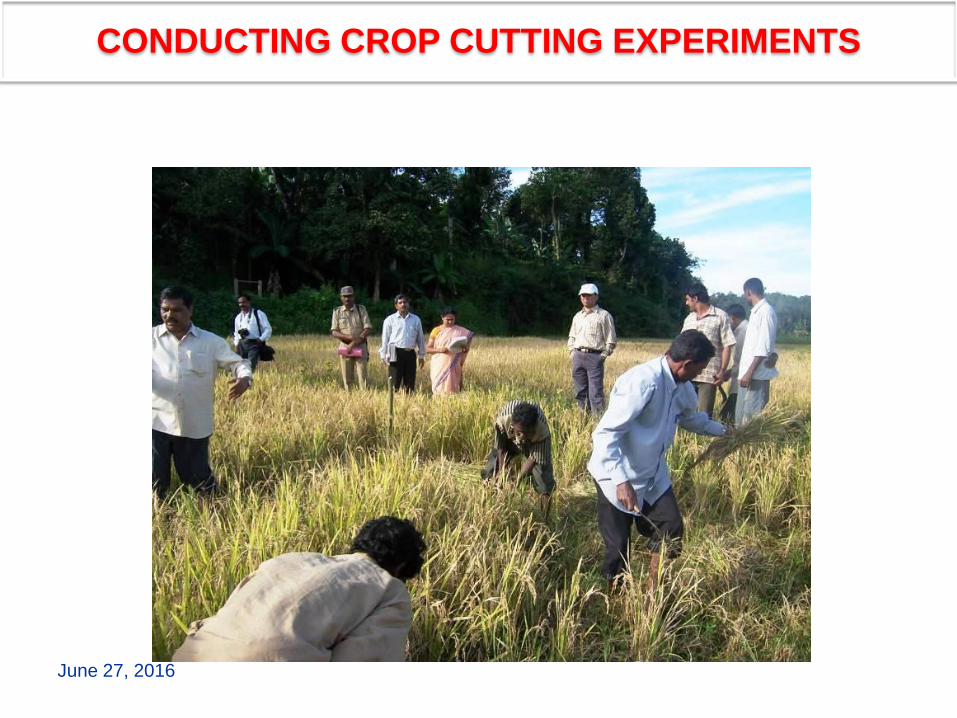
CONDUCTING CROP CUTTING EXPERIMENTS

Measuring Experimental Plot
June 27, 2016
YIELD ESTIMATION

Harvesting the Experimental Plot
June 27, 2016
YIELD ESTIMATION
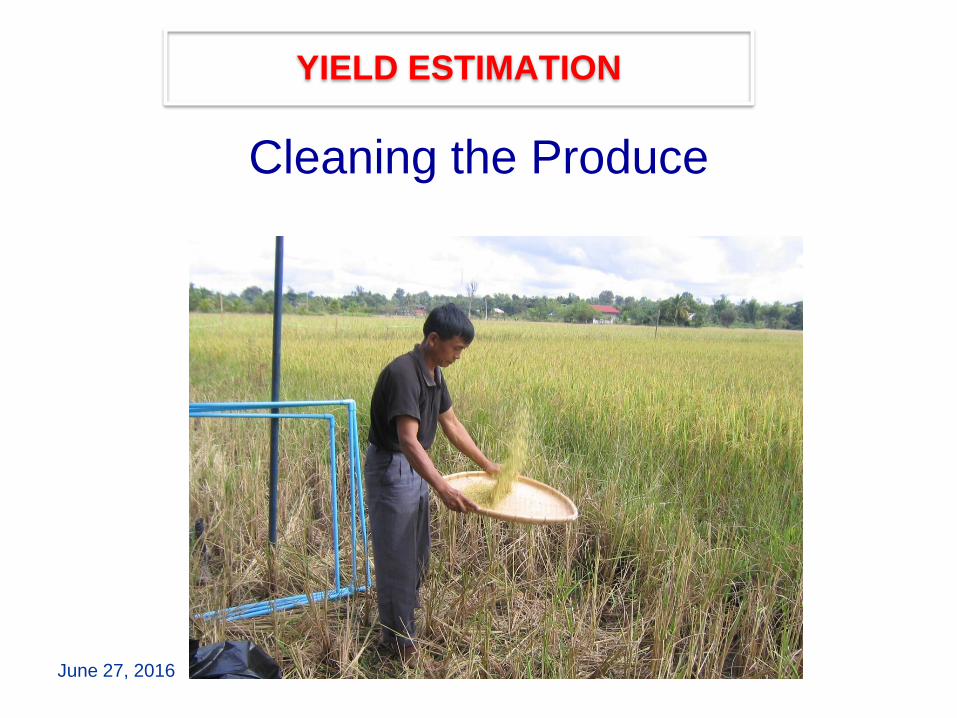
Cleaning the Produce
June 27, 2016
YIELD ESTIMATION
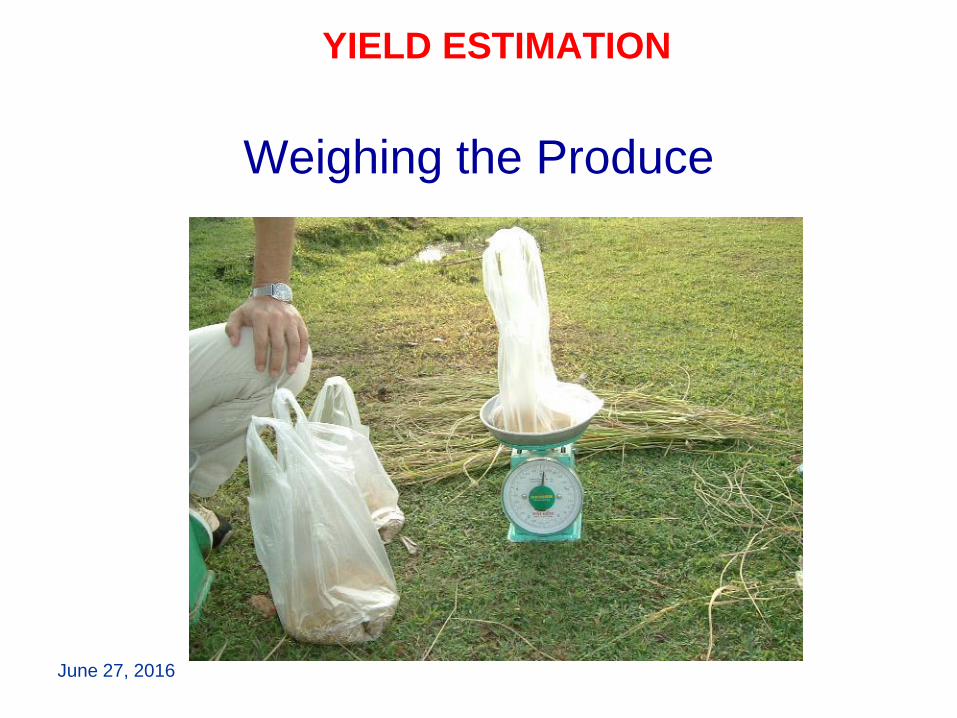
Weighing the Produce
June 27, 2016
YIELD ESTIMATION

OTHER SOURCES OF CROP ESTIMATES

-
Provides weekly inputs on:-
- Weather / rainfall situation
- Progressive sowing position
- Water storage in major reservoirs
- Availability of seeds, fertilizers
- Pest and disease situation
- Market arrivals and price situation
- Procurement
- Import / Export position
Crop Weather Watch Group

Forecasting Agricultural output using Space, Agro-
Meteorology and Land based observation (FASAL)
• To enhance the capabilities of the existing system of crop forecasts using information available on weather, economic variables and land based observations, the FASAL scheme was launched in August, 2006.
• Under FASAL, multiple forecast of 11major crops:
(i)Rice (Kharif & Rabi), (ii)Jowar (Kharif & Rabi), (iii)Maize, (iv)Bajra, (v)Jute, (vi)Ragi, (vii)Cotton, (viii)Groundnut (Kharif & Rabi), (ix)Sugarcane, (x)Rapeseed & Mustard and (xi)Wheat
were envisaged at National/State/District level depending on the status of technology available.

• Mahalanobis National Crop Forecast Centre (MNCFC)- remote sensing technology based forecast of area & production for:
(i)Rice (Kharif & Rabi), (ii)Jowar (Kharif & Rabi), (iii)Jute, (iv)Cotton, (v)Groundnut (Kharif & Rabi), (vi)Sugarcane, (vii)Rapeseed & Mustard and (viii)Wheat
at district/State/All India level.
• Forecast Schedule – F1 Kharif (15th Sept.) Rabi (31st Jan.)
F2 Kharif (15th Oct.) Rabi (28th Feb.)
F3 Kharif (30th Nov.) Rabi (31st Mar.)
• Institute of Economic Growth (IEG)-Forecast of area, production and yield in Kharif & Rabi season at pre sowing (F0) & sowing (F1) stage based on Econometric models.
• Models use trends in crop area and yield in the season, wholesale prices, MSPs, Prices of major fertilizers and pesticides, Quantity of fertilizers and pesticides used and Rainfall etc.
•
FASAL - Partner Organizations

• Forecast provided by IEG for 10 crops:-
(i) Rice (Kharif & Rabi) (ii) Bajra, (iii) Cotton (iv) Jowar (Kharif & Rabi) (v) Groundnut (Kharif & Rabi), (vi) Jute (vii) Maize (viii)Rapeseed & Mustard and (ix) Sugarcane (x) Wheat.
at all India and State level
• Forecast Time – F0 Kharif (31st May) Rabi (30th Nov.)
F1 Kharif (31st July) Rabi (31st Jan.)
• IMD has started providing experimental forecasts of yield based on Agromet models at District/State level for selected crops.
FASAL-Partner Organizations (MNCFC, IEG and IMD)

23
Validation of Data
DES validates the above data at the national level with input
from:
Forecasts given by the Space Applications Center
(SAC), Ahmedabad and IEG, New Delhi
Inputs received from the weekly Crop Weather Watch
Group (CWWG) meetings
Results of the available Crop Cutting Experiments
received from the SASAs/ NSSO for selected crops
Trends in the area, production and yield of different
crops during the last 5 years and
Trends in procurement and prices of respective
commodities

June 27, 2016