Embed Size (px)
Citation preview

INDIANA ECONOMIC ANALYSIS REPORT
Commissioner, Steve Braun October 2015

Indiana Department of Workforce Development | October 2015
2
Acknowledgements The Indiana Economic Analysis Report involved the following collaborators and/or contributors: DWD/Research and Analysis Allison Leeuw, Research Director Charlie Baer, Manager of Federal Studies DWD/ Economic and Market Analysis Kimberley Linville, Economic Analyst Greg Silvey, Economic Analyst Terry Brown, Regional Labor Analyst, Team Lead Steve Buck, Labor Market Analyst Michelle Graves-Moore, Economic Analyst Craig Volle, Projections Team Lead Contact: Charles Baer Team Lead Economic Market Analysis Indiana Department of Workforce Development 317-232-7718 Published October 2015 ©2015 Indiana Department of Workforce Development

Indiana Department of Workforce Development | October 2015
3
Economic Growth Regions

Indiana Department of Workforce Development | October 2015
4
2014 Indiana Employment in Brief: Indiana has seen steady employment gains in the 5 years following the recession. The average annual employment level for all industries was 2,890,690 annually in 2014; this is up 7% since 2009. Average weekly wages have risen to $818 for all Industries. Employment gains remain strongest in Health Care and Social Assistance, as well as Manufacturing. Weekly wages remain high for individuals in certain sectors of manufacturing, finance and insurance, and utilities. The following charts summarize briefly Indiana’s 2014 Employment from the Quarterly Census of Employment and Wage (QCEW) program.
Source IDWD Quarterly Census of Employment and Wages

Indiana Department of Workforce Development | October 2015
5
TABLE OF CONTENTS
Summary: Current Indiana Employment Situation / 2015 CES Estimates (preliminary) Section A: Economic Analysis 7 A1 Current Employment 8-12 Statewide QCEW 2014 Growing and Declining Industries Employment and Payroll Wages Regional Map and Wage Change 13 A2 Existing Demand 14 Help Wanted Online Data (and in Appendix) Employer Online Job Postings Key Skills and Certifications in Demand 17 A3 Emerging Demand 20 Regional Hot Jobs Short Term Projection Hot Jobs 21 Section B: Workforce Analysis 22 B1 Labor Force Estimates (State and Regional) 22 Unemployment Rates 23 Unemployment Rates (map) 24-26 Unemployment Insurance Claims 27 B2 Workforce and Industry Composition 28 Age Groups of the Workforce B3 Education 30 B4 Housing 32 Homeownership Rates Housing Units APPENDICES 33 ONLINE JOB POSTINGS BY EGR SKILLS AND CERTIFICATIONS IN DEMAND BY EGR UNEMPLOYMENT INSURANCE CLAIMANT PROFILES

Indiana Department of Workforce Development | October 2015
6
Summary: Current Indiana Economic Situation Preliminary estimates from the Current Employment Statistics and Local Area Unemployment Statistics as of July 2015 continue to indicate growing private sector employment and falling unemployment. Indiana's labor force is up 23,000 over the year, and has gained 76,000 since January 2013. Indiana’s labor force stands at 3,258,308. Indiana’s unemployment is down by 111,800 since January 2013, which is a decline of (42%). This indicates growing labor shortages in many areas of the state, particularly in areas of strong manufacturing growth, and in areas with declining populations. The latest population estimates indicate that over half of Indiana’s counties have lost population. Indiana’s private sector employment grew by 4,800 in July, (0.2%) and private sector employment is up 59,800 from a year ago, this is annual growth of (2.3%). Indiana’s overall growth is comparable to the national trend, as US private sector employment is up by 2.4% over the year (July 2015). Private sector monthly job growth has averaged about 3,900 over the last two years. Key growth sectors over the past year include private educational and health services, manufacturing, professional and business services, and retail and wholesale trade. The sector that is showing slow growth in recent months, yet decline over the year is the construction industry. Source: Current Employment Statistics (CES Preliminary Estimates)
IN Employment Change Over the Month, Year-to-Date and Over the Year (seasonally adjusted)
Industry July 2014December
2014 June 2015 July 2015Month
ChangeY-to-D
ChangeY-to-Y
ChangePrivate Educational & Health Services 438.7 441.5 447.2 451.6 4.4 10.1 12.9.....Private Educational Services 64.3 65.5 64.1 64.1 0.0 -1.4 -0.2.....Health Care & Social Assistance 374.4 376.0 383.1 387.5 4.4 11.5 13.1Manufacturing 507.4 514.6 520.4 519.2 -1.2 4.6 11.8Professional & Business Services 318.0 328.2 324.1 330.2 6.1 2.0 12.2Financial Activities 128.0 130.9 128.0 129.5 1.5 -1.4 1.5Construction 123.3 122.9 122.6 118.2 -4.4 -4.7 -5.1Leisure and Hospitality 294.8 295.0 301.4 299.8 -1.6 4.8 5.0Trade, Transportation & Utilities 575.7 581.5 596.7 596.8 0.1 15.3 21.1.....Trade 437.4 440.1 448.6 448.5 -0.1 8.4 11.1.....Transportation, Warehousing & Utilities 138.3 141.4 148.1 148.3 0.2 6.9 10.0All Other 169.1 168.3 169.6 169.5 -0.1 1.2 0.4
0.0 0.0 0.0Total Private 2,555.0 2,582.9 2,610.0 2,614.8 4.8 31.9 59.8Government (Includes Public Schools & Hospitals)
424.9 429.2 432.9 429.0 -3.9 -0.2 4.1Total Nonfarm 2,979.9 3,012.1 3,042.9 3,043.8 0.9 31.7 63.9
0.0 0.0 0.0United States Total Private 117,295.0 118,690.0 119,938.0 120,148.0 210.0 1,458.0 2,853.0

Indiana Department of Workforce Development | October 2015
7
SECTON A: ECONOMIC ANALYSIS A1 Current (2014) Employment
INDIANA EMPLOYMENT, FIRMS, AND WAGES BY INDUSTRY, 2014
Industries Average Annual
Wage Units
Total Annual
Wages (in billions)
Average Employment
Total $42,552 158,330 $123 2,890,869 Manufacturing $57,666 8,431 $29 507,198 Health Care and Social Assistance $44,061 13,059 $18 404,010
Retail Trade $25,091 20,364 $8 319,138 Accommodation and Food Services $14,252 12,701 $4 254,685
Educational Services $38,317 3,065 $10 250,475 Administrative and Waste Services $28,325 8,826 $5 184,666
Transportation and Warehousing $42,617 6,224 $6 134,066
Public Administration $43,699 2,840 $6 125,677 Construction $52,500 14,422 $7 123,086 Wholesale Trade $60,286 13,282 $7 117,805
Source: Quarterly Census of Employment and Wages Major Industries, Composition
19%
15%
12%
9%9%
7%
5%
5%
5%
4%
4% 3% 3%
2014 - % of total Emp Manufacturing
Health Care and SocialAssistanceRetail Trade
Accommodation and FoodServicesEducational Services
Administrative and WasteServicesTransportation andWarehousingPublic Administration
Construction
Wholesale Trade
Professional and TechnicalServicesFinance and Insurance
Other Services

Indiana Department of Workforce Development | October 2015
8
Table 1 Indiana Statewide Employment Change Source: Indiana Quarterly Census of Employment and Wages (Public and Private)
Industry 2009 2014 Change %
Change Total 2,705,346 2,890,869 185,523 7%
Manufacturing 442,280 507,198 64,918 15% Administrative and Waste Services 140,170 184,666 44,496 32% Health Care and Social Assistance 378,123 404,010 25,887 7% Accommodation and Food Services 235,262 254,685 19,423 8% Transportation and Warehousing 122,658 134,066 11,408 9% Retail Trade 308,142 319,138 10,996 4% Professional and Technical Services 96,086 106,041 9,955 10% Management of Companies and Enterprises 27,518 28,944 1,426 5% Other Services 80,503 83,348 2,845 4% Construction 120,318 123,086 2,768 2% Wholesale Trade 115,272 117,805 2,533 2% Agriculture, Forestry, Fishing, and Hunting 12,449 14,591 2,142 17% Mining 6,291 6,893 602 10% Real Estate and Rental and Leasing 33,931 34,044 113 0% Utilities 16,867 16,051 -816 -5% Finance and Insurance 95,149 93,298 -1,851 -2% Arts, Entertainment, and Recreation 44,031 41,665 -2,366 -5% Information 44,483 41,965 -2,518 -6% Educational Services 254,204 250,475 -3,729 -1% Public Administration 131,339 125,677 -5,662 -4%
From 2009 to 2014 total employment grew by 7% overall for all industries, including both public and private employment. This is measured from the Quarterly Census of Employment and Wages, annual average employer reported data. This is the most recent full year of data at the time of this report. QCEW is the best measure of true employment levels, from which other surveys (such as the CES cited in the introduction) are benchmarked annually. Gains over this five year period of recession and recovery were dominated by growth in a few key sectors in Indiana. Manufacturing saw the largest declines throughout the recession, and has also seen the largest comeback in raw numbers with gains of nearly 65,000 (15%) since 2009. Administrative support services (which includes employment services and temp labor) also saw significant gains over this time frame, 32% growth. These two sectors alone account for over 100,000 of the 185,000 jobs gained in the past five years. Many of the temp jobs may be in manufacturing as some employers have moved away from full time labor; however there have also been significant gains in health care, social services, transportation and warehousing, and in retail and wholesale trade. Many of these industries have also began to utilize temporary help services in recent years.

Indiana Department of Workforce Development | October 2015
9
Industries showing the highest employment increases from 2009 to 2014: Manufacturing Indiana manufacturers grew employment by 64,918 over this time frame, a growth rate of 15% as the fastest growing industry for Indiana. The latest CES survey job estimates for August of 2015 indicate continued growth for Manufacturing, with an additional 5,400 jobs since the start of 2015. The gains have been led by transportation equipment manufacturing, fabricated metals, and other supply chain industries for the automotive industry. This is an industry that pays wages greater than average, with weekly wages at $1,109 on average during 2014. Administrative Support and Waste Services This industry has grown by 44,496 over this five year period, at a rate of 32%. Gains have been dominated by growth in temporary employment services. Once concentrated in office support or manufacturing, recent growth indicates employment services now provide temporary labor to a wide variety of industries throughout the state. Wages for these industries vary widely, and the weekly averages may include part time workers. During 2014 the average weekly wage for this industry was $545. Health Care and Social Assistance Health care and social assistance facilities have grown by 7% in the last 5 years, an increase of 25,887 employed. This sector remains strong in 2015, showing gains of over 11,000 since January 2015 according to the latest CES August 2015 data. This sector growth includes physicians’ offices, hospitals, and a wide range of providers. Wages in this industry averaged just above the statewide total, at $847 weekly for 2014. Accommodation and Food Services The hospitality and food service industries have rebounded at a rate of 8% since 2009, growing 19,423 jobs. While many of these jobs are lower or middle wage jobs, growth in these industries indicates growth in consumer spending and confidence and may indicate positive economic trends for the state. This industry includes many part time workers, and average weekly wages were just $274 during 2014. Transportation and Warehousing Trucking, logistics, and warehousing has also seen a boom over the last five years, gaining 11,408 jobs at a rate of 9%. This industry has grown another 5,000 since the start of 2015. This industry pays nearly the statewide average, with weekly wages averaging $820 throughout 2014.
Industries showing decline from 2009 to 2014: The following industries have shown employment declines over the time frame from 2009 to 2014. This is based on the annual average estimates from QCEW, and includes public and private jobs. Finance and Insurance This sector has declined by 1,851 at a rate of 2%. These losses were predominantly in companies in credit intermediation and related activities. Insurance carriers actually gained slightly over the last five years. This industry makes up a small % of total employment for Indiana, and pays average weekly wages of $1,222.

Indiana Department of Workforce Development | October 2015
10
Arts, Entertainment, and Recreation As some of the entertainment industry still recovers from the recession, this industry lost 2,366 over the last five years, at a decline of 5%. Most of these losses were in performance and spectator sports companies, or in the gambling industries. This is also an industry with a share of part time workers, and average weekly wages were $578 in 2014. Information The information sector is a small section of Indiana’s economy, and lost 2,518 jobs at a rate of 6% decline from 2009 to 2014. This sector includes publishing, telecommunications, and internet broadcasting which all saw moderate declines over these years. Average weekly wages were above the state average, at $956 during 2014. Utilities This remains one of the highest paying, yet smallest sectors of the economy in Indiana. During 2009 to 2014 this industry declined by 5%, which was a loss of 816 employment. Average weekly wages were $1,615 in 2014. Educational Services This sector declined at a rate of just 1%, losing 3,729 jobs over this five year period. These jobs pay an average weekly wage under the statewide average at $737 in 2014. Employment in this industry includes private schools, and may also include early education programs. Public Administration Government saw the largest declines over this time frame, down 4% and 5,662 in employment. The largest declines were in executive, legislative, and other support, justice, and public order activities, and administration of economic programs. Wages in public administration fall slightly below the statewide average at $840 in 2014.

Indiana Department of Workforce Development | October 2015
11
Table 2 Indiana Statewide Total Payrolls PRIVATE SECTOR 2013-14 1 to 2013-14 4
Summary of Year-to-Year Change in Quarterly Payrolls (as %) (sorted by Q4 Payroll)
13-14:Q1 Chg
13-14:Q2 Chg
13-14:Q3 Chg
13-14:Q4 Chg 2014 Q4 Payroll
Total Private 3.10% 3.10% 3.50% 6.00% $28,293,907,452 Manufacturing 4.20% 4.90% 5.30% 7.40% $7,560,236,360 Health Care & Social Assist 1.30% 1.30% 2.90% 4.30% $4,336,387,215 Retail Trade 1.20% 2.80% 3.10% 7.10% $2,145,271,883 Wholesale Trade 5.10% 3.00% 4.90% 6.00% $1,912,302,426
Construction -9.30% -4.60% 0.20% 4.00% $1,830,936,606 Professional & Technical Services 3.90% 2.50% -0.50% 5.50% $1,762,644,238
Finance & Insurance 9.60% 2.00% 2.10% 4.80% $1,480,352,116 Admin & Support & Waste Mgmt. 5.80% 7.40% 7.00% 6.80% $1,423,546,131
Transportation & Warehousing 4.60% 5.50% 5.70% 7.60% $1,309,899,346
Accomm. & Food Services 0.80% 2.90% 3.40% 5.30% $946,739,615
Management of Companies 10.10% 7.00% -1.10% 8.50% $699,856,143
Other Services 2.30% 3.70% 4.40% 6.20% $643,058,718
Information -0.90% 1.10% 1.80% 2.60% $493,708,661
Educational Services 2.20% 2.40% 3.40% 3.20% $474,995,109 Arts, Entertainment & Recreation -3.90% 2.10% -2.70% 5.40% $356,758,702
Real Estate 14.00% 3.90% 5.70% 7.40% $344,887,184
Utilities 3.90% 1.80% 0.50% 1.70% $292,362,410
Agriculture, Forestry 7.10% 7.90% 5.80% 6.90% $148,351,446
Mining 0.10% 7.90% 9.30% 6.70% $131,124,936 Source IDWD Quarterly Census of Employment and Wages, data not seasonally adjusted Wages Average annual/weekly wages are affected by the ratio of full-time to part-time workers as well as the number of individuals in high-paying vs. low-paying occupations. Table 2 shows the quarterly payroll change from the same quarter a year earlier. In the first quarter of 2014 wages in construction, arts entertainment and recreation and information all lost ground compared to 2013. As the year went on all of the industry sectors gained ground in the fourth quarter 2014 on the same quarter in the previous year. Over the longer time frame, all twenty of Indiana’s industry sectors had an increase in annual average wages from 2009 to 2014 (Table 2a below). Some sectors experienced a more dramatic percentage change while other sectors were a little more modest in their increase. Real estate and rental and leasing gained 21.9% in wages from 2009 to 2014. This was followed closely by management of companies and enterprises (21.8%), finance and insurance (21.8%) and mining (19.9%). The lowest percentage increases were educational services at 4.6% and arts entertainment and recreation at 6.5% for the five year period.

Indiana Department of Workforce Development | October 2015
12
Table 2a Indiana Statewide Data INDIANA AVERAGE WEEKLY WAGES BY INDUSTRY (2009 and 2014 comparison)
2008 2009 2014 % Change
From 2009
Management of Companies and Enterprises $1,393 $1,387 $1,689 21.8% Utilities $1,359 $1,374 $1,615 17.5% Mining $1,120 $1,112 $1,333 19.9% Finance and Insurance $1,018 $1,004 $1,222 21.8% Professional and Technical Services $1,036 $1,029 $1,177 14.4% Wholesale Trade $1,009 $1,000 $1,159 16.0% Manufacturing $1,007 $1,007 $1,109 10.1% Construction $908 $905 $1,010 11.6% Information $836 $839 $956 13.9% Health Care and Social Assistance $755 $770 $847 10.1% Public Administration $753 $772 $840 8.8% Transportation and Warehousing $754 $747 $820 9.8% Real Estate and Rental and Leasing $635 $632 $770 21.9% Educational Services $688 $705 $737 4.6% Agriculture, Forestry, Fishing, and Hunting $583 $580 $689 18.9% Arts, Entertainment, and Recreation $564 $544 $579 6.5% Other Services $493 $492 $561 14.0% Administrative and Waste Services $501 $512 $545 6.4% Retail Trade $437 $440 $483 9.7% Accommodation and Food Services $244 $249 $274 10.2%
Source IDWD Quarterly Census of Employment and Wages Private sector wages vary across the state economic growth regions. The following map illustrates the average employment during 2014, and the average weekly wages for private employment in each of Indiana’s regions. Wages vary as industry composition and cost of living is different throughout the state. Marion County and Economic Growth Region 1 had average wages above the statewide average during 2014.

Indiana Department of Workforce Development | October 2015
13

Indiana Department of Workforce Development | October 2015
14
A2 Existing Demand
Current demand from employers, as measured from online jobs postings: Online job postings for new jobs have increased over the last few years. This includes data from the US Conference Board’s Help Wanted Online Series (HWOL), and Indiana’s Labor Exchange System, Indiana Career Connect (ICC) From HWOL: Employers posted approximately 88,671 total online job ads in Indiana during July of 2015, this was up slightly over the month from 87,035 (1.9%) in June. This is an increase of 2,754 over the year from July of 2014. Job Ads have shown steady increases in 2013 and 2014. The June Supply/Demand rate for Indiana declined to 1.8 unemployed for every job ad. This is down 0.4 over the year and just slightly higher than the national average of 1.6 per job ad. This is down significantly since the peak of over 8 unemployed persons per online job ad during the summer of 2009. As more employers are now posting online for potential job vacancies than prior to the recession, it is hard to look back historically for a longer term comparison. This significant decline in the ratio of unemployed per online ad is indicative of what employers may be interpreting as a labor shortage throughout the state.

Indiana Department of Workforce Development | October 2015
15

Indiana Department of Workforce Development | October 2015
16
Online job posting demand varies by industry, and some industries often over represent true demand. Some employers may post a lot of openings as they search for the best candidate, and some industries such as construction and manufacturing may only hire locally via other avenues. Posting demand also varies significantly across urban and rural areas, as rural areas are underrepresented in online ads. Nevertheless, this data does illustrate employer demand by occupation and can be useful for career counselors and jobs seekers. Demand for healthcare practitioners, business and financial operations, office administrative support, and food prep show the most growth in online posting demand since last July. Sales and related have seen the most over the year declines. For a complete listing of the top posted jobs by Economic Growth Region, please see the appendix to this report.
Labor Demand by Occupation, Not Seasonally Adjusted - Total Ads (000s)Source: The Conference Board
Occupation Jul-14 Jun-15 Jul-15Change over the Month
Change over the Year
Average Hourly Wage (OES)
Total 86.8 90.9 89.5 -1.5 2.7 19.94$ Management 7.2 7.0 6.6 -0.4 -0.6 44.71$ Business and financial operations 3.8 4.1 4.1 0.0 0.3 30.17$ Computer and mathematical 5.7 6.0 5.7 -0.3 0.1 33.41$ Architecture and engineering 3.5 3.8 3.3 -0.4 -0.2 33.23$ Life, physical, and social science 0.9 0.9 0.8 -0.1 -0.1 $ 28.17 Community and social services 1.6 1.5 1.5 0.0 -0.1 20.00$ Legal 0.2 0.2 0.2 0.0 0.0 36.53$ Education, training, and library 2.4 2.7 2.6 -0.1 0.1 22.58$ Arts, design, entertainment, sports, and media 1.8 1.9 1.9 0.0 0.1 20.35$ Healthcare practitioners and technical 8.1 10.9 10.7 -0.2 2.6 33.83$ Healthcare support 2.4 2.4 2.5 0.1 0.1 13.02$ Protective service 0.8 0.7 0.7 0.0 0.0 18.00$ Food preparation and serving related 3.1 3.2 3.3 0.1 0.2 9.73$ Building and grounds cleaning and maintenance 1.9 2.0 1.9 -0.2 0.0 11.89$ Personal care and service 1.0 0.9 0.9 0.0 0.0 10.82$ Sales and related 11.3 9.7 9.3 -0.3 -2.0 17.05$ Office and administrative support 8.8 9.1 9.5 0.4 0.8 15.76$ Farming, fishing, and forestry 0.1 0.1 0.1 0.0 0.0 14.21$ Construction and extraction 2.4 2.1 1.8 -0.3 -0.6 23.55$

Indiana Department of Workforce Development | October 2015
17
Top Skills and Certifications in Demand Statewide from Online Job Posting Data: Source: HWOL, see appendix for full listing The top listed skill (soft skills) by far, is oral and written communication skills, with 23,500 online ads listing this skill requirement with the latest online job data from August 2015. This is followed by marketing listed by 9,449 ads, integrity listed by 9,198, team-oriented listed by 9,027, and customer service oriented listed by 8,226. Specialized or technical skills listed in highest demand include quality assurance (QA), listed by 2,834 ads, application process listed by 1,812 ads, food preparation listed by 1,563, bilingual listed by 1,534 ads and preventative maintenance inspections listed by 1,480. The top certifications in demand from advertising employers, include drivers’ licenses, CDLs, certifications in Cardiopulmonary Resuscitation (CPR), HAZMAT, Basic Life Support (BLS) and Continuing Education (CE).

Indiana Department of Workforce Development | October 2015
18

Indiana Department of Workforce Development | October 2015
19
Supply and Demand as illustrated by Indiana Career Connect Job Postings and Applicants: Internal job orders for total positions are up by approximately 3,000 since last August, and all ICC job orders are up by nearly 6,000. New monthly applicants are up from 4,767 to 25,476 in August of 2015 from last August. The chart below illustrates concentration by major occupational group. The majority of internal job orders are from transportation and material moving occupations (truck drivers), office and administrative support, and health care practitioners (nurses), and the majority of applicants still fall under production or office occupations. However, given the significant increase in applicants over the last year the labor exchange system is clearly reaching new audiences of jobs seekers.

Indiana Department of Workforce Development | October 2015
20
A3 Emerging Demand Hoosier Hot 50 Jobs The 2014 Hoosier Hot 50 Jobs is a list of high growth rate occupations (both short-term and long-term) with wages at or above the state median. The occupations are ranked according to a single index of weighted occupational measures of growth and opportunity. Interviews and descriptions of the full listing can be found online. https://netsolutions.dwd.in.gov/hh50/joblist.aspx Statewide Hoosier Hot 50
Job Title 2022 Demand
Annual Openings
Average Wage Education
1 Registered Nurses 69,748 2,197 $58,320 Associate’s Degree
2 K-12 Teachers 72,210 2,221 $51,173 Bachelor’s/Master’s degree
3 Truck Drivers 49,651 1,185 $40,990 Short Term on the Job Training
4
Sales Representatives, Wholesale and Manufacturing
33,891 922 $53,790 Moderate on the Job Training
5
General and Operations Managers 32,758 878 $107,460 Bachelor's degree
6 Licensed Practical Nurses 23,268 886 $40,070 Postsecondary Vocational Training
7 Postsecondary Teachers 34,696 779 $72,349 Bachelor’s/Master’s Degree
8 Accountants and Auditors 21,896 813 $64,880 Bachelor’s Degree
9 First-Line Supervisors of Office and Administrative Support Workers
26,041 821 $49,920 High School diploma or equivalent
10 Electricians 16,684 495 $59,110 High School diploma or
equivalent
Some variation among the Regional Hot 50 Lists. Some jobs making the top 10 in some of the Economic Growth Regions include:
• Industrial Machinery Mechanics • Construction Laborers • First-Line Supervisors of Retail Sales Workers • Inspectors, Testers, Sorters, Samplers, and Weighers • Customer Service Representatives • Machinists

Indiana Department of Workforce Development | October 2015
21
• Maintenance and Repair Workers • Accountants and Auditors • Team Assemblers • Bookkeeping, Accounting, and Auditing Clerks • Physicians and Surgeons • Secretaries and Administrative Assistants • Mechanical Engineers
For a thorough listing of the Regional Hot 50 Jobs, please see the appendix. The occupational projections program provides projected job growth for approximately 800 SOC coded and defined occupations within Indiana. The Hot 50 Jobs is a subset of this list, to illustrate the jobs most in demand over the next decade, and those that will pay above average wages. The projections analysts can tailor these lists to economic growth regions throughout the state, and filter them according to industry or required educational attainment. The list below is similar to the Hot 50, but illustrates concentrated demand over a shorter-time frame to 2016.
Job Title 2016
Demand Annual
Openings Education
1 Truck Drivers 50,312 1,822 Postsecondary
Vocational Training
2 K-12 Teachers 68,408 2,066 Bachelor’s/Master’s degree
3 Sales Representatives, Wholesale and Manufacturing
33,788 1,382 Short Term on the Job Training
4 Registered Nurses 59,668 1,368 Associate’s Degree
5
General and Operations Managers 30,944 1,014 Bachelor's degree
6 Accountants and Auditors 22,094 990 Bachelor’s Degree
7 Maintenance and Repair Workers General 30,665 1,006 High School diploma or
equivalent
8 First-Line Supervisors of Production and Operating Workers
24,279 766 Postsecondary non-degree award
9
First-Line Supervisors of Office and Administrative Support Workers
24,152 851 High School diploma or equivalent
10
First-Line Supervisors of Retail Sales Workers 35,605 958 High School diploma or
equivalent
Indiana Department of Workforce Development | October 2015
22
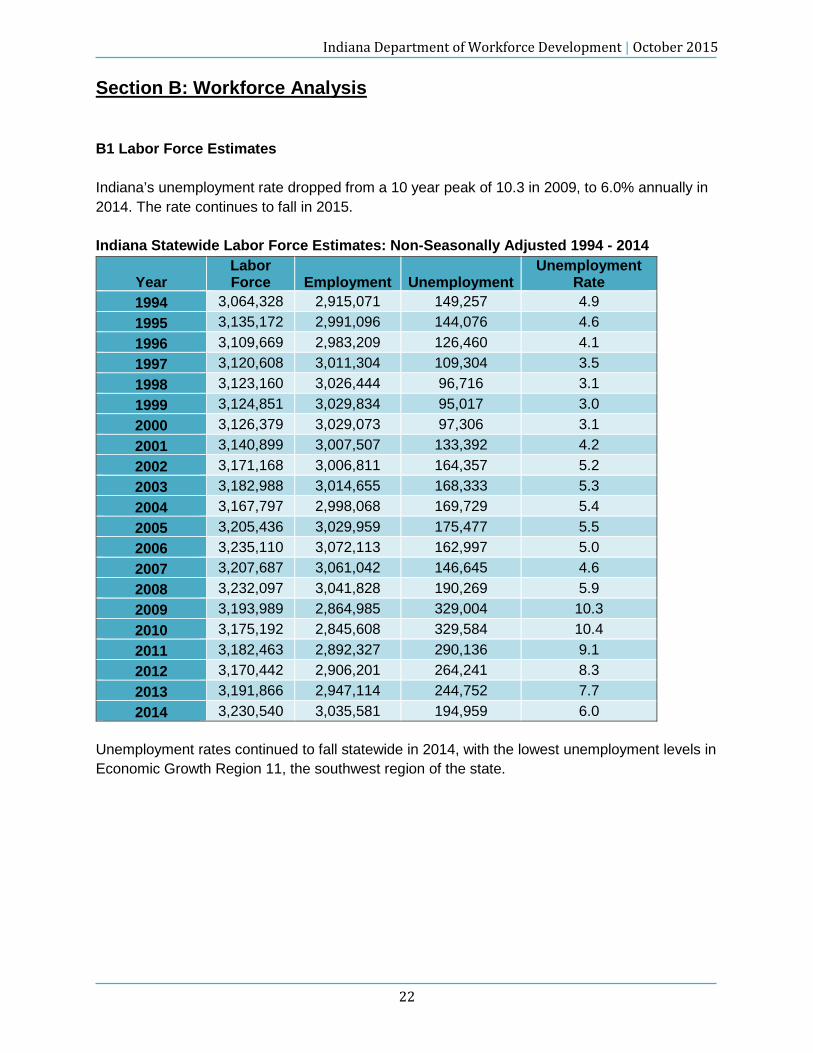
Section B: Workforce Analysis B1 Labor Force Estimates Indiana’s unemployment rate dropped from a 10 year peak of 10.3 in 2009, to 6.0% annually in 2014. The rate continues to fall in 2015. Indiana Statewide Labor Force Estimates: Non-Seasonally Adjusted 1994 - 2014
Year Labor Force Employment Unemployment
Unemployment Rate
1994 3,064,328 2,915,071 149,257 4.9 1995 3,135,172 2,991,096 144,076 4.6 1996 3,109,669 2,983,209 126,460 4.1 1997 3,120,608 3,011,304 109,304 3.5 1998 3,123,160 3,026,444 96,716 3.1 1999 3,124,851 3,029,834 95,017 3.0 2000 3,126,379 3,029,073 97,306 3.1 2001 3,140,899 3,007,507 133,392 4.2 2002 3,171,168 3,006,811 164,357 5.2 2003 3,182,988 3,014,655 168,333 5.3 2004 3,167,797 2,998,068 169,729 5.4 2005 3,205,436 3,029,959 175,477 5.5 2006 3,235,110 3,072,113 162,997 5.0 2007 3,207,687 3,061,042 146,645 4.6 2008 3,232,097 3,041,828 190,269 5.9 2009 3,193,989 2,864,985 329,004 10.3 2010 3,175,192 2,845,608 329,584 10.4 2011 3,182,463 2,892,327 290,136 9.1 2012 3,170,442 2,906,201 264,241 8.3 2013 3,191,866 2,947,114 244,752 7.7 2014 3,230,540 3,035,581 194,959 6.0
Unemployment rates continued to fall statewide in 2014, with the lowest unemployment levels in Economic Growth Region 11, the southwest region of the state.

Indiana Department of Workforce Development | October 2015
23
Indiana Regional Labor Force Data INDIANA ECONOMIC GROWTH REGIONS (EGRs), LABOR FORCE AND
UNEMPLOYMENT (N.S.A.), 2014
Region Labor Force Employment Unemployment Unemployment Rate
EGR 1 403,574 373,158 30,416 7.5 EGR 2 304,843 286,956 17,887 5.9 EGR 3 371,833 350,911 20,922 5.6 EGR 4 245,562 231,782 13,780 5.6 EGR 5 969,397 914,049 55,348 5.7 EGR 6 155,552 144,965 10,587 6.8 EGR 7 101,059 93,526 7,533 7.5 EGR 8 147,245 137,721 9,524 6.5 EGR 9 164,585 155,305 9,280 5.6
EGR 10 144,660 136,429 8,231 5.7 EGR 11 222,229 210,779 11,450 5.2
Source: IDWD, Local Area Unemployment Statistics (LAUS) Region 5 EGR data in this publication includes Marion County Region 12. Unemployment Rates Table 4 Indiana and U.S. Non-Seasonally Adjusted Annual Averages
Year Indiana U.S. 1994 4.9 6.1 1995 4.6 5.6 1996 4.1 5.4 1997 3.5 4.9 1998 3.1 4.5 1999 3.0 4.2 2000 3.1 4.0 2001 4.2 4.7 2002 5.2 5.8 2003 5.3 6.0 2004 5.4 5.5 2005 5.5 5.1 2006 5.0 4.6 2007 4.6 4.6 2008 5.9 5.8 2009 10.3 9.3 2010 10.4 9.6 2011 9.1 8.9 2012 8.3 8.1 2013 7.7 7.4 2014 6.0 6.2
Indiana Department of Workforce Development | October 2015
24
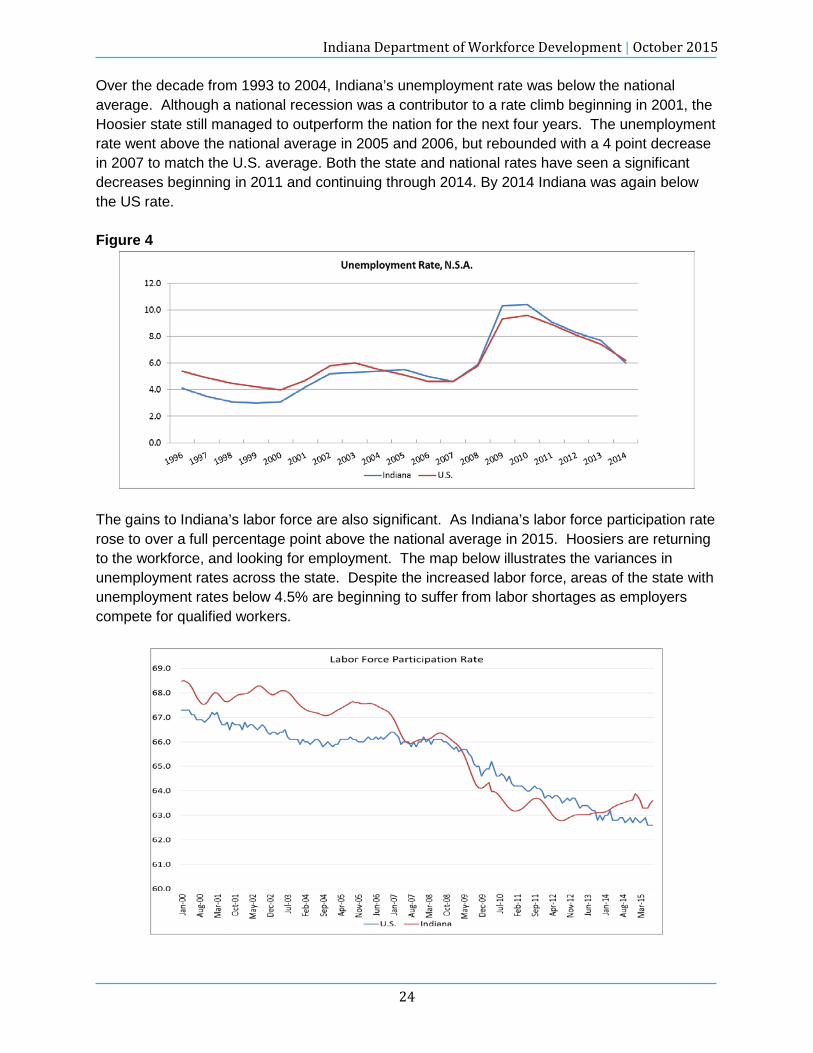
Over the decade from 1993 to 2004, Indiana’s unemployment rate was below the national average. Although a national recession was a contributor to a rate climb beginning in 2001, the Hoosier state still managed to outperform the nation for the next four years. The unemployment rate went above the national average in 2005 and 2006, but rebounded with a 4 point decrease in 2007 to match the U.S. average. Both the state and national rates have seen a significant decreases beginning in 2011 and continuing through 2014. By 2014 Indiana was again below the US rate. Figure 4
The gains to Indiana’s labor force are also significant. As Indiana’s labor force participation rate rose to over a full percentage point above the national average in 2015. Hoosiers are returning to the workforce, and looking for employment. The map below illustrates the variances in unemployment rates across the state. Despite the increased labor force, areas of the state with unemployment rates below 4.5% are beginning to suffer from labor shortages as employers compete for qualified workers.

Indiana Department of Workforce Development | October 2015
25

Indiana Department of Workforce Development | October 2015
26
Region 5 EGR data in this publication includes Marion County Region 12.

Indiana Department of Workforce Development | October 2015
27
Unemployment Claims by Industry Manufacturing, construction and administrative and support services sectors account for 54% of the claims for unemployment insurance filed in Indiana during 2014.These industries are especially vulnerable during difficult economic times. During the 2008 to 2014 time frame manufacturing and construction accounted for 44% of all UI Claims. (See Figures 5 & 6) Unemployment Insurance claims have declined significantly throughout 2014 and are now at the lowest levels in over a decade. For additional analysis on the demographics of UI Claimant beneficiaries by economic growth region, please see the appendix. Figure 5 & 6
Construction23%
Manufacturing18%
Admin. and Support
13%
All Other46%
INDIANA 2014 CLAIMS BY INDUSTRY

Indiana Department of Workforce Development | October 2015
28
B2 Workforce and Industry Composition Age Groups of the Workforce Indiana’s workforce distribution is shown in Figure 6. The 2008 to 2013 American Community Survey (ACS) data shows the two youngest age groups were composed of somewhat modest employment before spiking dramatically at the 25-44 age range. This is consistent with prior years. Specific data shows that 1.251 million Indiana workers were between the ages of 25 and 44; 698,931of the workers were between the ages of 45 and 54; and 483,105 of the workers were between the ages of 55 and 64. These numbers decrease significantly as many of Indiana’s employees enter the most common age ranges (65+) for retirement. See Figure 7. Figure 7
As many young Hoosiers complete their college educations, there is a resulting surge in the employment concentration within the 25-34 age groups. Yet the percentage of Indiana workers in the 25-34 age group is higher for some industry sectors than others. Listed in (Table 7) are the top 5 industry sectors with the highest concentration of workers in the 25-34 age group during 2012. Table 7 Sectors with Highest Percentage of Employment 25-34 Source: U.S. Census Bureau, Local Employment Dynamics *Data is for 3Q2013, 4Q2013, 1Q2014, 2Q2014)
Industry Sector
(25-34 Age Group)
(All Age Groups)
% of (25-34 Age Group) Employed
in Sector
Manufacturing 94,395 501,812 18.8% Health Care and Social Assistance 88,225 395,546 22.3% Retail Trade 66,629 316,290 21.1% Accommodation and Food Services 57,872 248,475 23.3% Administrative and Support and Waste Management and Remediation Services 49,084 182,844 26.8%
0
200,000
400,000
600,000
800,000
1,000,000
1,200,000
1,400,000
16-19 20-24 25-44 45-54 55-64 65-74 74 +Source: 2009 - 2013 ACS 5-Year Estimates
2013 Indiana Employment Distribution by Age Groups

Indiana Department of Workforce Development | October 2015
29
B3 Education Rates of educational attainment are on the rise for Indiana. Since 2014 the % of the population 25 and older with a Bachelor’s degree or higher, has risen from 19.4% to 24.8% as illustrated below. Nevertheless, there are still significant portions of Indiana’s population without a high school diploma. Certain areas of the state illustrate greater numbers at risk and in need of continued and higher education programs.
EDUCATION ATTAINMENT, IN 2000 to 2014 2000 Pct. Of Pop.
25+ 2013 Pct. Of Pop. 25+ 2014 Pct. Of
Pop. 25+ Total Population
25+ 3,893,278 100% 4,312,892 100% 4,312,892 100%
Less than High School Graduate 695,540 17.9% 534,799 12.4% 503,778 11.7%
High School Graduate (incl. equivalency)
1,447,734 37.2% 1,479,322 34.3% 1,489,620 34.5%
Some college less than Bachelor's 994,391 25.5% 1,272,303 29.5% 1,285,503 29.8%
Bachelor's or Higher Degree 755,613 19.4% 1,026,468 23.8% 1,068,357 24.8%
Source: U.S. Census Bureau & American Community Survey
Figure 1
Source: U.S. Bureau of Census, American Community Survey (ACS)

Indiana Department of Workforce Development | October 2015
30

Indiana Department of Workforce Development | October 2015
31
B4 Housing Homeownership Rates According to data from the U.S. Bureau of Census’s Housing Vacancy Survey (HVS), from 2005 to 2014 Indiana maintained a higher percentage of homeownership in comparison to the Midwest region as a whole. In 2005, Indiana had a rate of 75.0% in comparison to the Midwest’s 73.1%. Indiana maintained the higher rate during the entire time frame from 2005-2012. In 2014, the state finished with a homeownership rate of 70.1% to the Midwest’s 69.0%. For a year by year comparison, see Figure 7. Figure 7
Source: U.S. Bureau of Census, Housing Vacancy Survey (HVS) *Midwest: Illinois, Indiana, Michigan, Ohio, Wisconsin, Iowa, Kansas, Minnesota, Missouri, Nebraska North Dakota, South Dakota
66
67
68
69
70
71
72
73
74
75
2005 2006 2007 2008 2009 2010 2011 2012 2013 2014
% R
ate
Year
Indiana and Midwest Homeownership Rates (2005 - 2014)
Indiana
Midwest
Indiana Department of Workforce Development | October 2015
32
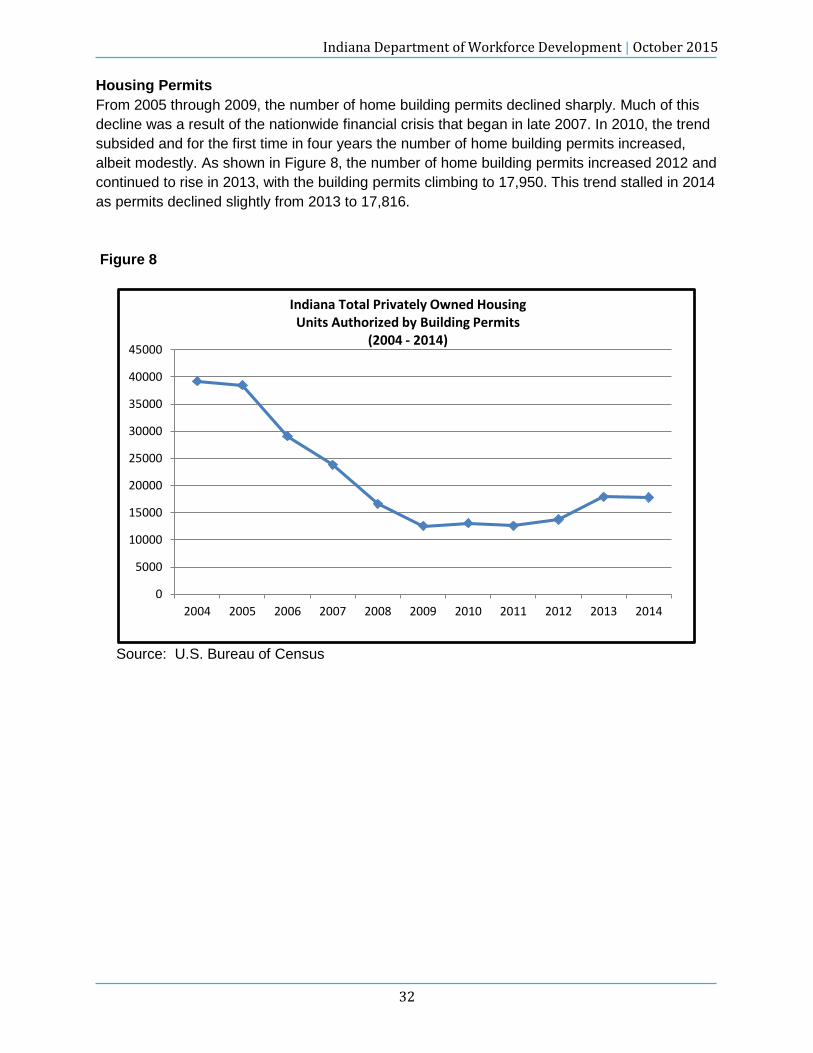
Housing Permits From 2005 through 2009, the number of home building permits declined sharply. Much of this decline was a result of the nationwide financial crisis that began in late 2007. In 2010, the trend subsided and for the first time in four years the number of home building permits increased, albeit modestly. As shown in Figure 8, the number of home building permits increased 2012 and continued to rise in 2013, with the building permits climbing to 17,950. This trend stalled in 2014 as permits declined slightly from 2013 to 17,816. Figure 8
Source: U.S. Bureau of Census
0
5000
10000
15000
20000
25000
30000
35000
40000
45000
2004 2005 2006 2007 2008 2009 2010 2011 2012 2013 2014
Indiana Total Privately Owned HousingUnits Authorized by Building Permits
(2004 - 2014)

Unemployment Insurance (UI) Claimant Pool Analysis
Contact for questions or additional information:
Olga VolokhovaBusiness & Workforce Studies/Data Team ManagerDepartment of Workforce Development10 N. Senate Ave. Rm SE 207Indianapolis, IN 46204Phone: 317-233-2697
Indiana Statewide
February 2015-July 2015
This report is a profile of UI Claimants receiving benefits for Unemployment Insurance. The numbers presented in this profile do not represent the total unemployed population.
1

All NAICS Combined Claimants by Month
Indiana Statewide
February 2015-July 2015
MonthContinued
ClaimsInitial
ClaimsUnique
Claimants
Feb-2015 148,432 17,730 56,908
Mar-2015 128,495 14,351 52,466
Apr-2015 98,839 14,557 43,827
May-2015 104,988 13,660 39,012
Jun-2015 81,542 14,872 37,236
Jul-2015 81,277 15,754 38,912
Note that continued claims counts may include multiple claims for the same individual.
2

All NAICS Combined Claimants by Indiana City of Residence
Indiana Statewide
February 2015-July 2015
City Name Claimants % of Total
Indianapolis 19,985 16.70%
Fort Wayne 5,979 5.00%
South Bend 3,012 2.52%
Evansville 2,954 2.47%
Terre Haute 2,128 1.78%
Gary 2,105 1.76%
Lafayette 2,035 1.70%
Elkhart 2,007 1.68%
Muncie 1,799 1.50%
Anderson 1,764 1.47%
Bloomington 1,733 1.45%
Valparaiso 1,543 1.29%
Hammond 1,418 1.18%
Kokomo 1,326 1.11%
Greenwood 1,178 0.98%
Crown Point 1,128 0.94%
Mishawaka 1,035 0.86%
Portage 1,020 0.85%
Columbus 988 0.83%
Michigan City 986 0.82%
Marion 962 0.80%
La Porte 929 0.78%
Hobart 864 0.72%
Noblesville 861 0.72%
Merrillville 846 0.71%
Other 59,104 49.38%
Total 119,689
3

All NAICS Combined Claimants by Indiana County of Residence
Indiana Statewide
February 2015-July 2015
County Name Claimants % of Total
Marion 20,460 17.09%
Lake 10,178 8.50%
Allen 6,671 5.57%
St Joseph 5,069 4.24%
Porter 3,562 2.98%
Elkhart 3,348 2.80%
Vanderburgh 2,956 2.47%
Hamilton 2,917 2.44%
Madison 2,798 2.34%
Tippecanoe 2,613 2.18%
La Porte 2,504 2.09%
Vigo 2,437 2.04%
Johnson 2,243 1.87%
Delaware 2,209 1.85%
Monroe 1,968 1.64%
Hendricks 1,759 1.47%
Clark 1,577 1.32%
Morgan 1,517 1.27%
Howard 1,474 1.23%
Grant 1,388 1.16%
Kosciusko 1,373 1.15%
Lawrence 1,357 1.13%
Wayne 1,234 1.03%
Hancock 1,156 0.97%
Bartholomew 1,149 0.96%
Other 33,772 28.22%
Total 119,689
Out of State 8,446
4
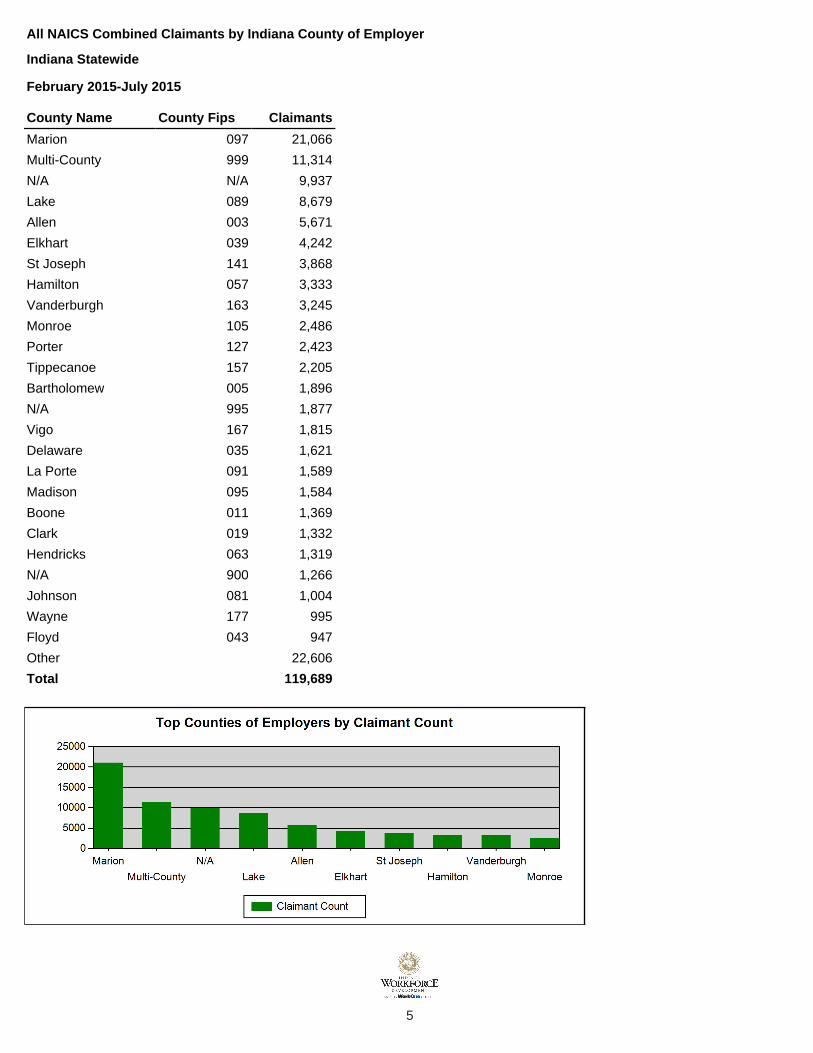
All NAICS Combined Claimants by Indiana County of Employer
Indiana Statewide
February 2015-July 2015
County Name County Fips Claimants
Marion 097 21,066
Multi-County 999 11,314
N/A N/A 9,937
Lake 089 8,679
Allen 003 5,671
Elkhart 039 4,242
St Joseph 141 3,868
Hamilton 057 3,333
Vanderburgh 163 3,245
Monroe 105 2,486
Porter 127 2,423
Tippecanoe 157 2,205
Bartholomew 005 1,896
N/A 995 1,877
Vigo 167 1,815
Delaware 035 1,621
La Porte 091 1,589
Madison 095 1,584
Boone 011 1,369
Clark 019 1,332
Hendricks 063 1,319
N/A 900 1,266
Johnson 081 1,004
Wayne 177 995
Floyd 043 947
Other 22,606
Total 119,689
5

All NAICS Combined Claimants by Occupational Group Based on Self-Reported SOC Code
Indiana Statewide
February 2015-July 2015
Occupational Group Description SOC Code Claimants % of Total
Construction and Extraction Occupations 470 19,148 16.00%
Production Occupations 510 17,014 14.22%
Transportation and Material Moving Occupations 530 16,670 13.93%
Office and Administrative Support Occupations 430 14,671 12.26%
Management Occupations 110 9,536 7.97%
Installation, Maintenance, and Repair Occs 490 6,812 5.69%
Sales and Related Occupations 410 5,949 4.97%
Building and Grounds Cleaning and Maintenance Occ 370 4,745 3.96%
Food Preparation and Serving Related Occupations 350 4,019 3.36%
Healthcare Support Occupations 310 3,760 3.14%
Healthcare Practitioners and Technical Occupations 290 3,397 2.84%
Business and Financial Operations Occupations 130 3,259 2.72%
Architecture and Engineering Occupations 170 1,926 1.61%
Education, Training, and Library Occupations 250 1,530 1.28%
Arts, Design, Entertainment, Sports, and Media Occ 270 1,484 1.24%
Computer and Mathematical Occupations 150 1,232 1.03%
Protective Service Occupations 330 1,032 0.86%
Personal Care and Service Occupations 390 949 0.79%
Community and Social Services Occupations 210 888 0.74%
Life, Physical, and Social Science Occupations 190 552 0.46%
Farming, Fishing, and Forestry Occupations 450 479 0.40%
Legal Occupations 230 435 0.36%
Military Specific Occupations 550 174 0.15%
Code 000 000 28 0.02%
Total 119,689
6

Claimants by NAICS of Separating Employer
Indiana Statewide
February 2015-July 2015
NAICS Code NAICS Title Claimants % of Total
23 Construction 22,400 18.72%
31-33 Manufacturing 22,389 18.71%
56 Admin. & Support & Waste Mgt. & Rem. Services 15,555 13.00%
N/A No NAICS available 9,937 8.30%
44-45 Retail Trade 9,058 7.57%
62 Health Care and Social Services 9,008 7.53%
72 Accommodation and Food Services 5,404 4.52%
48-49 Transportation and Warehousing 4,578 3.82%
54 Professional, Scientific, and Technical Services 3,741 3.13%
42 Wholesale Trade 3,731 3.12%
61 Educational Services 2,292 1.91%
81 Other Services(Except Public Administration) 2,288 1.91%
52 Finance and Insurance 2,148 1.79%
71 Arts, Entertainment, and Recreation 1,458 1.22%
53 Real Estate and Rental and Leasing 1,359 1.14%
92 Public Administration 1,292 1.08%
51 Information 1,244 1.04%
21 Mining 640 0.53%
55 Management of Companies and Enterprises 554 0.46%
11 Agriculture, Forestry, Fishing and Hunting 436 0.36%
22 Utilities 107 0.09%
99 Unallocated 70 0.06%
Total 119,689
7

All NAICS Combined Claimants by Educational Attainment/Highest Grade Completed
Indiana Statewide
February 2015-July 2015
Category Claimants % of Total
8th Grade or Less 2,109 1.76%
Grades 9-11 11,126 9.30%
H.S. Grad or Equivalent 60,298 50.38%
Post High School Education 44,585 37.25%
Unknown 1,571 1.31%
Total 119,689
8

All NAICS Combined Claimants by Age Group
Indiana Statewide
Age Group Claimants % of Total
16-19 ** **
20-24 9,937 8.30%
25-29 14,821 12.38%
30-34 15,634 13.06%
35-39 14,622 12.22%
40-44 14,292 11.94%
45-49 13,734 11.47%
50-54 14,518 12.13%
55-59 11,891 9.93%
60-64 6,229 5.20%
65+up 2,990 2.50%
Other * *
Total 119,689
Age calculated by Claims File Date - Birthdate
February 2015-July 2015
9

All NAICS Combined Claimants by Gender
Indiana Statewide
February 2015-July 2015
Category Claimants % of Total
Female 44,663 37.32%
Male 74,963 62.63%
N/A 63 0.05%
Total 119,689
10

All NAICS Combined Claimants by Weeks Paid and Average Weekly Payment
Indiana Statewide
February 2015-July 2015
Weeks Unemployed
# of Unique Claimants
Average Proceed Amount ($)
Average Entitlement Amount ($)
1 7,007 229.22 256.02
2 5,990 234.68 261.41
3 5,532 232.78 260.54
4 5,700 229.32 256.53
5 5,456 231.16 258.40
6 5,566 227.79 254.83
7 4,275 235.04 262.75
8 3,957 232.39 259.76
9 3,444 233.09 260.27
10 3,135 233.42 259.16
11 2,755 229.44 256.77
12 2,274 231.81 258.53
13 2,075 225.72 251.97
14 1,864 235.61 261.74
15 1,631 228.28 255.19
16 1,461 229.14 257.34
17 1,320 231.46 258.49
18 1,374 225.37 252.50
19 1,209 225.33 251.96
20 1,090 224.10 251.69
21 846 229.52 254.93
22 741 230.90 259.63
23 759 218.46 243.94
24 607 220.53 245.47
25 298 228.09 256.36
Average Number of Weeks Paid: 8
The number of weeks unemployed represent the number of weeks unemployed within the chosen time frame. These numbers do not represent the overall number of weeks for each person's spell of unemployment and may have additional weeks of unemployment beyond the chosen time frame.
11

Indiana Statewide
February 2015-July 2015
All NAICS Combined Claimants by Weeks Paid and Average Weekly Payment (cont.)
12

Claimant Analysis Scope = Unique Claimants Who Meet the Following Criteria:
Filed a continued claim for compensable weeks ending in February 2015-July 2015 (regardless of payment status)
Filed an initial claim in February 2015-July 2015 (regardless of claim status)
Transaction types of 'RG' (regular) and 'RV' (released vouchers) included.
Grand totals on each page excludes claimants from other states.
All claims types are included in the calculations in this report.
Claims data extracted from the Workforce Warehouse database, designed primarily as a researchdatabase, may not match exactly other counts produced by or for the Employment & Training Administration of the U. S. Department of Labor.
*Data is non-disclosable in this cell due to primary suppression. If a value is less than 10 claimants, but greater than zero, the data is suppressed.
**Data is non-disclosable in this cell due to secondary suppression. In this case, if the value of a non-disclosable data cell can be determined by adding disclosed data and subtracting from the total, the 2nd smallest value is also suppressed.
Methodology Notes
Additional Notes on "Weeks Paid and Average Weekly Payment" page: Other analyses include all claimants, regardless of payment status, so these counts may be smaller.Differences between entitlement amounts and proceeds amounts reflect amounts deducted fortaxes, child support payments and/or employment payment amounts for vacation, holidays, etc.Entitlement amounts are based on employees' wages during the benefit determination period.Proceeds amounts are the actual dollar amounts of the checks that go out to claimants.
Suppression:
The City of Residence, County of Residence, and County of Employer pages only show the top 25 values. The remainder of the values are placed into an "Other" grouping.
13

Glossary of Terms
NAICS = Industry Codes. The North American Industry Classification System (NAICS) is the standard used by Federal statistical agencies in classifying business establishments for the purpose of collecting, analyzing, and publishing statistical data related to the U.S. business economy.
SOC = Occupational Codes. The Standard Occupational Classification (SOC) system is used by Federal statistical agencies to classify workers into occupational categories for the purpose of collecting, calculating, or disseminating data. All workers are classified into one of 840 detailed occupations according to their occupational definition.
14

Regional Listing
Economic Growth Region 1Jasper, La Porte, Lake, Newton, Porter, Pulaski, Starke Counties
Economic Growth Region 2Elkhart, Fulton, Kosciusko, Marshall, St Joseph Counties
Economic Growth Region 3Adams, Allen, De Kalb, Grant, Huntington, Lagrange, Noble, Steuben, Wabash, Wells, Whitley Counties
Economic Growth Region 4Benton, Carroll, Cass, Clinton, Fountain, Howard, Miami, Montgomery, Tippecanoe, Tipton, Warren, White Counties
Economic Growth Region 5Boone, Hamilton, Hancock, Hendricks, Johnson, Madison, Marion, Morgan, Shelby Counties
Economic Growth Region 6Blackford, Delaware, Fayette, Henry, Jay, Randolph, Rush, Union, Wayne Counties
Economic Growth Region 7Clay, Parke, Putnam, Sullivan, Vermillion, Vigo Counties
Economic Growth Region 8Brown, Daviess, Greene, Lawrence, Martin, Monroe, Orange, Owen Counties
Economic Growth Region 9Dearborn, Decatur, Franklin, Jackson, Jefferson, Jennings, Ohio, Ripley, Switzerland Counties
Economic Growth Region 10Clark, Crawford, Floyd, Harrison, Scott, Washington Counties
Economic Growth Region 11Dubois, Gibson, Knox, Perry, Pike, Posey, Spencer, Vanderburgh, Warrick Counties
Economic Growth Regions
15
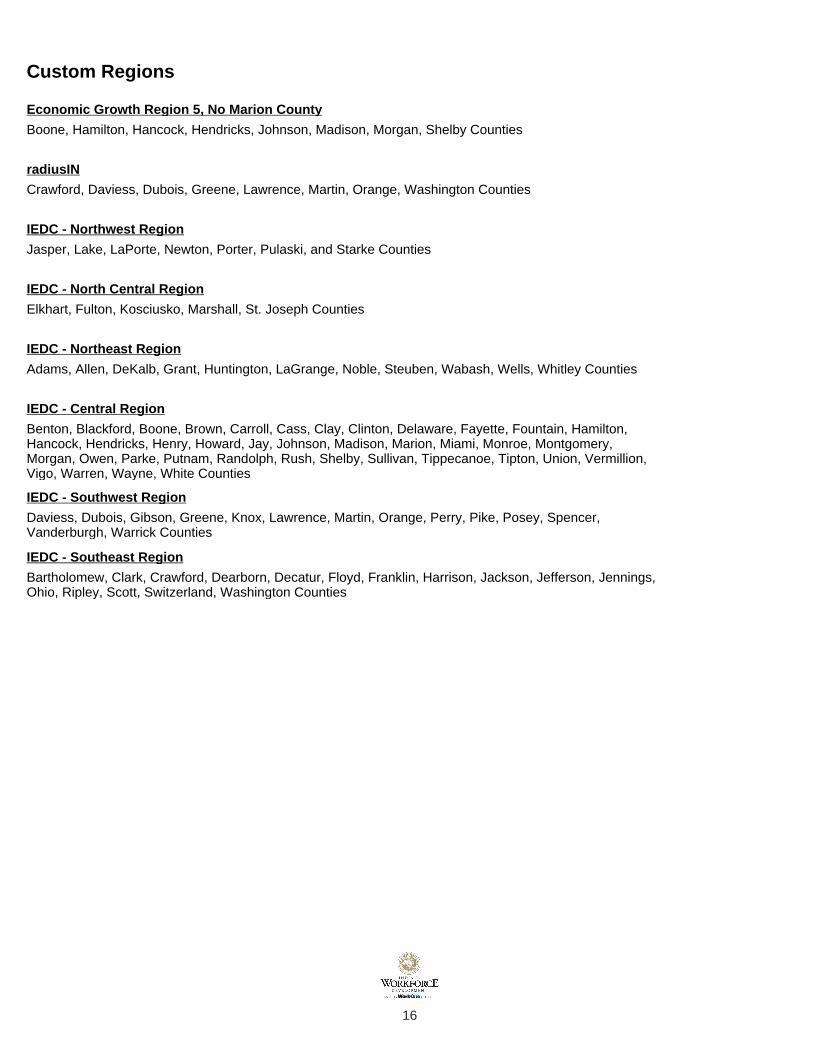
Economic Growth Region 5, No Marion County
Boone, Hamilton, Hancock, Hendricks, Johnson, Madison, Morgan, Shelby Counties
radiusIN
Crawford, Daviess, Dubois, Greene, Lawrence, Martin, Orange, Washington Counties
IEDC - Northwest Region
Jasper, Lake, LaPorte, Newton, Porter, Pulaski, and Starke Counties
IEDC - North Central Region
Elkhart, Fulton, Kosciusko, Marshall, St. Joseph Counties
IEDC - Northeast Region
Adams, Allen, DeKalb, Grant, Huntington, LaGrange, Noble, Steuben, Wabash, Wells, Whitley Counties
IEDC - Central Region
Benton, Blackford, Boone, Brown, Carroll, Cass, Clay, Clinton, Delaware, Fayette, Fountain, Hamilton, Hancock, Hendricks, Henry, Howard, Jay, Johnson, Madison, Marion, Miami, Monroe, Montgomery, Morgan, Owen, Parke, Putnam, Randolph, Rush, Shelby, Sullivan, Tippecanoe, Tipton, Union, Vermillion, Vigo, Warren, Wayne, White Counties
IEDC - Southwest Region
Daviess, Dubois, Gibson, Greene, Knox, Lawrence, Martin, Orange, Perry, Pike, Posey, Spencer, Vanderburgh, Warrick Counties
IEDC - Southeast Region
Bartholomew, Clark, Crawford, Dearborn, Decatur, Floyd, Franklin, Harrison, Jackson, Jefferson, Jennings, Ohio, Ripley, Scott, Switzerland, Washington Counties
Custom Regions
16

0 5000 10000 15000 20000 25000
Oral and written communication skills
Integrity
Customer service oriented
Problem solving
Sales and operations planning
Self-starting / Self-motivated
Organizational skills
Strong leadership skills
Time management
Owner operator
Troubleshooting
Microsoft PowerPoint
Analytical skills
Quality Assurance (QA)
Retail sales
Strong interpersonal skills
Entrepreneurial
Microsoft Word
Oracle
Data entry
Food preparation
Bilingual
Restaurant management
Structured query language (SQL)
Customer relationship management (CRM)
Soft Skills

0 500 1000 1500 2000 2500 3000
Quality Assurance (QA)
Food preparation
Preventative maintenance inspections
Structured query language (SQL)
Java
Technical support
Software development
Linux
Critical care
JavaScript (JS)
Systems Development Life Cycle (SDLC)
Microsoft SQL Server (MS SQL)
Salesforce CRM SFDC
Microsoft .NET Framework
Web services
Extensible markup language (XML)
Hypertext markup language (HTML)
Management information systems (MIS)
Python
Public accounting
Practical Extraction and Reporting Language (Perl)
Microsoft SharePoint
Cascading Style Sheets (CSS)
Accounts Receivable
Systems Integration
Skills

- 2,000 4,000 6,000 8,000 10,000 12,000
Driver's License
Certified Registered Nurse (RN)
HAZMAT
Continuing Education (CE)
Occupational Safety & Health Administration Certification (OSHA)
Certified in Nursing Administration (CNA)
Certified Purchasing Manager (CPM)
DOT Medical card
Certified Nursing Assistant (CNA)
Automotive Service Excellence (ASE)
Certified Public Accountant (CPA)
Health Insurance Portability and Accountability Act - HIPPA (HIPAA)
Board Certified (BC)
Top Secret Sensitive Compartmented Information (TS SCI)
Certified Medical Assistant (CMA)
Pediatric Advanced Life Support (PALS)
Associate of Science in Nursing (ASN)
Special Education (SPED)
Nationwide Mortgage Licensing System (NMLS)
Project Management Professional (PMP)
Family Medicine
Teaching license
Child Development Associate (CDA)
Speech and Language Pathologist (SLP)
Direct Support Professional (DSP)
Certifications

Source: US Conference Board HWOL
Soft Skills Job AdsOral and written communication skills 23500Marketing 9449Integrity 9198Team-oriented, teamwork 9027Customer service oriented 8226Detail oriented 8157Problem solving 7025Microsoft Office 6470Sales and operations planning 6169Creativity 6107Self-starting / Self-motivated 5627Work independently 5216Organizational skills 5104Management skills 4653Strong leadership skills 4507Coaching 4213Time management 4042Sales experience / ability 3888Owner operator 3875Basic computer skills 3578Troubleshooting 3450Work ethics 3149Microsoft PowerPoint 3001Project Management 2944Analytical skills 2924Dependability 2907Quality Assurance (QA) 2834Cash registers 2344Retail sales 2242Business development 2221Strong interpersonal skills 2199Ability to learn 1881Entrepreneurial 1858Application process 1812Microsoft Word 1800Negotiation skills 1799Oracle 1795Cash handling 1785Data entry 1682Guest service experience 1655Food preparation 1563Highly motivated 1562Bilingual 1534Preventative maintenance inspections 1480

Restaurant management 1444Quality control 1440Structured query language (SQL) 1411Ability to travel 1401Customer relationship management (CRM) 1392Java 1375

Source: US Conference Board HWOL
Skill Jobs AdsQuality Assurance (QA) 2834Application process 1812Food preparation 1563Bilingual 1534Preventative maintenance inspections 1480Quality control 1440Structured query language (SQL) 1411Customer relationship management (CRM) 1392Java 1375Pediatrics 1333Technical support 1284User Experience design (UX) 1254Software development 1233Geriatrics 1123Linux 1083Preventive maintenance 970Critical care 911UNIX 833JavaScript (JS) 811Patient Electronic Medical Record (EMR) 787Systems Development Life Cycle (SDLC) 772Application development 772Microsoft SQL Server (MS SQL) 748Behavioral health 740Salesforce CRM SFDC 715Electrical systems 713Microsoft .NET Framework 633Marketing and Sales 622Web services 616Material Handling 602Extensible markup language (XML) 596Relational Database Management System (RDBMS) 594Hypertext markup language (HTML) 592C-sharp (C#) 575Management information systems (MIS) 557Quality Systems 534Python 509Bilingual Spanish 507Public accounting 498Instrumentation 489Practical Extraction and Reporting Language (Perl) 469Transaction processing 467Microsoft SharePoint 465Business sales 462

Cascading Style Sheets (CSS) 459Accounts payable 449Accounts Receivable 442Work order 441Systems Integration 422Equipment Maintenance 414

Source: US Conference Board HWOL
Certification Job AdsDriver's License 10,927 Commercial Driver's License (CDL) 9,981 Certified Registered Nurse (RN) 5,207 Certification in Cardiopulmonary Resuscitation (CPR) 3,531 HAZMAT 2,881 Basic Life Support (BLS) 2,141 Continuing Education (CE) 2,023 Licensed Practical Nurse (LPN) 1,671 Occupational Safety & Health Administration Certification (OSHA) 1,665 Food safety programs (HACCP) 1,467 Certified in Nursing Administration (CNA) 1,162 Advanced Cardiac Life Support (ACLS) 1,025 Certified Purchasing Manager (CPM) 928 Tanker and Hazmat Endorsement 925 DOT Medical card 861 Class A Commercial Drivers License 790 Certified Nursing Assistant (CNA) 755 Physical Therapist Certification 742 Automotive Service Excellence (ASE) 728 Certified Practical Nurse, Long-term care (CPNL, LTC) 727 Certified Public Accountant (CPA) 708 State insurance license 683 Health Insurance Portability and Accountability Act - HIPPA (HIPAA) 670 First Aid certification 647 Board Certified (BC) 598 Pharmacy Technician (PT) 519 Top Secret Sensitive Compartmented Information (TS SCI) 469 Commission on Collegiate Nursing Education (CCNE) 448 Certified Medical Assistant (CMA) 391 Certified in Long Term Care (LTC) 385 Pediatric Advanced Life Support (PALS) 384 Licensed Clinical Social Worker (LCSW) 348 Associate of Science in Nursing (ASN) 347 Basic Cardiac Life Support (BCLS) 327 Special Education (SPED) 318 Emergency Medical Technician (EMT) 318 Nationwide Mortgage Licensing System (NMLS) 311 Home Health Aide (HHA) 305 Project Management Professional (PMP) 303 Better Business Bureau (BBB) 271 Family Medicine 264 Early Childhood Education (ECE) 243 Teaching license 241 Certified Information Systems Security Professional (CISSP) 231

Child Development Associate (CDA) 222 Clinical Laboratory Improvement Act (CLIA) 219 Speech and Language Pathologist (SLP) 211 Family Physician / Internal Medicine (FP/IM) 211 Direct Support Professional (DSP) 204 American Registry of Radiologic Technologists (ARRT) 200 …

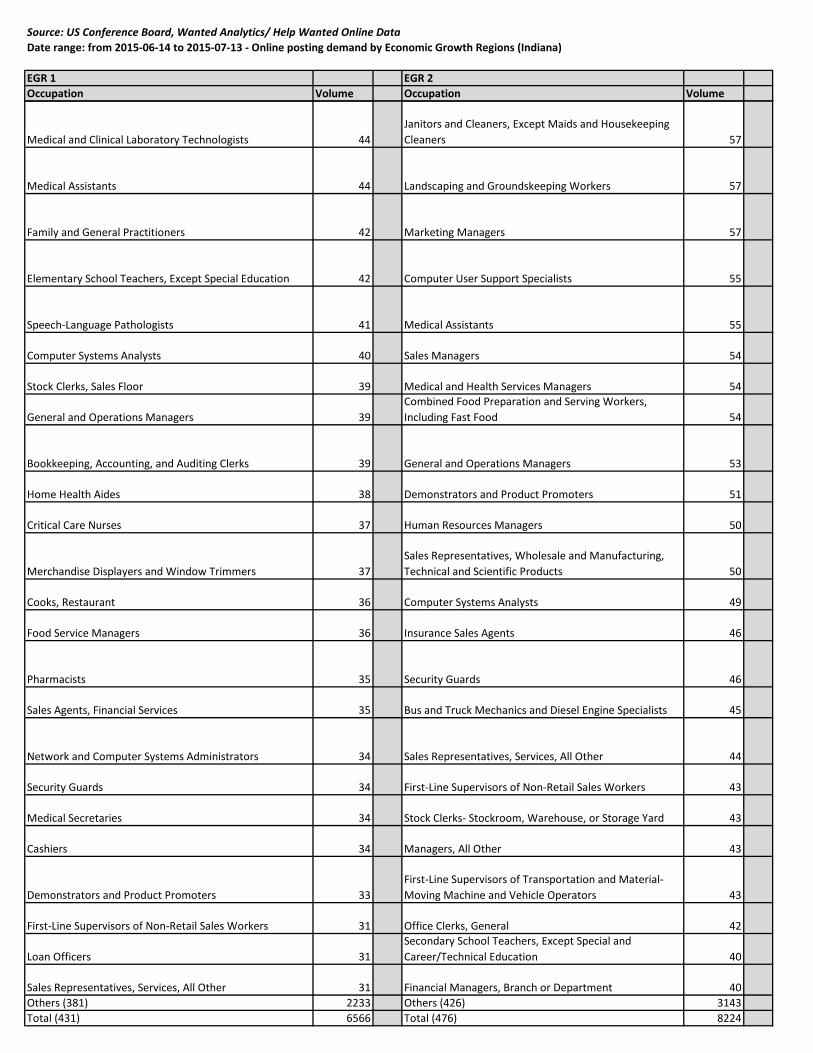
Source: US Conference Board, Wanted Analytics/ Help Wanted Online Data
Date range: from 2015-06-14 to 2015-07-13 - Online posting demand by Economic Growth Regions (Indiana)
EGR 1 EGR 2
Occupation Volume Occupation Volume
Heavy and Tractor-Trailer Truck Drivers 1012 Heavy and Tractor-Trailer Truck Drivers 917
Registered Nurses 394 Registered Nurses 279
Retail Salespersons 236 Industrial Engineers 263
First-Line Supervisors of Retail Sales Workers 216 First-Line Supervisors of Retail Sales Workers 244
First-Line Supervisors of Food Preparation and Serving
Workers 127
First-Line Supervisors of Production and Operating
Workers 244
First-Line Supervisors of Production and Operating
Workers 113 Retail Salespersons 215
Customer Service Representatives 100 Maintenance and Repair Workers, General 192
Maintenance and Repair Workers, General 91
Sales Representatives, Wholesale and Manufacturing,
Except Technical and Scientific Products 146
Nursing Assistants 90 Customer Service Representatives 131
Occupational Therapists 85
First-Line Supervisors of Food Preparation and Serving
Workers 113
Coaches and Scouts 83 Licensed Practical and Licensed Vocational Nurses 98
Industrial Engineers 80 Light Truck or Delivery Services Drivers 90
First-Line Supervisors of Office and Administrative Support
Workers 76 Accountants 89
First-Line Supervisors of Mechanics, Installers, and
Repairers 67 Laborers and Freight, Stock, and Material Movers, Hand 83
Sales Representatives, Wholesale and Manufacturing,
Except Technical and Scientific Products 65
First-Line Supervisors of Mechanics, Installers, and
Repairers 82
Licensed Practical and Licensed Vocational Nurses 65
First-Line Supervisors of Office and Administrative
Support Workers 80
Physical Therapists 63 Helpers--Production Workers 74
Combined Food Preparation and Serving Workers,
Including Fast Food 62 Social and Human Service Assistants 73
First-Line Supervisors of Transportation and Material-
Moving Machine and Vehicle Operators 57 Nursing Assistants 71
Insurance Sales Agents 57 Mechanical Engineers 67
Medical and Health Services Managers 56 Occupational Therapists 62
Computer User Support Specialists 56 Tellers 61
Bus and Truck Mechanics and Diesel Engine Specialists 54 Bookkeeping, Accounting, and Auditing Clerks 60
Janitors and Cleaners, Except Maids and Housekeeping
Cleaners 49
Executive Secretaries and Executive Administrative
Assistants 59
Secondary School Teachers, Except Special and
Career/Technical Education 47 Coaches and Scouts 59
Social and Human Service Assistants 46 Critical Care Nurses 58
Source: US Conference Board, Wanted Analytics/ Help Wanted Online Data
Date range: from 2015-06-14 to 2015-07-13 - Online posting demand by Economic Growth Regions (Indiana)
EGR 1 EGR 2
Occupation Volume Occupation Volume
Medical and Clinical Laboratory Technologists 44
Janitors and Cleaners, Except Maids and Housekeeping
Cleaners 57
Medical Assistants 44 Landscaping and Groundskeeping Workers 57
Family and General Practitioners 42 Marketing Managers 57
Elementary School Teachers, Except Special Education 42 Computer User Support Specialists 55
Speech-Language Pathologists 41 Medical Assistants 55
Computer Systems Analysts 40 Sales Managers 54
Stock Clerks, Sales Floor 39 Medical and Health Services Managers 54
General and Operations Managers 39
Combined Food Preparation and Serving Workers,
Including Fast Food 54
Bookkeeping, Accounting, and Auditing Clerks 39 General and Operations Managers 53
Home Health Aides 38 Demonstrators and Product Promoters 51
Critical Care Nurses 37 Human Resources Managers 50
Merchandise Displayers and Window Trimmers 37
Sales Representatives, Wholesale and Manufacturing,
Technical and Scientific Products 50
Cooks, Restaurant 36 Computer Systems Analysts 49
Food Service Managers 36 Insurance Sales Agents 46
Pharmacists 35 Security Guards 46
Sales Agents, Financial Services 35 Bus and Truck Mechanics and Diesel Engine Specialists 45
Network and Computer Systems Administrators 34 Sales Representatives, Services, All Other 44
Security Guards 34 First-Line Supervisors of Non-Retail Sales Workers 43
Medical Secretaries 34 Stock Clerks- Stockroom, Warehouse, or Storage Yard 43
Cashiers 34 Managers, All Other 43
Demonstrators and Product Promoters 33
First-Line Supervisors of Transportation and Material-
Moving Machine and Vehicle Operators 43
First-Line Supervisors of Non-Retail Sales Workers 31 Office Clerks, General 42
Loan Officers 31
Secondary School Teachers, Except Special and
Career/Technical Education 40
Sales Representatives, Services, All Other 31 Financial Managers, Branch or Department 40
Others (381) 2233 Others (426) 3143
Total (431) 6566 Total (476) 8224

Source: US Conference Board, Wanted Analytics/ Help Wanted Online Data
Date range: from 2015-06-14 to 2015-07-13
EGR 3 EGR 4
Occupation Volume Occupation Volume
Heavy and Tractor-Trailer Truck Drivers 1431 Heavy and Tractor-Trailer Truck Drivers 980
Registered Nurses 604 Registered Nurses 156
Maintenance and Repair Workers, General 213 Retail Salespersons 146
First-Line Supervisors of Retail Sales Workers 191 First-Line Supervisors of Retail Sales Workers 145
Retail Salespersons 183 Maintenance and Repair Workers, General 111
Medical Assistants 164 Customer Service Representatives 107
Industrial Engineers 161
First-Line Supervisors of Food Preparation and Serving
Workers 90
First-Line Supervisors of Production and Operating
Workers 150 Industrial Engineers 89
Customer Service Representatives 142
First-Line Supervisors of Production and Operating
Workers 84
Licensed Practical and Licensed Vocational Nurses 140
First-Line Supervisors of Office and Administrative
Support Workers 81
First-Line Supervisors of Office and Administrative
Support Workers 122
Sales Representatives, Wholesale and Manufacturing,
Except Technical and Scientific Products 77
Sales Representatives, Wholesale and Manufacturing,
Except Technical and Scientific Products 120 Speech-Language Pathologists 70
Janitors and Cleaners, Except Maids and Housekeeping
Cleaners 106 Receptionists and Information Clerks 70
First-Line Supervisors of Food Preparation and Serving
Workers 105 Office Clerks, General 63
Nursing Assistants 104 Merchandise Displayers and Window Trimmers 60
Light Truck or Delivery Services Drivers 87 Medical and Health Services Managers 60
Network and Computer Systems Administrators 87 Demonstrators and Product Promoters 56
Laborers and Freight, Stock, and Material Movers,
Hand 85 Coaches and Scouts 56
Medical and Health Services Managers 79 Nursing Assistants 53
Executive Secretaries and Executive Administrative
Assistants 77 Insurance Sales Agents 53
Physical Therapists 76 Personal Care Aides 53
First-Line Supervisors of Mechanics, Installers, and
Repairers 74 Occupational Therapists 52
Occupational Therapists 72 Computer User Support Specialists 52
Bookkeeping, Accounting, and Auditing Clerks 72
Combined Food Preparation and Serving Workers,
Including Fast Food 50
Speech-Language Pathologists 70 Licensed Practical and Licensed Vocational Nurses 47
Accountants 68 Social and Human Service Assistants 45

Source: US Conference Board, Wanted Analytics/ Help Wanted Online Data
Date range: from 2015-06-14 to 2015-07-13
EGR 3 EGR 4
Occupation Volume Occupation Volume
First-Line Supervisors of Transportation and Material-
Moving Machine and Vehicle Operators 67
First-Line Supervisors of Mechanics, Installers, and
Repairers 44
Insurance Sales Agents 66
Executive Secretaries and Executive Administrative
Assistants 43
Computer Systems Analysts 66 Mechanical Engineers 40
Sales Representatives, Wholesale and Manufacturing,
Technical and Scientific Products 65 Light Truck or Delivery Services Drivers 40
Computer User Support Specialists 64
Secretaries and Administrative Assistants, Except Legal,
Medical, and Executive 40
Coaches and Scouts 64 Physical Therapists 37
Sales Representatives, Services, All Other 63
Telecommunications Equipment Installers and
Repairers, Except Line Installers 36
Driver/Sales Workers 62 Medical Assistants 36
Landscaping and Groundskeeping Workers 61 Family and General Practitioners 35
Helpers--Production Workers 60 Medical Secretaries 34
Combined Food Preparation and Serving Workers,
Including Fast Food 60 Helpers--Production Workers 34
Maids and Housekeeping Cleaners 59 Tellers 32
Home Health Aides 56 Cashiers 32
Secretaries and Administrative Assistants, Except Legal,
Medical, and Executive 56 Electricians 32
Social and Human Service Assistants 55 Landscaping and Groundskeeping Workers 31
First-Line Supervisors of Construction Trades and
Extraction Workers 55 Home Health Aides 31
Receptionists and Information Clerks 54 Bookkeeping, Accounting, and Auditing Clerks 31
Healthcare Support Workers, All Other 54
Janitors and Cleaners, Except Maids and Housekeeping
Cleaners 31
Tellers 53 First-Line Supervisors of Non-Retail Sales Workers 31
Medical Secretaries 52 Maids and Housekeeping Cleaners 30
Bus and Truck Mechanics and Diesel Engine Specialists 51 Elementary School Teachers, Except Special Education 30
Telecommunications Equipment Installers and
Repairers, Except Line Installers 50 Teacher Assistants 30
Stock Clerks, Sales Floor 49 Laborers and Freight, Stock, and Material Movers, Hand 30
Office Clerks, General 49 Stock Clerks, Sales Floor 29
Others (470) 3582 Others (374) 1942
Total (520) 9756 Total (424) 5667

Source: US Conference Board, Wanted Analytics/ Help Wanted Online Data
Date range: from 2015-06-14 to 2015-07-13
EGR 5 EGR 6
Occupation Volume Occupation Volume
Heavy and Tractor-Trailer Truck Drivers 2269 Heavy and Tractor-Trailer Truck Drivers 976
Registered Nurses 1176 Registered Nurses 171
First-Line Supervisors of Retail Sales Workers 739 Receptionists and Information Clerks 99
Customer Service Representatives 718 Customer Service Representatives 95
Retail Salespersons 696 Speech-Language Pathologists 93
First-Line Supervisors of Office and Administrative
Support Workers 647 Retail Salespersons 90
Maintenance and Repair Workers, General 549 First-Line Supervisors of Retail Sales Workers 84
Computer Systems Analysts 546 Physical Therapists 73
Marketing Managers 488 Office Clerks, General 65
First-Line Supervisors of Food Preparation and Serving
Workers 483 Maintenance and Repair Workers, General 63
Accountants 466
First-Line Supervisors of Production and Operating
Workers 60
Computer User Support Specialists 458
First-Line Supervisors of Food Preparation and Serving
Workers 52
First-Line Supervisors of Production and Operating
Workers 458
First-Line Supervisors of Office and Administrative
Support Workers 51
Software Developers, Applications 452 Occupational Therapists 49
Medical and Health Services Managers 442 Social and Human Service Assistants 49
Sales Representatives, Wholesale and Manufacturing,
Except Technical and Scientific Products 428
Secretaries and Administrative Assistants, Except Legal,
Medical, and Executive 49
Management Analysts 424
Executive Secretaries and Executive Administrative
Assistants 49
Network and Computer Systems Administrators 392 Medical Secretaries 48
Industrial Engineers 387 Licensed Practical and Licensed Vocational Nurses 42
Sales Managers 363 Bookkeeping, Accounting, and Auditing Clerks 41
Executive Secretaries and Executive Administrative
Assistants 357 Helpers--Production Workers 39
Bookkeeping, Accounting, and Auditing Clerks 354 Insurance Sales Agents 38
Web Developers 351 Medical and Health Services Managers 35
Sales Representatives, Wholesale and Manufacturing,
Technical and Scientific Products 341
Janitors and Cleaners, Except Maids and Housekeeping
Cleaners 35
Information Technology Project Managers 316
Sales Representatives, Wholesale and Manufacturing,
Except Technical and Scientific Products 35
Sales Representatives, Services, All Other 309
First-Line Supervisors of Mechanics, Installers, and
Repairers 34

Source: US Conference Board, Wanted Analytics/ Help Wanted Online Data
Date range: from 2015-06-14 to 2015-07-13
EGR 5 EGR 6
Occupation Volume Occupation Volume
Combined Food Preparation and Serving Workers,
Including Fast Food 281 Nursing Assistants 33
First-Line Supervisors of Transportation and Material-
Moving Machine and Vehicle Operators 276 Industrial Engineers 33
First-Line Supervisors of Mechanics, Installers, and
Repairers 263 Laborers and Freight, Stock, and Material Movers, Hand 32
Laborers and Freight, Stock, and Material Movers,
Hand 256
First-Line Supervisors of Transportation and Material-
Moving Machine and Vehicle Operators 31
First-Line Supervisors of Non-Retail Sales Workers 249 Coaches and Scouts 30
General and Operations Managers 247
Combined Food Preparation and Serving Workers,
Including Fast Food 29
Social and Human Service Assistants 230 Maids and Housekeeping Cleaners 27
Human Resources Specialists 229 Computer User Support Specialists 25
Managers, All Other 228 Hotel, Motel, and Resort Desk Clerks 25
Light Truck or Delivery Services Drivers 225 Physical Therapist Assistants 24
Insurance Sales Agents 208 Light Truck or Delivery Services Drivers 24
Financial Managers, Branch or Department 204 Personal Care Aides 23
Licensed Practical and Licensed Vocational Nurses 200 Construction Carpenters 23
Coaches and Scouts 200 Electricians 23
Medical Assistants 199 Critical Care Nurses 22
Stock Clerks- Stockroom, Warehouse, or Storage Yard 197 Data Entry Keyers 22
Human Resources Managers 196 Family and General Practitioners 20
Maids and Housekeeping Cleaners 195 Cashiers 20
Medical Scientists, Except Epidemiologists 192 Physicians and Surgeons, All Other 20
First-Line Supervisors of Construction Trades and
Extraction Workers 191 Food Service Managers 20
Sales Agents, Financial Services 188 Merchandise Displayers and Window Trimmers 20
Food Service Managers 185 Security Guards 20
Computer Systems Engineers/Architects 178 Stock Clerks, Sales Floor 18
Computer Programmers 177 Mental Health and Substance Abuse Social Workers 18
Others (621) 14137 Others (330) 1342
Total (671) 33940 Total (380) 4439

Source: US Conference Board, Wanted Analytics/ Help Wanted Online Data
Date range: from 2015-06-14 to 2015-07-13
EGR 7 EGR 8
Occupation Volume Occupation Volume
Heavy and Tractor-Trailer Truck Drivers 563 Heavy and Tractor-Trailer Truck Drivers 598
Registered Nurses 295 Registered Nurses 137
First-Line Supervisors of Retail Sales Workers 72 Receptionists and Information Clerks 90
Retail Salespersons 62 Computer Systems Analysts 79
First-Line Supervisors of Food Preparation and Serving
Workers 59 First-Line Supervisors of Retail Sales Workers 79
Occupational Therapists 57 Retail Salespersons 74
Physical Therapists 45 Computer User Support Specialists 70
Customer Service Representatives 43 Customer Service Representatives 69
Industrial Engineers 43 Physical Therapists 68
Medical and Health Services Managers 40 Maintenance and Repair Workers, General 68
Surgical Technologists 38 Network and Computer Systems Administrators 67
Maintenance and Repair Workers, General 37
Executive Secretaries and Executive Administrative
Assistants 66
Insurance Sales Agents 33
First-Line Supervisors of Food Preparation and Serving
Workers 66
First-Line Supervisors of Production and Operating
Workers 32 Industrial Engineers 63
Critical Care Nurses 31
First-Line Supervisors of Office and Administrative Support
Workers 52
Sales Representatives, Wholesale and Manufacturing,
Except Technical and Scientific Products 29 Hotel, Motel, and Resort Desk Clerks 51
Medical Secretaries 27 Office Clerks, General 51
Receptionists and Information Clerks 27
Secretaries and Administrative Assistants, Except Legal,
Medical, and Executive 41
Social and Human Service Assistants 26
Janitors and Cleaners, Except Maids and Housekeeping
Cleaners 41
First-Line Supervisors of Office and Administrative
Support Workers 26 Medical Secretaries 41
Hotel, Motel, and Resort Desk Clerks 25 Speech-Language Pathologists 39
First-Line Supervisors of Mechanics, Installers, and
Repairers 23 Social and Human Service Assistants 39
Nursing Assistants 22
First-Line Supervisors of Production and Operating
Workers 37
Light Truck or Delivery Services Drivers 22 Personal Care Aides 35
Office Clerks, General 22 Maids and Housekeeping Cleaners 34
Computer User Support Specialists 21 Information Security Analysts 34

Source: US Conference Board, Wanted Analytics/ Help Wanted Online Data
Date range: from 2015-06-14 to 2015-07-13
EGR 7 EGR 8
Occupation Volume Occupation Volume
General and Operations Managers 21 Insurance Sales Agents 33
Food Service Managers 21 Electronics Engineering Technicians 33
Janitors and Cleaners, Except Maids and Housekeeping
Cleaners 20
Sales Representatives, Wholesale and Manufacturing,
Except Technical and Scientific Products 33
Telecommunications Equipment Installers and
Repairers, Except Line Installers 20
First-Line Supervisors of Mechanics, Installers, and
Repairers 32
Mental Health and Substance Abuse Social Workers 19 Web Developers 32
Laborers and Freight, Stock, and Material Movers, Hand 19 Automotive Specialty Technicians 29
Stock Clerks, Sales Floor 18 Laborers and Freight, Stock, and Material Movers, Hand 29
Driver/Sales Workers 18 Critical Care Nurses 28
Family and General Practitioners 18 Landscaping and Groundskeeping Workers 27
Licensed Practical and Licensed Vocational Nurses 18
Property, Real Estate, and Community Association
Managers 27
Executive Secretaries and Executive Administrative
Assistants 18 Helpers--Production Workers 26
Combined Food Preparation and Serving Workers,
Including Fast Food 18 Light Truck or Delivery Services Drivers 26
Surgeons 17 Merchandise Displayers and Window Trimmers 25
Demonstrators and Product Promoters 17 Bookkeeping, Accounting, and Auditing Clerks 25
Merchandise Displayers and Window Trimmers 17 Licensed Practical and Licensed Vocational Nurses 24
Physical Therapist Assistants 17 Information Technology Project Managers 24
First-Line Supervisors of Transportation and Material-
Moving Machine and Vehicle Operators 17
Combined Food Preparation and Serving Workers,
Including Fast Food 24
Security Guards 16 Nursing Assistants 23
Home Health Aides 16 Managers, All Other 23
Advertising Sales Agents 15 Cooks, Restaurant 23
Occupational Therapy Assistants 14 Software Developers, Applications 23
Secretaries and Administrative Assistants, Except Legal,
Medical, and Executive 14 Marketing Managers 23
Medical Assistants 13 Logisticians 23
Helpers--Production Workers 13 Demonstrators and Product Promoters 22
Others (291) 899 Others (368) 1618
Total (341) 3033 Total (418) 4344

Source: US Conference Board, Wanted Analytics/ Help Wanted Online Data
Date range: from 2015-06-14 to 2015-07-13
EGR 9 EGR 10
Occupation Volume Occupation Volume
Heavy and Tractor-Trailer Truck Drivers 384 Heavy and Tractor-Trailer Truck Drivers 250
Industrial Engineers 124 First-Line Supervisors of Retail Sales Workers 100
First-Line Supervisors of Retail Sales Workers 88 Customer Service Representatives 85
Registered Nurses 81 Maintenance and Repair Workers, General 77
Maintenance and Repair Workers, General 57 Retail Salespersons 72
First-Line Supervisors of Production and Operating
Workers 57
First-Line Supervisors of Food Preparation and Serving
Workers 69
Mechanical Engineers 52 Registered Nurses 65
Information Technology Project Managers 44
First-Line Supervisors of Office and Administrative Support
Workers 47
Retail Salespersons 44 Nursing Assistants 40
Customer Service Representatives 43 Physical Therapists 38
Accountants 41 Industrial Engineers 38
Medical and Health Services Managers 40
First-Line Supervisors of Production and Operating
Workers 37
Helpers--Production Workers 38 Licensed Practical and Licensed Vocational Nurses 37
First-Line Supervisors of Food Preparation and Serving
Workers 38 Stock Clerks- Stockroom, Warehouse, or Storage Yard 36
Security Guards 38 Computer User Support Specialists 31
Computer Systems Analysts 38
Janitors and Cleaners, Except Maids and Housekeeping
Cleaners 31
Social and Human Service Assistants 37 Social and Human Service Assistants 31
Laborers and Freight, Stock, and Material Movers, Hand 34 Bookkeeping, Accounting, and Auditing Clerks 30
Computer User Support Specialists 34 Speech-Language Pathologists 29
Speech-Language Pathologists 33 Cleaners of Vehicles and Equipment 28
Personal Care Aides 33
First-Line Supervisors of Mechanics, Installers, and
Repairers 28
Physical Therapists 29 Bus and Truck Mechanics and Diesel Engine Specialists 27
Licensed Practical and Licensed Vocational Nurses 29 Laborers and Freight, Stock, and Material Movers, Hand 27
Combined Food Preparation and Serving Workers,
Including Fast Food 29 Medical Secretaries 26
Physical Therapist Assistants 26
Combined Food Preparation and Serving Workers,
Including Fast Food 25
Maids and Housekeeping Cleaners 25 Security Guards 24

Source: US Conference Board, Wanted Analytics/ Help Wanted Online Data
Date range: from 2015-06-14 to 2015-07-13
EGR 9 EGR 10
Occupation Volume Occupation Volume
Nursing Assistants 25
Telecommunications Equipment Installers and Repairers,
Except Line Installers 24
Bookkeeping, Accounting, and Auditing Clerks 25 Helpers--Production Workers 24
First-Line Supervisors of Mechanics, Installers, and
Repairers 25 Medical and Health Services Managers 24
Merchandise Displayers and Window Trimmers 22
First-Line Supervisors of Transportation and Material-
Moving Machine and Vehicle Operators 23
First-Line Supervisors of Transportation and Material-
Moving Machine and Vehicle Operators 21 Cashiers 22
General and Operations Managers 21 Medical Assistants 22
Janitors and Cleaners, Except Maids and Housekeeping
Cleaners 21 Insurance Sales Agents 20
Cashiers 21 Home Health Aides 20
Industrial Truck and Tractor Operators 20 Waiters and Waitresses 20
First-Line Supervisors of Office and Administrative Support
Workers 20 Shipping, Receiving, and Traffic Clerks 19
Financial Managers, Branch or Department 20 Tellers 19
Electrical Engineers 20 Food Service Managers 18
Network and Computer Systems Administrators 20 Industrial Truck and Tractor Operators 18
Occupational Therapists 20 Stock Clerks, Sales Floor 17
Sales Representatives, Wholesale and Manufacturing,
Except Technical and Scientific Products 18 Personal Care Aides 16
Software Developers, Applications 18 Merchandise Displayers and Window Trimmers 16
Home Health Aides 18 Maids and Housekeeping Cleaners 16
Electronics Engineers, Except Computer 17 Accountants 16
Demonstrators and Product Promoters 16 Information Technology Project Managers 16
Cooks, Restaurant 16 Welders, Cutters, and Welder Fitters 15
Bus and Truck Mechanics and Diesel Engine Specialists 16 Automotive Specialty Technicians 14
Tellers 16 Pharmacy Technicians 14
Medical Assistants 16 Driver/Sales Workers 13
Auditors 16 Family and General Practitioners 13
Others (277) 1064 Others (271) 857
Total (327) 3048 Total (321) 2624

Source: US Conference Board, Wanted Analytics/ Help Wanted Online Data
Date range: from 2015-06-14 to 2015-07-13
EGR 11
Occupation Volume
Heavy and Tractor-Trailer Truck Drivers 847
Registered Nurses 173
Retail Salespersons 145
Maintenance and Repair Workers, General 145
First-Line Supervisors of Retail Sales Workers 145
Industrial Engineers 127
First-Line Supervisors of Production and Operating
Workers 101
Sales Representatives, Wholesale and Manufacturing,
Except Technical and Scientific Products 91
Customer Service Representatives 89
First-Line Supervisors of Food Preparation and Serving
Workers 88
Receptionists and Information Clerks 88
First-Line Supervisors of Office and Administrative Support
Workers 80
Social and Human Service Assistants 73
Janitors and Cleaners, Except Maids and Housekeeping
Cleaners 70
Licensed Practical and Licensed Vocational Nurses 65
Laborers and Freight, Stock, and Material Movers, Hand 64
Insurance Sales Agents 61
Home Health Aides 61
Maids and Housekeeping Cleaners 59
Computer User Support Specialists 59
Nursing Assistants 55
Combined Food Preparation and Serving Workers,
Including Fast Food 55
Personal Care Aides 54
First-Line Supervisors of Transportation and Material-
Moving Machine and Vehicle Operators 52
Executive Secretaries and Executive Administrative
Assistants 52
Medical and Health Services Managers 52

Source: US Conference Board, Wanted Analytics/ Help Wanted Online Data
Date range: from 2015-06-14 to 2015-07-13
EGR 11
Occupation Volume
Secretaries and Administrative Assistants, Except Legal,
Medical, and Executive 52
First-Line Supervisors of Mechanics, Installers, and
Repairers 49
Office Clerks, General 47
Computer Systems Analysts 46
Security Guards 45
Cashiers 43
Network and Computer Systems Administrators 43
Physical Therapists 42
Sales Representatives, Wholesale and Manufacturing,
Technical and Scientific Products 42
Mechanical Engineers 42
Light Truck or Delivery Services Drivers 41
Driver/Sales Workers 41
Sales Representatives, Services, All Other 40
Bus and Truck Mechanics and Diesel Engine Specialists 39
Telecommunications Equipment Installers and Repairers,
Except Line Installers 39
Medical Secretaries 38
Landscaping and Groundskeeping Workers 38
General and Operations Managers 37
Helpers--Production Workers 36
Accountants 36
Construction Carpenters 36
Food Service Managers 36
Cooks, Restaurant 35
First-Line Supervisors of Non-Retail Sales Workers 35
Others (429) 2573
Total (479) 6502


![Indiana Jones [TSR] - BOX - Indiana Jones RPG](https://img.pdfslide.net/doc/110x75/5515b11a497959161e8b4dce/indiana-jones-tsr-box-indiana-jones-rpg.jpg)