Embed Size (px)
Citation preview

INDIANA PUBLIC
RETIREMENT SYSTEM
Risk Analysis Report August 2019

TABLE OF CONTENTS
2019 Risk Analysis Report Indiana Public Retirement System
Section Page
Certification Letter
Overview ....................................................................................................................... 1
Maturity Measures ........................................................................................................ 4
Qualitative Analysis .................................................................................................... 21
Quantitative Analysis – Demographic Assumptions .................................................. 25
Quantitative Analysis – Economic Assumptions ....................................................... 31
August 16, 2019 Board of Trustees Indiana Public Retirement System 1 North Capitol, Suite 001 Indianapolis, IN 46204 Re: Risk Analysis Report Dear Members of the Board: At your request, we have performed a study of the actuarial-related risks faced by the Indiana Public Retirement System (INPRS). This report is designed to support and expand on information contained in the annual INPRS actuarial valuation reports. While the exhibits and graphs shown in this report are based on the June 30, 2018 INPRS actuarial valuation, the analysis of the results and the discussion of the implications for INPRS and its stakeholders are expected to remain substantially unchanged for the next few years. The primary objective of this report is to provide the analysis of risk, as required under Actuarial Standard of Practice Number 51, Assessment and Disclosure of Risk Associated with Measuring Pension Obligations and Determining Pension Plan Contributions. There are other risks that INPRS faces, including issues such as cyber security, a catastrophe to the physical location, embezzlement, and many others. These are outside the scope of our analysis, which focuses only on those risks relating to the variance in the measurement of the benefit obligations as well as the contribution rates. There is no specific action by the INPRS Board either required or expected in response to this report, although it is possible that a deeper understanding of the risks faced by the System may prompt some additional discussion or study. In preparing our report, we utilized the data, methods, assumptions, and benefit provisions described in the June 30, 2018 actuarial valuations of INPRS, which should be consulted for a complete description. Some of the results in this report are based upon modifying one or more of the valuation assumptions as noted in the discussion of the analysis being performed. The consultants who worked on this assignment are pension actuaries with significant public plan experience. In addition, the signing actuaries are independent of the System and the plan sponsor. We are not aware of any relationship that would impair the objectivity of our work.
Off
Cavanaugh Macdonald CC OO NN SS UU LL TT II NN GG,, LL LL CC
The experience and dedication you deserve
3802 Raynor Pkwy, Suite 202, Bellevue, NE 68123 Phone (402) 905-4461 • Fax (402) 905-4464
www.CavMacConsulting.com Offices in Kennesaw, GA • Bellevue, NE

August 16, 2019 Page 2
2019 Risk Analysis Report Indiana Public Retirement System
On the basis of the foregoing, we hereby certify that, to the best of our knowledge and belief, this report is complete and accurate. The valuation, on which this analysis was based, was prepared in accordance with principles of practice prescribed by the Actuarial Standards Board. Furthermore, the actuarial calculations were performed by qualified actuaries in accordance with accepted actuarial procedures, based on the current provisions of the retirement system and on actuarial assumptions that are internally consistent and reasonable based on the actual experience of the System. We are members of the American Academy of Actuaries and meet the Qualification Standards to render the actuarial opinion contained herein. We would be happy to answer further questions. We respectfully submit the following report and look forward to discussing it with you.
Brent A. Banister, PhD, FSA, EA, FCA, MAAA Patrice A. Beckham, FSA, EA, FCA, MAAA Chief Actuary Principal and Consulting Actuary
Virginia Fritz, FSA, EA, FCA, MAAA Senior Actuary

OVERVIEW
2019 Risk Analysis Report Indiana Public Retirement System 1
Actuarial Standard of Practice Number 51 (ASOP 51) Actuarial Standards of Practice (ASOPs) are issued by the Actuarial Standards Board and are binding for credentialed actuaries practicing in the United States. These standards generally identify what the actuary should consider, document and disclose when performing an actuarial assignment. In September 2017, ASOP 51, Assessment and Disclosure of Risk Associated with Measuring Pension Obligations and Determining Pension Plan Contributions, was issued as final with application to measurement dates on or after November 1, 2018. This ASOP applies to funding valuations, actuarial projections, and actuarial cost studies of proposed plan changes. A typical retirement system faces many different risks. The greatest risk for a retirement system is the inability to make benefit payments when due. If system assets are depleted, benefits may not be paid which could create legal and litigation risk. The term “risk” is most commonly associated with an outcome with undesirable results. However, in the actuarial world risk is defined as uncertainty. The actuarial valuation process uses many actuarial assumptions to project how future contributions and investment returns will meet the cash flow needs for future benefit payments. Of course, we know that actual experience each year will not unfold exactly as anticipated by the assumptions. This uncertainty, whether favorable or unfavorable, creates risk. ASOP 51 defines risk as the potential of actual future measurements deviating from expected future measurements due to actual experience that is different than the actuarial assumptions. Identifying Risks The first step in a project such as this is to identify the significant risks that affect how INPRS liabilities are measured and contributions determined. Some risks, such as investment return for a funded retirement plan, are obvious, but there are others that are not as clear. There is no definition of “significant” to clearly define which risks should be considered, nor is it always possible to know in advance before performing analysis whether certain risks are significant or not. The identification of risks is also specific to the retirement plan being studied. Some plan design features, such as lump sums based on market interest rates, could increase the risk a plan faces, while features that adjust benefits based on actual investment return may reduce the risk to the plan. Thus, this analysis for INPRS is uniquely prepared for INPRS and the risks it faces. Different plans are subject to different risks. The more significant risks discussed in this report include:
• Investment risk –actual investment returns differ from the assumption • Other economic risks – for example, inflation coupled with corresponding changes in investment
return, wage growth, and COLAs • Mortality risk –future changes in mortality rates differ from those currently anticipated • Retirement and termination risk – rates at which members leave employment for retirement or other
reasons differs from what is currently assumed • Active membership and payroll growth risk – the risk that the population and payroll (upon which
funding is often based) increase or decrease in an unexpected manner • Contribution risk – the risk that the funding policy will not result in adequate funding of a plan
OVERVIEW
2019 Risk Analysis Report Indiana Public Retirement System 2
Assessing Risks In this report, we consider a variety of risks faced by INPRS. A common theme for most retirement plans is that risks change as a plan matures. Because this is a fundamental issue, ASOP 51 requires the disclosure of appropriate measures of a plan’s maturity. In the section of this report that considers maturity measures, we provide a number of illustrations to help demonstrate this trend. It is worth noting that the eight funds in INPRS have some differences that relate to the nature of retirement eligibility and the historical inclusion of certain employment categories. This uniqueness can help explain why certain events may affect the groups differently. There are some risks that are inherently difficult to quantify, while other risks are mitigated or exacerbated by plan design and funding policy. In our section on qualitative analysis, we discuss some of these risks. We also discuss how the INPRS contribution rate policy addresses some of the risks faced by INPRS. Finally, we conclude this report with a quantitative assessment of some of the significant demographic and economic risks. The purpose of this analysis is to provide some perspective on the magnitude of the risks faced by INPRS. Methodology and Disclaimers Actuarial valuations are based on mathematical models and assumptions that attempt to reflect the most likely outcome of future contingent events. There is inherent randomness in many of the events that are modeled. For instance, an individual who is at an age where 2% of similar individuals are expected to die will either survive or die – there is no real-world scenario of being 98% alive. Mathematically, however, we value this individual as 0.98 of a living person and reflect a 0.02 death (with possible benefits to a survivor). This is appropriate using the statistical principle of the Law of Large Numbers which asserts that if we could experience many repetitions of the current state of affairs, the average result would be approximately what our model values. There will, however, be only one outcome and that is currently unknown. This actuarial model is an attempt to estimate the most likely outcome. Alternatively, we could value a large number of random, plausible scenarios in which the member survived 98% of the time and died 2% of the time. Such an approach would require very significant computational resources, while not producing commensurate improvements in the resulting measurement. In this report, we also utilize projection models in which we attempt to estimate the results produced by future valuations. There is inherently a wide range of outcomes as can be seen in the section of stochastic results at the end of this report. It is important to note that these models are designed to be comparative rather than predictive. In other words, if the results of a sustained low return result in a funded ratio about 10% lower than the baseline, this would likely still be approximately true, even if there were some changes in an unrelated variable such as the benefit structure or the rate of mortality improvement. The output of projection models provides the expected trend of future valuation results, recognizing that actual experience will fluctuate as it follows that general trend. The results in this report are based on the June 30, 2018 valuations with their underlying data, assumptions, and methods. There were bills passed in the 2019 legislative session that affected benefits for PERF, TRF Pre-’96, TRF ’96, and the ’77 Fund. These changes are generally minor in nature from a funding perspective, and so were not reflected. There was also a change to the TRF ’96 funding method which included a direct contribution by the State of $150 million, followed by a change in the contribution rate to 5.5%, effective July 1, 2019. Because this change will have a noticeable effect on the contribution rates
OVERVIEW
2019 Risk Analysis Report Indiana Public Retirement System 3
and the funded ratio, it has been reflected in the results shown herein. It is important to keep in mind that the results presented in this report are intended to help illustrate how the various Funds respond to variability in investment markets or human behavior, and are not intended to predict what will happen in the future. This report is intended to provide information to help the Board and other interested parties better understand how the risks faced by INPRS might unfold. There is no intent to provide any suggested course of action, or even to suggest that any course of action be considered. Should the Board be interested in a more extensive understanding or taking additional steps to manage risk, further study may be warranted. Conclusions Risk is not necessarily a negative concept. As humans, we regularly take risks such as driving in an automobile because we believe that the gain to be received outweighs the possible negative consequences. We do, however, take steps to mitigate the risk by looking both ways at an intersection before proceeding, wearing seatbelts, etc. We do these things because we have some understanding of the sources of risk. The goal of this report is to help the INPRS Board and staff understand the major risks facing INPRS’ funding, thereby allowing a reasoned approach to move forward.

MATURITY MEASURES
2019 Risk Analysis Report Indiana Public Retirement System 4
MATURITY OF THE SYSTEM While INPRS was officially created in 2011, the funds that were combined into this new entity date back much earlier – the Indiana Public Employees’ Retirement Fund (PERF) began in 1945 and the Indiana State Teachers’ Retirement Fund (TRF) dates back to 1921. For public retirement systems that have been around for 50 to 75 years or more, there has been a shift in the demographics of these systems as the population is aging and baby boomers have begun to retire. This change is not unexpected and has, in fact, been anticipated in the funding of the retirement systems. Even though it was anticipated, the demographic shift and maturing of the plans have increased the risk associated with funding the systems, since funding is generally related to active payroll. There are different ways to measure and assess the maturity level of a retirement system and we will discuss several in this section of the report. Historical Active to Retiree Ratio
One way to assess the maturity of the system is to consider the ratio of active members to retirees. In the early years after a retirement system is established, the ratio of active to retired members will be very high as the system is largely composed of active members. As the system matures over time, the ratio starts to decline. A very mature system often has a ratio near or below one. In addition, if the size of the active membership declines over time, it can accelerate the decline in the ratio. As the following graphs illustrate, this ratio of actives to retirees has been declining over time for most of the INPRS funds. Ongoing, Mature Plans: PERF, ’77 Fund, JRS, and EG&C
The Funds shown here are reasonably stable, mature funds and, therefore, the active to retiree ratio is generally flat or declining. The ’77 Fund was still relatively new at the beginning of the period graphed and therefore has greater decline. Note that the EG&C Fund had some growth in active membership in the mid-2000’s that caused a temporarily distortion to the general pattern.
0.0
1.0
2.0
3.0
4.0
5.0
6.0
7.0
2000 2001 2002 2003 2004 2005 2006 2007 2008 2009 2010 2011 2012 2013 2014 2015 2016 2017
Active to Retiree Ratio
PERF JRS EG&C '77 Fund

MATURITY MEASURES
2019 Risk Analysis Report Indiana Public Retirement System 5
Ongoing, Newer Plans: TRF ’96 and PARF As relatively newer funds (PARF was created in 1989 and TRF ’96 in 1996), these two funds have a very high proportion of actives. The decline is most dramatic for TRF ’96 Fund, going from over nearly 300 actives per retiree in 2001 to under 10 at the present. As time passes, these ratios will begin to resemble the patterns of the more mature funds.
Closed Plans: TRF Pre-’96 and LE DB
Because the TRF Pre-’96 and LE DB Funds are closed, there is a continued downward trend in the ratio as the remaining actives gradually transition to retirees.
0
5
10
15
20
25
30
35
40
45
50
2001 2002 2003 2004 2005 2006 2007 2008 2009 2010 2011 2012 2013 2014 2015 2016 2017 2018
Active to Retiree Ratio
TRF '96 PARF
0.0
0.2
0.4
0.6
0.8
1.0
1.2
1.4
1.6
1.8
2001 2002 2003 2004 2005 2006 2007 2008 2009 2010 2011 2012 2013 2014 2015 2016 2017 2018
Active to Retiree Ratio
TRF Pre-'96 LE DB Ratio

MATURITY MEASURES
2019 Risk Analysis Report Indiana Public Retirement System 6
Asset Volatility Ratio As a retirement system matures, the size of the market value of assets increases relative to the covered payroll of active members on which the System is funded. The size of the plan assets relative to covered payroll, sometimes referred to as the asset volatility ratio, is an important indicator of the contribution risk for the Funds. Particularly when investment experience different from expected is reflected by changes in the contribution rate applied to the active payroll, this ratio can help explain variation in contribution rates. The higher this ratio, the more sensitive a plan’s actuarially determined contribution rate is to investment return volatility. It is important to note that while a large ratio is an indication that the actuarially determined contributions are more volatile, the ratio will also be larger for a well-funded plan than for a poorly-funded plan. Thus, it is inappropriate to describe a large or small ratio as good or bad. The value of examining these ratios is to understand how the different funds may respond to variation in investment return. It should be noted that when a plan is not funded on a payroll basis (such as the TRF Pre-’96 Fund), this ratio is likely to be less meaningful. The following table shows how asset volatility affects contribution rates for the Funds. If the asset return is 10% different from the assumption (so either -3.25% or +16.75%), the actuarial contribution rate changes as a result of the change in the UAAL. The “Without Asset Smoothing” column reflects the how the rate would change if asset smoothing was not used, while the “with Asset Smoothing” column indicates the actual first year change in the amortization rate. Note that the actual employer contribution rate or amount
Change in Actuarial Contribution Rate for a 10% Change in Asset Return
Asset Volatility Ratio
Without Asset Smoothing
With Asset Smoothing
PERF 2.44 2.1% 0.4% TRF ‘96 1.62 1.4% 0.3% ’77 Fund 6.87 5.1% 1.0% JRS 9.44 8.2% 1.6% PARF 2.77 2.4% 0.5% EG&C 4.37 3.8% 0.8%
Note that TRF Pre-’96 and LE DB are excluded because there is no meaningful actuarial rate calculated. The results for the ’77 Fund reflect the 30-year amortization that applies since it is currently over 100% funded. The following pages show the historical trend for the asset volatility ratio for each of the INPRS membership groups based on the market value of assets and payroll used in the valuation. As is evident, the differing demographic characteristics of each group translates to different asset volatility ratios and different contribution rate risk.

MATURITY MEASURES
2019 Risk Report Indiana Public Retirement System 7
Asset Volatility Ratio Market Value of Assets ($ Millions) Covered Payroll ($ Millions) Asset Volatility Ratio
Fiscal Year End PERF TRF Pre-‘96 TRF ‘96 PERF TRF Pre-’96 TRF ‘96 PERF TRF Pre-’96 TRF ‘96
6/30/01 $8,355.5 $5,810.8 * $3,587.1 $2,564.5 $754.4 2.33 1.75 * 6/30/02 7,953.0 5,722.8 * 3,785.2 2,551.2 1,004.5 2.10 1.61 * 6/30/03 8,273.0 6,148.0 * 3,952.2 2,448.3 1,136.9 2.09 1.71 * 6/30/04 9,586.9 6,754.3 * 4,198.9 2,384.5 1,267.2 2.28 1.85 * 6/30/05 10,398.7 7,179.7 * 4,318.5 2,305.7 1,428.6 2.41 1.92 *
6/30/06 11,366.2 7,797.4 * 4,322.2 2,237.4 1,565.3 2.63 2.05 * 6/30/07 13,262.4 6,106.4 2,874.4 4,385.7 2,376.4 1,891.6 3.02 2.57 1.52 6/30/08 12,073.5 5,644.2 2,919.8 4,600.4 2,295.8 2,052.7 2.62 2.46 1.42 6/30/09 9,442.3 4,655.9 2,543.2 4,931.4 2,030.5 2,308.5 1.91 2.29 1.10 6/30/10 10,581.3 5,029.5 3,111.3 4,896.0 1,865.1 2,447.5 2.16 2.70 1.27
6/30/11 12,461.3 3,455.9 3,775.8 4,818.8 1,762.8 2,507.2 2.59 1.96 1.51 6/30/12 12,243.8 5,058.9 4,018.1 4,904.1 1,637.1 2,595.0 2.50 3.09 1.55 6/30/13 12,720.6 5,215.2 4,433.7 4,766.9 1,383.4 2,740.9 2.67 3.77 1.62 6/30/14 14,104.3 5,501.9 5,189.4 5,080.1 1,383.2 2,740.7 2.78 3.98 1.89 6/30/15 13,907.7 5,099.9 5,379.1 4,964.8 1,178.8 2,827.3 2.80 4.33 1.90
6/30/16 13,870.5 4,787.5 5,611.2 5,014.0 1,044.1 3,004.2 2.77 4.59 1.87 6/30/17 14,644.7 4,817.6 6,252.0 5,130.4 933.3 3,032.3 2.85 5.16 2.06 6/30/18 12,694.3 3,711.3 5,452.4 5,210.2 750.7 3,374.9 2.44 4.94 1.62
Note: Prior to 6/30/18, member DC account balances are reflected in the assets. *For historical information from 6/30/2001 through 6/30/2006, Market Value of Assets and Asset Volatility Ratio for TRF Pre-‘96 and TRF ‘96 are combined in TRF Pre-’96.

MATURITY MEASURES
2019 Risk Report Indiana Public Retirement System 8
Asset Volatility Ratio
Market Value of Assets ($ Millions) Covered Payroll ($ Millions) Asset Volatility Ratio Fiscal
Year End 77 Fund EG&C 77 Fund EG&C 77 Fund EG&C
6/30/01 $1,533.3 $36.3 $389.2 $12.5 3.94 2.91 6/30/02 1,537.7 34.8 396.2 12.7 3.88 2.75 6/30/03 1,706.3 36.6 433.0 11.9 3.94 3.07 6/30/04 2,071.6 42.9 469.8 10.2 4.41 4.20 6/30/05 2,381.7 47.3 493.7 13.2 4.82 3.57
6/30/06 2,718.4 52.6 522.2 14.9 5.21 3.53 6/30/07 3,310.2 63.2 557.6 17.7 5.94 3.57 6/30/08 3,148.4 61.1 604.0 21.3 5.21 2.86 6/30/09 2,591.7 51.4 649.0 25.2 3.99 2.04 6/30/10 3,033.3 61.2 675.8 26.7 4.49 2.29
6/30/11 3,721.4 75.3 687.3 24.0 5.41 3.13 6/30/12 3,817.0 76.5 697.1 25.8 5.48 2.97 6/30/13 4,116.9 97.0 706.6 26.2 5.83 3.70 6/30/14 4,758.0 110.7 734.0 26.7 6.48 4.15 6/30/15 4,828.4 110.0 764.2 25.8 6.32 4.27
6/30/16 4,951.0 111.3 791.5 26.2 6.26 4.26 6/30/17 5,401.2 120.0 829.7 28.1 6.51 4.27 6/30/18 5,927.6 131.5 863.2 30.1 6.87 4.37

MATURITY MEASURES
2019 Risk Report Indiana Public Retirement System 9
Asset Volatility Ratio
Market Value of Assets ($ Millions) Covered Payroll ($ Millions) Asset Volatility Ratio Fiscal Year End LE DB JRS PARF LE DB JRS PARF LE DB JRS PARF
6/30/01 $4.5 $112.2 $10.8 N/A $29.7 $13.6 N/A 3.77 0.79 6/30/02 4.1 112.5 11.1 N/A 25.8 14.4 N/A 4.36 0.77 6/30/03 4.1 124.8 12.6 N/A 25.4 13.2 N/A 4.91 0.95 6/30/04 4.7 150.8 16.2 N/A 25.7 15.1 N/A 5.87 1.07 6/30/05 5.0 171.0 19.0 N/A 32.2 16.7 N/A 5.31 1.14
6/30/06 5.1 193.3 21.6 N/A 34.1 19.2 N/A 5.67 1.13 6/30/07 5.5 233.4 26.2 N/A 29.7 18.1 N/A 7.85 1.45 6/30/08 4.7 219.4 24.6 N/A 33.7 20.6 N/A 6.51 1.19 6/30/09 3.4 179.4 19.7 N/A 36.2 20.8 N/A 4.96 0.95 6/30/10 3.4 208.4 22.4 N/A 36.7 21.0 N/A 5.67 1.07
6/30/11 3.6 257.0 26.5 N/A 45.8 18.1 N/A 5.62 1.46 6/30/12 3.4 262.3 27.7 N/A 45.1 21.7 N/A 5.81 1.28 6/30/13 3.3 375.8 47.9 N/A 47.0 21.2 N/A 8.00 2.26 6/30/14 3.5 432.7 54.5 N/A 47.9 21.4 N/A 9.04 2.54 6/30/15 3.2 437.4 53.4 N/A 49.7 22.0 N/A 8.81 2.43
6/30/16 2.9 441.8 52.8 N/A 53.0 22.2 N/A 8.34 2.38 6/30/17 2.9 475.1 55.6 N/A 55.9 23.5 N/A 8.51 2.36 6/30/18 2.9 514.0 61.0 N/A 54.5 22.0 N/A 9.44 2.77

MATURITY MEASURES
2019 Risk Report Indiana Public Retirement System 10
Historical Cash Flows Plans with negative cash flows will experience increased sensitivity to investment return volatility. Cash flows, for this purpose, are measured as contributions less benefit payments and expenses. If the System has negative cash flows and actual returns are below the assumed rate, there are fewer assets to be reinvested to earn the higher returns that typically follow. While any negative cash flow will produce such a result, it is typically a negative cash flow of more than 5% of market value that may cause liquidity concerns. While this is not a concern for INPRS at this time, it is important to monitor this metric so that any trends can be identified. Note that values shown in the table on the following page are for the total System as all benefits are paid from one trust.

MATURITY MEASURES
2019 Risk Report Indiana Public Retirement System 11
Aggregate Cash Flow ($ Millions)
Market Value Net Cash Flow Fiscal Benefit Payments of Assets as a Percent
Year End Contributions and Expenses Net Cash Flow (MVA) of MVA
6/30/01 $1,241.1 $957.5 $283.6 $15,863.4 1.79% 6/30/02 1,134.5 996.2 138.3 15,375.9 0.90% 6/30/03 1,202.2 1,038.9 163.3 16,305.3 1.00% 6/30/04 1,071.8 1,131.9 (60.1) 18,627.3 (0.32%) 6/30/05 1,116.2 1,220.5 (104.3) 20,202.2 (0.52%)
6/30/06 1,363.9 1,355.8 8.1 22,154.7 0.04% 6/30/07 1,461.3 1,516.7 (55.4) 25,881.6 (0.21%) 6/30/08 1,583.7 1,616.0 (32.3) 24,095.7 (0.13%) 6/30/09 1,660.5 1,630.9 29.7 19,487.0 0.15% 6/30/10 1,700.0 1,770.5 (70.5) 22,050.8 (0.32%)
6/30/11 1,745.9 2,068.6 (322.7) 23,776.8 (1.36%) 6/30/12 1,839.1 2,169.8 (330.7) 25,507.8 (1.30%) 6/30/13 2,262.4 2,272.1 (9.7) 27,010.4 (0.04%) 6/30/14 2,060.6 2,346.1 (285.5) 30,155.0 (0.95%) 6/30/15 2,116.6 2,556.8 (440.1) 29,819.1 (1.48%)
6/30/16 2,232.9 2,547.0 (314.1) 29,829.1 (1.05%) 6/30/17 2,184.0 2,587.4 (403.4) 31,769.0 (1.27%) 6/30/18* 2,099.4 2,583.0 (483.6) 28,495.0 (1.70%)
*Excludes asset transfers of Defined Contribution balances to the independent administrator for PERF and TRF funds.
(2.0%)
(1.5%)
(1.0%)
(0.5%)
0.0%
0.5%
1.0%
1.5%
2.0%
June 30,
Net Cash Flows as a Percent of MVA
MATURITY MEASURES
2019 Risk Report Indiana Public Retirement System 12
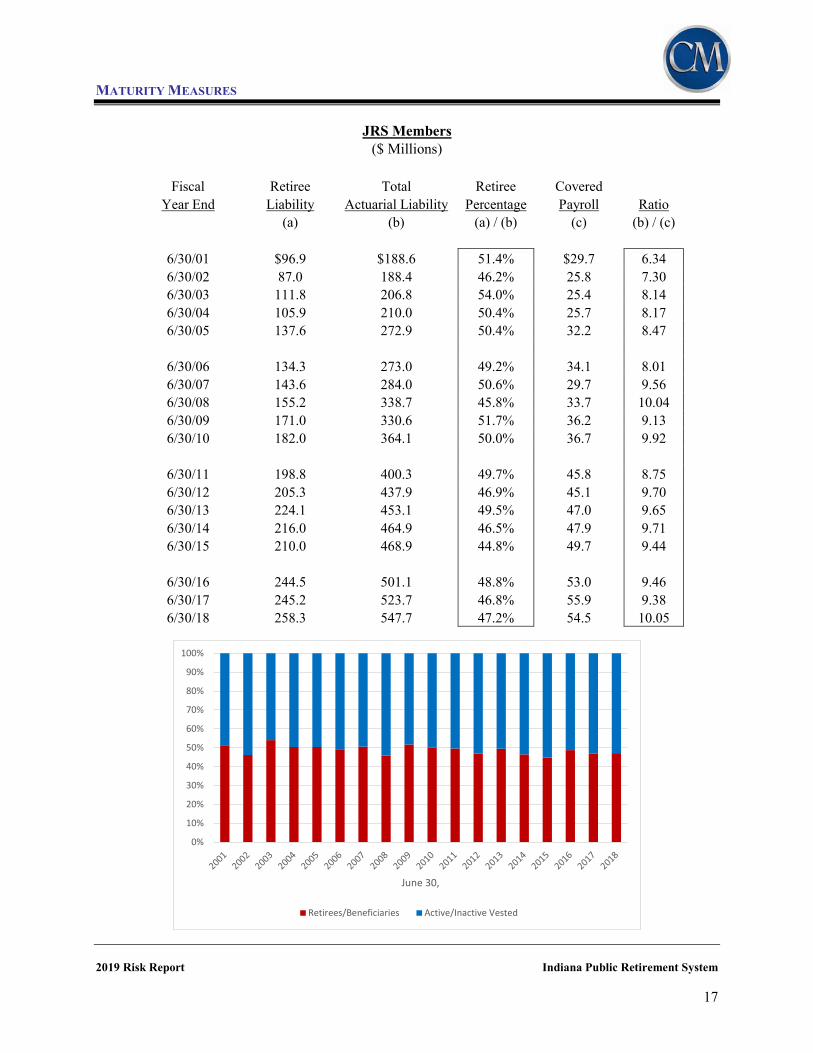
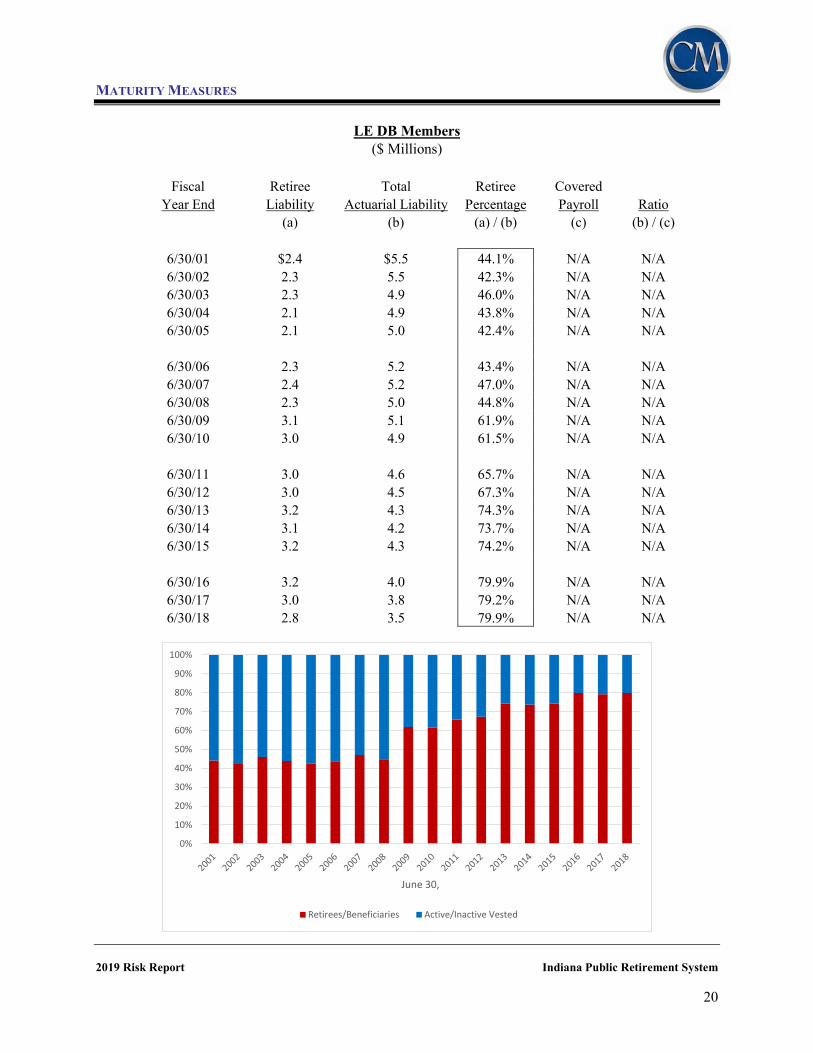
Liability Maturity Measurements As discussed earlier, most public sector retirement systems, including INPRS, have been in operation for over 50 years. As a result, they have aging plan populations indicated by a decreasing ratio of active members to retirees and a growing percentage of retiree liability when compared to the total. The retirement of the remaining baby boomers over the next 10-15 years is expected to further exacerbate the aging of the retirement system population. With more of the total liability residing with retirees, investment volatility has a greater impact on the funding of the system since it is more difficult to restore the system financially after losses occur when there is comparatively less payroll over which to spread costs. The following pages show how the proportion of retiree liability has increased through time. As would be expected, the proportion is moving toward 100% for the two closed plans, while the proportion still remains low for TRF ’96. Among the remaining plans, JRS has a notably higher retiree proportion, partly explained by the fact that judges enter the plan at older ages than active members of other plans and therefore have shorter careers. Further, the PERF and TRF plans have a notable drop in 2018 with the separation of the DC plan assets and obligations. A related measure is the ratio of the actuarial liability to payroll. This measure reflects both the proportion of liability as well as the value of the benefits for active members. A review of the following pages shows that there is a tendency for both of these measures to move together. One noteworthy comparison is that JRS and PARF are more similar when examining the proportion of retiree liability than when comparing the liability to the payroll. This is because the PARF benefits, which are essentially the difference between the JRS benefits and the PERF benefits, are significantly less valuable than the JRS benefits. As these two ratios increase, the contributions required to fund the plan also grow relative to payroll if the plan funded ratio is held constant. If the funded ratio improves, the required contributions will be more stable or even decline. Thus, even though the ’77 Fund has a larger actuarial liability to payroll ratio (largely because public safety benefits and retirement ages result in valuable benefits), the fact that it was over 100% funded in the June 30, 2018 valuation means that contribution rates are anticipated to be able to remain level.

MATURITY MEASURES
2019 Risk Report Indiana Public Retirement System 13
PERF Members ($ Millions)
Fiscal Retiree Total Retiree Covered Year End Liability Actuarial Liability Percentage Payroll Ratio
(a) (b) (a) / (b) (c) (b) / (c)
6/30/01 $2,426.1 $8,305.7 29.2% $3,587.1 2.32 6/30/02 2,582.1 9,066.1 28.5% 3,785.2 2.40 6/30/03 2,765.0 9,034.6 30.6% 3,952.2 2.29 6/30/04 2,927.9 9,844.4 29.7% 4,198.9 2.34 6/30/05 3,301.3 10,858.3 30.4% 4,318.5 2.51
6/30/06 3,648.8 11,450.9 31.9% 4,322.2 2.65 6/30/07 4,007.4 12,439.8 32.2% 4,385.7 2.84 6/30/08 4,227.4 13,103.2 32.3% 4,600.4 2.85 6/30/09 4,611.3 13,506.3 34.1% 4,931.4 2.74 6/30/10 4,931.6 14,506.1 34.0% 4,896.0 2.96
6/30/11 5,370.8 14,913.1 36.0% 4,818.8 3.09 6/30/12 5,895.8 15,784.2 37.4% 4,904.1 3.22 6/30/13 6,367.8 16,145.7 39.4% 4,766.9 3.39 6/30/14 6,250.9 16,732.2 37.4% 5,080.1 3.29 6/30/15 6,981.3 17,980.6 38.8% 4,964.8 3.62
6/30/16 7,595.1 18,408.9 41.3% 5,014.0 3.67 6/30/17 7,835.0 19,106.2 41.0% 5,130.4 3.72 6/30/18 7,768.2 16,091.4 48.3% 5,210.2 3.09

MATURITY MEASURES
2019 Risk Report Indiana Public Retirement System 14
TRF Pre-‘96 Members ($ Millions)
Fiscal Retiree Total Retiree Covered Year End Liability Actuarial Liability Percentage Payroll Ratio
(a) (b) (a) / (b) (c) (b) / (c)
6/30/02 $4,411.7 $13,497.8 32.7% $2,551.2 5.29 6/30/03 4,832.8 13,354.9 36.2% 2,448.3 5.45 6/30/04 5,116.2 13,548.5 37.8% 2,384.5 5.68 6/30/05 5,653.5 14,254.1 39.7% 2,305.7 6.18
6/30/06 6,238.1 15,002.5 41.6% 2,237.4 6.71 6/30/07 7,063.9 15,988.3 44.2% 2,376.4 6.73 6/30/08 7,244.4 15,792.3 45.9% 2,295.8 6.88 6/30/09 7,891.3 16,027.1 49.2% 2,030.5 7.89 6/30/10 8,153.2 16,282.1 50.1% 1,865.1 8.73
6/30/11 8,556.0 16,318.4 52.4% 1,762.8 9.26 6/30/12 9,260.1 16,522.0 56.0% 1,637.1 10.09 6/30/13 10,079.1 16,462.4 61.2% 1,383.4 11.90 6/30/14 9,686.4 16,355.2 59.2% 1,383.2 11.82 6/30/15 10,488.1 17,017.7 61.6% 1,178.8 14.44
6/30/16 11,358.2 16,840.2 67.4% 1,044.1 16.13 6/30/17 11,653.7 16,736.8 69.6% 933.3 17.93 6/30/18 11,161.0 14,583.2 76.5% 750.7 19.43

MATURITY MEASURES
2019 Risk Report Indiana Public Retirement System 15
TRF ‘96 Members ($ Millions)
Fiscal Retiree Total Retiree Covered Year End Liability Actuarial Liability Percentage Payroll Ratio
(a) (b) (a) / (b) (c) (b) / (c)
6/30/02 $17.3 $1,166.9 1.5% $1,004.5 1.16 6/30/03 107.7 1,392.5 7.7% 1,136.9 1.22 6/30/04 148.9 1,649.4 9.0% 1,267.2 1.30 6/30/05 219.7 2,010.7 10.9% 1,428.6 1.41
6/30/06 282.6 2,363.1 12.0% 1,565.3 1.51 6/30/07 449.5 2,827.6 15.9% 1,891.6 1.49 6/30/08 514.9 2,957.8 17.4% 2,052.7 1.44 6/30/09 432.9 3,135.4 13.8% 2,308.5 1.36 6/30/10 483.1 3,614.6 13.4% 2,447.5 1.48
6/30/11 544.5 3,996.8 13.6% 2,507.2 1.59 6/30/12 646.2 4,338.3 14.9% 2,595.0 1.67 6/30/13 781.9 4,749.4 16.5% 2,740.9 1.73 6/30/14 759.2 5,237.0 14.5% 2,740.7 1.91 6/30/15 897.0 5,905.7 15.2% 2,827.3 2.09
6/30/16 1,079.3 6,391.8 16.9% 3,004.2 2.13 6/30/17 1,213.8 6,914.2 17.6% 3,032.3 2.28 6/30/18 1,232.1 5,563.3 22.1% 3,374.9 1.65

MATURITY MEASURES
2019 Risk Report Indiana Public Retirement System 16
’77 Fund Members ($ Millions)
Fiscal Retiree Total Retiree Covered
Year End Liability Actuarial Liability Percentage Payroll Ratio (a) (b) (a) / (b) (c) (b) / (c)
6/30/01 $384.1 $1,620.3 23.7% $389.2 4.16 6/30/02 447.0 1,808.8 24.7% 396.2 4.56 6/30/03 457.8 1,766.8 25.9% 433.0 4.08 6/30/04 452.8 1,875.5 24.1% 469.8 3.99 6/30/05 436.6 2,064.2 21.2% 493.7 4.18
6/30/06 503.5 2,415.1 20.8% 522.2 4.62 6/30/07 546.6 2,649.5 20.6% 557.6 4.75 6/30/08 655.8 2,889.3 22.7% 604.0 4.78 6/30/09 765.9 3,150.8 24.3% 649.0 4.85 6/30/10 859.6 3,332.7 25.8% 675.8 4.93
6/30/11 970.7 3,639.0 26.7% 687.3 5.29 6/30/12 1,135.5 4,122.4 27.5% 697.1 5.91 6/30/13 1,288.5 4,392.9 29.3% 706.6 6.22 6/30/14 1,280.9 4,707.0 27.2% 734.0 6.41 6/30/15 1,362.0 4,680.7 29.1% 764.2 6.12
6/30/16 1,532.9 5,039.8 30.4% 791.5 6.37 6/30/17 1,715.5 5,385.8 31.9% 829.7 6.49 6/30/18 1,910.2 5,839.7 32.7% 863.2 6.76
0%
10%
20%
30%
40%
50%
60%
70%
80%
90%
100%
June 30,
Retirees/Beneficiaries Active/Inactive Vested
MATURITY MEASURES
2019 Risk Report Indiana Public Retirement System 17
JRS Members ($ Millions)
Fiscal Retiree Total Retiree Covered
Year End Liability Actuarial Liability Percentage Payroll Ratio (a) (b) (a) / (b) (c) (b) / (c)
6/30/01 $96.9 $188.6 51.4% $29.7 6.34 6/30/02 87.0 188.4 46.2% 25.8 7.30 6/30/03 111.8 206.8 54.0% 25.4 8.14 6/30/04 105.9 210.0 50.4% 25.7 8.17 6/30/05 137.6 272.9 50.4% 32.2 8.47
6/30/06 134.3 273.0 49.2% 34.1 8.01 6/30/07 143.6 284.0 50.6% 29.7 9.56 6/30/08 155.2 338.7 45.8% 33.7 10.04 6/30/09 171.0 330.6 51.7% 36.2 9.13 6/30/10 182.0 364.1 50.0% 36.7 9.92
6/30/11 198.8 400.3 49.7% 45.8 8.75 6/30/12 205.3 437.9 46.9% 45.1 9.70 6/30/13 224.1 453.1 49.5% 47.0 9.65 6/30/14 216.0 464.9 46.5% 47.9 9.71 6/30/15 210.0 468.9 44.8% 49.7 9.44
6/30/16 244.5 501.1 48.8% 53.0 9.46 6/30/17 245.2 523.7 46.8% 55.9 9.38 6/30/18 258.3 547.7 47.2% 54.5 10.05
0%
10%
20%
30%
40%
50%
60%
70%
80%
90%
100%
June 30,
Retirees/Beneficiaries Active/Inactive Vested

MATURITY MEASURES
2019 Risk Report Indiana Public Retirement System 18
PARF Members ($ Millions)
Fiscal Retiree Total Retiree Covered
Year End Liability Actuarial Liability Percentage Payroll Ratio (a) (b) (a) / (b) (c) (b) / (c)
6/30/01 $2.2 $20.4 10.6% $13.6 1.50 6/30/02 2.0 22.4 8.8% 14.4 1.55 6/30/03 2.1 15.7 13.3% 13.2 1.19 6/30/04 2.4 22.6 10.7% 15.1 1.49 6/30/05 2.3 25.7 8.9% 16.7 1.55
6/30/06 2.3 29.2 7.7% 19.2 1.52 6/30/07 3.2 32.1 10.0% 18.1 1.77 6/30/08 5.2 38.1 13.6% 20.6 1.85 6/30/09 10.4 44.6 23.3% 20.8 2.15 6/30/10 12.6 49.2 25.5% 21.0 2.34
6/30/11 16.8 53.3 31.6% 18.1 2.95 6/30/12 18.7 56.1 33.3% 21.7 2.58 6/30/13 22.0 61.9 35.5% 21.2 2.92 6/30/14 22.7 65.3 34.7% 21.4 3.05 6/30/15 26.6 77.9 34.2% 22.0 3.54
6/30/16 37.7 85.0 44.3% 22.2 3.83 6/30/17 38.5 96.7 39.8% 23.5 4.11 6/30/18 39.0 103.3 37.8% 22.0 4.69
0%
10%
20%
30%
40%
50%
60%
70%
80%
90%
100%
June 30,
Retirees/Beneficiaries Active/Inactive Vested

MATURITY MEASURES
2019 Risk Report Indiana Public Retirement System 19
EG&C Members ($ Millions)
Fiscal Retiree Total Retiree Covered
Year End Liability Actuarial Liability Percentage Payroll Ratio (a) (b) (a) / (b) (c) (b) / (c)
6/30/01 $17.1 $52.0 32.9% $12.5 4.17 6/30/02 18.8 55.9 33.6% 12.7 4.42 6/30/03 17.6 52.0 33.9% 11.9 4.35 6/30/04 17.8 50.0 35.6% 10.2 4.90 6/30/05 18.9 60.0 31.5% 13.2 4.53
6/30/06 20.9 64.8 32.2% 14.9 4.35 6/30/07 24.6 74.5 33.0% 17.7 4.20 6/30/08 28.9 77.2 37.4% 21.3 3.62 6/30/09 35.0 89.3 39.2% 25.2 3.54 6/30/10 36.0 97.9 36.8% 26.7 3.66
6/30/11 46.7 101.5 46.0% 24.0 4.23 6/30/12 53.9 113.3 47.6% 25.8 4.40 6/30/13 56.0 118.1 47.4% 26.2 4.51 6/30/14 54.6 123.6 44.2% 26.7 4.64 6/30/15 61.5 132.8 46.3% 25.8 5.15
6/30/16 67.4 139.0 48.5% 26.2 5.31 6/30/17 69.2 142.6 48.5% 28.1 5.07 6/30/18 68.8 140.1 49.1% 30.1 4.65
0%
10%
20%
30%
40%
50%
60%
70%
80%
90%
100%
June 30,
Retirees/Beneficiaries Active/Inactive Vested
MATURITY MEASURES
2019 Risk Report Indiana Public Retirement System 20
LE DB Members ($ Millions)
Fiscal Retiree Total Retiree Covered
Year End Liability Actuarial Liability Percentage Payroll Ratio (a) (b) (a) / (b) (c) (b) / (c)
6/30/01 $2.4 $5.5 44.1% N/A N/A 6/30/02 2.3 5.5 42.3% N/A N/A 6/30/03 2.3 4.9 46.0% N/A N/A 6/30/04 2.1 4.9 43.8% N/A N/A 6/30/05 2.1 5.0 42.4% N/A N/A
6/30/06 2.3 5.2 43.4% N/A N/A 6/30/07 2.4 5.2 47.0% N/A N/A 6/30/08 2.3 5.0 44.8% N/A N/A 6/30/09 3.1 5.1 61.9% N/A N/A 6/30/10 3.0 4.9 61.5% N/A N/A
6/30/11 3.0 4.6 65.7% N/A N/A 6/30/12 3.0 4.5 67.3% N/A N/A 6/30/13 3.2 4.3 74.3% N/A N/A 6/30/14 3.1 4.2 73.7% N/A N/A 6/30/15 3.2 4.3 74.2% N/A N/A
6/30/16 3.2 4.0 79.9% N/A N/A 6/30/17 3.0 3.8 79.2% N/A N/A 6/30/18 2.8 3.5 79.9% N/A N/A
0%
10%
20%
30%
40%
50%
60%
70%
80%
90%
100%
June 30,
Retirees/Beneficiaries Active/Inactive Vested

QUALITATIVE ANALYSIS
2019 Risk Report Indiana Public Retirement System 21
QUALITATIVE ANALYSIS
ASOP 51 provides that the assessment of risk does not necessarily have to be quantitative, but may be qualitative. This report will provide quantitative analysis in a later section, but first we will discuss the overall assessment of risk for INPRS from a qualitative perspective.
(1) INPRS Funding Policy
INPRS has eight plans, each funded with a separate contribution approach. Some funds receive member contributions as set by legislation. For the state-appropriated funds (TRF Pre-’96 Fund, JRS, PARF, and LE DB), the Board recommends the contribution amounts to the Indiana Legislature. For the remaining funds (PERF, TRF ’96, ’77 Fund, and EG&C), the Board sets the employer contribution rates. In broad terms, the first step in determining the contribution rate or amount is based on considering the normal cost plus the amortization of the Unfunded Actuarial Accrued Liability (UAAL). The amortization method creates a new layer of UAAL each year that is amortized over a closed 20-year period (five years for TRF Pre-’96 and LE DB since they have no new entrants) as a level dollar amount. Should a plan be over 100% funded, the surplus is amortized over an open 30-year period. Where the INPRS Board sets the employer contribution rates, the Board Policy Contribution Rate remains unchanged from the prior year unless the actuarial contribution rate is higher, in which case the rate is increased to that level. If the funded ratio exceeds 105%, the Board Contribution Policy Rate is reduced 25% of the way from the current rate to the normal cost rate. Once the funded ratio exceeds 120%, the contribution rate will be set at the normal cost rate. The basic funding approach adopted by the INPRS’ Board has some very positive positive features. Using level-dollar amortization is more conservative than the level-percent of payroll amortization method used by many public plans. The level-percent amortization method results in amortization payments that increase each year by an expected payroll growth. This results in lower payments initially, but higher payments later when payroll is larger. The level-dollar amortization method pays down the UAAL at a faster rate, partly by being more expensive (as a rate of pay) in the early years. While this is a conservative approach, some would argue that by not funding in a level manner, the current generation of contributors (employers and ultimately taxpayers) are paying more than its share while future generations will pay less. This is a public policy decision, not an actuarial decision. Further discussion of how this reduces risk is contained in later sections of this report. A second positive feature for the PERF, TRF-’96, ’77 Fund, and EG&C is the policy of maintaining the current contribution rate until the Funds have a funded ratio of at least 105%. This approach creates contribution stability and predictability which are often desired by employers, and also serves to accelerate funding progress. As with the level-dollar amortization method, more rapid funding now means that the stakeholders currently contributing are doing so to the benefit of those to come (if all assumptions are met). TRF Pre-’96 is an exception to the general funding approach. Historically, this Fund was operated as a pay-as-you-go program rather than as a funded plan. With the creation of a new, funded plan for teachers in 1996, the strategy is to now gradually build up assets that will fund the remaining benefit payments. To meet this goal, annual allocations are currently being increased 3% each year. Once the allocations exceed current benefit payments, the allocations will be reduced to the annual benefit needs until sufficient assets are available to pay the remaining benefits. While the Fund is closed and gradually winding down, there is still a long period during which benefits will be paid. There may be some degree of variability in
QUALITATIVE ANALYSIS
2019 Risk Report Indiana Public Retirement System 22
contribution needs that will increase proportionately over time, but because the funding needs will ultimately begin to diminish, the amount of variability will likely be manageable in the context of the overall state budget.
(2) Legal Obligation to Make Contributions and Historical Contributions
There is a direct correlation between healthy, well-funded retirement systems and consistent contributions equal to the full actuarial contribution rate each year. Indiana has exhibited a commitment to making the actuarially-determined contributions, or, for the TRF Pre-’96 Fund, developed and implemented a strategy to systematically fund the obligations. Part of this commitment is that the majority of employers (in PERF, TRF-’96, and the ’77 Fund) are legally obligated to pay the contribution rate set by the INPRS Board. Plan sponsors who have frequently chosen to defer funding are finding themselves facing some very challenging times, with increased risk and uncertainty in the future.
(3) Benefit Design Features INPRS covers several distinct groups of members, and so it is not surprising that the benefit designs for the various groups have correspondingly distinct features. In this section, we wish to discuss three of these features that are especially interesting from a risk analysis perspective:
• post-retirement benefit adjustments, • DROP benefits, and • the options for election within PERF’s hybrid plan.
We stress again that risk is not inherently good or bad, so the presence of a feature that alters a Fund’s risk profile does not mean that the feature is good or bad, either.
Post-retirement Adjustments: One of the most significant and fundamental intents of a retirement plan is to provide an income stream for those people who have retired at the end of a career. For purchasing power of that income stream to be maintained throughout a retiree’s lifetime, the amount of income increase through time to mitigate the impact of inflation. There are various ways in which this can be accomplished, including as an automatic adjustment, as a periodic plan sponsor initiative, or by some other mechanism outside the plan. The ’77 Fund and JRS provide for the impact of inflation by providing an automatic Cost-of-Living-Adjustment (COLA) as part of the benefit structure. The ’77 Fund links the increase to actual inflation (not to exceed 3%), while the JRS increase is linked to the increase in the salary for actively employed judges and magistrates. Because these COLAs are set in statute, the contribution rate is calculated reflecting future expected COLAs; i.e., they are pre-funded. Predictable, pre-funded COLAs tend to create less risk than those that are granted on an ad hoc basis, particularly if there is no offsetting funding. Further, the 3% cap on the ’77 Fund reduces the risk to the Fund that would result from high inflation. Not only do inflation and salary increases tend to move together over the long run, but there is also some tendency for nominal investment returns to also increase with inflation. This means that when inflation is higher and the COLAs are larger, the investment return may also be larger, helping to offset the impact of the larger-than-expected COLAs. Of course, a low-inflation environment will have lower COLAs, helping mitigate the impact of lower investment returns. The remaining funds (except PARF which is an “excess” benefit over the PERF benefit) do not have a statutory COLA, but for many years have provided retirees with a “13th check”, based on years of

QUALITATIVE ANALYSIS
2019 Risk Report Indiana Public Retirement System 23
service. This 13th check requires legislative approval each biennium, but has not generally separately been funded as part of the legislation, although the use of a post-retirement increase assumption meant that sufficient pre-funding was occurring. In the 2018 legislative session, a new mechanism for providing post-retirement benefits was developed. Funding for these benefits is provided by an allocation of lottery proceeds (to be used for TRF Pre-’96 and the other funds as needed) and by a supplemental benefit funding rate set by the INPRS Board. This supplemental rate may be up to 1% of pay, and was initially set with an equal reduction in the employer contribution rate so the total employer rate was unchanged. The Legislature may grant post-retirement benefits (such as a 13th check or a permanent increase) to members of all the funds as long as the INPRS Board certifies that each Supplemental Reserve Account (SRA) has sufficient funds to pay the benefit obligation, including future years if a permanent increase is granted. Because SRA funding has just begun, there is no history yet regarding the type of benefits will be proposed or granted, or how much funding will be accumulated. However, there are some observations that can be made regarding risk. First, because any additional benefit must be funded from assets already accumulated, the risk of unfunded benefits is reduced. Second, the granting of additional benefits is not directly tied to inflation or any other uncontrolled variable, also limits risk. Finally, depending upon the pattern of benefits granted and because active payroll and lottery funds are being used to fund benefits for current retirees, it is possible that the SRA contributions could vary year to year (up to 1%), providing a minor source of volatility. DROP benefits: Under a Deferred Retirement Option Program (DROP), active members may elect to have their retirement benefits commence without actually ending employment. During the time they continue to be actively employed, the benefit payments are accumulated within the trust, and then the accumulation is paid as a lump sum when employment ends. Any additional service and pay during the DROP period do not result in a revision of the retirement benefit. There are additional parameters governing the program, but they are not relevant to this discussion. Within INPRS, the ’77 Fund and EG&C have this provision. Because the DROP benefit is a plan provision, it is anticipated in the funding requirements. Of course, to the extent that actual behavior differs from expected, there could be actuarial gains or losses. A frequent goal of these benefits is to encourage long-time employees to continue to work, especially when there is a service cap in place (as is the case for the ’77 Fund, for example). Some of the benefits may be external to the retirement system, including retaining expertise, maintaining staffing levels, non-retirement benefit costs, etc., but there can be a cost impact for retirement systems. In the case of an individual incented to remain in employment rather than retire, the Fund receives additional contributions during the DROP period without any increase in benefits paid. Conversely, consider someone who was intending to retire at a target age past their service cap. If this person enters DROP at the service maximum and leaves DROP at the target age, the system receives no additional funding compared to the no-DROP option, but still pays more benefits than it would have. Since the behavior in the absence of the DROP is unknowable, the actual cost or savings of a DROP cannot be determined. Because of the uncertainty, DROP, like any retirement assumption, is inherently a risk, and actuarial experience may be either be favorable or unfavorable depending upon what individuals choose to do. Plan Election and Hybrid Features: The PERF and TRF plan designs provide that member contributions are directed into a Defined Contribution (DC) plan and the employer contributions fund a Defined Benefit (DB) plan. New employees may now elect the MyChoice option which is a DC-only benefit structure in which a portion of the employer contribution is allocated to the member DC account

QUALITATIVE ANALYSIS
2019 Risk Report Indiana Public Retirement System 24
and the rest goes to the DB plan to fund the UAAL. (Some employers have elected to offer only the original DB/DC hybrid or only the MyChoice plan.) This choice option has some risk implications. First, for every person who is in the DC-only plan, the retirement risks (e.g. investment return, longevity, and inflation) have been transferred from the employer to the individual, thus reducing the PERF and TRF plan risks. (While this risk transfer is most likely not a net-zero transaction with the member taking on more risk than the Fund gives up, we are focusing only on the Funds’ risk in this report.) Thus, increased DC plan participation will most likely reduce DB plan risk. The funding mechanism, however, is such that the employer will pay the same contribution rate regardless of the member election. This avoids any incentive for the employer to influence an employee’s decision. Nonetheless, some employers have nonetheless opted to provide some or all employees with only the DB-DC hybrid plan or only the DC plan. A second consideration is that members may elect the DB or DC plan based partly on their perceived employment patterns. Those who expect to retire at younger ages may find that the DB plan is a better fit, while those who do not expect to remain in covered employment long may choose the DC plan. In this case, the DB plan is selected by those for whom the cost is higher than average, while the DC plan is selected by those for whom the value of the DC contributions upon termination will be more valuable than the DB benefit. This adverse selection could result in an increase in the normal cost rate for the DB plan, which in turn also would increase the contributions to the DC accounts. While this is theoretically a risk, the magnitude of the risk is limited by the fact that most new employees do not know how their career will unfold, nor are most of them likely to perform such a detailed mathematical analysis. Finally, we note that because MyChoice is a relatively new feature, the utilization over time is not known. To the extent that it is utilized, the active membership of the DB funds will be lower than it would have been. For many systems, this would be a concern because the UAAL is amortized as a level percentage of payroll and typically require a constant population for the funding model to work properly. For INPRS, this is not as much of an issue because the UAAL payment is calculated as a level dollar amount and is collected on all payroll (DB and DC plans).

QUANTITATIVE ANALYSIS – DEMOGRAPHIC ASSUMPTIONS
2019 Risk Report Indiana Public Retirement System 25
QUANTITATIVE ANALYSIS There are a number of risks inherent in the funding of a defined benefit plan. These include:
• demographic risks such as mortality, payroll growth, aging population including the impact of baby boomers, and retirement ages;
• economic risks, such as investment return and inflation; • contribution risk, i.e., the potential for contribution rates to be too high for the plan
sponsor/employer to pay; and • external risks such as the regulatory and political environment.
The various risk factors for a given system can have a significant impact – favorable or unfavorable – on the actuarial projection of liabilities and contribution rates. Under ASOP 51, the actuary is required to include plan-specific commentary regarding the risks that are identified. However, such comments can be qualitative rather than quantitative. In this section of the report, we include quantitative analysis to assist with a deeper understanding of some of the key risks for INPRS. Demographic Risks Demographic risks are those arising from the actual behavior of members differing from that expected based on the actuarial assumptions. These changes may arise when a significant portion of members are influenced to take some particular action due to employer or governmental actions, when there are improvements in medicine that affect broad groups of retirees, when societal trends encourage new behavior, or they may simply be random. Examples include early retirement windows, new drugs to treat common diseases, or trends across society to work longer before retiring. Many of these risks are minor in nature since they unfold gradually and generally have a small impact on a retirement system. Some, however, are comparatively more significant and warrant additional discussion. Mortality Risk A key demographic risk for all retirement systems, including INPRS, is improvement in mortality (longevity) greater or less than anticipated because benefits are paid for members’ lifetimes. While the actuarial assumptions used in the valuation reflect small, continuous improvements in mortality experience each year, and these assumptions are evaluated and refined in every experience study, the risk arises because there is a possibility of some sudden shift, perhaps from a significant medical breakthrough that could quickly impact life expectancy and increase liabilities. Likewise, there is some possibility of a significant public health crisis that could result in a significant number of additional deaths in a short time period, which would also be significant, although more easily absorbed. Over recent history, mortality rates have improved on average at a rate of about 1 percent per year for the core ages of retirees. The mortality projection scale used for the valuation is somewhat more complex than this, but it suffices for illustration to think of the current mortality improvement assumption as also being about 1% per year. To consider longevity risk, we considered the impact of faster improvements in life expectancies of 1.5 times as much improvement, along with only half as much improvement. As the following charts illustrate, a greater improvement factor greatly increases the life expectancy over time.

QUANTITATIVE ANALYSIS – DEMOGRAPHIC ASSUMPTIONS
2019 Risk Report Indiana Public Retirement System 26
In performing valuations, we do not directly use life expectancy values, but rather apply the mortality rates at each age directly. For 2019, if the mortality improvement scale were cut in half (to a 0.5% per year improvement), the liabilities would decrease by about 1% at age 62, while if the mortality improvement scale increased by 150% (resulting in a 1.5% per year improvement), liabilities at age 62 would increase approximately 1%. Over the next 20 years, the impact of either change would roughly double. Note that these changes in mortality improvement are noticeable departures from historical norms, but they are plausible.
Active Population Growth or Decline Risks Valuations consider the data on a single date and do not directly reflect future members. However, in reality, if the active membership increases or decreases, it will lead to decreases or increases in the actuarial contribution rate (but not the dollar amount) needed to fund the UAAL. Additionally, as discussed earlier in the report, there could be some implications for PERF and TRF ’96 if the population demographics are changing due to selection of the MyChoice option.
The following graphs show the historical count and covered payroll for active members in each fund. The historical patterns are helpful in evaluating the risk ahead. The decreasing count and level payroll for PERF in recent years, for example, indicates some possibility of upward pressure on the UAAL contribution rate. TRF ’96 has increasing active membership (as TRF Pre-’96 is declining) which should help reduce the likelihood of the UAAL rate increasing. The other plans (except the closed LE DB fund) show reasonably steady populations and modest payroll growth, allowing for fairly stable contribution rates if all other assumptions are met.
84.2 84.884.886.1
85.4
87.4
76
80
84
88
92
Age 62 in 2019 Age 62 in 2039
Life Expectancy: 62-Year Old Male
50% of Improvement Baseline Improvement 150% of Improvement
86.4 87.086.988.187.6
89.3
76
80
84
88
92
Age 62 in 2019 Age 62 in 2039
Life Expectancy: 62-Year Old Female
50% of Improvement Baseline Improvement 150% of Improvement
020406080
100120140160
2001
2002
2003
2004
2005
2006
2007
2008
2009
2010
2011
2012
2013
2014
2015
2016
2017
2018
Thou
sand
s
Active Count(PERF Members)
0
1,000
2,000
3,000
4,000
5,000
6,000
2001
2002
2003
2004
2005
2006
2007
2008
2009
2010
2011
2012
2013
2014
2015
2016
2017
2018
Mill
ions
Covered Payroll(PERF Members)

QUANTITATIVE ANALYSIS – DEMOGRAPHIC ASSUMPTIONS
2019 Risk Report Indiana Public Retirement System 27
0
10,000
20,000
30,000
40,000
50,000
60,000
2001
2002
2003
2004
2005
2006
2007
2008
2009
2010
2011
2012
2013
2014
2015
2016
2017
2018
Active Count(TRF Pre - '96)
0
500
1,000
1,500
2,000
2,500
3,000
2001
2002
2003
2004
2005
2006
2007
2008
2009
2010
2011
2012
2013
2014
2015
2016
2017
2018
Mill
ions
Covered Payroll(TRF Pre - '96)
010,00020,00030,00040,00050,00060,00070,000
2001
2002
2003
2004
2005
2006
2007
2008
2009
2010
2011
2012
2013
2014
2015
2016
2017
2018
Active Count(TRF '96)
0500
1,0001,5002,0002,5003,0003,5004,000
2001
2002
2003
2004
2005
2006
2007
2008
2009
2010
2011
2012
2013
2014
2015
2016
2017
2018
Mill
ions
Covered Payroll(TRF '96)
0
200
400
600
800
1,000
2001
2002
2003
2004
2005
2006
2007
2008
2009
2010
2011
2012
2013
2014
2015
2016
2017
2018
Mill
ions
Covered Payroll('77 Fund)
02,0004,0006,0008,000
10,00012,00014,00016,000
2001
2002
2003
2004
2005
2006
2007
2008
2009
2010
2011
2012
2013
2014
2015
2016
2017
2018
Active Count('77 Fund)

QUANTITATIVE ANALYSIS – DEMOGRAPHIC ASSUMPTIONS
2019 Risk Report Indiana Public Retirement System 28
0
100
200
300
400
500
2001
2002
2003
2004
2005
2006
2007
2008
2009
2010
2011
2012
2013
2014
2015
2016
2017
2018
Active Count(JRS)
0
10
20
30
40
50
60
2001
2002
2003
2004
2005
2006
2007
2008
2009
2010
2011
2012
2013
2014
2015
2016
2017
2018
Mill
ions
Covered Payroll(JRS)
0
50
100
150
200
250
2001
2002
2003
2004
2005
2006
2007
2008
2009
2010
2011
2012
2013
2014
2015
2016
2017
2018
Active Count(PARF)
0
5
10
15
20
25
2001
2002
2003
2004
2005
2006
2007
2008
2009
2010
2011
2012
2013
2014
2015
2016
2017
2018
Mill
ions
Covered Payroll(PARF)
0
100
200
300
400
500
2001
2002
2003
2004
2005
2006
2007
2008
2009
2010
2011
2012
2013
2014
2015
2016
2017
2018
Active Count(EG&C)
05
101520253035
2001
2002
2003
2004
2005
2006
2007
2008
2009
2010
2011
2012
2013
2014
2015
2016
2017
2018
Mill
ions
Covered Payroll(EG&C)
010203040506070
2001
2002
2003
2004
2005
2006
2007
2008
2009
2010
2011
2012
2013
2014
2015
2016
2017
2018
Active Count(LE DB Fund)

QUANTITATIVE ANALYSIS – DEMOGRAPHIC ASSUMPTIONS
2019 Risk Report Indiana Public Retirement System 29
A decline in INPRS active membership could occur for a number of reasons, but the risk is likely different for each of the eight funds. Of course, a decline is expected for TRF Pre-’96 since it is closed and new teachers participate in TRF ’96. Other events that could arise in the future include such things as the state of Indiana experiencing severe and prolonged fiscal challenges that would lead to a reduction in the number of state PERF employees. Alternatively, if there is a decline in the student population, it could reduce the need to maintain the current level of teachers. Regardless of the cause for the decline, a substantial decrease in the active membership could pose a risk to the stability of contribution rates, even if the contribution dollar amounts are more stable or even declining. While INPRS avoids some of this risk by amortizing the UAAL as a level dollar amount, declines in active population still lead to higher contribution rates. Referring to the maturity measures shown earlier in the report, it should be evident that lower payroll will increase the Asset Volatility Ratio. Of course, an increase in active membership would decrease the actuarial contribution rate and Asset Volatility Ratio and reduce the actuarial contribution rate volatility. Other Demographic Risks Changes to retirement and termination rates are likely to occur through time as the nature of the workforce and societal expectations shift. For instance, over the past decade or so, we have observed a general shift in retirement patterns in which retirements are occurring later. This may be a function of economic considerations, expectations of longer life in retirement, a proportionate decrease in physically-demanding jobs, or changes in family composition. Such changes do affect the funding of the plan, but generally these changes are minor and gradual and are reflected in modified assumptions resulting from regular experience studies. The issue of retirement patterns deserves some additional comments. Generally speaking, if retirement occurs later, the cost of the benefits decreases. While later retirements may mean an individual’s annual benefit is larger due to additional service and higher pay, the individual is also expected to receive the benefit for a shorter period of time, a net reduction in the actuarial liability in most cases. Further, the plan receives additional contributions during the years of additional employment. Thus, delaying retirement has a positive impact from a system funding perspective, while earlier retirement has a negative impact. As noted, there appear to be some broad trends toward later retirements, but there are some risks from retirement changes that might materialize in the shorter term. First, at times states or large political subdivision employers decide to provide some sort of incentive (inside or outside of the retirement plan) for employees to retire during a specified short period of time. These early retirement windows, while less common than they used to be, produce a sudden actuarial loss to the system. A second shock to a system could occur if there were a sudden change in the economic environment. In the years following the 2008 financial crisis, we observed many plans had lower numbers of retirees. For PERF and TRF where there is a significant DC component of the benefits for individuals, an economic downturn is likely to encourage a delay in retirement because the DC accounts are lower than expected, while a surge in the economy might spur earlier retirements. From INPRS perspective, the economic downturn risk is moderated because the actuarial gain or loss from the retirement patterns would be a partial offset to the actuarial loss or gain on the asset portfolio. In the same way that changing retirement patterns can affect INPRS as a whole, changes in DROP patterns also affect the ’77 Fund and EG&C. Since DROP usually involves a multi-year commitment, behavioral changes will likely be less responsive to economic conditions. Changes in the utilization or the duration of participation in DROP are likely to unfold over time, allowing for gradual changes in assumptions as the trends are detected.

QUANTITATIVE ANALYSIS – DEMOGRAPHIC ASSUMPTIONS
2019 Risk Report Indiana Public Retirement System 30
Of course, special incentives to adjust behavior by an employer or as part of some change in plan provisions could lead to a short-term change, just as the early retirement windows affect retirement patterns. More significant changes in demographic assumptions are likely to be influenced by something significant such as a legislative change. Obviously, some changes in INPRS provisions or state employment rules could quickly change behavior patterns, but these would probably be anticipated as part of the legislation. Externally, a significant change in current Social Security or Medicare provisions could change retirement. Such changes cannot be easily quantified because the timing of such events, the impact of the event on behavior, and the magnitude of the behavior change cannot be reasonably anticipated.
QUANTITATIVE ANALYSIS – ECONOMIC ASSUMPTIONS
2019 Risk Report Indiana Public Retirement System 31
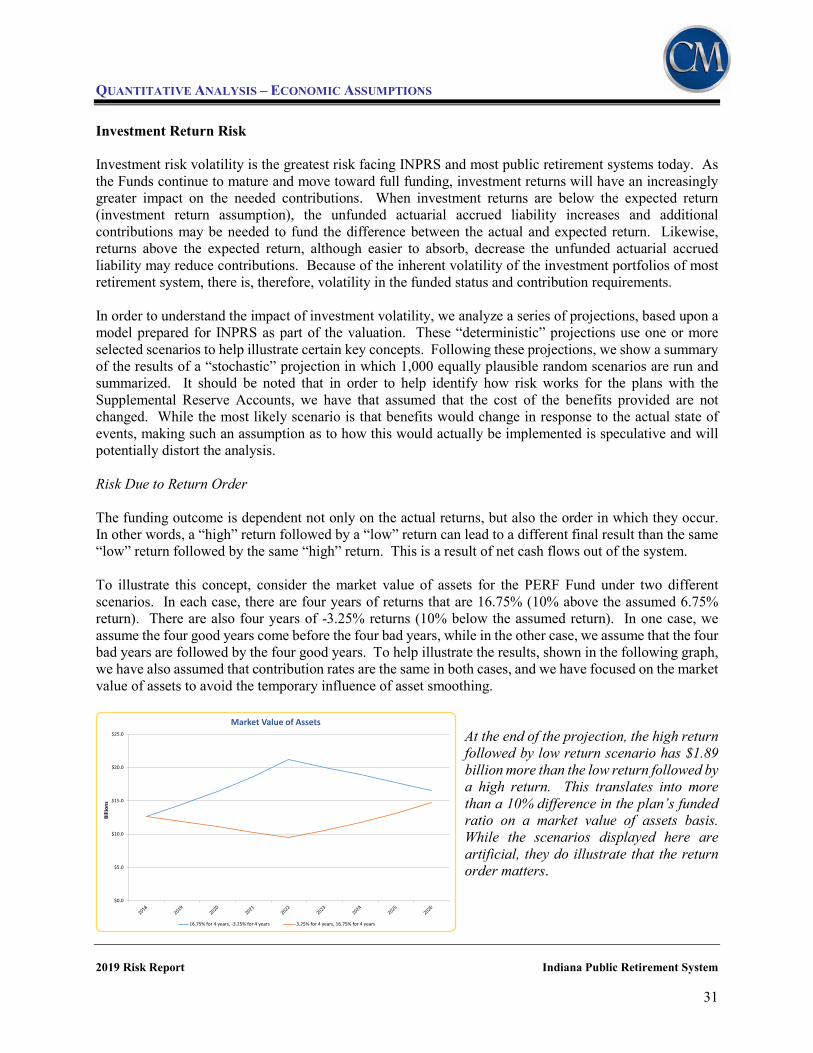
Investment Return Risk Investment risk volatility is the greatest risk facing INPRS and most public retirement systems today. As the Funds continue to mature and move toward full funding, investment returns will have an increasingly greater impact on the needed contributions. When investment returns are below the expected return (investment return assumption), the unfunded actuarial accrued liability increases and additional contributions may be needed to fund the difference between the actual and expected return. Likewise, returns above the expected return, although easier to absorb, decrease the unfunded actuarial accrued liability may reduce contributions. Because of the inherent volatility of the investment portfolios of most retirement system, there is, therefore, volatility in the funded status and contribution requirements. In order to understand the impact of investment volatility, we analyze a series of projections, based upon a model prepared for INPRS as part of the valuation. These “deterministic” projections use one or more selected scenarios to help illustrate certain key concepts. Following these projections, we show a summary of the results of a “stochastic” projection in which 1,000 equally plausible random scenarios are run and summarized. It should be noted that in order to help identify how risk works for the plans with the Supplemental Reserve Accounts, we have that assumed that the cost of the benefits provided are not changed. While the most likely scenario is that benefits would change in response to the actual state of events, making such an assumption as to how this would actually be implemented is speculative and will potentially distort the analysis. Risk Due to Return Order The funding outcome is dependent not only on the actual returns, but also the order in which they occur. In other words, a “high” return followed by a “low” return can lead to a different final result than the same “low” return followed by the same “high” return. This is a result of net cash flows out of the system. To illustrate this concept, consider the market value of assets for the PERF Fund under two different scenarios. In each case, there are four years of returns that are 16.75% (10% above the assumed 6.75% return). There are also four years of -3.25% returns (10% below the assumed return). In one case, we assume the four good years come before the four bad years, while in the other case, we assume that the four bad years are followed by the four good years. To help illustrate the results, shown in the following graph, we have also assumed that contribution rates are the same in both cases, and we have focused on the market value of assets to avoid the temporary influence of asset smoothing.
At the end of the projection, the high return followed by low return scenario has $1.89 billion more than the low return followed by a high return. This translates into more than a 10% difference in the plan’s funded ratio on a market value of assets basis. While the scenarios displayed here are artificial, they do illustrate that the return order matters.
$0.0
$5.0
$10.0
$15.0
$20.0
$25.0
Billi
ons
Market Value of Assets
16.75% for 4 years, -3.25% for 4 years -3.25% for 4 years, 16.75% for 4 years
QUANTITATIVE ANALYSIS – ECONOMIC ASSUMPTIONS
2019 Risk Report Indiana Public Retirement System 32
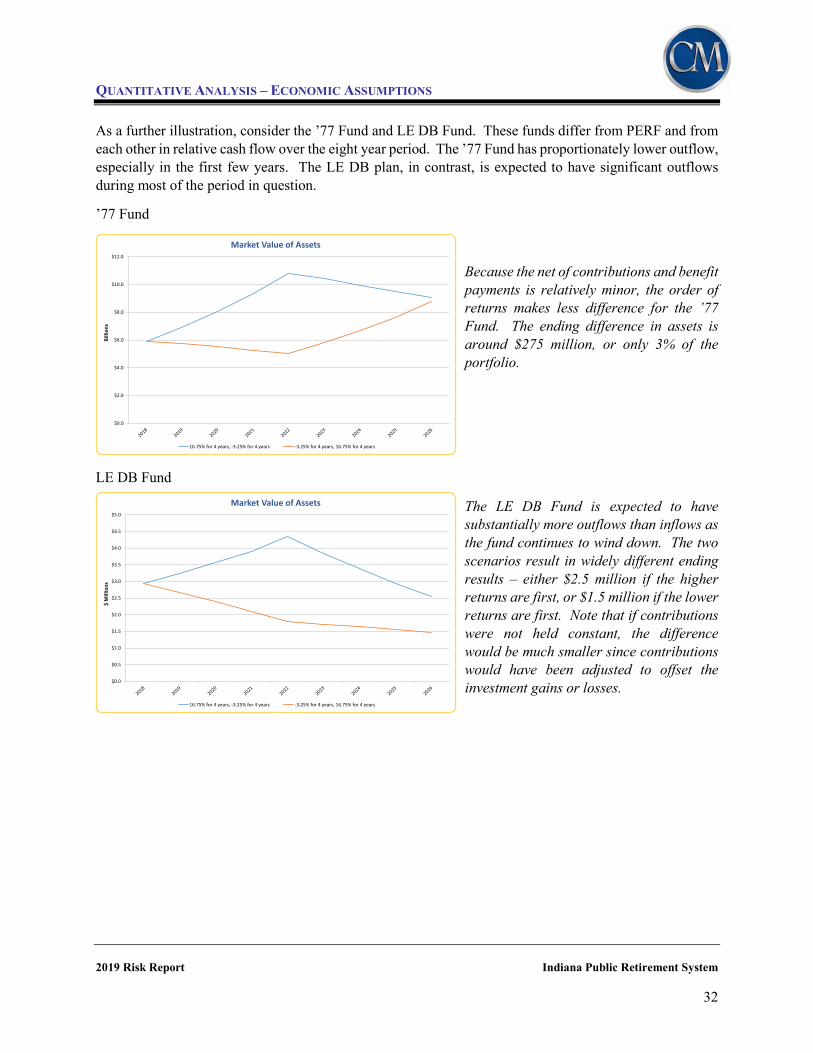
As a further illustration, consider the ’77 Fund and LE DB Fund. These funds differ from PERF and from each other in relative cash flow over the eight year period. The ’77 Fund has proportionately lower outflow, especially in the first few years. The LE DB plan, in contrast, is expected to have significant outflows during most of the period in question.
’77 Fund
Because the net of contributions and benefit payments is relatively minor, the order of returns makes less difference for the ’77 Fund. The ending difference in assets is around $275 million, or only 3% of the portfolio.
LE DB Fund
The LE DB Fund is expected to have substantially more outflows than inflows as the fund continues to wind down. The two scenarios result in widely different ending results – either $2.5 million if the higher returns are first, or $1.5 million if the lower returns are first. Note that if contributions were not held constant, the difference would be much smaller since contributions would have been adjusted to offset the investment gains or losses.
$0.0
$2.0
$4.0
$6.0
$8.0
$10.0
$12.0
Billi
ons
Market Value of Assets
16.75% for 4 years, -3.25% for 4 years -3.25% for 4 years, 16.75% for 4 years
$0.0
$0.5
$1.0
$1.5
$2.0
$2.5
$3.0
$3.5
$4.0
$4.5
$5.0
$ M
illio
ns
Market Value of Assets
16.75% for 4 years, -3.25% for 4 years -3.25% for 4 years, 16.75% for 4 years

QUANTITATIVE ANALYSIS – ECONOMIC ASSUMPTIONS
2019 Risk Report Indiana Public Retirement System 33
Risk of Low Returns for Sustained Period The current view from most investment consultants is that a low return environment may persist for a number of years into the future. Some consultants anticipate that after this extended period, investment returns will revert to historic norms, while other consultants do not extend their assumptions that far into the future. There is no way to know whether this view of low returns for five to ten years is correct or not, but it is important to determine the potential impact of low returns over a sustained period on INPRS’ funding. In particular, we want to examine the scenario based on information supplied by the INPRS’ investment group, in which returns will be 5.50% for the next 10 years, and 7.25% thereafter. It should be noted that such an assumption is not inconsistent with the 6.75% long-term rate of return currently used for the INPRS valuations. The difference is really a variant of the prior discussion on order of returns: How does a scenario that has lower returns followed by higher returns compare with a scenario that has the same (approximately) average returns for all years? Unlike the prior discussion where contributions were held constant, we now want to study how both contributions and the funded status are impacted. If returns are consistently below the expected return of 6.75% in the early years, the actuarial contribution rates will be continually increasing as the unfavorable investment experience is captured in the asset smoothing method. Thus, the ending funded status is partly a function of the actual returns over the period as well as actual additional contributions. The following graphs show the impact of low returns on the funded ratio and the actuarial vs. Board Policy employer contributions for each of the Funds. In each case, the low return scenario (5.50% for 10 years, 7.25% thereafter) is compared with the baseline scenario of 6.75% for all years.

QUANTITATIVE ANALYSIS – ECONOMIC ASSUMPTIONS
2019 Risk Report Indiana Public Retirement System 34
PERF
In this scenario, the low returns for the next 10 years hold the funded ratio at around 80% for the next 10 years. The gap closes because of the higher returns that begin after 10 years and because contribution rates decline in the baseline scenario several years ahead of the decline under the sustained low return scenario.
Under the baseline scenario, the actuarial rate declines steadily as funding improves. Eventually, this results in the employer contribution rate declining until they reach the normal cost rate. In the low return scenario, there is a 10-year delay before the same pattern occurs.
0%
20%
40%
60%
80%
100%
120%
140%
160%
Funded Ratio
Low Returns Baseline
0.0%
2.0%
4.0%
6.0%
8.0%
10.0%
12.0%
Contribution Rates
Employer - Low Reutrns Actuarial - Low Returns Employer-Baseline Actuarial Baseline

QUANTITATIVE ANALYSIS – ECONOMIC ASSUMPTIONS
2019 Risk Report Indiana Public Retirement System 35
TRF Pre-‘96
Because of the current low funded ratio for TRF Pre-’96, low investment returns do not have much impact. Significant anticipated cash inflows also contribute to the stability. Once the funded ratio reaches 100%, the 7.25% long term return continues to improve the funded status.
The contribution amounts are largely cash flow driven for many years, and so the sustained low return scenario has very little impact on the contribution amounts.
0%
20%
40%
60%
80%
100%
120%
Funded Ratio
Low Returns Baseline
0
200
400
600
800
1,000
1,200
$ M
illio
ns
Contribution Amounts
Employer - Low Returns Employer-Baseline

QUANTITATIVE ANALYSIS – ECONOMIC ASSUMPTIONS
2019 Risk Report Indiana Public Retirement System 36
TRF ‘96
The TRF ’96 Fund funded ratio declines in the presence of low returns, but then gradually increases to 100% funded. Because of the current strong funded status and contributions above the actuarial rate, the low returns for ten years do not have as much impact on this Fund as they do for some of the others.
The sustained low return scenario has the effect of increasing contributions in about ten years from 5.5% to around 5.8%. Note that the decrease in 2019 in the employer contribution rate is a result of legislation that deposited $150 million into the Fund in exchange for the reduced contribution rate. The contribution increase after 2030 is to fund the SRA benefits.
0%
20%
40%
60%
80%
100%
120%
Funded Ratio
Low Returns Baseline
0.0%
1.0%
2.0%
3.0%
4.0%
5.0%
6.0%
7.0%
8.0%
Contribution Rates
Employer - Low Reutrns Actuarial - Low Returns Employer-Baseline Actuarial Baseline

QUANTITATIVE ANALYSIS – ECONOMIC ASSUMPTIONS
2019 Risk Report Indiana Public Retirement System 37
’77 Fund
A period of sustained low returns would have a noticeable impact on the funded ratio, emerging through time. It should be noted that the funded ratio still remains near 100%, but it does not move above 105% (when contribution rates may be reduced) for a number of years.
As noted in the discussion on the funded ratio, the delay in reaching the funded ratio threshold to allow contribution reductions is delayed as a result of the persistent low returns. Ultimately, however, the employer contribution rate moves toward the normal cost rate under either scenario. The actuarial contribution rate is driven down because of the amortization of surplus.
0%
20%
40%
60%
80%
100%
120%
140%
Funded Ratio
Low Returns Baseline
0.0%
2.0%
4.0%
6.0%
8.0%
10.0%
12.0%
14.0%
16.0%
18.0%
20.0%
Contribution Rates
Employer - Low Reutrns Actuarial - Low Returns Employer-Baseline Actuarial Baseline

QUANTITATIVE ANALYSIS – ECONOMIC ASSUMPTIONS
2019 Risk Report Indiana Public Retirement System 38
JRS
Much like the other funds, the JRS Fund has an initial reduction in the funded ratio as the low returns are experienced. Because contribution to JRS are intended to be made at the actuarial rate, the recovery is slower than the ’77 Fund where contributions are intended to be higher than needed so as to move the Fund above 100% funded.
Because JRS contributions are based on the actuarial requirements of the Fund, a sustained period of low returns would push rates higher until all of the resulting actuarial losses have been recognized in the asset smoothing method. Because of the stronger returns after 10 years under the alternate scenario, the contribution amounts ultimately are lower than anticipated under the baseline.
0%
20%
40%
60%
80%
100%
120%
Funded Ratio
Low Returns Baseline
0
5
10
15
20
25
30
35
40
$ M
illio
ns
Contribution Amounts
Employer - Low Returns Employer-Baseline

QUANTITATIVE ANALYSIS – ECONOMIC ASSUMPTIONS
2019 Risk Report Indiana Public Retirement System 39
PARF
Because PARF is starting at a lower funded ratio than most of the funds, but is being funded with the intent of being fully funded by around 2040, the impact of the low returns is essentially offset by higher contributions, and so the funded ratio moves toward 100% either way. Under the alternate scenario, stronger returns after 10 years ultimately lead to a higher funded ratio.
As would be expected in the alternate scenario, lower initial investment returns require higher contributions. As the plan reaches 100% funded, contributions are reduced because the no longer any UAAL.
0%
20%
40%
60%
80%
100%
120%
Funded Ratio
Low Returns Baseline
0
1
2
3
4
5
6
7
8
$ M
illio
ns
Contribution Amounts
Employer - Low Returns Employer-Baseline

QUANTITATIVE ANALYSIS – ECONOMIC ASSUMPTIONS
2019 Risk Report Indiana Public Retirement System 40
EG&C
Because the employer contribution rate for EG&C is currently well above the actuarial rate, there is a strong inflow of funds. Consequently, the sustained low returns have comparatively minor impact on the funded ratio.
There is currently a significant margin between the employer contribution rate and the actuarial contribution rate. The low returns in the short term are offset by delaying the contribution reductions. Ultimately, the rates decrease to the normal cost rate.
0%
20%
40%
60%
80%
100%
120%
140%
160%
Funded Ratio
Low Returns Baseline
0.0%
5.0%
10.0%
15.0%
20.0%
25.0%
Contribution Rates
Employer - Low Reutrns Actuarial - Low Returns Employer-Baseline Actuarial Baseline
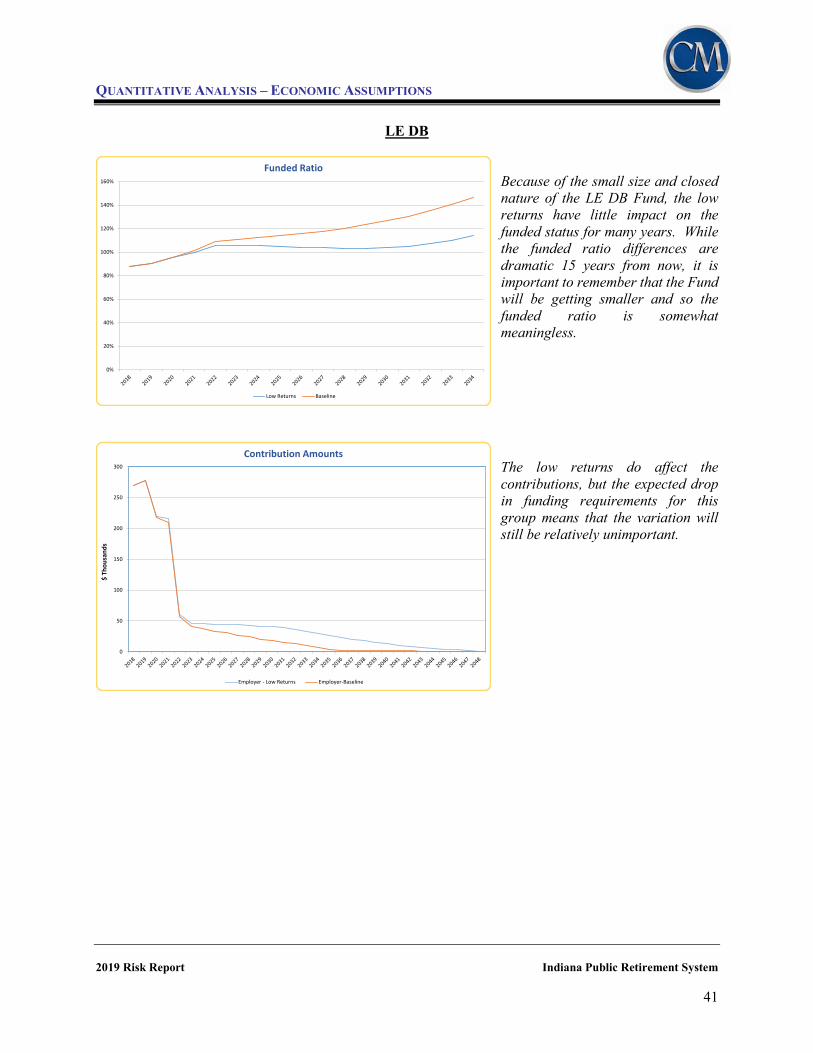
QUANTITATIVE ANALYSIS – ECONOMIC ASSUMPTIONS
2019 Risk Report Indiana Public Retirement System 41
LE DB
Because of the small size and closed nature of the LE DB Fund, the low returns have little impact on the funded status for many years. While the funded ratio differences are dramatic 15 years from now, it is important to remember that the Fund will be getting smaller and so the funded ratio is somewhat meaningless.
The low returns do affect the contributions, but the expected drop in funding requirements for this group means that the variation will still be relatively unimportant.
0%
20%
40%
60%
80%
100%
120%
140%
160%
Funded Ratio
Low Returns Baseline
0
50
100
150
200
250
300
$ Th
ousa
nds
Contribution Amounts
Employer - Low Returns Employer-Baseline

QUANTITATIVE ANALYSIS – ECONOMIC ASSUMPTIONS
2019 Risk Report Indiana Public Retirement System 42
Risk of Shocks in the Investment Markets From late 2007 through early 2009, the financial markets crashed both in the U.S. and abroad resulting in the worst annual investment return ever experienced by many public retirement systems like INPRS. This single year dropped the funded status, on a market value basis, by more than 20% for many systems. While this is hopefully an extremely rare occurrence, it does point out the need to examine how a system might respond in the event of another investment shock. To study the impact of such a shock, the INPRS investment staff identified the portfolio return which would have resulted from actual market experience in the 90 years from 1928 to 2017, assuming that the current asset allocation had always been in place. (Verus provided this data to the investment staff, including using proxies for asset classes that did not have a historical index.) They next identified the three worst five-year periods and the three best five-year periods over that time. In recognition that markets often correct after significant gains or losses, we examined these five year periods coupled with the next five years actually observed. For this analysis, we modeled these six scenarios (the three best and the three worst) for the ten years of actual experience and assumed that the 6.75% long-term return assumption applied after that. The scenarios considered are: Worst 5-Year Periods Best 5-Year Periods Period 1928-
1937 2008-2017
1965-1974
1982-1991
1932-1941
1951-1960
Return - Year 1 22.3% -20.3% 6.6% 25.5% 0.1% 11.7% Return - Year 2 -2.0% 15.4% -3.5% 15.1% 25.9% 10.2% Return - Year 3 -10.3% 10.9% 11.1% 8.7% 3.4% 1.5% Return - Year 4 -23.2% -0.1% 7.0% 26.3% 25.6% 27.9% Return - Year 5 0.1% 9.7% -6.6% 18.4% 18.5% 15.6% Return - Year 6 25.9% 11.3% 10.6% 0.5% -17.0% 2.6% Return - Year 7 3.4% 3.4% 12.7% 17.0% 16.7% -1.8% Return - Year 8 25.6% -0.9% 13.3% 18.5% 1.7% 20.8% Return - Year 9 18.5% 7.0% 0.3% -1.6% -2.6% 4.7% Return - Year 10 -17.0% 11.2% -8.5% 19.7% -7.4% 6.0%
Annualized Years 1-5 -3.75% 2.25% 2.68% 18.60% 14.16% 13.06% Annualized Years 1-10 2.88% 4.25% 3.99% 14.44% 5.59% 9.57%
The following pages show graphs with these scenarios (with 6.75% assumed for years 11 and beyond). For each Fund, the first set of graphs are using the three scenarios that started with the worst five-year periods, followed by a set of graphs with the three scenarios associated with the best five-year periods. While some of the worst (and best) market returns in US history are represented in the following graphs, one important item to note is that the outcomes are neither catastrophic nor result in significant overfunding. In other words, the funding policy used by INPRS is able to handle even the especially good or bad times observed in the past. The path from the investment shock to returning to normal, however, may be bumpy.

QUANTITATIVE ANALYSIS – ECONOMIC ASSUMPTIONS
2019 Risk Report Indiana Public Retirement System 43
PERF Worst 5-Year Scenarios
These scenarios result in the funded ratio being around 10%-20% lower than the baseline for 20 years or more. Because of the starting funded status of around 80%, there are only a few years that go below 70% funded.
The 1928-1937 scenario results in contribution increases of around 3.5% that persist for many years. The other two scenarios, however, result in smaller increases. In all of the alternate scenarios, the contribution decreases are delayed many years.
0%
20%
40%
60%
80%
100%
120%
140%
160%
Funded Ratio
1928-1937 1965-1974 2008-2017 Baseline
0.0%
2.0%
4.0%
6.0%
8.0%
10.0%
12.0%
14.0%
16.0%
Employer Contribution Rates
1928-1937 1965-1974 2008-2017 Baseline

QUANTITATIVE ANALYSIS – ECONOMIC ASSUMPTIONS
2019 Risk Report Indiana Public Retirement System 44
PERF Best 5-Year Scenarios
The strong returns of the 1980’s cause the funded ratio to rise dramatically. During that time period, many plans responded by increasing benefits and/or lowering contributions, sometimes below the normal cost rate. While returns in 1932-1937 were strong, the following five years were not, reversing much of the gains from those years.
The PERF funding policy sets contributions no lower than the normal cost rate. Under good investment return scenarios, this contribution floor is reached sooner, as observed in this graph.
0.0%
2.0%
4.0%
6.0%
8.0%
10.0%
12.0%
Employer Contribution Rates
1932-1941 1951-1960 1982-1991 Baseline
0%
50%
100%
150%
200%
250%
300%
350%
400%
450%
500%
Funded Ratio
1932-1941 1951-1960 1982-1991 Baseline

QUANTITATIVE ANALYSIS – ECONOMIC ASSUMPTIONS
2019 Risk Report Indiana Public Retirement System 45
TRF Pre-‘96
Worst 5-Year Scenarios
Because of the low funded ratio for TRF Pre-’96, low returns have only a modest impact on the funded ratio.
The funding policy for TRF Pre-’96 calls for a proportionate increase in the contributions each year, not to exceed expected benefit payments, until the plan is funded. Thus, there is no near-term impact on contributions from these adverse return scenarios.
0
200
400
600
800
1,000
1,200
$ M
illio
ns
Employer Contribution Amounts
1928-1937 1965-1974 2008-2017 Baseline
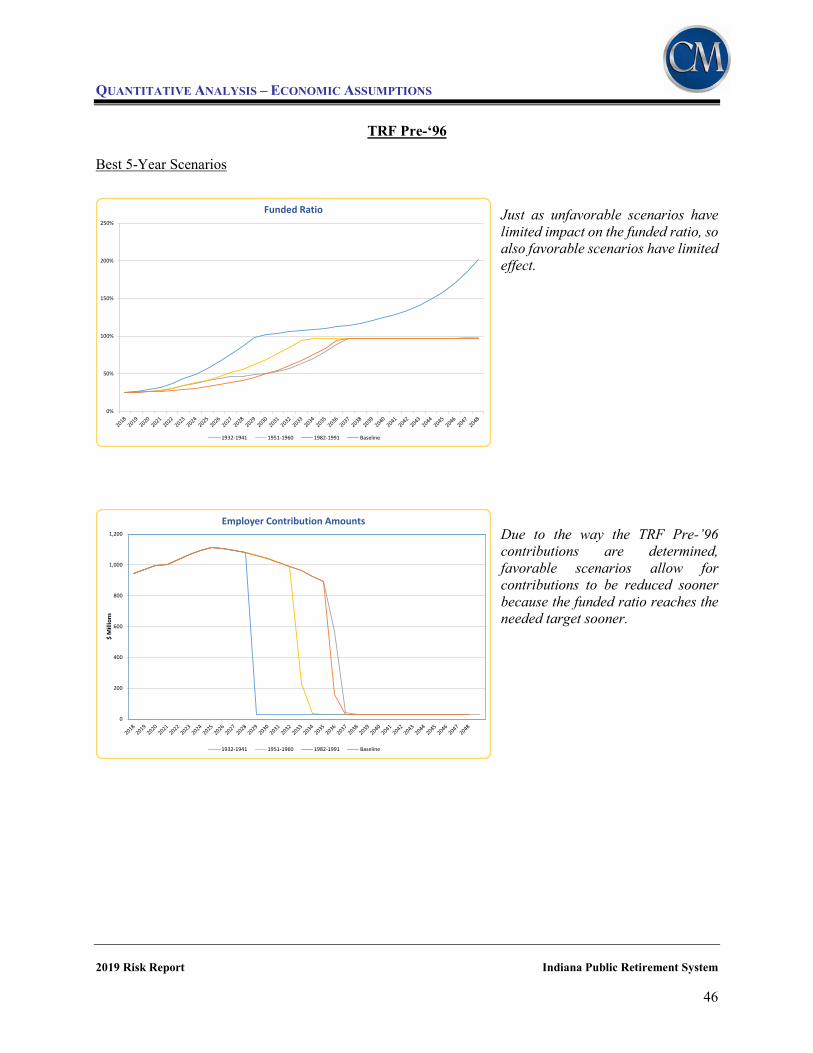
QUANTITATIVE ANALYSIS – ECONOMIC ASSUMPTIONS
2019 Risk Report Indiana Public Retirement System 46
TRF Pre-‘96 Best 5-Year Scenarios
Just as unfavorable scenarios have limited impact on the funded ratio, so also favorable scenarios have limited effect.
Due to the way the TRF Pre-’96 contributions are determined, favorable scenarios allow for contributions to be reduced sooner because the funded ratio reaches the needed target sooner.
0
200
400
600
800
1,000
1,200
$ M
illio
ns
Employer Contribution Amounts
1932-1941 1951-1960 1982-1991 Baseline
0%
50%
100%
150%
200%
250%
Funded Ratio
1932-1941 1951-1960 1982-1991 Baseline

QUANTITATIVE ANALYSIS – ECONOMIC ASSUMPTIONS
2019 Risk Report Indiana Public Retirement System 47
TRF ‘96
Worst 5-Year Scenarios TRF ’96 is less affected by the investment returns than PERF. This is primarily a function of low retiree liability.
The 1928-1937 scenario leads to sustained contributions 3.7% above the baseline. In general, these scenarios quickly reverse the July 1, 2019 employer rate reduction.
0%
20%
40%
60%
80%
100%
120%
Funded Ratio
1928-1937 1965-1974 2008-2017 Baseline
0.0%
2.0%
4.0%
6.0%
8.0%
10.0%
12.0%
Employer Contribution Rates
1928-1937 1965-1974 2008-2017 Baseline
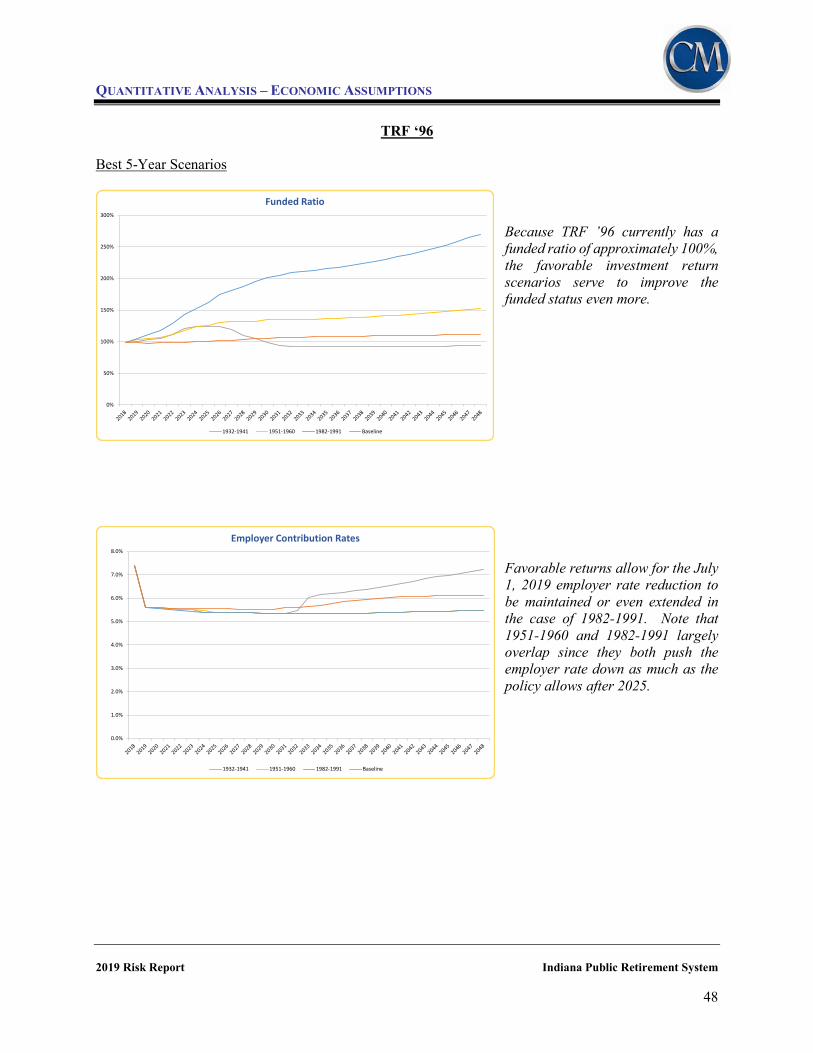
QUANTITATIVE ANALYSIS – ECONOMIC ASSUMPTIONS
2019 Risk Report Indiana Public Retirement System 48
TRF ‘96 Best 5-Year Scenarios
Because TRF ’96 currently has a funded ratio of approximately 100%, the favorable investment return scenarios serve to improve the funded status even more.
Favorable returns allow for the July 1, 2019 employer rate reduction to be maintained or even extended in the case of 1982-1991. Note that 1951-1960 and 1982-1991 largely overlap since they both push the employer rate down as much as the policy allows after 2025.
0%
50%
100%
150%
200%
250%
300%
Funded Ratio
1932-1941 1951-1960 1982-1991 Baseline
0.0%
1.0%
2.0%
3.0%
4.0%
5.0%
6.0%
7.0%
8.0%
Employer Contribution Rates
1932-1941 1951-1960 1982-1991 Baseline
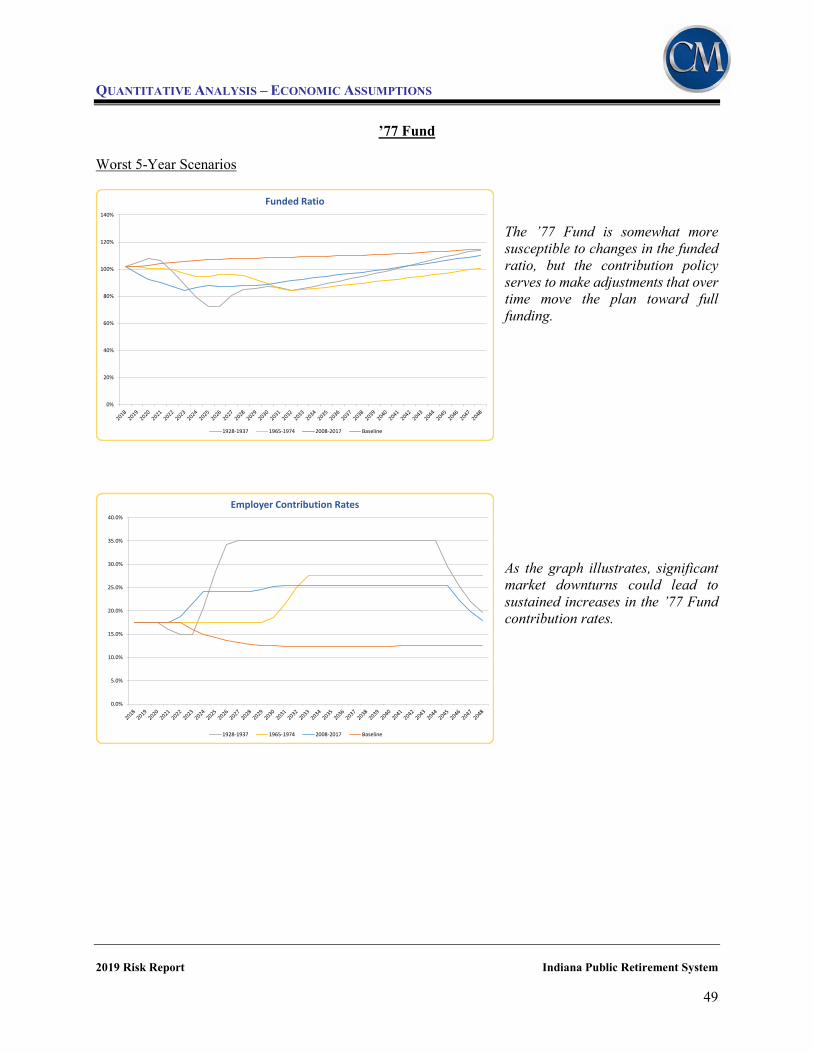
QUANTITATIVE ANALYSIS – ECONOMIC ASSUMPTIONS
2019 Risk Report Indiana Public Retirement System 49
’77 Fund
Worst 5-Year Scenarios The ’77 Fund is somewhat more susceptible to changes in the funded ratio, but the contribution policy serves to make adjustments that over time move the plan toward full funding.
As the graph illustrates, significant market downturns could lead to sustained increases in the ’77 Fund contribution rates.
0%
20%
40%
60%
80%
100%
120%
140%
Funded Ratio
1928-1937 1965-1974 2008-2017 Baseline
0.0%
5.0%
10.0%
15.0%
20.0%
25.0%
30.0%
35.0%
40.0%
Employer Contribution Rates
1928-1937 1965-1974 2008-2017 Baseline
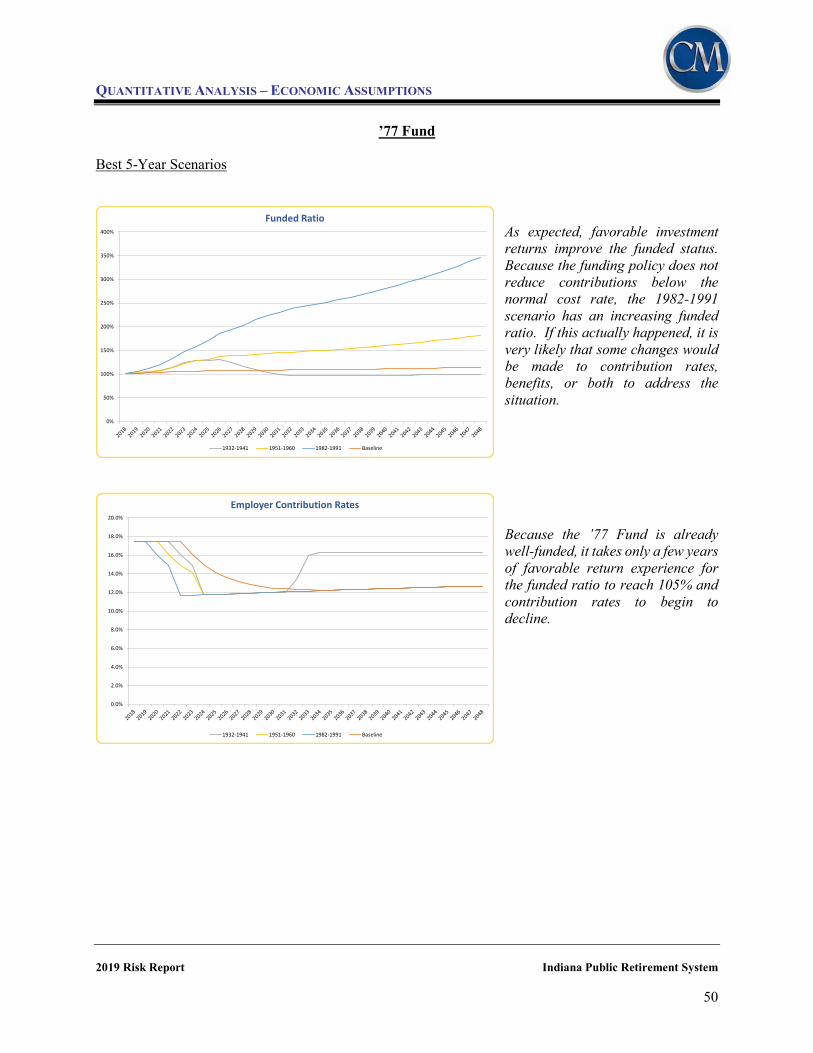
QUANTITATIVE ANALYSIS – ECONOMIC ASSUMPTIONS
2019 Risk Report Indiana Public Retirement System 50
’77 Fund Best 5-Year Scenarios
As expected, favorable investment returns improve the funded status. Because the funding policy does not reduce contributions below the normal cost rate, the 1982-1991 scenario has an increasing funded ratio. If this actually happened, it is very likely that some changes would be made to contribution rates, benefits, or both to address the situation.
Because the ’77 Fund is already well-funded, it takes only a few years of favorable return experience for the funded ratio to reach 105% and contribution rates to begin to decline.
0.0%
2.0%
4.0%
6.0%
8.0%
10.0%
12.0%
14.0%
16.0%
18.0%
20.0%
Employer Contribution Rates
1932-1941 1951-1960 1982-1991 Baseline
0%
50%
100%
150%
200%
250%
300%
350%
400%
Funded Ratio
1932-1941 1951-1960 1982-1991 Baseline

QUANTITATIVE ANALYSIS – ECONOMIC ASSUMPTIONS
2019 Risk Report Indiana Public Retirement System 51
JRS
Worst 5-Year Scenarios Much like the ’77 Fund, JRS is somewhat more susceptible to changes in the funded ratio, but the contribution policy serves to adjust contributions and move the funded ratio towards 100%.
JRS contribution amounts could be substantially higher following significantly unfavorable market returns. It is important to note that the baseline amount shown is relatively stable as a percentage of pay, but that payroll also increases significantly over the next 30 years, so that the dollar amount increases.
0%
20%
40%
60%
80%
100%
120%
Funded Ratio
1928-1937 1965-1974 2008-2017 Baseline
0
10
20
30
40
50
60
$ M
illio
ns
Employer Contribution Amounts
1928-1937 1965-1974 2008-2017 Baseline
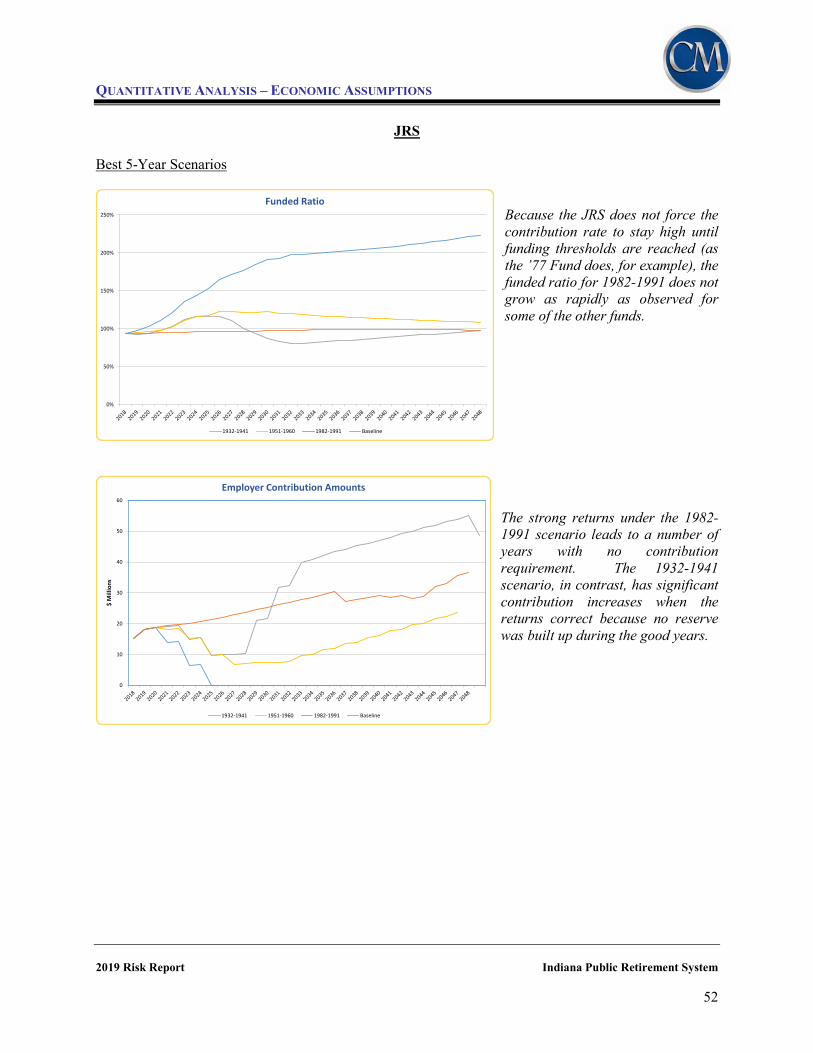
QUANTITATIVE ANALYSIS – ECONOMIC ASSUMPTIONS
2019 Risk Report Indiana Public Retirement System 52
JRS Best 5-Year Scenarios
Because the JRS does not force the contribution rate to stay high until funding thresholds are reached (as the ’77 Fund does, for example), the funded ratio for 1982-1991 does not grow as rapidly as observed for some of the other funds.
The strong returns under the 1982-1991 scenario leads to a number of years with no contribution requirement. The 1932-1941 scenario, in contrast, has significant contribution increases when the returns correct because no reserve was built up during the good years.
0%
50%
100%
150%
200%
250%
Funded Ratio
1932-1941 1951-1960 1982-1991 Baseline
0
10
20
30
40
50
60
$ M
illio
ns
Employer Contribution Amounts
1932-1941 1951-1960 1982-1991 Baseline

QUANTITATIVE ANALYSIS – ECONOMIC ASSUMPTIONS
2019 Risk Report Indiana Public Retirement System 53
PARF
Worst 5-Year Scenarios Like the sustained low return scenarios, PARF does not vary as much with low returns because there are significant contributions being made to bring the funding up to 100%.
PARF contribution amounts could be substantially higher following unfavorable market returns. It is important to note that the baseline amount shown is relatively stable as a percentage of pay, but pay increases significantly over the next 30 years.
0%
20%
40%
60%
80%
100%
120%
Funded Ratio
1928-1937 1965-1974 2008-2017 Baseline
0
1
2
3
4
5
6
7
8
9
10
$ M
illio
ns
Employer Contribution Amounts
1928-1937 1965-1974 2008-2017 Baseline

QUANTITATIVE ANALYSIS – ECONOMIC ASSUMPTIONS
2019 Risk Report Indiana Public Retirement System 54
PARF Best 5-Year Scenarios
Like JRS, PARF does not force the contribution rate to remain above the actuarial rate until funding thresholds are reached. Thus, the funded ratio for 1982-1991 does not grow as high as, for example, the ’77 Fund.
The strong investment returns in the 1982-1991 scenario quickly leads to no contribution requirement for many years.
0%
20%
40%
60%
80%
100%
120%
140%
160%
180%
Funded Ratio
1932-1941 1951-1960 1982-1991 Baseline
0
1
2
3
4
5
6
7
8
9
$ M
illio
ns
Employer Contribution Amounts
1932-1941 1951-1960 1982-1991 Baseline

QUANTITATIVE ANALYSIS – ECONOMIC ASSUMPTIONS
2019 Risk Report Indiana Public Retirement System 55
EG&C
Worst 5-Year Scenarios Because EG&C has contributions well above the actuarial rate, if poor investment returns are realized, there is still a lot of money flowing into the Fund that can help stabilize the funded ratio.
The current contribution rates are sufficient to cover many, but not all, sets of unfavorable investment return scenarios without any rate increases. As can be observed, these scenarios would delay rate decreases.
0%
20%
40%
60%
80%
100%
120%
140%
160%
Funded Ratio
1928-1937 1965-1974 2008-2017 Baseline
0.0%
5.0%
10.0%
15.0%
20.0%
25.0%
Employer Contribution Rates
1928-1937 1965-1974 2008-2017 Baseline

QUANTITATIVE ANALYSIS – ECONOMIC ASSUMPTIONS
2019 Risk Report Indiana Public Retirement System 56
EG&C Best 5-Year Scenarios
As with other funds, favorable experience can dramatically improve the funded ratio. Like the ’77 Fund, but unlike JRS and PARF, the funded ratio grows rapidly in the 1982-1991 scenario since the funding policy slowly moves from the current rate to the normal cost rate, providing significant cash inflows above those required.
As would be expected, favorable investment return scenarios accelerate the reduction in employer contribution rates since the 105% and 120% funded ratio thresholds are reached sooner.
0%
50%
100%
150%
200%
250%
300%
350%
400%
450%
Funded Ratio
1932-1941 1951-1960 1982-1991 Baseline
0.0%
5.0%
10.0%
15.0%
20.0%
25.0%
Employer Contribution Rates
1932-1941 1951-1960 1982-1991 Baseline
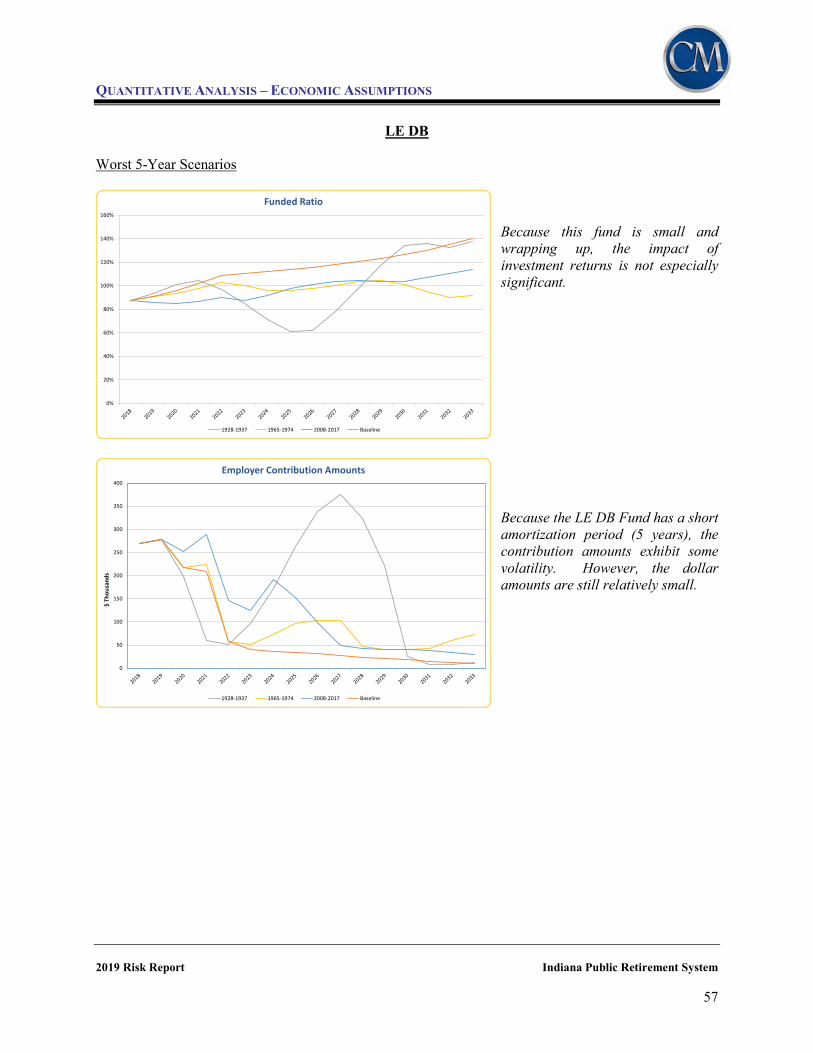
QUANTITATIVE ANALYSIS – ECONOMIC ASSUMPTIONS
2019 Risk Report Indiana Public Retirement System 57
LE DB
Worst 5-Year Scenarios
Because this fund is small and wrapping up, the impact of investment returns is not especially significant. Because the LE DB Fund has a short amortization period (5 years), the contribution amounts exhibit some volatility. However, the dollar amounts are still relatively small.
0%
20%
40%
60%
80%
100%
120%
140%
160%
Funded Ratio
1928-1937 1965-1974 2008-2017 Baseline
0
50
100
150
200
250
300
350
400
$ Th
ousa
nds
Employer Contribution Amounts
1928-1937 1965-1974 2008-2017 Baseline

QUANTITATIVE ANALYSIS – ECONOMIC ASSUMPTIONS
2019 Risk Report Indiana Public Retirement System 58
LE DB Best 5-Year Scenarios
Because this fund is small and wrapping up, the impact of investment returns is not especially significant.
Under investment return scenarios where favorable results occur in the near term, the small contributions required for the LE DB fund could be nearly eliminated.
0%
100%
200%
300%
400%
500%
600%
700%
Funded Ratio
1932-1941 1951-1960 1982-1991 Baseline
0
50
100
150
200
250
300
$ Th
ousa
nds
Employer Contribution Amounts
1932-1941 1951-1960 1982-1991 Baseline

QUANTITATIVE ANALYSIS – ECONOMIC ASSUMPTIONS
2019 Risk Report Indiana Public Retirement System 59
Sensitivity Analysis
Rather than just changing the investment return assumption, we can analyze the investment risk by changing the entire set of economic assumptions to represent an optimistic or pessimistic outcome (anticipated in advance), similar to the forecasting used by the Social Security Administration. This allows a more complete picture of what might happen, rather than just examining the effects of changing a single variable at a time.
We assume that all assumptions are met in the future for each scenario. In particular, please note that this means that the payroll amounts, benefit payments, and actuarial liabilities, are all varying, in contrast with other analyses in this report in which these amounts held constant. For this purpose, the following assumption sets were studied:
Assumption Baseline
(Valuation) Pessimistic Optimistic Inflation 2.25% 1.75% 2.75% Investment Return 6.75% 6.25% 7.25% Wage Inflation 2.50% 2.00% 3.00% COLA for ’77 Fund/JRS 2.0%/2.5% 1.5%/2.0% 2.5%/3.0% Active Membership Size Level* Decrease 1% for 10
years, level thereafter
Increase 1% for 10 years, level thereafter
Mortality Improvement Valuation Basis 150% of the scale 50% of the scale
* For PERF, the baseline has an annual reduction of 0.825% to reflect anticipated MyChoice enrollment. The pessimistic and optimistic scenarios vary 1% from that trend during the first ten years.
The graphs on the following pages compare the funded ratios and contributions for these three scenarios.

QUANTITATIVE ANALYSIS – ECONOMIC ASSUMPTIONS
2019 Risk Report Indiana Public Retirement System 60
PERF
Due to the funding policy and current funded ratio, the funded ratio moves to over 100%. The pessimistic scenario takes significantly longer as a result of a higher actuarial liability, lower investment returns, and lower payroll upon which to fund the shortfall.
The most notable result is how the optimistic and pessimistic results change the point at which the contribution rates begin to decline. Note that because the payroll amounts are lower in the pessimistic scenario and higher in the optimistic scenario, the total contributions are not as different as the rates alone would suggest.

QUANTITATIVE ANALYSIS – ECONOMIC ASSUMPTIONS
2019 Risk Report Indiana Public Retirement System 61
TRF Pre ‘96
As has been discussed earlier, the funded ratio for TRF Pre-’96 is not as sensitive to the impact of investment returns. Further, the impact of payroll has limited impact on TRF Pre-’96 because the plan has been closed for over 20 years. These factors mean that the three scenarios are reasonably similar.
For the most part, contributions are driven by expected benefit payments in the early years. This leads to some differences simply as a result of assumed mortality improvements. Ultimately, the impact of the economic scenarios, particularly investment return, mildly affects contributions.
0.0
200.0
400.0
600.0
800.0
1,000.0
1,200.0
$ M
illio
ns
Contribution Amounts
Employer-Optimistic Employer-Baseline Employer-Pessimistic
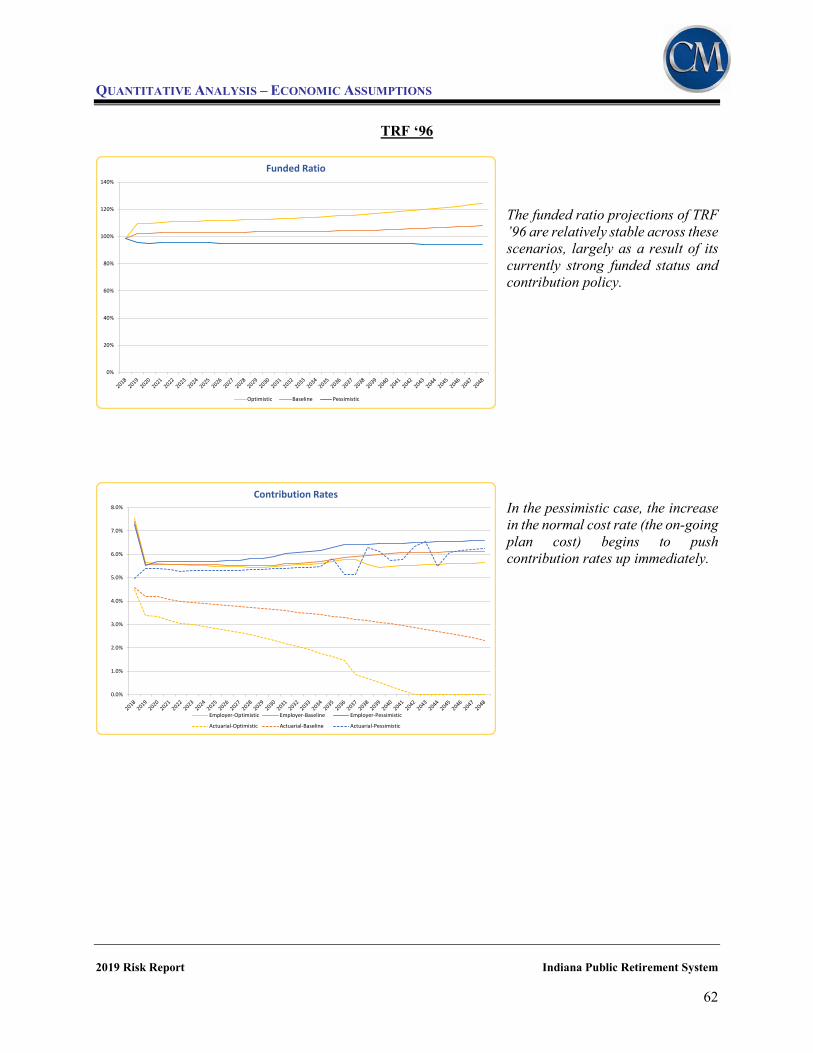
QUANTITATIVE ANALYSIS – ECONOMIC ASSUMPTIONS
2019 Risk Report Indiana Public Retirement System 62
TRF ‘96
The funded ratio projections of TRF ’96 are relatively stable across these scenarios, largely as a result of its currently strong funded status and contribution policy.
In the pessimistic case, the increase in the normal cost rate (the on-going plan cost) begins to push contribution rates up immediately.
0%
20%
40%
60%
80%
100%
120%
140%
Funded Ratio
Optimistic Baseline Pessimistic
0.0%
1.0%
2.0%
3.0%
4.0%
5.0%
6.0%
7.0%
8.0%
Contribution Rates
Employer-Optimistic Employer-Baseline Employer-Pessimistic
Actuarial-Optimistic Actuarial-Baseline Actuarial-Pessimistic

QUANTITATIVE ANALYSIS – ECONOMIC ASSUMPTIONS
2019 Risk Report Indiana Public Retirement System 63
’77 Fund ‘The ’77 Fund funded ratio is fairly robust across the various economic scenarios. The change in the COLA and salary scale assumptions largely offset the change in investment return assumption.
As noted for the funded status, the simultaneous changes of the COLA and salary scale along with the investment return assumption result in reasonably small variation in the contribution rates.
0.0%
2.0%
4.0%
6.0%
8.0%
10.0%
12.0%
14.0%
16.0%
18.0%
20.0%
Contribution Rates
Employer-Optimistic Employer-Baseline Employer-Pessimistic
Actuarial-Optimistic Actuarial-Baseline Actuarial-Pessimistic

QUANTITATIVE ANALYSIS – ECONOMIC ASSUMPTIONS
2019 Risk Report Indiana Public Retirement System 64
JRS
JRS exhibits much of the same stability in the funded ratio as seen in the ’77 Fund because of the same impact of offsetting economic assumptions. In fact, the results of the pessimistic and optimistic scenarios actually play out in a partially reversed manner. JRS exhibits much of the stability as the ’77 Fund because of the offsetting economic assumptions. Over time, the optimistic scenario requires greater contributions because of the greater payroll being received (meaning larger benefits), but the differences as a rate of pay would be less significant.
0.0
5.0
10.0
15.0
20.0
25.0
30.0
35.0
40.0
45.0
50.0
$ M
illio
ns
Contribution Amounts
Employer-Optimistic Employer-Baseline Employer-Pessimistic

QUANTITATIVE ANALYSIS – ECONOMIC ASSUMPTIONS
2019 Risk Report Indiana Public Retirement System 65
PARF
Because the immediate application of the new assumptions increases the contribution amounts for PARF, the funding strategy under all scenarios moves toward 100% funded in a predictable manner, leaving little variation.
The immediate application of the new pessimistic assumptions leads to increases in contributions above what is expected under the baseline. Even under the optimistic assumptions, there is upward pressure on contributions. 0.0
1.0
2.0
3.0
4.0
5.0
6.0
7.0
8.0
$ M
illio
ns
Contribution Amounts
Employer-Optimistic Employer-Baseline Employer-Pessimistic

QUANTITATIVE ANALYSIS – ECONOMIC ASSUMPTIONS
2019 Risk Report Indiana Public Retirement System 66
EG&C
EG&C has a funding policy and benefit structure that are generally similar to PERF and TRF ’96. Like them, the funded ratio improves steadily in all scenarios.
Much of the EG&C projection of contribution rates is driven by the substantial current excess of the employer contribution rate over the actuarial contribution rate. Thus, the variation under the scenarios affects when, not if, the contribution rates begin to decline.
0.0%
5.0%
10.0%
15.0%
20.0%
25.0%
Contribution Rates
Employer-Optimistic Employer-Baseline Employer-Pessimistic
Actuarial-Optimistic Actuarial-Baseline Actuarial-Pessimistic
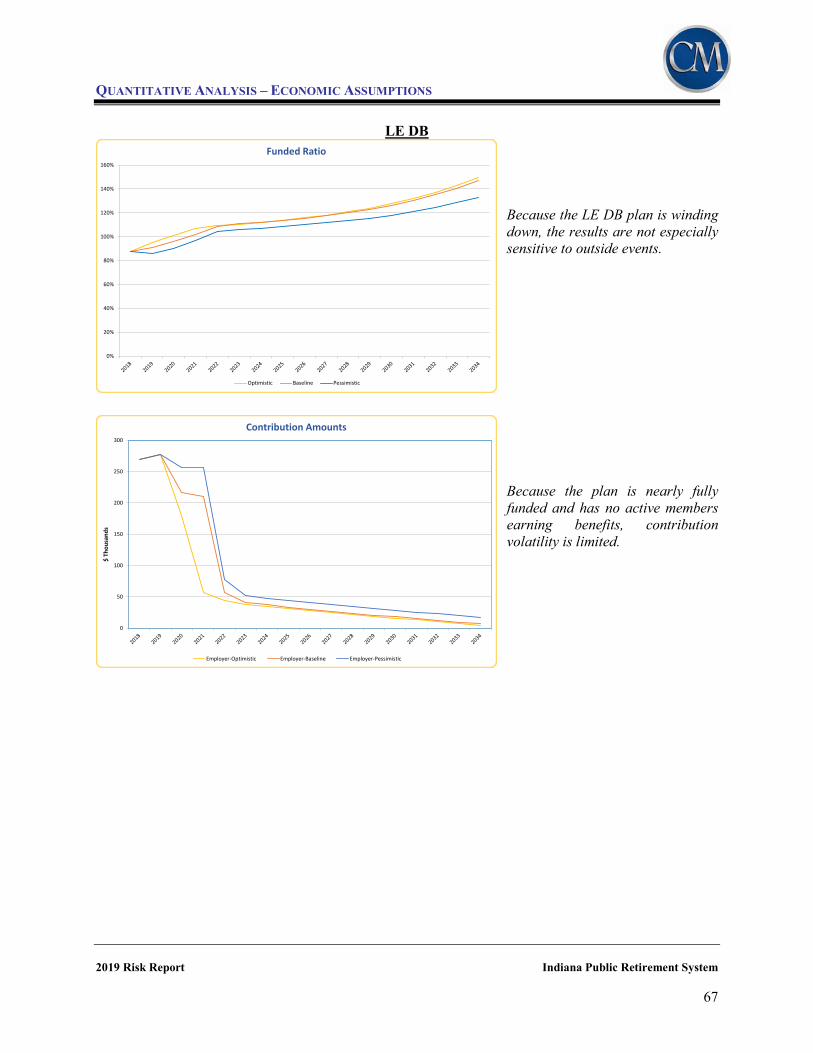
QUANTITATIVE ANALYSIS – ECONOMIC ASSUMPTIONS
2019 Risk Report Indiana Public Retirement System 67
LE DB Because the LE DB plan is winding down, the results are not especially sensitive to outside events.
Because the plan is nearly fully funded and has no active members earning benefits, contribution volatility is limited.
0%
20%
40%
60%
80%
100%
120%
140%
160%
Funded Ratio
Optimistic Baseline Pessimistic
0
50
100
150
200
250
300
$ Th
ousa
nds
Contribution Amounts
Employer-Optimistic Employer-Baseline Employer-Pessimistic

QUANTITATIVE ANALYSIS – ECONOMIC ASSUMPTIONS
2019 Risk Report Indiana Public Retirement System 68
Another way to perform investment return sensitivity analysis is to look at how results would unfold if the assumptions remain unchanged, but actual experience varies. Of course, in reality, the assumptions would eventually be updated to reflect actual experience, so this type of analysis is useful only when shorter periods of time are considered. In the following charts, actual rates of return from 5.0% to 7.5% are considered for a 10-year period. The impact is shown using a “heat map” in which the results are color coded from green (most favorable) to red (least favorable) to help visually show trends. In this analysis, the current investment return assumption of 6.75% is not changed, but the impact of differing actual returns over the next ten years is studied.
PERF
While the actuarial rate declines for most of the alternate return scenarios, the employer contribution rate would not decline since the funded ratio does not reach 105% during this period under these returns.
2019 2020 2021 2022 2023 2024 2025 2026 2027 20285.00% 80% 81% 82% 82% 82% 82% 82% 82% 82% 82%5.25% 80% 81% 82% 83% 83% 83% 83% 83% 84% 84%5.50% 80% 81% 82% 83% 84% 84% 84% 85% 85% 86%5.75% 80% 81% 82% 84% 84% 85% 86% 86% 87% 88%6.00% 80% 81% 83% 84% 85% 86% 87% 88% 89% 90%6.25% 80% 81% 83% 84% 86% 87% 88% 89% 91% 92%6.50% 80% 81% 83% 85% 86% 88% 89% 91% 92% 94%6.75% 80% 82% 83% 85% 87% 89% 90% 92% 94% 96%7.00% 80% 82% 84% 86% 88% 90% 92% 94% 96% 98%7.25% 80% 82% 84% 86% 88% 91% 93% 95% 98% 101%7.50% 80% 82% 84% 87% 89% 92% 94% 97% 100% 103%
Funded Ratio at June 30 Valuation
2020 2021 2022 2023 2024 2025 2026 2027 2028 20295.00% 7.9% 7.8% 7.6% 7.6% 7.7% 7.8% 8.0% 8.1% 8.3% 8.4%5.25% 7.9% 7.8% 7.6% 7.5% 7.5% 7.6% 7.6% 7.7% 7.8% 7.9%5.50% 7.8% 7.7% 7.5% 7.3% 7.3% 7.3% 7.3% 7.3% 7.3% 7.3%5.75% 7.8% 7.7% 7.4% 7.2% 7.1% 7.1% 7.0% 6.9% 6.8% 6.7%6.00% 7.8% 7.7% 7.4% 7.1% 7.0% 6.8% 6.6% 6.5% 6.3% 6.1%6.25% 7.8% 7.6% 7.3% 7.0% 6.8% 6.5% 6.3% 6.0% 5.7% 5.5%6.50% 7.8% 7.6% 7.2% 6.8% 6.6% 6.3% 5.9% 5.6% 5.2% 4.8%6.75% 7.8% 7.6% 7.1% 6.7% 6.4% 6.0% 5.6% 5.1% 4.7% 4.2%7.00% 7.8% 7.5% 7.1% 6.6% 6.2% 5.7% 5.2% 4.7% 4.1% 3.5%7.25% 7.8% 7.5% 7.0% 6.5% 6.0% 5.4% 4.9% 4.3% 3.6% 2.7%7.50% 7.8% 7.5% 6.9% 6.3% 5.8% 5.2% 4.5% 3.8% 3.0% 2.2%
Actuarial Contribution Rate for FYE
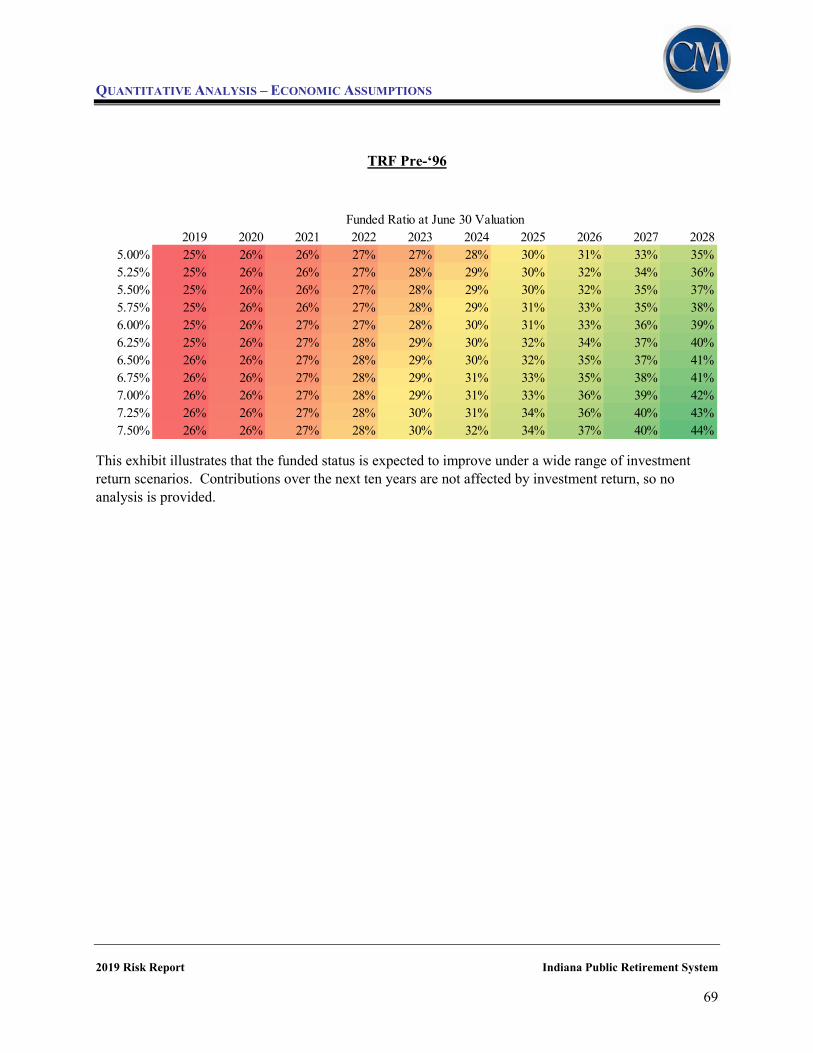
QUANTITATIVE ANALYSIS – ECONOMIC ASSUMPTIONS
2019 Risk Report Indiana Public Retirement System 69
TRF Pre-‘96
This exhibit illustrates that the funded status is expected to improve under a wide range of investment return scenarios. Contributions over the next ten years are not affected by investment return, so no analysis is provided.
2019 2020 2021 2022 2023 2024 2025 2026 2027 20285.00% 25% 26% 26% 27% 27% 28% 30% 31% 33% 35%5.25% 25% 26% 26% 27% 28% 29% 30% 32% 34% 36%5.50% 25% 26% 26% 27% 28% 29% 30% 32% 35% 37%5.75% 25% 26% 26% 27% 28% 29% 31% 33% 35% 38%6.00% 25% 26% 27% 27% 28% 30% 31% 33% 36% 39%6.25% 25% 26% 27% 28% 29% 30% 32% 34% 37% 40%6.50% 26% 26% 27% 28% 29% 30% 32% 35% 37% 41%6.75% 26% 26% 27% 28% 29% 31% 33% 35% 38% 41%7.00% 26% 26% 27% 28% 29% 31% 33% 36% 39% 42%7.25% 26% 26% 27% 28% 30% 31% 34% 36% 40% 43%7.50% 26% 26% 27% 28% 30% 32% 34% 37% 40% 44%
Funded Ratio at June 30 Valuation
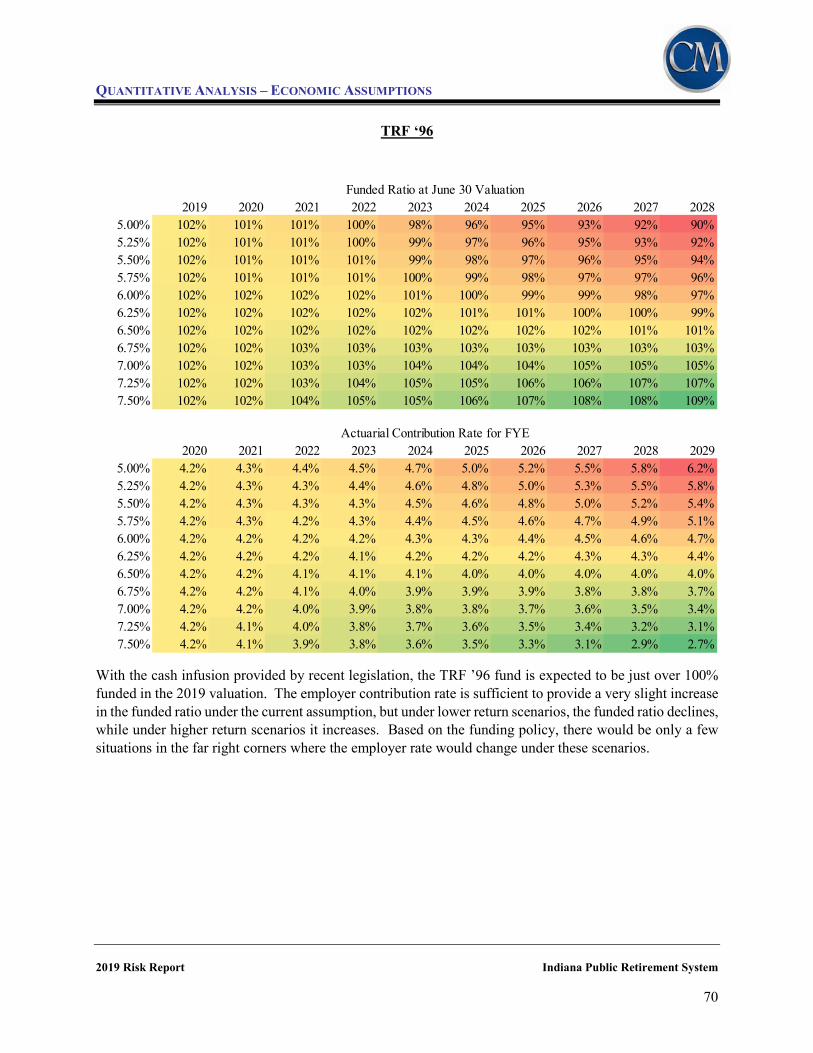
QUANTITATIVE ANALYSIS – ECONOMIC ASSUMPTIONS
2019 Risk Report Indiana Public Retirement System 70
TRF ‘96
With the cash infusion provided by recent legislation, the TRF ’96 fund is expected to be just over 100% funded in the 2019 valuation. The employer contribution rate is sufficient to provide a very slight increase in the funded ratio under the current assumption, but under lower return scenarios, the funded ratio declines, while under higher return scenarios it increases. Based on the funding policy, there would be only a few situations in the far right corners where the employer rate would change under these scenarios.
2019 2020 2021 2022 2023 2024 2025 2026 2027 20285.00% 102% 101% 101% 100% 98% 96% 95% 93% 92% 90%5.25% 102% 101% 101% 100% 99% 97% 96% 95% 93% 92%5.50% 102% 101% 101% 101% 99% 98% 97% 96% 95% 94%5.75% 102% 101% 101% 101% 100% 99% 98% 97% 97% 96%6.00% 102% 102% 102% 102% 101% 100% 99% 99% 98% 97%6.25% 102% 102% 102% 102% 102% 101% 101% 100% 100% 99%6.50% 102% 102% 102% 102% 102% 102% 102% 102% 101% 101%6.75% 102% 102% 103% 103% 103% 103% 103% 103% 103% 103%7.00% 102% 102% 103% 103% 104% 104% 104% 105% 105% 105%7.25% 102% 102% 103% 104% 105% 105% 106% 106% 107% 107%7.50% 102% 102% 104% 105% 105% 106% 107% 108% 108% 109%
Funded Ratio at June 30 Valuation
2020 2021 2022 2023 2024 2025 2026 2027 2028 20295.00% 4.2% 4.3% 4.4% 4.5% 4.7% 5.0% 5.2% 5.5% 5.8% 6.2%5.25% 4.2% 4.3% 4.3% 4.4% 4.6% 4.8% 5.0% 5.3% 5.5% 5.8%5.50% 4.2% 4.3% 4.3% 4.3% 4.5% 4.6% 4.8% 5.0% 5.2% 5.4%5.75% 4.2% 4.3% 4.2% 4.3% 4.4% 4.5% 4.6% 4.7% 4.9% 5.1%6.00% 4.2% 4.2% 4.2% 4.2% 4.3% 4.3% 4.4% 4.5% 4.6% 4.7%6.25% 4.2% 4.2% 4.2% 4.1% 4.2% 4.2% 4.2% 4.3% 4.3% 4.4%6.50% 4.2% 4.2% 4.1% 4.1% 4.1% 4.0% 4.0% 4.0% 4.0% 4.0%6.75% 4.2% 4.2% 4.1% 4.0% 3.9% 3.9% 3.9% 3.8% 3.8% 3.7%7.00% 4.2% 4.2% 4.0% 3.9% 3.8% 3.8% 3.7% 3.6% 3.5% 3.4%7.25% 4.2% 4.1% 4.0% 3.8% 3.7% 3.6% 3.5% 3.4% 3.2% 3.1%7.50% 4.2% 4.1% 3.9% 3.8% 3.6% 3.5% 3.3% 3.1% 2.9% 2.7%
Actuarial Contribution Rate for FYE
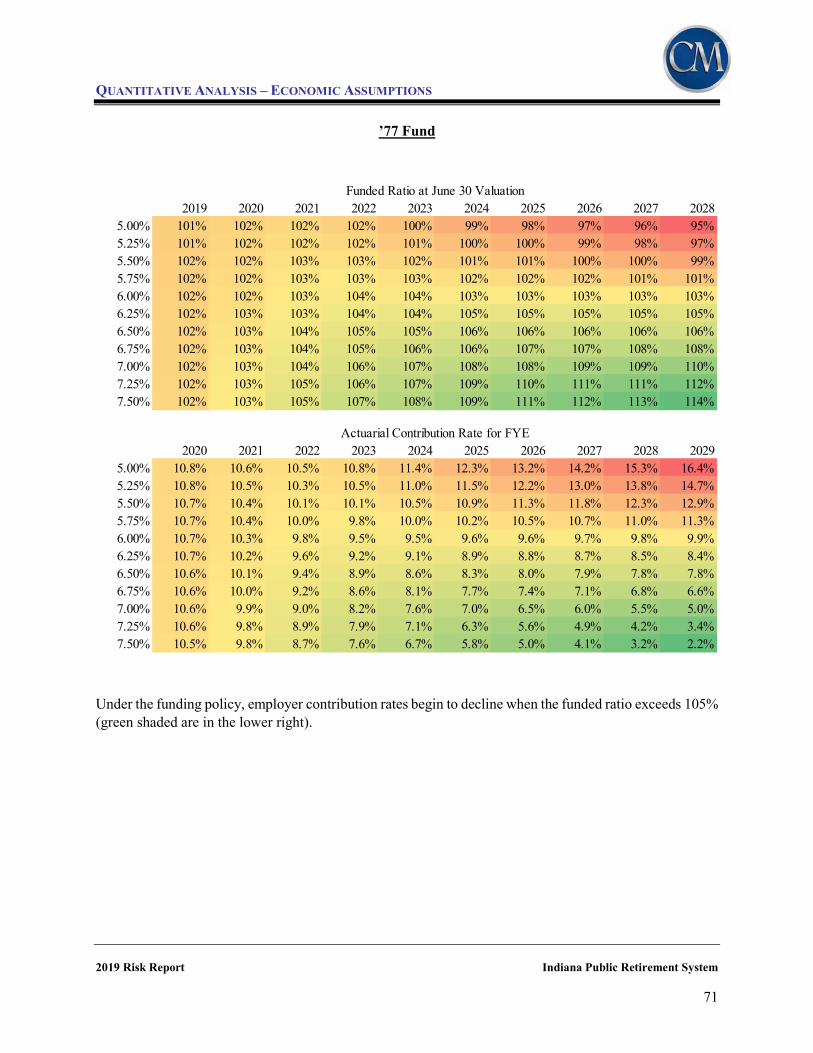
QUANTITATIVE ANALYSIS – ECONOMIC ASSUMPTIONS
2019 Risk Report Indiana Public Retirement System 71
’77 Fund
Under the funding policy, employer contribution rates begin to decline when the funded ratio exceeds 105% (green shaded are in the lower right).
2019 2020 2021 2022 2023 2024 2025 2026 2027 20285.00% 101% 102% 102% 102% 100% 99% 98% 97% 96% 95%5.25% 101% 102% 102% 102% 101% 100% 100% 99% 98% 97%5.50% 102% 102% 103% 103% 102% 101% 101% 100% 100% 99%5.75% 102% 102% 103% 103% 103% 102% 102% 102% 101% 101%6.00% 102% 102% 103% 104% 104% 103% 103% 103% 103% 103%6.25% 102% 103% 103% 104% 104% 105% 105% 105% 105% 105%6.50% 102% 103% 104% 105% 105% 106% 106% 106% 106% 106%6.75% 102% 103% 104% 105% 106% 106% 107% 107% 108% 108%7.00% 102% 103% 104% 106% 107% 108% 108% 109% 109% 110%7.25% 102% 103% 105% 106% 107% 109% 110% 111% 111% 112%7.50% 102% 103% 105% 107% 108% 109% 111% 112% 113% 114%
Funded Ratio at June 30 Valuation
2020 2021 2022 2023 2024 2025 2026 2027 2028 20295.00% 10.8% 10.6% 10.5% 10.8% 11.4% 12.3% 13.2% 14.2% 15.3% 16.4%5.25% 10.8% 10.5% 10.3% 10.5% 11.0% 11.5% 12.2% 13.0% 13.8% 14.7%5.50% 10.7% 10.4% 10.1% 10.1% 10.5% 10.9% 11.3% 11.8% 12.3% 12.9%5.75% 10.7% 10.4% 10.0% 9.8% 10.0% 10.2% 10.5% 10.7% 11.0% 11.3%6.00% 10.7% 10.3% 9.8% 9.5% 9.5% 9.6% 9.6% 9.7% 9.8% 9.9%6.25% 10.7% 10.2% 9.6% 9.2% 9.1% 8.9% 8.8% 8.7% 8.5% 8.4%6.50% 10.6% 10.1% 9.4% 8.9% 8.6% 8.3% 8.0% 7.9% 7.8% 7.8%6.75% 10.6% 10.0% 9.2% 8.6% 8.1% 7.7% 7.4% 7.1% 6.8% 6.6%7.00% 10.6% 9.9% 9.0% 8.2% 7.6% 7.0% 6.5% 6.0% 5.5% 5.0%7.25% 10.6% 9.8% 8.9% 7.9% 7.1% 6.3% 5.6% 4.9% 4.2% 3.4%7.50% 10.5% 9.8% 8.7% 7.6% 6.7% 5.8% 5.0% 4.1% 3.2% 2.2%
Actuarial Contribution Rate for FYE

QUANTITATIVE ANALYSIS – ECONOMIC ASSUMPTIONS
2019 Risk Report Indiana Public Retirement System 72
JRS
While JRS is funded by the State contributing the recommended contribution amount (when approved by the Legislature), the actuarial contribution rate is shown here to illustrate that contributions will increase modestly as a rate of pay if actual returns are as expected, with greater increases or decreases for actual returns below or above the expected return.
2019 2020 2021 2022 2023 2024 2025 2026 2027 20285.00% 93% 93% 93% 92% 91% 89% 88% 87% 86% 85%5.25% 94% 93% 93% 92% 91% 90% 89% 88% 87% 87%5.50% 94% 93% 93% 93% 92% 91% 90% 90% 89% 88%5.75% 94% 93% 93% 93% 93% 92% 91% 91% 90% 90%6.00% 94% 93% 94% 94% 93% 93% 93% 92% 92% 92%6.25% 94% 93% 94% 94% 94% 94% 94% 94% 93% 93%6.50% 94% 94% 94% 95% 95% 95% 95% 95% 95% 95%6.75% 94% 94% 95% 95% 96% 96% 96% 96% 96% 97%7.00% 94% 94% 95% 96% 96% 97% 97% 98% 98% 99%7.25% 94% 94% 95% 96% 97% 98% 98% 99% 100% 100%7.50% 94% 94% 95% 97% 98% 99% 100% 100% 101% 102%
Funded Ratio at June 30 Valuation
2020 2021 2022 2023 2024 2025 2026 2027 2028 20295.00% 34.9% 36.3% 37.2% 38.5% 40.4% 42.5% 44.5% 46.5% 48.5% 50.3%5.25% 34.8% 36.2% 36.9% 38.0% 39.7% 41.6% 43.4% 45.1% 46.9% 48.5%5.50% 34.8% 36.1% 36.6% 37.5% 39.0% 40.6% 42.2% 43.7% 45.3% 46.7%5.75% 34.7% 35.9% 36.3% 37.1% 38.3% 39.7% 41.0% 42.3% 43.7% 44.9%6.00% 34.7% 35.8% 36.0% 36.6% 37.6% 38.7% 39.8% 40.9% 42.0% 43.0%6.25% 34.7% 35.6% 35.8% 36.1% 36.9% 37.8% 38.6% 39.5% 40.3% 41.1%6.50% 34.6% 35.5% 35.5% 35.6% 36.1% 36.8% 37.4% 38.0% 38.6% 39.2%6.75% 34.6% 35.4% 35.2% 35.1% 35.4% 35.8% 36.2% 36.5% 36.9% 37.2%7.00% 34.5% 35.2% 34.9% 34.6% 34.7% 34.8% 34.9% 35.0% 35.1% 35.2%7.25% 34.5% 35.1% 34.6% 34.2% 33.9% 33.8% 33.6% 33.5% 33.3% 34.7%7.50% 34.5% 35.0% 34.3% 33.7% 33.2% 32.8% 32.4% 34.3% 33.7% 33.0%
Actuarial Contribution Rate for FYE

QUANTITATIVE ANALYSIS – ECONOMIC ASSUMPTIONS
2019 Risk Report Indiana Public Retirement System 73
PARF
PARF, like JRS, is funded by the State contributing the recommended contribution amount as approved by the Legislature. Contributions are shown here as a rate to illustrate that contributions will somewhat increase as a rate of pay if actual returns are as expected, with greater increases or decreases for actual returns below or above the expected return.
2019 2020 2021 2022 2023 2024 2025 2026 2027 20285.00% 62% 63% 65% 66% 66% 67% 67% 68% 69% 70%5.25% 62% 63% 65% 66% 67% 68% 68% 69% 70% 71%5.50% 62% 63% 65% 66% 67% 68% 69% 70% 71% 72%5.75% 62% 63% 65% 67% 68% 69% 70% 71% 72% 73%6.00% 62% 63% 65% 67% 68% 69% 71% 72% 73% 75%6.25% 62% 64% 66% 67% 69% 70% 71% 73% 74% 76%6.50% 62% 64% 66% 68% 69% 71% 72% 74% 75% 77%6.75% 62% 64% 66% 68% 70% 71% 73% 75% 77% 78%7.00% 62% 64% 66% 68% 70% 72% 74% 76% 78% 80%7.25% 62% 64% 66% 69% 71% 73% 75% 77% 79% 81%7.50% 62% 64% 67% 69% 71% 73% 76% 78% 80% 82%
Funded Ratio at June 30 Valuation
2020 2021 2022 2023 2024 2025 2026 2027 2028 20295.00% 19.4% 20.1% 20.6% 20.9% 21.6% 22.3% 23.0% 23.5% 24.1% 24.7%5.25% 19.4% 20.0% 20.5% 20.8% 21.4% 22.0% 22.6% 23.1% 23.6% 24.2%5.50% 19.4% 20.0% 20.4% 20.6% 21.1% 21.7% 22.3% 22.6% 23.1% 23.6%5.75% 19.3% 19.9% 20.3% 20.5% 20.9% 21.4% 21.9% 22.2% 22.6% 23.0%6.00% 19.3% 19.9% 20.2% 20.3% 20.7% 21.1% 21.5% 21.8% 22.1% 22.4%6.25% 19.3% 19.9% 20.1% 20.2% 20.5% 20.9% 21.2% 21.3% 21.6% 21.8%6.50% 19.3% 19.8% 20.0% 20.1% 20.3% 20.6% 20.8% 20.9% 21.0% 21.2%6.75% 19.3% 19.8% 20.0% 19.9% 20.1% 20.3% 20.4% 20.4% 20.5% 20.6%7.00% 19.3% 19.7% 19.9% 19.8% 19.9% 20.0% 20.0% 20.0% 19.9% 19.9%7.25% 19.3% 19.7% 19.8% 19.6% 19.6% 19.7% 19.7% 19.5% 19.4% 19.3%7.50% 19.3% 19.7% 19.7% 19.5% 19.4% 19.4% 19.3% 19.1% 18.8% 18.6%
Actuarial Contribution Rate for FYE

QUANTITATIVE ANALYSIS – ECONOMIC ASSUMPTIONS
2019 Risk Report Indiana Public Retirement System 74
EG&C
Once the funded ratio reaches 105%, the employer contribution rate begins to decline. (The actuarial rate exhibit some odd patterns as the funded ratio reaches 100% which limits its value for comparative purposes, so it has been omitted.)
2019 2020 2021 2022 2023 2024 2025 2026 2027 20285.00% 93% 94% 96% 97% 98% 98% 99% 99% 100% 100%5.25% 93% 94% 96% 98% 99% 99% 100% 101% 102% 102%5.50% 93% 94% 97% 98% 99% 100% 101% 102% 103% 104%5.75% 93% 95% 97% 99% 100% 101% 103% 104% 105% 106%6.00% 93% 95% 97% 99% 101% 102% 104% 106% 107% 108%6.25% 93% 95% 97% 100% 102% 103% 105% 107% 109% 110%6.50% 93% 95% 98% 100% 102% 104% 107% 109% 111% 112%6.75% 93% 95% 98% 101% 103% 106% 108% 110% 112% 113%7.00% 93% 95% 98% 101% 104% 107% 109% 112% 114% 116%7.25% 93% 95% 99% 102% 105% 108% 111% 113% 116% 118%7.50% 93% 96% 99% 102% 105% 109% 112% 114% 117% 119%
Funded Ratio at June 30 Valuation
2020 2021 2022 2023 2024 2025 2026 2027 2028 20295.00% 20.8% 20.8% 20.8% 20.8% 20.8% 20.8% 20.8% 20.8% 20.8% 20.8%5.25% 20.8% 20.8% 20.8% 20.8% 20.8% 20.8% 20.8% 20.8% 20.8% 20.8%5.50% 20.8% 20.8% 20.8% 20.8% 20.8% 20.8% 20.8% 20.8% 20.8% 20.8%5.75% 20.8% 20.8% 20.8% 20.8% 20.8% 20.8% 20.8% 20.8% 20.8% 19.2%6.00% 20.8% 20.8% 20.8% 20.8% 20.8% 20.8% 20.8% 20.8% 19.2% 16.5%6.25% 20.8% 20.8% 20.8% 20.8% 20.8% 20.8% 20.8% 19.2% 16.5% 14.5%6.50% 20.8% 20.8% 20.8% 20.8% 20.8% 20.8% 20.8% 19.2% 16.5% 14.5%6.75% 20.8% 20.8% 20.8% 20.8% 20.8% 20.8% 19.2% 16.5% 14.4% 13.0%7.00% 20.8% 20.8% 20.8% 20.8% 20.8% 20.8% 19.2% 16.5% 14.4% 13.0%7.25% 20.8% 20.8% 20.8% 20.8% 20.8% 20.8% 19.2% 16.5% 14.4% 13.0%7.50% 20.8% 20.8% 20.8% 20.8% 20.8% 19.2% 16.4% 14.4% 12.9% 11.8%
Employer Contribution Rate for FYE

QUANTITATIVE ANALYSIS – ECONOMIC ASSUMPTIONS
2019 Risk Report Indiana Public Retirement System 75
LE DB
The contributions are not significantly affected by the return, so the resulting chart is not insightful and has been omitted.
2019 2020 2021 2022 2023 2024 2025 2026 2027 20285.00% 90% 95% 99% 105% 103% 102% 101% 99% 97% 96%5.25% 90% 95% 100% 105% 104% 103% 102% 101% 100% 99%5.50% 90% 95% 100% 106% 106% 105% 105% 104% 104% 103%5.75% 90% 95% 100% 107% 107% 107% 107% 106% 106% 106%6.00% 91% 95% 101% 107% 108% 108% 108% 109% 109% 110%6.25% 91% 95% 101% 108% 109% 109% 110% 111% 112% 113%6.50% 91% 96% 101% 108% 110% 111% 112% 113% 115% 117%6.75% 91% 96% 102% 109% 111% 112% 114% 116% 118% 120%7.00% 91% 96% 102% 109% 112% 114% 116% 118% 121% 124%7.25% 91% 96% 102% 110% 113% 115% 118% 120% 124% 128%7.50% 91% 96% 103% 111% 114% 116% 119% 123% 127% 131%
Funded Ratio at June 30 Valuation

QUANTITATIVE ANALYSIS – ECONOMIC ASSUMPTIONS
2019 Risk Report Indiana Public Retirement System 76
Variability of Returns – Stochastic Modeling Deterministic modeling is helpful to compare different scenarios, which can lead to a better understanding of the funding dynamics of the system. Missing in this analysis is an understanding of the likelihood of various scenarios and the plausible range of outcomes from the anticipated volatility associated with the asset allocation. These issues are handled with the more robust approach of stochastic modeling, in which investment performance is varied, based on the expected distribution of portfolio returns. Rather than obtaining a single result, this approach develops the results for many plausible scenarios, so that the distribution of outcomes can be considered. For this modeling, we generated 1,000 30-year scenarios based on the expected return (6.75%) and standard deviation of the INPRS’ portfolio (10.00% as indicated in Verus materials presented to the Board) and assumed that each year’s returns are independent. For each simulation, the assets, liabilities, actuarial contribution rates and employer contribution rates (or amounts) were modeled for the next 30 years. Distributions of Outcomes It can also be useful to examine the distribution of outcomes for insight into the risk associated with investment returns. The following charts show the distribution of the funded ratio for the next 10 years for each Fund. In each chart, the blue portion of the bar represents the range between the 25th and 75th percentiles, or the middle 50% of results. A black line in the middle of the blue portion indicates the median (50th percentile) result. The tan portion of the bars extend to show the 5th and 95th percentiles. For JRS and PARF, the distribution of employer contribution amounts is also included because they provide insight into the funding process. (The other funds have contribution rates that are less related to funded status, and so they are not very helpful in explaining the fund dynamics.)
PERF – Funded Ratio
The 25th percentile (bottom of the blue bar) remains close to 78% funded for the ten-year period, meaning there is a 75% chance that the funded ratio will be at least as high as it is now. The median funded ratio in 2028 is 98%. Half of all results are between 78% funded and 118% funded. This range of outcomes might be wider than expected, largely because there is little contribution rate responsiveness to actual investment experience for several years.
0%
20%
40%
60%
80%
100%
120%
140%
160%
180%
2019 2020 2021 2022 2023 2024 2025 2026 2027 2028
Funded Ratio

QUANTITATIVE ANALYSIS – ECONOMIC ASSUMPTIONS
2019 Risk Report Indiana Public Retirement System 77
TRF Pre ‘96 – Funded Ratio
Because the Fund assets are increasing over this time period, the funded ratio improves under almost all conditions. The contributions are unchanged under any scenario since contributions are based on benefit payments during the projection period.
TRF ‘96 – Funded Ratio
The range of potential results for TRF ’96 is more compact than PERF (the blue bars represent a smaller range) primarily because the difference between the TRF ’96 employer contribution rate and the actuarial contribution rate has substantially cushion compared to PERF.
0%
20%
40%
60%
80%
100%
120%
140%
160%
180%
2019 2020 2021 2022 2023 2024 2025 2026 2027 2028
Funded Ratio
0%
20%
40%
60%
80%
100%
120%
140%
160%
180%
2019 2020 2021 2022 2023 2024 2025 2026 2027 2028
Funded Ratio
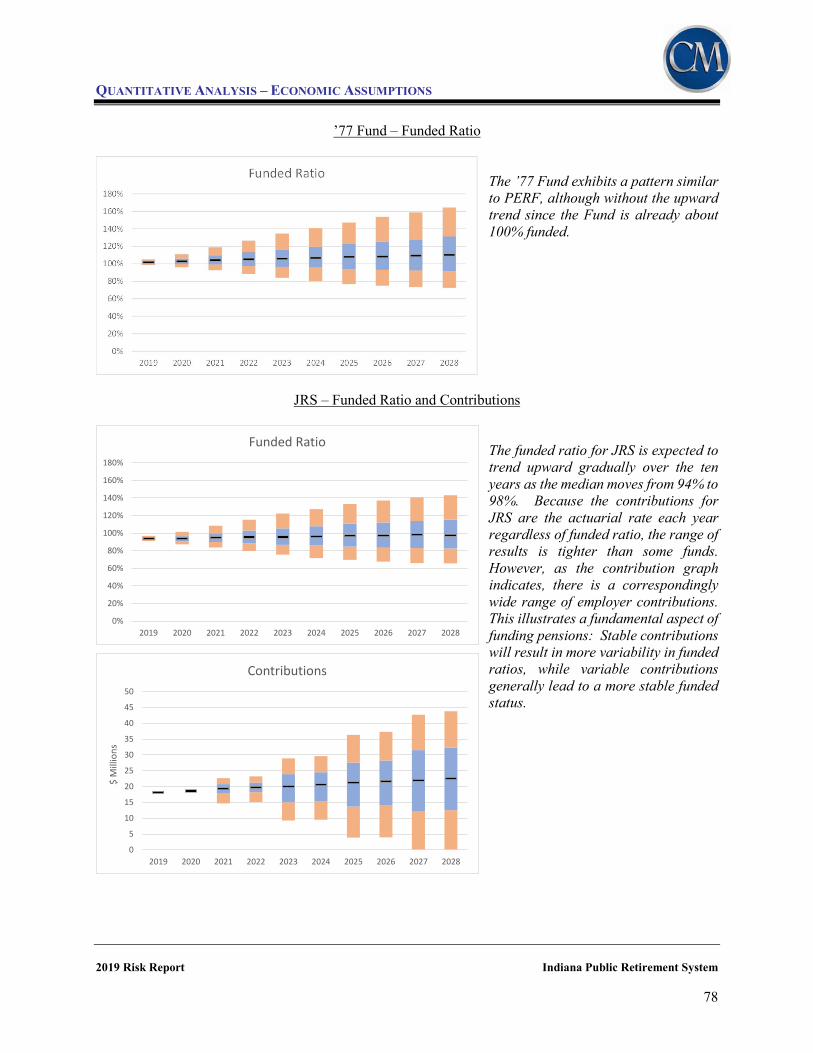
QUANTITATIVE ANALYSIS – ECONOMIC ASSUMPTIONS
2019 Risk Report Indiana Public Retirement System 78
’77 Fund – Funded Ratio
The ’77 Fund exhibits a pattern similar to PERF, although without the upward trend since the Fund is already about 100% funded.
JRS – Funded Ratio and Contributions
The funded ratio for JRS is expected to trend upward gradually over the ten years as the median moves from 94% to 98%. Because the contributions for JRS are the actuarial rate each year regardless of funded ratio, the range of results is tighter than some funds. However, as the contribution graph indicates, there is a correspondingly wide range of employer contributions. This illustrates a fundamental aspect of funding pensions: Stable contributions will result in more variability in funded ratios, while variable contributions generally lead to a more stable funded status.
0
5
10
15
20
25
30
35
40
45
50
2019 2020 2021 2022 2023 2024 2025 2026 2027 2028
$ M
illio
ns
Contributions
0%
20%
40%
60%
80%
100%
120%
140%
160%
180%
2019 2020 2021 2022 2023 2024 2025 2026 2027 2028
Funded Ratio
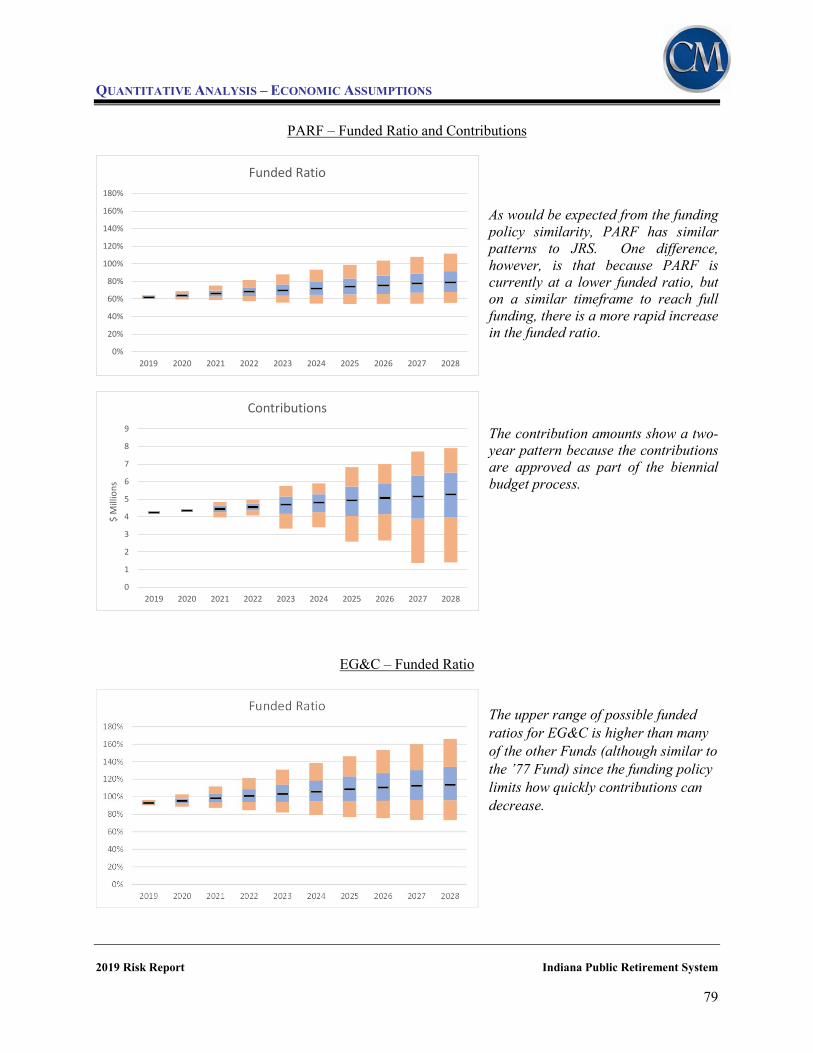
QUANTITATIVE ANALYSIS – ECONOMIC ASSUMPTIONS
2019 Risk Report Indiana Public Retirement System 79
PARF – Funded Ratio and Contributions As would be expected from the funding policy similarity, PARF has similar patterns to JRS. One difference, however, is that because PARF is currently at a lower funded ratio, but on a similar timeframe to reach full funding, there is a more rapid increase in the funded ratio. The contribution amounts show a two-year pattern because the contributions are approved as part of the biennial budget process.
EG&C – Funded Ratio The upper range of possible funded ratios for EG&C is higher than many of the other Funds (although similar to the ’77 Fund) since the funding policy limits how quickly contributions can decrease.
0
1
2
3
4
5
6
7
8
9
2019 2020 2021 2022 2023 2024 2025 2026 2027 2028
$ M
illio
ns
Contributions
0%
20%
40%
60%
80%
100%
120%
140%
160%
180%
2019 2020 2021 2022 2023 2024 2025 2026 2027 2028
Funded Ratio

QUANTITATIVE ANALYSIS – ECONOMIC ASSUMPTIONS
2019 Risk Report Indiana Public Retirement System 80
LE DB – Funded Ratio
Because the LE DB Fund is currently well-funded, closed, and contributions are expected to diminish, favorable scenarios can push the funded ratio up with little opportunity to reduce it by contribution reduction. This leads to a very wide range of possible outcomes compared to the other funds.